


Abstract
Background/Objectives: Prosaposin (PSAP) is a multifunctional protein involved in sphingolipid metabolism and neuroprotection. This study investigated the association between serum PSAP levels and type 2 diabetes mellitus (T2DM) and explored the association between PSAP and lower-limb motor nerve conduction abnormalities in patients with T2DM. Methods: This single-center cross-sectional study included 172 participants (48 normal controls and 124 patients with T2DM). Serum PSAP was measured by ELISA. Among patients with T2DM, 112 underwent nerve conduction studies to assess lower-limb motor nerve conduction abnormalities. Logistic regression, Firth penalized logistic regression, and RCS analyses were performed. Exploratory mediation analysis with 5000 bootstrap resamples evaluated the indirect effect involving glycated hemoglobin A1c (HbA1c) in the association between PSAP and T2DM. Results: Serum PSAP levels were higher in patients with T2DM than in normal controls (p < 0.001). The association between lnPSAP and T2DM remained significant after adjustment for age, sex, systolic blood pressure, BMI, and total cholesterol (p = 0.008), but was attenuated and no longer significant after further adjustment for HbA1c. Exploratory mediation analysis identified a significant indirect-effect estimate involving HbA1c (p < 0.001), warranting cautious interpretation given the cross-sectional design and the role of HbA1c in T2DM diagnosis. For lower-limb motor nerve conduction abnormalities, lnPSAP was significantly associated in univariable analysis (p = 0.044), but not after multivariable adjustment (p = 0.157), consistent with the Firth penalized logistic regression and RCS analyses. Conclusions: Serum PSAP levels were elevated in patients with T2DM, although the association was substantially attenuated after further adjustment for HbA1c. The exploratory mediation findings do not establish a causal pathway. The association between PSAP and lower-limb motor nerve conduction abnormalities remained inconclusive after multivariable adjustment. Further longitudinal studies are needed to clarify these associations.
1. Introduction
Diabetes has become a major global public health challenge. According to the 11th edition of the International Diabetes Federation (IDF) Diabetes Atlas [1], an estimated 589 million adults aged 20–79 years were living with diabetes worldwide in 2024. China has the largest number of adults with diabetes in this age group and ranks second in terms of total diabetes-related healthcare expenditure. Changes in lifestyle, including unhealthy dietary habits and increasing overweight and obesity, together with increasing life expectancy and population aging [2], have contributed to the growing prevalence and absolute number of people with type 2 diabetes mellitus (T2DM). These trends are expected to continue in the coming years.
T2DM is a common chronic disease that can lead to severe vascular, renal, and neurological complications as the disease progresses [3], including diabetic microvascular and macrovascular complications and diabetes-related cognitive impairment. Therefore, the prevention and management of T2DM and its complications are of critical importance. Among the various forms of diabetic neuropathy, distal symmetric polyneuropathy (DSPN) is the most common, accounting for approximately 75% of diabetic neuropathy cases according to previous reviews [4]. With disease progression, DSPN can substantially impair quality of life and increase the risks of foot ulcers, falls, and lower-limb amputation. Nerve conduction studies (NCS) provide an important objective method for assessing peripheral nerve function, particularly large-fiber involvement, and play a key role in the evaluation of DSPN. According to the Toronto consensus criteria [5], confirmed DSPN requires abnormal nerve conduction findings in conjunction with typical neuropathic symptoms or signs. NCS can also detect electrophysiological abnormalities in patients without overt clinical manifestations, thereby facilitating the identification of subclinical peripheral nerve dysfunction. Assessment of lower-limb motor nerve conduction may therefore provide useful information on peripheral nerve function in patients with T2DM.
Prosaposin (PSAP) is a multifunctional protein of approximately 70 kDa that serves as the precursor of lysosomal sphingolipid activator proteins. It is proteolytically cleaved along the endosomal–lysosomal pathway to generate four heat-stable sphingolipid activator proteins, saposin A, B, C, and D [6]. PSAP and its cleavage products together form an essential cofactor system for lysosomal sphingolipid degradation, highlighting the importance of this system in lipid metabolism and its potential relevance to glucose metabolism. In addition, PSAP functions as a neurotrophic factor in the nervous system and may influence neuronal survival and synaptic growth [7]. Recent studies have further suggested that PSAP may play important roles in adipose tissue energy homeostasis, mitochondrial function, and immunometabolic interactions [8,9]. More recently, a clinical study from China reported that serum PSAP levels were higher in patients with T2DM and that serum PSAP concentrations were positively correlated with the degree of insulin resistance [10].
As early as 1999, preclinical studies showed that PSAP and its derived peptides exert neurotrophic and myelinotrophic effects in Schwann cells and promote peripheral nerve repair in animal models [11]. Calcutt et al. found that PSAP mRNA expression was significantly increased in peripheral nerve tissues of diabetic rats. They further showed that TX14(A), an active peptide derived from PSAP, could prevent abnormalities in nerve fiber function, reductions in nerve conduction velocity, and some structural axonal damage in diabetic rats [12]. In addition, another animal study suggested that altered PSAP secretion under diabetic conditions may contribute to impaired regeneration of injured peripheral nerves [13]. Recent experimental studies further demonstrate that peripheral nerve injury is associated with impaired nerve conduction, neuroinflammatory changes, and alterations in molecular markers related to neuronal plasticity and axonal injury [14,15]. Taken together, these findings suggest that PSAP may participate in the neuroprotective and reparative responses to peripheral nerve injury under diabetic conditions. However, whether circulating PSAP levels are associated with T2DM and lower-limb motor nerve conduction abnormalities in patients with T2DM remains insufficiently understood.
In summary, PSAP is involved in lysosomal sphingolipid metabolism and has additional biological functions related to cellular homeostasis and neuroprotection. These functions provide a biological rationale for investigating the potential associations of PSAP with T2DM and diabetes-related peripheral nerve dysfunction. Although previous studies have reported elevated serum PSAP levels in patients with T2DM and an association with insulin resistance [10], the relationships between circulating PSAP levels, T2DM, and peripheral nerve conduction abnormalities remain insufficiently understood.
Therefore, this study aimed to investigate the association between serum PSAP levels and T2DM and, among patients with T2DM, to evaluate the association between serum PSAP levels and lower-limb motor nerve conduction abnormalities. Multivariable logistic regression and restricted cubic spline analyses were used to further characterize these associations.
2. Materials and Methods
2.1. Participants
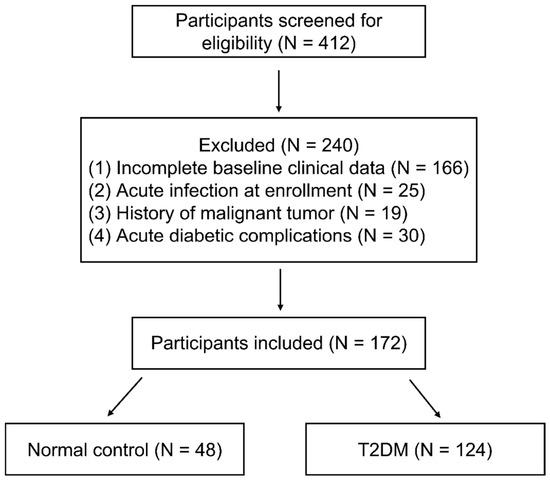
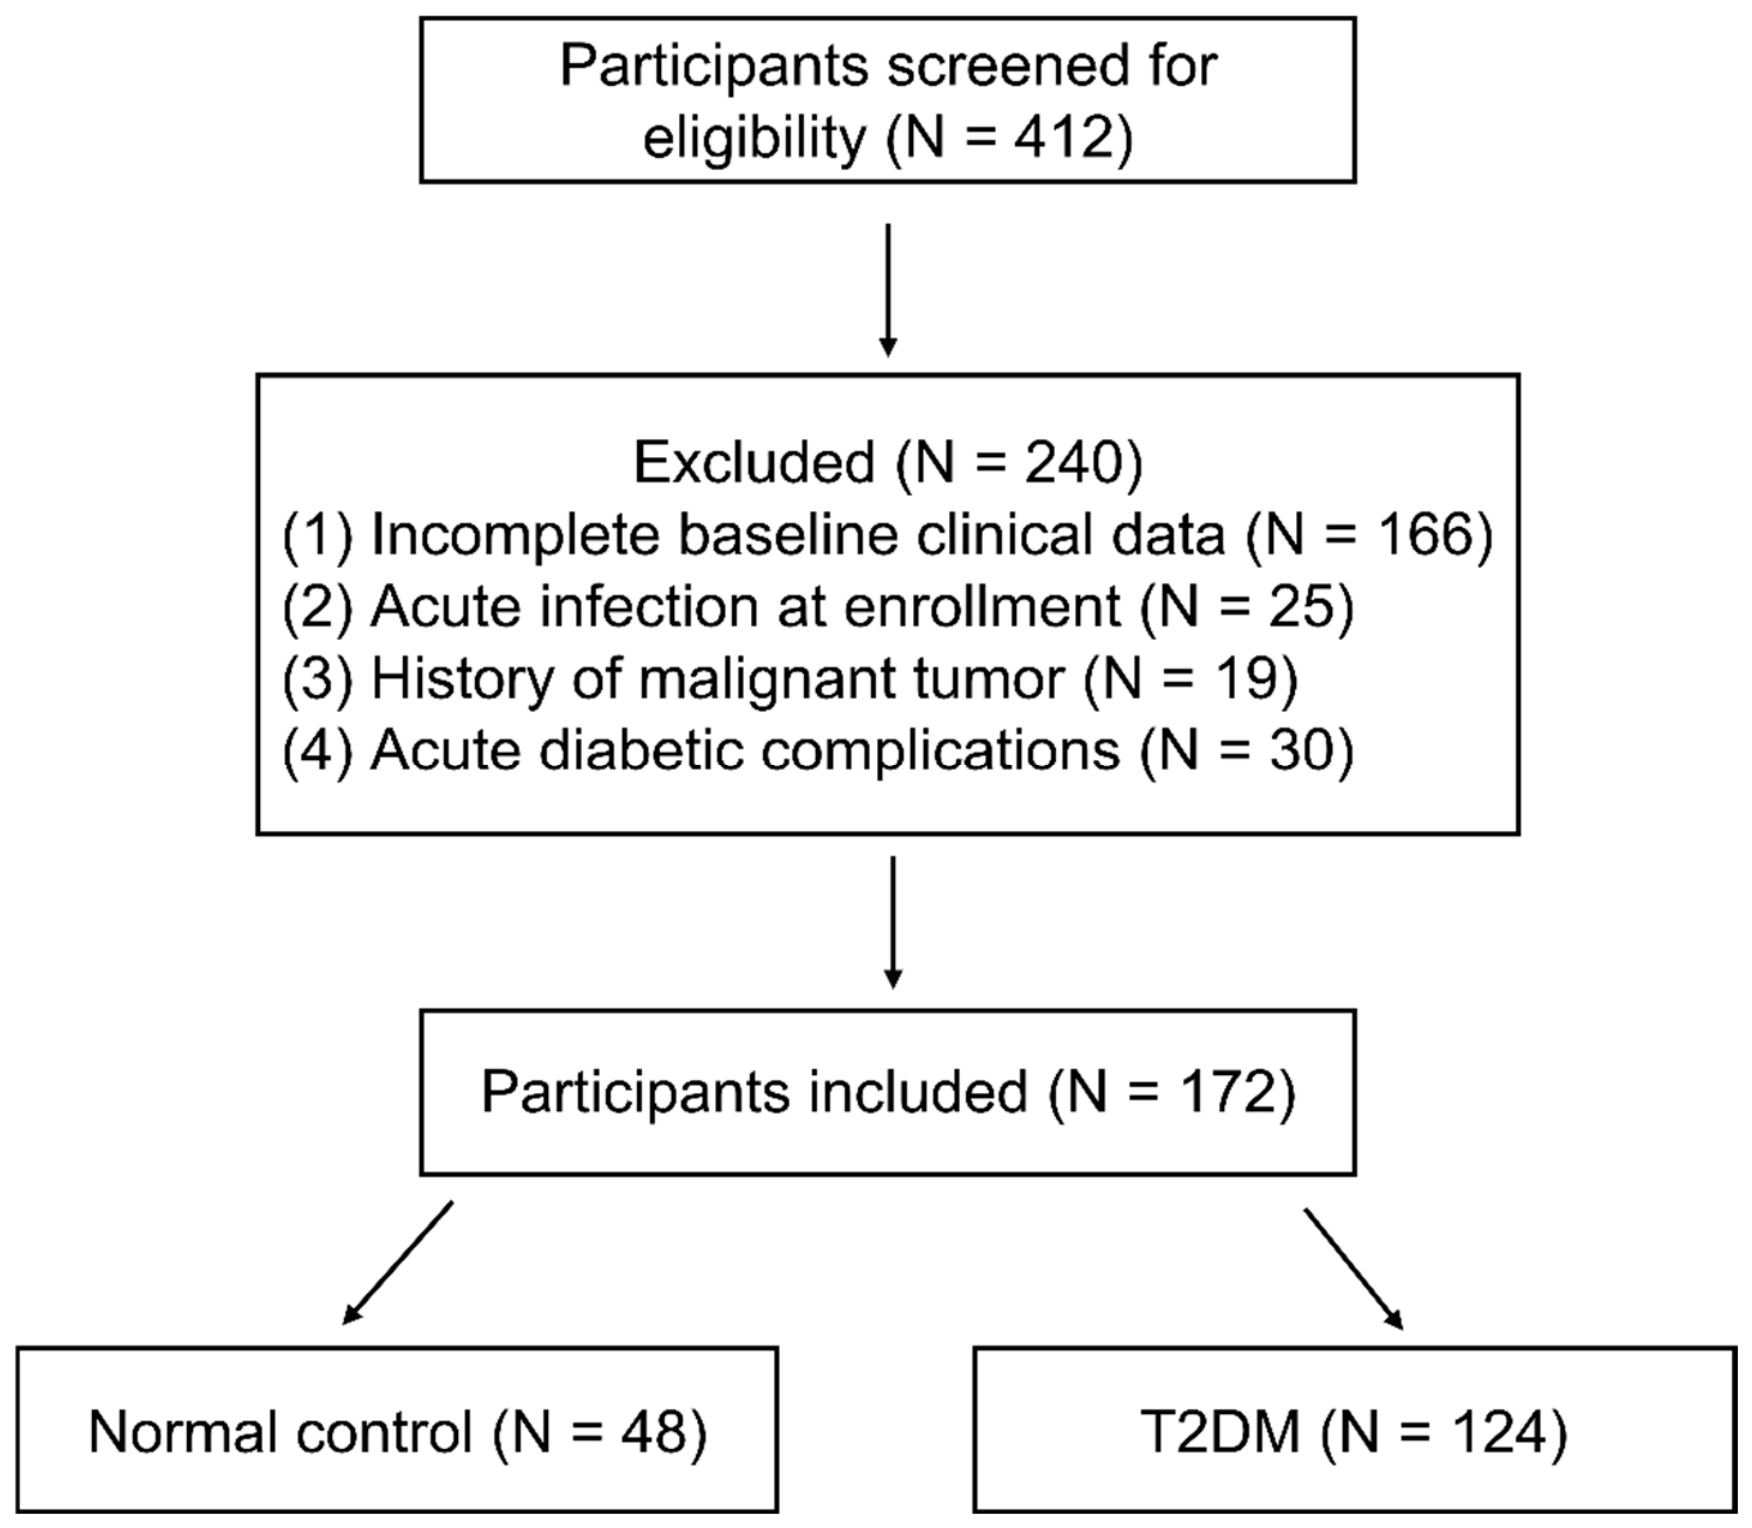
This cross-sectional clinical observational study included 124 patients with T2DM who were diagnosed in the Department of Endocrinology at Tongji Hospital, Tongji Medical College, Huazhong University of Science and Technology, between May and June 2026, as identified from the electronic medical record system. In addition, 48 participants were recruited from the Health Examination Center as the normal control (NC) group. The participant selection process is shown in Figure 1. All participants provided written informed consent.
Figure 1.
Flowchart of participant selection and grouping. A total of 412 participants were screened for eligibility, of whom 240 were excluded according to the prespecified exclusion criteria. Finally, 172 participants were included in the analysis, comprising 48 participants in the NC group and 124 participants in the T2DM group. NC, normal control; T2DM, type 2 diabetes mellitus.
The inclusion criteria for patients with T2DM were as follows: (1) meeting the diagnostic criteria for T2DM according to the 2013 American Diabetes Association (ADA) criteria: glycated hemoglobin A1c (HbA1c) ≥ 6.5%, random plasma glucose ≥ 11.1 mmol/L, fasting plasma glucose ≥ 7.0 mmol/L, with fasting defined as no caloric intake for at least 8 h, or 2-h plasma glucose ≥ 11.1 mmol/L during an oral glucose tolerance test (OGTT); (2) age 18–90 years; (3) absence of acute diabetic complications, such as diabetic ketosis, diabetic ketoacidosis, or hyperosmolar hyperglycemic state; (4) no current use of glucose-lowering medication or current use of one to three glucose-lowering medications, including insulin and glucagon-like peptide-1 (GLP-1) receptor agonists. All participants in the T2DM group were hospitalized patients.
For participants with T2DM, the exclusion criteria were as follows: (1) positive results for one or more diabetes-related autoantibodies, including insulin autoantibody (IAA), islet cell antibody (ICA), and glutamic acid decarboxylase antibody (GAD), with a diagnosis of type 1 diabetes or a diagnosis of secondary diabetes or other specific types of diabetes; (2) severe chronic complications of diabetes, such as diabetic foot, severe diabetic retinopathy, severe diabetic nephropathy, severe hepatic or renal dysfunction, or severe primary neurological disorders; (3) severe systemic diseases, such as malignant tumors, hematological disorders, epilepsy, or severe psychiatric disorders; (4) acute infections, including respiratory tract infections, urinary tract infections, skin infections, or other acute infectious diseases; (5) a history of acute exacerbation of severe systemic diseases within the previous 3 months, such as acute coronary syndrome, myocardial infarction, or stroke; (6) pregnancy or breastfeeding; (7) a history of illicit drug use; (8) antibiotic use within the previous month for ≥3 days; or (9) a history of surgery within the previous year.
The control group consisted of participants recruited from a health examination center. Diabetes was excluded according to the 2013 American Diabetes Association (ADA) diagnostic criteria. Participants with a history of malignant tumors, acute infections, or other conditions meeting the study’s exclusion criteria were excluded.
The study protocol was approved by the Medical Ethics Committee of Tongji Hospital (TJ-IRB202604018) and was conducted in accordance with the principles of the Declaration of Helsinki.
2.2. Data Collection
Demographic data were collected from all study participants, including age and sex, along with clinically relevant information, including height, weight, body mass index (BMI), duration of diabetes, use of glucose-lowering medications, history of comorbidities, and personal medical history. Venous blood samples were collected from all participants in the early morning after an overnight fast to measure fasting plasma glucose (FPG), glycated hemoglobin A1c (HbA1c), white blood cell (WBC) count, hemoglobin (Hb), platelet (PLT) count, 25-hydroxyvitamin D [25(OH)D], alanine aminotransferase (ALT), total cholesterol (TC), triglycerides (TG), creatinine (Cr), and estimated glomerular filtration rate (eGFR). Random urine samples were also collected to measure the urinary albumin-to-creatinine ratio (UACR).
Serum was separated from whole blood by high-speed centrifugation and stored at −80 °C until batch analysis. Serum PSAP concentrations were measured using a commercial human prosaposin double-antibody sandwich enzyme-linked immunosorbent assay (ELISA) kit manufactured by Wuhan Yunclone Technology Co., Ltd., Wuhan, China (Catalog No. SEC756Hu). All procedures were performed in accordance with the manufacturer’s instructions. Because circulating PSAP concentrations typically exceed the upper limit of the assay standard curve, all serum samples were uniformly diluted at 1:10 before measurement. The assay detection range was 0.78–50 ng/mL, with a sensitivity of ≤0.33 ng/mL. According to the manufacturer’s validation data, serum spike recovery ranged from 82% to 102%, and dilution linearity was acceptable. The intra-assay and inter-assay coefficients of variation were <10% and <12%, respectively. All samples were diluted 1:10, measured in duplicate by the same technician across two assay plates in two batches, and fell within the assay detection range. Absorbance was measured at 450 nm, and serum PSAP concentrations were calculated from the standard curve with correction for the dilution factor.
Among the 124 patients with T2DM, 112 underwent NCS and were included in the analysis. NCS were performed by experienced physicians, with bilateral motor nerve conduction assessed in the tibial and common peroneal nerves. Nerve conduction velocity (NCV) and compound muscle action potential (CMAP) amplitude were evaluated using laboratory-specific reference ranges. An abnormal result was defined as an NCV or CMAP amplitude below the corresponding lower reference limit. Participants were classified as having lower-limb motor nerve conduction abnormalities if at least one abnormal parameter was present on at least one side of both the tibial and common peroneal nerves. This criterion was used to reduce potential misclassification due to isolated abnormalities in a single nerve. Participants who did not meet this criterion were classified as the negative group.
2.3. Sample Size Calculation
Sample size calculations were performed using PASS software (version 25.0.2; NCSS, LLC, Kaysville, UT, USA) based on previously reported clinical data [10]. The calculation was designed to compare serum PSAP levels between the T2DM and control groups. Assuming a between-group difference of 112.4 ng/mL in serum PSAP levels between the T2DM and control groups, a two-sided significance level (α) of 0.05, and a statistical power (1-β) of 0.90, with a 1:1 allocation ratio between the two groups, a minimum of 18 participants (9 per group) was required. Allowing for a 20% dropout rate, the required sample size was increased to 12 participants per group, resulting in a total planned sample size of 24 participants. Because no previous clinical studies had established the association between PSAP and lower-limb motor nerve conduction abnormalities in humans, no separate a priori sample size calculation was performed for this exploratory analysis.
2.4. Statistical Analysis
Statistical analyses were performed using SPSS (version 27.0.1; IBM Corp., Armonk, NY, USA) and R (version 4.5.1; R Foundation for Statistical Computing, Vienna, Austria). GraphPad Prism (version 9.5; GraphPad Software, San Diego, CA, USA) was used for data visualization.
The distribution of continuous variables was assessed using the Shapiro–Wilk test, together with visual inspection of histograms and Q-Q plots. Continuous variables that were normally distributed in both groups were expressed as mean ± standard deviation (SD) and compared using the independent-samples t-test. For variables that were not normally distributed in either group, data were expressed as median (interquartile range [IQR]) and compared using the Mann–Whitney U test. Categorical variables were presented as frequencies and percentages and compared using the chi-square test or Fisher’s exact test, as appropriate.
Because serum PSAP concentrations exhibited a skewed distribution, raw PSAP concentrations were used for nonparametric between-group comparisons. For logistic regression and restricted cubic spline (RCS) analyses, PSAP concentrations were natural log-transformed (lnPSAP) to reduce the influence of skewness on model fitting.
Binary logistic regression analyses were performed to evaluate the associations of lnPSAP with T2DM and lower-limb motor nerve conduction abnormalities. Odds ratios (ORs) and 95% confidence intervals (CIs) were reported. Firth’s penalized logistic regression was performed as a sensitivity analysis to assess the robustness of the findings. Restricted cubic spline (RCS) analysis was used to explore potential nonlinear associations between lnPSAP and lower-limb motor nerve conduction abnormalities. Exploratory mediation analysis with 5000 bootstrap resamples was conducted to investigate the potential mediating role of HbA1c in the association between lnPSAP and T2DM. All statistical tests were two-sided, and a p-value < 0.05 was considered statistically significant.
3. Results
3.1. Characteristics of Participants
A total of 172 participants were included in the present study, comprising 48 participants in the normal control (NC) group and 124 participants in the type 2 diabetes mellitus (T2DM) group. The baseline clinical characteristics of the two groups are presented in Table 1.
Table 1.
Baseline characteristics of the study participants.
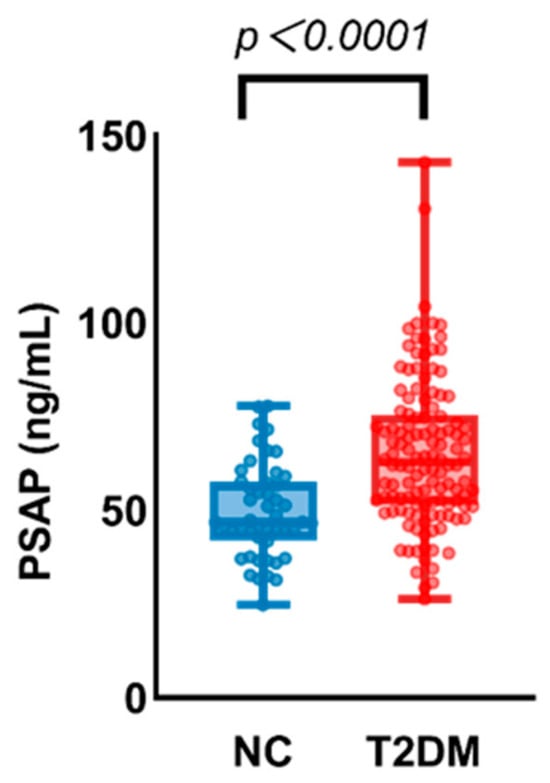
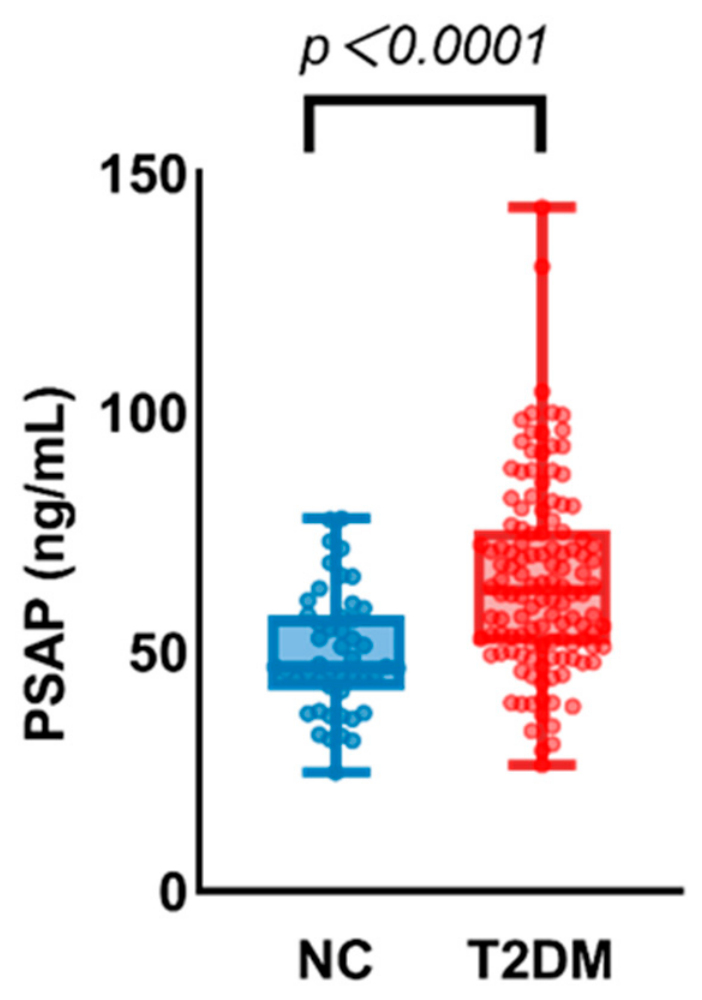
Compared with the NC group, serum PSAP levels were significantly higher in the T2DM group [62.8 (51.4, 75.5) vs. 46.8 (42.0, 57.6) ng/mL, p < 0.001]. In addition, glucose metabolism-related parameters were significantly higher in the T2DM group, with both glycated hemoglobin A1c (HbA1c) and fasting plasma glucose (FPG) levels significantly higher than those in the NC group (both p < 0.001).
Regarding clinical characteristics and metabolic parameters, the T2DM group had significantly higher diastolic blood pressure (DBP), hemoglobin (Hb), and urinary albumin-to-creatinine ratio (UACR) levels than the NC group (p = 0.022, p < 0.001, and p = 0.024, respectively), whereas platelet (PLT) counts were significantly lower in the T2DM group (p = 0.008). In addition, the proportions of participants with a history of smoking and alcohol consumption were significantly higher in the T2DM group than in the NC group (p = 0.014 and p = 0.016, respectively).
No statistically significant differences were observed between the two groups in age, years of education, body mass index (BMI), systolic blood pressure (SBP), white blood cell (WBC) count, lipid parameters (total cholesterol and triglycerides), renal function parameters (serum creatinine and estimated glomerular filtration rate), 25-hydroxyvitamin D [25(OH)D] levels, or alanine aminotransferase (ALT) levels (all p > 0.05).
3.2. Elevated Serum PSAP Levels Are Associated with Type 2 Diabetes Mellitus
As shown in Figure 2, serum PSAP levels were significantly higher in patients with T2DM than in the NC group. The median PSAP levels were 46.77 ng/mL in the NC group and 62.78 ng/mL in the T2DM group, respectively, with the T2DM group showing significantly higher levels than the NC group (p < 0.0001). These findings suggest that serum PSAP levels may be associated with T2DM.
Figure 2.
Comparison of serum PSAP concentrations between normal control (NC) and type 2 diabetes mellitus (T2DM) groups. Data were presented as box-and-whisker plots overlaid with individual scatter dots, with boxes representing median and interquartile range. Statistical analysis was performed using the Mann–Whitney U test, p < 0.0001. The median PSAP level was 46.77 ng/mL in the NC group and 62.78 ng/mL in the T2DM group.
A logistic regression model was further used to examine the association between serum PSAP levels and the odds of T2DM (Table 2). In the unadjusted model (Crude Model 1), lnPSAP levels were significantly associated with T2DM (OR = 21.454, 95% CI: 5.659–81.342, p < 0.001). After adjustment for age, sex, SBP, BMI, and TC (Adjusted Model 2), lnPSAP remained significantly associated with T2DM (OR = 8.176, 95% CI: 1.722–38.821, p = 0.008). When lnPSAP was analyzed per 1-SD increase, each 1-SD increase in lnPSAP was associated with higher odds of T2DM (OR = 1.868, 95% CI: 1.175–2.969, p = 0.008), corresponding to an approximately 87% increase in the odds of T2DM. However, after further adjustment for HbA1c (Adjusted Model 3), the association between lnPSAP and T2DM was substantially attenuated and was no longer statistically significant (OR = 0.022, 95% CI: 0.000114–4.350, p = 0.157).
Table 2.
Logistic regression analysis of the association between lnPSAP and type 2 diabetes mellitus.
To further characterize the observed association between lnPSAP and prevalent T2DM, an exploratory statistical mediation analysis involving HbA1c was performed using 5000 percentile bootstrap resamples (Table 3). The estimated total effect was 0.00676 (95% CI: 0.0000–0.1432, p = 0.002). The estimated indirect effect associated with HbA1c was 0.00754 (95% CI: 0.0000–0.3238, p < 0.001), while the estimated direct effect after accounting for HbA1c was −0.00078 (95% CI: −0.2007–0.0000, p = 0.0416). These estimates describe the statistical decomposition of the observed association under the specified mediation model. Given that HbA1c is one of the diagnostic criteria for T2DM and that the cross-sectional design does not establish temporal ordering, these findings should not be interpreted as evidence that HbA1c causally mediates the relationship between lnPSAP and T2DM.
Table 3.
Exploratory statistical mediation analysis of the association between lnPSAP and prevalent type 2 diabetes mellitus involving HbA1c.
3.3. Association Between Serum PSAP Levels and Lower-Limb Motor Nerve Conduction Abnormalities in Patients with Type 2 Diabetes Mellitus
Among the 112 participants, 77 met the criterion for lower-limb motor nerve conduction abnormality (abnormal conduction velocity or amplitude in both the tibial and common peroneal nerves), and 35 did not meet this criterion. The two groups differed in several baseline characteristics (Table 4). Those with abnormalities were older (56.1 vs. 43.3 years, p < 0.001), had a longer diabetes duration (5 vs. 0 years, p < 0.001), lower BMI, hemoglobin and platelet counts, and lower total cholesterol. Sex, smoking and drinking habits, blood pressure, HbA1c, white blood cell count, UACR, 25(OH)D, triglycerides, creatinine, fasting glucose, and serum PSAP were similar between the two groups. Serum PSAP levels were slightly higher in the abnormality group (68.1 vs. 60.9 ng/mL), but the difference was not statistically significant (p = 0.071).
Table 4.
Baseline characteristics of patients with T2DM according to lower-limb motor nerve conduction status.
Logistic regression analysis was subsequently performed to evaluate the association between lnPSAP and lower-limb motor nerve conduction abnormalities (Table 5). In the unadjusted model, higher lnPSAP levels were significantly associated with increased odds of nerve conduction abnormalities (OR = 4.387, 95% CI: 1.039–18.527, p = 0.044). After adjustment for age, sex, systolic blood pressure, diabetes duration, HbA1c, and 25-hydroxyvitamin D levels, the association between lnPSAP and nerve conduction abnormalities was no longer statistically significant (OR = 3.651, 95% CI: 0.607–21.980, p = 0.157). In the adjusted model, only age was independently associated with nerve conduction abnormalities (OR = 1.046, 95% CI: 1.004–1.090, p = 0.032). Sensitivity analysis using Firth penalized logistic regression yielded consistent results, with lnPSAP showing a similar non-significant association (OR = 3.150, 95% CI: 0.595–18.336, p = 0.179).
Table 5.
Logistic regression analysis of the association between lnPSAP and lower-limb motor nerve conduction abnormalities in patients with T2DM.
Restricted cubic spline (RCS) analysis with three knots was performed to explore the potential dose–response relationship between lnPSAP and lower-limb motor nerve conduction abnormalities (Figure S1). Although the spline curve showed a gradual upward trend with increasing lnPSAP, neither the overall association (p for overall association = 0.301) nor the nonlinear component (p for nonlinearity = 0.522) was statistically significant. Thus, no significant association or departure from linearity was detected in the present sample, consistent with the multivariable logistic regression results.
4. Discussion
The present study found that serum PSAP levels were higher in patients with T2DM than in normal controls. The association between lnPSAP and T2DM remained statistically significant after adjustment for age, sex, systolic blood pressure, BMI, and total cholesterol, but was substantially attenuated and no longer statistically significant after further adjustment for HbA1c. Among patients with T2DM, serum PSAP levels were slightly higher in those with lower-limb motor nerve conduction abnormalities, but the difference was not statistically significant. The association between lnPSAP and nerve conduction abnormalities was also no longer significant after multivariable adjustment, and restricted cubic spline analysis showed no significant overall or nonlinear association.
Our findings showed a significant association between serum PSAP levels and prevalent T2DM. Compared with the NC group, patients with T2DM had higher serum PSAP levels, and this association remained statistically significant after adjustment for age, sex, SBP, BMI, and TC. These findings are consistent with those reported by Ji et al. [10], who similarly observed elevated circulating PSAP levels in patients with T2DM and reported associations between PSAP and blood glucose levels as well as markers of insulin resistance. However, the association between PSAP and prevalent T2DM was attenuated and no longer statistically significant after further adjustment for HbA1c. To further characterize this finding, we conducted an exploratory statistical mediation analysis, which yielded a nonzero estimated indirect effect associated with HbA1c under the specified model. Given the overlap between HbA1c and the diagnostic definition of T2DM, this result should be interpreted as a statistical decomposition of the observed association rather than evidence that HbA1c mediates a biological or causal pathway between PSAP and T2DM.
These findings warrant cautious interpretation. HbA1c is one of the diagnostic criteria for T2DM, creating substantial overlap between the mediator and the definition of the outcome. Moreover, the cross-sectional design does not establish the temporal ordering among PSAP levels, HbA1c, and prevalent T2DM. Consequently, the mediation analysis cannot establish a causal mediating role for HbA1c or determine the direction of the relationships among these variables. Longitudinal studies are needed to clarify the temporal relationships between PSAP levels and glycemic status and to investigate the biological basis of their observed associations.
The mechanisms underlying elevated serum PSAP levels in T2DM remain unclear. One possible explanation is that chronic hyperglycemia and the accompanying metabolic stress may induce adaptive changes in PSAP expression or secretion, thereby contributing to increased circulating PSAP levels. Previous studies and recent reviews have suggested that PSAP is involved in cellular metabolic homeostasis, sphingolipid metabolism, and metabolic stress-related processes; thus, alterations in circulating PSAP levels may reflect an adaptive response to metabolic disturbances [10,16]. In addition, given the established involvement of PSAP in sphingolipid metabolism and lipid homeostasis, changes in PSAP levels may occur in parallel with insulin resistance and broader metabolic dysregulation [9]. Nevertheless, because of the cross-sectional design of the present study, the temporal relationship and causal direction between PSAP and abnormal glucose metabolism cannot be established. Longitudinal studies and mechanistic investigations are therefore needed to determine whether altered PSAP levels are a consequence of metabolic dysregulation, a contributing factor, or both.
Previous evidence regarding the relationship between PSAP and diabetic peripheral nerve injury has primarily been derived from cellular and animal studies [11,12]. PSAP has neurotrophic and myelinotrophic properties, and the PSAP-derived peptide TX14(A) has been shown to ameliorate functional and structural abnormalities of peripheral nerves in experimental models of diabetes. However, clinical evidence linking circulating PSAP levels to peripheral nerve dysfunction in patients with T2DM remains limited. In the present study, the association between serum PSAP levels and lower-limb motor nerve conduction abnormalities was not statistically significant after multivariable adjustment, and no significant overall or nonlinear association was identified in the restricted cubic spline analysis. These findings suggest that the relationship between circulating PSAP and peripheral nerve dysfunction remains uncertain and should be interpreted cautiously.
Peripheral nerve dysfunction can be assessed objectively using NCS. Abnormalities in motor nerve conduction velocity and CMAP amplitude may reflect different aspects of nerve dysfunction, including conduction slowing and axonal loss [5,17,18]. In patients with T2DM, such abnormalities may be relevant to the broader spectrum of diabetic peripheral nerve complications. Diabetic peripheral neuropathy, particularly distal symmetric polyneuropathy, is a common neurological complication of diabetes involving complex metabolic and microvascular mechanisms. Chronic hyperglycemia and other metabolic disturbances, including dyslipidemia and insulin resistance, may contribute to oxidative stress, mitochondrial dysfunction, and inflammation, thereby impairing neuronal and Schwann-cell function and promoting peripheral nerve injury [19,20,21]. Nevertheless, the lower-limb motor nerve conduction abnormalities examined in the present study should not be interpreted as equivalent to a confirmed diagnosis of DSPN, because standardized neuropathic symptoms and signs were not systematically assessed and the sural sensory nerve was not examined.
The biological significance of circulating PSAP in relation to peripheral nerve dysfunction remains unclear. Serum PSAP levels may reflect changes in its expression, secretion, or metabolism, or a compensatory response to metabolic stress or nerve injury. Thus, the slightly higher PSAP levels observed in the unadjusted comparison between participants with and without lower-limb motor nerve conduction abnormalities do not establish a direct pathogenic or protective role for PSAP. Moreover, the association did not remain statistically significant after multivariable adjustment, and the spline analysis provided no evidence of an overall or nonlinear association. The experimental neurotrophic effects of PSAP therefore provide a rationale for clinical investigation but cannot be directly extrapolated to the interpretation of circulating PSAP levels in patients with T2DM.
Several considerations are important when interpreting these findings. First, the cross-sectional design precludes determination of the temporal relationship between serum PSAP levels and peripheral nerve dysfunction. Second, the analysis was based on an operational NCS-defined outcome involving both the tibial and common peroneal motor nerves, rather than a comprehensive clinical diagnosis of DSPN. Third, the association was not statistically significant after multivariable adjustment, and the restricted cubic spline analysis did not provide evidence of an overall or nonlinear association. Further clinical studies incorporating standardized neurological assessments and comprehensive nerve conduction protocols are warranted to clarify the relationship between circulating PSAP and diabetic peripheral nerve dysfunction.
Several limitations should be acknowledged. First, the single-center cross-sectional design precludes causal inference. Additionally, patients with T2DM were recruited from a hospital, whereas controls were recruited from a health examination center. Despite excluding diabetes in controls according to the 2013 American Diabetes Association diagnostic criteria, differences in recruitment settings and clinical characteristics may have introduced selection bias and residual confounding. Furthermore, serum PSAP measurements were performed in two separate batches using two assay plates, and samples were not randomly allocated across plates. Therefore, potential inter-batch variation cannot be excluded.
Second, the sample size calculation was designed for the comparison of serum PSAP levels between the T2DM and control groups, not for the analysis of lower-limb motor nerve conduction abnormalities. As no previous clinical data were available to estimate the expected effect size for the latter analysis, no separate a priori sample size calculation was performed, and insufficient statistical power cannot be excluded. In the multivariable logistic regression model, the smaller outcome group comprised 35 patients for seven covariates, corresponding to approximately five patients in the smaller outcome group per covariate. This is below commonly recommended events-per-variable thresholds and raises concerns about the stability and precision of the estimates, as well as the potential for overfitting. Although Firth-penalized logistic regression was conducted as a sensitivity analysis, validation in larger cohorts is needed.
Third, nerve conduction assessment was limited to selected nerves, without systematic evaluation of neuropathic symptoms and signs or sensory nerve conduction, including sural nerve assessment. Therefore, the operational definition of lower-limb motor nerve conduction abnormalities should not be equated with a confirmed diagnosis of DSPN. Incomplete information on glucose-lowering medication use also limited the assessment of potential treatment-related confounding.
Finally, serum PSAP was measured at a single time point, precluding evaluation of longitudinal changes. The exploratory mediation analysis cannot establish the temporal ordering of lnPSAP, HbA1c, and T2DM. Moreover, because HbA1c is an established diagnostic criterion for T2DM, the mediation findings should be interpreted cautiously and not as evidence of a causal pathway.
Future multicenter studies with larger and more diverse populations are needed to validate the association between serum PSAP levels and lower-limb motor nerve conduction abnormalities. Longitudinal studies incorporating repeated PSAP measurements and comprehensive clinical and neurophysiological assessments may help clarify the temporal relationship between PSAP levels and peripheral nerve dysfunction. Further cellular and animal studies may also elucidate the potential roles of PSAP in sphingolipid metabolism and peripheral nerve function.
5. Conclusions
In conclusion, serum PSAP levels were higher in patients with T2DM than in normal controls. Although the association between lnPSAP and T2DM remained significant after adjustment for several clinical covariates, it was substantially attenuated and no longer statistically significant after further adjustment for HbA1c. Among patients with T2DM, serum PSAP levels were slightly higher in those with lower-limb motor nerve conduction abnormalities, but the difference was not statistically significant. The association between lnPSAP and these abnormalities was also not statistically significant after multivariable adjustment, and no significant nonlinear association was observed. These findings suggest that serum PSAP may be related to the metabolic disturbances associated with T2DM; however, its relationship with lower-limb motor nerve conduction abnormalities remains inconclusive.
Supplementary Materials
The following supporting information can be downloaded at: https://www.mdpi.com/article/10.3390/biomedicines14112450/s1, Figure S1: Restricted cubic spline analysis of the association between lnPSAP and lower-limb motor nerve conduction abnormality. The solid black line represents the adjusted odds ratio, and the shaded area represents the 95% confidence interval. Models were adjusted for age, sex, SBP, HbA1c, diabetes duration, and 25(OH)D. The dashed horizontal line indicates an odds ratio of 1. p for overall association and p for nonlinearity are shown.
Author Contributions
Conceptualization, D.M., W.X., Y.C. and Y.Y.; methodology, D.M., W.X., Y.C. and Y.Y.; investigation, L.B., R.G. and J.T.; data curation, L.B., W.X. and J.T.; formal analysis, L.B. and R.G.; writing—original draft preparation, L.B.; writing—review and editing, L.B., W.X. and D.M. All authors have read and agreed to the published version of the manuscript.
Funding
This research was funded by the Scientific Research Fund of Health Commission of Hubei Province (WJ2023M013), the Natural Science Foundation of Hubei Province (2024AFB961), and the Teaching and Research Fund for Ideological and Political Education in Curriculum of the Second Clinical College of Tongji Medical College, Huazhong University of Science and Technology (TJSZ2024005), awarded to Weijie Xu.
Institutional Review Board Statement
The study was conducted in accordance with the Declaration of Helsinki and approved by the Ethics Committee of Tongji Hospital (protocol code: TJ-IRB202604018; date of approval: 2 April 2026).
Informed Consent Statement
Informed consent was obtained from all subjects involved in the study. Written informed consent has been obtained from the patients to publish this paper.
Data Availability Statement
The original contributions presented in this study are included in the article. Further inquiries can be directed to the corresponding authors.
Acknowledgments
We acknowledge support from the ward staff of the Division of Endocrinology and the staff conducting neuroelectrophysiological examinations at Tongji Hospital, Huazhong University of Science and Technology, Wuhan, China.
Conflicts of Interest
The authors declare no conflicts of interest.
Abbreviations
The following abbreviations are used in this manuscript:
| T2DM | type 2 diabetes mellitus |
| PSAP | prosaposin |
| DPN | diabetic peripheral neuropathy |
| DSPN | diabetic distal symmetric polyneuropathy |
| NCS | nerve conduction studies |
| NCV | nerve conduction velocity |
| CAMP | compound muscle action potential |
| NC | normal control |
| SBP | systolic blood pressure |
| DBP | diastolic blood pressure |
| BMI | body mass index |
| HbA1c | glycated hemoglobin A1c |
| WBC | white blood cell count |
| Hb | hemoglobin |
| PLT | platelet count |
| UACR | urinary albumin-to-creatinine ratio |
| 25(OH)D | 25-hydroxyvitamin D |
| ALT | alanine aminotransferase |
| TC | total cholesterol |
| TG | triglycerides |
| Cr | creatinine |
| eGFR | estimated glomerular filtration rate |
| FPG | fasting plasma glucose |
| OR | odds ratio |
| CI | confidence interval |
References
- Genitsaridi, I.; Salpea, P.; Salim, A.; Sajjadi, S.; Tomic, D.; James, S.; Thirunavukkarasu, S.; Issaka, A.; Chen, L.; Basit, A.; et al. 11th Edition of the IDF Diabetes Atlas: Global, Regional, and National Diabetes Prevalence Estimates for 2024 and Projections for 2050. Lancet Diabetes Endocrinol. 2026, 14, 149–156, Correction in Lancet Diabetes Endocrinol. 2026. 14, e12. https://doi.org/10.1016/S2213-8587(26)00238-X. [Google Scholar] [CrossRef] [Scilit] [PubMed]
- Kahn, S.E.; Cooper, M.E.; Del Prato, S. Pathophysiology and Treatment of Type 2 Diabetes: Perspectives on the Past, Present, and Future. Lancet 2014, 383, 1068–1083. [Google Scholar] [CrossRef] [Scilit] [PubMed]
- Vijan, S. Type 2 Diabetes. Ann. Intern. Med. 2019, 171, ITC65–ITC80, Erratum in Ann. Intern. Med. 2020, 172, 708. https://doi.org/10.7326/L19-0839. Erratum in Ann. Intern. Med. 2021, 174, 735. https://doi.org/10.7326/L21-0151. [Google Scholar] [CrossRef] [Scilit] [PubMed]
- Bansal, V.; Kalita, J.; Misra, U.K. Diabetic Neuropathy. Postgrad. Med. J. 2006, 82, 95–100. [Google Scholar] [CrossRef] [Scilit] [PubMed]
- Tesfaye, S.; Boulton, A.J.M.; Dyck, P.J.; Freeman, R.; Horowitz, M.; Kempler, P.; Lauria, G.; Malik, R.A.; Spallone, V.; Vinik, A.; et al. Diabetic Neuropathies: Update on Definitions, Diagnostic Criteria, Estimation of Severity, and Treatments. Diabetes Care 2010, 33, 2285–2293, Erratum in Diabetes Care 2010, 33, 2725. https://doi.org/10.2337/dc10-er12a. [Google Scholar] [CrossRef] [Scilit] [PubMed]
- Kishimoto, Y.; Hiraiwa, M.; O’Brien, J.S. Saposins: Structure, Function, Distribution, and Molecular Genetics. J. Lipid Res. 1992, 33, 1255–1267. [Google Scholar] [CrossRef] [Scilit]
- O’Brien, J.S.; Carson, G.S.; Seo, H.C.; Hiraiwa, M.; Kishimoto, Y. Identification of Prosaposin as a Neurotrophic Factor. Proc. Natl. Acad. Sci. USA 1994, 91, 9593–9596. [Google Scholar] [CrossRef] [Scilit] [PubMed]
- Hasegawa, M.; Yamamoto, Y.; Fujisawa, A.; Kashiba, M. Prosaposin Is a Novel Coenzyme Q10-Binding Protein. J. Clin. Biochem. Nutr. 2024, 74, 108–112. [Google Scholar] [CrossRef] [Scilit] [PubMed]
- Li, X.; Guo, L. Prosaposin: A Multifaceted Protein Orchestrating Biological Processes and Diseases. Cells 2025, 14, 1131. [Google Scholar] [CrossRef] [Scilit] [PubMed]
- Ji, X.; Wang, Y.; Xu, S.; Cao, L.; Fang, P.; Zhang, Z. Circulating Prosaposin and Ependymin-Related Protein 1 Levels Are Correlated with Insulin Resistance in Type 2 Diabetic Patients. Front. Endocrinol. 2025, 16, 1519586. [Google Scholar] [CrossRef] [Scilit] [PubMed]
- Hiraiwa, M.; Campana, W.M.; Mizisin, A.P.; Mohiuddin, L.; O’Brien, J.S. Prosaposin: A Myelinotrophic Protein That Promotes Expression of Myelin Constituents and Is Secreted after Nerve Injury. Glia 1999, 26, 353–360. [Google Scholar] [CrossRef]
- Calcutt, N.A.; Campana, W.M.; Eskeland, N.L.; Mohiuddin, L.; Dines, K.C.; Mizisin, A.P.; O’Brien, J.S. Prosaposin Gene Expression and the Efficacy of a Prosaposin-Derived Peptide in Preventing Structural and Functional Disorders of Peripheral Nerve in Diabetic Rats. J. Neuropathol. Exp. Neurol. 1999, 58, 628–636. [Google Scholar] [CrossRef] [Scilit] [PubMed]
- Jolivalt, C.G.; Vu, Y.; Mizisin, L.M.; Mizisin, A.P.; Calcutt, N.A. Impaired Prosaposin Secretion during Nerve Regeneration in Diabetic Rats and Protection of Nerve Regeneration by a Prosaposin-Derived Peptide. J. Neuropathol. Exp. Neurol. 2008, 67, 702–710. [Google Scholar] [CrossRef] [Scilit] [PubMed]
- Sharifian, M.; Rashidian-Rashidabadi, A.; Bagheri, F.; Aghaei, Z.; Haghighatian, Z.; Goodarzi, E.; Marzban, A. Spinal Serotonergic Signaling Mediates the Neuroprotective Effects of Duloxetine Following Chronic Constriction Injury in Rats. Nexus Pathophysiol. Ther. NPT 2026, 1, 1–14. [Google Scholar] [CrossRef]
- Delfani, S.; Bagheri, F.; Rashidian-Rashidabadi, A.; Mokhtari, S.; Darabian, S.; Abbaszadeh, A. GLP-1 Receptor Signaling Partially Mediates Sitagliptin-Induced Neuroprotection in Experimental Neuropathic Pain Following Chronic Constriction Injury. Nexus Pathophysiol. Ther. NPT 2026, 1, 1–17. [Google Scholar] [CrossRef]
- Taha, H.B.; Zhu, S.; Wang, E. Prosaposin in CNS Health and Disease, Metabolic Stress and Exercise Adaptation. J. Mol. Med. Berl. Ger. 2026, 104, 38. [Google Scholar] [CrossRef] [Scilit] [PubMed]
- Dunnigan, S.K.; Ebadi, H.; Breiner, A.; Katzberg, H.D.; Lovblom, L.E.; Perkins, B.A.; Bril, V. Conduction Slowing in Diabetic Sensorimotor Polyneuropathy. Diabetes Care 2013, 36, 3684–3690. [Google Scholar] [CrossRef] [Scilit] [PubMed]
- Uncini, A.; Cavallaro, T.; Fabrizi, G.M.; Manganelli, F.; Vallat, J.-M. Conduction Slowing, Conduction Block and Temporal Dispersion in Demyelinating, Dysmyelinating and Axonal Neuropathies: Electrophysiology Meets Pathology. J. Peripher. Nerv. Syst. JPNS 2024, 29, 135–160. [Google Scholar] [CrossRef] [Scilit] [PubMed]
- Obrosova, I.G. Diabetes and the Peripheral Nerve. Biochim. Biophys. Acta 2009, 1792, 931–940. [Google Scholar] [CrossRef] [Scilit] [PubMed]
- Vincent, A.M.; Callaghan, B.C.; Smith, A.L.; Feldman, E.L. Diabetic Neuropathy: Cellular Mechanisms as Therapeutic Targets. Nat. Rev. Neurol. 2011, 7, 573–583. [Google Scholar] [CrossRef] [Scilit] [PubMed]
- Feldman, E.L.; Nave, K.-A.; Jensen, T.S.; Bennett, D.L.H. New Horizons in Diabetic Neuropathy: Mechanisms, Bioenergetics, and Pain. Neuron 2017, 93, 1296–1313. [Google Scholar] [CrossRef] [Scilit] [PubMed]

Disclaimer/Publisher’s Note: The statements, opinions and data contained in all publications are solely those of the individual author(s) and contributor(s) and not of MDPI and/or the editor(s). MDPI and/or the editor(s) disclaim responsibility for any injury to people or property resulting from any ideas, methods, instructions or products referred to in the content. |
© 2026 by the authors. Licensee MDPI, Basel, Switzerland. This article is an open access article distributed under the terms and conditions of the Creative Commons Attribution (CC BY) license.