


Abstract
Background: Clinical responses to first-generation mechanistic target of rapamycin (mTOR) inhibitors vary substantially across malignancies, indicating that pathway activation alone is insufficient to identify tumors likely to depend on mTOR signaling. Methods: We developed Partitioned Literature Aggregation (PLA), a framework that organizes large biomedical literature collections into disease-specific summaries before cross-disease aggregation. A single discovery query identified malignancies evaluated with rapamycin, everolimus, or temsirolimus, after which each disease-specific corpus was independently interrogated using an identical standardized prompt. Applied to more than 4.4 million PubMed abstract records representing 24 disease-specific corpora, PLA generated comparative clinical summaries that identified renal cell carcinoma (RCC) and hepatocellular carcinoma (HCC) as contrasting anchors of established and unsuccessful rapalog development, respectively. To investigate molecular features associated with this clinical contrast, overall-survival relationships for mTOR-associated genes were evaluated across publicly available transcriptomic cohorts using the Kaplan–Meier Plotter platform. Associations meeting the prespecified exploratory threshold of p < 0.01 were assembled into a gene-by-indication matrix according to hazard-ratio direction. Results: HCC and RCC exhibited distinct prognostic architectures, supporting further investigation of the HCC state associated with historically limited rapalog efficacy. Within HCC, stepwise composite analysis identified a four-gene prognostic signature comprising PPARGC1A, EIF4E, RRAGC, and FKBP1A. Higher four-gene adverse-risk scores were associated with poorer overall survival (HR for high versus low score, 2.59; 95% CI, 1.8–3.74; log-rank p = 1.1 × 10⁻⁷). The complete four-gene architecture was not uniformly retained across immune contexts. Exploratory subgroup analyses identified significant prognostic associations in eight TLR-high strata after correction for multiple comparisons, whereas none of the TLR-low strata met the corrected threshold. Component-gene associations were also observed in seven tumor-microenvironment strata—MSC-low, CD4-low, RegT-high, Th1-high, NK-high, macrophage-high, and CD8-low. These exploratory observations generate hypotheses concerning immune context. Conclusions: These findings link the prognostic signature to immune context and support prospective testing of its potential to identify HCC patients who benefit from mTOR-directed therapy.
1. Introduction
The phosphatidylinositol 3-kinase (PI3K)/protein kinase B (AKT)/mechanistic target of rapamycin (mTOR) signaling pathway (PI3K/AKT/mTOR) is a central regulator of cellular growth, proliferation, metabolism, and survival. It integrates growth-factor and nutrient inputs to coordinate mRNA translation and cell-cycle progression. The mammalian/mechanistic target of rapamycin (mTOR) pathway serves as a master nutrient sensor that promotes anabolic metabolism and suppresses autophagy necessary for rapid cancerous growth [1,2,3,4]. mTOR is a serine/threonine kinase that regulates cell growth and metabolism in response to diverse external stimuli and functions as a central node in a complex net of signaling pathways that are involved in both normal physiological and pathogenic events [5]. mTOR assembles into two multi-protein complexes, mTORC1 and mTORC2; the former is rapamycin-sensitive, whereas the latter is generally rapamycin-resistant [6]. Together, mTORC1/2 represent the major regulator of growth in animals and are the key link between the availability of nutrients in the environment and the control of most anabolic and catabolic processes [3]. Upstream cues such as PI3K–Akt signaling and the tuberous sclerosis complex (TSC) converge on mTOR, while downstream targets include AKT, protein kinase C, 4E-BP1, ribosomal protein S6 kinase (S6K), transcription factor EB, sterol-responsive element-binding proteins, Lipin-1, and Unc-51-like kinases, allowing the pathway to govern translation, lipid and nucleotide synthesis, lysosome biogenesis, nutrient sensing, and growth-factor signaling [7]. Through phosphorylation of 4E-BP1 and S6K, activated mTORC1 increases the level of many proteins that are needed for cell-cycle progression, proliferation, angiogenesis, and survival pathways [8], while mTORC2 activates PKC-α and AKT and regulates the actin cytoskeleton [6]. Not surprisingly, mTOR deregulation is implicated in a broad range of pathological conditions, including diabetes, cancer, neurodegenerative diseases, myopathies, inflammatory, infectious, and autoimmune conditions [9]; constitutive pathway activation drives aging, neurological diseases, and human malignancies [7], establishing mTOR as a prime therapeutic target for metabolic disorders, cancer, and age-related disease [1].
The rapamycin-sensitive complex (mTORC1) promotes protein synthesis in response to growth factors and nutrients via the phosphorylation of p70S6K and 4E-BP1 [10]. Acting as the key link between the availability of nutrients in the environment and the control of most anabolic and catabolic processes, mTORC1 is engaged by lysosome-associated Rag GTPases and their many regulators and associated cytosolic and lysosomal nutrient sensors [3]. Consistently, mTORC1 activation occurs in response to nutrient availability, growth-factor signals, and stress, and regulates much of the cell’s biosynthetic activity, from proteins to lipids, and recycling through autophagy [4]. Downstream, the pathway plays a central role in regulating translation, lipid synthesis, nucleotide synthesis, biogenesis of lysosomes, nutrient sensing, and growth-factor signaling [7]. Upstream modulation involves Akt and the tuberous sclerosis complex (TSC), which integrate mitogenic cues with metabolic control [5]. Owing to this breadth of influence, mTOR deregulation is implicated in a broad range of pathological conditions, including diabetes, cancer, neurodegenerative diseases, and autoimmune conditions, underscoring the therapeutic importance of precisely targeting mTORC1 activity [9].
In contrast, the rapamycin-insensitive complex (mTORC2) represents the nutrient-insensitive branch of mechanistic TOR signaling that is predominantly activated by hormonal and growth-factor cues. It is insensitive to nutrients or energy conditions, yet in response to hormones or growth factors, mTORC2 phosphorylates Akt and regulates the actin cytoskeleton and cell survival [11]. Functionally, the complex promotes cell migration and survival via the activation of Rho GTPases and the phosphorylation of AKT, respectively, with its promigratory activity depending on its interaction with P-Rex1, a Rac-specific guanine nucleotide exchange factor [10]. Although its kinase activity is not acutely blocked by rapamycin, hours of incubation with this antibiotic can impede the assembly of this signaling complex [10], highlighting the therapeutic challenge of selectively inhibiting mTORC2. Downstream, mTORC2 phosphorylates the C-terminal hydrophobic motif of some AGC kinases like Akt and SGK and, through its association with ribosomes, plays a crucial role in the maintenance of normal and cancer cells while being involved in cellular metabolic regulation [12]. Reflecting this breadth of action, recent reviews note that knowledge of mTORC2 is rapidly expanding with particular focus on its involvement in the control of cell metabolism and its physiological implications in metabolic diseases and aging [13]. Collectively, these observations establish mTORC2 as a central integrator of growth-factor signaling, cytoskeletal dynamics, metabolic homeostasis, and oncogenic processes, underscoring its promise—but also its complexity—as a therapeutic target.
Here we analyze large, clinically annotated transcriptomic cohorts to identify mTOR-associated prognostic signatures and explore their potential relevance to treatment with mTOR inhibitors, including intravenous everolimus (Sapu003). The HCC tumor microenvironment influences progression, immune escape, treatment response, and survival. TLR signaling is context dependent: TLR3 can promote tumor-cell death and immune-cell recruitment, whereas TLR2/4 signaling can drive immunosuppression, stemness, invasion, metastasis, and recurrence [14,15,16,17,18]. TLR profiles may therefore support prognostic assessment and patient stratification, although their heterogeneous cellular effects complicate clinical translation [19,20]. Sapu003 is a clinical-scale mPEG–cholesterol Deciparticle™ formulation developed for reproducible intravenous delivery of hydrophobic everolimus [21]. In rats, Sapu003 produced dose-proportional pharmacokinetics, substantially higher and more predictable systemic exposure, and broader tissue distribution than oral everolimus, without marked gastrointestinal accumulation [22]. Repeat-dose GLP studies showed no treatment-related mortality, injection-site intolerance, or gastrointestinal lesions, supporting continued clinical evaluation [22].
2. Materials and Methods
2.1. Establishment of a 28M PubMed Corpus
Each abstract was embedded and transformed (langchain-openai 0.2.3, openai 1.52.0) into a vector of numbers capturing semantic similarity between text elements (tokens) and then stored in our internal Qdrant vector database (https://qdrant.tech/, accessed on 1 July 2026) using puppeteer 19.11.1. Semantically similar abstracts are transformed into the same vector “embedding” space, as the embedding has been trained to minimize the distance between pairs of abstracts in this space. During the question-answering process, the user’s query is converted into an embedding vector. A similarity metric, such as cosine similarity, is then utilized to find the embedded abstract vectors nearest to the vector representing the query. The abstracts that correspond to these nearest vectors are subsequently provided to the question-answering model as context, alongside the original query, to produce a response to the user’s question.
The React framework served as the backbone of the user interface, providing an open-source and flexible solution for developing powerful front-end user interfaces (https://react.dev/, accessed on 25 March 2024). In addition, we used the @mui/material (https://mui.com/, accessed on 25 March 2024) libraries for the interface’s design aspects and aimed to follow the material design guidelines closely. Serving the front end was Node.js (https://nodejs.org/en, accessed on 25 March 2024). The Node.js libraries included in the project were @adobe/pdfservices-node-sdk 3.4.2, @aws-sdk/client-s3 3.412.0, @langchain/community 0.2.5, @material-ui/core 4.12.4, @mui/base 5.0.0-beta.18, @mui/icons-material 5.11.16, @mui/material 5.15.20, @mui/styled-engine-sc 5.12.0, @mui/x-date-pickers 6.15.0, @qdrant/js-client-rest 1.4.0, carrot2 0.0.1, pdf2img 0.5.0, pdfjs-dist 4.5.136, puppeteer 19.11.1, react 18.2.0, sequelize 6.31.1, and zod 3.22.4.
2.2. Partitioned Literature Aggregation (PLA)
PDAOAI, Oncotelic, Agoura Hills, USA, powered by the OpenAI GPT-5.0 large language model (OpenAI, San Francisco, CA, USA) was used. PDAOAI is publicly available at this link: https://sapu-public.oncochatbot.com, accessed on 1 July 2026. The Partitioned Literature Aggregation (PLA) framework was developed to systematically characterize the clinical development landscape of first-generation mTOR inhibitors across oncology. The analysis was initiated by querying the complete PubMed-derived literature corpus (28M abstracts) with PDAOAI using the standardized discovery prompt: “Provide a complete list of all cancers tested with rapalogs such as mTOR inhibitors, everolimus, rapamycin, temsirolimus.” The LLM model identified all malignancies in which first-generation mTOR inhibitors had been investigated. These malignancies were subsequently used to define disease-specific literature corpora. Each disease-specific corpus was then interrogated independently with PDAOAI using an identical standardized prompt: “Provide comprehensive writeup on the clinical efficacy of mTOR inhibitors.” Aggregation of the responses was performed using the LLM. The model independently classified each malignancy into one of three evidence categories without user interaction or manual reassignment:
1. Established indications—supported by randomized Phase III clinical trials and regulatory approval. 2. Investigational indications—supported by reproducible Phase I/II clinical studies or biomarker-guided clinical activity but lacking regulatory approval. 3. Negative or experimental indications—clinical studies demonstrating insufficient therapeutic efficacy for routine clinical use or evidence limited to preclinical investigation.
Mathematical Proof of PLA. Let the literature be divided into 24 disease-specific corpora:
where Ci contains ni abstract records assigned to disease corpus i. In the manuscript:
= {C1, C2, …, C24}
Because some diseases represent overlapping or nested categories, N is the total number of abstract-partition assignments processed, not necessarily the number of unique PubMed abstracts after cross-corpus deduplication.
Monolithic analysis. When all records are searched together in a single retrieval space, the approximate representation weight of disease is:
Thus, a disease with twice as many assigned abstracts has approximately twice the opportunity to influence retrieval and the resulting synthesis, assuming comparable relevance distributions.
Partitioned Literature Aggregation. PLA applies the same standardized clinical-efficacy query independently to each disease corpus:
where Q is the identical query and Si is the resulting disease-specific summary.
Si = Q(Ci), i = 1, …, 24
The 24 disease-level summaries are then aggregated:
where G denotes the final evidence-synthesis and classification step.
A = G(S1, S2, …, S24)
Because every disease contributes one disease-level summary before aggregation, its initial representation weight is:
Therefore, each disease contributes 4.17% of the disease-level comparison, regardless of the size of its underlying literature corpus.
The proof. For any two diseases i and j, their relative representation under monolithic analysis is approximately:
Under PLA:
Therefore:
PLA transforms corpus-size-weighted representation into equal initial disease-level representation.
2.3. Literature Scope for mTOR Analysis
We took the entirety of literature data and performed partition and aggregation to arrive at a meaningful synthesis of the clinical literature data on mTOR inhibitors. Mathematically, PLA replaces corpus-size-weighted representation with disease-level representation. Under monolithic retrieval, the approximate relative contribution of disease i is ni/N, where ni is the number of abstract records assigned to that disease corpus and N is the total number of abstract-partition assignments. Under PLA, an identical query is independently applied to each of 24 disease-specific corpora, producing one disease-level summary per corpus before aggregation. Consequently, every disease receives an initial representation weight of 1/24, or 4.17%. For example, the breast-cancer corpus was 73.7-fold larger than the mantle-cell-lymphoma corpus, producing a potential representation ratio of approximately 73.7:1 under monolithic retrieval. PLA reduced this ratio to 1:1 at the disease-summary level. PLA does not establish that all diseases have equivalent clinical evidence; it establishes that all 24 diseases are independent.
The processed 24 cancer subgroups included 4,599,457 abstracts and represent disease-specific corpora as contextual retrieval spaces rather than mutually exclusive publication sets. Consequently, an abstract relevant to both a broad disease category and a nested malignancy could be included in more than one corpus. This intentional overlap allowed each disease-specific query to be evaluated within its relevant clinical and biological context. Accordingly, the aggregate number of abstracts represents the sum of records retrieved across all disease-specific analyses and should not be interpreted as the number of unique publications after deduplication across corpora. The data used in the analysis are shown below (Table 1).
Table 1.
Summary of the data reported in mTOR analysis.
2.4. PLA-Based Gene Extraction and Clustering Analysis
Gene identification was performed using an mTOR-focused literature corpus represented by 32,896 abstract-level response records using a keyword search of mTOR and cancer. Each abstract was interrogated independently using the identical prompt: “Provide the gene names involved in mTOR signaling that are reported in this abstract.” The abstract-specific outputs were subsequently aggregated, gene names were normalized, and duplicate entries were consolidated into a nonredundant gene catalog.
Gene frequency was calculated as the number of distinct PMID-associated responses mentioning that gene; repeated mentions within the same response contributed only one occurrence to this frequency. Unresolved gene-family or complex names and nonhuman labels were retained separately rather than assigned to individual human genes.
The aggregated responses contained 4851 distinct entries: 4812 resolved human gene symbols and 39 unresolved or nonhuman labels. The human-gene catalog included core mTOR-complex components, upstream signaling and nutrient-sensing regulators, downstream translational and metabolic effectors, and contextual genes.
If Ai denotes abstract i, the model generated an abstract-specific gene set:
where Q represents application of the identical gene-extraction query to the individual abstract.
Gi = Q(Ai),
The gene sets extracted from the individual abstracts were then combined to generate the grand gene list:
where N = 32,896 abstracts. Duplicate gene names identified in multiple abstracts were consolidated during aggregation. Thus, repeated identification of the same gene increased its frequency of occurrence but did not create multiple entries in the final nonredundant gene list.
The procedure therefore followed three steps:
individual abstract → abstract-specific gene list → aggregated nonredundant gene list.
The complete export preserved the input PMID list, processing settings, queries, and model outputs. The recorded configuration specified GPT-5, dense PubMed similarity search with k = 100, and a processing batch size of 40. Similarity search ranked records by embedding similarity to the query. Internet access, conversational memory, and automated summary generation were disabled. The PDAOAI temperature setting was 7; no seed was specified. The reported prompts, processing settings, and archived outputs support traceability but do not establish repeat-run reproducibility. No seed was specified, and stability across independent runs was not evaluated. Even though multiple runs were performed and results were found to be similar, a comprehensive review of reproducibility was not performed.
No regulatory or clinical-trial benchmark was applied because FDA/EMA labels and ClinicalTrials.gov do not provide comprehensive reference standards for genes involved in mTOR biology. The mathematical basis for separate abstract-level interrogation followed by aggregation is presented in the Section 3.
Separately, the complete 65,558-abstract mTOR corpus was interrogated using the monolithic prompt: “Provide list of genes for mTOR pathway—be exhaustive and including all mTOR pathway genes or genes upstream and downstream affectors of mTOR.” After deduplication and symbol normalization, the monolithic response contained 138 explicitly named human genes. All 138 were present in the abstract-level aggregated catalog.
The literature-derived list was intentionally broader than the canonical structural components of mTORC1 and mTORC2. Genes were broadly identified as belonging to at least one of the following functional categories: mTOR-complex components, upstream signaling inputs, nutrient- or energy-sensing regulators, direct substrates, downstream translational or metabolic effectors, feedback regulators, mTOR-interacting proteins, or members of experimentally defined mTOR-centered molecular networks. The initial list therefore included both canonical pathway genes and noncanonical genes with documented functional or network-level relationships to mTOR signaling.
Canonical genes included core mTOR-complex components and established pathway regulators such as MTOR, RPTOR, MLST8, RICTOR, MAPKAP1, PRR5, AKT, RPS6KB1, EIF4EBP1, EIF4E, RHEB, TSC1, TSC2, PTEN, PIK3CA, DEPTOR, and RAS-family signaling proteins. The broader literature search also identified RALA, RAC1, PPARGC1A, and FKBP1A as mTOR-associated candidates.
A prognosis matrix was constructed using significant gene-indication associations derived from overall-survival analyses. Gene-indication associations meeting the nominal p < 0.01 threshold were included in a prognosis matrix used primarily for visualization and exploration, with HR direction recorded as favorable (HR < 1) or adverse (HR > 1). This threshold was more stringent than p < 0.05 but did not constitute formal multiplicity control. These associations were considered hypothesis-generating. Non-significant associations were represented as blank cells. Gene expression and overall-survival analyses were performed using the KMplotter RNA-seq platform. For HCC, the underlying database was TCGA-LIHC, the same database used in the subsequent direct computational analyses. KMplotter HCC analyses and direct TCGA-LIHC analyses therefore represent analyses of the same underlying patient cohort and were not treated as independent datasets. Each gene was analyzed individually within each cancer indication using the KMplotter survival-analysis platform. Patients were dichotomized into high- and low-expression groups using the median expression cutoff, and overall survival was evaluated by Kaplan–Meier analysis with hazard ratios (HRs) and log-rank p-values reported by the database.
Liver (HCC) and kidney (RCC) cancers were used as reference prognostic programs. Each indication was compared according to the overlap of its significant prognostic genes with these reference signatures and classified into one of five groups: HCC, HCC-biased intermediate, RCC-biased intermediate, RCC, or Null (no significant prognostic genes).
2.5. Development of the HCC Four-Gene Composite Prognostic Signature
Initial HCC gene screening and composite development were performed using TCGA-LIHC through the KMplotter HCC RNA-seq interface. The four-gene signature was developed within this discovery cohort. Subsequent direct TCGA-LIHC reanalysis assessed internal robustness, whereas the independent ICGC LIRI-JP cohort was used for external validation.
To develop a multigene prognostic signature, PPARGC1A was first selected as the anchor gene because it exhibited the strongest independent favorable prognostic association within the candidate gene set (HR < 1). Candidate adverse genes (HR > 1) were subsequently evaluated individually by constructing equal-weight two-gene composite signatures consisting of PPARGC1A (inverted) and a single adverse gene. These 11 genes are EIF4E, FKBP1A, HRAS, KRAS, NDRG1, NRAS, PPARG, RAC1, RALA, RHEB, and RRAGC. Each two-gene signature was assessed using Kaplan–Meier overall-survival analysis, hazard ratio (HR), and log-rank significance.
Genes demonstrating the greatest improvement in prognostic discrimination were then compared for redundancy using Pearson and Spearman correlation analyses. Preference was given to genes that both enhanced the prognostic performance of PPARGC1A and provided complementary information, as indicated by low correlation with PPARGC1A or by representing distinct correlation modules.
Based on these analyses, FKBP1A, EIF4E, and RRAGC were selected for incorporation into the final composite with PPARGC1A. Each gene’s expression was standardized to a mean of zero and standard deviation of one within the discovery cohort. The four-gene score was calculated as Z(FKBP1A) + Z(EIF4E) + Z(RRAGC) − Z(PPARGC1A), using equal-magnitude coefficients. Higher scores indicate the adverse prognostic state.
Patients were dichotomized using the median composite score generated by the KMplotter algorithm, and overall survival was evaluated by Kaplan–Meier analysis with hazard ratios estimated using Cox proportional-hazards regression. No weighting optimization or coefficient fitting was performed; all genes contributed equally to the composite score. However, gene selection was guided by discovery-cohort survival outcomes. No multiplicity correction encompassing the complete sequential model-search procedure was applied; discovery-model p values are therefore descriptive rather than confirmatory.
2.6. Validation Using ICGC LIRI-JP Cohort
Gene-level RNASeqV2 RSEM-normalized expression data for TCGA-LIHC were obtained from the Broad Institute GDAC Firehose 2016_01_28 release and matched to the corresponding clinical overall-survival data. The analysis was restricted to primary tumor samples with valid gene-expression measurements, positive follow-up time, and an overall-survival event indicator coded as 1 for death and 0 for censoring. The final matched cohort comprised 365 patients and 131 deaths.
Figure 1 summarizes the two underlying cohorts and their analytical roles: TCGA-LIHC for discovery, model development, and internal robustness assessment, and ICGC LIRI-JP for independent external validation. Table 2 reports cohort characteristics, expression sources, eligible patient counts, and death counts. KMplotter and direct TCGA-LIHC analyses are explicitly identified as analyses of the same underlying database.
Figure 1.
Cohort provenance and analytical workflow. TCGA-LIHC and the HCC RNA-seq database accessed through KMplotter are the same underlying database. KMplotter was used for discovery, composite development, and exploratory subgroup analyses. Direct TCGA-LIHC reanalysis included 365 eligible patients and 131 deaths; cross-fitting assessed internal robustness within this same cohort. Independent external validation used ICGC LIRI-JP through HCCDB18, comprising 212 tumor specimens aggregated to 203 patients, with 35 deaths. The four-gene score was fixed before external testing and applied without gene selection or coefficient refitting. Exact eligible sample sizes and death counts for individual KMplotter analyses should accompany their corresponding results.
Table 2.
Cohort characteristics and analytical roles of TCGA-LIHC and ICGC LIRI-JP.
Processed level-3 gene-expression and clinical data for LIRI-JP were obtained from HCCDB18 [23]. When multiple tumor specimens were available from the same patient, expression values were averaged at the patient level without reference to survival outcomes. When multiple probes mapped to the same gene, their normalized expression values were averaged to generate one patient-level value for that gene. No gene or probe was selected according to its association with survival in the validation cohorts.
The same four genes, coefficient directions, and gene-wise z-standardization procedure were used in validation. Each gene’s expression was standardized separately within each validation cohort to a mean of zero and standard deviation of one across eligible tumor samples, without reference to survival outcomes. The coefficients were fixed and were not refitted. The four-gene composite score was calculated as:
Composite score = +Z(FKBP1A) + Z(EIF4E) + Z(RRAGC) − Z(PPARGC1A).
A higher score therefore represented the adverse-risk molecular state, reflecting higher relative expression of FKBP1A, EIF4E, and RRAGC and lower relative expression of PPARGC1A. No genes were added or removed, and the coefficients were not refitted in any validation cohort. The three-gene composite score was calculated similarly with the Z(FKBP1A) value excluded. As a scaling sensitivity analysis, the composite was also calculated directly from the processed expression values without gene-wise standardization:
Unstandardized score = +FKBP1A + EIF4E + RRAGC − PPARGC1A.
The primary validation analysis evaluated the standardized composite as a continuous variable using Cox proportional-hazards regression. The effect estimate was reported as the hazard ratio for overall mortality per one-standard-deviation increase in the composite score, with its 95% confidence interval and two-sided Wald p value. Harrell’s concordance index was used to summarize rank discrimination. The proportional-hazards assumption was assessed using scaled Schoenfeld residuals.
For secondary visualization, patients were divided into high- and low-score groups using the cohort-specific median, selected without reference to survival outcome. Kaplan–Meier curves were compared using a two-sided log-rank test, and a Cox model was used to estimate the high-versus-low score hazard ratio. Median dichotomization was considered a secondary descriptive analysis and not the primary validation test.
LIRI-JP constituted the single primary external-validation test, for which two-sided p < 0.05 was considered evidence of replication in the expected direction. No alternative gene combinations, coefficients, or outcome-derived cutoffs were evaluated. Analyses were performed using Python 3.12.13 with pandas 2.2.3, NumPy 2.3.5, SciPy 1.17.0, and lifelines 0.30.3.
We performed limited additional sensitivity analyses in all 203 patients, including 35 deaths. Selected covariates were complete; no imputation was required. To limit model complexity, cirrhosis and venous invasion were added separately to a clinical model containing age, sex, and UICC T category. Each combined model contained five regression parameters.
The locked four-gene score remained associated with overall survival after adjustment for cirrhosis (HR per SD, 1.48; 95% CI, 1.03–2.12; p = 0.0339) or venous invasion (HR, 1.50; 95% CI, 1.05–2.14; p = 0.0270). An exploratory model additionally adjusting for HBV presence produced a consistent association (HR, 1.47; 95% CI, 1.02–2.11; p = 0.0377).
Child–Pugh class, albumin, bilirubin, AFP, performance status, and treatment were absent from the recovered clinical annotations and could not be incorporated. Residual clinical confounding remains a limitation.
2.7. Repeated Cross-Fitted Pathway Analysis
To evaluate the robustness of the identified HCC pathway state, patients were divided into five folds stratified by overall-survival event status. Five-fold cross-fitting was repeated 20 times using a fixed pseudorandom seed of 1701, yielding 100 training and held-out evaluations. For each evaluation, four folds formed the training set and the remaining fold was held out. Each patient’s final pathway score was the mean of the scores generated for that patient during evaluations in which the patient was held out.
Within each training set, candidates were divided into high- and low-expression groups using the training-set median. Eligibility required a two-sided training-set log-rank p < 0.05, an effect magnitude of at least HR 1.25 or its reciprocal, and agreement with the prespecified direction. Eligible candidates were ranked by training-set log-rank p value, effect magnitude, and molecular-coherence score, in that order. Eligibility thresholds were not relaxed when no candidate qualified.
Effector expression was standardized within the training set, and separate centroids were calculated for the candidate-high and candidate-low groups. Molecular coherence represented the proportion of measured effectors whose differences agreed with their prespecified activation or inhibition directions. Magnitude was the mean absolute standardized difference. Molecular quality was calculated as max [0, 2(coherence) − 1] × magnitude × square root of the number of measured effectors. Molecular quality served only as the final tie-breaker after training p-value and HR effect size.
For each held-out patient, squared Euclidean distances from the training-derived candidate-low and candidate-high effector centroids were calculated. The activity score was defined as the mean distance to the low centroid minus the mean distance to the high centroid. Positive activity scores indicated a downstream expression state more similar to the candidate-high or activity-like downstream state, whereas negative scores indicated a state more similar to the candidate-low or suppression-like state. No held-out survival outcomes contributed to anchor selection, centroid estimation, or scoring for that held-out evaluation.
For the final cross-fitted score, patients were divided at the cohort median into activity-like and suppression-like groups. OS distributions were compared with a two-sided log-rank test. Hazard ratios and 95% confidence intervals were estimated using a univariable Cox proportional-hazards model with Efron handling of tied event times. The primary displayed contrast was activity-like versus suppression-like. Under this convention, HR > 1 indicated adverse OS for the activity-like group and HR < 1 indicated beneficial OS. When the reverse contrast was displayed, the HR and both confidence limits were reciprocated and the confidence limits were reordered. All figures, tables, and machine-readable results named the numerator and denominator explicitly.
2.8. Component Gene and Immune Context Analyses
Each of the 12 candidate genes was also evaluated individually using a cohort-median expression cutoff, a two-sided log-rank test, and Cox proportional-hazards regression comparing higher with lower expression. Observed HR directions were compared with their prespecified directions. Benjamini–Hochberg FDR correction was applied across all 12 component-gene tests. Individual-gene results were considered supportive and were not used as evidence of treatment response.
TLR1 through TLR10 and TGFB1 through TGFB3 were evaluated as exploratory overlays. For each measured overlay gene, patients were divided at the gene-specific median, and the cross-fitted pathway score was tested separately within the lower and higher overlay strata. The HCC4 overlay used the signed standardized composite defined above and was divided at its median. Raw p values and Benjamini–Hochberg q values were reported within each declared overlay family. Statistical significance in one stratum and not another was not interpreted as interaction; effect modification required a separate formal interaction model.
Exploratory TME analyses were conducted using the immune-cell-infiltration classifications available through KMplotter, including basophils, B cells, CD4+ T cells, CD8+ T cells, eosinophils, monocytes, mesenchymal stromal cells (MSCs), natural killer (NK) cells, regulatory T cells (Tregs), T helper 1 (Th1) cells, and T helper 2 (Th2) cells. Complete component-gene retention required all four genes to have nominal log-rank p < 0.01 within the subgroup, with HR < 1 for PPARGC1A and HR > 1 for EIF4E, RRAGC, and FKBP1A. Partial component-gene retention required exactly three genes to meet these same criteria. Subgroups with fewer than three qualifying genes were described by their component count. A significant composite association in the absence of four individually significant component genes was described as a composite association and not as retention of the complete signature. The subgroup analyses were considered exploratory, and nominal significance in one subgroup was not interpreted as a statistically significant interaction.
2.9. Software, Multiplicity Control, and Analytical Reporting
The TCGA pathway application was implemented as a self-contained JavaScript browser application and executed locally so that uploaded patient data were not transmitted. The analysis exported the cohort size, event count, selected genes and pathways, cross-fitting configuration, eligibility thresholds, HR orientation, fold-level candidate results, direction-concordance indicators, eligibility decisions, anchor-selection frequencies, patient-level out-of-fold scores, component-gene results, and overlay results in machine-readable JSON format.
The ICGC LIRI-JP validation analysis was performed in Python version 3.12.10. Data processing was conducted using pandas version 2.2.3 and NumPy version 2.3.5. Cox regression, Kaplan–Meier estimation, log-rank testing, Harrell’s concordance index, and proportional-hazards testing were implemented using lifelines version 0.30.3, with additional statistical functionality provided by SciPy version 1.17.0. Kaplan–Meier plots were generated using Matplotlib version 3.10.8 in Python version 3.12.14.
All statistical tests were two-sided. Exact p-values, HRs, 95% confidence intervals, and multiplicity-adjusted q-values were reported where applicable. The cross-cancer screening, cross-fitted pathway analysis, and immune-context analyses were considered exploratory. Benjamini–Hochberg corrections applied to subsequent analyses addressed their respective testing families and did not correct the initial cross-cancer screen. The locked ICGC LIRI-JP analysis provided independent prognostic validation of the final four-gene score. No survival analysis was interpreted as demonstrating predictive sensitivity to an mTOR inhibitor in the absence of a prespecified treatment-by-signature interaction in an appropriately treated cohort.
3. Results
3.1. Partitioned Literature Aggregation (PLA)
To evaluate the effect of disease partitioning on literature synthesis, the standardized instruction, “Provide a comprehensive write-up on the clinical efficacy of mTOR inhibitors,” was applied using two analytical workflows. The first queried the complete PubMed-derived corpus as a single monolithic knowledge base, whereas the second independently interrogated each disease-specific literature corpus before performing aggregation of the resulting disease-level responses.
The monolithic query successfully identified the major clinically established indications for first-generation rapalogs, including advanced renal cell carcinoma (RCC), hormone-receptor-positive/HER2-negative breast cancer, pancreatic neuroendocrine tumors, mantle cell lymphoma, and tuberous-sclerosis-associated tumors. The generated synthesis correctly described the overall-survival benefit of temsirolimus in poor-risk RCC, the progression-free-survival benefit of everolimus following VEGF-targeted therapy, and the regulatory approval of these agents in their principal indications. Additional observations included discussion of adverse-event profiles, next-generation catalytic mTOR inhibitors, and treatment resistance. The response therefore captured many of the major themes of mTOR-inhibitor development and produced an accurate high-level summary of the literature.
The monolithic synthesis was highly asymmetric, with a large proportion of the discussion devoted to RCC, followed by neuroendocrine tumors and tuberous-sclerosis-associated indications. Numerous statements describing RCC efficacy were repeatedly supported by different review articles and guideline summaries, resulting in multiple citations describing essentially the same clinical observations. The monolithic analysis generated detailed discussion for only a limited number of diseases and largely omitted independent evaluation of many malignancies represented within the source library, including hepatocellular carcinoma, gastric cancer, colorectal cancer, endometrial cancer, diffuse large B-cell lymphoma, acute myeloid leukemia, multiple myeloma, prostate cancer, and several additional tumor types. Where these diseases were mentioned, they were generally incorporated into broad statements describing limited activity of rapalogs in solid tumors rather than receiving disease-specific clinical assessment. Consequently, the monolithic synthesis primarily emphasized successful clinical programs while compressing or omitting diseases in which first-generation mTOR inhibitors demonstrated limited efficacy or failed clinical development.
Independent interrogation of disease-specific corpora produced a substantially different result. Because each malignancy was required to answer the identical standardized question before aggregation, every disease generated an individual clinical-efficacy response describing the highest level of available evidence, therapeutic setting, regulatory status, major limitations, and representative supporting studies. This reduces representation of the response to one per indication regardless of the size of the corpora. Diseases with established clinical benefit, including RCC, pancreatic neuroendocrine tumors, hormone-receptor-positive breast cancer, mantle cell lymphoma, and tuberous-sclerosis-associated tumors, were evaluated alongside malignancies such as hepatocellular carcinoma, glioblastoma, pancreatic adenocarcinoma, gastric cancer, colorectal cancer, and non-small-cell lung cancer, in which substantial biological rationale failed to translate into meaningful clinical efficacy and therefore had relatively lower abstract counts. The resulting synthesis therefore retained the complete spectrum of clinical outcomes rather than preferentially representing successful indications. The workflow for this Partitioned Literature Aggregation (PLA) approach is illustrated in Figure 2. A comparative evaluation of the monolithic and disease-partitioned literature-query strategies, highlighting the methodological distinctions and resulting scientific implications of each approach, is summarized in Table 3.
Figure 2.
Workflow of Partitioned Literature Aggregation (PLA) framework. The complete PubMed corpus (28M) was initially interrogated using a standardized discovery query to identify all malignancies investigated with first-generation mTOR inhibitors (rapamycin/sirolimus, temsirolimus, and everolimus). The resulting literature was partitioned into disease-specific corpora comprising 24 malignancies represented in a total of 4,599,457 PubMed abstracts. Each disease corpus was independently analyzed using an identical standardized clinical-efficacy query to generate disease-specific summaries. The resulting evidence was subsequently aggregated and classified according to the highest level of clinical evidence into three categories: (i) established indications supported by randomized Phase III trials and regulatory approval, (ii) investigational indications supported by early-phase clinical studies, and (iii) negative or experimental indications with limited or no demonstrated clinical benefit. This workflow preserves disease-specific context while enabling systematic cross-disease comparison and evidence synthesis.
Table 3.
Comparisons between Monolithic and PLA approaches.
To illustrate the retrieval rationale underlying disease-specific partitioning, we compared broad and disease-specific keyword searches performed on 18 September 2026 using PubMed Best Match. This experiment evaluated PubMed search rankings rather than the embedding/Qdrant/PDAOAI/LLM pipeline described in Section 2.1 and Section 2.2.
The monolithic query was:
(everolimus OR temsirolimus OR sirolimus OR rapamycin) AND cancer
This search returned 23,823 records.
Disease-specific partitions were generated by adding either “mantle cell lymphoma” or “hepatocellular carcinoma” to the same query. The MCL and HCC partitions contained 167 and 1018 records, respectively.
An illustrative reference set was assembled by selecting all seven clinical publications: three phase II–III temsirolimus studies in MCL and four clinical everolimus studies in advanced HCC. The set comprised primary clinical studies evaluating these agents in the two indications and included evidence of clinical activity in MCL and limited or absent benefit in HCC. It was not assembled through a systematic eligibility-based review or independent expert adjudication, and selection before inspection of search rankings was not documented. It was therefore used as an illustrative retrieval check rather than a prespecified validation standard. Retrieval was evaluated within the first 200 and 500 ranked records. Publications were matched by exact PMID. Recall was defined as the proportion of the seven reference publications retrieved within each screening window. Paired retrieval at 500 records was evaluated using an exact two-sided McNemar test.
The MCL partition reduced the corpus by 99.3%, and the HCC partition reduced it by 95.7%. None of the three MCL trials appeared within the first 500 monolithic records. After partitioning, all three appeared within the first 100 results, at ranks 74, 87, and 99.
For HCC, the monolithic search retrieved one of four studies within the first 500 records. After partitioning, all four were retrieved at ranks 43, 65, 279, and 283. The recovered publications included EVOLVE-1, the pivotal phase III trial showing that everolimus did not improve overall survival in advanced HCC.
At a screening cutoff of 200 records, the monolithic corpus retrieved one of seven target publications (14.3%), whereas PLA retrieved five of seven publications (71.4%). At a cutoff of 500 records, the monolithic corpus still retrieved only one of seven publications (14.3%), while PLA retrieved all seven publications (100%).
At the 500-record cutoff, PLA improved recall by 85.7 percentage points. Six publications were retrieved only by PLA, one was retrieved by both methods, and none was retrieved only by the monolithic strategy (exact McNemar p = 0.031).
Disease-specific PubMed queries improved the ranks of the selected rapalog studies within the examined per-query screening windows. Retrieved publications included both positive MCL studies and negative HCC studies. These observations illustrate the potential benefit of disease-specific retrieval.
These findings do not mean that the publications were absent from PubMed or impossible to find through exhaustive searching. Rather, six of seven studies were not surfaced within the first 500 results of the broad rapalog–cancer search. Partitioning reduced competition from unrelated indications and restored these studies to the reviewable set.
3.2. Common Biological Features of Tumors Responsive to First-Generation mTOR Inhibitors
The literature data can be aggregated into three clusters as follows: Tier I—Established Indications (Approved): Renal cell carcinoma (RCC), Mantle cell lymphoma (MCL), Subependymal giant cell astrocytoma (SEGA/TSC), Pancreatic neuroendocrine tumors (pNET), Gastrointestinal neuroendocrine tumors (GI NET), Lung neuroendocrine tumors (Lung NET), Hormone-receptor-positive/HER2-negative breast cancer. Randomized Phase III evidence with regulatory approval demonstrating established clinical benefit of first-generation mTOR inhibitors. Tier II—Investigational Indications: Ovarian cancer, Endometrial cancer, Non-small-cell lung cancer (NSCLC), Soft tissue sarcoma, Melanoma, Multiple myeloma, Prostate cancer, Bladder cancer, Thyroid cancer, and other malignancies with reproducible Phase I/II activity. Clinical activity has been demonstrated in selected studies or biomarker-defined populations, but evidence remains insufficient for regulatory approval. Tier III—Negative/Experimental Indications: Hepatocellular carcinoma (HCC), Glioblastoma (GBM), Colorectal cancer, Gastric cancer, Pancreatic adenocarcinoma, Cervical cancer, Head and neck squamous cell carcinoma, Leukemia, and other exploratory indications with negative or predominantly preclinical evidence. Despite biological rationale, clinical trials have failed to demonstrate sufficient therapeutic benefit, or evidence remains confined to preclinical or early exploratory studies. Cancer types demonstrating a strong clinical benefit from mTOR inhibition are summarized in Table 4.
Table 4.
Cancer types with strong clinical evidence of efficacy.
3.3. Clustering of mTOR Pathway Genes
Clustering of the prognosis matrix identified five distinct prognostic groups defined by the relative contribution of the HCC and RCC reference programs (Figure 3, Table 5). At one extreme, HCC (Liver) formed a discrete cluster characterized by a compact but highly specific prognostic network consisting of 13 significant genes. In contrast, RCC represented the opposite endpoint, exhibiting the largest and most extensive prognostic network with 32 significant genes, consistent with a broad regulatory program.
Figure 3.
Clustering Identifies Conserved Prognostic mTOR Network States. Heatmap of signed negative log10-transformed p-values for mTOR-pathway-related genes across 16 tumor indications. Red indicates adverse prognostic associations (HR > 1), blue indicates favorable associations (HR < 1), and white indicates non-significant results (p > 0.01). HRs compare high versus low expression of each gene. Genes and tumor types were clustered using Spearman correlation and average linkage, revealing shared prognostic mTOR-pathway signatures across cancers. Patient numbers are indicated. The heatmap displays 73 genes across 16 indication/dataset groups, representing 1168 gene-indication comparisons. The clustering was primarily for visualization and exploration.
Table 5.
Gene-Indication cluster.
Among intermediate indications, LGG, bladder, Breast GSE, melanoma, AML, gastric, head and neck, and colon cancers showed greater overlap with the RCC reference set and were designated RCC-biased. LGG shared eight of its 29 significant genes with RCC (28%) and two with HCC (7%). Bladder shared two of nine with RCC (22%) and one with HCC (11%). Lung was HCC-biased, sharing one of three significant genes with HCC (33%) and none with RCC. Pancreas was balanced, sharing one of seven significant genes with each reference set (14% each). These labels describe gene-set overlap and do not establish shared mechanisms or treatment response.
Comparison of representative genes further distinguished the five groups. The HCC cluster was enriched for genes associated with stress-adaptive and anabolic signaling, whereas the RCC cluster contained a substantially larger collection of regulatory genes distributed throughout the mTOR signaling network. The two intermediate groups exhibited mixed prognostic architectures, reflecting varying contributions from both reference programs together with indication-specific prognostic genes.
3.4. Identification of HCC Composite Gene Signature
To identify genes providing complementary prognostic information, PPARGC1A was combined individually with 11 candidate adverse prognostic genes: EIF4E, FKBP1A, HRAS, KRAS, NDRG1, NRAS, PPARG, RAC1, RALA, RHEB, and RRAGC. PPARGC1A was entered in the inverted orientation. Equal-weight composite scores were evaluated for overall survival using a median cutoff.
The candidate genes differed substantially in their ability to improve the prognostic performance of PPARGC1A, indicating that they were not functionally interchangeable. HRAS, NDRG1, PPARG, and RAC1 were excluded from further model development because their addition did not provide a sufficiently strong improvement over PPARGC1A alone, which had a log-rank p value of 2.2 × 10⁻⁴. The remaining seven genes—EIF4E, FKBP1A, KRAS, NRAS, RALA, RHEB, and RRAGC—were retained for higher-order composite testing. Among the two-gene signatures, PPARGC1A + RRAGC showed the strongest prognostic association, with a log-rank p value of 3.4 × 10⁻⁶ (Table 6).
Table 6.
HCC two-gene composite analysis.
The weak correlations between PPARGC1A and most retained genes supported their potential to provide complementary rather than redundant prognostic information. In particular, RRAGC was essentially uncorrelated with PPARGC1A despite producing the strongest two-gene composite, consistent with a substantial incremental contribution to the composite classifier (Table 6).
A three-gene composite analysis was then performed with PPARGC1A included as the constant anchor and every possible pair of the seven retained adverse genes added in the inverted orientation. This design generated 21 unique three-gene signatures. Thus, each cell in the pairwise matrix represents a complete composite consisting of PPARGC1A plus the corresponding row and column genes (Table 7).
Table 7.
HCC pairwise combination of a three-gene composite.
The three-gene signatures varied markedly in prognostic performance. The strongest model was + EIF4E + RRAGC − PPARGC1A, which achieved a log-rank p value of 6.6 × 10⁻⁷, HR for high versus low three-gene score, 2.46 (95% CI 1.71–3.54), and median overall survival of 31.0 months in the high-score group versus 84.7 months in the low-score group. This represented an approximately five-fold improvement in statistical significance relative to the best two-gene signature, PPARGC1A + RRAGC (Table 7).
Several additional three-gene signatures also improved upon the PPARGC1A + RRAGC two-gene benchmark, including + RALA + RRAGC − PPARGC1A (p = 1.1 × 10⁻⁶), + EIF4E + NRAS − PPARGC1A (p = 1.4 × 10⁻⁶), + FKBP1A + RRAGC − PPARGC1A (p = 2.0 × 10⁻⁶), + EIF4E + FKBP1A − PPARGC1A (p = 2.1 × 10⁻⁶), and + FKBP1A + KRAS − PPARGC1A (p = 2.8 × 10⁻⁶) (Table 7).
FKBP1A and RALA were identified as possible fourth members of this gene signature. The addition of RALA was ineffective, but the addition of FKBP1A improved the log-rank p value to 1.1 × 10⁻⁷. The addition of FKBP1A produced the four-gene adverse-risk score, calculated as FKBP1A + EIF4E + RRAGC − PPARGC1A. Patients with a high four-gene score had significantly poorer overall survival than those with a low score (HR for high versus low score, 2.59; 95% CI, 1.80–3.74; log-rank p = 1.1 × 10⁻⁷). Median overall survival was 37.8 months in the high-score group and 84.4 months in the low-score group. The survival curves for the best-performing composites are shown in Figure 4. A schematic summary of the final four-gene composite is shown in Figure 5.
Figure 4.
Four-gene mTOR composite curves. (A–D) Kaplan–Meier analyses according to PPARGC1A, EIF4E, RRAGC, and FKBP1A expression. (A) PPARGC1A: Median survival: Low-expression cohort (months) = 38.3; High-expression cohort (months) = 81.9. (B) EIF4E: Median survival: Low-expression cohort (months) = 71; High-expression cohort (months) = 46.6. (C) RRAGC: Median survival: Low-expression cohort (months) = 70.5; High-expression cohort (months) = 45.7. (D) FKBP1A: Median survival: Low-expression cohort (months) = 81.9; High-expression cohort (months) = 45.7. (E) + EIF4E + RRAGC − PPARGC1A: Median survival: Low-expression cohort (months) = 84.7; High-expression cohort (months) = 31. Three-gene adverse-risk score, calculated as EIF4E + RRAGC − PPARGC1A. (F) + EIF4E + FKBP1A + RRAGC − PPARGC1A: Median survival: Low-expression cohort (months) = 84.4; High-expression cohort (months) = 37.8. Four-gene adverse-risk score, calculated as FKBP1A + EIF4E + RRAGC − PPARGC1A. Patients were classified using the respective cohort medians. For panels E and F, the reported HR compares the high adverse-risk score group with the low adverse-risk score group; therefore, HR > 1 indicates poorer survival in the high-score group. Median overall survival for the three-gene score was 31.0 months in the high-score group versus 84.7 months in the low-score group. Median overall survival for the four-gene score was 37.8 months in the high-score group versus 84.4 months in the low-score group. The composite is an mTOR-associated expression score calculated as FKBP1A + EIF4E + RRAGC − PPARGC1A. Thus, the high-expression composite score represents relatively high combined expression of the three adverse mTOR-associated components—FKBP1A, EIF4E, and RRAGC—together with relatively low PPARGC1A expression. We retained the terms high expression and low expression in the Kaplan–Meier figures because they provide a readily visualized representation of the aggregate expression state captured by the composite. For (A–D), HRs compare high versus low expression of the indicated gene.
Figure 5.
Four-gene mTOR signature. Two composite states and survival outcomes. The adverse-risk score assigns positive coefficients to FKBP1A, EIF4E, and RRAGC and a negative coefficient to PPARGC1A. Higher scores indicate the adverse prognostic state; lower scores indicate the favorable prognostic state.
3.5. Independent Validation of the Prognostic Gene Signatures
The HCCDB18 dataset contained 212 HCC tumor samples from 203 unique patients. For patients with multiple tumor specimens, gene-expression values were averaged before calculating the composite scores. All 203 patients met the prespecified data-quality criteria and were included in the survival analysis; 35 patients died during follow-up, whereas 168 were alive or censored.
To provide an intuitive and consistent interpretation of the hazard ratios, the locked composite was also expressed as an adverse-risk score. Genes showing adverse survival directions in the discovery analysis—FKBP1A, EIF4E, and RRAGC—were assigned positive coefficients, whereas PPARGC1A, which showed a beneficial direction, was assigned a negative coefficient:
Four-gene adverse-risk score = Z(FKBP1A) + Z(EIF4E) + Z(RRAGC) − Z(PPARGC1A)
The corresponding three-gene adverse-risk score was:
Three-gene adverse-risk score = Z(EIF4E) + Z(RRAGC) − Z(PPARGC1A)
Accordingly, a higher composite score represented a more adverse prognostic state, and an HR greater than 1 indicated a higher hazard of death. The adverse-risk score is the negative of the favorable-oriented score. Reversing the sign reverses the numerical ranking of patients and reciprocates the HRs, without changing statistical significance. Prognostic discrimination is equivalent when the direction of risk is interpreted consistently. A schematic summary of the final four-gene composite is shown in Figure 5.
In the primary continuous analysis, both scores were significantly associated with overall survival. Each 1-SD increase in the three-gene adverse-risk score was associated with a 54% higher hazard of death (HR, 1.54; 95% CI, 1.10–2.13; p = 0.013). The association was stronger for the four-gene adverse-risk score, for which each 1-SD increase was associated with a 70% higher hazard of death (HR, 1.70; 95% CI, 1.22–2.38; p = 0.0015). The four-gene score also demonstrated greater prognostic discrimination than the three-gene score (Harrell C-index, 0.676 versus 0.637). Thus, inclusion of FKBP1A was associated with a stronger survival relationship and improved discrimination in this validation cohort. The proportional-hazards test was not significant for the four-gene score (p = 0.350), providing no evidence that the proportional-hazards assumption was violated (Table 8).
Table 8.
External validation of the adverse-oriented four-gene prognostic score in the ICGC LIRI-JP cohort.
For the secondary categorical analysis, patients were classified at the cohort median into a high adverse-risk group (n = 101) and a low adverse-risk group, representing the beneficial composite state (n = 102). Patients with high four-gene adverse-risk scores had significantly poorer overall survival than those with low scores (HR for high versus low four-gene score, 2.13; 95% CI, 1.06–4.17; Wald p = 0.033; log-rank p = 0.029). When the analysis was repeated using the three-gene score excluding FKBP1A, the direction of association was maintained but attenuated and was not statistically significant (HR for high versus low three-gene score, 1.79; 95% CI, 0.90–3.57; log-rank p = 0.091). Thus, higher values of both scores were associated with an adverse survival direction, but statistically significant separation between the high- and low-risk groups was observed only for the four-gene score.
The association between the continuous four-gene adverse-risk score and overall survival remained significant after adjustment for age, sex, and TNM stage (adjusted HR per SD, 1.49; 95% CI, 1.04–2.13; p = 0.027). A sensitivity analysis in which the composite was calculated from unstandardized expression values produced a consistent association (HR per SD, 1.61; 95% CI, 1.16–2.27; p = 0.0038), indicating that the result was not dependent on gene-level z-score transformation.
Supportive individual-gene analyses were directionally consistent with the prespecified score orientation. Higher PPARGC1A expression showed a beneficial survival direction (HR per SD, 0.78; 95% CI, 0.56–1.10; p = 0.158), whereas higher expression of EIF4E (HR per SD, 1.37; 95% CI, 0.96–1.96; p = 0.084), RRAGC (HR per SD, 1.43; 95% CI, 1.03–2.00; p = 0.035), and FKBP1A (HR per SD, 1.82; 95% CI, 1.30–2.56; p = 0.000542) showed adverse survival directions. These analyses were supportive and were not used to alter the composition, coefficients, or orientation of the locked score.
The lower statistical significance observed in the ICGC LIRI-JP cohort relative to TCGA-LIHC likely reflects reduced statistical power and differences in cohort composition rather than failure of the signature to replicate. The LIRI-JP analysis included fewer patients than TCGA-LIHC (203 vs. 365) and, more importantly, substantially fewer deaths (35 vs. 131), corresponding to observed mortality rates of 17.2% and 35.2%, respectively. Because the precision of survival estimates is driven primarily by the number of events, the smaller number of deaths in LIRI-JP resulted in wider confidence intervals and particularly limited the power of the median-split Kaplan–Meier analysis. The cohorts also differed clinically and etiologically: LIRI-JP contained a greater proportion of patients with stage III–IV disease (36.5% vs. 25.9%) and represented a predominantly Japanese, HCV-associated population, whereas TCGA-LIHC was a more heterogeneous, multi-institutional cohort with mixed etiologies. Despite these differences, the locked continuous four-gene score remained significantly associated with overall survival in LIRI-JP, supporting the reproducibility of the signature across distinct HCC populations. Accordingly, the difference in p-values between cohorts should not be interpreted as direct evidence of a weaker biological association, because statistical significance depends on event number, sample size, and cohort heterogeneity in addition to effect magnitude. Together, the results provide independent validation of the prognostic association of the four-gene signature in the ICGC LIRI-JP HCC cohort and establish that the four-gene signature captures reproducible prognostic information beyond the original discovery cohort.
3.6. Cross-Fitting Analysis
The cross-fitting analysis was performed to determine whether the prognostic information contained in the prespecified four-gene HCC panel persisted when survival-guided model selection and patient scoring were separated. The analysis included 365 patients from TCGA-LIHC and 131 overall-survival events. Candidate selection was restricted to PPARGC1A, FKBP1A, EIF4E, and RRAGC. All four genes were individually associated with overall survival and remained significant after Benjamini–Hochberg correction across the four component-gene tests. Higher PPARGC1A expression was associated with lower mortality (HR 0.58, 95% CI 0.41–0.82; q = 0.00178), whereas higher FKBP1A (HR 2.14, 95% CI 1.50–3.06; q = 0.000071), EIF4E (HR 1.83, 95% CI 1.29–2.60; q = 0.000763), and RRAGC expression (HR 1.89, 95% CI 1.33–2.68; q = 0.000610) were associated with higher mortality.
Directional concordance demonstrates that the cross-fitted signal preserved the polarity of the prespecified signature. Repeated five-fold cross-fitting was performed for 20 repetitions, generating 100 training and held-out evaluations. Within each training set, the application selected the component with the strongest eligible survival association and used the resulting model to score only patients who had been held out from that model-fitting step. FKBP1A was selected in 78% of resamples, reflecting its stronger individual survival association in TCGA-LIHC. When the completely out-of-fold score was divided at its median, the activity-like group had worse overall survival than the suppression-like group (HR 1.96, 95% CI 1.38–2.79; log-rank p = 0.000138). The reciprocal comparison of suppression-like versus activity-like produced an HR of 0.51 (95% CI 0.36–0.73). Thus, prognostic separation persisted when each patient was evaluated using a model that had not been fitted using that patient’s outcome.
The cross-fitting exercise therefore provides an internal robustness assessment showing that the four-gene panel contains reproducible prognostic information and that its adverse-versus-beneficial polarity is preserved during out-of-fold analysis. FKBP1A was the most stable prognostic representative of the four-gene panel in TCGA-LIHC. Specifically, in 78 of 100 training resamples, FKBP1A produced the smallest eligible survival p-value among PPARGC1A, FKBP1A, EIF4E, and RRAGC. The adverse association of FKBP1A with OS is resistant to moderate changes in patient composition. FKBP1A captures a substantial portion of the prognostic state represented by the panel. Biologically, FKBP1A encodes FKBP12, the protein that binds rapamycin and rapalogs; the drug–FKBP12 complex subsequently inhibits mTORC1. Its repeated selection therefore provides a mechanistically relevant connection between the prognostic panel and rapalog pharmacology.
To assess whether the prognostic information represented by the four-gene panel was displaced by related mTOR genes, the candidate universe was expanded to 12 measured genes. All four HCC4 components remained associated with overall survival in their previously established directions after Benjamini–Hochberg correction across the 12 component tests. During repeated cross-fitting, an HCC4 component was selected in 74% of training resamples: FKBP1A in 59%, RRAGC in 10%, PPARGC1A in 4%, and EIF4E in 1%. Among the expanded-panel genes, RAC1 was the principal alternative and was selected in 21% of resamples; RALA, PPARG, and HRAS collectively accounted for the remaining 5%. Despite this exchange of anchor selection, expansion of the candidate set had minimal effect on patient-level classification. Scores from the HCC4-restricted and 12-gene analyses were nearly identical (r = 0.9989), and 361 of 365 patients retained the same median-defined risk assignment. Survival associations were likewise unchanged, with activity-like versus suppression-like HRs of 1.96 in the HCC4-restricted analysis and 1.94 in the expanded analysis. These findings indicate that the prognostic state recovered by cross-fitting was principally represented by the original four-gene panel, while RAC1 and other expanded-panel genes acted as correlated alternative markers without materially improving prognostic classification.
3.7. TLR Analysis
Heterogeneity was observed across TLR-defined immune states. Individual TLR backgrounds recovered only subsets of the four prognostic genes, whereas TLR10-high was the only subgroup in which all four genes (PPARGC1A, EIF4E, RRAGC, and FKBP1A) were simultaneously identified as significant prognostic markers. No other TLR-high or TLR-low subgroup reproduced the complete signature (Table 9).
Table 9.
HCC gene signature across TLR strata.
The complete four-gene model produced the strongest discrimination between survival groups (HR = 2.59, log-rank p = 1.1 × 10⁻⁷), whereas the three-gene model (EIF4E/RRAGC/FKBP1A) demonstrated a weaker association (HR = 1.96, p = 1.6 × 10⁻⁴). Likewise, the two-gene combinations PPARGC1A/FKBP1A (HR = 2.22, p = 7.8 × 10⁻⁶) and PPARGC1A/EIF4E (HR = 2.17, p = 1.6 × 10⁻⁵) also showed reduced prognostic performance relative to the complete signature (Table 9). All HRs in this comparison represent high versus low composite score.
The cross-fitted activity score was positively correlated with individual TLR expression, with Pearson correlation coefficients ranging from 0.24 to 0.50. After Benjamini–Hochberg correction across the 20 TLR-stratum tests, the adverse association between the activity-like state and overall survival remained significant in the TLR1-high, TLR2-high, TLR4-high, TLR6-high, TLR7-high, TLR8-high, TLR9-high, and TLR10-high strata (all q < 0.05; Table 10). The largest effect estimates were observed in TLR10-high tumors (HR 3.42, 95% CI 1.96–5.95; q = 0.000062) and TLR9-high tumors (HR 3.13, 95% CI 1.86–5.28; q = 0.000062). The association did not meet the corrected significance threshold in the TLR3-high (q = 0.0531) or TLR5-high (q = 0.127) strata. None of the TLR-low strata remained significant after correction. These results are summarized in Table 10 and describe exploratory within-stratum associations.
Table 10.
HCC gene signature across TLR backgrounds.
3.8. Exploratory Tumor-Microenvironment Subgroup Analyses of the HCC Four-Gene Signature
To describe prognostic associations within exploratory tumor-microenvironment subgroups, the HCC cohort was stratified according to individual immune-cell and stromal populations available in KMplotter, and survival analyses were repeated within each subgroup using a significance threshold of p < 0.01. To account for multiple testing, the 72 gene-by-tumor-microenvironment comparisons, comprising four genes across 18 immune or stromal backgrounds, were adjusted using the Benjamini–Hochberg procedure. Of the 47 associations that met the nominal significance threshold of p < 0.05, 41 remained significant at a false-discovery rate of q < 0.05. The strongest adverse prognostic associations were retained after adjustment. In the macrophage-high background, elevated RRAGC expression was associated with inferior survival (HR 2.71, nominal p = 4.1 × 10⁻⁵, q = 0.00103). The RegT-high background retained significant adverse associations for EIF4E (HR 2.47, p = 3.6 × 10⁻⁵, q = 0.00103), RRAGC (HR 2.12, p = 5.9 × 10⁻⁴, q = 0.00303), and FKBP1A (HR 2.46, p = 4.3 × 10⁻⁵, q = 0.00103). PPARGC1A was also significant in the RegT-high subgroup, although its association was protective rather than adverse (HR 0.57, p = 0.0096, q = 0.0209).
Significant associations involving all four genes were retained in the CD4-low, macrophage-high, MSC-low, RegT-high, and Th1-high backgrounds. Multiple associations also remained significant in the B-cell-low, CD8-low, NK-high, Th2-high, and Th2-low backgrounds. Overall, PPARGC1A generally retained a protective association, with HR values below 1, whereas EIF4E, RRAGC, and FKBP1A generally retained adverse associations, with HR values above 1.
Among all TME partitions, only CD4-low, CD8-low, Mθ-high, MSC-low, NK-high, regulatory T-cell (Treg)-high, and Th1-high retained at least three of the four components comprising the four-gene signature, identifying these as the principal immune contexts in which the mTOR prognostic program remained intact (Table 11). In each of these TMEs, all four genes (PPARGC1A, EIF4E, RRAGC, and FKBP1A) remained independently significant while preserving their original prognostic direction. The RegT-high stratum met the complete retention criterion, including PPARGC1A (HR 0.57; p = 0.0096).
Table 11.
HCC gene signature in TME backgrounds.
3.9. RNA–Protein Analysis
RNA and protein concordance was evaluated by secondary analysis of the Gao et al. hepatocellular carcinoma (HCC) proteogenomic cohort [24]. The original study profiled paired tumor and adjacent liver tissues from 159 patients with hepatitis B virus (HBV)-related HCC in China. Patients underwent primary curative resection at Zhongshan Hospital, Fudan University, Shanghai, between June 2010 and December 2014, without prior anticancer treatment, as documented in the subsequent report of the same cohort [25]. Only tumor measurements were used in the present analysis; adjacent liver tissues were not pooled with tumors.
We obtained the processed RNA sequencing and gene-level mass spectrometry proteomics matrices from the HCC multiomics data repository deposited by Shi (Zenodo version 1, published 25 December 2024; DOI: 10.5281/zenodo.14553766) [26]. The repository identifies these data as originating from Gao et al. and processed using CPTAC Pan-Cancer Working Group pipelines [27]. Thus, the analysis used the later processed data resource rather than newly quantified raw sequencing or mass spectrometry data. The downloaded archive checksum matched the repository MD5 (6b67ac84db568b9fc6b77950d7f06a70).
Complete paired RNA and protein measurements were available for FKBP1A, EIF4E, and RRAGC in all 159 matched tumors. Each gene showed a positive RNA–protein correlation that remained significant after adjustment across the three measurable targets. RRAGC had the largest Spearman correlation (rho = 0.652; 95% CI, 0.545–0.744; p = 1.41 × 10⁻²⁰; q = 4.23 × 10⁻²⁰, Figure 6). EIF4E showed a moderate positive correlation (rho = 0.523; 95% CI, 0.406–0.619; p = 1.59 × 10⁻¹²; q = 2.39 × 10⁻¹²), as did FKBP1A (rho = 0.481; 95% CI, 0.348–0.596; p = 1.38 × 10⁻¹⁰; q = 1.38 × 10⁻¹⁰).
Figure 6.
RNA–protein concordance for EIF4E, RRAGC, and FKBP1A in the Gao hepatocellular carcinoma cohort. Each point represents a tumor with matched RNA sequencing and proteomic measurements (n = 159 per gene). EIF4E is shown as red squares, RRAGC as green upward triangles, and FKBP1A as purple downward triangles. RNA abundance is expressed as upper-quartile-normalized log2 RSEM values, and protein abundance as log2 reference-intensity-normalized values.
PPARGC1A RNA measurements were available for all 159 matched tumors, but PPARGC1A was absent from the processed gene-level protein matrix. Consequently, its RNA–protein correlation could not be estimated.
4. Discussion
The rapid growth of biomedical literature has made it increasingly difficult to identify all relevant evidence within large search-result sets. Bentegeac et al. described this as a structural problem for evidence synthesis: keyword-based database searches may be limited by inconsistent terminology, indexing delays, and the practical burden of screening thousands of records [28]. In their 66-review benchmark, PubMed alone achieved 75% mean sensitivity. Adding the top 500 BibliZap citation-search results increased sensitivity to 91%, while full citation expansion increased it to 97% but added a median of 6450 records [28].
BibliZap and PLA address different limitations of conventional retrieval. BibliZap uses known relevant seed articles to expand forward and backward through citation networks [28]. This can recover studies missed by keyword searches, but it requires suitable seed articles, may favor older or highly connected publications, and can substantially increase screening burden. PLA instead partitions a heterogeneous corpus before retrieval, with the aim of reducing competition between diseases and improving the visibility of indication-specific publications within a defined screening window.
Our findings identify a related problem within a monolithic therapeutic corpus. Only one of seven clinically important MCL and HCC publications appeared within the first 500 results of the broad rapalog–cancer search. Disease-specific PLA increased recall to seven of seven while reducing the candidate corpus by 99.3% for MCL and 95.7% for HCC. PLA recovered both positive temsirolimus trials in MCL and negative everolimus trials in HCC, indicating that partitioning did not selectively favor positive evidence.
The integration of our PDAOAI technology applied to PubMed abstracts facilitated the rapid discovery of key primary publications used in the writing of this manuscript. The selected benchmark illustrated improved retrieval visibility with disease-specific searching; broader methodological superiority remains to be established. By partitioning the literature into independent disease-specific corpora before evidence synthesis, the PLA framework preserves disease-specific biological and clinical context while minimizing bias arising from differences in publication volume among malignancies.
The number of abstracts differed markedly among disease-specific corpora. Hormone-receptor-positive breast cancer contributed 588,114 abstracts, whereas MCL contributed 7979 and pNET contributed 15,017. Thus, the breast-cancer corpus was approximately 74-fold larger than the MCL corpus and 39-fold larger than the pNET corpus. The broad leukemia corpus was approximately 35-fold larger than the nested T-ALL corpus. Gastrointestinal cancers contributed 542,160 abstracts.
When all abstracts are treated as one retrieval space, the answer is more likely to emphasize conclusions, terminology, treatment combinations, and limitations represented in high-volume corpora. PLA ensured that each disease first generated a complete clinical-efficacy answer before cross-disease aggregation. The final aggregation was therefore driven by the pattern and strength of disease-specific clinical outcomes rather than by publication abundance alone. PLA was designed to improve disease-level evidence coverage by ensuring that each partition contributes a summary before aggregation. The mathematical formulation establishes equal initial representation of disease summaries but does not demonstrate greater accuracy, completeness, reduced bias, or clinical reliability. Equal representation does not imply equivalent evidence strength, because the quantity and quality of clinical evidence differ across diseases. The seven-publication MCL/HCC benchmark illustrates improved retrieval visibility after disease-specific searching but does not validate the accuracy of LLM-generated summaries or the three-tier clinical classification. Future work should assess retrieval recall, evidence coverage, factual accuracy, and classification agreement separately using larger, independently curated reference sets across diverse diseases. Comparisons should use equal total screening budgets, and representative summaries should undergo independent expert review. Aggregation should distinguish disease representation from evidence strength by accounting explicitly for study quality and level of clinical evidence.
The accumulated clinical evidence demonstrates a clear hierarchy of therapeutic efficacy. The strongest evidence is observed in renal cell carcinoma (RCC), pancreatic neuroendocrine tumors (pNET), gastrointestinal and lung neuroendocrine tumors (NET), hormone-receptor-positive/HER2-negative breast cancer, mantle cell lymphoma (MCL), subependymal giant cell astrocytoma (SEGA), and tuberous sclerosis complex (TSC)-associated renal angiomyolipoma, where multiple randomized Phase III trials consistently demonstrated clinically meaningful improvements in overall survival, progression-free survival, or durable tumor regression, ultimately leading to regulatory approval [29,30,31,32,33,34,35].
Beyond these established indications, a second tier of malignancies demonstrates reproducible but less definitive evidence of clinical activity. Follicular lymphoma represents the strongest nonapproved indication, with independent Phase II studies reporting objective response rates exceeding 50%, complete response rates approaching 25%, and median progression-free survival of approximately one year. Similarly, diffuse large B-cell lymphoma (DLBCL), transformed follicular lymphoma, peripheral T-cell lymphoma, Hodgkin lymphoma, and selected acute myeloid leukemia (AML) have consistently demonstrated measurable antitumor activity in early-phase clinical studies, although responses have generally been less durable and no randomized confirmatory studies have established these diseases as standard indications [36,37,38]. Comparable exploratory activity has also been reported in sarcoma, endometrial carcinoma, thyroid cancer, pancreatic adenocarcinoma, gastric cancer, and selected gastrointestinal malignancies, where Phase I/II studies demonstrated disease stabilization or modest objective responses but failed to establish sufficient evidence for routine clinical implementation [39,40,41].
In contrast, several malignancies have demonstrated disappointing clinical outcomes despite compelling biological rationale. Hepatocellular carcinoma (HCC) has long been considered an attractive therapeutic target because activation of the PI3K/AKT/mTOR pathway is frequently observed in hepatocarcinogenesis. Nevertheless, clinical studies failed to demonstrate sufficient efficacy to justify regulatory approval or routine clinical use, illustrating that pathway activation alone is not an adequate predictor of therapeutic benefit [41,42]. The pivotal phase III EVOLVE-1 trial evaluated everolimus in 546 patients with advanced HCC following sorafenib failure or intolerance. Everolimus did not improve median overall survival versus placebo (7.6 vs. 7.3 months; HR 1.05, 95% CI 0.86–1.27; p = 0.68) or time to progression, although disease control was numerically higher (56.1% vs. 45.1%). These findings established that everolimus is ineffective in an unselected advanced-HCC population while leaving unresolved whether biomarker-defined molecular subsets could benefit from mTOR inhibition [43]. Likewise, glioblastoma (GBM) represents one of the clearest examples of unsuccessful rapalog development. Multiple Phase II studies demonstrated minimal clinical activity, randomized trials failed to demonstrate superiority over standard therapy, and a recent systematic review and meta-analysis concluded that first-generation mTOR inhibitors failed to improve progression-free survival and were associated with inferior overall survival in unselected patients [36,44,45,46,47]. These negative findings have been attributed, at least in part, to incomplete inhibition of mTOR signaling and adaptive activation of compensatory pathways, emphasizing that biological pathway activation does not necessarily indicate functional dependence on mTOR signaling.
Here we identified a core mTOR signature specific to HCC: PPARGC1A, EIF4E, RRAGC, and FKBP1A. PPARGC1A (PGC-1α) primarily reflects the metabolic consequences of mTOR signaling rather than direct regulation of cell proliferation. mTORC1 controls mitochondrial function through coordinated transcriptional and translational mechanisms involving YY1-dependent activation of PGC-1α together with enhanced translation of mitochondria-associated proteins through inhibition of 4E-binding proteins [48,49,50,51]. These complementary mechanisms establish a feed-forward program linking increased protein synthesis with enhanced oxidative phosphorylation and ATP generation. Nevertheless, the biological effects of PPARGC1A regulation are highly tissue dependent. Loss of mTORC1 suppresses PGC-1α expression and mitochondrial biogenesis in skeletal muscle, whereas excessive mTORC1 activation induces PGC-1α-dependent metabolic programs in liver and contributes to mitochondrial remodeling in lung and other tissues [49,50,51,52,53]. These observations indicate that PPARGC1A primarily functions as an adaptive metabolic effector whose biological consequences depend on tissue context rather than serving as a universal marker of mTOR activation. The initial cross-cancer screen used nominal significance without multiplicity correction, and signature development involved outcome-guided selection. These steps are susceptible to false-positive selection and optimistic discovery estimates. Expanded 12-gene cross-fitting supported internal robustness but did not eliminate these limitations. Independent LIRI-JP validation supports the final score’s prognostic association, rather than confirming every association identified during screening.
Exploratory analyses identified significant prognostic associations in eight TLR-high strata after multiplicity correction, whereas none of the TLR-low strata met the corrected threshold. The largest effect was observed in the TLR10-high subgroup (HR 3.42, 95% CI 1.96–5.95), although TLR10-high and TLR9-high shared the lowest adjusted q value (q = 0.000062). Given the established immunosuppressive and anti-inflammatory functions of TLR10 [45,46,47], these findings support further investigation of TLR10 as part of the immune context associated with this prognostic pathway state.
Additionally, the HCC composite only existed in seven TME states (MSC-low, CD4-low, Treg-high, Th1-high, NK-high, monocyte-high, and CD8-low), which define an immune landscape that closely resembles the immune-infiltrated but functionally suppressed phenotype increasingly recognized in HCC [54,55,56]. Treg-high is consistent with enrichment of FOXP3+ regulatory T cells, which suppress cytotoxic T-cell activity through inhibitory cytokines and checkpoint pathways and represent one of the dominant immunosuppressive populations within human HCC [57,58]. Monocyte-high is similarly compatible with increased infiltration of tumor-associated monocytes and macrophages, which inhibit T-cell function, recruit additional regulatory T cells, and contribute to resistance to immune checkpoint blockade [55,56,59,60,61]. The CD4-low background is consistent with loss of effective helper T-cell support required for sustained CD8+ T-cell activation, while the CD8-low background reflects reduced cytotoxic effector-cell activity, both recognized features of ineffective antitumor immunity in HCC [54,62]. In contrast, Th1-high indicates persistence of interferon-γ-associated inflammatory signaling, and NK-high reflects maintenance of innate cytotoxic immune populations that are frequently present within HCC despite impaired overall immune function [57,63,64]. The coexistence of Th1- and NK-associated immune activation with Treg enrichment and impaired adaptive cytotoxic immunity further supports an immune-engaged but dysfunctional TME rather than a classical immune-desert phenotype.
The data support a model in which the four-gene mTOR signature is maintained within tumors that remain accessible to immune-cell infiltration but are functionally restrained by regulatory lymphoid and myeloid programs. The immune architecture identified here closely parallels biological states repeatedly associated with ineffective PD-1-mediated antitumor immunity in contemporary HCC studies [54,55,57,59,60,61].
Previous studies established complementary foundations for evaluating Sapu003 in HCC. The HCC tumor-microenvironment study demonstrated that the prognostic effects of DNMT3A and GMPS are modified by TME composition and TLR-defined immune states, indicating that immune context is an important determinant of HCC metabolic and prognostic biology [65]. Formulation studies subsequently established Sapu003 as a scalable, stable, sub-20 nm intravenous everolimus Deciparticle™ formulation with potent weekly antitumor activity in a preclinical model [21], while ADME and toxicology studies showed higher and more consistent systemic everolimus exposure than oral administration, broad tissue distribution, reduced gastrointestinal accumulation, and no treatment-related gastric pathology in repeat-dose rat studies [22]. The current study extends these findings by defining an HCC-specific four-gene mTOR-metabolic architecture—PPARGC1A, EIF4E, RRAGC, and FKBP1A—and identifying the TME- and TLR-defined states in which the complete signature is retained. The four-gene signature has a direct conceptual relationship to mTOR biology: FKBP1A is required for canonical rapalog binding, RRAGC links amino-acid sensing to mTORC1 localization, EIF4E reflects translational output, and PPARGC1A captures an opposing mitochondrial-metabolic program. The adverse prognostic association raises the hypothesis that this signature reflects dependence on, or adaptation through, an mTOR-associated network. This provides a rationale for prospective biomarker evaluation during rapalog development.
At this stage, the signature is supported as prognostic. Its predictive and/or diagnostic interpretation will be tested during rapalog clinical development in the identification of HCC patients responsive to Sapu003 treatment and/or predictive of response to Sapu003 treatment. Together, these studies provide a biologically grounded framework for prospectively testing whether immune-contextualized, biomarker-defined HCC populations are more susceptible to intravenous mTOR inhibition with Sapu003 than the unselected populations evaluated historically.
The treatment-enrichment hypothesis is based on several linked findings.
First, the composite contains genes representing complementary levels of mTOR biology. RRAGC regulates amino-acid-dependent recruitment of mTORC1 to the lysosome; EIF4E represents a major translational output of mTORC1 signaling; PPARGC1A reflects the associated mitochondrial-metabolic state; and FKBP1A encodes FKBP12, the intracellular protein required for rapamycin and its analogues to bind and inhibit mTORC1. The inclusion of FKBP1A therefore provides a direct mechanistic connection between the prognostic state and rapalog pharmacology.
Second, the composite was explicitly oriented as an adverse-risk score:
Adverse-risk score = Z(FKBP1A) + Z(EIF4E) + Z(RRAGC) − Z(PPARGC1A).
Consequently, a high adverse-risk score corresponds to relatively high RNA expression of FKBP1A, EIF4E, and RRAGC together with relatively low PPARGC1A RNA expression. It should not be interpreted as uniformly high expression of all four genes. Increased transcript abundance of FKBP1A, EIF4E, and RRAGC would generally be expected to increase the availability of their corresponding proteins, including FKBP12, although protein abundance was not measured and transcript-to-protein concordance cannot be assumed for every individual tumor. The high-score state is therefore interpreted as a transcriptional indicator of increased activity or availability of several components associated with mTORC1 regulation, translational output, and rapalog binding.
The relationship to FKBP1A is particularly relevant. Rapalogs do not inhibit mTORC1 directly; they first bind FKBP12, encoded by FKBP1A, and the resulting drug–FKBP12 complex binds and inhibits mTORC1. Higher FKBP1A RNA in the adverse/high-score group would be expected, subject to post-transcriptional regulation, to support greater FKBP12 protein availability and formation of the pharmacologically active rapalog–FKBP12 complex. This does not prove drug response, but it strengthens the biological rationale for testing rapalogs in the adverse/high-score population rather than in an unselected HCC population. The inclusion of FKBP1A, which encodes the rapalog-binding protein FKBP12, provides a mechanistic rationale for testing whether high-score tumors are more sensitive to rapalogs. This relationship remains to be established at the protein and treatment-response levels.
Third, the adverse four-gene state was reproduced in the independent ICGC LIRI-JP cohort without changing the genes, coefficients, or orientation of the score. Each 1-SD increase in the locked adverse-risk score was associated with a 70% higher hazard of death (HR, 1.70; 95% CI, 1.22–2.38; p = 0.0015). The association remained significant after adjustment for age, sex, and TNM stage (adjusted HR, 1.49; 95% CI, 1.04–2.13; p = 0.027). These findings demonstrate that the adverse transcriptional state captures reproducible prognostic information beyond the TCGA-LIHC discovery cohort.
Fourth, the state was not uniformly present across HCC immune contexts. After correction for multiple comparisons, its prognostic association remained significant in eight TLR-high strata, whereas none of the TLR-low strata remained significant. The strongest effect was observed in TLR10-high tumors (HR, 3.42; 95% CI, 1.96–5.95; q = 0.000062).
Within the TLR10-high population, median stratification further divides patients into adverse/high-score and favorable/low-score groups. The adverse/high-score group, representing approximately half of the TLR10-high population by construction, has relatively high FKBP1A, EIF4E, and RRAGC RNA, relatively low PPARGC1A RNA, and poor overall survival. This subgroup warrants prospective testing of the rapalog-response hypothesis.
The study identifies a reproducible adverse mTOR-associated transcriptional state in HCC that was independently validated as prognostic in the ICGC LIRI-JP cohort. The adverse/high-score group is characterized by relatively high FKBP1A, EIF4E, and RRAGC RNA expression, which may correspond to increased availability of their encoded proteins. These findings do not establish treatment benefit; predictive validation will require a rapalog-treated cohort with an appropriate comparator and formal biomarker-by-treatment interaction testing.
The Gao HCC cohort provides empirical evidence that higher tumor RNA abundance is associated with higher corresponding protein abundance for FKBP1A, EIF4E, and RRAGC. Concordance was strongest for RRAGC and moderate for EIF4E and FKBP1A. For FKBP1A, the observed correlation supports a qualified link between transcript abundance and measured abundance of its encoded protein, FKBP12. The present analysis did not measure rapalog–FKBP12–mTOR complex formation, mTORC1 activation or dependency, or pharmacological response. Similarly, EIF4E and RRAGC abundance correlations do not establish their functional activity. These observations should therefore be described as evidence of RNA–protein concordance and mechanistic plausibility, while any relationship with drug sensitivity remains a hypothesis requiring direct testing.
5. Conclusions
The Partitioned Literature Aggregation (PLA) framework synthesizes large biomedical literature corpora into disease-specific summaries. By combining a single literature discovery query with independent disease-level interrogation using identical prompts, the workflow preserves disease-specific biological context while enabling systematic cross-disease comparison. Applied to the clinical development of first-generation mTOR inhibitors, the PLA framework efficiently searched more than 28 million PubMed abstracts into a unified summary encompassing 24 malignancy subgroups. It identified HCC and RCC as two poles of treatment effectiveness for rapalogs. Subsequent analyses identified a four-gene prognostic mTOR-associated transcriptional signature comprising PPARGC1A, EIF4E, RRAGC, and FKBP1A. Its associations with immune context provide a rationale for testing biomarker-guided rapalog therapy in HCC.
Author Contributions
Conceptualization, V.T.; writing—original draft preparation, V.T., A.C. and W.-H.C.; writing—review and editing, V.T., A.C., W.-H.C., S.M., M.P., T.J., C.H., U.M., S.Q., S.S. and C.L. All authors have read and agreed to the published version of the manuscript.
Funding
This study received funding from Sapu Bioscience.
Institutional Review Board Statement
Not applicable.
Informed Consent Statement
Not applicable.
Data Availability Statement
The data presented in this study were derived from publicly available resources. The data were obtained from the KMplotter database (https://kmplot.com/) and were reanalyzed in the present study. The derived datasets and analysis code will be available from the corresponding author upon reasonable request, subject to applicable source-data restrictions and redistribution permissions.
Acknowledgments
During the preparation of this manuscript/study, the authors used PDAOAI, version 2.0, developed at Oncotelic Therapeutics, Agoura Hills, CA, USA, for the purposes of literature searching and editing. The authors have reviewed and edited the output and take full responsibility for the content of this publication.
Conflicts of Interest
The authors are employees or consultants of Sapu Bioscience, LLC, the sponsor of this study. The funder supported the study and was involved in the study design, data collection, data analysis, interpretation of the results, preparation of the manuscript, and the decision to submit the manuscript for publication. Such relationships are disclosed as potential conflicts of interest. All authors had full access to the data and take responsibility for the integrity and accuracy of the reported results.
Abbreviations
The following abbreviations are used in this manuscript:
| HR | Hazard ratio |
| HCC | Hepatocellular carcinoma |
| RCC | Renal cell carcinoma |
| TME | Tumor microenvironment |
References
- Marafie, S.K.; Al-Mulla, F.; Abubaker, J. mTOR: Its Critical Role in Metabolic Diseases, Cancer, and the Aging Process. Int. J. Mol. Sci. 2024, 25, 6141. [Google Scholar] [CrossRef] [Scilit]
- Ilagan, E.; Manning, B.D. Emerging role of mTOR in the response to cancer therapeutics. Trends Cancer 2016, 2, 241–251. [Google Scholar] [CrossRef] [Scilit]
- Sabatini, D.M. Twenty-five years of mTOR: Uncovering the link from nutrients to growth. Proc. Natl. Acad. Sci. USA 2017, 114, 11818–11825. [Google Scholar] [CrossRef] [Scilit]
- Ramlaul, K.; Aylett, C.H.S. Signal integration in the (m)TORC1 growth pathway. Front. Biol. 2018, 13, 237–262. [Google Scholar] [CrossRef] [Scilit]
- Dobashi, Y.; Watanabe, Y.; Miwa, C.; Suzuki, S.; Koyama, S. Mammalian target of rapamycin: A central node of complex signaling cascades. Int. J. Clin. Exp. Pathol. 2011, 4, 476–495. [Google Scholar]
- Populo, H.; Lopes, J.M.; Soares, P. The mTOR signalling pathway in human cancer. Int. J. Mol. Sci. 2012, 13, 1886–1918. [Google Scholar] [CrossRef] [Scilit]
- Panwar, V.; Singh, A.; Bhatt, M.; Tonk, R.K.; Azizov, S.; Raza, A.S.; Sengupta, S.; Kumar, D.; Garg, M. Multifaceted role of mTOR (mammalian target of rapamycin) signaling pathway in human health and disease. Signal Transduct. Target. Ther. 2023, 8, 375. [Google Scholar] [CrossRef] [Scilit]
- Gibbons, J.J.; Abraham, R.T.; Yu, K. Mammalian target of rapamycin: Discovery of rapamycin reveals a signaling pathway important for normal and cancer cell growth. Semin. Oncol. 2009, 36, S3–S17. [Google Scholar] [CrossRef] [Scilit]
- El Hiani, Y.; Egom, E.E.; Dong, X.P. mTOR signalling: Jack-of-all-trades (1). Biochem. Cell Biol. 2019, 97, 58–67. [Google Scholar] [CrossRef] [Scilit]
- Bracho-Valdes, I.; Moreno-Alvarez, P.; Valencia-Martinez, I.; Robles-Molina, E.; Chavez-Vargas, L.; Vazquez-Prado, J. mTORC1- and mTORC2-interacting proteins keep their multifunctional partners focused. IUBMB Life 2011, 63, 896–914. [Google Scholar] [CrossRef] [Scilit]
- Zhou, H.; Huang, S. The complexes of mammalian target of rapamycin. Curr. Protein Pept. Sci. 2010, 11, 409–424. [Google Scholar] [CrossRef] [Scilit]
- Jhanwar-Uniyal, M.; Wainwright, J.V.; Mohan, A.L.; Tobias, M.E.; Murali, R.; Gandhi, C.D.; Schmidt, M.H. Diverse signaling mechanisms of mTOR complexes: mTORC1 and mTORC2 in forming a formidable relationship. Adv. Biol. Regul. 2019, 72, 51–62, Erratum in Adv. Biol. Regul. 2019, 82, 100846. [Google Scholar] [CrossRef] [Scilit]
- Luo, Y.; Xu, W.; Li, G.; Cui, W. Weighing In on mTOR Complex 2 Signaling: The Expanding Role in Cell Metabolism. Oxidative Med. Cell. Longev. 2018, 2018, 7838647. [Google Scholar] [CrossRef] [Scilit]
- Chew, V.; Abastado, J.P. Immunomodulation of the tumor microenvironment by Toll-like receptor-3 (TLR3) ligands. Oncoimmunology 2013, 2, e23493. [Google Scholar] [CrossRef] [Scilit]
- Chew, V.; Chen, J.; Lee, D.; Loh, E.; Lee, J.; Lim, K.H.; Weber, A.; Slankamenac, K.; Poon, R.T.; Yang, H.; et al. Chemokine-driven lymphocyte infiltration: An early intratumoural event determining long-term survival in resectable hepatocellular carcinoma. Gut 2012, 61, 427–438. [Google Scholar] [CrossRef] [Scilit]
- Papadakos, S.P.; Arvanitakis, K.; Stergiou, I.E.; Lekakis, V.; Davakis, S.; Christodoulou, M.I.; Germanidis, G.; Theocharis, S. The Role of TLR4 in the Immunotherapy of Hepatocellular Carcinoma: Can We Teach an Old Dog New Tricks? Cancers 2023, 15, 2795. [Google Scholar] [CrossRef] [Scilit]
- Zhou, S.; Du, R.; Wang, Z.; Shen, W.; Gao, R.; Jiang, S.; Fang, Y.; Shi, Y.; Chang, A.; Liu, L.; et al. TLR4 increases the stemness and is highly expressed in relapsed human hepatocellular carcinoma. Cancer Med. 2019, 8, 2325–2337. [Google Scholar] [CrossRef] [Scilit]
- Ye, L.; Zhang, Q.; Cheng, Y.; Chen, X.; Wang, G.; Shi, M.; Zhang, T.; Cao, Y.; Pan, H.; Zhang, L.; et al. Tumor-derived exosomal HMGB1 fosters hepatocellular carcinoma immune evasion by promoting TIM-1+ regulatory B cell expansion. J. Immunother. Cancer 2018, 6, 145. [Google Scholar] [CrossRef] [Scilit]
- Liu, L.; Liu, B.; Yu, J.; Zhang, D.; Shi, J.; Liang, P. Development of a Toll-Like Receptor-Based Gene Signature That Can Predict Prognosis, Tumor Microenvironment, and Chemotherapy Response for Hepatocellular Carcinoma. Front. Mol. Biosci. 2021, 8, 729789. [Google Scholar] [CrossRef] [Scilit]
- Gupta, M.K.; Vadde, R. TLR-based therapeutic strategies for hepatocellular carcinoma. Cytokine Growth Factor Rev. 2025, 85, 179–189, Erratum in Cytokine Growth Factor Rev. 2025, 86, 156. [Google Scholar] [CrossRef] [Scilit]
- Min, S.H.; Forero, K.; Putnam, W.; Anderson, J.; Hoff, R.; Lopp, J.; Trieu, V.; Ho, K.; Lee, C. Intravenous Everolimus Formulation (Sapu003) for Clinical Trials. Int. J. Mol. Sci. 2026, 27, 5775. [Google Scholar] [CrossRef] [Scilit]
- Chang, W.H.; Chang, N.; Min, S.H.; Lopp, J.M.; Hoff, R.; Hoque, T.; Trieu, V.; Lee, C. IV-EVE: EVE for Injection-ADME, Pharmacokinetic and Toxicological Evaluation for Novel Deciparticle EVE Formulation. Biomedicines 2026, 14, 1573. [Google Scholar] [CrossRef] [Scilit]
- Lian, Q.; Wang, S.; Zhang, G.; Wang, D.; Luo, G.; Tang, J.; Chen, L.; Gu, J. HCCDB: A Database of Hepatocellular Carcinoma Expression Atlas. Genom. Proteom. Bioinform. 2018, 16, 269–275. [Google Scholar] [CrossRef] [Scilit]
- Gao, Q.; Zhu, H.; Dong, L.; Shi, W.; Chen, R.; Song, Z.; Huang, C.; Li, J.; Dong, X.; Zhou, Y.; et al. Integrated Proteogenomic Characterization of HBV-Related Hepatocellular Carcinoma. Cell 2019, 179, 561–577.E22, Erratum in Cell 2019, 179, 1240. [Google Scholar] [CrossRef] [Scilit]
- Zhu, H.; Lin, Y.; Lu, D.; Wang, S.; Liu, Y.; Dong, L.; Meng, Q.; Gao, J.; Wang, Y.; Song, N.; et al. Proteomics of adjacent-to-tumor samples uncovers clinically relevant biological events in hepatocellular carcinoma. Natl. Sci. Rev. 2023, 10, nwad167. [Google Scholar] [CrossRef] [Scilit]
- Shi, Z. HCC Multiomics Data; Zenodo: Geneva, Switzerland, 2024. [Google Scholar] [CrossRef]
- Li, Y.; Dou, Y.; Da Veiga Leprevost, F.; Geffen, Y.; Calinawan, A.P.; Aguet, F.; Akiyama, Y.; Anand, S.; Birger, C.; Cao, S.; et al. Proteogenomic data and resources for pan-cancer analysis. Cancer Cell 2023, 41, 1397–1406. [Google Scholar] [CrossRef] [Scilit]
- Bentegeac, R.; Le Guellec, B.; Leblanc, V.; Lenain, R.; Dauchet, L.; Gauthier, V.; Gerard, E.; Chazard, E.; Amouyel, P.; Aymes, E.; et al. BibliZap: An exploratory evaluation of an automated multi-level citation searching tool for systematic and rapid reviews. Res. Synth. Methods 2026, 17, 816–829. [Google Scholar] [CrossRef] [Scilit]
- Alvarado, Y.; Mita, M.M.; Vemulapalli, S.; Mahalingam, D.; Mita, A.C. Clinical activity of mammalian target of rapamycin inhibitors in solid tumors. Target. Oncol. 2011, 6, 69–94. [Google Scholar] [CrossRef] [Scilit]
- Dancey, J. mTOR signaling and drug development in cancer. Nat. Rev. Clin. Oncol. 2010, 7, 209–219. [Google Scholar] [CrossRef] [Scilit]
- Fasolo, A.; Sessa, C. Targeting mTOR pathways in human malignancies. Curr. Pharm. Des. 2012, 18, 2766–2777. [Google Scholar] [CrossRef] [Scilit]
- Hasskarl, J. Everolimus. In Small Molecules in Oncology; Recent Results in Cancer Research; Springer: Berlin/Heidelberg, Germany, 2014; Volume 201, pp. 373–392. [Google Scholar] [CrossRef] [Scilit]
- Hasskarl, J. Everolimus. In Small Molecules in Oncology; Recent Results in Cancer Research; Springer: Cham, Switzerland, 2018; Volume 211, pp. 101–123. [Google Scholar] [CrossRef] [Scilit]
- Yao, J.C.; Fazio, N.; Singh, S.; Buzzoni, R.; Carnaghi, C.; Wolin, E.; Tomasek, J.; Raderer, M.; Lahner, H.; Voi, M.; et al. Everolimus for the treatment of advanced, non-functional neuroendocrine tumours of the lung or gastrointestinal tract (RADIANT-4): A randomised, placebo-controlled, phase 3 study. Lancet 2016, 387, 968–977. [Google Scholar] [CrossRef] [Scilit]
- Yao, J.C.; Shah, M.H.; Ito, T.; Bohas, C.L.; Wolin, E.M.; Van Cutsem, E.; Hobday, T.J.; Okusaka, T.; Capdevila, J.; de Vries, E.G.; et al. Everolimus for advanced pancreatic neuroendocrine tumors. N. Engl. J. Med. 2011, 364, 514–523. [Google Scholar] [CrossRef] [Scilit]
- Dancey, J.E.; Curiel, R.; Purvis, J. Evaluating temsirolimus activity in multiple tumors: A review of clinical trials. Semin. Oncol. 2009, 36, S46–S58. [Google Scholar] [CrossRef] [Scilit]
- Abraham, R.T.; Eng, C.H. Mammalian target of rapamycin as a therapeutic target in oncology. Expert Opin. Ther. Targets 2008, 12, 209–222. [Google Scholar] [CrossRef] [Scilit]
- Smith, S.M.; van Besien, K.; Karrison, T.; Dancey, J.; McLaughlin, P.; Younes, A.; Smith, S.; Stiff, P.; Lester, E.; Modi, S.; et al. Temsirolimus has activity in non-mantle cell non-Hodgkin’s lymphoma subtypes: The University of Chicago phase II consortium. J. Clin. Oncol. 2010, 28, 4740–4746. [Google Scholar] [CrossRef] [Scilit]
- Agulnik, M. New developments in mammalian target of rapamycin inhibitors for the treatment of sarcoma. Cancer 2012, 118, 1486–1497. [Google Scholar] [CrossRef] [Scilit]
- Garrido-Laguna, I.; Tan, A.C.; Uson, M.; Angenendt, M.; Ma, W.W.; Villaroel, M.C.; Zhao, M.; Rajeshkumar, N.V.; Jimeno, A.; Donehower, R.; et al. Integrated preclinical and clinical development of mTOR inhibitors in pancreatic cancer. Br. J. Cancer 2010, 103, 649–655. [Google Scholar] [CrossRef] [Scilit]
- Lebwohl, D.; Thomas, G.; Lane, H.A.; O’Reilly, T.; Escudier, B.; Yao, J.C.; Pavel, M.; Franz, D.; Berg, W.; Baladi, J.F.; et al. Research and innovation in the development of everolimus for oncology. Expert Opin. Drug Discov. 2011, 6, 323–338. [Google Scholar] [CrossRef] [Scilit]
- Yuan, R.; Kay, A.; Berg, W.J.; Lebwohl, D. Targeting tumorigenesis: Development and use of mTOR inhibitors in cancer therapy. J. Hematol. Oncol. 2009, 2, 45. [Google Scholar] [CrossRef] [Scilit]
- Zhu, A.X.; Kudo, M.; Assenat, E.; Cattan, S.; Kang, Y.K.; Lim, H.Y.; Poon, R.T.; Blanc, J.F.; Vogel, A.; Chen, C.L.; et al. Effect of everolimus on survival in advanced hepatocellular carcinoma after failure of sorafenib: The EVOLVE-1 randomized clinical trial. JAMA 2014, 312, 57–67. [Google Scholar] [CrossRef] [Scilit]
- Gomez, E.G.; Morales, M.A.M.; San-Juan, D.; Romero-Valencia, J.; Mendez, D.L.R.; Hernandez, D.O.L.; Pizarro, M.M.; Narvaez, E.R.B.; Pelayo-Salazar, M.E.; Jimenez, S.M. Efficacy and safety of immune checkpoint inhibitors and mTOR inhibitors as targeted therapy for glioblastoma: A systematic review and meta-analysis of randomized clinical trials. Neurosurg. Rev. 2026, 49, 95. [Google Scholar] [CrossRef] [Scilit]
- Wick, W.; Gorlia, T.; Bady, P.; Platten, M.; van den Bent, M.J.; Taphoorn, M.J.; Steuve, J.; Brandes, A.A.; Hamou, M.F.; Wick, A.; et al. Phase II Study of Radiotherapy and Temsirolimus versus Radiochemotherapy with Temozolomide in Patients with Newly Diagnosed Glioblastoma without MGMT Promoter Hypermethylation (EORTC 26082). Clin. Cancer Res. 2016, 22, 4797–4806. [Google Scholar] [CrossRef] [Scilit]
- Chinnaiyan, P.; Won, M.; Wen, P.Y.; Rojiani, A.M.; Werner-Wasik, M.; Shih, H.A.; Ashby, L.S.; Michael Yu, H.H.; Stieber, V.W.; Malone, S.C.; et al. A randomized phase II study of everolimus in combination with chemoradiation in newly diagnosed glioblastoma: Results of NRG Oncology RTOG 0913. Neuro Oncol. 2018, 20, 666–673. [Google Scholar] [CrossRef] [Scilit]
- Ma, D.J.; Galanis, E.; Anderson, S.K.; Schiff, D.; Kaufmann, T.J.; Peller, P.J.; Giannini, C.; Brown, P.D.; Uhm, J.H.; McGraw, S.; et al. A phase II trial of everolimus, temozolomide, and radiotherapy in patients with newly diagnosed glioblastoma: NCCTG N057K. Neuro Oncol. 2015, 17, 1261–1269. [Google Scholar] [CrossRef] [Scilit]
- Cunningham, J.T.; Rodgers, J.T.; Arlow, D.H.; Vazquez, F.; Mootha, V.K.; Puigserver, P. mTOR controls mitochondrial oxidative function through a YY1-PGC-1alpha transcriptional complex. Nature 2007, 450, 736–740. [Google Scholar] [CrossRef] [Scilit]
- Bentzinger, C.F.; Romanino, K.; Cloetta, D.; Lin, S.; Mascarenhas, J.B.; Oliveri, F.; Xia, J.; Casanova, E.; Costa, C.F.; Brink, M.; et al. Skeletal muscle-specific ablation of raptor, but not of rictor, causes metabolic changes and results in muscle dystrophy. Cell Metab. 2008, 8, 411–424. [Google Scholar] [CrossRef] [Scilit]
- Romanino, K.; Mazelin, L.; Albert, V.; Conjard-Duplany, A.; Lin, S.; Bentzinger, C.F.; Handschin, C.; Puigserver, P.; Zorzato, F.; Schaeffer, L.; et al. Myopathy caused by mammalian target of rapamycin complex 1 (mTORC1) inactivation is not reversed by restoring mitochondrial function. Proc. Natl. Acad. Sci. USA 2011, 108, 20808–20813. [Google Scholar] [CrossRef] [Scilit]
- Morita, M.; Gravel, S.P.; Chenard, V.; Sikstrom, K.; Zheng, L.; Alain, T.; Gandin, V.; Avizonis, D.; Arguello, M.; Zakaria, C.; et al. mTORC1 controls mitochondrial activity and biogenesis through 4E-BP-dependent translational regulation. Cell Metab. 2013, 18, 698–711. [Google Scholar] [CrossRef] [Scilit]
- Cornu, M.; Oppliger, W.; Albert, V.; Robitaille, A.M.; Trapani, F.; Quagliata, L.; Fuhrer, T.; Sauer, U.; Terracciano, L.; Hall, M.N. Hepatic mTORC1 controls locomotor activity, body temperature, and lipid metabolism through FGF21. Proc. Natl. Acad. Sci. USA 2014, 111, 11592–11599. [Google Scholar] [CrossRef] [Scilit]
- Summer, R.; Shaghaghi, H.; Schriner, D.; Roque, W.; Sales, D.; Cuevas-Mora, K.; Desai, V.; Bhushan, A.; Ramirez, M.I.; Romero, F. Activation of the mTORC1/PGC-1 axis promotes mitochondrial biogenesis and induces cellular senescence in the lung epithelium. Am. J. Physiol. Lung Cell. Mol. Physiol. 2019, 316, L1049–L1060, Erratum in Am. J. Physiol. Lung Cell. Mol. Physiol. 2019, 320, L468–L471. [Google Scholar] [CrossRef] [Scilit]
- Magen, A.; Hamon, P.; Fiaschi, N.; Soong, B.Y.; Park, M.D.; Mattiuz, R.; Humblin, E.; Troncoso, L.; D’Souza, D.; Dawson, T.; et al. Intratumoral dendritic cell-CD4+ T helper cell niches enable CD8+ T cell differentiation following PD-1 blockade in hepatocellular carcinoma. Nat. Med. 2023, 29, 1389–1399. [Google Scholar] [CrossRef] [Scilit]
- Zhang, Q.; He, Y.; Luo, N.; Patel, S.J.; Han, Y.; Gao, R.; Modak, M.; Carotta, S.; Haslinger, C.; Kind, D.; et al. Landscape and Dynamics of Single Immune Cells in Hepatocellular Carcinoma. Cell 2019, 179, 829–845.E20. [Google Scholar] [CrossRef] [Scilit]
- Mantovani, A.; Marchesi, F.; Malesci, A.; Laghi, L.; Allavena, P. Tumour-associated macrophages as treatment targets in oncology. Nat. Rev. Clin. Oncol. 2017, 14, 399–416. [Google Scholar] [CrossRef] [Scilit]
- Zheng, C.; Zheng, L.; Yoo, J.K.; Guo, H.; Zhang, Y.; Guo, X.; Kang, B.; Hu, R.; Huang, J.Y.; Zhang, Q.; et al. Landscape of Infiltrating T Cells in Liver Cancer Revealed by Single-Cell Sequencing. Cell 2017, 169, 1342–1356.E16. [Google Scholar] [CrossRef] [Scilit]
- Fu, J.; Xu, D.; Liu, Z.; Shi, M.; Zhao, P.; Fu, B.; Zhang, Z.; Yang, H.; Zhang, H.; Zhou, C.; et al. Increased regulatory T cells correlate with CD8 T-cell impairment and poor survival in hepatocellular carcinoma patients. Gastroenterology 2007, 132, 2328–2339. [Google Scholar] [CrossRef] [Scilit]
- Wu, S.Y.; Fu, T.; Jiang, Y.Z.; Shao, Z.M. Natural killer cells in cancer biology and therapy. Mol. Cancer 2020, 19, 120. [Google Scholar] [CrossRef] [Scilit]
- Wu, Q.; Zhou, W.; Yin, S.; Zhou, Y.; Chen, T.; Qian, J.; Su, R.; Hong, L.; Lu, H.; Zhang, F.; et al. Blocking Triggering Receptor Expressed on Myeloid Cells-1-Positive Tumor-Associated Macrophages Induced by Hypoxia Reverses Immunosuppression and Anti-Programmed Cell Death Ligand 1 Resistance in Liver Cancer. Hepatology 2019, 70, 198–214. [Google Scholar] [CrossRef] [Scilit]
- Tu, X.; Chen, L.; Zheng, Y.; Mu, C.; Zhang, Z.; Wang, F.; Ren, Y.; Duan, Y.; Zhang, H.; Tong, Z.; et al. S100A9+CD14+ monocytes contribute to anti-PD-1 immunotherapy resistance in advanced hepatocellular carcinoma by attenuating T cell-mediated antitumor function. J. Exp. Clin. Cancer Res. 2024, 43, 72. [Google Scholar] [CrossRef] [Scilit]
- Sia, D.; Jiao, Y.; Martinez-Quetglas, I.; Kuchuk, O.; Villacorta-Martin, C.; Castro de Moura, M.; Putra, J.; Camprecios, G.; Bassaganyas, L.; Akers, N.; et al. Identification of an Immune-specific Class of Hepatocellular Carcinoma, Based on Molecular Features. Gastroenterology 2017, 153, 812–826. [Google Scholar] [CrossRef] [Scilit]
- Sun, H.; Huang, Q.; Huang, M.; Wen, H.; Lin, R.; Zheng, M.; Qu, K.; Li, K.; Wei, H.; Xiao, W.; et al. Human CD96 Correlates to Natural Killer Cell Exhaustion and Predicts the Prognosis of Human Hepatocellular Carcinoma. Hepatology 2019, 70, 168–183. [Google Scholar] [CrossRef] [Scilit]
- Vivier, E.; Tomasello, E.; Baratin, M.; Walzer, T.; Ugolini, S. Functions of natural killer cells. Nat. Immunol. 2008, 9, 503–510. [Google Scholar] [CrossRef] [Scilit]
- Chang, W.H.; Shah, D.; Myers, S.; Potts, M.; Qazi, S.; Trieu, V. Comparative Tumor Microenvironment Analysis for HCC and PDAC Using KMplotter. Int. J. Mol. Sci. 2025, 26, 11920. [Google Scholar] [CrossRef] [Scilit]
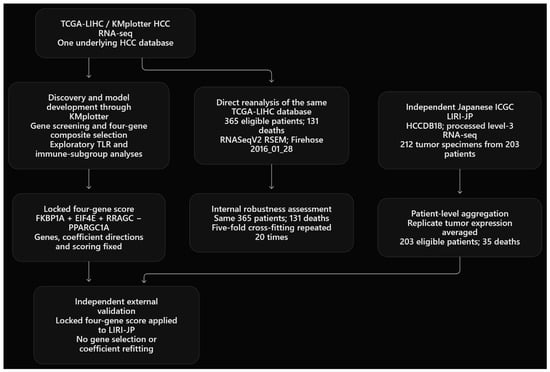
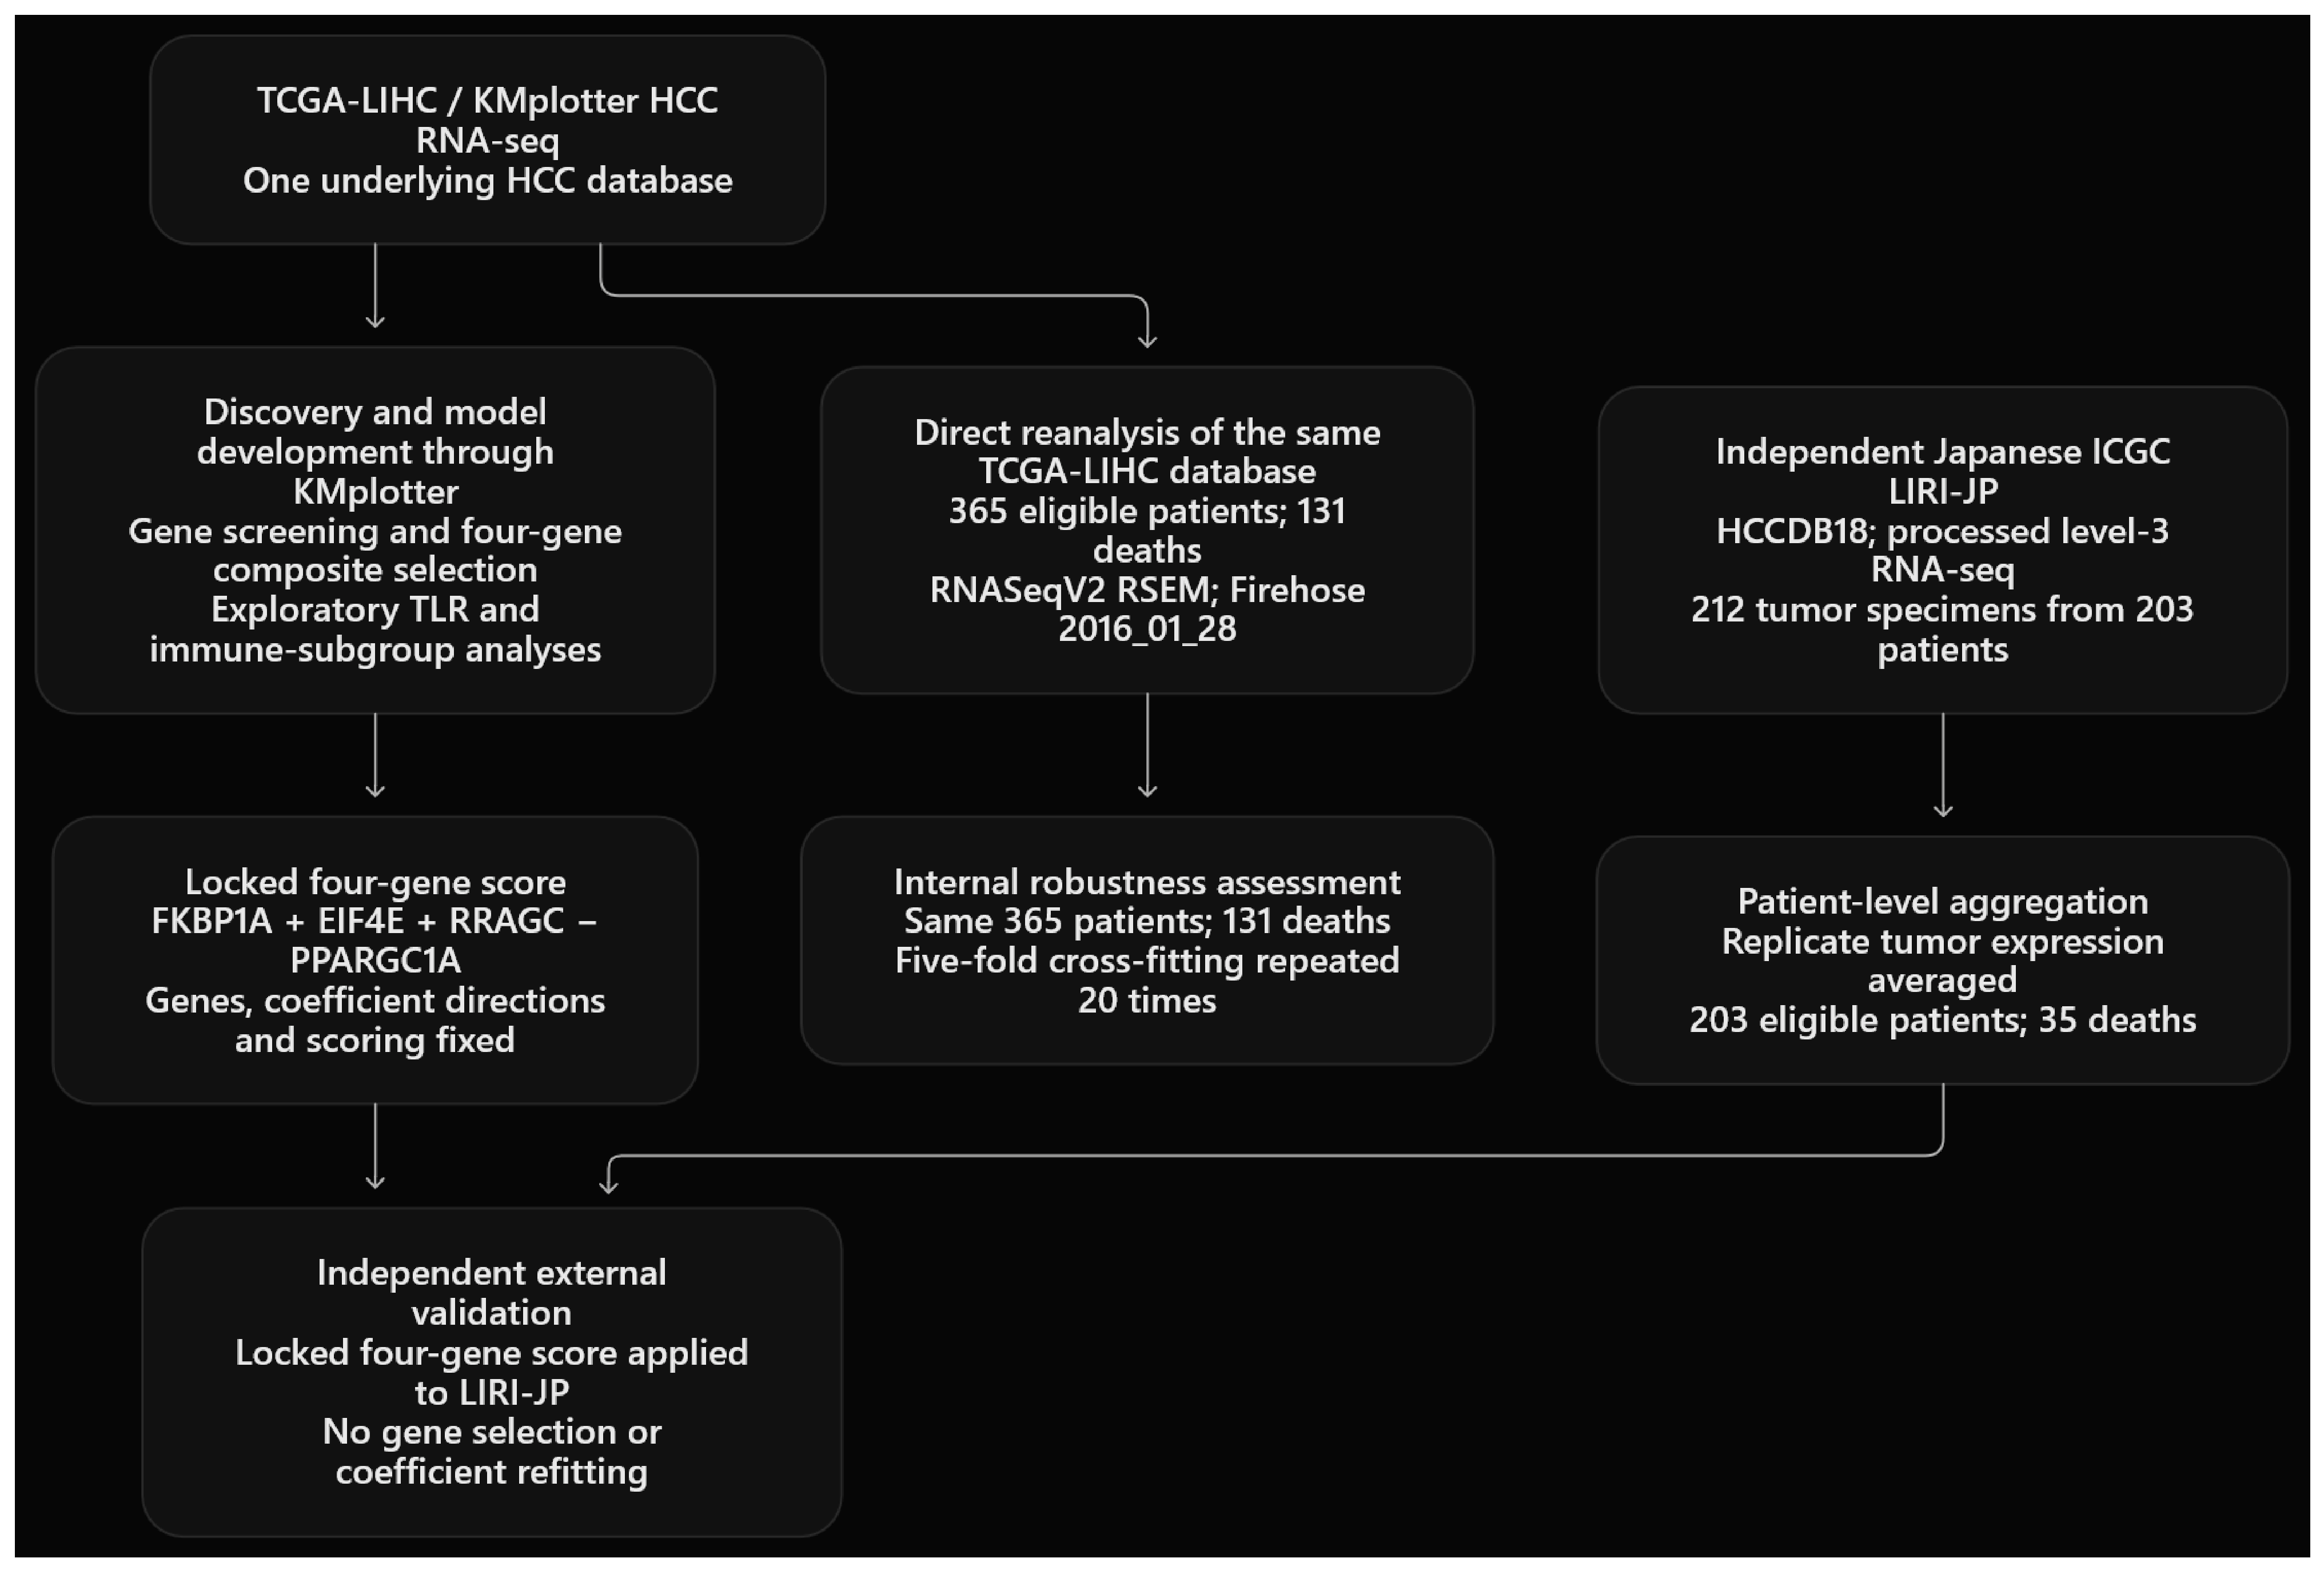
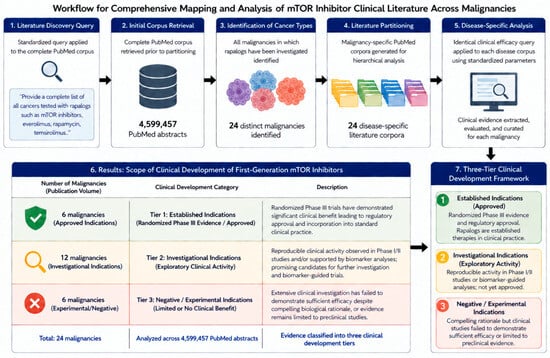
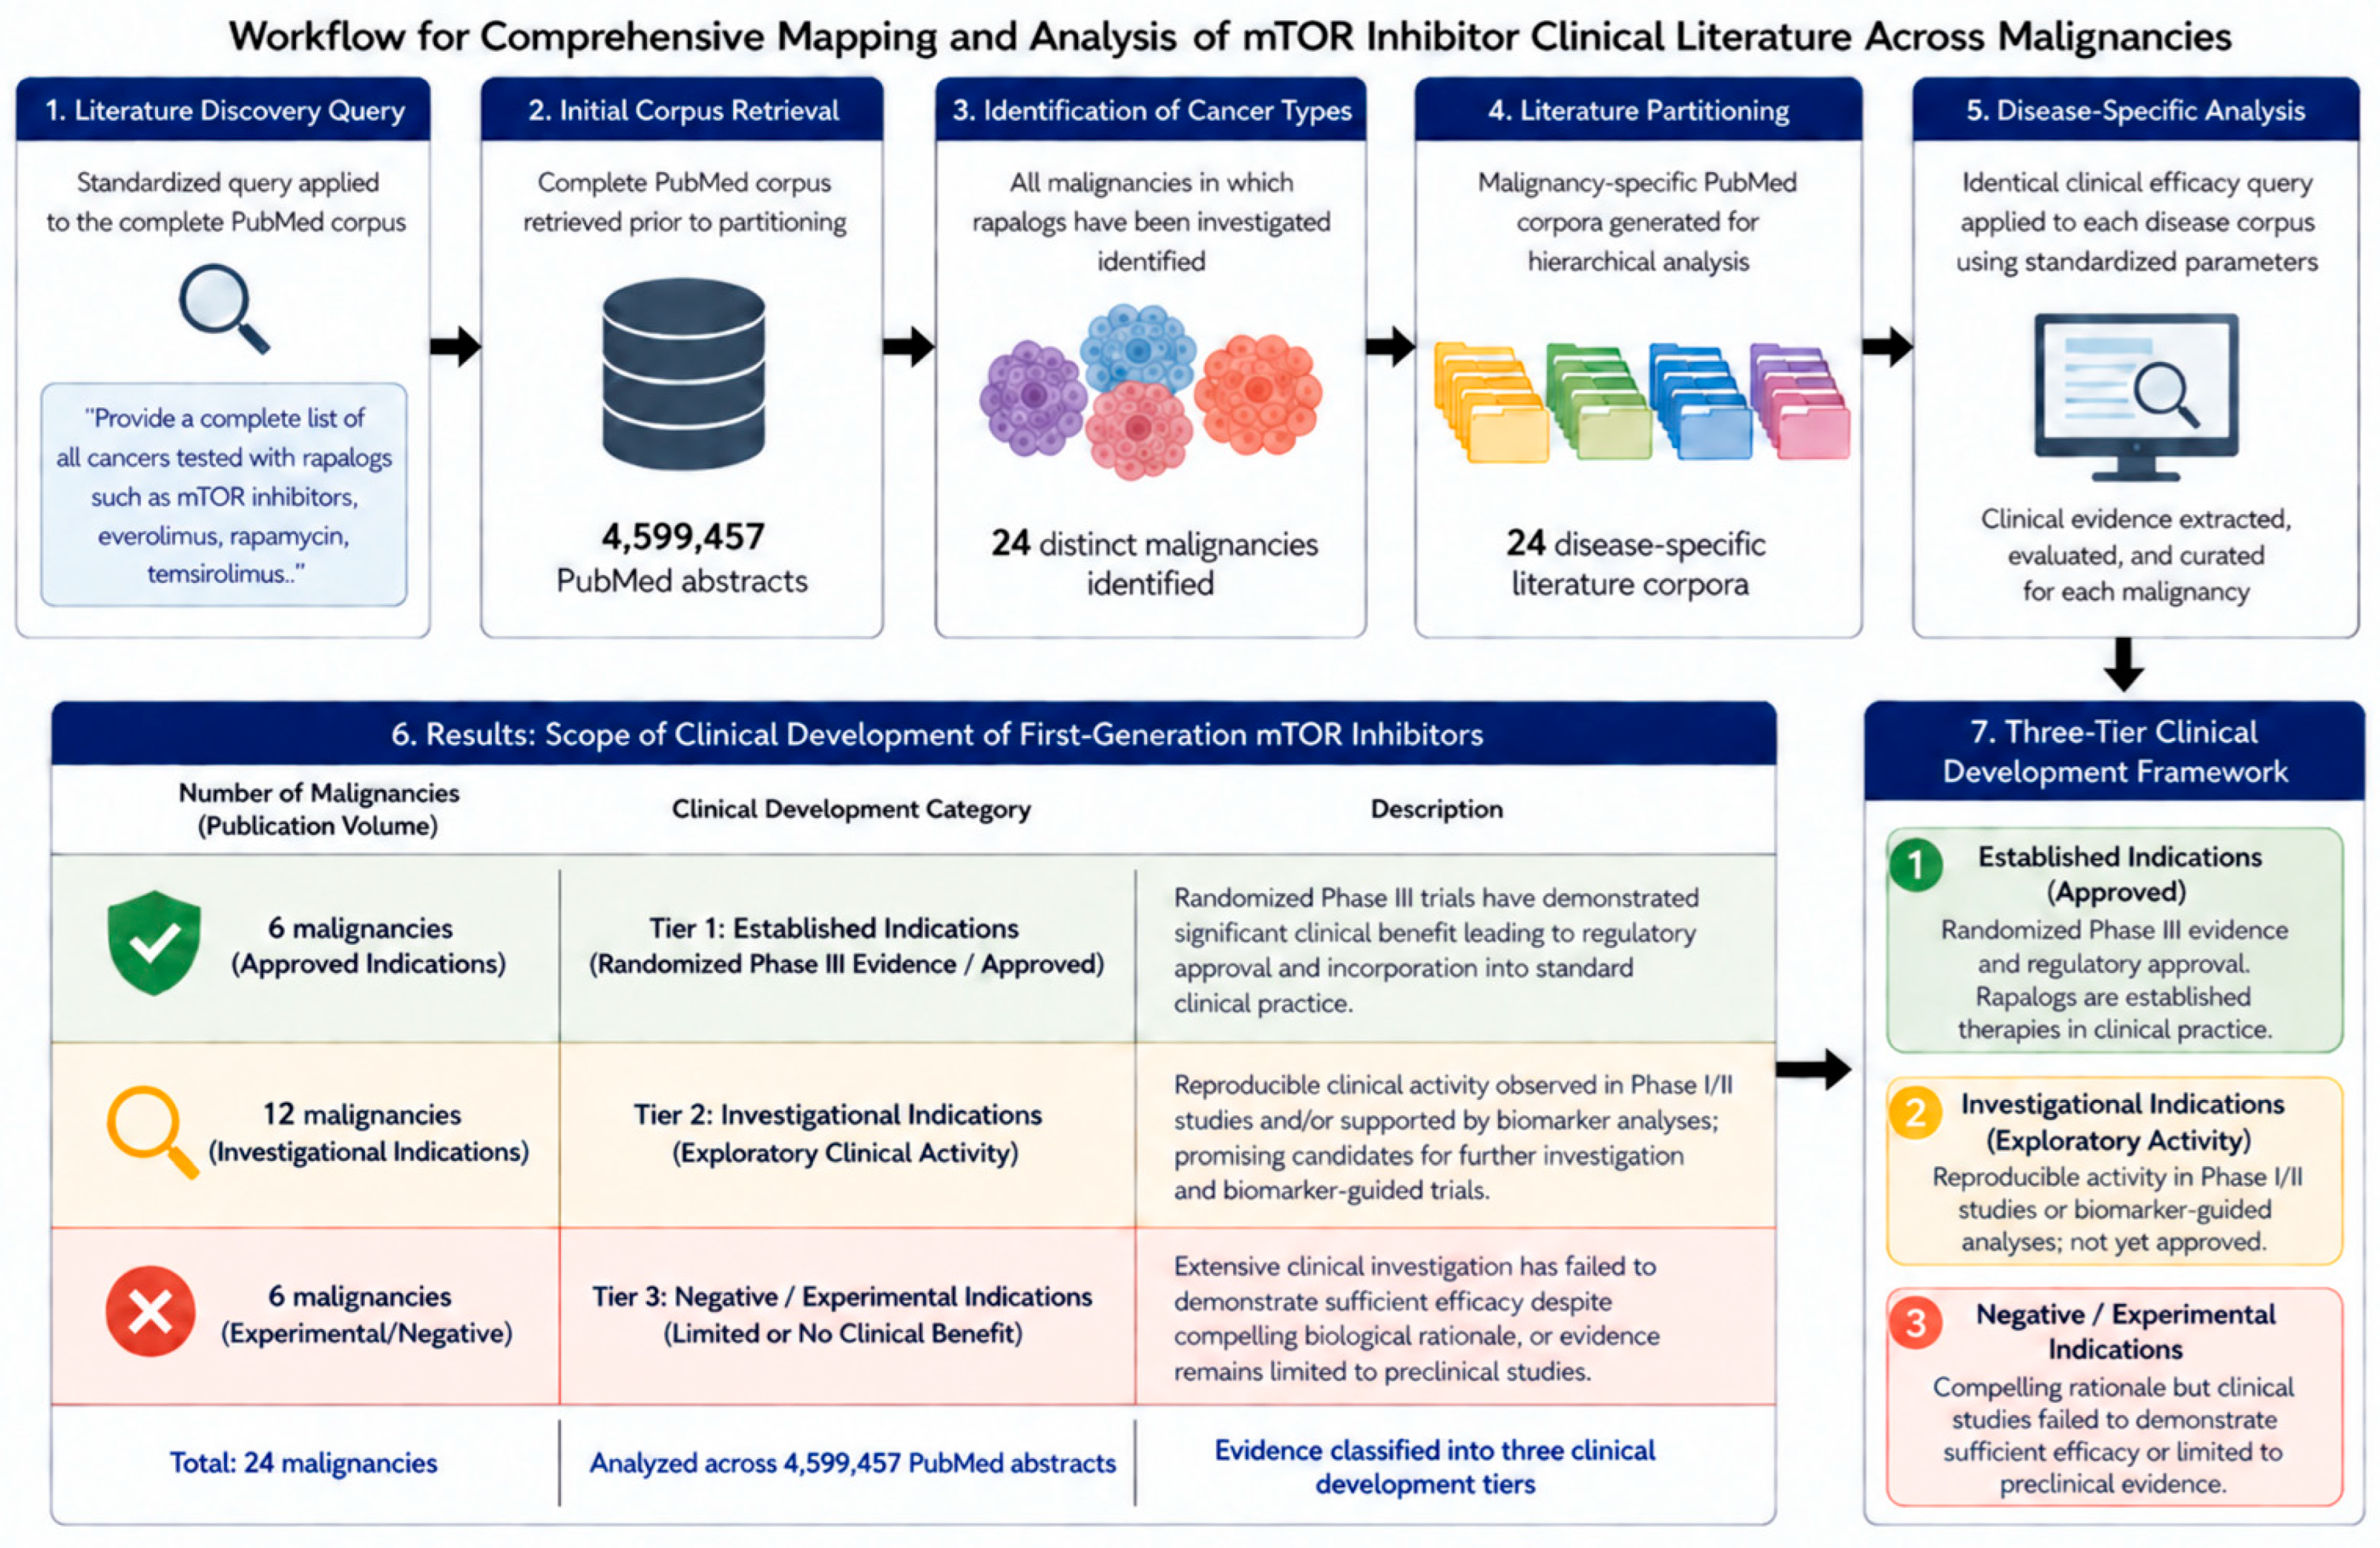
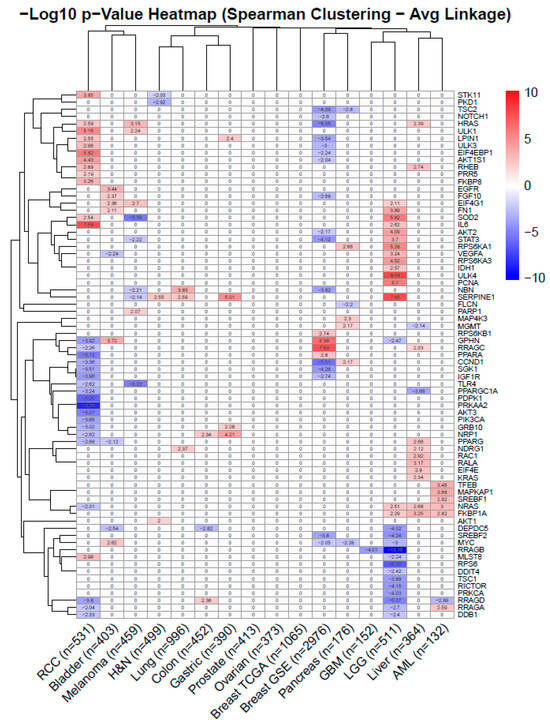
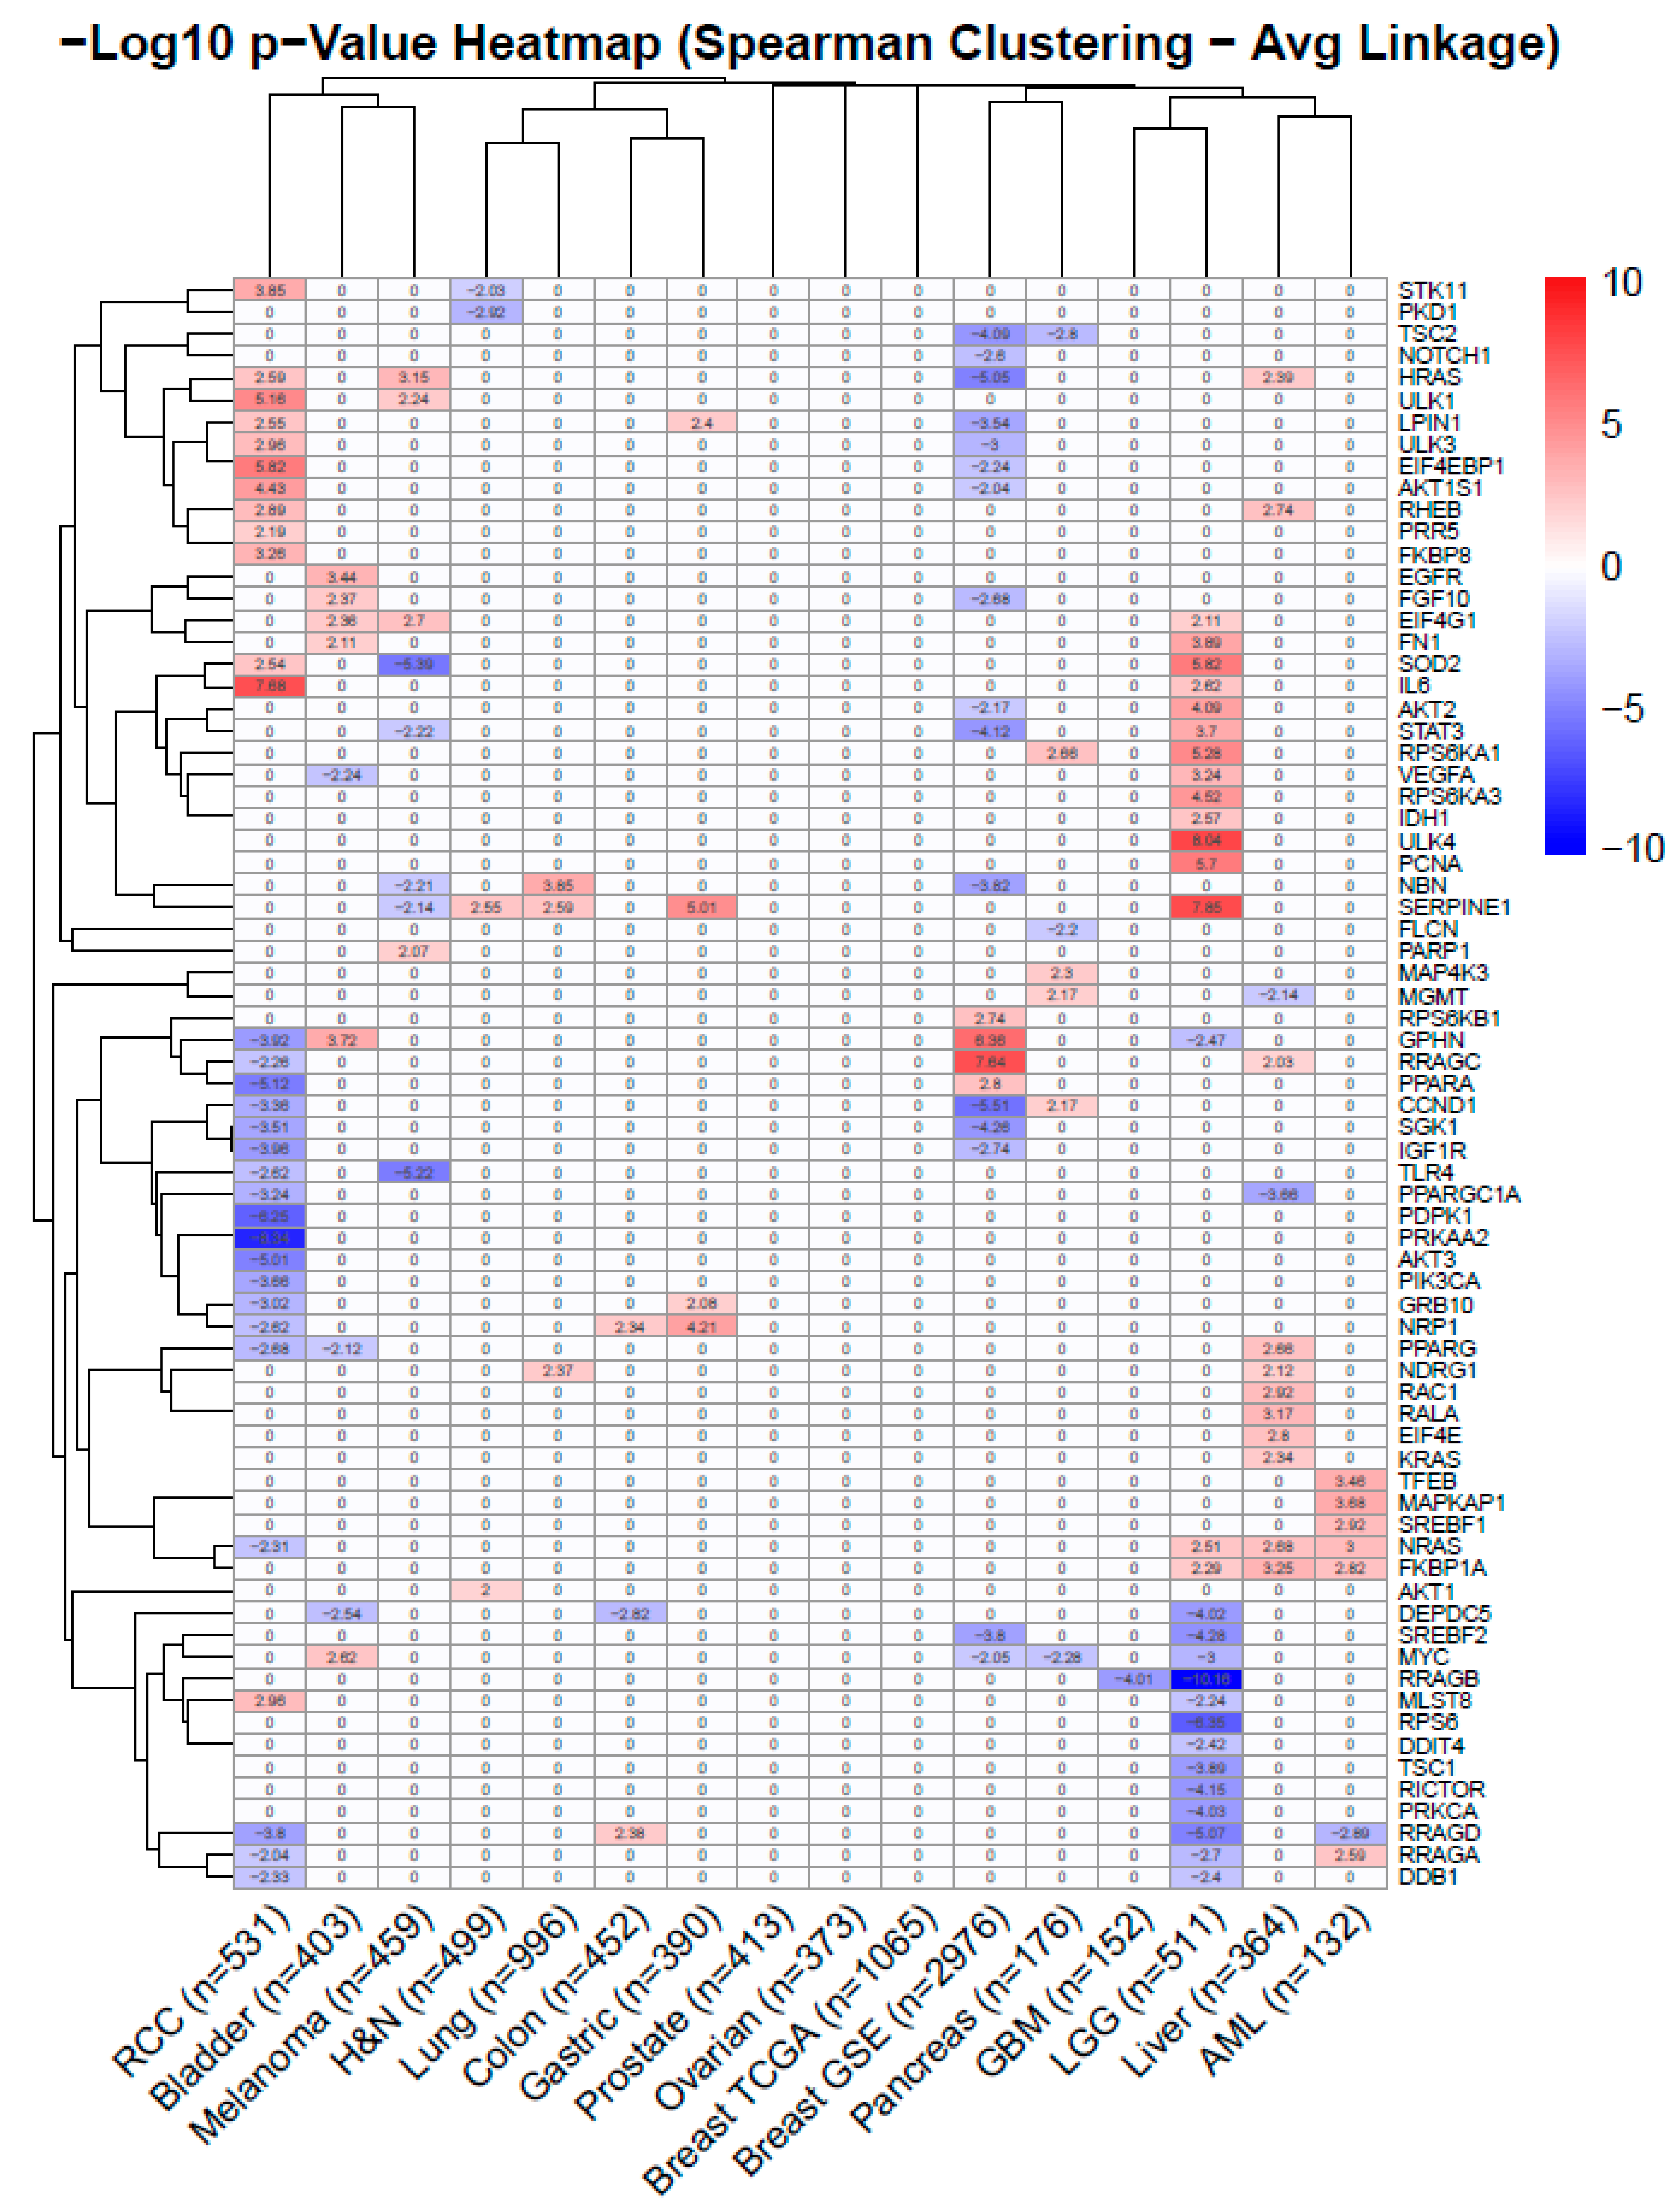
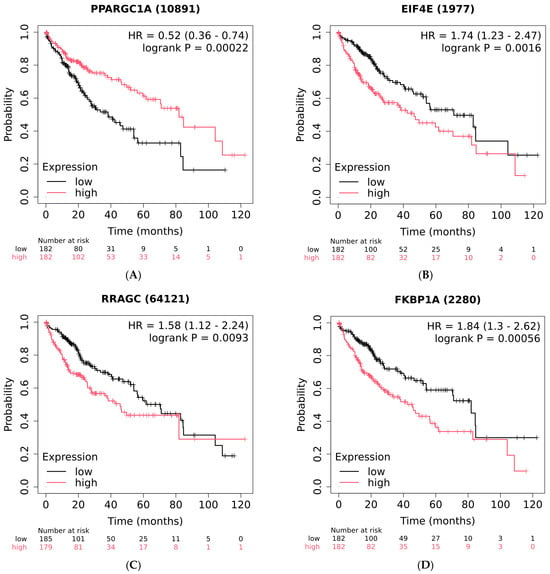
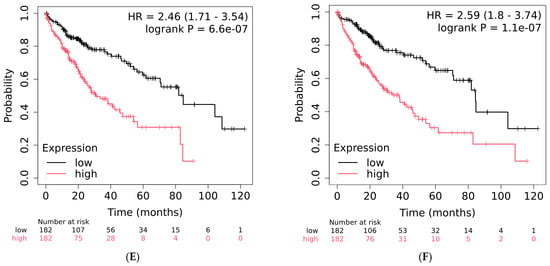
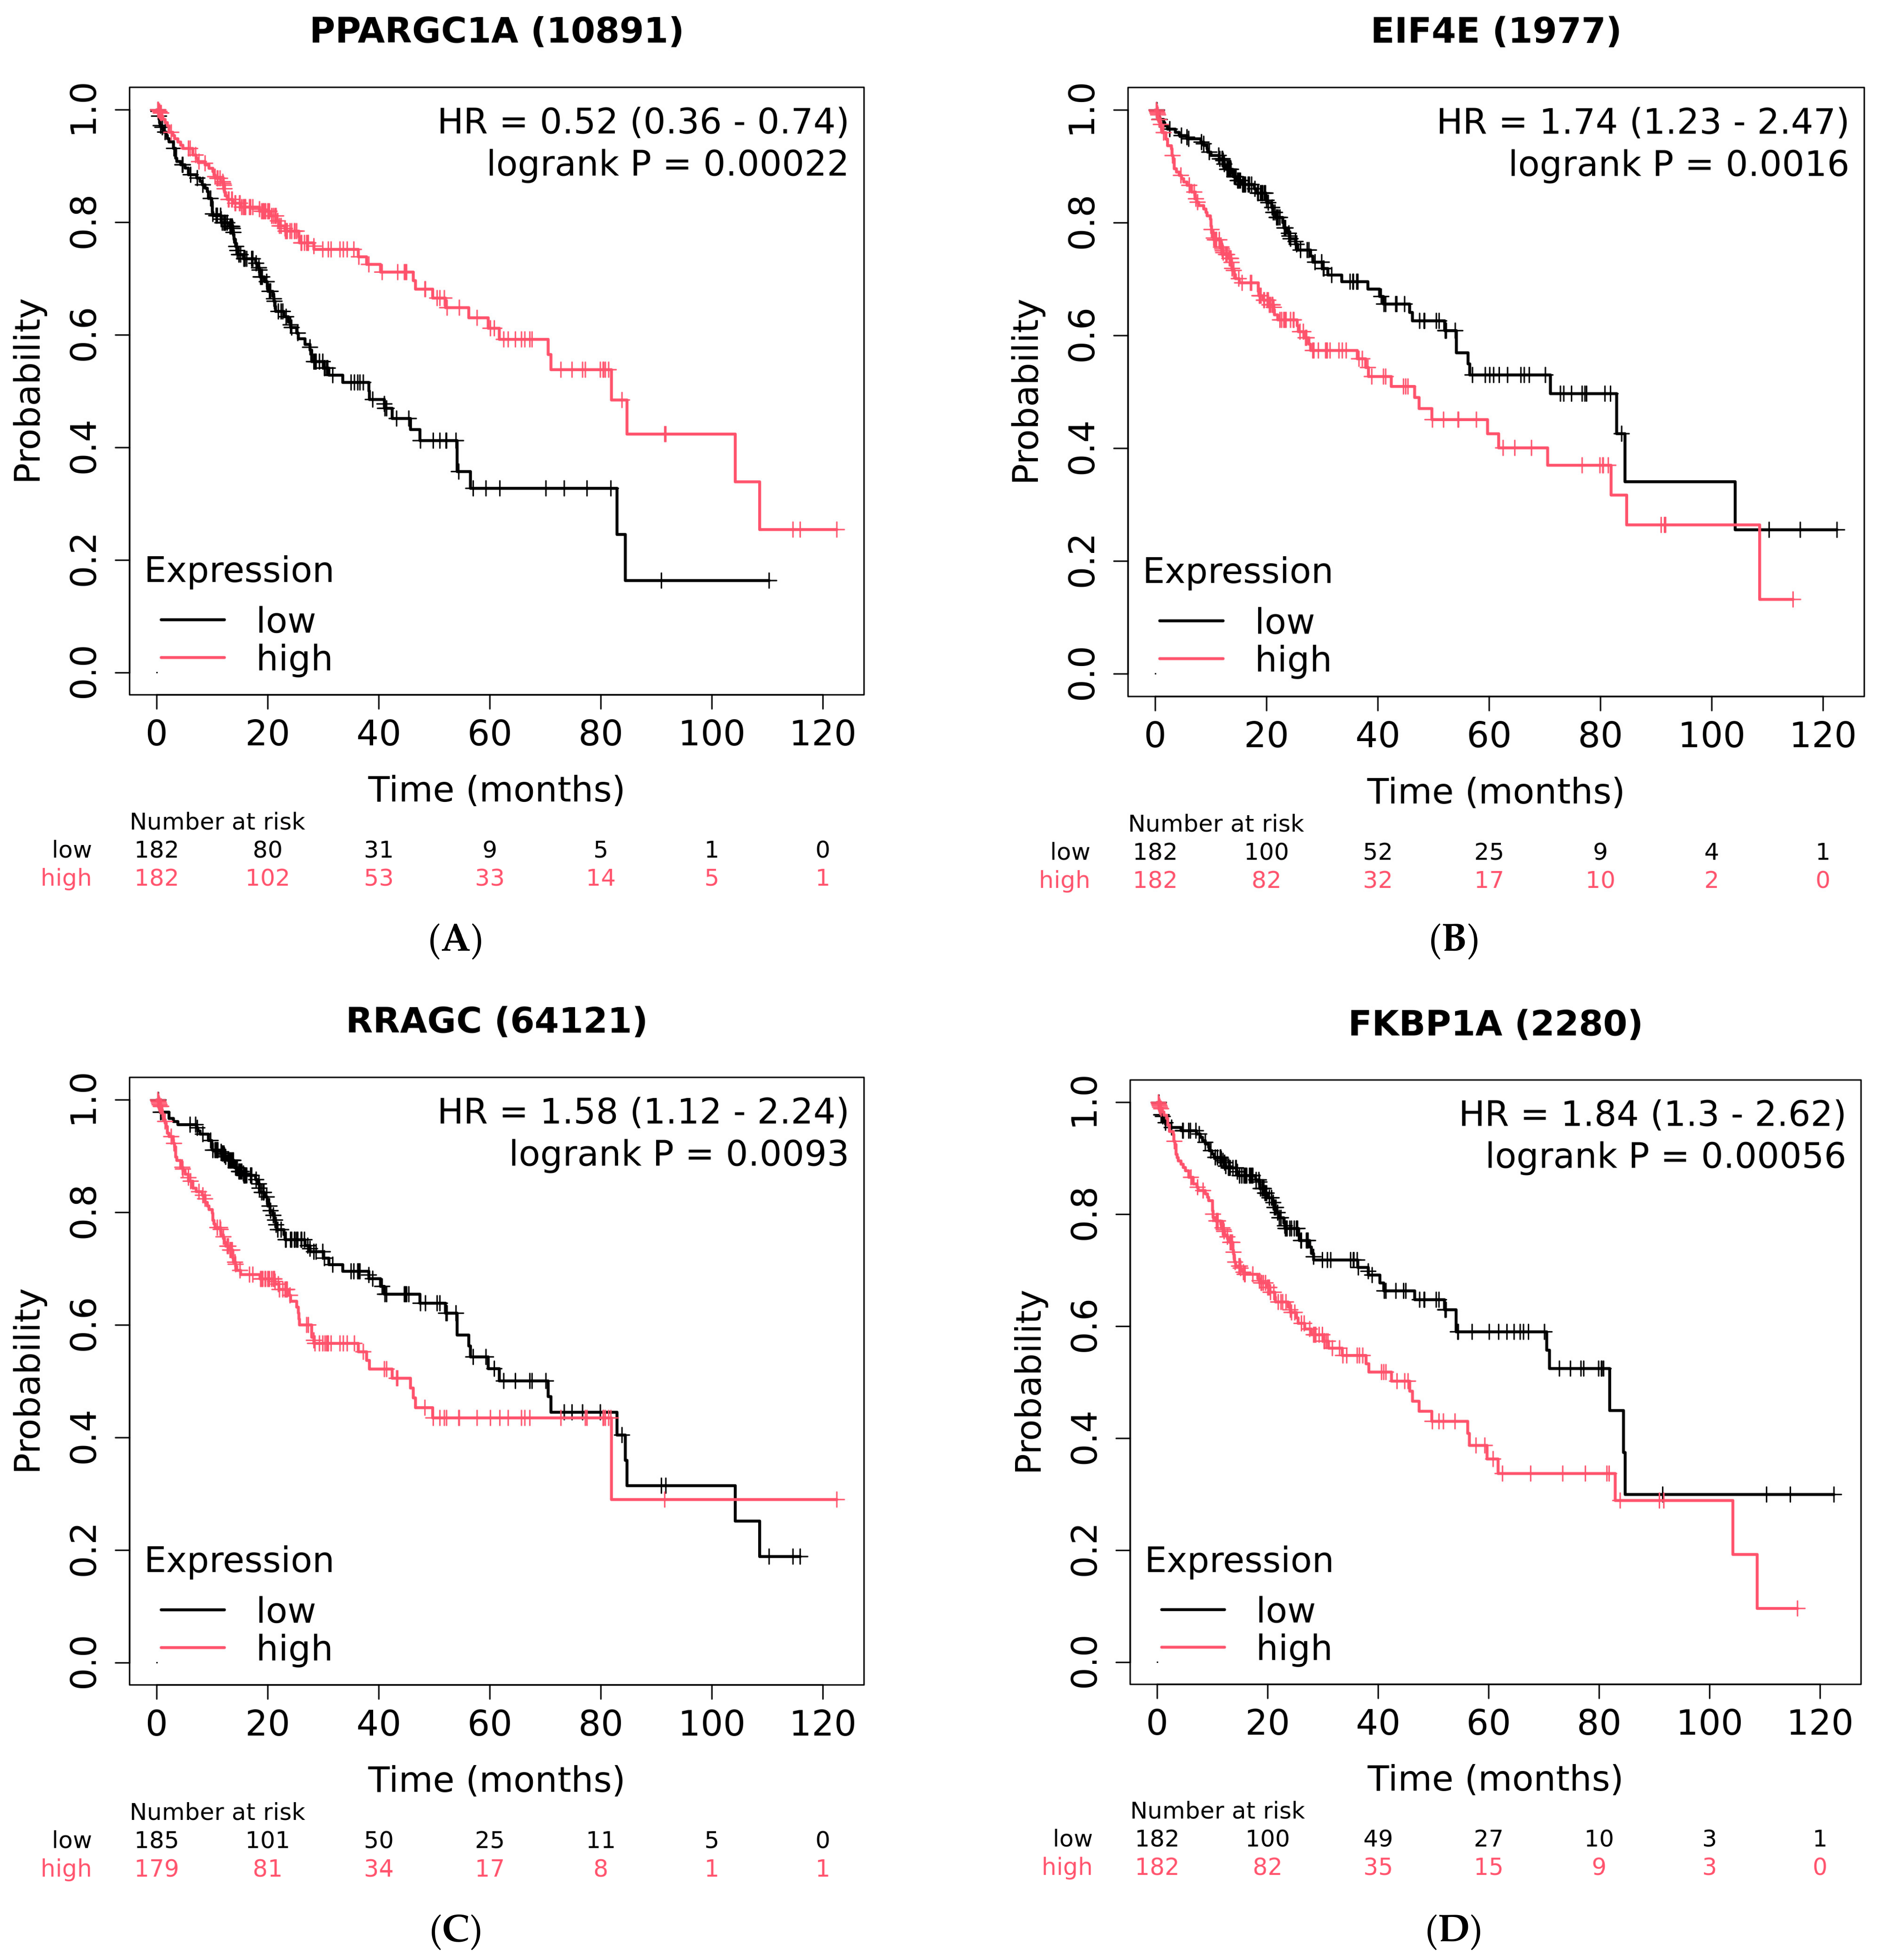
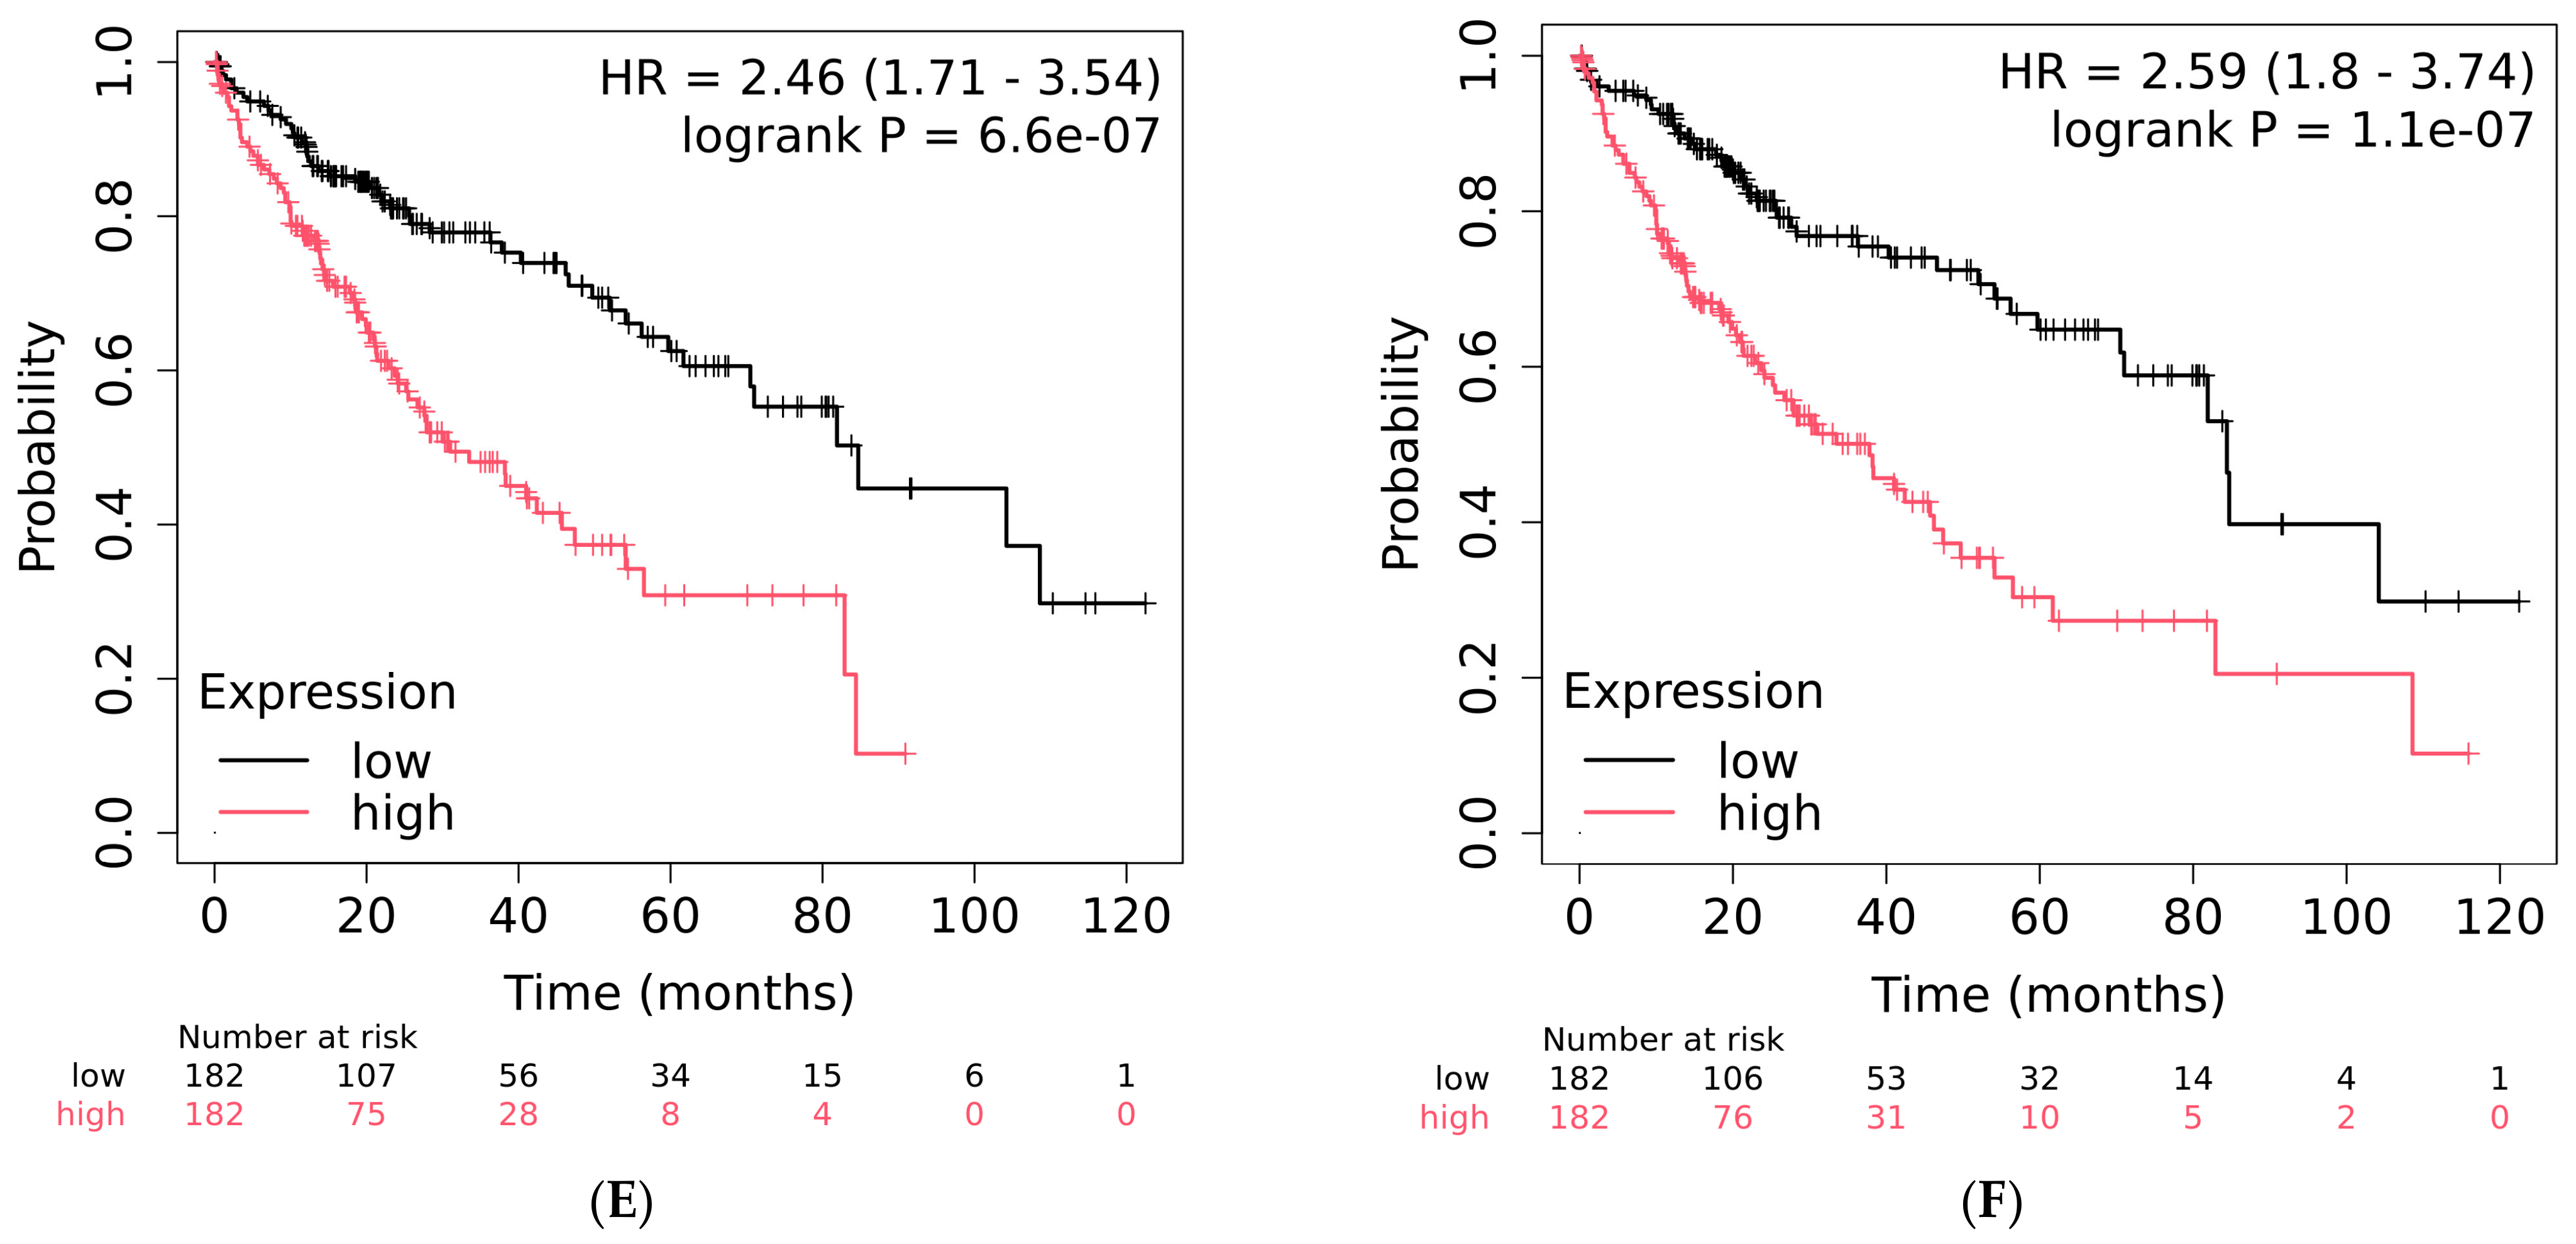
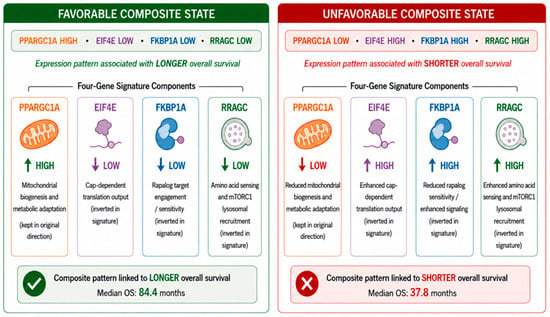
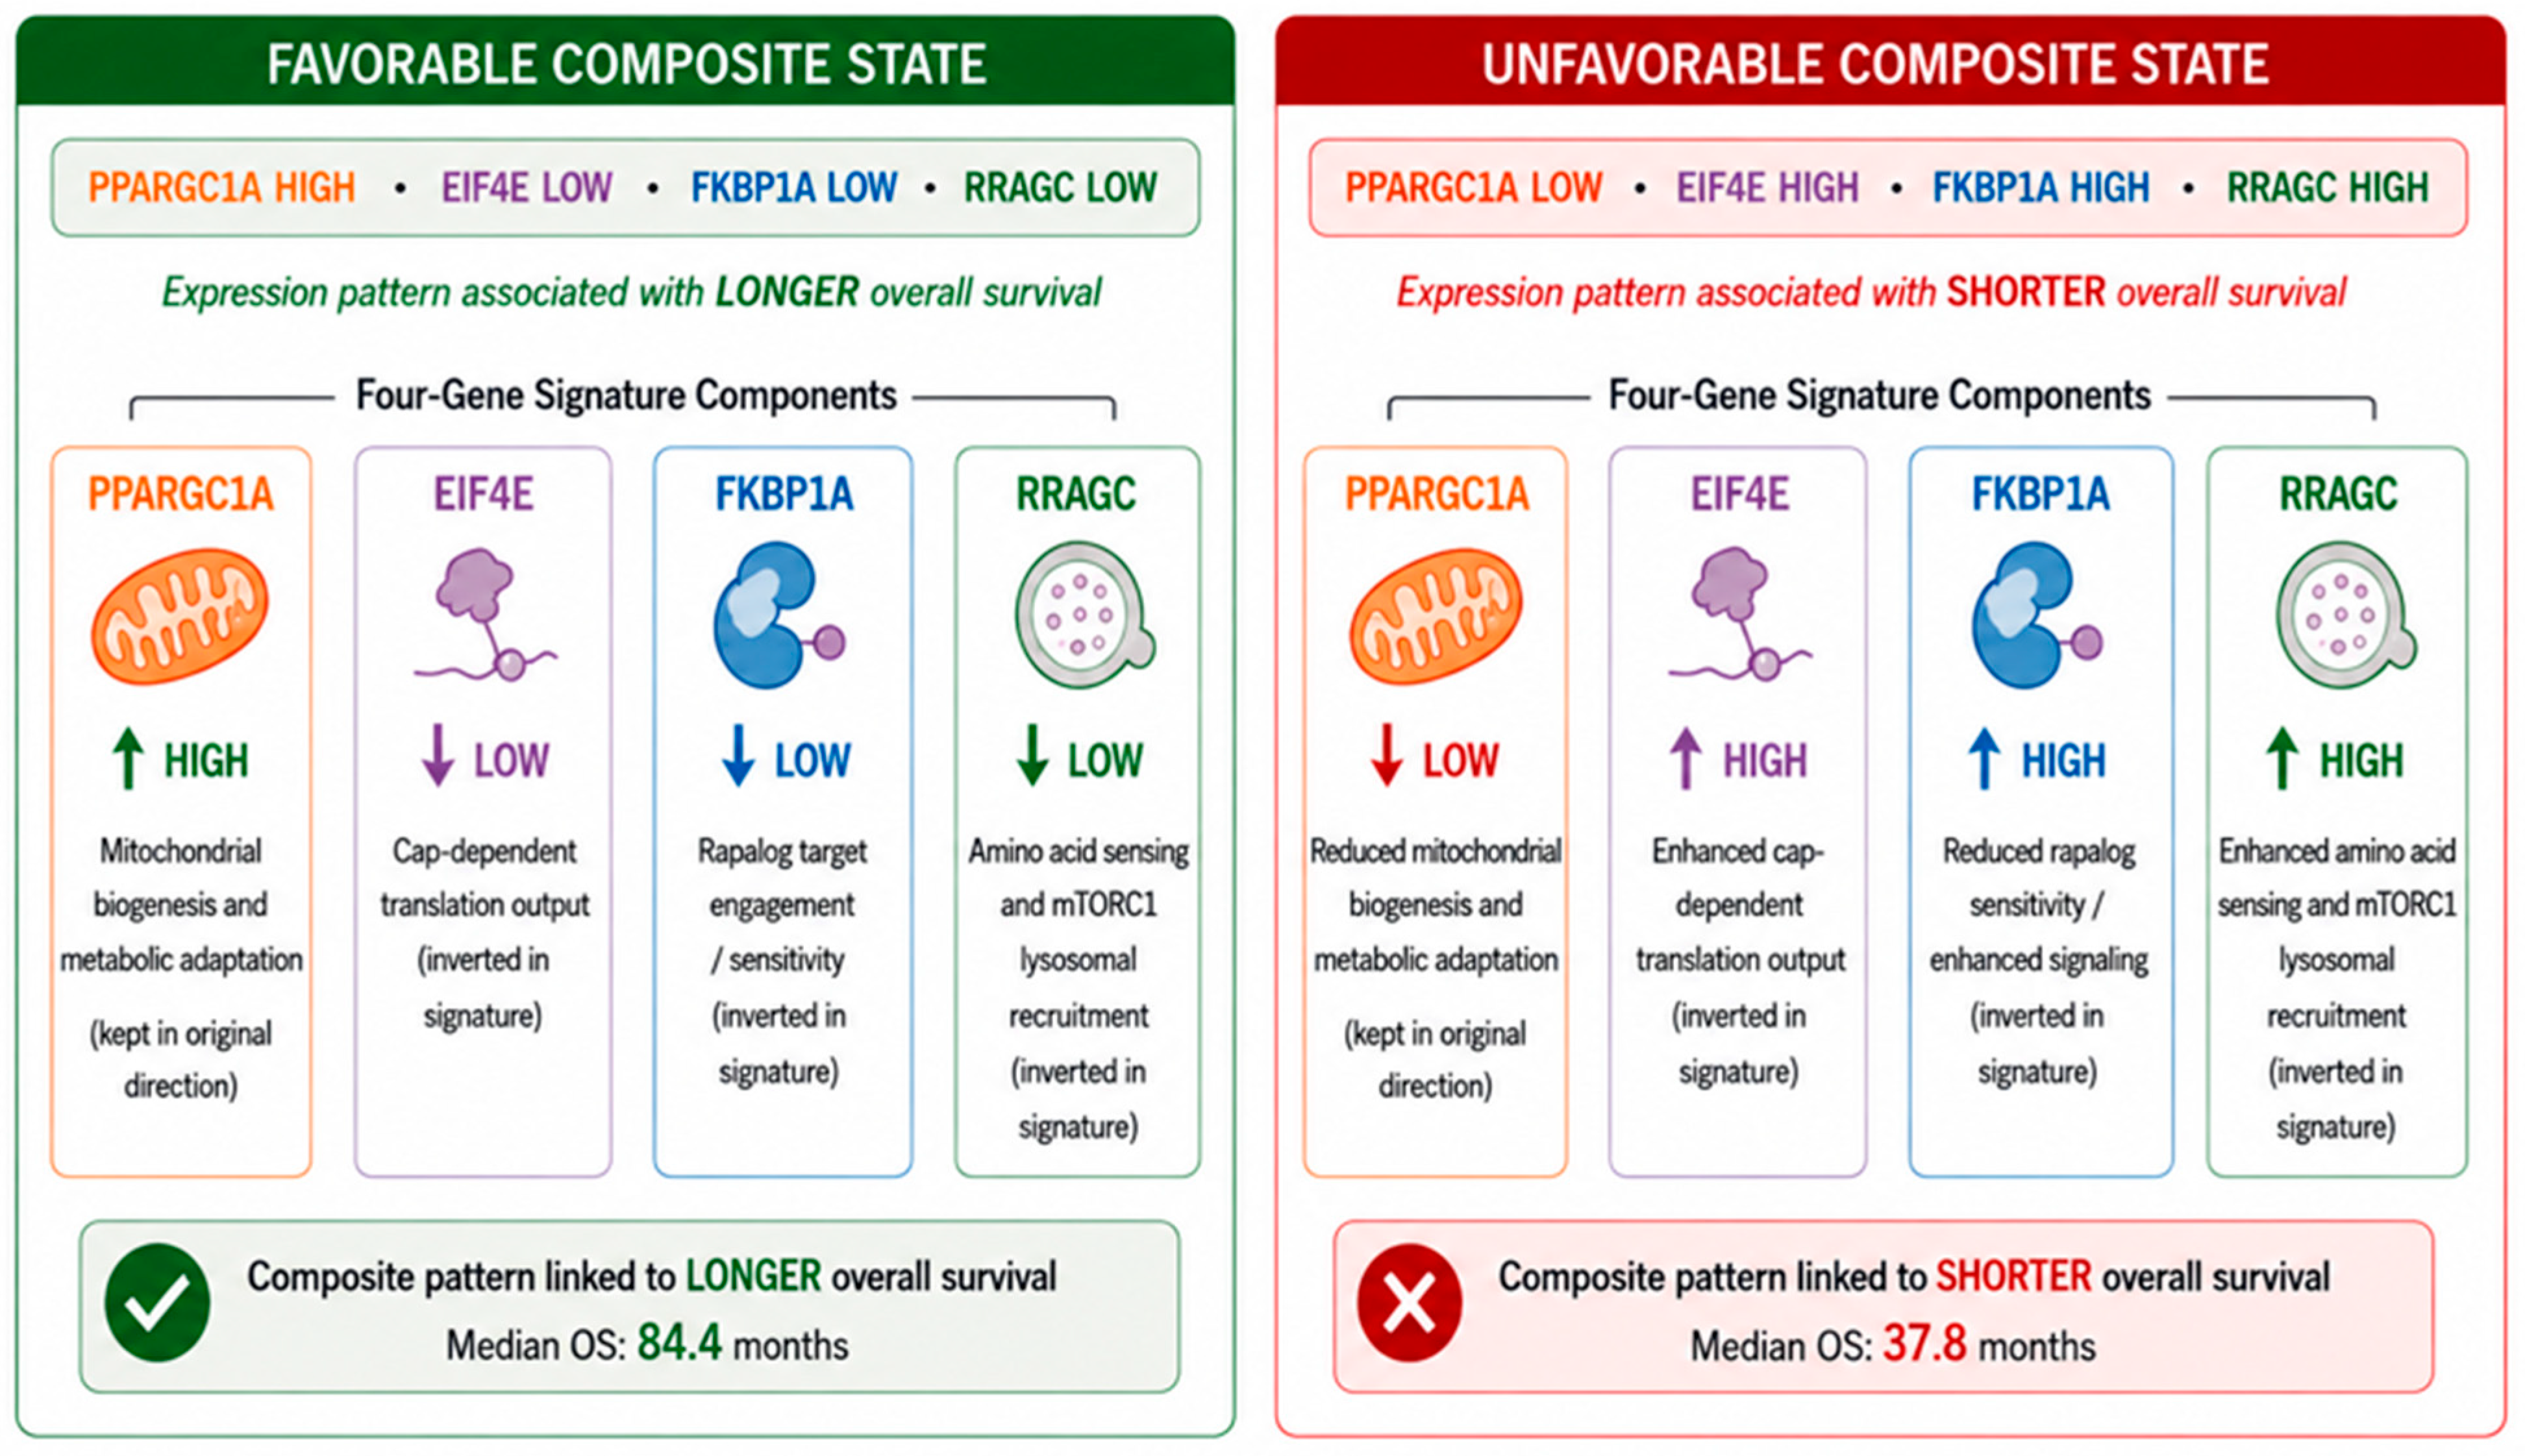
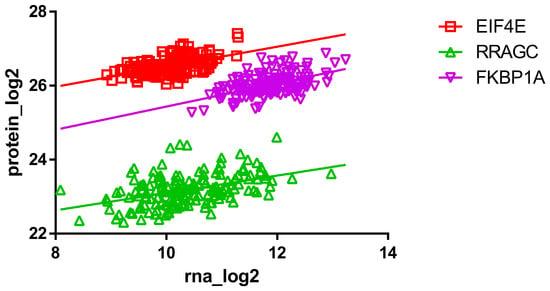
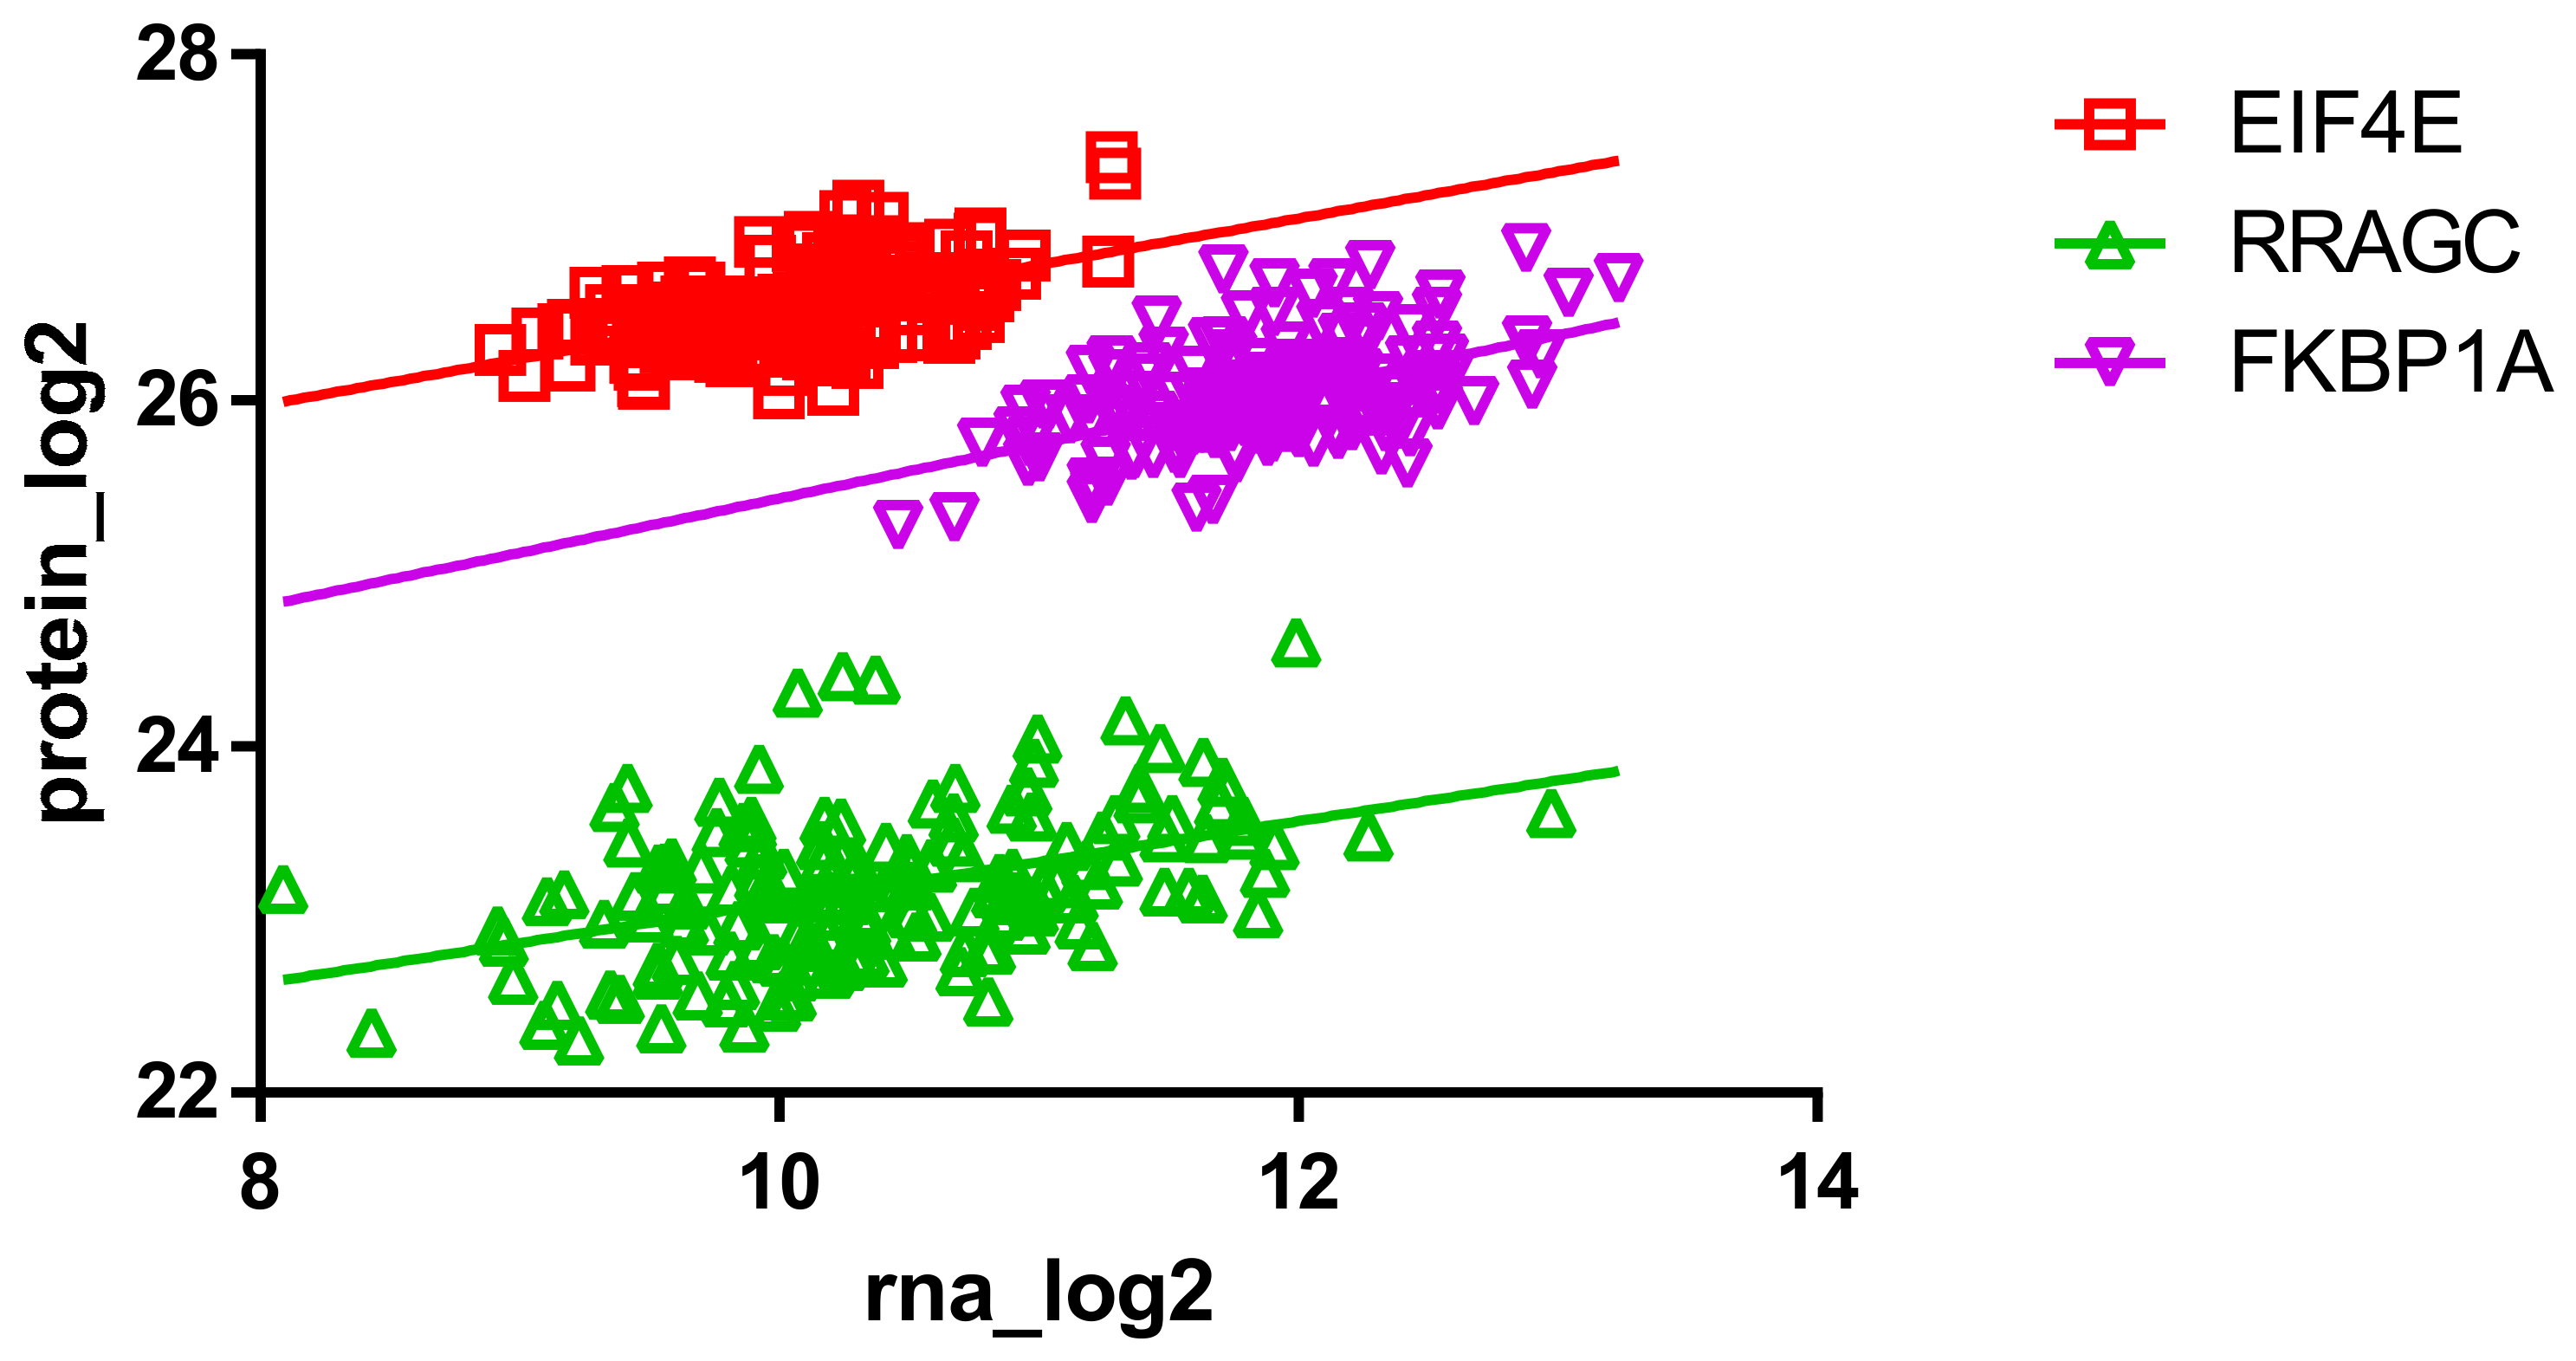

Disclaimer/Publisher’s Note: The statements, opinions and data contained in all publications are solely those of the individual author(s) and contributor(s) and not of MDPI and/or the editor(s). MDPI and/or the editor(s) disclaim responsibility for any injury to people or property resulting from any ideas, methods, instructions or products referred to in the content. |
© 2026 by the authors. Licensee MDPI, Basel, Switzerland. This article is an open access article distributed under the terms and conditions of the Creative Commons Attribution (CC BY) license.