


Abstract
Nanopipette-based single-molecule sensing offers a label-free route to protein analysis, but distinguishing structurally different proteins from ionic current traces remains difficult. Here, we classified three clinically important proteins (CCL5, MMP1 and TIMP1) from their nanopipette translocation signals. Twelve biophysical features were extracted from a balanced subset of 846 events (282 per protein) drawn from 1317 recorded events (one experiment per protein). Random Forest, SVM and gradient boosting were compared by five-fold cross-validation; gradient boosting performed best (accuracy 92.1 ± 2.0%, macro ROC-AUC 0.982). Absolute current drop and relative blockage (ΔI/I0) were the most important features (about 37% of importance), and PCA and clustering separated TIMP1 but not CCL5 and MMP1. However, with a histogram-based gradient boosting classifier on a pool of 28 experiments (7095 events), balanced accuracy fell from 90.0% under event-level cross-validation to 73.5% when whole experiments recorded with other nanopipettes were held out (mean CCL5 recall 30%), and to 47–63% without baseline-related features, whereas open-pore current alone gave 92.0% and 82.6%, indicating pipette-specific contributions. These proof-of-concept findings indicate that, within the present dataset, nanopipette signals can distinguish the three proteins, whereas generalization to independent nanopipettes, particularly for CCL5, remains to be demonstrated.
1. Introduction
Rapid and accurate identification of proteins from complex biological fluids is vital for providing clinical diagnosis and conducting fundamental life science research. Conventional detection methods, including enzyme-linked immunosorbent assays (ELISA), mass spectrometry, and Western blotting, have been shown to be very sensitive and specific, but they almost always require fluorescent labels, antibodies, or extensive sample preparation, which limits their use in point-of-care and real-time monitoring settings [1,2,3,4].
Nanopipette-based single-molecule sensing has emerged as a promising label-free detection technology [5,6,7]. Using nanopipettes, researchers can force single molecules of analytes through nanoscale openings (also called pores) by applying an electric field across the pore, causing the ionic current flowing through the pore to occlude for a set period. During these occlusions, the resulting characteristic current blockage events provide detailed information about the molecules moving through the nanopipette, including (but not limited to) the size, charge density, and conformational dynamics of the molecule. Nucleic acids, small molecules, peptides, and proteins have all been detected using this technique [8,9].
Several investigations have shown that ML can be utilized in the analysis of nanopore signals [10]. CNNs and various deep learning methods, such as recurrent networks, have been previously studied for their application to raw signal classification. In comparison, traditional ML methods including Random Forest, SVM, and gradient boosting have all shown competence when faced with hand-crafted biophysical features [11,12,13]. However, comprehensive benchmarking of these approaches across multiple clinically relevant proteins under event-level cross-validation, remains limited in literature. Recent studies have also combined resistive-pulse signatures with unsupervised Gaussian mixture and spectral clustering to separate viral capsids by cargo state [14], and enzyme-functionalized single solid-state nanochannels have been reviewed as single-molecule biosensing platforms [15].
We endeavored to study three extracellular proteins of high biomedical importance: CCL5 (RANTES), which functions as a chemokine signal for inflammation and recruitment of immune cells; MMP1, a matrix metalloproteinase that degrades components of the extracellular matrix and facilitates tumor invasion and tissue remodeling; TIMP1, a naturally occurring inhibitor of metalloproteinases, with roles in fibrosis, apoptosis and cancer progression. CCL5, TIMP1 and MMP1 have vastly different molecular weights (CCL5: ~8 kDa; TIMP1: ~28 kDa; MMP1: ~52 kDa), which add significant challenges and physiological implications to the simultaneous discrimination of these three target proteins.
We present a systematic feature extraction and ML classification pipeline applied to a balanced set of 846 single-molecule translocation events (selected from 1317 recorded events) across three proteins. Under event-level cross-validation, GBM reached 92.1% accuracy and a macro ROC-AUC of 0.982, and leave-one-experiment-out validation on 28 experiments (7095 events; CCL5, n = 3) was used to test robustness across independent recordings. This work is presented as a proof-of-concept study of three proteins with widely different molecular weights; it is not a validated diagnostic method. We further examine which features drive the classification through feature importance ranking and principal component analysis.
2. Material and Methods
2.1. Proteins and Sample Preparation
Recombinant human CCL5, MMP1, and TIMP1 proteins were purchased from PeproTech (Thermo Fisher Scientific, Waltham, MA, USA; catalog numbers 300-06-20UG, 420-01-10UG and 410-01-10UG, respectively) with a purity level of >95%. Working stock solutions of the proteins in phosphate-buffered saline (PBS, pH 7.4) were made with a dilution ratio of 1:50 to achieve a concentration of 50 pM for each of the three recombinant proteins prior to their use in experiments. All working solutions were filtered through the equivalent of a 0.25 μm membrane to remove any aggregates that may have formed during preparation.
To ensure reproducibility and physical clarity, measurements were conducted in 1× PBS (137 mM NaCl, 2.7 mM KCl, 10 mM Na2HPO4, 1.8 mM KH2PO4, pH 7.4) at room temperature (~22 °C). A fixed transmembrane voltage of 0.7 V was applied. The nanopipette possessed an approximate pore opening diameter of 30 nm (mean of three pipettes, verified by scanning electron microscopy; Nova 600 NanoLab, FEI Company, Hillsboro, OR, USA) and a cone angle of 27.8°. The Ag/AgCl reference electrode was placed in the external bath, while the working electrode was located inside the nanopipette.
At pH 7.4, the electrophoretic transport of proteins is heavily influenced by their respective isoelectric points. The predominant driving force through the nanopipette is a combination of electrophoretic motion (dictated by the net charge of each protein) and electroosmotic flow. The electroosmotic flow is directed toward the cathode due to the negative surface charge of the quartz nanopipette under these pH conditions, which acts concurrently with or in opposition to the electrophoretic forces depending on the specific protein.
2.2. Biosensor Fabrication, Data Acquisition, and Event Detection
The experimental design—including the nanopipette fabrication, measurement conditions, and data acquisition steps—followed the protocols we recently developed [16]. Nanopipettes were fabricated from quartz capillaries (inner diameter 0.3 mm, outer diameter 1.0 mm, length 15 cm; World Precision Instruments, Sarasota, FL, USA). The capillaries were cleaned in a plasma cleaner (25 W, 4:1 O2:N2, 1500 mTorr chamber pressure, 4 min) as described previously [16] and pulled with a P-2000 laser-based micropipette puller (Sutter Instrument, Novato, CA, USA) using a two-line program: (1) HEAT 775, FIL 4, VEL 30, DEL 170, PUL 80; (2) HEAT 825, FIL 3, VEL 20, DEL 175, PUL 180. No electron-beam shrinking was applied, and the tip geometry of three representative pipettes was verified by scanning electron microscopy. Each experiment was performed on a different day with a separate nanopipette, and all nanopipettes were fabricated with the same protocol. Before each experiment, the pipette was tested in protein-free 1× PBS to confirm a clean, unobstructed tip (stable open-pore current, no clogging); pipettes were used when their open-pore currents in PBS were within approximately ±10% of a reference value of 1400 pA, and the experiment was started only after this check. Ionic currents were recorded in voltage-clamp mode with an Axopatch 200B amplifier, low-pass filtered with an 8-pole Bessel filter at 2 kHz, digitized at 250 kHz with a Digidata 1440A and acquired with pClamp 10.7 software (all from Molecular Devices, San Jose, CA, USA), using Ag/AgCl electrodes inside a Faraday cage [16]. Individual translocation events were detected and segmented from continuous ionic current recordings using the OpenNanopore software package [17], run in MATLAB (version R2025a; The MathWorks, Inc., Natick, MA, USA). This program employs a change-point detection method based on the cumulative sum (CUSUM) algorithm, which allows for the robust identification of events by adapting to low-frequency baseline fluctuations. For each detected event, the start and end sample indices, the number of distinct current levels (NumberOfLevels), event type (Standard Event or Impulsion), baseline current, blockage current, and charge area (AreaCoulomb) were recorded. A total of 391, 282, and 644 events were recorded for CCL5, MMP1, and TIMP1, respectively. Each of these datasets comes from one experiment (one continuous recording with one nanopipette). These experiments are part of a set of 28 experiments with 28 nanopipettes (CCL5, n = 3; MMP1, n = 16; TIMP1, n = 9; each with at least 15 events), which was used for the leave-one-experiment-out validation described below.
2.3. Feature Extraction and Balanced Dataset Construction
Twelve biophysical features were extracted from each translocation event for use in machine learning classification [18]:
- (1).
- Translocation duration (ms)—the time it takes for the event to occur from start to finish.
- (2).
- Blockage depth—the relative reduction in the ionic current (ΔI/I0 × 100), where I0 is the open-pore (baseline) current fitted around the event.
- (3).
- Absolute current drop ΔI—the difference in the baseline current and the current level during the event (using pA).
- (4).
- Event area (AreaCoulomb)—the charge carried by the total ionic current during the event (measured in pC), calculated by OpenNanopore as the integral of the total (not baseline-subtracted) current over the event duration; it therefore scales approximately with I0 × duration and contains baseline information.
- (5).
- Number of current levels—number of stable conductance levels within the event.
- (6).
- Signal standard deviation (pA)—the magnitude of the variability of the current within the event.
- (7).
- Skewness—the third standardized moment of the current distribution within the event.
- (8).
- Kurtosis—the fourth standardized moment reflecting tail behavior of the current distribution.
- (9).
- Rise time (ms)—the time for the cumulative absolute current deflection to rise from the 10th to the 90th percentiles, (10) asymmetry (%)—the difference between the average current during the first and second halves of the event as a function of the baseline.
- (10).
- Log10(duration)—A log10-transformed duration value for the purpose of normalizing the heavy-tailed distribution.
- (11).
- Log10(area)—A log10-transformed event area.
All features were normalized using z-score normalization (zero mean, unit variance) before training on any of the models used for this analysis.
To ensure that the different protein classes are compared fairly, a random sample of 282 was taken from each class event pool resulting in 846 total events that are balanced. The random sampling was done using a fixed seed (42) to ensure replicable results. The balanced subset was not tested for distributional equivalence with the complete event pool. The remaining 109 CCL5 and 362 TIMP1 events came from the same experiments. Table 1, the PCA, the clustering and the cross-validation use the balanced set, whereas the duration–distribution fits use all detected events.
Table 1.
Biophysical translocation parameters for CCL5, MMP1, and TIMP1 (n = 282 per protein, balanced subset). Event area is the integral of the total current over the event; I0 is given as mean ± SD across the events of the single experiment per protein. Four events with negative ΔI (artifacts; see text) are included in the means and SDs.
2.4. Machine Learning Models
Three supervised classification algorithms were evaluated:
Random Forest (RF): An ensemble of 200 decision trees with a maximum depth of 10, trained using class-balanced sample weights to handle any residual class imbalance. Feature splits were evaluated using Gini impurity.
Support Vector Machine (SVM): A kernel SVM with a radial basis function (RBF) kernel, class-balanced weights, and default regularization parameter (C = 1.0) and kernel coefficient (γ = ‘scale’). SVM was trained on z-score normalized features.
Gradient Boosting Machine (GBM): An ensemble of 200 shallow decision tree classifiers trained sequentially to minimize cross-entropy loss. Learning rate was set to 0.1 with a subsample fraction of 1.0.
All models were implemented using scikit-learn in Python 3 [19]. Model performance was assessed using five-fold stratified cross-validation, preserving class proportions in each fold. Evaluation metrics included classification accuracy, macro-averaged F1-score, and one-vs-rest macro-averaged ROC-AUC. For the leave-one-experiment-out validation (below), balanced accuracy, i.e., the mean of the per-protein recalls, was used. Crucially, to entirely eliminate preprocessing leakage, z-score normalization (zero mean, unit variance) was implemented inside a scikit-learn pipeline. The scaling statistics (mean and standard deviation) were calculated strictly on the training folds and subsequently applied to the held-out test folds during each cross-validation iteration. In each fold, approximately 676–677 events were used for training and 169–170 events for testing (about 225–226 and 56–57 events per protein, respectively). Splits were made at the level of individual events, without grouping by recording. Because events from the same experiment, and thus the same nanopipette, can appear in both training and test folds, event-level cross-validation quantifies separability within the present dataset rather than generalization to independent nanopipettes or experimental days. This is addressed by the leave-one-experiment-out validation described below.
2.5. Dimensionality Reduction and Statistical Analysis
To visualize inter-protein separation in a 2D space, principal component analysis (PCA) was performed on the standardized 12-dimensional features, in relation to the full balanced dataset. PCA was implemented to calculate the first two principal components for all events and quantify data retained by calculating the ratio of explained variance. Mean ± standard deviation across five folds of cross-validation metrics is reported.
The Kruskal–Wallis non-parametric test was used to assess group differences in translocation time, ΔI/I0 and ΔI across proteins, and Dunn’s post hoc test with Bonferroni correction was used due to the non-normal distribution of duration values (Shapiro–Wilk test, p < 0.05). A p-value of 0.05 was determined to be significant.
Duration distributions were fitted (location fixed at zero) with lognormal, inverse Gaussian, gamma, Weibull and exponential models by maximum likelihood to all detected events of each protein and compared using the Akaike information criterion (AIC) and the Kolmogorov–Smirnov distance. For unsupervised clustering, k-means (k = 3, 20 initializations) and Gaussian mixture models (k = 3) were applied to the z-scored 12-feature matrix and compared with the true protein labels using the adjusted Rand index (ARI), normalized mutual information (NMI) and silhouette score.
To test generalization across recordings, leave-one-experiment-out (LOEO) validation was performed on the per-experiment OpenNanopore event tables (28 experiments: CCL5, n = 3; MMP1, n = 16; TIMP1, n = 9; only experiments with at least 15 events were used). For these experiments all twelve features were computed from the event segments of the OpenNanopore output (event waveform and fitted levels) with the same definitions as for the primary dataset, and the open-pore current I0 was taken from the fitted baseline. In each iteration one experiment was held out, and a histogram-based gradient boosting classifier (scikit-learn HistGradientBoostingClassifier, a different implementation from the GBM used for Table 2 and Table 3; 200 iterations, learning rate 0.1, otherwise default settings, class-balanced sample weights) was trained on all events of the remaining experiments. Because a held-out experiment contains events of a single protein, the recall of that protein was determined for each held-out experiment, and balanced accuracy was defined as the mean of the three per-protein mean recalls. For comparison, event-level stratified five-fold cross-validation was performed with the same classifier and features on the same pool of events. The feature subsets are defined in Table 4.
Table 2.
Five-fold cross-validation performance of three classifiers (mean ± SD across folds).
Table 3.
Per-class classification metrics for gradient boosting (GBM) under 5-fold CV.
Table 4.
Event-level cross-validation versus leave-one-experiment-out (LOEO) validation with the same classifier (histogram-based gradient boosting) on the 7095 events of the 28 experiments with at least 15 events. CV: balanced accuracy of event-level stratified five-fold cross-validation. LOEO: mean of the three per-protein mean recalls when each experiment is held out in turn (%). Recalls are mean ± SD across held-out experiments (CCL5 n = 3, MMP1 n = 16, TIMP1 n = 9).
For the protein-free controls, one recording per protein (1× PBS, 0.7 V, 250 kHz sampling; Table 5) acquired with the corresponding nanopipette (fabricated as described in Section 2.2) before the protein experiment was filtered with an 8-pole Bessel filter at 2 kHz and analyzed with a threshold-based detector (events were runs of the baseline-corrected filtered trace below −1.5 σ, with a peak of at least 4σ, a mean depth of at least 25 pA and a duration of 0.064–1.5 ms, where σ is the robust noise estimate of the trace; this detector differs from the OpenNanopore CUSUM procedure used for the protein events). The same criteria were not applied to the protein recordings, so the comparison of event rates with the protein experiments is approximate.
Table 5.
Event rates in protein-free 1× PBS controls (one recording per protein) and in protein experiments (events/s). Protein rates are given for the primary experiment of each protein and as the median (range) over all experiments with at least 15 events (n = 3, 16 and 9).
3. Results
3.1. Translocation Event Characteristics
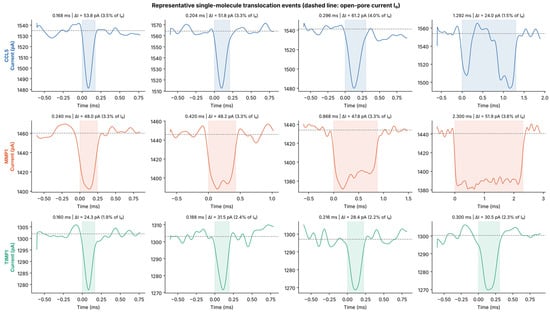
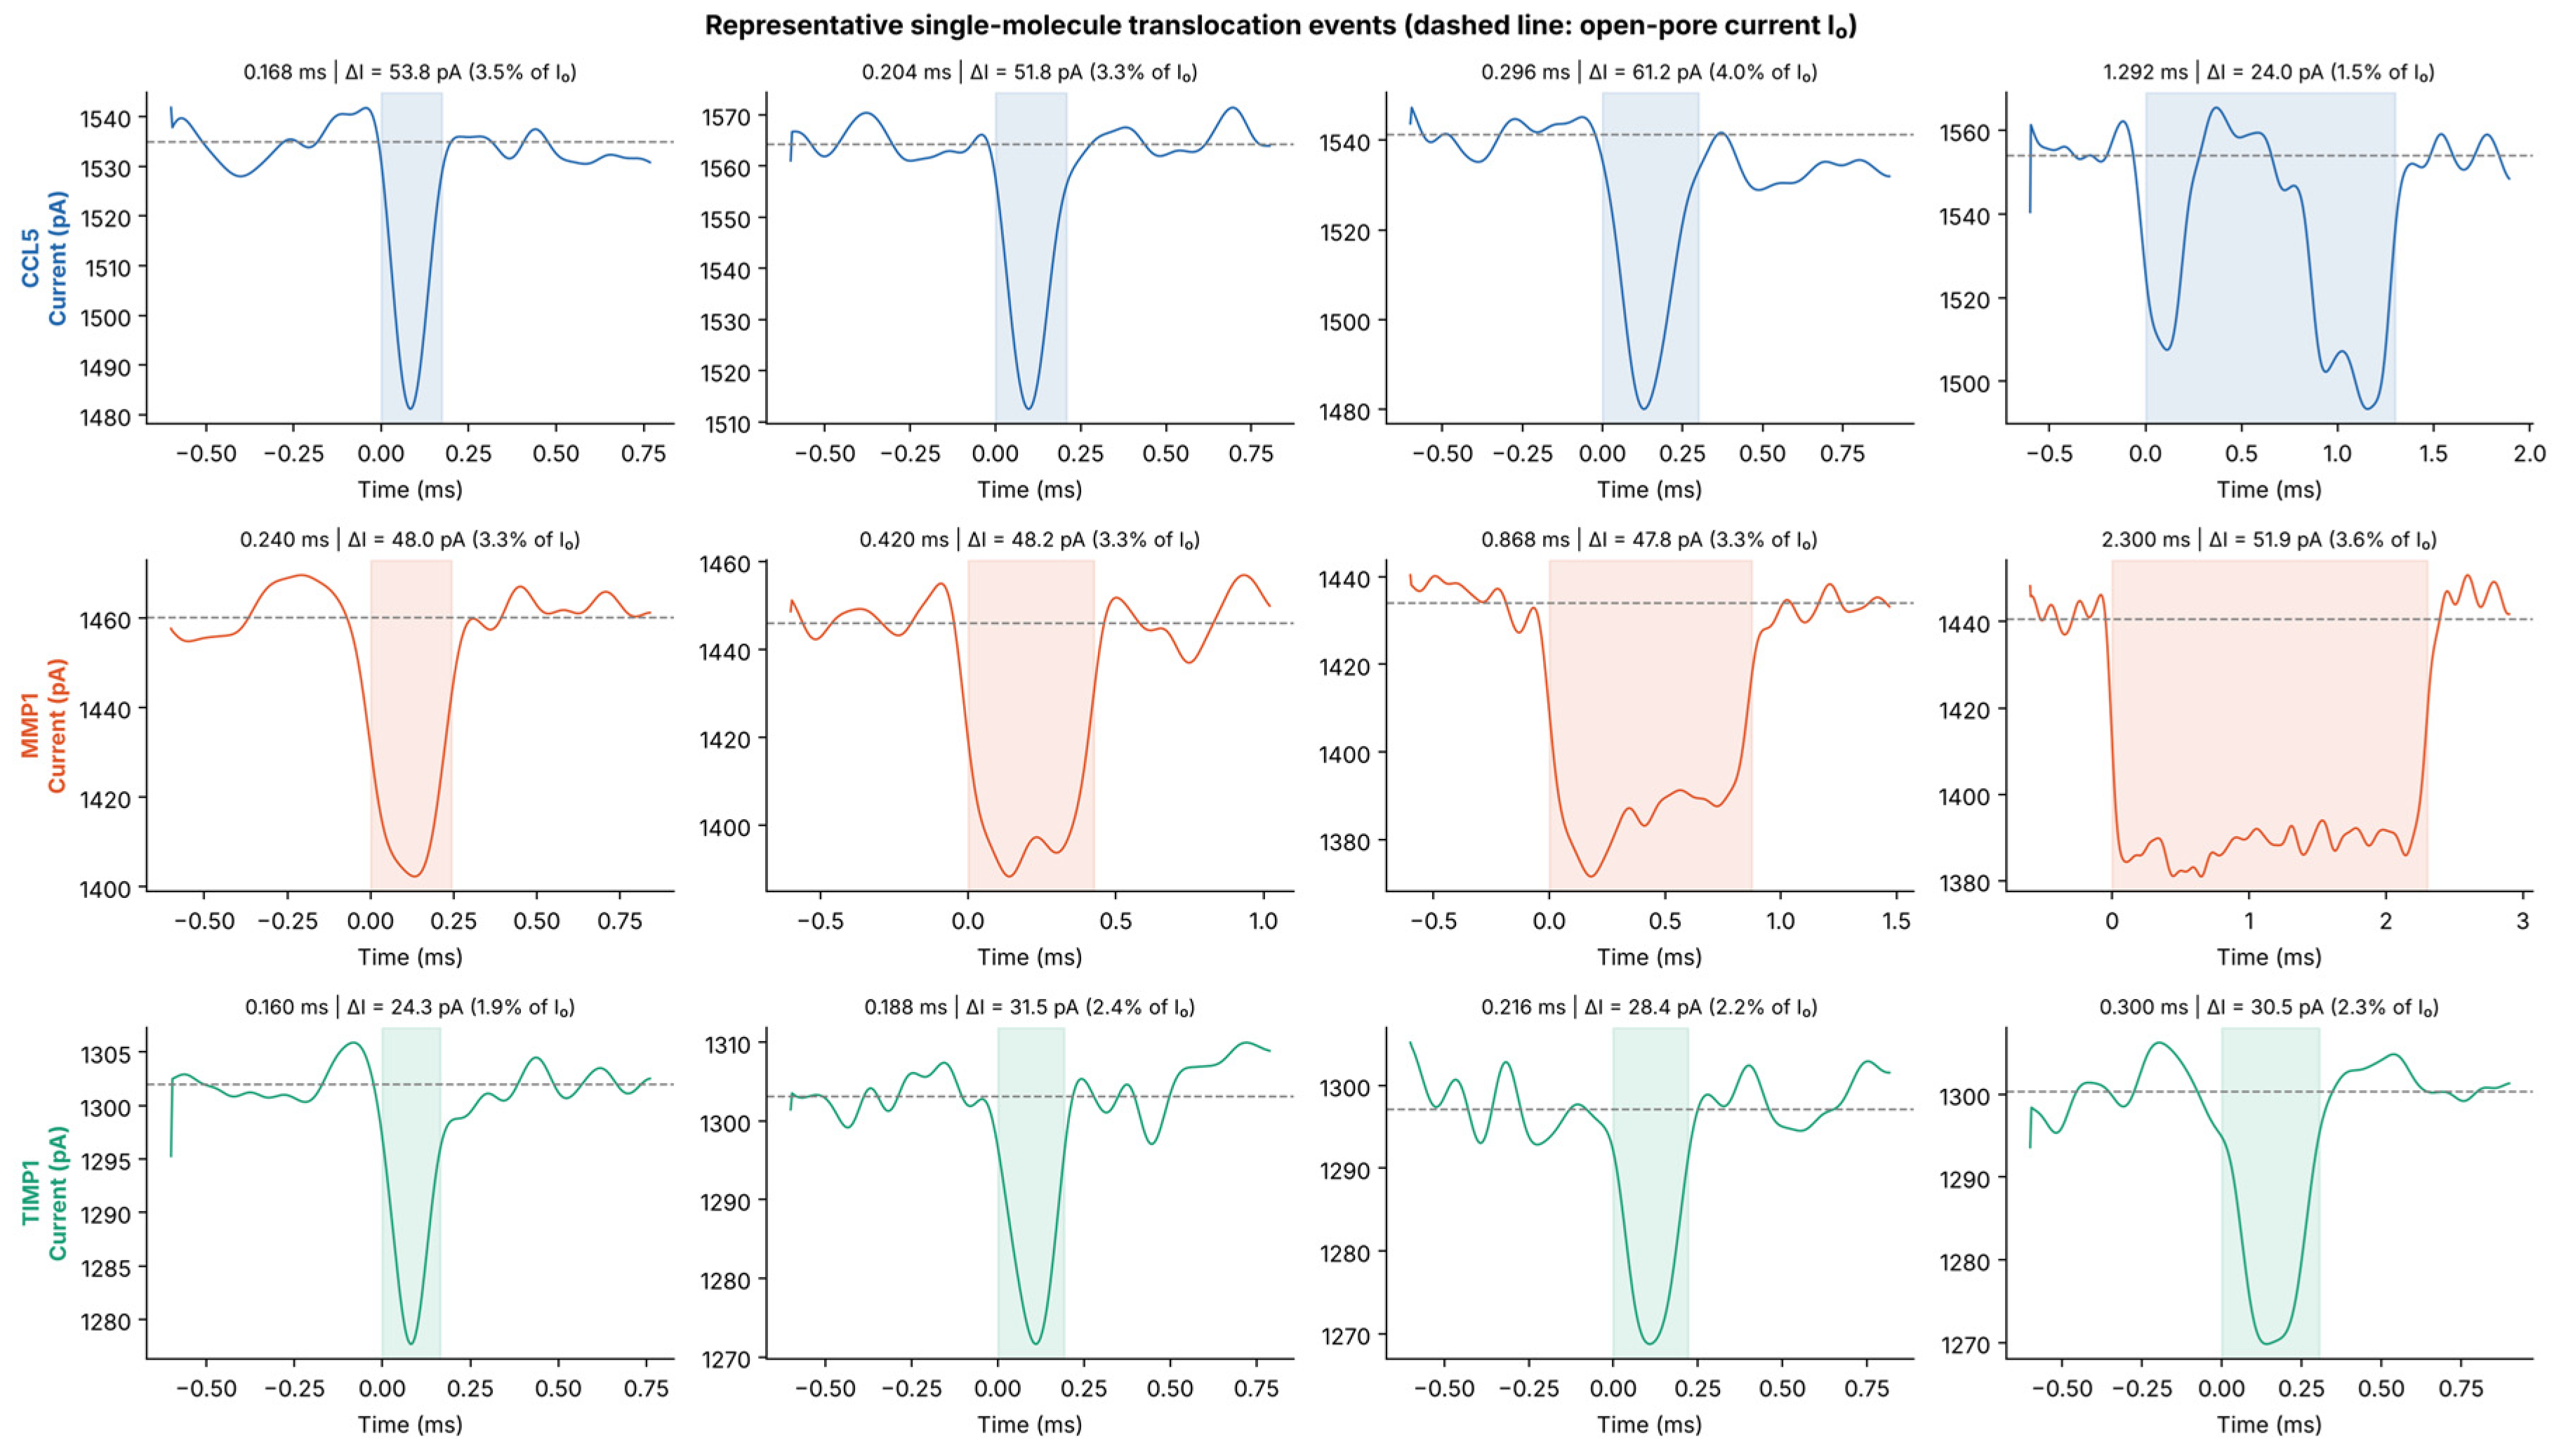
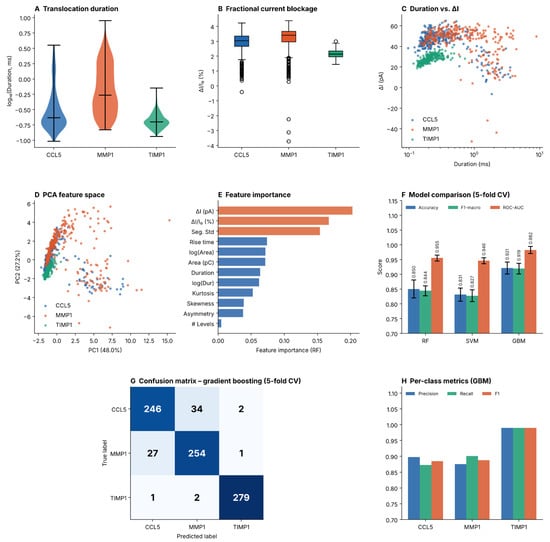
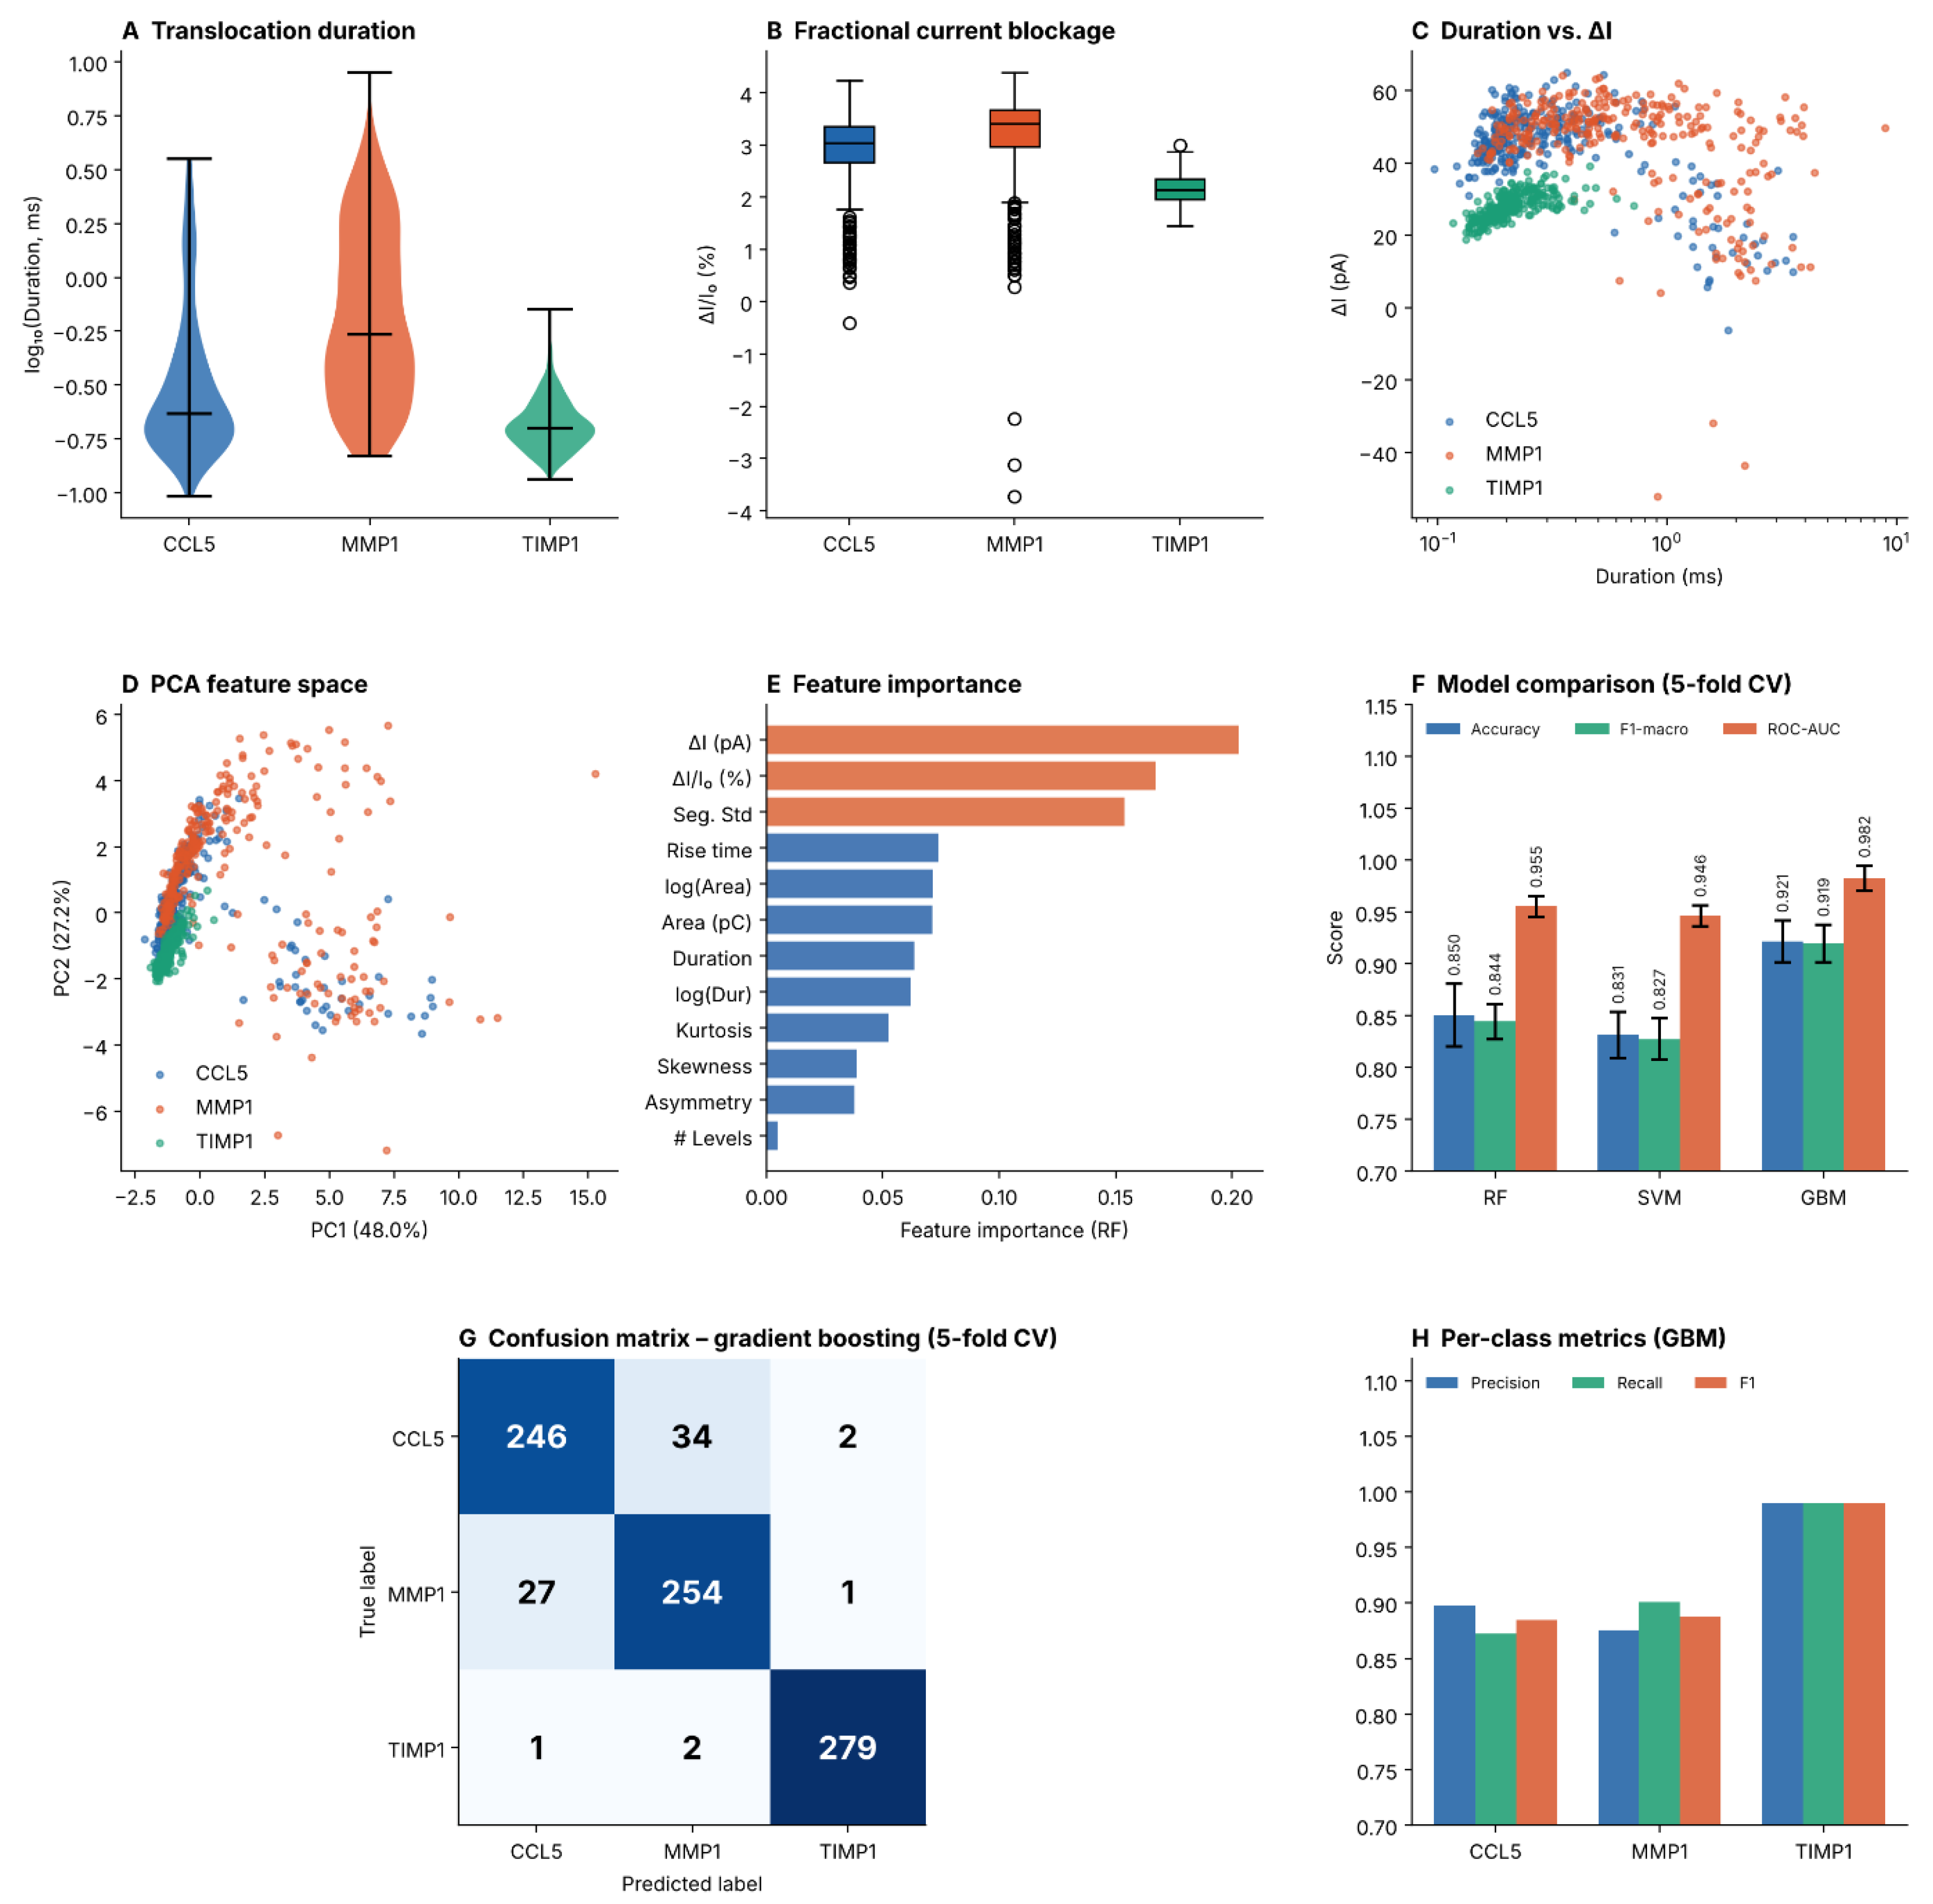
Figure 1 shows representative waveforms: TIMP1 events appear shorter and shallower, whereas CCL5 and MMP1 waveforms overlap considerably. Beyond these visual signatures, our quantitative analysis (Table 1) confirms highly significant variations in their translocation durations (Kruskal–Wallis H = 268.8; p < 0.001) across the examined proteins (Figure 2A). The translocations for TIMP1 occurred with an average duration (mean) of 0.217 ms (median this value is reduced to 0.200 ms) and therefore represent a faster (i.e., TIMP1 faster than CCL5 or MMP1) set of translocation events than CCL5 (with an average of 0.482 ms; median 0.232 ms) or MMP1 (with an average of 1.002 ms; median 0.544 ms). The much longer mean duration of CCL5 and MMP1, when compared to their respective median durations, indicates right-skewed duration distributions with long tails for both proteins, whereas TIMP1 showed a narrower and more symmetric distribution; formal distribution fits are described below.
Figure 1.
Representative single-molecule translocation waveforms for CCL5 (top row, blue), MMP1 (middle row, orange), and TIMP1 (bottom row, green). Four events spanning the duration distribution (15th, 38th, 62nd and 90th percentiles) are shown for each protein. The dashed gray line indicates the baseline open-channel current; the shaded region marks the event window. Event duration, ΔI and ΔI/I0 are annotated above each panel.
Figure 2.
Comprehensive machine learning analysis of nanopore translocation events. (A) Violin plots of log10-transformed translocation duration distributions for CCL5, MMP1, and TIMP1 (n = 282 per class). (B) Box plots of the fractional current blockage ΔI/I0. (C) Scatter plot of ΔI versus duration, color-coded by protein class. (D) PCA projection onto two principal components (PC1: 48.0%, PC2: 27.2% variance explained). (E) Random Forest feature importance ranking; top features shown in orange. (F) Five-fold cross-validation comparison of RF, SVM, and GBM for accuracy, F1-macro, and Macro ROC-AUC. (G) Confusion matrix for GBM predictions under cross-validation (n = 846 events total). (H) Per-class precision, recall, and F1-score for GBM.
To characterize the functional form of the duration distributions, five candidate models were fitted to all detected events of each protein (CCL5, n = 391; MMP1, n = 282; TIMP1, n = 644). The inverse Gaussian (Wald) distribution gave the lowest AIC for CCL5 (AIC 37.6 vs. 61.1 for the lognormal) and MMP1 (492.6 vs. 511.8), whereas the lognormal distribution was preferred for TIMP1 (−1772.9 vs. −1763.7 for the inverse Gaussian); the gamma, Weibull and exponential models were clearly worse (ΔAIC > 60 relative to the best model for every protein). However, the Kolmogorov–Smirnov distances of the best models remained 0.08–0.21, so none of the candidate distributions describes the data adequately. This is not surprising, because the detection threshold truncates short events, durations are quantized at 4 µs, and the 2 kHz filter distorts the shortest events. The fits are therefore descriptive, and no translocation mechanism is inferred from them.
The fractional current blockage ΔI/I0 was small for all three proteins (CCL5: 2.89 ± 0.75%; MMP1: 3.09 ± 1.07%; TIMP1: 2.15 ± 0.27%; absolute ΔI 44.4 ± 11.6, 44.9 ± 15.4 and 28.0 ± 3.6 pA, respectively), with significant overall differences (Kruskal–Wallis H = 311.9 for ΔI/I0 and 341.2 for ΔI, p < 0.001) (Figure 2B; ΔI versus duration is shown in Figure 2C). In Dunn’s post hoc test (Bonferroni-corrected), all pairwise ΔI/I0 differences were significant (p < 0.001), whereas ΔI did not differ between CCL5 and MMP1 (p = 0.27). TIMP1 displayed the shallowest and most consistent blockage (smallest ΔI), whereas CCL5 and MMP1 had similar ΔI although their molecular weights differ about 6.5-fold; ΔI therefore does not scale simply with protein size here. Because TIMP1 events are short (median 0.200 ms) relative to the 2 kHz filter, part of its smaller ΔI may also reflect filter attenuation (Figure 1, bottom row). Event areas, i.e., the charge carried by the total current during the event, mirrored the duration trends: MMP1 events accumulated the largest median area (0.761 pC), while TIMP1 events were smallest (0.256 pC). Because the event area is the integral of the total current, it is approximately I0 × median duration (1538 pA × 0.232 ms = 0.357 pC, 1456 pA × 0.544 ms = 0.792 pC and 1301 pA × 0.200 ms = 0.260 pC for CCL5, MMP1 and TIMP1, respectively), so it is not independent of duration and also carries baseline information. Four events in the balanced subset (three MMP1, one CCL5) showed a negative ΔI, i.e., a mean current above the fitted baseline (Figure 2B,C). Such events are not blockages and are attributed to baseline-fit or level-assignment artifacts, mainly in long events. They were retained so that the balanced dataset was not altered. Because the Kruskal–Wallis and Dunn tests are rank-based, they are essentially unaffected, whereas the standard deviations (in particular the ΔI SD of MMP1) are inflated by these events.
3.2. Principal Component Analysis (PCA)
PCA of the 12-dimensional feature matrix shows partial inter-protein separability via a 2D projection (Figure 2D) with PC1 capturing 48.0% and PC2 capturing 27.2%, resulting in a cumulative total variance of 75.2%. PC1 was dominated by duration-, area- and rise-time-related features (loadings 0.39–0.40), whereas ΔI and ΔI/I0 loaded mainly on PC2 (0.46 each). TIMP1 showed the highest compactness and the most distinct cluster, while CCL5 and MMP1 had some overlap at their distributional boundaries indicating that these two proteins are less separable in the unsupervised feature space.
Unsupervised clustering of the standardized 12-feature matrix gave a consistent picture. With k = 3, k-means and Gaussian mixture models recovered the protein labels only weakly (ARI 0.18 and 0.23; NMI 0.24 and 0.26; silhouette 0.44 and 0.39): 281 of 282 TIMP1 events fell into one cluster, whereas CCL5 and MMP1 events were distributed across all three clusters. The silhouette score was highest for k = 2 (0.60), i.e., the data are more naturally described by a TIMP1-like and a CCL5/MMP1-like population than by three protein-specific clusters. Removing ΔI-related features did not change this result (ARI 0.15 and 0.21).
3.3. Machine Learning Classification Performance
All three classifiers performed well in the classification task (Table 2, Figure 2F). GBM was the top model, achieving an overall accuracy of 92.1 ± 2.0%, a macro F1-score of 0.919, and a macro ROC-AUC of 0.982 in five cross-validation folds. RF reached an accuracy of 85.0 ± 3.0% (macro ROC-AUC 0.955) and the SVM 83.1 ± 2.2% (macro ROC-AUC 0.946).
Per-class precision, recall, and F1-scores derived from GBM cross-validation predictions are summarized in Table 3. TIMP1 was classified almost perfectly (precision and recall 0.99), whereas CCL5 and MMP1 were frequently confused with each other (34 CCL5 events were predicted as MMP1 and 27 MMP1 events as CCL5; precision and recall 0.87–0.90) (Figure 2G,H).
3.4. Feature Importance Analysis
The Random Forest analysis provided feature importance scores (Figure 2E) for the various features, with ΔI (pA) ranked as the most significant feature, contributing 20.3% of the total importance. The second most significant feature was relative blockage depth (ΔI/Io), contributing 16.7% of the total importance, while signal standard deviation contributed 15.4% of the total importance. Collectively, these three features made up about 52% of the predictive capability of the model. Log-transformed event area and untransformed event area contributed an additional 14% to the model’s predictive capability. Although higher-order statistical moments (skewness, kurtosis) and temporal features (rise time, asymmetry) played a smaller role than these other features, they were nonetheless important because they have non-negligible contributions to the overall predictive capability of the model.
Feature importance describes the classifier trained on this dataset and should not be read as evidence that ΔI encodes molecular size: CCL5 and MMP1 had similar ΔI (Dunn’s test, p = 0.27) despite their different molecular weights, and the validation across independent experiments below shows that absolute-current features also carry pipette-specific information. Although geometrical volume exclusion is generally considered a major contributor to ΔI in nanopores, ionic-current signals are governed by competing mechanisms. Counterion-associated conduction along the protein surface can partially offset geometrical blockage and alter signal amplitude [20,21], and changes in local permittivity or capacitance-related effects can also contribute to ionic-current modulation [22].
3.5. Validation Across Independent Experiments
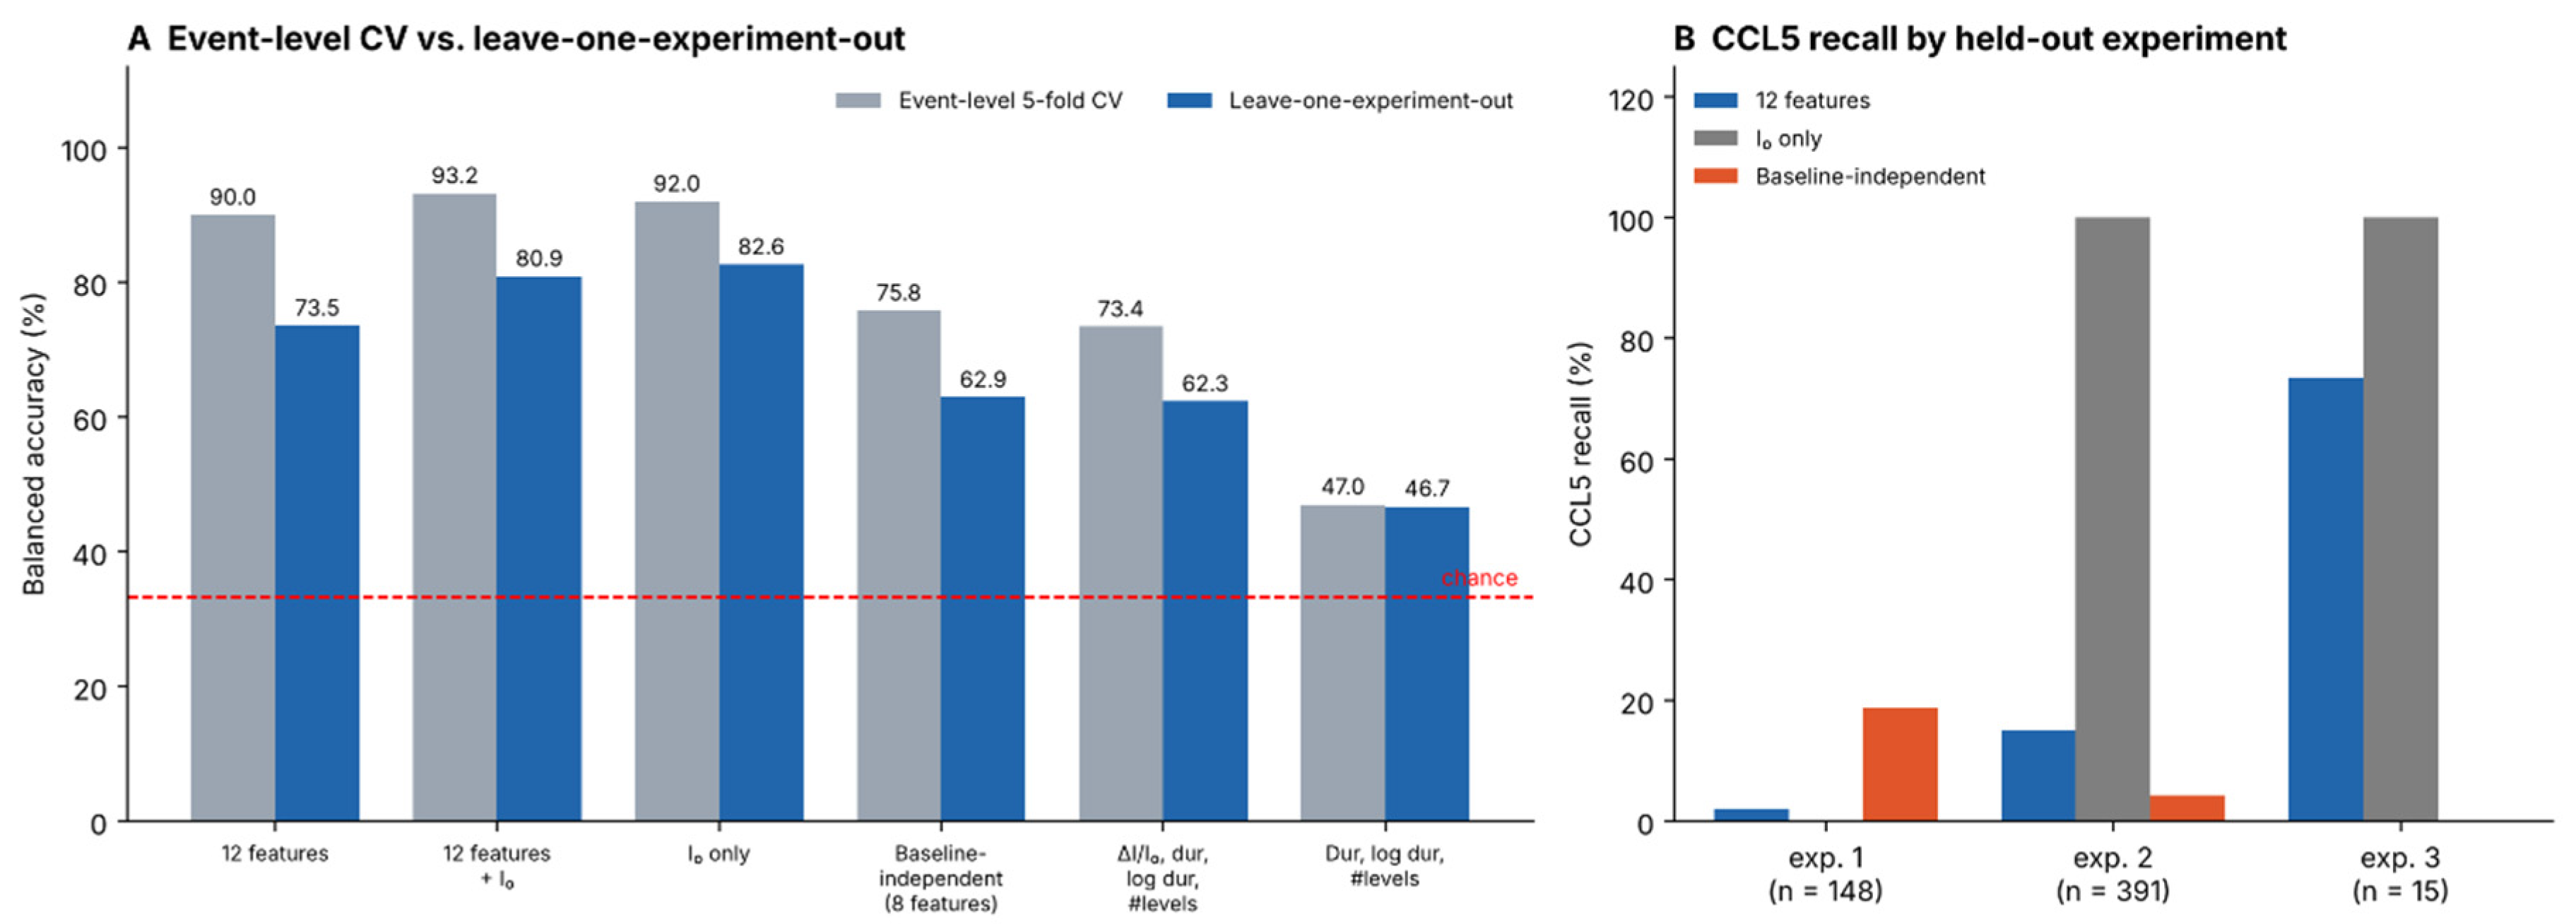
Because event-level cross-validation can place events from the same recording (and nanopipette) in both training and test sets, the classifier was additionally evaluated by leave-one-experiment-out (LOEO) validation, in which each held-out experiment was recorded on a different day and with a different nanopipette than the training experiments (Table 4, Figure 3). The 28 experiments with at least 15 events contained 7095 events (CCL5 554, MMP1 3532, TIMP1 3009). With the same twelve features and the same classifier, balanced accuracy was 90.0% under event-level five-fold cross-validation on this pool but 73.5% under leave-one-experiment-out validation (Table 4, Figure 3); on the 846-event balanced set the same classifier reached 92.8% under event-level cross-validation. In the leave-one-experiment-out analysis, mean recall was 93 ± 17% for MMP1 (16 experiments) and 98 ± 4% for TIMP1 (9 experiments) but only 30 ± 38% for CCL5 (3 experiments with 148, 391 and 15 events: 2%, 15% and 73%, respectively; Figure 3B; the 391-event experiment is the primary CCL5 experiment). The open-pore current I0 alone gave 82.6% balanced accuracy (and 92.0% under event-level cross-validation, i.e., more than the 90.0% obtained with all twelve features), and adding it to the twelve features gave 80.9%. Features that contain no absolute currents (ΔI/I0, duration, log duration, number of levels, rise time, skewness, kurtosis and asymmetry) gave 62.9% (CCL5 recall 8%), ΔI/I0 with duration, log duration and number of levels gave 62.3%, and the kinetic features duration, log duration and number of levels alone gave 46.7%, only moderately above chance (33.3%). Note that ΔI, event area and signal standard deviation, which are expressed in absolute current units, may also carry baseline information, so the twelve-feature set is not free of I0. These results indicate that a substantial part of the separability seen in event-level cross-validation reflects recording- and pipette-specific signal properties, in particular the open-pore current, and that generalization to independent experiments is considerably less certain than the event-level metrics suggest.
Figure 3.
Leave-one-experiment-out validation. (A) Balanced accuracy of event-level five-fold cross-validation (gray) and of leave-one-experiment-out validation (blue) for the same classifier and feature sets; the dashed line marks chance (33.3%). (B) Recall of the three held-out CCL5 experiments for three feature sets.
3.6. Protein-Free Control Recordings
All nanopipettes were tested in protein-free 1× PBS before the protein experiments. To estimate the background event rate, one such control recording per protein, made with the corresponding nanopipette, was analyzed (Table 5); the remaining pipettes were screened in the same way but not analyzed quantitatively. Only 3, 0 and 1 event-like excursions were found (0.03, 0 and 0.01 events/s) for the CCL5, MMP1 and TIMP1 pipettes, respectively, whereas the event rates in the primary protein experiments were 12.19, 2.39 and 5.72 events/s, i.e., higher by point-estimate factors of about 370 (CCL5) and 500 (TIMP1) than in the corresponding controls (no event was found in the MMP1 control); because the control counts are very small, the 95% Poisson upper limits of the control rates (0.10, 0.04 and 0.06 events/s for CCL5, MMP1 and TIMP1) correspond to rate ratios of at least about 125, 60 and 90, respectively. The median rates over all experiments with at least 15 events were 1.42, 2.01 and 0.99 events/s, and the lowest rates (0.17–0.19 events/s for MMP1 and CCL5) were only about five times the highest control rate (0.03 events/s). These controls indicate that the detected events are not produced by the pipette and electrolyte alone. They were, however, recorded before the protein experiments and are short, so they cannot exclude contamination or fouling during the protein recordings. In addition, the control detector (mean depth ≥ 25 pA, duration ≤ 1.5 ms) differs from the CUSUM detection of the protein events and would exclude a fraction of shallow TIMP1-like events (ΔI = 28.0 ± 3.6 pA) and of long MMP1-like events (duration 1.002 ± 1.033 ms), so the fold-differences above are approximate.
4. Discussion
The findings indicate that, within the recorded experiments, translocation signal characteristics allow CCL5, MMP1 and TIMP1 to be differentiated by a gradient boosting classifier with good accuracy (92.1% under event-level cross-validation) using a relatively small set of 12 features; this separability, however, only partly generalized to held-out experiments (see below). These results are consistent with previous studies of ML applied to protein sensing using nanopores [10,23].
The classification performance under event-level cross-validation (accuracy 92.1%, macro ROC-AUC 0.982) is encouraging given that the three proteins differ substantially in molecular weight (approximately 8, 28, and 52 kDa). Although larger proteins might be expected to cause progressively deeper and longer blockages, the order observed here was not monotonic in molecular weight: MMP1 (~52 kDa) produced the longest events, but TIMP1 (~28 kDa) produced the shallowest and shortest events, and CCL5 (~8 kDa) produced deeper and longer events than TIMP1. The classification presented here is therefore a first step. It supports the feasibility of our event-detection workflow and machine-learning pipeline, providing a starting point before tackling the much harder problem of fingerprinting isobaric proteins or species with highly similar molecular weights. ΔI and ΔI/I0 were the two most important features, but because CCL5 and MMP1 showed similar ΔI despite a ~6.5-fold difference in molecular weight, ΔI does not scale simply with protein size and also depends on the pipette and its open-pore current. Signal standard deviation may reflect additional event dynamics, for example rotational tumbling, partial unfolding or multiple pathways through the nanopipette, which could contribute to increased current noise within individual events; these possibilities were not tested here. Importantly, because the three proteins differ markedly in size and the open-pore current differed among the protein datasets, part of the separability reported here may be attributable to molecular-size differences and part to pipette- or session-specific signal properties, and the present closed-set classifier would assign any unseen protein to one of the three trained classes. Demonstrating selectivity therefore requires further tests with a protein of similar molecular weight, with proteins absent from the training set, and with mixtures at different molar ratios, which we plan as follow-up work.
One informative aspect is the difference between the three translocation duration distributions. Of all the observed species, TIMP1 showed not only the shortest median time but also a much narrower distribution (SD: 0.072 ms), which may indicate a more uniform translocation geometry and is compatible with a compact, rigid fold. Although CCL5 and MMP1 are the lowest- and highest-molecular-weight proteins, respectively, they showed markedly larger duration variability, which may be associated with conformational flexibility or multiple modes of translocation (Figure 1, middle and top rows). Multi-domain or conformationally flexible proteins could, in principle, adopt different orientations or partially unfold inside the nanopipette. These interpretations are hypotheses consistent with the data rather than direct observations, because protein conformation, orientation and unfolding were not measured here.
The higher cross-validated accuracy of GBM over RF and SVM may be consistent with its well-documented advantages on tabular/feature-based datasets: sequential error correction, implicit feature selection through gradient descent, and robustness to feature scale heterogeneity. The SVM’s slightly lower performance may reflect non-linear boundaries between protein clusters in feature space that are better approximated by the higher-capacity GBM ensemble; given the leave-one-experiment-out results, however, the ranking of classifiers under event-level cross-validation should not be over-interpreted.
The LOEO results (Table 4, Figure 3) provide a more stringent test than event-level cross-validation. Using the same twelve features and classifier, balanced accuracy fell from 90.0% under event-level cross-validation to 73.5% when whole experiments were held out, and the mean CCL5 recall over the three held-out experiments was only 30% (roughly 13% when weighted by the number of events). The open-pore current alone gave 82.6% balanced accuracy (92.0% under event-level cross-validation, compared with 90.0% for all twelve features), close to the 80.9% obtained with the twelve features plus I0, which indicates that in this dataset a large part of the discriminating information reflects the baseline of each pipette rather than molecular properties; ΔI, event area and signal standard deviation may carry such information as well. Pipettes were used when their open-pore currents in protein-free PBS were within approximately ±10% of a reference value of 1400 pA, and the mean I0 values in the protein experiments (1538, 1456 and 1301 pA) deviate from this reference by +9.9%, +4.0% and −7.1%, respectively, i.e., they lie at the limit of this acceptance range. The mean I0 of the individual experiments with at least 15 events ranged from 1454 to 1635 pA for CCL5, 1429 to 1515 pA for MMP1 and 1285 to 1302 pA for TIMP1; relative to 1400 pA, the experiment-level means span −8% to +17% (1285–1635 pA), so the upper end of the CCL5 range exceeds the ±10% acceptance range, which was applied to PBS recordings before the experiments, whereas the I0 values reported here were measured in the protein solution. Part of this difference may therefore reflect pipette-to-pipette variability within and beyond the acceptance range; in addition, I0 changed after the transition from PBS to the protein solution and over the course of a recording. These effects are not related to the translocating molecule and were not analyzed systematically here. The I0 of the TIMP1 experiments varied by only about 1% (1285–1302 pA), compared with about 12% for CCL5 (1454–1635 pA), which suggests that the I0 differences among the protein datasets may be related to pipette fabrication (e.g., the tip geometry of the pipettes made for each protein); because fabrication dates and batches were not recorded, this could not be tested. The apparent separability therefore cannot be attributed to the translocation signals of the proteins alone. When only features without absolute currents were used, balanced accuracy fell to 63% (47% with kinetic features alone), and the mean CCL5 recall was only 8%. Because each held-out experiment was recorded on a different day with a different nanopipette, the LOEO result reflects generalization across nanopipettes and days. The main remaining limitation of the present proof-of-concept, namely that chronology and fabrication batches were not recorded and that prospectively fabricated nanopipettes have not been tested, is described under Limitations below. The near absence of events in protein-free controls (Table 5) nevertheless indicates that the detected events are associated with the protein rather than with the pipette and electrolyte alone, although the controls come from only three pipettes and were recorded before the protein experiments.
Beyond supervised classification, unsupervised clustering has been used to group single-molecule events without prior labels, for example vector-based fuzzy clustering of single-molecule charge-transport traces [24], wavelet-transform-based clustering of single-molecule junction dynamics [25], and Gaussian mixture and spectral clustering of resistive-pulse events from viral capsids [14]. The first two concern single-molecule junction measurements rather than nanopore recordings, so they provide methodological context rather than direct validation of the present approach. In our data, k-means and Gaussian mixture clustering separated TIMP1 but not CCL5 and MMP1, and benchmarking the pipeline on simulated mixtures of translocation waveforms with known ground truth is a natural next step.
From an applied standpoint, and provided that generalization to independent nanopipettes can be demonstrated, the classification framework could in the future be integrated into an analysis pipeline for label-free protein identification in research contexts; it is not a validated diagnostic method. Trained GBM models are computationally light, so classification of already extracted features is unlikely to be rate-limiting in principle; inference and feature-extraction times were, however, not measured here. Extension of this approach to multiplex detection in protein mixtures is a possible next step, requiring development of mixture deconvolution algorithms operating on multi-feature event distributions.
Limitations
There are several major limitations that need to be taken into account. First, our data were collected in a single electrolyte (1× PBS) and with nanopipettes of one nominal geometry; the applicability of these data to other pore geometries or electrolyte compositions needs to be studied further to learn what types of relationships exist (voltage dependence is addressed in item (ii) below). Additionally, we recognize that the protein-free control recordings were short (90 s each) and were acquired before, not during, the protein experiments, which limits our ability to completely definitively rule out progressive pore fouling or transient baseline instability, although OpenNanopore’s CUSUM algorithm heavily mitigates the latter. Furthermore, given that some events (especially for TIMP1) exhibit median durations of ~0.200 ms, the 2 kHz analog Bessel filter applied before digitization at 250 kHz (10–90% rise time ≈ 0.17 ms), which is comparable to the shortest event durations, may lead to the attenuation of the fastest ultra-short events or minor distortions in apparent current amplitude, and because the shortest events are attenuated most strongly, the smaller ΔI of TIMP1 may partly reflect filtering rather than molecular size alone [26,27]. Future instrumentational setups with higher bandwidths are required to fully capture these microsecond-scale dynamics. Finally, the analysis does not correct for the possibility that each unique sample might constitute more than one protein molecule because we have assumed that each defined event in our dataset is representative of a single molecule (and some events, e.g., the 12–21% of CCL5 and MMP1 events with more than one current level (Table 1), may represent compound events caused by aggregation and/or transient interactions among proteins, which make it difficult to assign individual samples); therefore, future investigations should develop a rejection process for removing outlying events. In addition, the following limitations apply. (i) the chronological order and fabrication batches of the experiments were not recorded, so time-dependent drift and batch effects were not assessed (the main limitation of this study), and testing of the classifier on prospectively fabricated nanopipettes remains to be demonstrated. (ii) a relatively high potential (0.7 V) was used. Lower potentials generally better preserve the native structure of biomolecules, and because only one voltage was tested, voltage-induced deformation or unfolding cannot be excluded as a contributor to the observed duration variability; voltage-dependent measurements are planned. (iii) each protein was measured individually at a single concentration (50 pM). A calibration curve relating event frequency to protein concentration, together with the limit of detection and dynamic range, is a key requirement for a biosensor and will be addressed in future work. (iv) protein mixtures, a fourth protein of similar molecular weight and proteins absent from the training set were not measured, and selectivity has therefore not been established; these experiments require new measurements and are beyond the scope of this proof-of-concept study.
5. Conclusions
We have shown, as a proof of concept, that machine learning-based classification of nanopipette ionic current translocation signatures can discriminate three clinically relevant proteins—CCL5, MMP1, and TIMP1—within the recorded dataset, with a gradient boosting classifier achieving 92.1% accuracy and a macro ROC-AUC of 0.982 under event-level five-fold cross-validation. Accuracy was lower and more variable when entire experiments were held out (balanced accuracy 73.5% with the same features and 63% without baseline-related features, with a mean CCL5 recall of 30% over three held-out experiments; the open-pore current alone gave 92.0% and 82.6% under event-level and leave-one-experiment-out validation, respectively). Feature importance analysis identified the absolute and relative current drop as the most informative features, although these also depend on the pipette and its open-pore current. This work provides a proof-of-concept computational framework for nanopipette-based protein fingerprinting and provides a starting point for future work on nanopipette-based protein identification, which will require validation with independent nanopipettes, protein mixtures and unknown proteins.
Funding
This research was funded by the Scientific Research Projects Coordination Unit (BAP) of Bursa Uludağ University, grant numbers FGA-2024-1745 and FAY-2024-1777.
Data Availability Statement
The data that support the findings of this study are available upon request from the corresponding author. This includes the per-event feature tables (balanced dataset and per-experiment tables), the protein-free control recordings and the Python code used for feature extraction, statistical analysis, distribution fitting, clustering and classification.
Acknowledgments
During the preparation of this manuscript, the author used Grammarly (version 14.1342.0; Grammarly, Inc., San Francisco, CA, USA) and Claude Opus 5.5 (Anthropic PBC, San Francisco, CA, USA) solely for English grammar checking and text polishing purposes.
Conflicts of Interest
The author declares no conflicts of interest.
References
- Barbosa, A.I.; Reis, N.M. A critical insight into the development pipeline of microfluidic immunoassay devices for the sensitive quantitation of protein biomarkers at the point of care. Analyst 2017, 142, 858–882. [Google Scholar] [CrossRef] [Scilit] [PubMed]
- Kim, J.; Jeong, J.; Ko, S.H. Electrochemical biosensors for point-of-care testing. Bio-Des. Manuf. 2024, 7, 548–565. [Google Scholar] [CrossRef] [Scilit]
- Shrikrishna, N.S.; Gandhi, S. Nanopore-based sensing for biomarker detection: From fundamental principles to translational diagnostics. J. Nanobiotechnol. 2025, 23, 663. [Google Scholar] [CrossRef] [Scilit] [PubMed]
- Arter, W.E.; Charmet, J.; Kong, J.; Saar, K.L.; Herling, T.W.; Müller, T.; Keyser, U.F.; Knowles, T.P.J. Combining affinity selection and specific ion mobility for microchip protein sensing. Anal. Chem. 2018, 90, 10302–10310. [Google Scholar] [CrossRef] [Scilit] [PubMed]
- Deamer, D.; Akeson, M.; Branton, D. Three decades of nanopore sequencing. Nat. Biotechnol. 2016, 34, 518–524. [Google Scholar] [CrossRef] [Scilit] [PubMed]
- Gu, L.-Q.; Shim, J.W. Single molecule sensing by nanopores and nanopore devices. Analyst 2010, 135, 441–451. [Google Scholar] [CrossRef] [Scilit] [PubMed]
- Oukhaled, A.; Bacri, L.; Pastoriza-Gallego, M.; Betton, J.-M.; Pelta, J. Sensing proteins through nanopores: Fundamental to applications. ACS Chem. Biol. 2012, 7, 1935–1949. [Google Scholar] [CrossRef] [Scilit] [PubMed]
- Li, P.; Liang, D.; Yang, E.; Zeb, M.; Huang, H.; Sun, H.; Zhang, W.; Peng, C.; Zhao, Y.; Ma, W. Bio-nanopore technology for biomolecules detection. Adv. Biotechnol. 2024, 2, 45. [Google Scholar] [CrossRef] [Scilit] [PubMed]
- Bearden, S.; Abramyan, T.M.; Gil, D.; Johnson, J.; Murashko, A.; Makaev, S.; Mai, D.; Baranchikov, A.; Ivanov, V.; Reukov, V.; et al. Resolving the size and charge of small particles: A predictive model of nanopore mechanics. J. Phys. Chem. C 2024, 128, 17619–17630. [Google Scholar] [CrossRef] [Scilit] [PubMed]
- Wan, Y.K.; Hendra, C.; Pratanwanich, P.N.; Göke, J. Beyond sequencing: Machine learning algorithms extract biology hidden in nanopore signal data. Trends Genet. 2022, 38, 246–257. [Google Scholar] [CrossRef] [Scilit] [PubMed]
- Breiman, L. Random forests. Mach. Learn. 2001, 45, 5–32. [Google Scholar] [CrossRef] [Scilit]
- Cortes, C.; Vapnik, V. Support-vector networks. Mach. Learn. 1995, 20, 273–297. [Google Scholar] [CrossRef] [Scilit]
- Friedman, J.H. Greedy function approximation: A gradient boosting machine. Ann. Stat. 2001, 29, 1189–1232. [Google Scholar] [CrossRef] [Scilit]
- Renkes, S.; Gray, S.J.; Kim, M.; Alexandrakis, G. Plasmonic nanopore sensing to probe the DNA loading status of adeno-associated viruses. Chemosensors 2025, 13, 418. [Google Scholar] [CrossRef] [Scilit] [PubMed]
- Hernández Parra, L.M.; Azzaroni, O.; Marmisollé, W.A. Enzyme-based single solid-state nanochannel biosensors. Chemosensors 2025, 13, 275. [Google Scholar] [CrossRef] [Scilit]
- Demirtas, M. Enhancing the sensitivity of nanopipette biosensors for protein analysis. Brain Behav. 2024, 14, e3405. [Google Scholar] [CrossRef] [Scilit]
- Raillon, C.; Granjon, P.; Graf, M.; Steinbock, L.J.; Radenovic, A. Fast and automatic processing of multi-level events in nanopore translocation experiments. Nanoscale 2012, 4, 4916–4924. [Google Scholar] [CrossRef] [Scilit] [PubMed]
- Yu, L.; Kang, X.; Li, F.; Mehrafrooz, B.; Makhamreh, A.; Fallahi, A.; Foster, J.C.; Aksimentiev, A.; Chen, M.; Wanunu, M. Unidirectional single-file transport of full-length proteins through a nanopore. Nat. Biotechnol. 2023, 41, 1130–1139. [Google Scholar] [CrossRef] [Scilit] [PubMed]
- Pedregosa, F.; Varoquaux, G.; Gramfort, A.; Michel, V.; Thirion, B.; Grisel, O.; Blondel, M.; Prettenhofer, P.; Weiss, R.; Dubourg, V.; et al. Scikit-learn: Machine learning in Python. J. Mach. Learn. Res. 2011, 12, 2825–2830. [Google Scholar]
- Bandara, Y.M.N.D.Y.; Farajpour, N.; Freedman, K.J. Nanopore current enhancements lack protein charge dependence and elucidate maximum unfolding at protein’s isoelectric point. J. Am. Chem. Soc. 2022, 144, 3063–3073. [Google Scholar] [CrossRef] [Scilit] [PubMed]
- Smeets, R.M.M.; Keyser, U.F.; Krapf, D.; Wu, M.-Y.; Dekker, N.H.; Dekker, C. Salt dependence of ion transport and DNA translocation through solid-state nanopores. Nano Lett. 2006, 6, 89–95. [Google Scholar] [CrossRef] [Scilit] [PubMed]
- Tsutsui, M.; Yokota, K.; He, Y.; Kawai, T. Ionic signal amplification of DNA in a nanopore. Small Methods 2022, 6, 2200761. [Google Scholar] [CrossRef] [Scilit] [PubMed]
- Baaken, G.; Ankri, N.; Schuler, A.-K.; Ruhe, J.; Behrends, J.C. Nanopore-based single-molecule mass spectrometry on a lipid membrane microarray. ACS Nano 2011, 5, 8080–8088. [Google Scholar] [CrossRef] [Scilit] [PubMed]
- Lemmer, M.; Inkpen, M.S.; Kornysheva, K.; Long, N.J.; Albrecht, T. Unsupervised vector-based classification of single-molecule charge transport data. Nat. Commun. 2016, 7, 12922. [Google Scholar] [CrossRef] [Scilit] [PubMed]
- Li, D.; Wang, H.; Zuo, X.; Deng, W.; Luo, S.; Wang, M.; Chen, L.; Zhao, X.; Xiang, D. Wavelet transform-based clustering decoding the dynamical properties of single molecular junctions. J. Phys. Chem. Lett. 2026, 17, 2601–2609. [Google Scholar] [CrossRef] [Scilit] [PubMed]
- Tsutsui, M.; Wada, M.; Arima, A.; Tsunekawa, Y.; Sasaki, T.; Sakamoto, K.; Yokota, K.; Baba, Y.; Kawai, T.; Okada, T. Identifying viral vector characteristics by nanopore sensing. ACS Nano 2024, 18, 15695–15704. [Google Scholar] [CrossRef] [Scilit] [PubMed]
- Plesa, C.; Kowalczyk, S.W.; Zinsmeester, R.; Grosberg, A.Y.; Rabin, Y.; Dekker, C. Fast translocation of proteins through solid state nanopores. Nano Lett. 2013, 13, 658–663. [Google Scholar] [CrossRef] [Scilit] [PubMed]

Disclaimer/Publisher’s Note: The statements, opinions and data contained in all publications are solely those of the individual author(s) and contributor(s) and not of MDPI and/or the editor(s). MDPI and/or the editor(s) disclaim responsibility for any injury to people or property resulting from any ideas, methods, instructions or products referred to in the content. |
© 2026 by the author. Licensee MDPI, Basel, Switzerland. This article is an open access article distributed under the terms and conditions of the Creative Commons Attribution (CC BY) license.