


Abstract
Background/Objectives: Recognizing the types and intensity of everyday emotions helps people articulate distress and seek support. Community assessment therefore needs to describe coexisting emotions alongside specific symptoms. The Core Seven-Emotions Inventory–Short Form (CSEI-s), developed and initially validated in Korea, draws on traditional Korean medicine’s Seven Emotions framework. However, references for interpreting scores across adult age groups remain limited. This study explored sample-based references for multidimensional emotional profiles. Methods: A cross-sectional online survey included 1769 adults aged 20–65 years recruited through non-probability sampling across 17 Korean regions. Subscale percentile ranks, linear T scores, and measurement-error estimates were derived. Internal consistency, factor structure, and demographic differences were examined. Results: Subscale Cronbach’s α ranged from 0.736 to 0.900. A score of 12 corresponded to percentile ranks of 48.8 for Rumination/Pensiveness and 82.5 for Anger. Older groups generally reported lower scores. The correlated seven-factor model outperformed the alternatives without reaching adequate fit, and exploratory structural equation modeling revealed cross-loadings and poor separation of Fear from Fright. Conclusions: These preliminary references locate observed subscale scores within a defined sample. They are sample-based, non-diagnostic resources, not population norms or clinical thresholds, and individual interpretation awaits further validation.
1. Introduction
Emotion, feeling, and mood are interrelated but conceptually distinguishable [1,2,3]. Emotion refers to a relatively brief bodily and behavioral response to a particular stimulus, whereas feeling denotes the conscious, subjective experience of that response; mood is a more enduring affective state without a clearly defined object [2,3,4]. Affective atmosphere encompasses the emotional context formed through interactions between individuals and their environment [5]. In everyday life, these experiences overlap, and individuals often describe their state broadly as feeling good or feeling bad. A report of feeling bad may encompass anger, sadness, anxiety, and fear at different intensities [1,3]. Understanding emotional experience therefore benefits from a multidimensional profile that identifies specific emotional components and their relative prominence.
Brief symptom measures such as the Patient Health Questionnaire-9 (PHQ-9) and the Generalized Anxiety Disorder-7 (GAD-7) support the identification of probable depression or generalized anxiety disorder and assessment of symptom severity [6,7]. Such measures are valuable for screening and grading the severity of a specific problem, but they are less suited to depicting the composition and relative levels of multiple co-occurring emotions as an integrated profile. This limitation is particularly relevant in the digital era, in which complex affective states are often compressed into a restricted vocabulary of emotion words, emojis or short sentences [8]. Moreover, the same emotional expression may be produced and interpreted differently depending on social and relational contexts [8]. A culturally grounded multidimensional measure may help address this gap.
The Seven Emotions (chiljeong, 七情: 喜 [Joy], 怒 [Anger], 思 [Rumination/Pensiveness], 憂 [Melancholy], 悲 [Sorrow], 恐 [Fear], and 驚 [Fright]) theory in traditional Korean medicine provides a culturally situated framework for understanding complex emotional experience [9]. It conceptualizes emotions as interrelated responses involving mind and body, rather than mutually exclusive reactions. The seven domains are Joy, Anger, Rumination/Pensiveness, Melancholy, Sorrow, Fear, and Fright. Rumination/Pensiveness covers repetitive or absorbed thinking, everyday worry included. Melancholy concerns low motivation and a hopeless outlook, and Sorrow concerns sadness and loneliness. Fear refers to timidity and apprehension; Fright refers to being easily startled. Building on this framework, Lee et al. developed the 100-item Core Seven-Emotions Inventory (CSEI) [9,10]. Its length, however, may increase respondent burden in primary healthcare or repeated assessments. Cheong et al. developed the 28-item CSEI-s, with four items per domain, and reported initial validity evidence [11]. Because that study involved 178 predominantly young adults, examination in a broader community age range was needed. A subsequent preliminary standardization survey in a separate sample examined reliability and associations with external measures and reinforced the need for a larger main survey [12].
Practical use of the instrument requires empirical distributions for interpreting individual scores and evidence about its measurement properties in a larger sample. A clearly defined reference group and estimates of measurement error help place raw scores in context [13]. The Guidelines for Reporting on Norm-Referenced and Criterion-Referenced Scores (GRoNC) recommend reporting sample representativeness, score transformations, and estimation uncertainty [14]. Reference values for a culturally grounded measure can support community research and subsequent cross-cultural investigation.
This study explored sample-based reference values for the CSEI-s as groundwork for future standardization. Using a non-probability community sample recruited across Korea (N = 1769), we derived empirical percentile ranks and linear T scores. We also examined the correlated seven-factor structure, internal consistency, and comparability across sex and age groups to clarify the interpretation of those reference values. Following GRoNC principles, we report the reference sample’s characteristics, the uncertainty in percentile estimates, standard errors of measurement (SEM), and principles for interpreting individual profiles [14]. A percentile rank indicates how common a score was among the surveyed adults, and a T score expresses its distance from the sample mean; neither conveys psychological or clinical significance.
The study addressed the following research questions:
- (1)
- What factor structure and item-level structural characteristics are observed for the CSEI-s?
- (2)
- What level of internal consistency is observed for its seven subscales?
- (3)
- To what extent are factor-loading relationships comparable across sex and age groups?
- (4)
- What patterns of differential item functioning (DIF) and observed score differences occur by sex and age?
- (5)
- What sample-based reference values and interpretive guidance can be provided from the raw-score distributions and measurement-error estimates, and how sensitive are these values to demographic calibration?
The reference tables allow researchers to interpret each emotional domain against its own score distribution and may support studies of emotional assessment in community, primary care, and digital health settings.
2. Materials and Methods
2.1. Study Design and Ethical Approval
This planned exploratory cross-sectional study examined CSEI-s reference values in a non-probability community sample. The Institutional Review Board of Wonkwang University approved the study on 21 December 2021 (WKUIRB-202112-SB-109). The web questionnaire was prepared in January 2022. Expert screen-layout review and technical compatibility pre-testing were performed in February 2022 to verify display functionality across standard web browsers and devices. Data were collected from 1 March to 30 March 2022 (closing at 23:59 KST), through a professional online research provider (Kstat Research, Seoul, Republic of Korea). The survey formed part of a multi-institutional project run on a year-by-year plan. The preliminary survey was analyzed and published first [12], and the main-survey analyses presented here, covering structure, invariance, and reference values, were carried out afterwards. The provider enforced user authentication, standard SSL encryption, and platform privacy protocols. Participants provided electronic informed consent via the initial screening interface before entering the survey. The questionnaire consisted of 39 items, four demographic items (sex, age, education, region), the 28 CSEI-s items, and seven concurrent emotion ratings, presented in a fixed order across four sequential web screens on desktop and five on mobile devices without adaptive branching or randomization. Responses were not forced; respondents could leave items unanswered and were permitted to use back-navigation to review and modify their answers prior to final submission. Reporting follows the applicable Strengthening the Reporting of Observational Studies in Epidemiology (STROBE) items [15] and the principles of GRoNC [14].
2.2. Participants and Data Cleaning
The target population comprised adults aged 20–65 years residing in the Republic of Korea. Participants were recruited from a closed, professional online panel using non-probability regional quotas reflecting the population distribution across all 17 metropolitan cities and provinces. Panelists were invited via the provider’s standard survey notifications and opt-in emails. To prevent duplicate submissions, the survey platform verified unique member IDs alongside IP address tracking and browser session controls. Upon survey completion, participants received standard panel reward points (equivalent to approximately KRW 1500 [~USD 1.20]) in accordance with the survey provider’s routine policy.
The recruitment target was 2000 analyzable responses, with 2100 respondents recruited to allow for exclusions. This target supported description of score distributions across demographic groups and regions. Under an independent-sampling binomial approximation, N = 2000 gives a 95% interval half-width of about 1.0 percentage point around a proportion of 0.05 or 0.95, compared with about 2.5 percentage points at n = 300 (illustrative only; not a population margin of error).
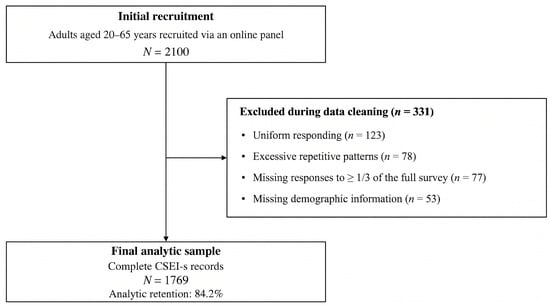
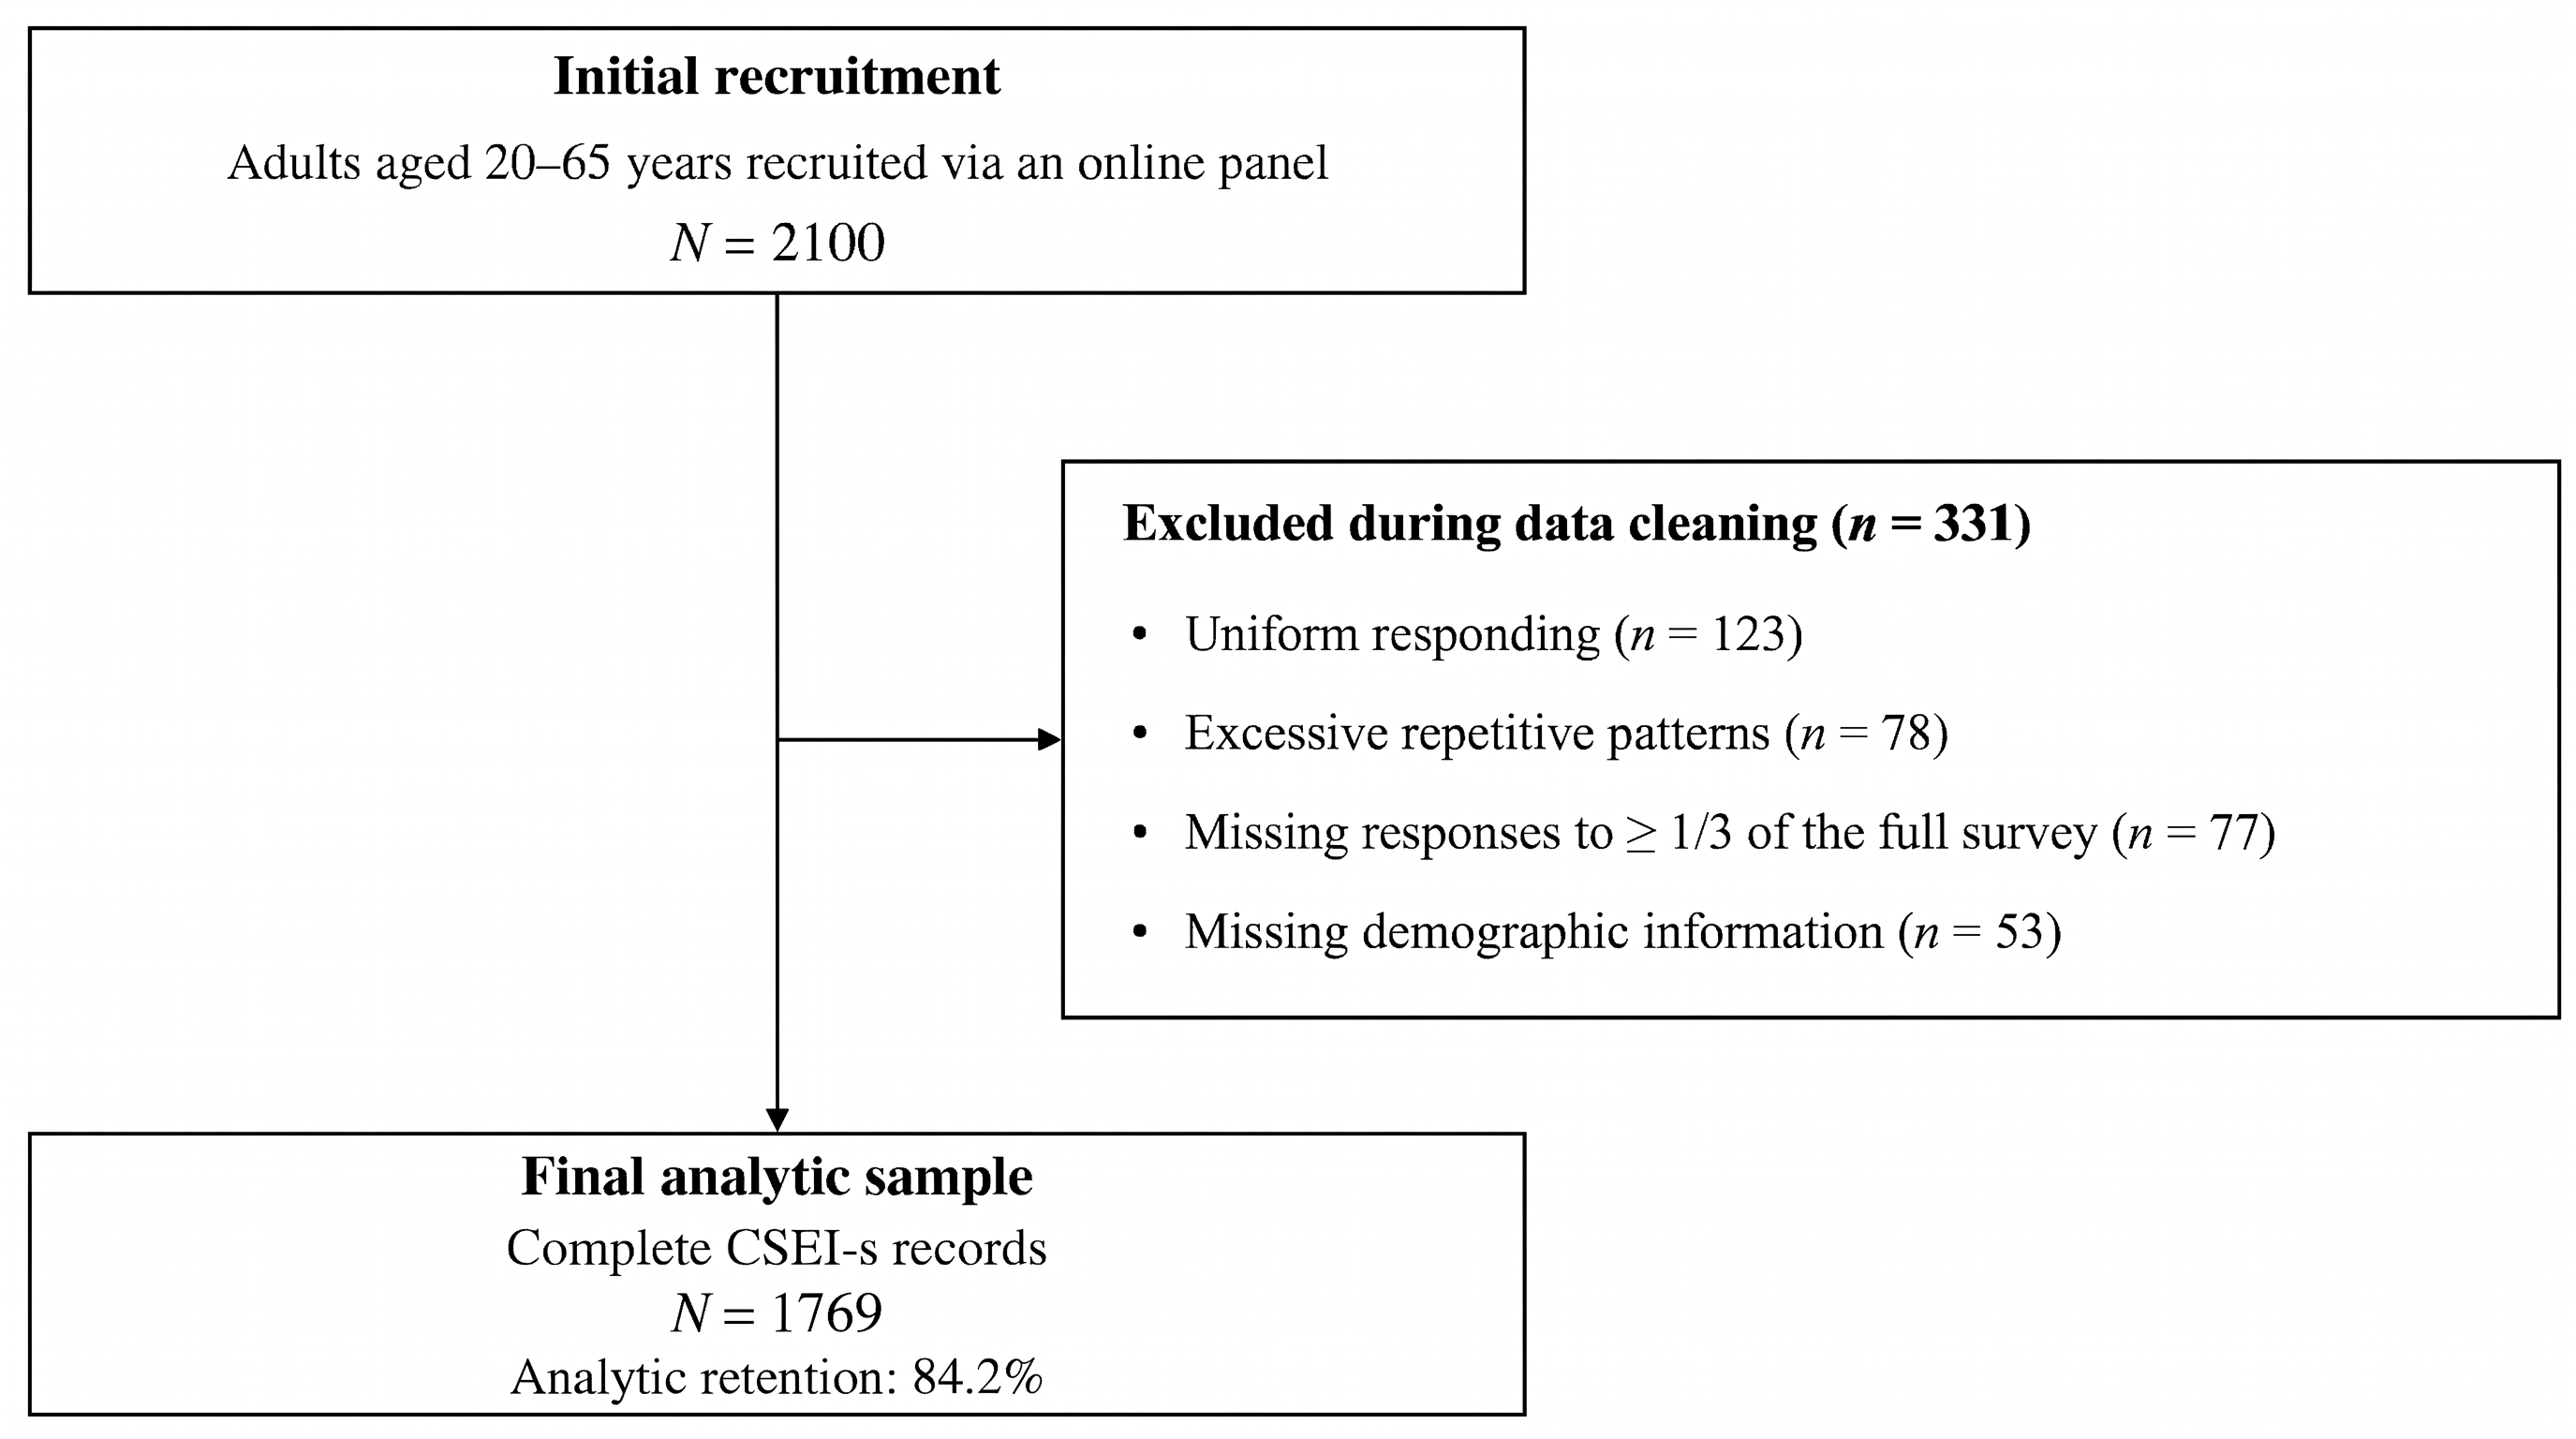
Reporting was reviewed against the Checklist for Reporting Results of Internet E-Surveys (CHERRIES) [16] and GRoNC [14]. Proprietary server view counts and initial invitation logs were managed internally by the survey vendor and were unavailable to the investigators; consequently, formal CHERRIES view, participation, and technical completion rates could not be calculated. Initial screening was carried out by the survey provider under its quality-control protocol before data transfer, and the investigators received only the screened, anonymized file. The provider applied four exclusion categories in sequence: uniform responding (n = 123), excessive repetitive patterns (n = 78), missing responses to at least one third of the full survey (n = 77), and missing demographic information (n = 53). Neither the item-level records of excluded respondents nor the numerical parameters of the pattern filters were provided. No completion-time threshold was applied. Uniform and repetitive strings are standard indicators of careless responding [17], though uniform answers to emotion items can also be genuine. After 331 exclusions, 1769 complete records were retained, representing an analytic retention rate of 84.2% of the 2100 recruited respondents (Figure 1). The retained records had no missing or out-of-range values in the 28 items or the analyzed demographic variables. No transferred record had a missing value, so no imputation or prorating was needed. Whether the raw file held records with fewer missing responses could not be determined. The sample was recruited independently of the preliminary standardization survey [12], and no participants or records overlap.
Figure 1.
Participant flow from recruitment to the analytic sample.
2.3. Reference Group and Coverage
The reference group was described by sex, age, education, and region. Age groups were 20–29, 30–39, 40–49, 50–59, and 60–65 years. Regional counts and proportions described geographical coverage.
Primary reference values were calculated from the unweighted online sample. Demographic calibration assessed sensitivity to sample composition (Section 2.5.6), following GRoNC reporting principles [14].
2.4. Measure
The CSEI-s contains 28 self-report items, with four items for each of the seven emotional domains [11]. Responses range from 1 (not at all) to 5 (very much), producing subscale scores of.4–20. Respondents rated how they had felt during the past week, including the day of the survey. Supplementary Table S1 lists item assignments, original Korean wording, and English translations for reporting. The total score (28–140)(adds Joy to the six negative-emotion domains in the same direction. It is reported only as a descriptive summary, not as a validated general emotional construct, and its conversions are given in the Supplementary Materials. The English labels describe chiljeong domains. Melancholy (憂) covers low motivation, hopelessness, and dysphoric affect; it is not a measure of depressive disorder. Everyday worries falls under Rumination/Pensiveness (思; item 17), which includes repetitive thought and absorbed contemplation. Fright (驚) denotes a sudden startle-like response, distinguished from Fear (恐). Each subscale was interpreted against its own reference distribution.
Participants also completed seven single-item emotion-intensity ratings, recorded in the questionnaire as Visual Analog Scale (VAS) scores from 0 to 10. The labels were Joy, Anger, Thought, Depressed Mood, Sadness, Fear, and Surprise. All 1769 respondents had complete ratings. These concurrent self-reports were examined in relation to the CSEI-s domains.
2.5. Statistical Analysis and Reference Values
2.5.1. Descriptive Statistics and Internal Consistency
All statistical analyses were performed using Python (version 3.12.14; Python Software Foundation, Wilmington, DE, USA) and R (version 4.3.3; R Foundation for Statistical Computing, Vienna, Austria), including thelavaan (version 0.6-17) andsemTools (version 0.5-6) packages. Means, standard deviations, medians, interquartile ranges, skewness, excess kurtosis, and floor and ceiling percentages were calculated for all scores. Floor and ceiling percentages refer to the theoretical minimum and maximum, respectively. Internal consistency was assessed using Cronbach’s α with 95% confidence intervals (CIs) from 2000 non-parametric bootstrap resamples and standardized McDonald’s ω [18]. Omega was calculated from standardized loadings and residual variances in separate one-factor maximum-likelihood (ML) models for each four-item subscale. It describes a sum of standardized items, whereas α was calculated from the raw item scores.
2.5.2. Supporting Analyses of Internal Structure
One-factor, orthogonal seven-factor, and correlated seven-factor models were compared using normal-theory ML with Wishart likelihood and N − 1 scaling. The χ2 statistic, comparative fit index (CFI), Tucker–Lewis index (TLI), root mean square error of approximation (RMSEA) with 90% confidence intervals, and standardized root mean square residual (SRMR) were examined jointly [19]. The models were also estimated using weighted least squares with mean- and variance-adjusted test statistics (WLSMV) in lavaan to account for the five ordered response categories, with ordinal robust fit indices reported [20,21,22]. All models used the specified simple structure, with cross-loadings and residual covariances fixed to zero. Sources of misfit were examined through modification indices from the ordinal model, a seven-factor exploratory structural equation model (ESEM; WLSMV, oblique geomin rotation) [23], a second-order model for the six negative-emotion domains, and a bifactor model. The bifactor model had a general factor for the 24 items of the six negative-emotion domains and one specific factor for each of the seven domains, with all factors orthogonal. Joy was not part of the general factor, so its items loaded only on the Joy-specific factor.
Composite reliability (CR) and average variance extracted (AVE) were calculated from standardized ML loadings. Domain differentiation was assessed using the heterotrait–monotrait (HTMT) ratio based on absolute Pearson item correlations, with 0.85 as a descriptive reference and pointwise 95% confidence intervals obtained from 2000 bootstrap resamples (random seed = 20260930) [24].
An exploratory diagnostic ML model omitting item 8 was also examined. The original 28-item scoring system was retained for all reference values.
2.5.3. Multigroup Models, DIF, and Demographic Comparisons
Configural and loading-constrained models were fitted separately across sex and the five age groups. Each factor was identified by fixing its first item loading to 1 in every group; factor variances, factor covariances, and residual variances were estimated separately by group. Equality constraints were placed on the remaining 21 loadings, adding 21 degrees of freedom for sex and 84 for age. Non-negative residual variances and positive-definite factor covariance matrices were enforced. Multigroup RMSEA values incorporated the number of groups [25]. Absolute changes of CFI ≤ 0.010 and RMSEA ≤ 0.015 were descriptive guides [26], interpreted alongside absolute fit, sample sizes, and boundary estimates. Ordinal invariance was then tested under WLSMV with theta parameterization, following the identification of Wu and Estabrook [27] and adding equality constraints on thresholds, loadings, and latent-response intercepts in turn. The ML models used the five age groups of Table 1. The ordinal models combined the two oldest groups (50–65 years; n = 336), because five items had empty response categories at ages 60–65(n = 68). Robust indices are not available for constrained models in lavaan (version 0.6-17), so scaled fit indices were compared.
Table 1.
Demographic characteristics of the reference group (N = 1769).
Cumulative-logit DIF analyses matched each item on the standardized sum of the other three items in its subscale, which kept the studied item out of its own matching score. Sex was binary and age was standardized and continuous. Group main effects and group-by-rest-score interactions represented uniform and non-uniform DIF. Benjamini–Hochberg false discovery rate (FDR)-adjusted p < 0.05 and McFadden ΔR2 ≥ 0.01 defined statistical and substantive evidence, respectively [28]. In sensitivity analyses, items were also matched on the full subscale score and on a purified score that excluded other flagged items, and MIMIC models with ordinal indicators tested direct effects of sex and age on each item [29].
Sex differences were evaluated using Welch’s independent-samples t-tests, mean differences with Welch 95% CIs, and Cohen’s d. Age-group differences were assessed by one-way ANOVA and η2; Welch’s ANOVA was used as a sensitivity analysis. CIs for d and η2 were estimated using 2000 bootstrap resamples within sex or age groups, preserving group sizes (random seed = 20260930). Because the age distribution differed by sex (Table 1), adjusted analyses used ordinary least squares (OLS) models containing sex and a five-level age-group factor as additive effects. The model included an intercept, a female indicator, and four age-group indicators, leaving 1763 residual degrees of freedom. Conventional t-based CIs described the female coefficient; Type II F tests and partial η2 described each term conditional on the other. Heteroskedasticity-consistent (HC3) CIs and F tests were examined as sensitivity analyses. In separate models, the four sex × age-group interaction terms were tested jointly using HC3 Wald F tests. All group comparisons were exploratory associations. Group-comparison and HTMT intervals were pointwise; DIF used multiplicity adjustment. The correlation family was adjusted separately as described in Section 2.5.5.
2.5.4. Reference-Score Construction
Percentile cut-points were estimated by the nearest-rank method. For a raw score x, its percentile rank was PR(x) = 100 × [n(X < x) + 0.5 × n(X = x)]/N, assigning tied scores their midrank. Linear T scores were computed as T = 50 + 10(X − M)/SD, preserving the shape of the score distribution, which means they do not map onto normal-curve positions in skewed subscales. Normalized T scores, 50 + 10 × Φ−1(PR/100), were added as a supplementary metric (Supplementary Table S22), with percentile ranks as the primary reference. Percentile cut-point CIs used 2000 non-parametric bootstrap resamples. The standard error of measurement was approximated as SEM = SD × √(1 − α), with ±1.96 × SEM as a pooled, cross-sectional measurement-error range. As this is a single pooled value, conditional SEMs on the raw-score metric were also derived from a graded model based on the ordinal item parameters (Supplementary Table S23). Descriptive bands used PR boundaries; ties can affect the percentage in each band. All reported values were verified using Python 3.12.14 and R 4.3.3 (lavaan 0.6–17, semTools 0.5–6).
2.5.5. Exploratory Concurrent Associations
We examined all 49 associations between the seven CSEI-s subscales and the seven emotion-intensity ratings as planned exploratory analyses. Spearman correlations used average ranks for ties. Pointwise 95% confidence intervals were obtained from 2000 participant-level bootstrap resamples, preserving each respondent’s paired scores (random seed = 20261002).
Two-sided asymptotic p values were adjusted across the 49 correlations using the Benjamini–Hochberg procedure [28]. The full correlation matrix is reported in Supplementary Table S15.
2.5.6. Demographic-Calibration Sensitivity Analysis
We assessed demographic-calibration sensitivity using Ministry of the Interior and Safety resident-registration counts for March 2022, restricted to ages 20–65 [30]. Unit starting weights were calibrated by iterative proportional fitting to 10 sex-by-age categories and 17 regional margins, then normalized to a mean of 1 with no trimming or other restrictions. Calibrated values were compared as point estimates, and the calibration itself was not bootstrapped. A sex-by-age-only scenario was also examined. Means, percentile cut-points, midrank percentile ranks, and linear T scores were compared with the primary unweighted references. Supplementary Tables S16 and S17 describe the benchmark, weights, and score changes.
3. Results
3.1. Composition of the Reference Group
The final sample included 1769 adults, 885 men and 884 women, with a mean age of 39.13 years (SD = 10.54). Age-group counts were 376 (20–29 years), 569 (30–39), 488 (40–49), 268 (50–59), and 68 (60–65). Respondents aged 30–49 years accounted for 59.8% of the sample, and 53.1% held a bachelor’s degree (Table 1). All retained records had complete data for the variables analyzed. Eleven retained respondents gave identical answers to all 28 items. Excluding them left every reported cut-point unchanged, and the effect of re-adding the screened uniform responders under hypothetical patterns is summarized in Supplementary Table S21.
All 17 metropolitan cities and provinces were represented (Table 2). Gyeonggi (n = 465, 26.29%) and Seoul (n = 325, 18.37%) contributed the largest numbers.
Table 2.
Regional composition of the analytic sample (N = 1769).
3.2. Descriptive Statistics and Score Distributions
Rumination/Pensiveness had the highest mean raw score (12.37) and Anger the lowest (8.46). All subscales were positively skewed, with greater skewness for Anger, Melancholy, Fright, and Sorrow (Table 3) (0.533–0.805). Fright had the largest floor percentage (16.28%).
Table 3.
Descriptive statistics and score distributions of the CSEI-s (N = 1769).
3.3. Internal Consistency
Subscale Cronbach’s α ranged from 0.736 to 0.900 and standardized McDonald’s ω ranged from 0.737 to 0.899 (Table 4). Joy had the lowest internal consistency.
Table 4.
Internal consistency of the CSEI-s (N = 1769).
3.4. Structural Validity and Item-Level Diagnostics
The correlated seven-factor model fit better than the one-factor and orthogonal seven-factor alternatives under both estimation approaches (Table 5). Under ML, χ2(329) = 3720.48, CFI = 0.885, TLI = 0.868, RMSEA = 0.076 (90% CI 0.074–0.079), and SRMR = 0.084. Under ordinal WLSMV, adjusted χ2(329) = 7281.47, robust CFI = 0.840, robust TLI = 0.816, robust RMSEA = 0.102 (90% CI 0.099–0.105), and SRMR = 0.082. Unadjusted, scaled, and robust ordinal fit indices are reported separately in Supplementary Table S13.
Table 5.
Comparison of maximum-likelihood and ordinal confirmatory factor models.
Standardized ML loadings ranged from 0.538 to 0.881 and composite reliability ranged from 0.736 to 0.900. AVE was at least 0.50 for five domains, but was 0.413 for Joy and 0.488 for Fear (Table 6). Item estimates are reported in Supplementary Table S12. Latent factor correlations ranged from −0.442 to 0.807, with the highest between Fear and Fright. HTMT ratios ranged from 0.171 to 0.828; all 21 point estimates were below 0.85 (Supplementary Table S9). Melancholy–Sorrow had the highest HTMT (0.828; bootstrap 95% CI 0.793–0.856), with an upper limit exceeding 0.85. The other 20 intervals had upper limits below 0.85. Ordinal standardized loadings ranged from 0.333 to 0.919. For Joy item 8, the standardized ML loading was 0.538 (95% CI 0.498–0.579), whereas the ordinal loading was 0.333 (robust 95% CI 0.285–0.381), the lowest ordinal estimate; all 28 estimates and intervals are reported in Supplementary Table S14.
Table 6.
Standardized factor loadings, composite reliability and average variance extracted (ML, correlated seven-factor model).
The largest ML residual correlation was between items 8 (“I feel elated”) and 13 (0.338); the same pair had the largest ordinal residual correlation (0.374). In the exploratory ML analysis omitting item 8, CFI was 0.898, TLI was 0.882, RMSEA was 0.074 (90% CI 0.072–0.076, and SRMR was 0.063. Reference-score calculations retained all 28 items to preserve the original scoring system. The largest modification indices involved cross-loadings of item 8 on the six negative-emotion factors and of item 23 on other negative factors. The ESEM fitted considerably better (robust CFI = 0.949, TLI = 0.904, RMSEA = 0.074, SRMR = 0.020) and recovered Anger, Rumination/Pensiveness, Joy, Sorrow, and Fright as recognizable factors. The Melancholy items separated into a low-motivation pair (items 4 and 18) and a hopelessness pair (items 11 and 25), while the Fear items loaded mostly with Fright or with the low-motivation pair. A second-order negative-emotion model fitted worse than the correlated model (robust CFI = 0.804). A bifactor model did somewhat better but still fitted poorly (robust CFI = 0.864, RMSEA = 0.095). Its general factor accounted for most of the common variance among the negative items (ECV = 0.653), and Fear and Sorrow retained the least specific variance (Supplementary Table S18).
3.5. Measurement Invariance and Differential Item Functioning
3.5.1. Configural, Loading-Constrained, and Ordinal Invariance Models
Constraining the 21 non-marker loadings produced small fit changes: ΔCFI = −0.0005 and ΔRMSEA = −0.0010 for sex, and ΔCFI = −0.0022 and ΔRMSEA = −0.0013 for age (Table 7). The χ2 difference tests were significant for sex (p = 0.019) and age (p < 0.001), as expected with this sample size, but the changes in CFI and RMSEA stayed within the descriptive guides. Configural CFI was 0.888 for sex and 0.873 for age. The age-configural model contained a residual-variance estimate approaching zero. In the ordinal models, constraining thresholds, loadings, and intercepts changed scaled CFI by no more than 0.004 for sex and for age (four age groups), and RMSEA fell at each step (Supplementary Table S19). Most scaled χ2 difference tests were significant, and baseline fit remained weak.
Table 7.
Multigroup ML models with group-specific factor variances.
3.5.2. Differential Item Functioning
After Benjamini–Hochberg FDR correction, 13 items showed statistically significant sex-related DIF. Substantive uniform DIF (McFadden ΔR2 ≥ 0.01) was identified in three Melancholy items: item 11 (ΔR2 = 0.014), item 18 (0.027), and item 25 (0.016).
For age entered as a continuous variable, 16 items were statistically significant after FDR correction. Substantive uniform DIF was limited to item 8 in Joy (ΔR2 = 0.013) and item 18 in Melancholy (0.017). No substantive non-uniform DIF was identified for sex or age. Full-score, purified, and MIMIC analyses flagged largely the same items. In the MIMIC models, the sex effects on items 11 and 25 ran opposite to that on item 18 (Supplementary Table S20). At equal rest scores, women were expected to score 0.50 points higher than men on item 18 and 0.33–0.34 points lower on items 11 and 25, while item 4 (not flagged) added 0.18 points; summed over the four items, the net DIF in the Melancholy sum was 0.01 points.
3.6. Observed Sex Differences Before and After Age-Group Adjustment
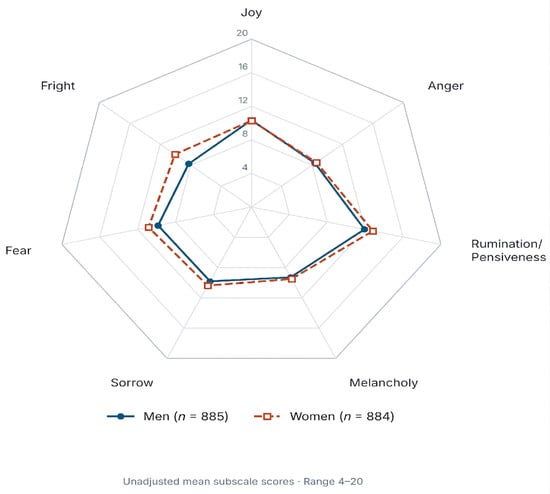
Women had higher unadjusted scores for Rumination/Pensiveness, Sorrow, Fear, and Fright (Table 8). The largest difference was for Fright: 1.81 points (95% CI 1.43–2.19), with Cohen’s d = 0.446 (bootstrap 95% CI 0.355–0.541). Women were more concentrated in younger age groups than men (Table 1).
Table 8.
Unadjusted and age-group-adjusted sex differences in CSEI-s scores (N = 1769).
After adjustment for age group, the sex difference decreased to 1.55 points for Fright (95% CI 1.16–1.93; partial η2 = 0.034), 0.77 for Fear (95% CI 0.41–1.12), and 0.46 for Rumination/Pensiveness (95% CI 0.10–0.82). These differences remained statistically significant. The adjusted Sorrow difference was 0.35 points (95% CI −0.03 to 0.72; p = 0.072) and was no longer statistically significant. Joy, Anger, and Melancholy showed no statistically significant sex differences before or after adjustment. The observed sex difference in Melancholy was small, but MIMIC models suggested that DIF running in opposite directions across items 11, 18, and 25 partly masked a small latent difference (Supplementary Table S20). Full unadjusted and adjusted results are reported in Supplementary Tables S8 and S10, respectively. HC3 sensitivity analyses yielded the same significance pattern. Joint interaction tests had p values of 0.113–0.825 (Supplementary Table S11).
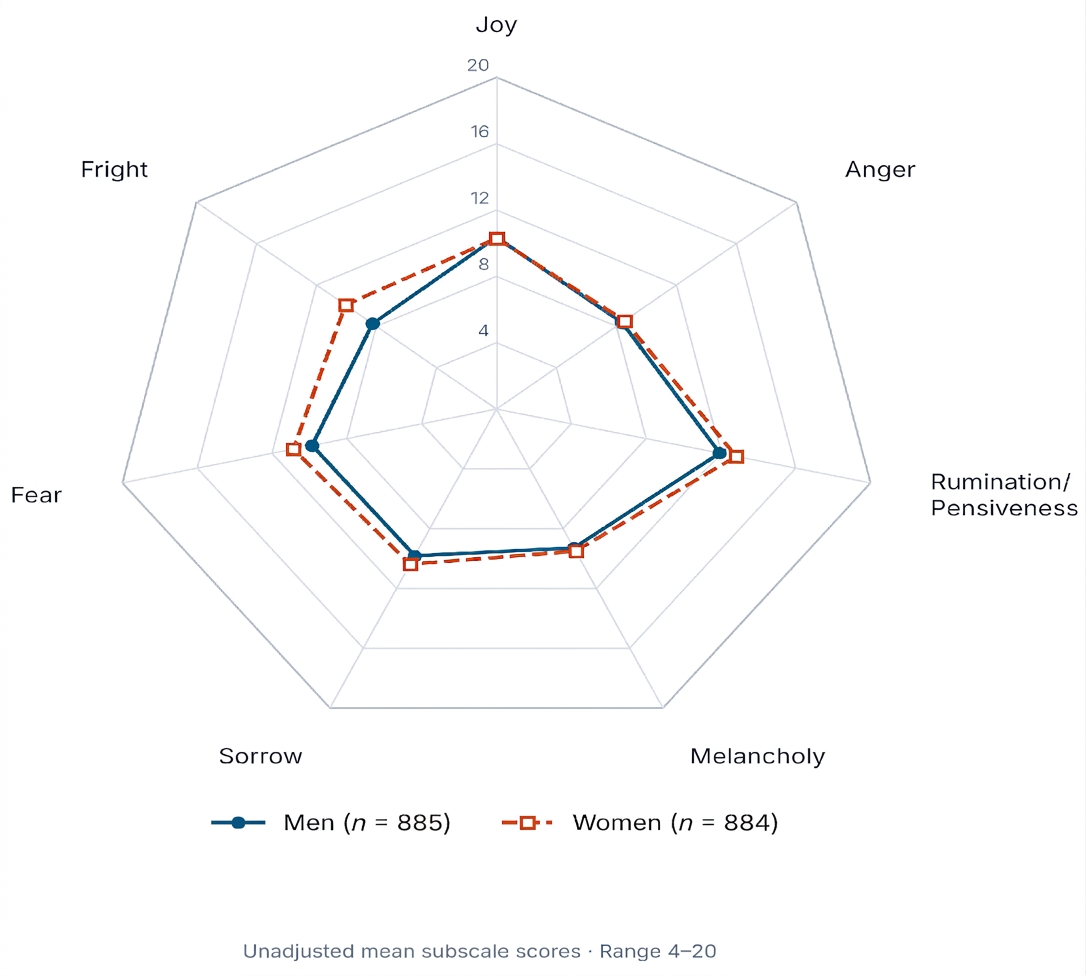
Figure 2 displays the unadjusted mean scores by sex for each subscale.
Figure 2.
Mean CSEI-s subscale scores by sex. Points show unadjusted means for men (n = 885) and women (n = 884), as reported in Table 8. Each subscale has a score range of 4–20.
3.7. Observed Score Differences by Age Group
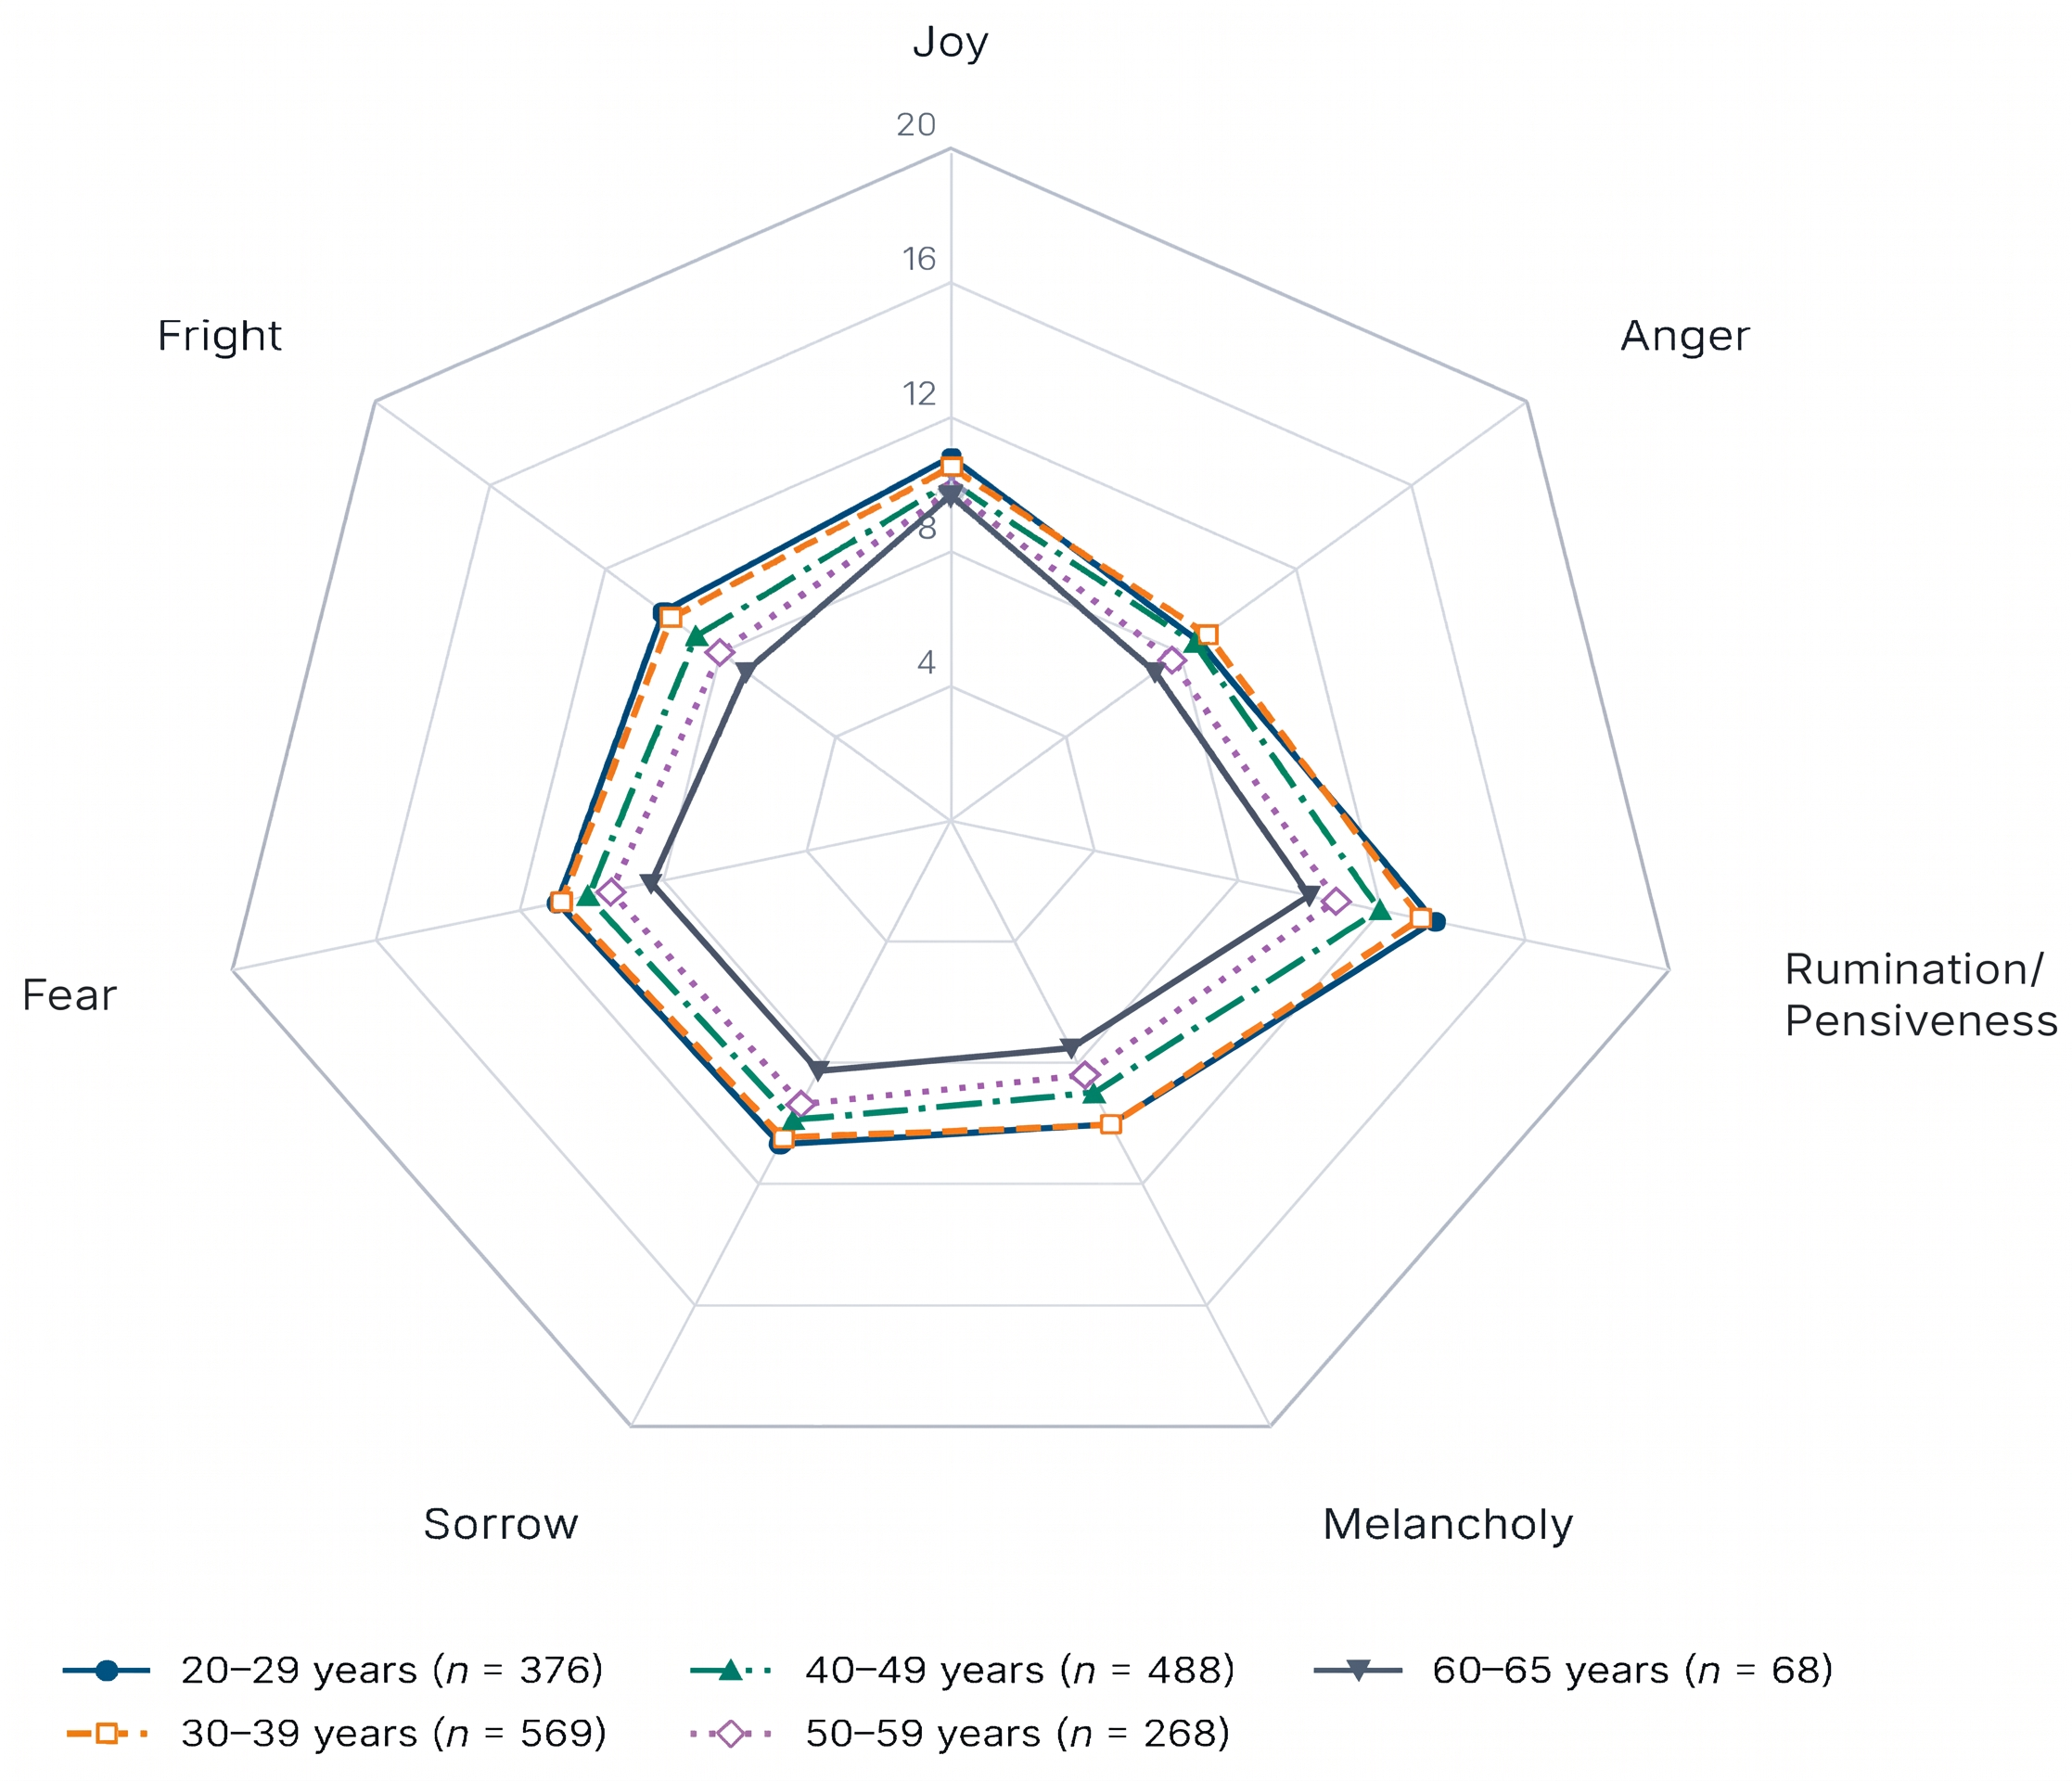
All unadjusted age-group comparisons were statistically significant (Table 9). The largest effect was for Rumination/Pensiveness, F(4, 1764) = 34.44, η2 = 0.072 (bootstrap 95% CI 0.053–0.099), p < 0.001. Mean scores were generally lower in older groups, although Anger and Melancholy were similar or slightly higher in the thirties than in the twenties. With adjustment for sex, age-group F(4, 1763) statistics ranged from 5.92 to 30.02 (all p < 0.001), with partial η2 from 0.013 to 0.064. Rumination/Pensiveness (0.064) again had the largest effect (Supplementary Table S10). HC3 age-group tests also had p < 0.001 for all eight scores (Supplementary Table S11). Unadjusted effect-size CIs are in Supplementary Table S8.
Table 9.
Differences on the CSEI-s by age group (N = 1769).
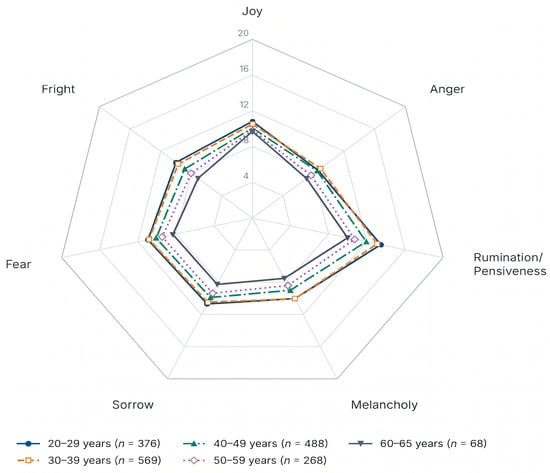
Figure 3 displays the five age-group means within each domain. The largest separation occurred for Rumination/Pensiveness. The oldest group included 68 participants.
Figure 3.
Mean CSEI-s subscale scores by age group. Points show unadjusted means from Table 9. Group sizes were 376, 569, 488, 268, and 68 in ascending age order.
3.8. Sample-Based Reference Values
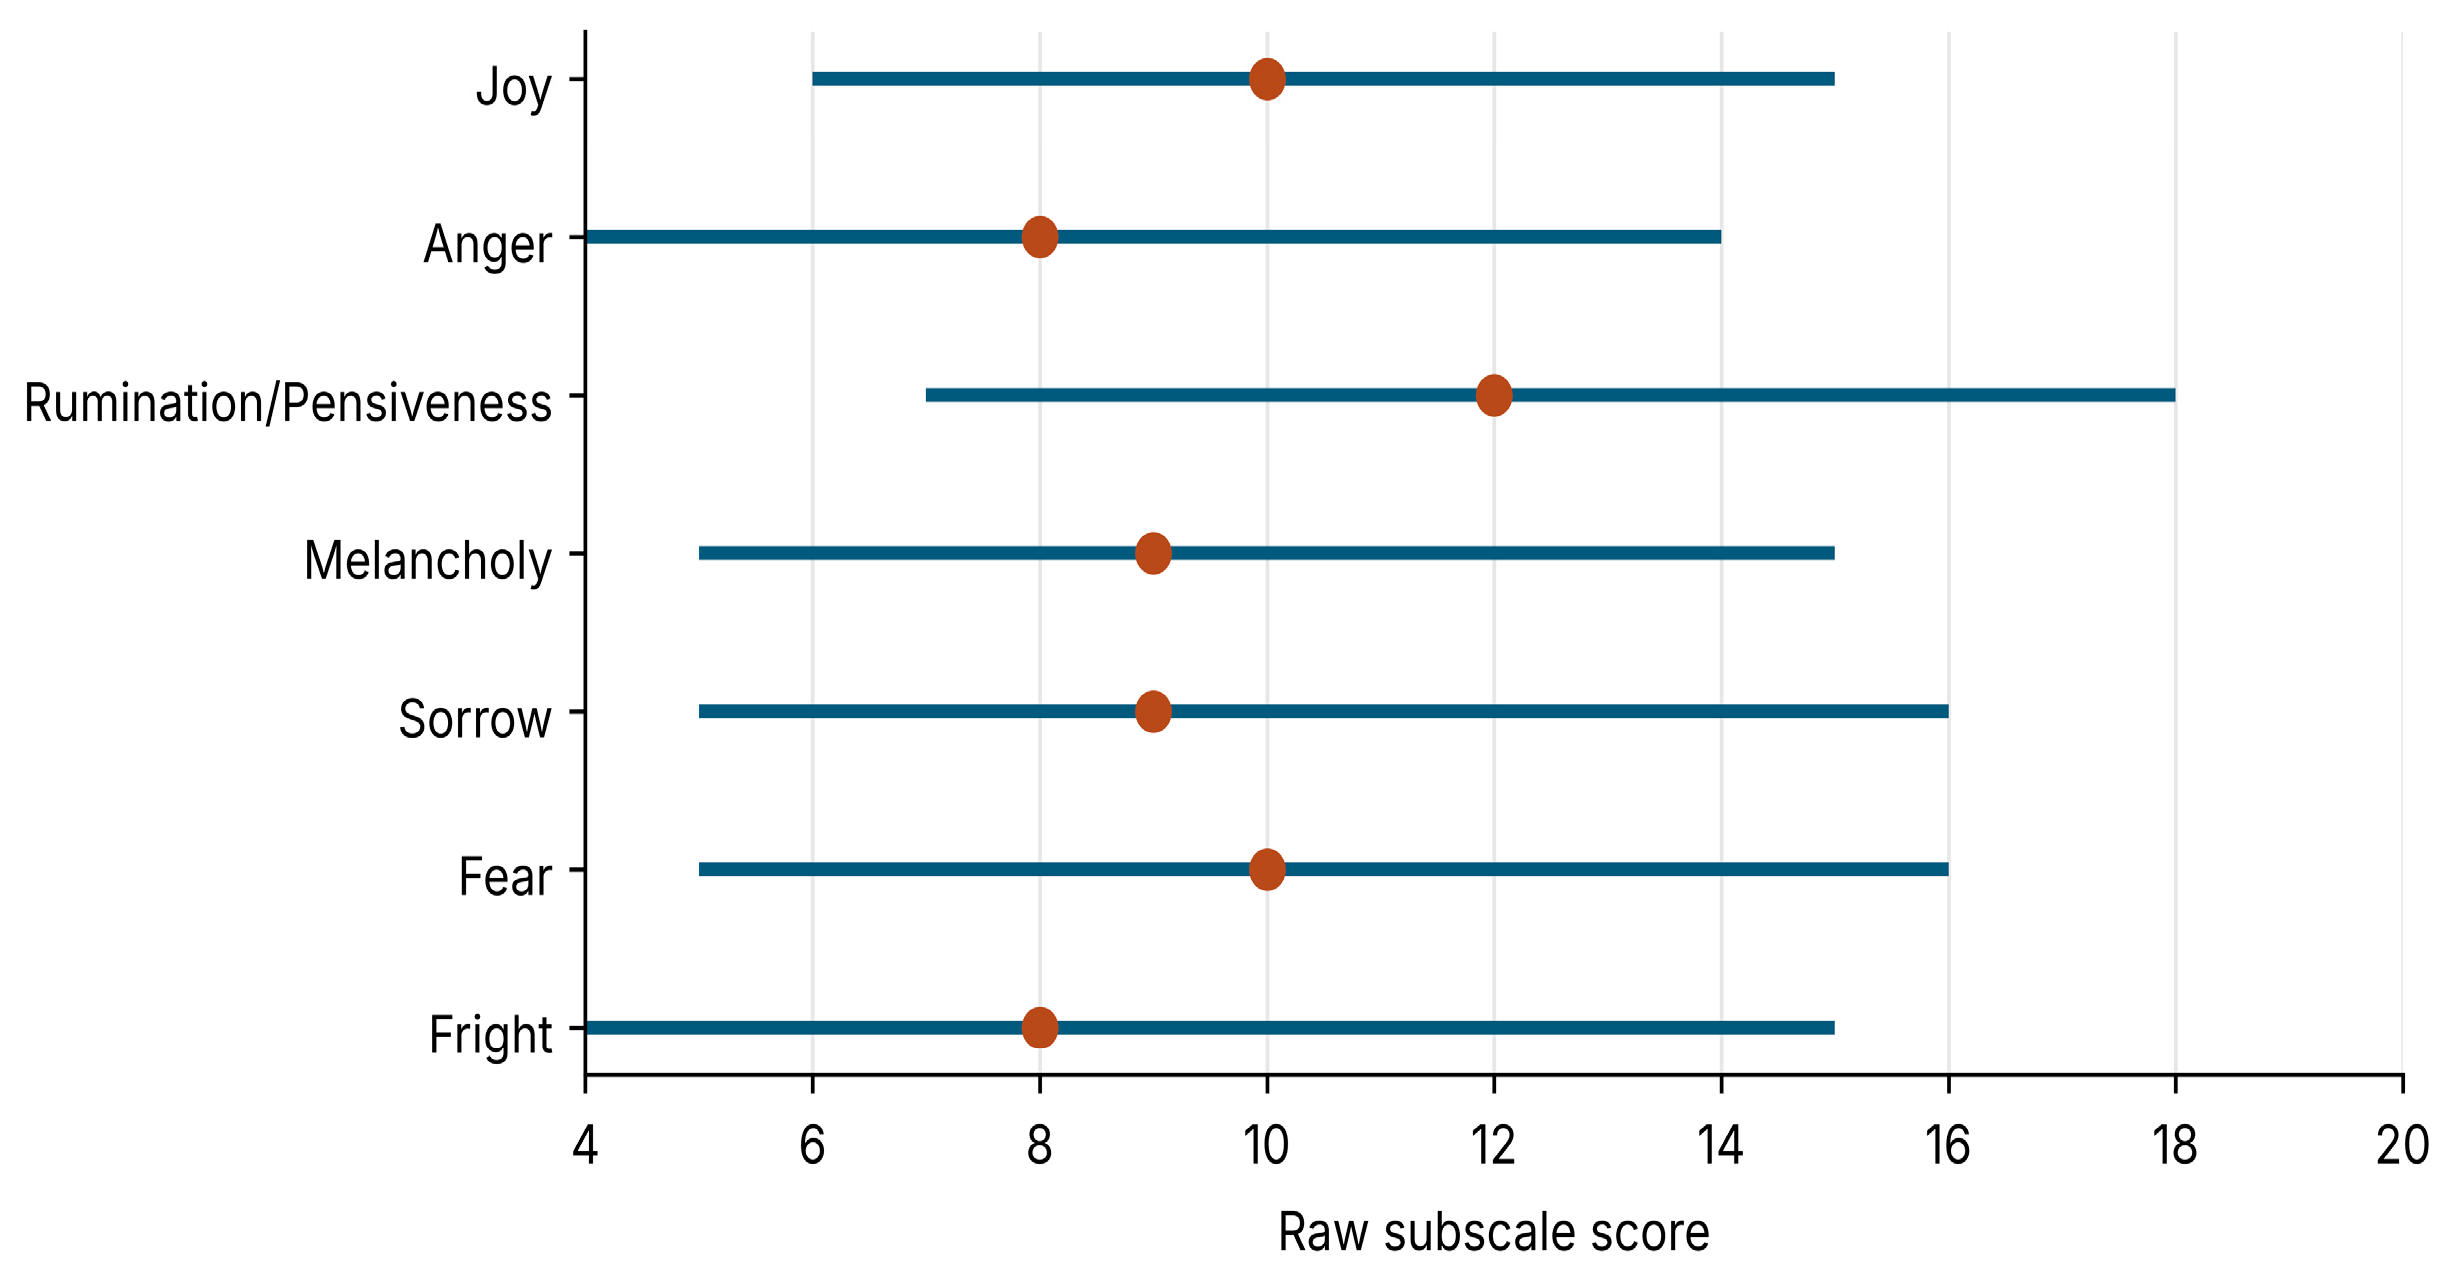
Table 10 presents the empirical percentile cut-points. Subscale medians were 10 for Joy, 8 for Anger, 12 for Rumination/Pensiveness, 9 for Melancholy, 9 for Sorrow, 10 for Fear, and 8 for Fright. Percentile ranks and linear T-score conversions for individual raw scores are provided in Supplementary Table S3. With only 17 possible scores per subscale and up to 16.3% of respondents sharing a score, percentile ranks of adjacent raw scores differed by as much as 13.0 points. Sampling error mattered less: bootstrap intervals for individual percentile ranks were no wider than 4.6 points (Supplementary Table S23). Most subscale percentile CIs spanned 0–1 raw-score points (Table 11). Conversions and percentile intervals for the descriptive sum score appear in Supplementary Tables S4 and S7 Whole-sample percentiles provide the common reference. Supplementary Tables S5 and S6 describe group-specific means and dispersion.
Table 10.
Sample-based percentile reference values (N = 1769).
Table 11.
Bootstrap 95% confidence intervals for the key percentiles and standard errors of measurement.
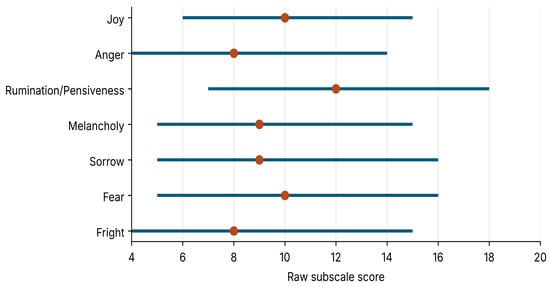
Figure 4 displays the P10, P50, and P90 raw-score values separately for each domain, providing a compact view of the marginal reference distributions.
Figure 4.
Marginal percentile reference values for the CSEI-s subscales. Horizontal lines join P10 and P90; filled points mark P50 (N = 1769). Values are from Table 10 and summarize each subscale’s distribution separately.
Table 11 summarizes sampling uncertainty for percentile cut-points and approximate measurement error for individual scores. Supplementary Tables S2 and S7 provide the corresponding parameters and calculations.
3.9. Individual Score Interpretation
Each subscale score can be located within its own reference distribution and considered alongside item content and current circumstances. For example, a raw score of 12 corresponds to PR = 48.8 for Rumination/Pensiveness and PR = 82.5 for Anger (Supplementary Table S3). Approximate 95% measurement-error ranges were ±2.6–3.4 points for the subscales. Conditional SEMs were 1.52–1.85 points in the mid-range of the subscales and smaller near the floor and ceiling (Supplementary Table S23).
Table 12 provides descriptive bands based on midrank percentile ranks for discussing a score’s position within the sample.
Table 12.
Non-diagnostic descriptive bands based on percentile ranks.
3.10. Associations with Concurrent Emotion Ratings
For similarly labeled CSEI-s domains and single-item ratings, Spearman correlations were 0.538 for Joy, 0.434 for Anger, 0.374 for Rumination/Pensiveness–Thought, 0.591 for Sorrow–Sadness, 0.355 for Fear, and 0.406 for Fright–Surprise. Melancholy correlated 0.540 with Depressed Mood, a related but differently labeled rating. Cross-domain associations were also evident: Fear correlated 0.422 with Depressed Mood, and Rumination/Pensiveness correlated 0.471 with that rating. Scores generally corresponded with similarly named ratings, although domain specificity was limited. Supplementary Table S14 reports all 49 correlations, their pointwise bootstrap confidence intervals, and adjusted q values (N = 1769).
3.11. Population Composition and Weighting Sensitivity
Regional proportions differed from the age-matched population benchmark by at most 0.76 percentage points. Larger differences concerned age: adults aged 30–39 represented 32.17% of the sample versus 19.11% of the benchmark, whereas those aged 60–65 represented 3.84% versus 13.90% (Supplementary Table S16). After calibration for sex, age, and region, the seven subscale means decreased by 0.18–0.50 points, corresponding to 0.053–0.129 unweighted SDs. Their P10, P50, P90, and P95 cut-points differed by no more than one raw-score point. Changes in subscale percentile ranks reached 5.17 percentile points, and linear T-score changes reached 2.05 points across all possible subscale scores. The supplementary total mean decreased from 70.17 to 67.81, and its P95 decreased from 102 to 100. Weights ranged from 0.402 to 6.894, the largest falling in the 60–65 group; Kish effective sample size was 1146, or 64.8% of N. The implied design effect of about 1.54 would widen intervals by roughly 24% relative to the unweighted ones. Even so, calibrated cut-points stayed within one raw-score point of the primary references. Adding regional calibration to sex-by-age calibration changed subscale means by no more than 0.015 points. Weighting results are reported in Supplementary Table S17.
4. Discussion
This study provides sample-based reference values for the existing 28-item CSEI-s as groundwork for future standardization. Data from 1769 community adults extend earlier CSEI-s research [11,12] and provide complete raw-score conversions for seven emotional domains, uncertainty estimates, and guidance for describing emotional profiles. The tables use the original four-item subscale sums.
Emotional assessment research benefits from an explicit comparison group. Reference studies of established emotion and mental-health measures likewise provide useful distributional information from non-clinical samples [31,32]. The present tables translate raw CSEI-s scores into two complementary summaries: percentile ranks show empirical standing, whereas linear T scores express distance from the sample mean in standard-deviation units. For example, the same raw score of 12 corresponds to percentile ranks of 82.5 for Anger and 48.8 for Rumination/Pensiveness. This difference makes domain-specific reference distributions informative when describing a multidimensional profile.
Subscales generally showed acceptable internal consistency, but the correlated seven-factor model did not achieve adequate absolute fit, particularly under ordinal estimation. Internal consistency describes the coherence of the item sums; the fit indices and residuals identify unresolved structural problems. Strict simple-structure models can fit poorly when small cross-loadings or residual correlations are present [33], and fit indices from categorical estimators are not directly interchangeable with ML indices or cut-offs derived for continuous data [34]. The total score sums Joy and six negative-emotion domains in the same direction, and neither a one-factor nor a second-order model fitted well. A high α does not turn such a sum into a unitary index, so it is shown only as a descriptive sum score. Interpretation should therefore focus on the subscales, with particular attention to Joy’s low AVE and the Melancholy–Sorrow HTMT interval, whose upper limit exceeded 0.85. Joy mixes high-arousal affect with optimism, vitality, and life satisfaction, and this heterogeneity most directly explains its low AVE. The Fright items, by contrast, are near-synonyms, and three Sorrow items are worded in parallel; both features may raise α without widening construct coverage. Shared variance among the negative-domain sums is also substantial, and Fear and Sorrow scores in particular cannot be read as independent of general negative affect.
The Melancholy–Sorrow overlap (HTMT = 0.828; upper 95% CI limit = 0.856) has a simple explanation in item content. Items on hopelessness and loneliness describe closely related low moods, and in the ESEM the loneliness item cross-loaded on the hopelessness factor. Traditional Seven Emotions theory places both emotions in the lung system [9,10], which fits their proximity but should not be taken as an interpretation of these results.
Item 8 in Joy had the lowest ordinal loading (0.333) and its largest residual correlation was with item 13 in another domain (ML = 0.338; ordinal = 0.374). In the 27-item diagnostic ML model, fit improved (CFI = 0.898, TLI = 0.882, RMSEA = 0.074, SRMR = 0.063), although the incremental indices remained below conventional benchmarks. Unlike the other Joy items, it correlated positively with the Anger and Fright items. The Korean expression deultteuda can mean pleasant excitement but also restlessness, so the item may tap arousal as much as positive valence [35]. The English “feel elated” carries only the positive sense. Item 8 is the obvious first candidate for rewording in future versions. Any such revision, including a second look at the Fear items, should be guided by theory and tested in new data, not driven by modification indices.
Traditional Seven Emotions theory, which links excessive Joy to dispersal of qi [9,10], offers useful background here, though it does not explain the psychometric findings. Tables S12–S14 provide the item estimates and model comparisons. The conversion tables use the original 28-item form, and any change to the item set would require new conversions.
Percentile ranks and linear T scores describe observed score distributions and can therefore be calculated irrespective of latent-factor model fit. Model misfit nevertheless constrains their psychological interpretation [13]. The tables locate an observed four-item sum within the reference sample but do not establish that each sum reflects a distinct latent emotion. Fear did not emerge as a separate ESEM factor, and Melancholy overlapped with Sorrow; profiles are better interpreted through item content and observed sums than as latent emotion scores. The contribution of the tables is accordingly descriptive: they document the distribution of an existing scoring system and provide a baseline for revised versions. Their use in interpreting individual profiles will require further validity evidence.
Concurrent ratings corresponded as expected most clearly for Joy, Melancholy–Depressed Mood, and Sorrow–Sadness. Correspondence was weaker where the rating did not match the CSEI-s construct, as with Thought and Surprise. Fear correlated more strongly with Depressed Mood than with the Fear rating, in line with its weak differentiation in the ESEM. Single-item ratings have unknown precision, and completing them on the same occasion as the CSEI-s adds shared method variance. Future validation should include established multidimensional measures such as the PANAS, along with validated measures of specific emotions [36].
After age adjustment, women had higher Fright, Fear, and Rumination/Pensiveness scores, with the largest difference in Fright. Epidemiological studies also report sex differences in some anxiety disorders [37], although those studies concern diagnosed disorders whereas the present analysis describes emotional scores. Sex-specific summaries (Supplementary Table S5) provide context when interpreting individual profiles.
The generally lower negative-emotion scores in older groups are compatible with socioemotional selectivity theory [38]. Joy scores, however, were also lower in older groups, which is less consistent with the maintenance of positive affect proposed by that theory. Because the Joy items include high-arousal expressions such as “feel elated” (item 8), this pattern may partly reflect an age-related shift in preference from high-arousal toward low-arousal positive states [39]; item 8 also showed substantive age-related DIF. The design is cross-sectional, so these are differences between age groups, not developmental change, and cohort differences or selective online participation may also contribute. With only conditional invariance evidence and age DIF in items 8 and 18, they warrant cautious interpretation. Anger and Melancholy scores were similar or slightly higher in adults in their thirties than in their twenties. Work stress, parenting demands, and socioeconomic responsibilities are possible explanations that would require direct assessment.
Ordinal constraints on thresholds, loadings, and intercepts changed fit only slightly across sex and age groups. With weak baseline fit and DIF in several items, this is conditional evidence of comparability at best, and the group differences reported here remain observed score differences [26,40]. The Melancholy DIF largely canceled out in the subscale sum and does not appreciably shift the common references, although item-level differences still matter when profiles are discussed. The items with opposite DIF corresponded to the low-motivation and hopelessness facets found in the ESEM. Item 18 also showed age DIF, and sex or age comparisons that rest on this item call for caution.
To use the tables, sum the four items in each domain and locate the corresponding raw-score row. The percentile rank should be reported as the primary reference, together with the reference sample and collection period, and the seven domains should be considered jointly; linear and normalized T scores are supplementary. As a one-point difference can shift a percentile rank by more than 10 points, ranks are best treated as approximate positions, with neighboring scores within about ±1 SEM taken into account, particularly near the floor. Sex and age summaries provide context, whereas percentile confidence intervals and SEM ranges convey uncertainty. In healthcare discussions, profiles may be considered alongside duration, distress, functional impairment, and current circumstances.
4.1. Limitations
Voluntary online-panel recruitment, limited non-response information, and overrepresentation of adults aged 30–49 years restrict generalizability. Regional coverage and demographic calibration do not establish population representativeness. Calibration addresses the measured demographic margins, leaving possible selection differences related to education, unmeasured characteristics, and age within the calibration bands. Adults older than 65 years were excluded; the 60–65-year group contained 68 participants, including 21 women. Large weights in this group reduced the effective sample size. Summary statistics for this group are imprecise; among women, 95% confidence half-widths for subscale means reached 2.1 raw-score points. Whole-sample references were therefore preferred to separate demographic norms. Bootstrap intervals describe precision conditional on this sample. The data were collected in March 2022, during Korea’s large Omicron wave [41]. With items anchored to the past week, pandemic-related stress may have raised negative emotions and lowered Joy, and the references may not reflect ordinary conditions. They should be re-examined in data collected after the pandemic. Screening relied on the provider’s filters, with no attention checks or completion-time criteria, and the incentive was small. Some uniform responders may have been genuine low scorers, and the sensitivity analyses could model only that group.
Measurement limitations also affect interpretation. Given the weak baseline fit and item-level DIF, the ordinal invariance results fall short of firmly establishing latent-mean comparability across groups. DIF results were broadly consistent across matching methods, though four-item subscales leave little room for purification, while demographic adjustment leaves possible residual confounding. Concurrent ratings were same-occasion self-reports, and participants’ clinical status was not assessed. The items refer to the past week, so scores reflect recent states, and the tables have not been evaluated for monitoring change. These data do not establish diagnostic accuracy or thresholds for change over time. Both the α-based SEM, a pooled cross-sectional estimate, and the conditional SEMs rest on a measurement model with limited structural support. The English item translations were prepared for reporting and have not been validated as an English-language instrument. Group comparisons and HTMT intervals were exploratory and pointwise; DIF and the 49 rating correlations used separate multiplicity adjustments. The effects of using these profiles on emotional awareness, communication, or health outcomes were not evaluated.
4.2. Possible Future Applications
These tables provide a defined comparison context for an existing brief emotional measure. WHO describes mental health as a continuum and emphasizes its promotion in everyday settings [42]. Within this framework, a seven-domain profile may help individuals articulate the nature of their emotional difficulties more precisely in community health education, individual consultation, or primary care. None of these uses was tested in the present study. Clinical utility, diagnostic accuracy, sensitivity to change, and effects on emotional awareness, communication, or health outcomes remain to be examined, and such applications should be regarded as hypotheses for future evaluation.
5. Conclusions
This study provides preliminary percentile-rank and linear T-score references for the original 28-item CSEI-s, based on 1769 community adults recruited across 17 Korean regions. The values describe the non-probability reference sample and do not establish population norms or clinical cut-offs. Structural validity evidence is still limited, and further psychometric work is needed before the references are used to interpret individual profiles. The priorities are the factor structure, particularly the separation of Fear and Fright, and evidence for the validity of the subscale scores.
The tables show where each observed subscale score falls within a defined reference sample, while retaining the original scoring system. Whether such profiles help adults understand and talk about everyday emotions in community health education or primary care is a question for future studies.
Supplementary Materials
The following supporting information can be downloaded at https://www.mdpi.com/article/10.3390/healthcare14223958/s1, Table S1 lists the CSEI-s items, domain assignments, original Korean wording, and English translations; Tables S2–S7 provide score-conversion parameters, raw-score conversions, demographic summaries, and percentile uncertainty; Table S8 reports unadjusted group-difference CIs; Table S9 reports latent factor correlations, HTMT ratios, and HTMT bootstrap CIs; Table S10 reports covariate-adjusted group differences; Table S11 reports HC3 and interaction sensitivity analyses; Table S12 reports standardized item estimates for the correlated seven-factor ML model; Table S13 distinguishes ML, unadjusted ordinal, scaled ordinal, and robust ordinal fit indices and their RMSEA confidence intervals; Table S14 reports ordinal standardized loadings, robust standard errors, confidence intervals, residual variances, and item R2; Table S15 reports the exploratory concurrent-rating results; Tables S16 and S17 report the population benchmark and demographic-calibration sensitivity results; and Tables S18–S23 report analyses of misfit, ordinal invariance, DIF sensitivity, screening sensitivity, normalized T scores, and score-level precision.
Author Contributions
Conceptualization, H.W.K.; methodology, M.J.C.; validation, M.J.C. and D.-E.L.; formal analysis, M.J.C.; investigation, J.K., D.H.K., H.J.K. and I.C.J.; data curation, D.-E.L.; writing—original draft preparation, M.J.C.; writing—review and editing, D.-E.L., J.K., D.H.K., H.J.K. and I.C.J.; visualization, D.-E.L.; supervision, H.W.K.; funding acquisition, H.W.K. All authors have read and agreed to the published version of the manuscript.
Funding
This work was supported by the Korea Health Technology R&D Project through the Korea Health Industry Development Institute (KHIDI), funded by the Ministry of Health & Welfare, Republic of Korea (grant number RS-2021-KH109310 and RS-2023-KH138802).
Institutional Review Board Statement
The study was conducted in accordance with the Declaration of Helsinki and approved by the Institutional Review Board of Wonkwang University (WKUIRB-202112-SB-109; 21 December 2021).
Informed Consent Statement
Electronic informed consent was obtained from all participants before participation through the online survey panel platform.
Data Availability Statement
The article and Supplementary Materials contain the reported reference values and additional summary statistics. De-identified individual-level data are available from the corresponding author upon reasonable request. The code and analytical scripts are available from the corresponding author upon reasonable request.
Acknowledgments
During the preparation of this manuscript, the authors used GPT Astra (OpenAI, San Francisco, CA, USA; accessed 30 September–2 October 2026) for English language polishing, figure editing, and graphical abstract preparation, and Claude Opus 5.5 (Anthropic, San Francisco, CA, USA) for language editing. After using these tools, the authors reviewed and edited all AI-generated content, and take full responsibility for the study design, data collection, analysis, interpretation, and the entire manuscript.
Conflicts of Interest
The authors declare no conflicts of interest.
Abbreviations
The following abbreviations are used in this manuscript:
| Abbreviation | Definition |
| AVE | Average variance extracted |
| CFI | Comparative fit index |
| CHERRIES | Checklist for Reporting Results of Internet E-Surveys |
| CI | Confidence interval |
| CR | Composite reliability |
| CSEI | Core Seven-Emotions Inventory |
| CSEI-s | Core Seven-Emotions Inventory–Short Form |
| DIF | Differential item functioning |
| FDR | False discovery rate |
| GAD-7 | Generalized Anxiety Disorder-7 |
| GRoNC | Guidelines for Reporting on Norm-Referenced and Criterion-Referenced Scores |
| HC3 | Heteroskedasticity-consistent covariance estimator type 3 |
| HTMT | Heterotrait–monotrait ratio |
| IQR | Interquartile range |
| ML | Maximum likelihood |
| OLS | Ordinary least squares |
| PHQ-9 | Patient Health Questionnaire-9 |
| PR | Percentile rank |
| RMSEA | Root mean square error of approximation |
| SD | Standard deviation |
| SEM | Standard error of measurement |
| SRMR | Standardized root mean square residual |
| STROBE | Strengthening the Reporting of Observational Studies in Epidemiology |
| TLI | Tucker–Lewis index |
| VAS | Visual analog scale |
| WLSMV | Weighted least squares with mean- and variance-adjusted test statistics |
References
- Gray, E.K.; Watson, D. Emotion, mood, and temperament: Similarities, differences, and a synthesis. In Emotions at Work: Theory, Research and Applications in Management; Payne, R.L., Cooper, C.L., Eds.; John Wiley & Sons: Chichester, UK, 2001; pp. 21–43. ISBN 978-0-471-98759-8. [Google Scholar]
- Beedie, C.J.; Terry, P.C.; Lane, A.M. Distinctions between emotion and mood. Cogn. Emot. 2005, 19, 847–878. [Google Scholar] [CrossRef] [Scilit]
- Scherer, K.R. What are emotions? And how can they be measured? Soc. Sci. Inf. 2005, 44, 695–729. [Google Scholar] [CrossRef] [Scilit]
- Russell, J.A. Core affect and the psychological construction of emotion. Psychol. Rev. 2003, 110, 145–172. [Google Scholar] [CrossRef] [PubMed]
- Anderson, B. Affective atmospheres. Emot. Space Soc. 2009, 2, 77–81. [Google Scholar] [CrossRef] [Scilit]
- Kroenke, K.; Spitzer, R.L.; Williams, J.B.W. The PHQ-9: Validity of a brief depression severity measure. J. Gen. Intern. Med. 2001, 16, 606–613. [Google Scholar] [CrossRef] [Scilit] [PubMed]
- Spitzer, R.L.; Kroenke, K.; Williams, J.B.W.; Löwe, B. A brief measure for assessing generalized anxiety disorder: The GAD-7. Arch. Intern. Med. 2006, 166, 1092–1097. [Google Scholar] [CrossRef] [Scilit] [PubMed]
- Derks, D.; Fischer, A.H.; Bos, A.E.R. The role of emotion in computer-mediated communication: A review. Comput. Hum. Behav. 2008, 24, 766–785. [Google Scholar] [CrossRef] [Scilit]
- Lee, G.E.; Park, B.Y.; Kim, H.Y.; Lyu, Y.S.; Kang, H.W. A preliminary study on the development of the core emotion assessment instrument based on the Chiljeong. J. Orient. Neuropsychiatry 2014, 25, 109–122. (In Korean) [Google Scholar] [CrossRef] [Scilit]
- Lee, G.E.; Park, B.Y.; Moon, K.S.; You, J.M.; Kang, H.W. A study on the development of the Core Emotional Assessment Questionnaire (CEAQ) based on the Seven Emotions (七情). J. Orient. Neuropsychiatry 2015, 26, 143–160. (In Korean) [Google Scholar] [CrossRef] [Scilit]
- Cheong, M.J.; Lee, G.E.; Lee, Y.; Bae, K.H.; Kang, Y.; Kim, J.H.; Lyu, Y.S.; Kang, H.W. Validation of the Core Seven-Emotions Inventory–short form. Integr. Med. Res. 2019, 8, 116–119. [Google Scholar] [CrossRef] [Scilit] [PubMed]
- Kim, J.; Cheong, M.J.; Lee, D.E.; Lyu, Y.S.; Jung, I.C.; Kim, J.; Kang, H.W. A preliminary survey study on standardization of the Core Seven Emotions Inventory–Short Form (CSEI-s). J. Orient. Neuropsychiatry 2023, 34, 125–139. (In Korean) [Google Scholar] [CrossRef]
- American Educational Research Association; American Psychological Association; National Council on Measurement in Education. Standards for Educational and Psychological Testing; American Educational Research Association: Washington, DC, USA, 2014; Available online: https://www.testingstandards.net/open-access-files.html (accessed on 1 October 2026).
- Timmerman, M.E.; De Bildt, A.; Urban, J. The GRoNC: Guidelines for reporting on norm-referenced and criterion-referenced scores. Assessment 2026, 33, 954–972. [Google Scholar] [CrossRef] [Scilit] [PubMed]
- von Elm, E.; Altman, D.G.; Egger, M.; Pocock, S.J.; Gøtzsche, P.C.; Vandenbroucke, J.P. The Strengthening the Reporting of Observational Studies in Epidemiology (STROBE) statement: Guidelines for reporting observational studies. Lancet 2007, 370, 1453–1457. [Google Scholar] [CrossRef] [Scilit] [PubMed]
- Eysenbach, G. Improving the quality of Web surveys: The Checklist for Reporting Results of Internet E-Surveys (CHERRIES). J. Med. Internet Res. 2004, 6, e34. [Google Scholar] [CrossRef] [Scilit] [PubMed]
- Meade, A.W.; Craig, S.B. Identifying careless responses in survey data. Psychol. Methods 2012, 17, 437–455. [Google Scholar] [CrossRef] [Scilit] [PubMed]
- McDonald, R.P. Test Theory: A Unified Treatment; Lawrence Erlbaum Associates: Mahwah, NJ, USA, 1999. [Google Scholar] [CrossRef] [Scilit]
- Hu, L.; Bentler, P.M. Cutoff criteria for fit indexes in covariance structure analysis: Conventional criteria versus new alternatives. Struct. Equ. Model. 1999, 6, 1–55. [Google Scholar] [CrossRef] [Scilit]
- Flora, D.B.; Curran, P.J. An empirical evaluation of alternative methods of estimation for confirmatory factor analysis with ordinal data. Psychol. Methods 2004, 9, 466–491. [Google Scholar] [CrossRef] [Scilit] [PubMed]
- Rosseel, Y. lavaan: An R package for structural equation modeling. J. Stat. Softw. 2012, 48, 1–36. [Google Scholar] [CrossRef] [Scilit]
- Savalei, V. Improving fit indices in structural equation modeling with categorical data. Multivar. Behav. Res. 2021, 56, 390–407. [Google Scholar] [CrossRef] [Scilit] [PubMed]
- Asparouhov, T.; Muthén, B. Exploratory structural equation modeling. Struct. Equ. Model. 2009, 16, 397–438. [Google Scholar] [CrossRef] [Scilit]
- Henseler, J.; Ringle, C.M.; Sarstedt, M. A new criterion for assessing discriminant validity in variance-based structural equation modeling. J. Acad. Mark. Sci. 2015, 43, 115–135. [Google Scholar] [CrossRef] [Scilit]
- Steiger, J.H. A note on multiple sample extensions of the RMSEA fit index. Struct. Equ. Model. 1998, 5, 411–419. [Google Scholar] [CrossRef] [Scilit]
- Chen, F.F. Sensitivity of goodness of fit indexes to lack of measurement invariance. Struct. Equ. Model. 2007, 14, 464–504. [Google Scholar] [CrossRef] [Scilit]
- Wu, H.; Estabrook, R. Identification of confirmatory factor analysis models of different levels of invariance for ordered categorical outcomes. Psychometrika 2016, 81, 1014–1045. [Google Scholar] [CrossRef] [Scilit] [PubMed]
- Benjamini, Y.; Hochberg, Y. Controlling the false discovery rate: A practical and powerful approach to multiple testing. J. R. Stat. Soc. Ser. B Methodol. 1995, 57, 289–300. [Google Scholar] [CrossRef] [Scilit]
- Woods, C.M. Evaluation of MIMIC-model methods for DIF testing with comparison to two-group analysis. Multivar. Behav. Res. 2009, 44, 1–27. [Google Scholar] [CrossRef] [Scilit] [PubMed]
- Ministry of the Interior and Safety. Resident Registration Population Statistics by Age, March 2022. Ages 20–65; All Registration Categories; Foreigners Excluded. Available online: https://jumin.mois.go.kr/ageStatMonth.do (accessed on 4 October 2026).
- Crawford, J.R.; Henry, J.D. The Positive and Negative Affect Schedule (PANAS): Construct validity, measurement properties and normative data in a large non-clinical sample. Br. J. Clin. Psychol. 2004, 43, 245–265. [Google Scholar] [CrossRef] [Scilit] [PubMed]
- Crawford, J.R.; Henry, J.D.; Crombie, C.; Taylor, E.P. Normative data for the HADS from a large non-clinical sample. Br. J. Clin. Psychol. 2001, 40, 429–434. [Google Scholar] [CrossRef] [Scilit] [PubMed]
- Beauducel, A.; Wittmann, W.W. Simulation study on fit indexes in CFA based on data with slightly distorted simple structure. Struct. Equ. Model. 2005, 12, 41–75. [Google Scholar] [CrossRef] [Scilit] [PubMed]
- Xia, Y.; Yang, Y. RMSEA, CFI, and TLI in structural equation modeling with ordered categorical data: The story they tell depends on the estimation methods. Behav. Res. Methods 2019, 51, 409–428. [Google Scholar] [CrossRef] [Scilit] [PubMed]
- Russell, J.A. A circumplex model of affect. J. Pers. Soc. Psychol. 1980, 39, 1161–1178. [Google Scholar] [CrossRef] [Scilit]
- Watson, D.; Clark, L.A.; Tellegen, A. Development and validation of brief measures of positive and negative affect: The PANAS scales. J. Pers. Soc. Psychol. 1988, 54, 1063–1070. [Google Scholar] [CrossRef] [PubMed]
- McLean, C.P.; Asnaani, A.; Litz, B.T.; Hofmann, S.G. Gender differences in anxiety disorders: Prevalence, course of illness, comorbidity and burden of illness. J. Psychiatr. Res. 2011, 45, 1027–1035. [Google Scholar] [CrossRef] [Scilit] [PubMed]
- Carstensen, L.L.; Isaacowitz, D.M.; Charles, S.T. Taking time seriously: A theory of socioemotional selectivity. Am. Psychol. 1999, 54, 165–181. [Google Scholar] [CrossRef] [PubMed]
- Scheibe, S.; English, T.; Tsai, J.L.; Carstensen, L.L. Striving to feel good: Ideal affect, actual affect, and their correspondence across adulthood. Psychol. Aging 2013, 28, 160–171. [Google Scholar] [CrossRef] [Scilit] [PubMed]
- Vandenberg, R.J.; Lance, C.E. A review and synthesis of the measurement invariance literature: Suggestions, practices, and recommendations for organizational research. Organ. Res. Methods 2000, 3, 4–70. [Google Scholar] [CrossRef] [Scilit]
- Lee, J.K. As the incidence of Omicron increases, so will the number of deaths. Osong Public Health Res. Perspect. 2022, 13, 1–3. [Google Scholar] [CrossRef] [Scilit] [PubMed]
- World Health Organization. Mental Health. Available online: https://www.who.int/news-room/fact-sheets/detail/mental-health-strengthening-our-response (accessed on 10 November 2026).

Disclaimer/Publisher’s Note: The statements, opinions and data contained in all publications are solely those of the individual author(s) and contributor(s) and not of MDPI and/or the editor(s). MDPI and/or the editor(s) disclaim responsibility for any injury to people or property resulting from any ideas, methods, instructions or products referred to in the content. |
© 2026 by the authors. Licensee MDPI, Basel, Switzerland. This article is an open access article distributed under the terms and conditions of the Creative Commons Attribution (CC BY) license.