


Abstract
Background/Objectives: Newly registered autism spectrum disorder (ASD) cases in Kazakhstan have increased, but population-standardized regional variation and its relation to child psychiatry workforce capacity have not been described. Methods: This retrospective ecological study used annual psychiatric service reports (Form 10-f, Ministry of Health) for 2015–2025, including newly registered cases coded F84.0, F84.1 and F84.5 among children aged 0–17 years. Rates per 100,000 children were calculated nationally and for 16 historical-boundary regions. The national trend was modeled using negative binomial regression and regional inequality using the Gini coefficient. Results: The national rate of newly registered ASD cases increased from 3.9 to 63.5 per 100,000 children (average annual rate ratio 1.32, 95% CI 1.31–1.34), whereas child psychiatrist density declined from 2.06 to 1.43 per 100,000 children and the ratio of newly registered cases to child psychiatrists increased from 1.9 to 44.3. In 2025, regional rates ranged from 28.7 to 221.4 (Astana) per 100,000 children. The Gini coefficient of regional rates decreased from 0.64 to 0.32. Conclusions: Registered ASD cases increased markedly while child psychiatrist density declined, and registration rates varied substantially between regions. These data describe registration rather than prevalence, and regional estimates are subject to uncertainty in population denominators.
1. Introduction
Autism spectrum disorder (ASD) is a neurodevelopmental condition characterized by impairments in social communication and restricted, repetitive patterns of behavior. Globally, child and adolescent mental health conditions remain persistently under-resourced relative to their disease burden, particularly in low- and middle-income countries [1]. The Global Burden of Disease Study 2021 estimated that approximately 61.8 million people worldwide were on the autism spectrum, an age-standardized prevalence of 788.3 per 100,000 population, with autism ranking among the leading causes of non-fatal health burden in people younger than 20 years [2]. Global systematic reviews and meta-analyses report pooled ASD prevalence estimates of approximately 0.6–0.7% among children, with substantial heterogeneity between studies attributable in part to differences in case ascertainment method, diagnostic criteria and study setting [3,4]. A systematic review and meta-analysis of studies conducted in Asia reported a lower pooled prevalence of 0.36% [5].
In Kazakhstan, awareness of ASD as a distinct clinical and administrative category has grown considerably over the past decade, accompanying broader reforms to child mental health services and the introduction of routine developmental screening in primary care, within a national legal framework for social and medical–pedagogical support of children with disabilities established in 2002 [6]. This mirrors a broader global policy shift: a 2023 joint WHO/UNICEF report identified early detection and family-centered support for children with developmental disabilities, including ASD, as a priority in low- and middle-income health systems, while noting that specialist assessment and intervention services remain heavily concentrated in a small number of urban centers in most such settings [7]. Several recent studies using Kazakhstan’s Unified National Electronic Healthcare System (UNEHS) have documented a steep rise in both incidence and period prevalence of registered ASD between 2014 and 2021, alongside regional variation attributed descriptively to differences in healthcare infrastructure, urbanization, and environmental exposure [8,9]. A separate UNEHS-based analysis has additionally linked ASD incidence in Kazakhstani children to patterns of all-cause hospitalization and associated risk factors [10], underscoring the growing volume of registry-based ASD research using this data source specifically. Kazakhstan’s Ministry of Health also maintains an independent, longer-running administrative data stream—the annual Form 10-f report on diseases and contingents of patients with mental and behavioral disorders, compiled by the psychiatric service—which has not, to our knowledge, been used to examine regional ASD disparities through 2025, nor linked explicitly to trends in the specialist workforce responsible for diagnosis.
This gap matters for two reasons. First, extending the observation window to 2025 captures a period of markedly accelerated registration that is not visible in analyses ending in 2022 or 2024. Second, a rising count of registered cases is, by itself, uninformative about whether the system that generates that count—child psychiatrists, developmental pediatricians, and screening infrastructure—has expanded commensurately; if it has not, regional differences in registration rates may partly reflect where diagnostic capacity is concentrated, a possibility that registration data alone cannot test, with potential implications for future service-capacity planning.
We therefore used Form 10-f registry data for 2015–2025 to (1) describe the national trend in registered ASD cases and rates per 100,000 children; (2) quantify the magnitude and persistence of regional disparities in population-standardized registered ASD rates using the absolute change in rates between 2015 and 2025, the coefficient of variation and the Gini coefficient; and (3) relate the national trend in registrations to the trend in child psychiatrist workforce size, to assess whether specialist workforce capacity has kept pace with the rise in registered cases. We interpret these findings in the context of Kazakhstan’s 2022 administrative reorganization (creation of Abai, Zhetysu, and Ulytau regions) and discuss implications for healthcare planning and equitable service delivery.
2. Materials and Methods
2.1. Study Design and Data Source
This was a retrospective, registry-based ecological (population-level) study. The primary data source was the annual Form 10-f report (“Report on diseases and contingents of patients with mental and behavioral disorders”), compiled by the psychiatric service of the Ministry of Health of the Republic of Kazakhstan, for the years 2015 through 2025 inclusive. Form 10-f reports are prepared by healthcare organizations providing psychiatric care and submitted to the regional centers of electronic healthcare, where they are aggregated at the regional level and then consolidated at the national level by the Republican Center for Electronic Health Care of the Ministry of Health. The data available for this study comprised aggregate annual counts of newly registered children aged 0–17 years by ICD-10 diagnostic category and administrative region, together with annual counts of psychiatrists and child psychiatrists; individual-level records were not available to the authors. The extract was provided to the authors by the Republican Center for Electronic Health Care upon official request and was restricted by the data provider to children aged 0–17 years. Form 10-f is the annual administrative report on diseases and contingents of patients with mental and behavioral disorders; in its current version (Appendix 13 to Order of the Minister of Health of the Republic of Kazakhstan No. ҚP ДCM-313/2020 of 22 December 2020, as amended by Order No. ҚP ДCM-144 of 30 November 2022), the form carries the index 13-PPR and is submitted annually by healthcare organizations at district, regional and city level by 10 February of the year following the reporting period [11]. Table 1000 of the form reports patients in whom a mental or behavioral disorder was diagnosed for the first time in life during the reporting year, by sex and age group. Within disorders of psychological development (F80–F89), childhood autism (F84.0), atypical autism (F84.1) and Asperger syndrome (F84.5) are reported as separate rows, whereas other F84 subcategories are not reported separately. Table 1000 is compiled from the outpatient medical record (form No. 052/u, insert 5 “Dynamic (dispensary) observation of the patient”), and patients are registered by the psychiatric organization serving the area of their residence, irrespective of where the diagnosis was established. A sample of the form, with an English translation of the rows used in this study, is provided in the Supplementary Materials (Figure S1). This administrative pathway is distinct from the Unified National Electronic Healthcare System (UNEHS)-based registries used in prior Kazakhstani studies [8,9], and captures newly registered patients presenting through the psychiatric/developmental service network rather than all electronic health record contacts. The Form 10-f ASD data and psychiatrist workforce data were provided in electronic Excel format and therefore did not require manual transcription from paper records. Population denominators were entered separately from official statistical compilations of the Bureau of National Statistics of the Republic of Kazakhstan and matched to the corresponding study years and geographic units before calculation of population-standardized rates. National annual totals and the corresponding regional breakdowns were cross-checked for internal consistency; one discrepancy was identified for 2020 (childhood autism, F84.0), where the national aggregate figure exceeded the sum of regional counts by 30 cases. Because two independently structured regional data extracts—one organized by region and diagnostic code across years, the other by region and year across diagnostic codes—agreed with each other exactly, the regional-sum value was adopted as the corrected figure for this cell throughout the manuscript. A sensitivity analysis retaining the original, uncorrected 2020 national aggregate yielded a nearly identical rate ratio (1.325, 95% CI 1.308–1.342, versus 1.324, 95% CI 1.305–1.343, in the corrected analysis reported throughout) and did not alter the interpretation of the national trend.
2.2. Case Definition
Cases were defined using ICD-10 codes as reported in Form 10-f, consistent with the World Health Organization’s International Statistical Classification of Diseases and Related Health Problems, 10th Revision [12]: F84.0 (childhood autism), F84.1 (atypical autism), and F84.5 (Asperger syndrome). These three codes were selected because they correspond to the ICD-10 pervasive developmental disorder categories that were consolidated into the single diagnosis of autism spectrum disorder in DSM-5 and ICD-11, and because they were the ASD-related codes available as separate categories in the Form 10-f data obtained for this study for all years 2015–2025. Rett syndrome (F84.2) was excluded because it is a genetically defined condition classified outside autism spectrum disorder in DSM-5 and ICD-11. Other childhood disintegrative disorder (F84.3) and other or unspecified pervasive developmental disorders (F84.8, F84.9) were not available as separate categories in these data and were therefore not included. The same three-code definition was applied in every year and region. The three diagnostic categories were summed to derive the combined ASD total (F84.0 + F84.1 + F84.5), which was the outcome for all trend and disparity analyses; category-specific counts were retained descriptively, but comparison between diagnostic categories was not an objective of this study. Broader “disorders of psychological development” (F80–F89) figures were also extracted for context but were not the primary outcome. The Form 10-f data used in this study comprised newly registered cases among children aged 0–17 years only; patients aged 18 years or older were not included. The numerator and the denominator therefore refer to the same age range (0–17 years). Screening results were not used as a case definition: cases entered the analysis only if they were recorded in Form 10-f under one of the included ICD-10 diagnostic codes. Because individual clinical records were unavailable, the diagnostic assessment and specialist-confirmation pathway for individual registered cases could not be independently verified. The national diagnostic pathway is described in Section 2.3.
2.3. Diagnostic Pathway for Autism Spectrum Disorder in Kazakhstan
During the study period, the diagnosis of ASD in Kazakhstan was guided by two successive national clinical protocols: the protocol “Autism” (2015), covering childhood autism and atypical autism [13], and the protocol “Pervasive Developmental Disorders (Autism Spectrum Disorders)” (2021), which additionally covers Asperger syndrome [14]. Under the 2021 protocol, the diagnostic pathway comprises the following stages.
(1) Identification of children at risk. Screening with the M-CHAT-R is recommended for children aged two years during preventive examinations in primary healthcare, as an additional screening method whose use is determined by the physician [14]. Children with delayed speech and communication skills, behavioral or emotional disturbances, a sibling with a pervasive developmental disorder, or a positive screening result are considered at risk and are referred to a psychiatrist. Implementation of standardized screening in primary healthcare has been reported to be uneven, with pilot use in selected regions [15].
(2) Psychiatric assessment. The initial diagnosis is established by a psychiatrist (child or adult) in the mental health service, on the basis of the developmental history and the current clinical presentation, by identifying the combination of qualitative impairments in social interaction, abnormalities in communication, and restricted, stereotyped, repetitive behavior specified in the ICD-10 diagnostic criteria [14]. When the diagnosis cannot be established on an outpatient basis, the protocol provides for planned hospitalization for examination.
(3) Supplementary assessments and differential diagnosis. The Autism Diagnostic Observation Schedule, Second Edition (ADOS-2), the Autism Diagnostic Interview–Revised (ADI-R), and an experimental-psychological (pathopsychological) assessment by a clinical psychologist are designated as additional methods, used when indicated by the treating physician [14]. Pediatric assessment for somatic comorbidity, audiological assessment in children with speech delay, and consultation with other specialists (e.g., neurologist, speech therapist, special education specialist) are recommended as indicated. Differential diagnosis within category F84 is based on dynamic clinical-psychopathological examination and observation and on experimental-psychological assessment. Routine use of standardized diagnostic instruments in clinical practice has been reported to be limited [16].
(4) Diagnosis and coding. The diagnosis is coded according to ICD-10. The 2021 protocol further subdivides childhood autism and atypical autism into national five-character subcategories (F84.01, F84.02, F84.11, F84.12); the Form 10-f data analyzed in this study were reported at the level of F84.0, F84.1 and F84.5.
(5) Post-diagnostic management and reporting. After the diagnosis is established, the psychiatrist determines, with the informed consent of the child’s parents or legal representatives, the need for and type of dynamic observation, and the medical advisory commission issues conclusions for the psychological–medical–pedagogical commission (educational placement) and for the medical and social expert commission (disability assessment) [14]. Cases in which the diagnosis was established for the first time in life are recorded in the outpatient medical record and reported in Table 1000 of Form 10-f, as described in Section 2.1.
Because most of the standardized instruments described above are designated as additional methods, and because individual medical records were unavailable, the authors could not determine which assessments were applied to individual registered cases. Moreover, because the national clinical guidance changed during the study period, the pathway described above should not be interpreted as evidence that identical diagnostic procedures were applied consistently throughout 2015–2025.
2.4. Geographic Units
Data were reported at the level of Kazakhstan’s administrative regions. Because three new regions (Abai, Zhetysu, Ulytau) were carved out of existing regions in 2022, and the former South Kazakhstan region was earlier split into Turkestan region and the city of Shymkent, raw counts were retained by administrative unit as reported in each year, including both historical and current administrative divisions, for descriptive presentation (Table S1), whereas all longitudinal regional disparity analyses for 2015–2025 used a consistent 16-unit historical-boundary classification, in which post-reform regions were merged back into their pre-reform parent region (Abai merged with East Kazakhstan; Ulytau merged with Karaganda; Zhetysu merged with Almaty region; Turkestan, Shymkent, and the historical South Kazakhstan region merged into a single “Southern macro-region”). This merging preserves a like-for-like comparison across the full study period. A crosswalk between the administrative units and the historical-boundary analytical units is provided in Table S2e.
2.5. Population Denominators
National annual population and national child population (ages 0–17) were obtained from institutional Bureau of National Statistics compilations [17] and used to calculate national-level rates per 100,000 total population and per 100,000 children. Region-specific child population denominators (ages 0–17) for each year 2015–2025 were subsequently obtained from regional statistical compilations of the same institutional source, disaggregated by the 17 administrative regions in use prior to the 2022 reorganization (i.e., prior to Abai, Zhetysu, and Ulytau being split out as separate units). These regional population figures were paired with case counts using the historical 16-unit boundary classification described in Section 2.4 (Abai, Zhetysu, and Ulytau cases merged into East Kazakhstan, Almaty region, and Karaganda respectively; Turkestan and Shymkent populations summed to approximate the pre-2018 South Kazakhstan boundary), yielding population-standardized ASD registration rates per 100,000 children for all 16 historical-boundary regions across the full study period. We identified and corrected a specific numerator–denominator mismatch affecting three regions: the regional population source did not include separate population figures for Abai, Zhetysu, and Ulytau (consistent with the source dataset’s 17-region, pre-2022 structure), whereas ASD cases for these three new regions are recorded separately in Form 10-f from 2023 onward (2022 case counts for all three were zero). Pairing the combined case counts (parent region + new region) with the parent region’s population alone would inflate the rates for East Kazakhstan, Almaty region, and Karaganda for 2023–2025. We corrected this by estimating the child population of Abai, Zhetysu, and Ulytau using each region’s total population (obtained from published Bureau of National Statistics regional summaries) multiplied by its parent region’s child-to-total population ratio (as observed in our data for East Kazakhstan, Almaty region, and Karaganda respectively), and adding this estimate to the parent region’s population for 2023–2025 before computing rates. This approach assumes that the age structure of each newly created region was approximately similar to that of its parent region in the corresponding year. This estimation step introduces additional uncertainty beyond the underlying data for these three region-years specifically; results for the remaining 13 historical-boundary regions, and for all regions in 2015–2022, do not rely on this estimation step. This correction substantially, though not completely, resolved a broader data-reconciliation issue we identified: prior to correction, the summed 16-region child population total was 7–9% lower than the independently compiled national child population total in every study year. For 2023–2025, adding the estimated Abai/Zhetysu/Ulytau population closed most of this gap (e.g., from a 504,008-person shortfall to a 36,491-person, 0.5%, shortfall in 2025), indicating that the missing population of these three new regions was the primary driver of the discrepancy for those years. For 2015–2022, which predate the estimation correction, the regional total remained 7–9% lower than the national total, and we were unable to fully reconcile this earlier-period residual discrepancy at the time of writing; it is addressed further in the Limitations section.
2.6. Workforce Data
Annual headcounts of psychiatrists and child psychiatrists nationwide (with urban/rural breakdown) were extracted from the same institutional dataset for 2015–2025. Child psychiatrist counts were expressed per 100,000 children aged 0–17, using the same national child population denominator as the ASD case rate, since this is the population from which pediatric ASD cases are drawn; total psychiatrist counts (adult and child combined) were expressed per 100,000 total population, consistent with standard workforce-density reporting for the general specialist pool. A derived indicator—newly registered ASD cases per child psychiatrist per year—was also calculated as a system-level indicator of the relation between registrations and specialist capacity; it is not a measure of the diagnostic activity of psychiatrists or of individual caseload (see Section 3 and Section 4 for this distinction).
2.7. Statistical Analysis
Descriptive statistics (counts, rates, percentages, absolute change in rates, coefficient of variation; compound annual growth rate [CAGR] as a supplementary descriptive measure only) were computed in Python (version 3.13.5) using pandas (version 2.2.3) and NumPy (version 2.3.5). The national time trend in registered ASD cases (2015–2025) was tested formally using a negative binomial regression of annual case count on calendar year (centered), with log child population as an offset, fitted by maximum likelihood (statsmodels, version 0.14.6); a negative binomial rather than Poisson specification was used because a preliminary Poisson model showed marked overdispersion (Pearson χ2/df = 5.13), consistent with standard guidance for count data exhibiting variance in excess of the mean [18]. The exponentiated year coefficient is reported as a rate ratio (labeled IRR by convention for count-regression models, though it refers here to the rate of newly registered cases rather than to epidemiological incidence in the strict sense) with a 95% confidence interval. Model adequacy was assessed using the Pearson and deviance goodness-of-fit statistics, inspection of Pearson residuals, the Ljung–Box test for residual autocorrelation (lags 1–3), Newey–West heteroscedasticity- and autocorrelation-consistent standard errors (lag 1), leave-one-year-out re-estimation, Cook’s distance, and comparison with a Poisson model with robust (sandwich) standard errors. Departure from a constant annual rate of change was assessed by adding a quadratic term for calendar year and comparing models with a likelihood-ratio test. Given the small number of annual observations (n = 11), these diagnostics have limited statistical power and were interpreted descriptively (Table S3). Geographic concentration of registered ASD rates was quantified for each year using both the coefficient of variation (CV = SD/mean × 100) and the Gini coefficient across the 16 historical-boundary regional rates (registered cases per 100,000 children), following established use of these indices in the health-equity literature for measuring the concentration of a health-related variable across population subgroups [19]; because these measures are computed here on population-standardized rates rather than raw case counts, they are interpretable as measures of geographic inequality in registered ASD rates, subject to the population-data reconciliation caveat described in Section 2.5. The Gini coefficient provides a bounded (0–1) measure of concentration that is comparatively less sensitive to a small number of very large regions than the CV. No individual-level or patient-identifiable data were used; the study relied exclusively on aggregate, previously de-identified administrative counts. Regional change between 2015 and 2025 was summarized as the absolute difference in rates and the change in regional rank, and the association between regional rates in 2015 and 2025 was assessed with Spearman’s rank correlation coefficient. CAGR values are reported in Table S4 and were not interpreted for regions with fewer than 5 registered cases in 2015. Because the summed regional child population was 7–9% lower than the national total in 2015–2022 (Section 2.5), the sensitivity of regional rates, rankings, the coefficient of variation and the Gini coefficient to the denominators was assessed under three scenarios: (A) proportional scaling of all regional denominators in each year to the national total; (B) allocation of the annual shortfall to East Kazakhstan, Almaty region and Karaganda in proportion to the estimated 2023 child populations of Abai, Zhetysu and Ulytau, respectively; and (C) allocation of the entire annual shortfall to each region in turn (16 scenarios per year), to bound the effect of an unknown distribution of the shortfall (Table S5).
3. Results
3.1. National Trend, 2015–2025
The national number of newly registered ASD cases rose from 207 in 2015 to 4386 in 2025 (Table 1), a 21.2-fold increase in absolute count. Expressed per 100,000 children aged 0–17, the rate rose from 3.91 to 63.54—a 16.3-fold increase. Childhood autism (F84.0) specifically rose from 2.34 to 44.81 per 100,000 children over the same period. A negative binomial regression indicated an average increase in the registered case rate of 32.4% per year over 2015–2025 (rate ratio 1.324, 95% CI 1.305–1.343; p < 0.001). The negative binomial specification adequately accounted for overdispersion (Pearson χ2/df 1.17 vs. 5.13 for the Poisson model). The estimate was stable when each year was omitted in turn (range 1.317–1.330) and when autocorrelation-consistent standard errors were used, and no significant residual autocorrelation was detected (Table S3). A Poisson model with robust standard errors gave a similar estimate (rate ratio 1.340, 95% CI 1.322–1.358). The largest residual occurred in 2020, when the observed number of registrations was lower than predicted. Adding a quadratic term improved model fit (likelihood-ratio χ2 = 11.3, p < 0.001), indicating that the rate of increase was not constant but accelerated over the period. The rate ratio should therefore be interpreted as an average over the study period rather than as a constant annual growth rate.
Table 1.
National ASD registration trends and psychiatric workforce, Kazakhstan, 2015–2025.
3.2. Child Psychiatry Workforce Capacity
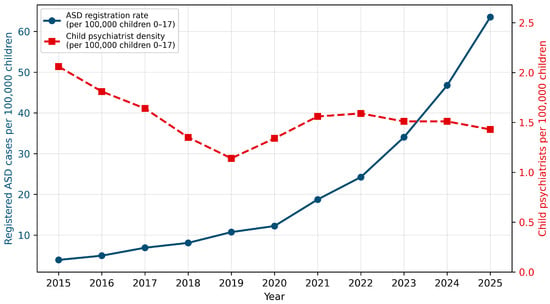
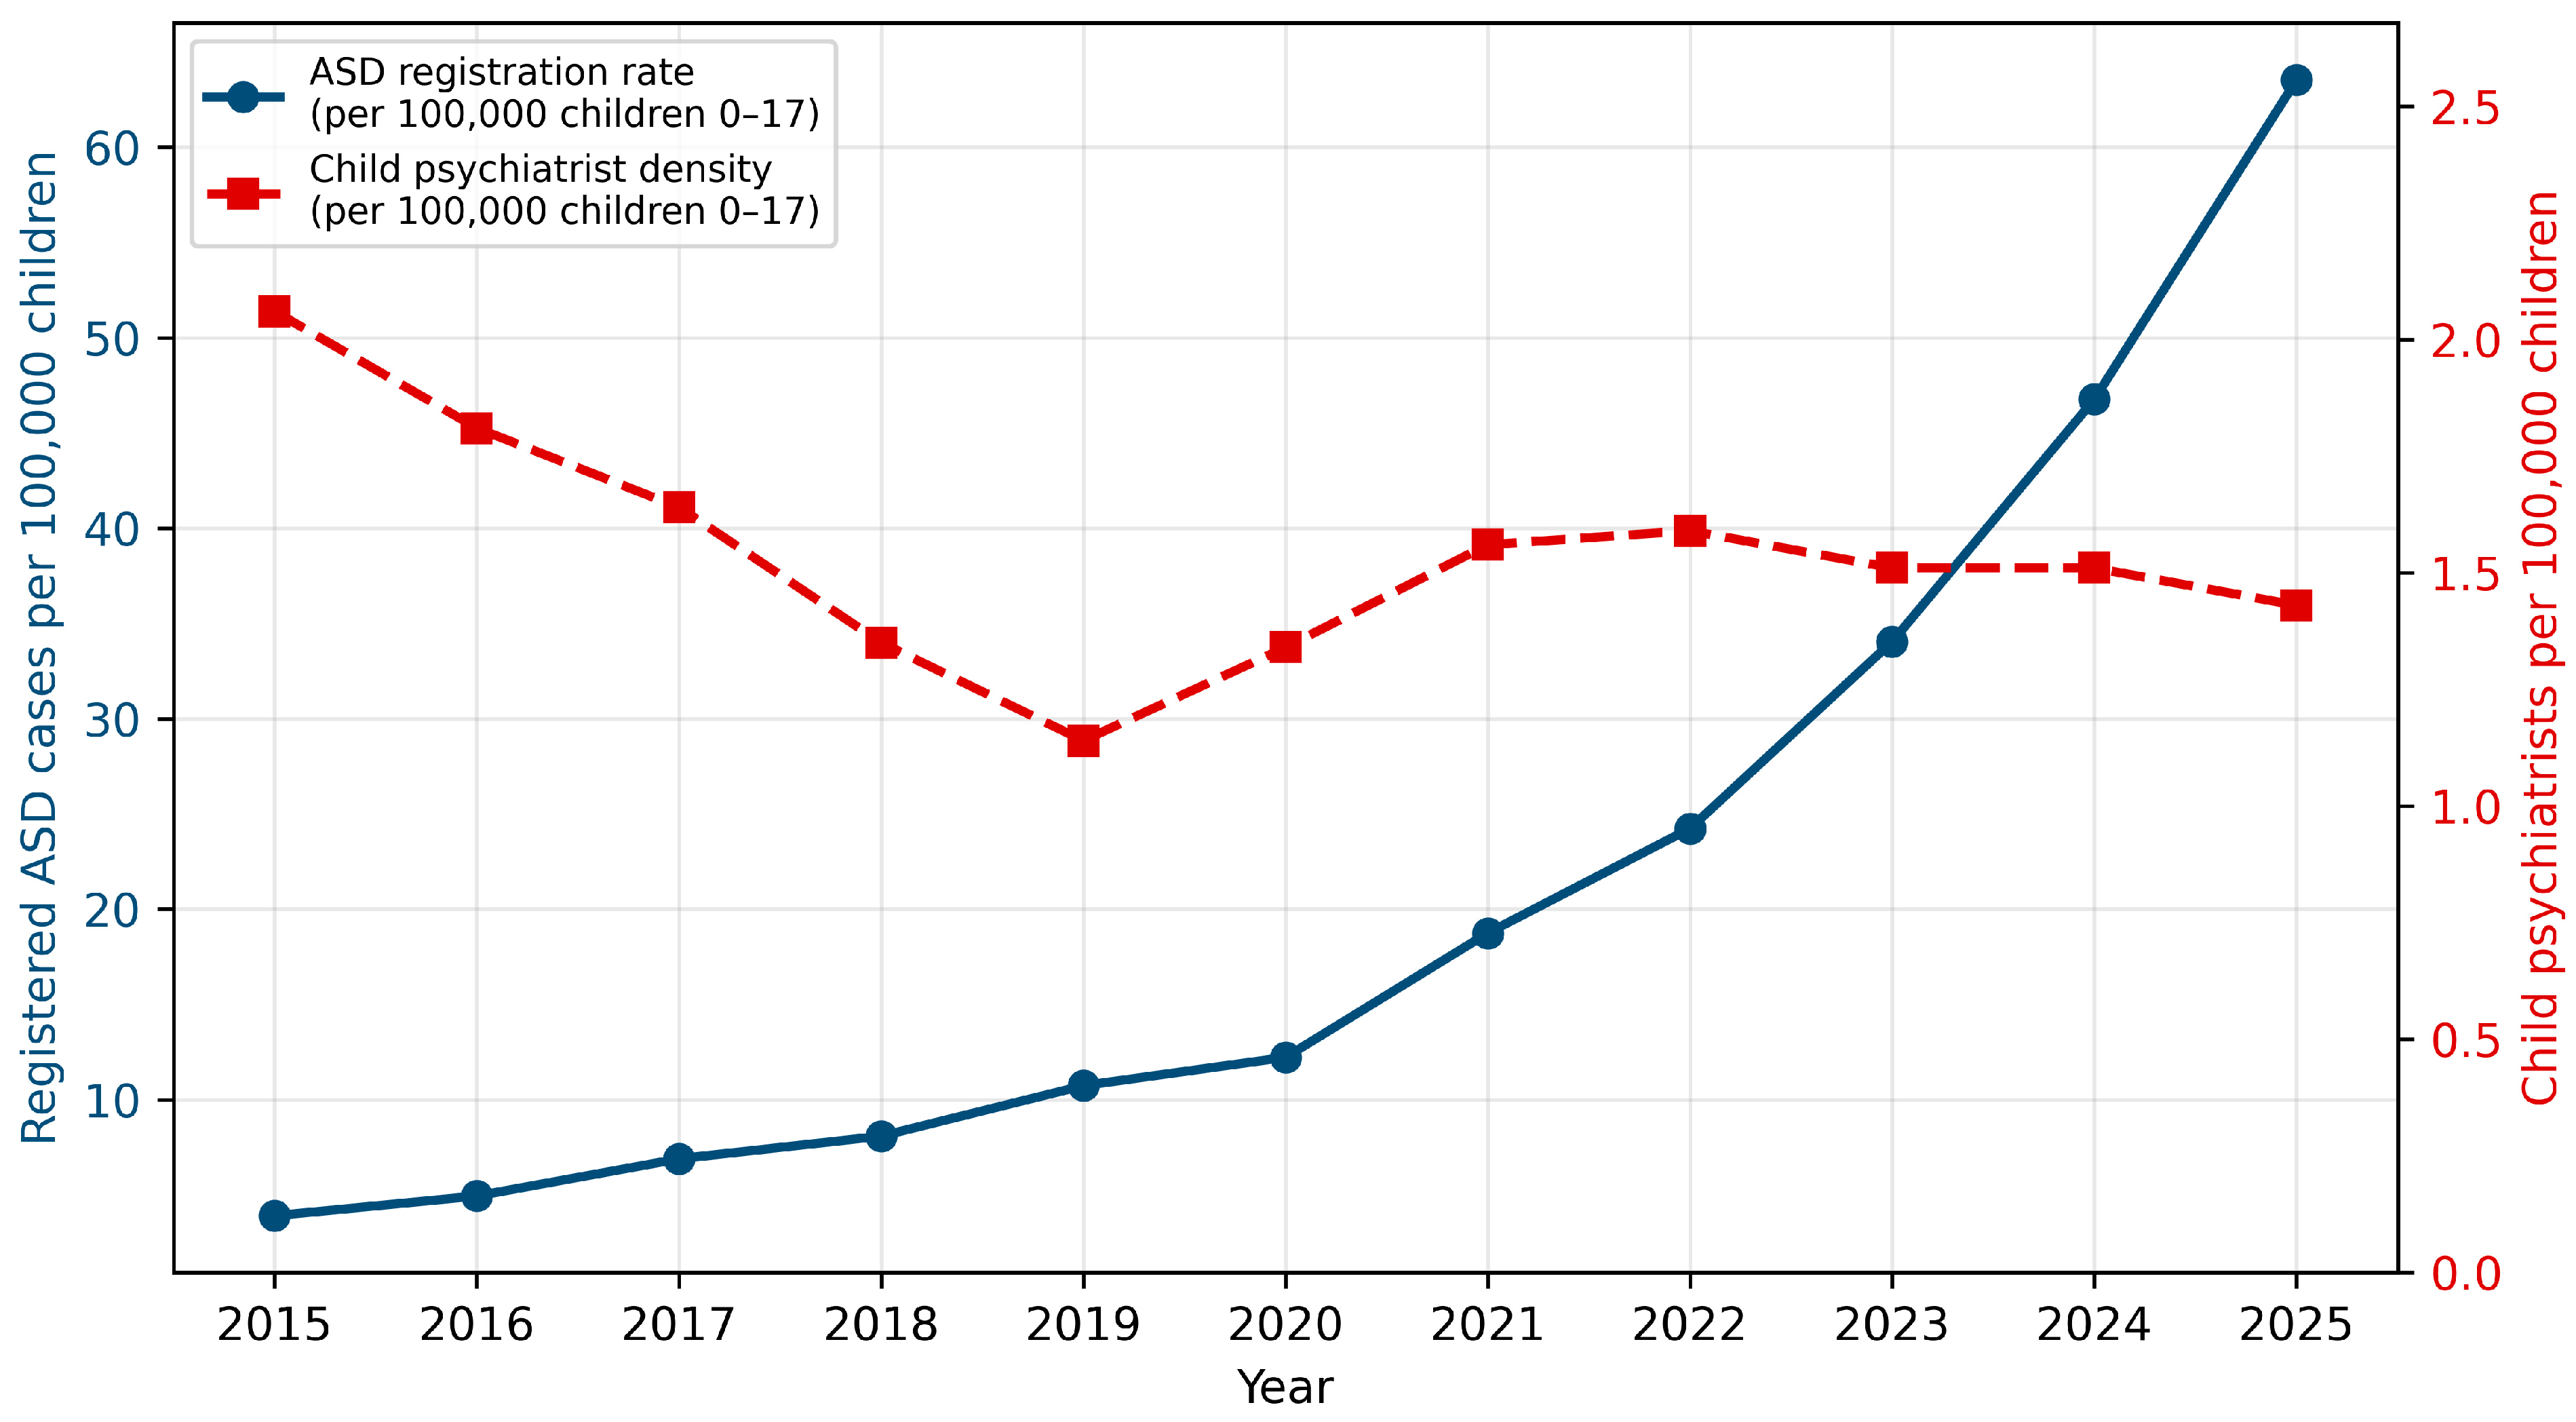
Child psychiatrist headcount nationwide did not keep pace with the rise in registrations, and child psychiatrist density relative to the growing child population actually declined: from 2.06 per 100,000 children in 2015 to a low of 1.14 in 2019, before partially recovering to 1.43 per 100,000 children by 2025 (Table 1; Figure 1)—still well below the 2015 level. Over the same period, the ratio of newly registered ASD cases to child psychiatrists rose from 1.9 in 2015 to 44.3 in 2025—a roughly 23-fold increase. We label this an ASD registrations-to-child-psychiatrist ratio rather than a per-provider caseload, since registry counts do not indicate how many children each individual psychiatrist evaluated, how diagnostic responsibility was distributed among psychiatrists, pediatricians, and psychologists, or how many non-ASD conditions each provider also managed; the ratio is best interpreted as a system-level indicator of potential capacity pressure, not as a measure of the diagnostic activity of psychiatrists or of individual caseloads. Total psychiatrists (adult and child combined) per 100,000 population were essentially flat across the decade (4.29 in 2015; 4.65 in 2025).
Figure 1.
National ASD registration rate (per 100,000 children 0–17) versus child psychiatrist density (per 100,000 children 0–17), Kazakhstan, 2015–2025.
3.3. Regional Distribution and Disparities
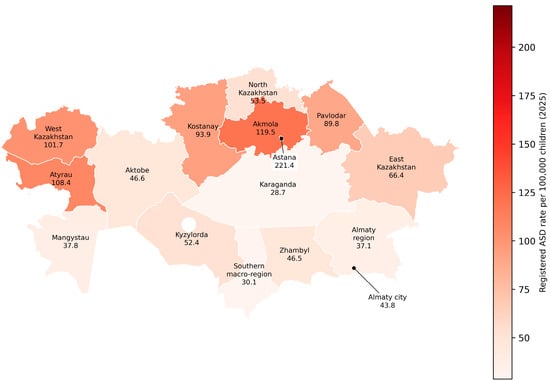
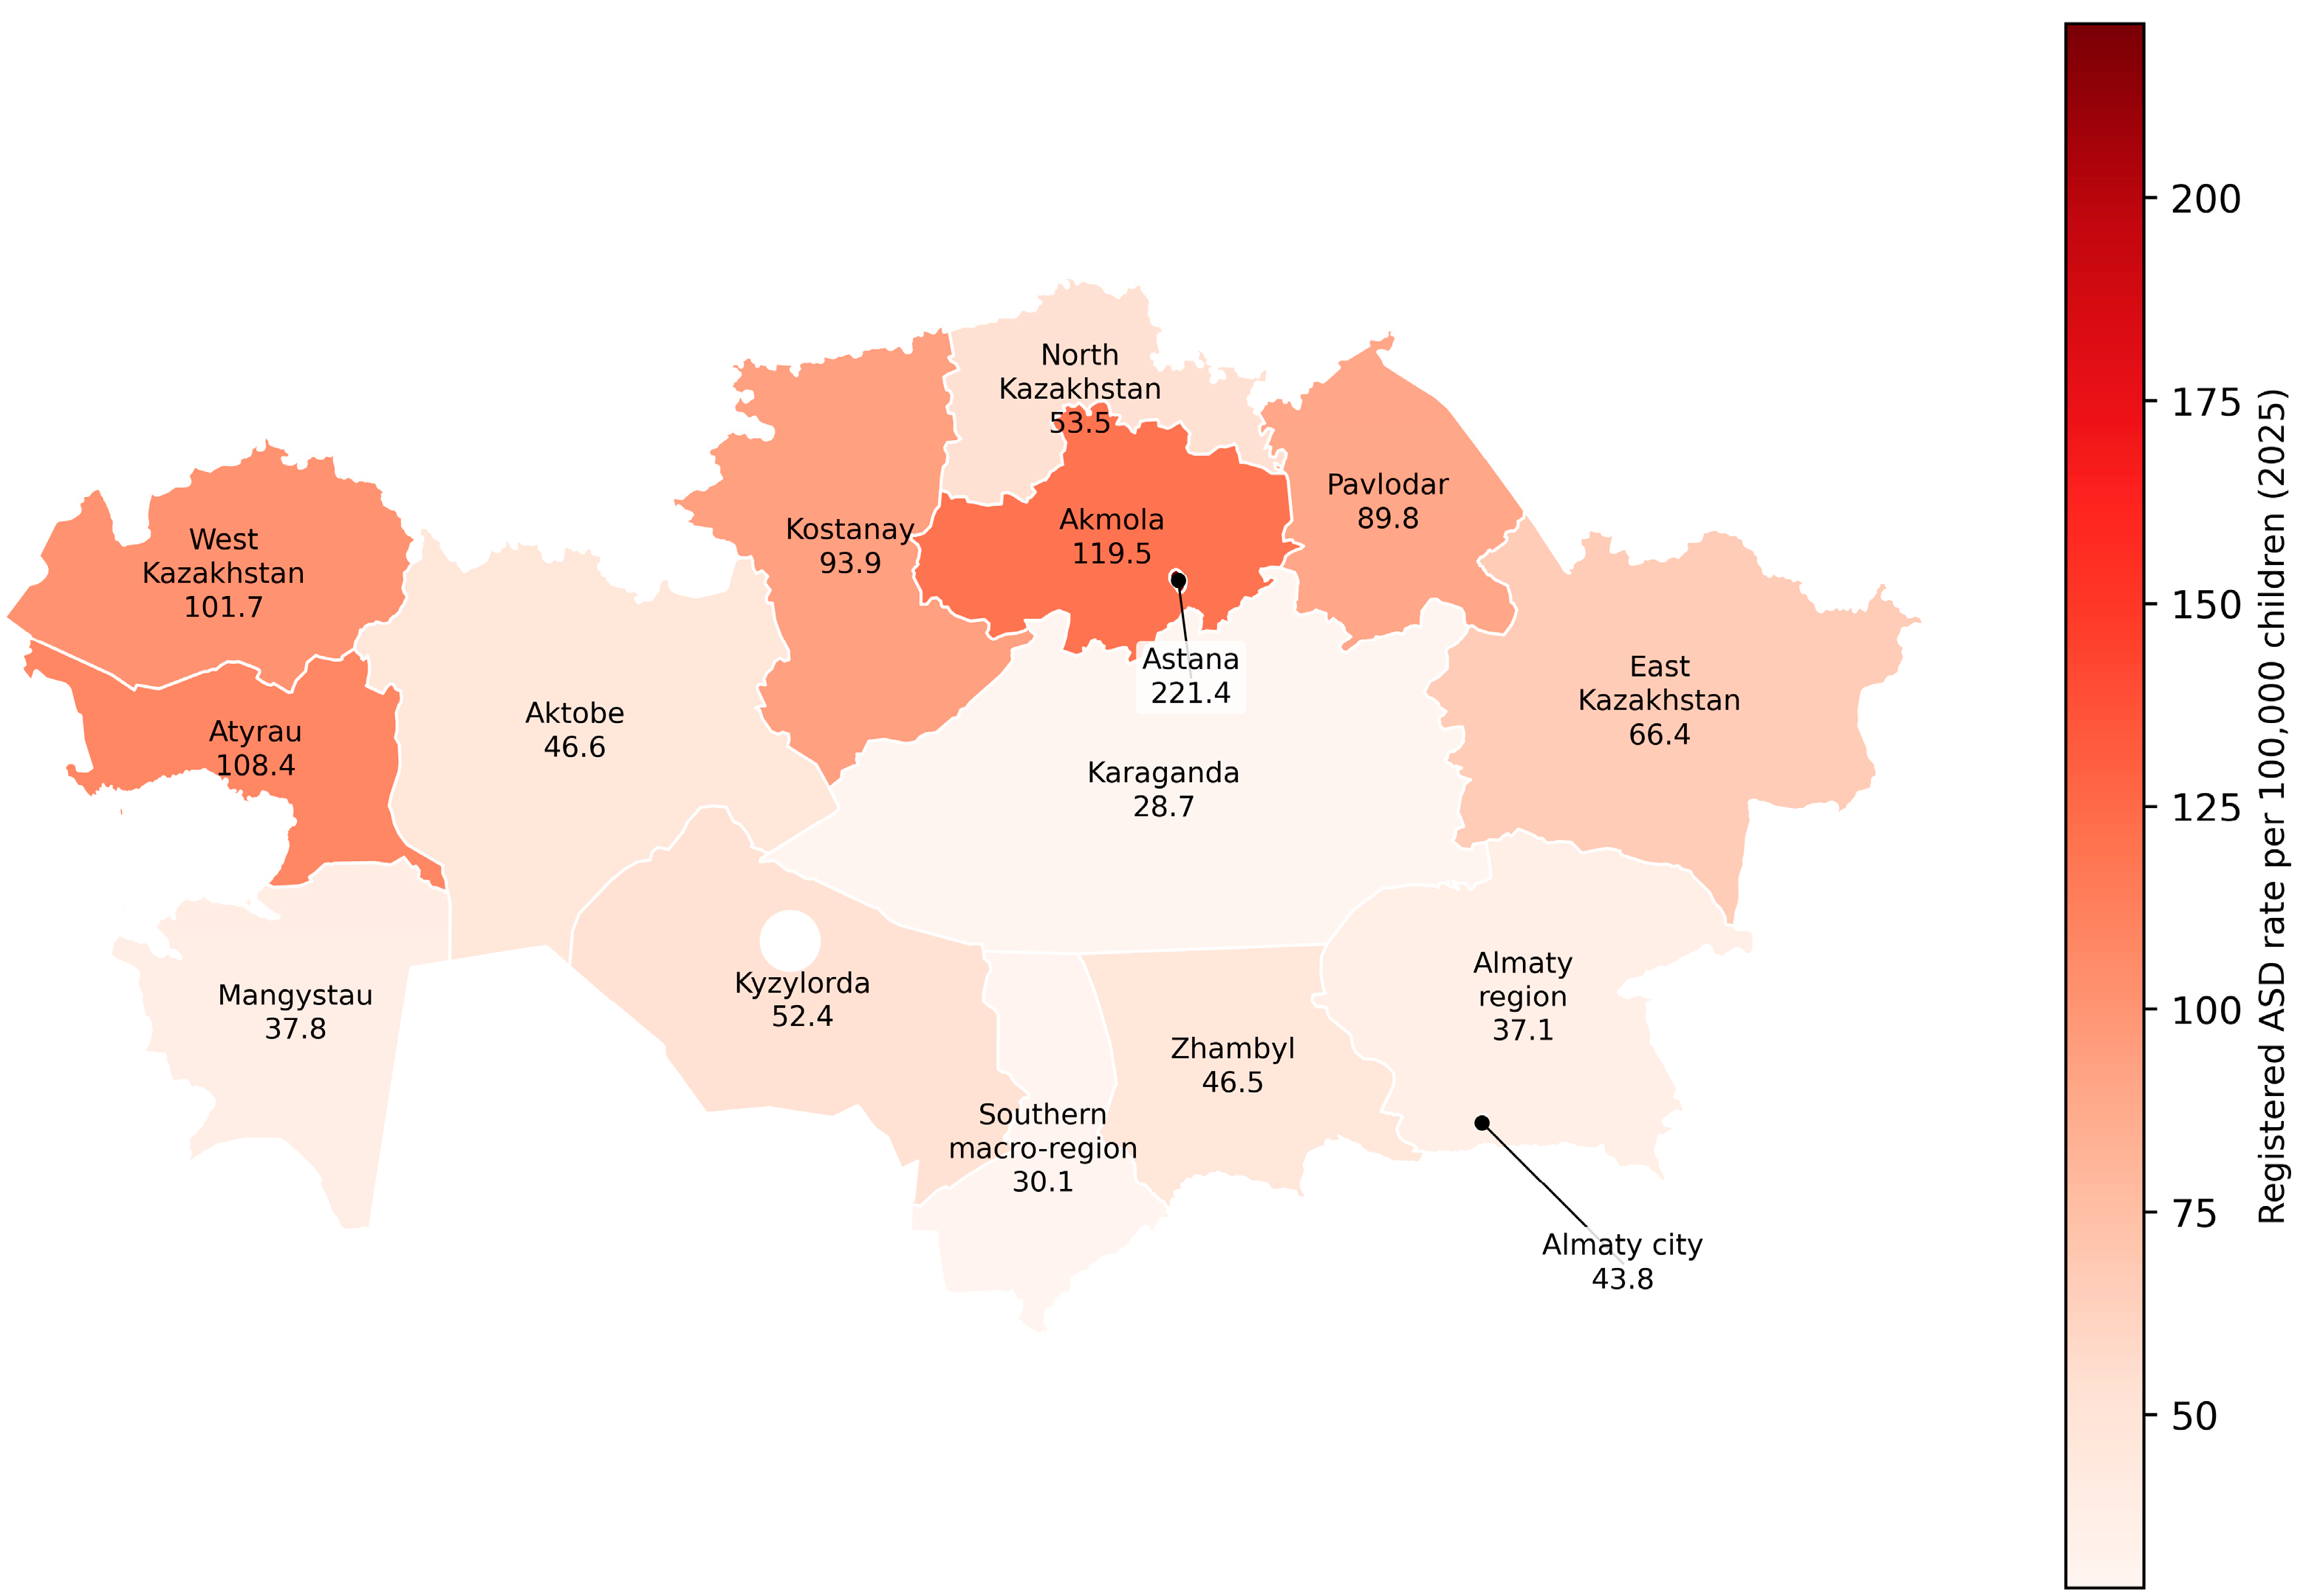
Table 2 and Figure 2 present a cross-sectional snapshot of the most recent year (2025) to summarize the current regional distribution of population-standardized ASD registration rates (registered cases per 100,000 children), using the historical 16-unit boundary classification (Section 2.4) for which regional population denominators were available; the full year-by-year regional rate series (2015–2025) underlying this snapshot is provided in Table S2d (Supplementary Materials), while raw case counts by administrative unit, including historical and current divisions, remain available in Table S1. Table 3 reports the change in regional rates between 2015 and 2025, and Figure 3 reports concentration trends across the full study period. Astana had by far the highest registered ASD rate in 2025 (221.4 per 100,000 children), nearly 1.9 times the second-highest region (Akmola, 119.5 per 100,000) and nearly eight times the lowest-rate region (Karaganda, incl. Ulytau, 28.7 per 100,000). Astana accounted for 25.6% of national registrations in 2025 while holding only 7.4% of the child population across the 16 historical-boundary regions—a roughly 3.5-fold overrepresentation relative to its population share, indicating that Astana’s elevated raw case count reflects a substantially higher per capita registration rate rather than merely a larger regional population.
Table 2.
Regional ranking of registered ASD rates per 100,000 children, 2025 (population-standardized; single-year snapshot, full 2015–2025 series in Table S2d).
Figure 2.
Regional distribution of registered ASD rates per 100,000 children (historical-boundary regions), Kazakhstan, 2025 (single-year snapshot; full 2015–2025 series in Table S2d).
Table 3.
Registered ASD rate per 100,000 children aged 0–17 years by historical-boundary region, 2015 and 2025: absolute change and regional rank (population-standardized).
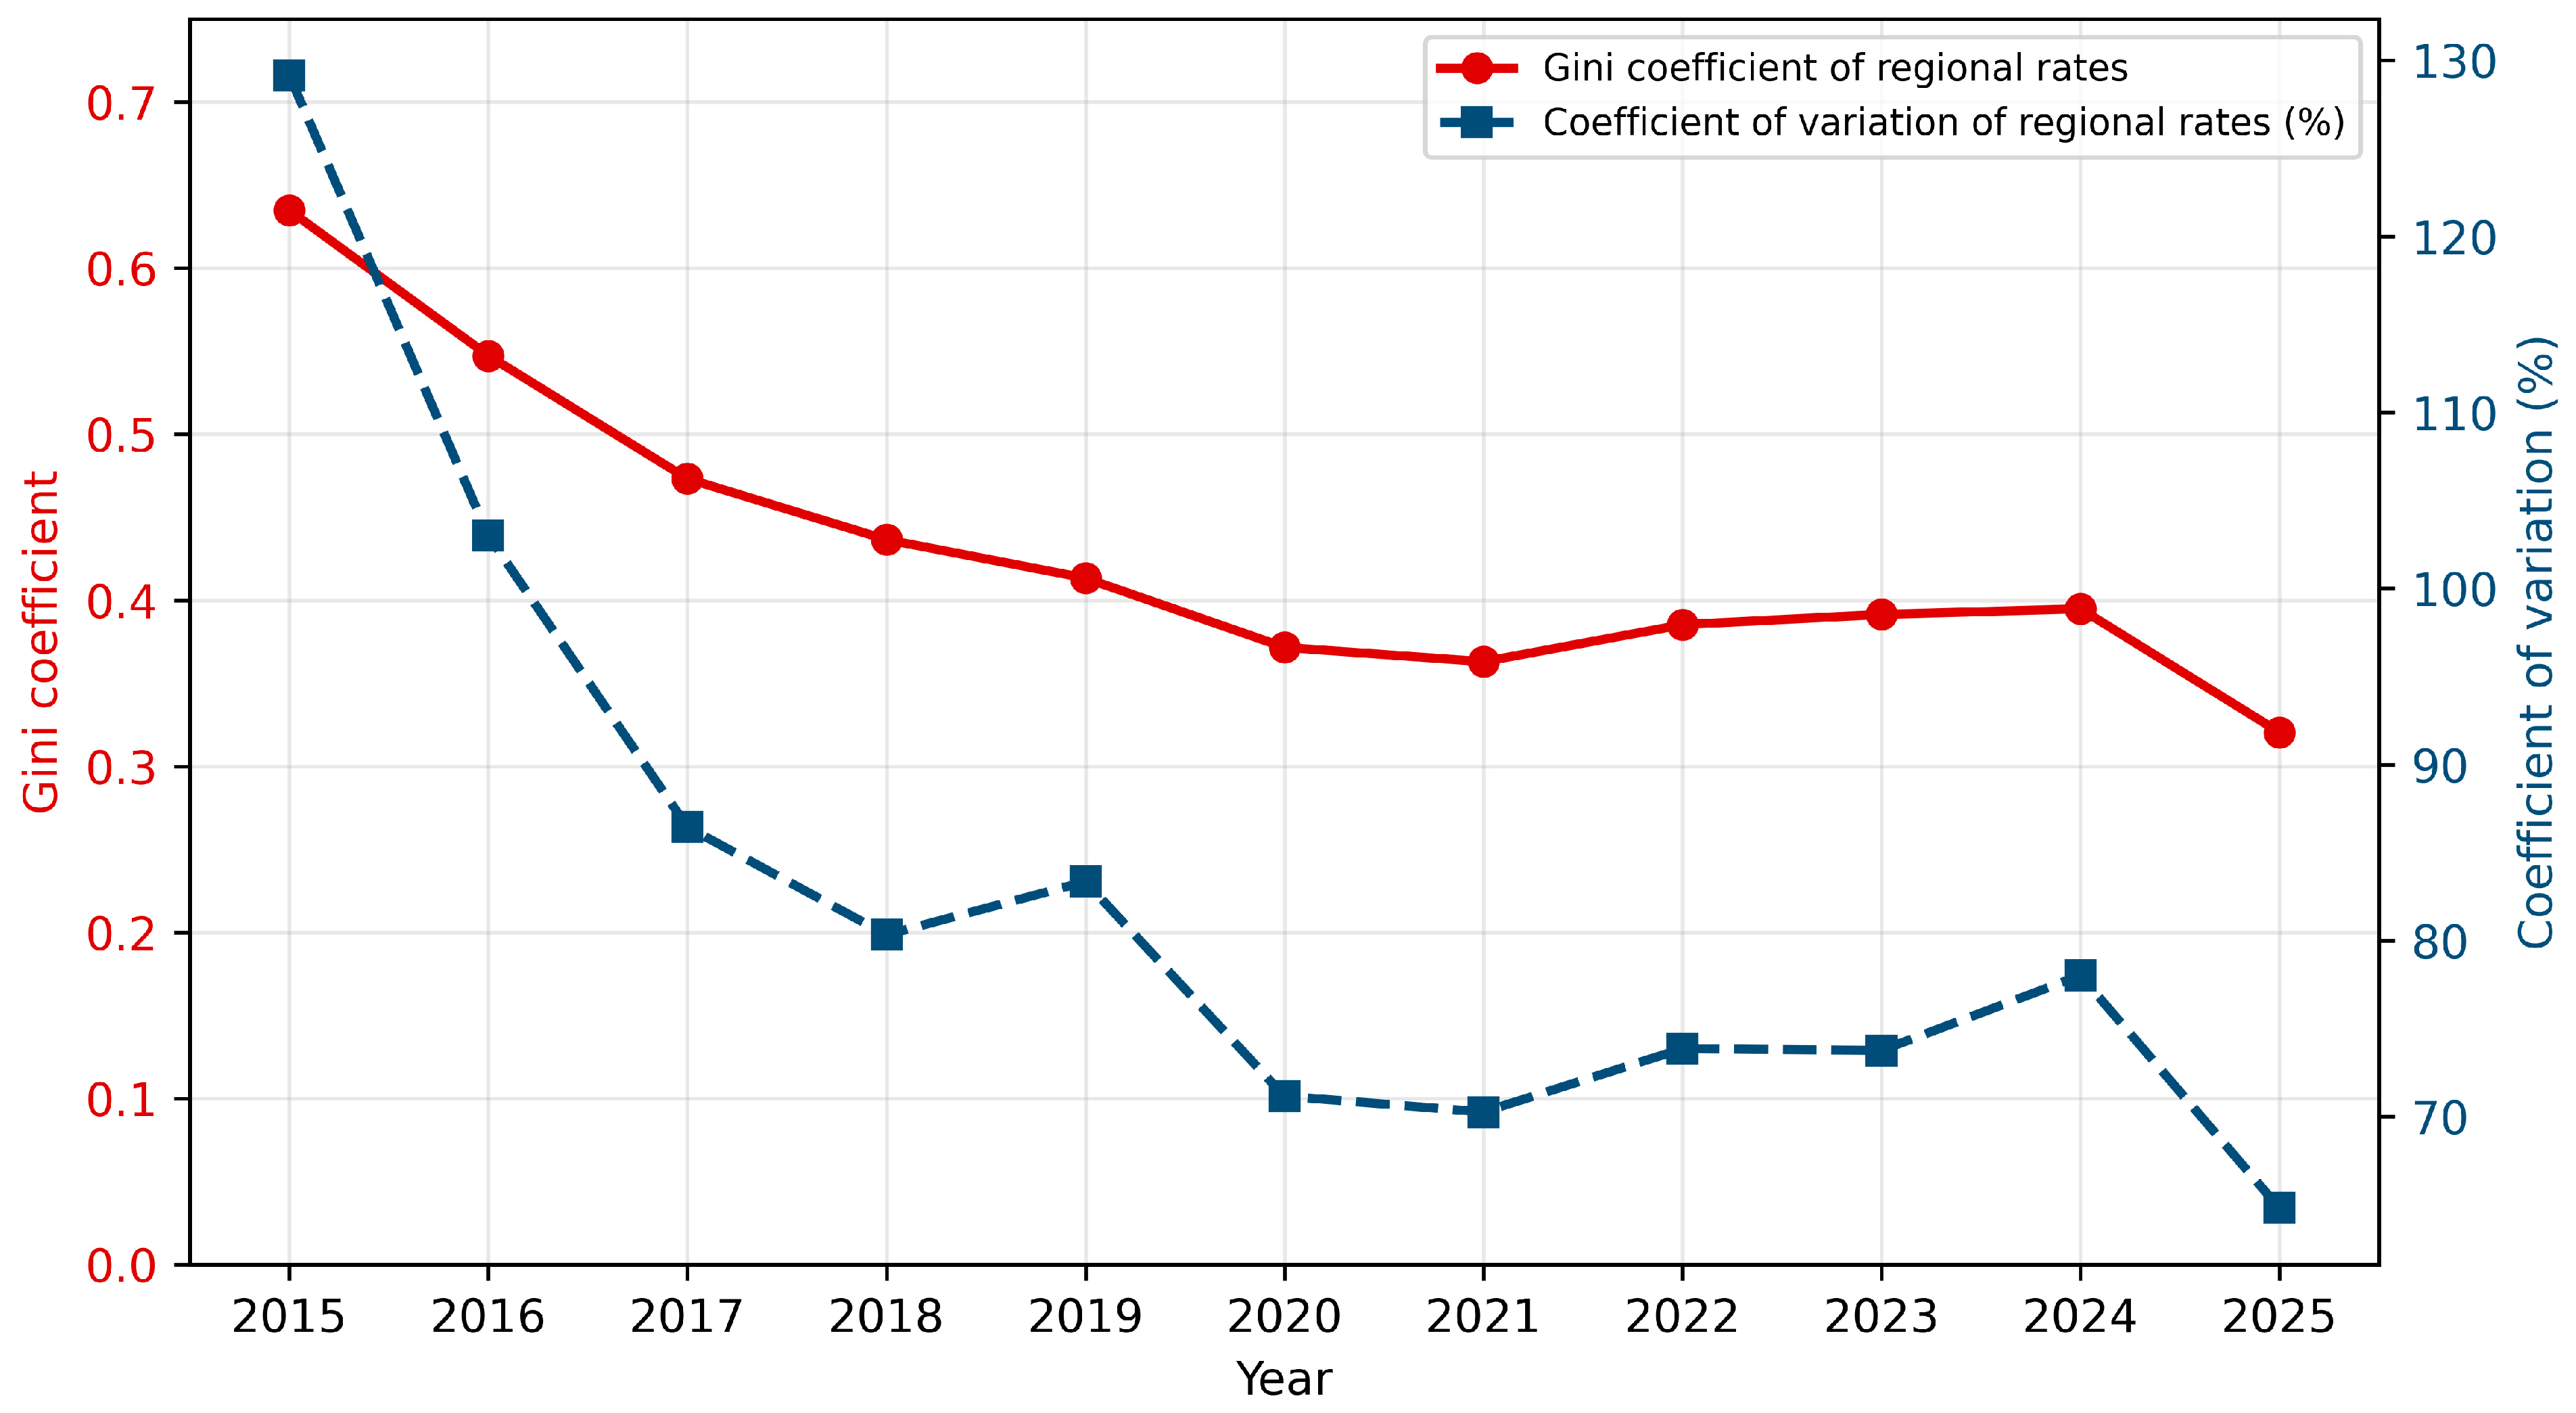
Figure 3.
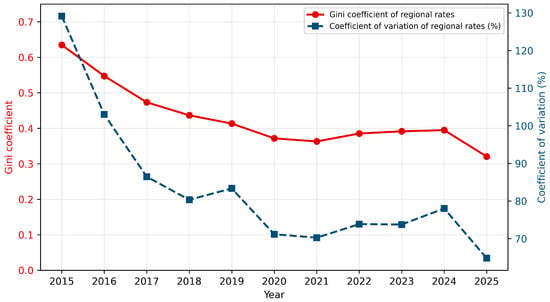
Gini coefficient and coefficient of variation in population-standardized regional ASD registration rates, 2015–2025.
The regional rate ranking in 2025 diverged notably from a raw-count ranking: Almaty city, which would rank third by raw case count (298 cases), fell to 12th of 16 by rate (43.8 per 100,000) owing to its large child population (679,872), while Akmola, mid-table by raw count, rose to second place by rate; East Kazakhstan (incl. Abai), despite its combined case count, fell to 7th by rate once the estimated Abai population was incorporated into its denominator. This reordering illustrates why population standardization materially changes the interpretation of regional disparities in this setting. Astana’s rate advantage was not limited to 2025: it had the highest registered rate in nine of the eleven study years; the exceptions were 2015, when its rate (21.0 per 100,000 children) was marginally below those of North Kazakhstan (21.3) and East Kazakhstan (21.2), and 2022, when East Kazakhstan (incl. Abai) recorded a higher rate (96.1 vs. 73.9 per 100,000) (Table S2d). The 2022 exception was not observed under one of the alternative denominator assumptions examined in Section 3.5 (scenario B). The coefficient of variation in regional rates ranged from 64.8% (2025) to 129.1% (2015) across the study period, and the Gini coefficient of the regional rate distribution declined from 0.635 in 2015 to 0.321 in 2025 (mean across the period 0.430)—a decline broadly consistent in direction with, though somewhat larger in magnitude than, the raw-count-based concentration measures reported in earlier stages of this analysis, suggesting a narrowing of relative geographic inequality in registered ASD rates over the study period, even as Astana’s absolute rate advantage persisted, although the magnitude of this change should be interpreted cautiously, given the population-denominator uncertainty described in Section 2.5.
3.4. Change in Regional Registered Rates, 2015–2025 (Historical Boundaries)
Table 3 compares population-standardized registered rates in 2015 and 2025. All 16 regions recorded an increase, with absolute changes ranging from 27.7 (Karaganda, incl. Ulytau) to 200.4 (Astana) per 100,000 children (median 45.7). Regional rankings changed considerably over the period, and the 2015 rate was only weakly associated with the 2025 rate (Spearman ρ = 0.28, p = 0.29). Astana, East Kazakhstan and North Kazakhstan had similar rates in 2015 (21.0–21.3 per 100,000 children), but by 2025 Astana’s rate (221.4) was more than three times those of East Kazakhstan (66.4) and North Kazakhstan (53.5). Atyrau and Pavlodar recorded no registrations in 2015 but ranked third and sixth in 2025. Compound annual growth rates are reported in Table S4 as a descriptive supplementary measure only, because in regions with very small baseline counts a single additional case substantially changes the estimate.
3.5. Sensitivity of Regional Estimates to Population Denominators
Under proportional scaling (scenario A), registered rates for 2015–2022 were 7–9% lower than in the main analysis, whereas regional rankings, the coefficient of variation and the Gini coefficient were unchanged, because these relative measures are not affected by a common scaling factor. Under scenario B, the rates for East Kazakhstan, Almaty region and Karaganda in 2015–2022 were lower than in the main analysis (e.g., East Kazakhstan 11.2 vs. 21.2 per 100,000 children in 2015); the Gini coefficient was 0.638 in 2015 and 0.321 in 2025, and Astana had the highest registered rate in every year from 2016 to 2025, including 2022. Across the 16 allocations in scenario C, the Gini coefficient ranged from 0.629 to 0.653 in 2015 and from 0.313 to 0.326 in 2025, so the decline between 2015 and 2025 was observed in every allocation, and Astana had the highest rate in 2025 in every allocation (Table S5). In 2016–2021, Astana ranked below first only when the entire shortfall, which exceeded the city’s own child population, was assigned to Astana. The principal regional findings were therefore not sensitive to the alternative denominator assumptions examined.
4. Discussion
All findings reported here refer to registered cases and do not estimate the prevalence or incidence of ASD. This study extends the evidence base on registered ASD case rates in Kazakhstan in three ways relative to recent national registry studies [8,9]. First, it draws on an independent administrative data stream—the psychiatric service’s Form 10-f annual report—rather than the Unified National Electronic Healthcare System, offering a degree of methodological triangulation: the two systems capture overlapping but not identical patient pathways, and broadly consistent upward trends across both sources make it less likely that the observed increase is solely an artifact of a single reporting system. Second, it extends observation through a full additional year (2025), during which the national rate per 100,000 children rose further from 46.8 to 63.5, with the observed annual rate continuing to increase through 2025. Third, and most directly relevant to the stated healthcare-planning focus of this paper, it links the rise in registrations explicitly to workforce trends: to our knowledge no prior Kazakhstani study has reported child psychiatrist density alongside the case trend, despite this ratio being directly informative for service planning. The distinction we draw throughout this manuscript between a registered case rate and true underlying prevalence is not unique to Kazakhstan or to administrative data of this kind: a Swedish population-based study similarly found that trends in registered clinical ASD diagnoses over a 10-year period diverged substantially from trends in autism phenotype prevalence measured independently through standardized twin-cohort assessment, with registered diagnoses rising far faster than the underlying phenotype—direct empirical evidence that registry-based rate increases in the kind reported here can substantially overstate changes in true prevalence [20]. A UK primary care registry study spanning two decades similarly reported an exponential rise in newly registered autism diagnoses, with the steepest relative increases in subgroups (women, adults) previously least likely to be diagnosed—a pattern consistent with expanding case ascertainment into previously under-recognized populations rather than a proportional rise in true incidence [21].
The finding that the ASD registrations-to-child-psychiatrist ratio rose roughly 23-fold while child psychiatrist density per 100,000 children simultaneously declined is, we believe, the paper’s central contribution. This increase should not be interpreted as a corresponding increase in the number of cases detected or managed by each psychiatrist: diagnostic pathways may involve pediatricians, primary care physicians, psychologists and psychiatrists, and the aggregate data do not identify which professional detected or confirmed individual cases. The rising ratio indicates that registered ASD cases increased much faster than national child psychiatry capacity, but it does not measure individual workload, waiting times for diagnosis, follow-up intensity or quality of care. Two broad interpretations are possible and cannot be distinguished with the present data: an increasing role of non-specialist providers and earlier stages of the care pathway in case identification, and growing pressure on specialist capacity for diagnostic assessment and post-diagnostic support. The second interpretation is consistent with independent, non-registry evidence from Kazakhstan: a stratified national survey by Rymkhanova et al. [22] explicitly documented a shortage of trained ASD specialists and modeled a continuing rise in specialist demand as the diagnosed population grows, while a cross-sectional survey of parents and physicians found that only 26.7% of physicians reported routine use of standardized diagnostic tools despite high self-reported confidence in early identification, and identified training gaps and fragmented care coordination as persistent barriers [16]. Kazakhstani nurses and general specialists have similarly been shown to have incomplete awareness of current diagnostic criteria and screening instruments [23,24]. Taken together with our workforce-density finding, this literature suggests the rise in registrations we document is occurring within a system whose specialist capacity and standardized-tool adoption have not been reported to expand proportionately.
The concentration of registered ASD rates in Astana is broadly consistent with prior descriptive findings of pronounced capital-region excess, using an independent data source and denominator: Nukeshtayeva et al. [8] report Astana reaching 263.7 per 100,000 children for childhood autism specifically by 2022, the highest of any region in their UNEHS-based analysis. Our Form 10-f-based estimate for Astana’s combined ASD rate (F84.0 + F84.1 + F84.5) was 221.4 per 100,000 children in 2025—of a similar order of magnitude to their single-diagnosis 2022 figure, although the two estimates differ in data source, diagnostic scope and year and are not directly comparable. Our year-by-year rate series extends this by showing that the pattern is not a single-year artifact: Astana had the highest registered rate in nine of the eleven study years (all except 2015 and 2022), and its difference from regions with similar 2015 rates widened over time (Section 3.4). Karaganda (incl. Ulytau), the Southern macro-region and Mangystau had the lowest population-standardized registration rates in 2025. The present data indicate that the higher registration rate in Astana is not explained by differences in child population size; they do not indicate why it is higher. Several explanations are possible, and we regard them as hypotheses for future research rather than conclusions of this study: referral of children from other regions to diagnostic services in the capital, regional differences in diagnostic and coding practices, differences in the availability of screening and specialist services, internal migration of families with children toward the capital, socioeconomic and demographic differences between regions, and differences in the underlying occurrence of ASD. Testing these hypotheses would require individual-level data on place of residence, referral pathway and date of diagnosis, together with regional workforce data.
Two observations from this study are relevant to healthcare planning. First, population standardization substantially changed the regional ranking of registrations, so planning based on raw counts may misrepresent regional variation. Second, national child psychiatrist density declined while the number of registered cases increased, which indicates that child psychiatry workforce capacity warrants attention in national planning; the present aggregate data cannot determine how much additional capacity is required or where. Previous literature describes several policy options that may merit evaluation in Kazakhstan, including structured developmental screening in primary care with validated instruments such as the M-CHAT-R/F [25], which has been piloted in primary healthcare organizations in Karaganda [15], and task-sharing approaches to early identification in settings with limited specialist capacity [26]. These options were not evaluated in the present study, and their feasibility, effectiveness and costs in Kazakhstan would require dedicated evaluation.
We have not compared the rates reported here with international ASD prevalence estimates, because the annual rate of newly registered cases is not epidemiologically equivalent to period or point prevalence obtained through active case ascertainment in defined birth cohorts. The decline in child psychiatrist density observed in Kazakhstan is, however, consistent with the broader under-resourcing of child and adolescent mental health services reported internationally, particularly in low- and middle-income countries [1].
Strengths and Limitations
Several limitations should be noted. First, region-specific child population denominators were obtained for this analysis, enabling population-standardized regional rates for the first time. During preparation of this manuscript we identified a specific numerator–denominator mismatch: the regional population source did not include Abai, Zhetysu, or Ulytau as separate units (consistent with its 17-region, pre-2022 structure), while ASD cases for these three regions are recorded separately in Form 10-f from 2023 onward. We corrected this by estimating each new region’s child population from its published total population multiplied by its parent region’s child-to-total population ratio, and adding this to the parent region’s population for 2023–2025 (Section 2.5); this estimation step is a secondary approximation and introduces additional uncertainty specific to East Kazakhstan (incl. Abai), Almaty region (incl. Zhetysu), and Karaganda (incl. Ulytau) in these three years. If the age structure of the newly created regions differed materially from that of their parent regions, the estimated child population denominators and resulting rates for these region-years may be biased. Separately, an unresolved population-reconciliation discrepancy remains for 2015–2022: even after this correction, the regional population total for those years (which predate the estimation correction and are unaffected by it) was 7–9% lower than the independently compiled national child population total in every year, despite both figures reportedly originating from the Bureau of National Statistics, and we were unable to fully reconcile this earlier-period gap at the time of writing. The size of this gap (456,431–501,377 children per year) was similar to the estimated combined child population of Abai, Zhetysu and Ulytau in 2023 (476,804), which suggests, but does not establish, that the 2015–2022 regional figures for East Kazakhstan, Almaty region and Karaganda may already have been compiled according to the post-2022 boundaries. The main regional conclusions were unchanged under this and other alternative denominator assumptions (Section 3.5; Table S5). Given both sources of uncertainty, we regard regional rankings, changes in rates, and concentration indices as informative for relative comparisons, but absolute regional rate values—particularly for East Kazakhstan, Almaty region, and Karaganda in 2023–2025, and for all regions in 2015–2022—should be interpreted as best-available estimates rather than exact figures pending independent verification. Second, we were similarly unable to obtain region-specific psychiatrist and child psychiatrist workforce data; the workforce analysis in this study is therefore restricted to the national level, and a regional panel analysis linking region-specific ASD registration rates to region-specific psychiatrist density—which would considerably strengthen the health-workforce-planning contribution of this work—could not be conducted here and would require future data collection on regional workforce distribution. Third, Form 10-f captures newly registered cases through the psychiatric service pathway and may undercount children diagnosed and managed exclusively through other services (early intervention centers, private practice, education-sector assessment) without subsequent registration in the psychiatric registry. More generally, as with other administrative data sources, registered counts depend on the completeness of reporting, coding practices and service organization, which may vary between regions and over time and could not be independently verified; to our knowledge, the diagnostic accuracy of ASD codes recorded in Form 10-f has not been validated against standardized clinical assessment in Kazakhstan. The aggregate format of the data also precluded examination of individual diagnostic pathways and clinical or sociodemographic characteristics. Fourth, the 2022 administrative reorganization (creation of Abai, Zhetysu, Ulytau) complicates strict region-level trend comparison across the full period; we addressed this through a historical-boundary merge, but this necessarily obscures any genuine sub-regional heterogeneity that may exist within, e.g., the former South Kazakhstan region. Fifth, as an ecological, registry-based study, this analysis cannot attribute causation to any specific driver of the observed national trend (diagnostic criteria awareness, screening policy changes, true incidence change, migration); the negative binomial trend model quantifies the average annual rate of increase but does not itself identify a single mechanism. We did not estimate a data-driven trend breakpoint (e.g., around the 2022 administrative reorganization) using joinpoint or segmented regression, because the national series comprised only 11 annual observations and dividing such a short series into segments could yield unstable breakpoint estimates. Instead, departure from a constant annual rate of change was assessed by adding a quadratic calendar-year term, which indicated significant acceleration over the study period. The negative binomial rate ratio is therefore retained as a summary of the average temporal trend across 2015–2025, not as evidence of a constant annual growth rate or a specific breakpoint. With 11 annual observations, the precision of the confidence interval for the rate ratio relies on model assumptions that cannot be fully verified, and diagnostic tests for residual autocorrelation have limited power; the confidence interval should therefore be regarded as approximate. Sixth, the case definition (F84.0, F84.1 and F84.5) does not include other childhood disintegrative disorder (F84.3) or other and unspecified pervasive developmental disorders (F84.8, F84.9). Children registered under these codes, which are encompassed by autism spectrum disorder in current classifications, are therefore not counted, and the reported rates may underestimate the total number of registrations with ASD-related diagnoses.
5. Conclusions
The newly registered ASD case rate in Kazakhstan rose more than sixteen-fold per 100,000 children between 2015 and 2025, while child psychiatrist density per 100,000 children declined over the same period—a combination that, at the national level, is well supported by population-standardized data and represents this study’s most robust finding. Population-standardized regional rates, obtained for this analysis, indicate that registration rates were highest in Astana and several other regions and that these differences do not merely reflect differences in regional population size: Astana’s 2025 rate (221.4 per 100,000 children) was nearly eight times that of the lowest-rate region, and its share of national registrations (25.6%) exceeded its share of the regional child population (7.4%) by a factor of 3.5. This regional finding carries an important caveat, however: a numerator–denominator mismatch affecting three post-2022 regions was identified and corrected during this analysis, and an unresolved population-reconciliation gap remains for 2015–2022 that was not fully resolved at the time of writing, so absolute regional rate values for earlier years, in particular, should be treated as best-available estimates rather than exact figures. These findings indicate that national child psychiatry workforce capacity warrants attention in healthcare planning in view of the rising number of registered cases. Further research using individual-level and regional workforce data is needed to explain regional differences in registration, and reconciliation of regional and national population data would improve the precision of regional estimates.
Supplementary Materials
The following supporting information can be downloaded at https://www.mdpi.com/article/10.3390/healthcare14223910/s1: Table S1: Registered ASD cases (F84.0 + F84.1 + F84.5) by administrative region and year, Kazakhstan, 2015–2025 (raw administrative units, including historical and current administrative divisions); Table S2a: National ASD case counts, child population aged 0–17, and regional concentration statistics (coefficient of variation and Gini coefficient of raw counts) by year, 2015–2025; Table S2b: Registered ASD cases by historical-boundary region and year, 2015–2025; Table S2c: Child population aged 0–17 by historical-boundary region and year, 2015–2025 (for 2023–2025, includes an estimated population addition for Abai, Zhetysu, and Ulytau in East Kazakhstan, Almaty region, and Karaganda respectively; see Section 2.5); Table S2d: Population-standardized registered ASD rate per 100,000 children by historical-boundary region and year, 2015–2025 (rates for 2023–2025 in these same three regions rely on the estimated population in Table S2c); Table S2e: Crosswalk between administrative units and historical-boundary analytical units; Table S3: Diagnostics of the negative binomial model for the national trend in registered ASD cases, 2015–2025; Table S4: Compound annual growth rate of registered ASD rates by historical-boundary region, 2015–2025 (descriptive only; regions with fewer than 5 registered cases in 2015 are flagged); Table S5: Sensitivity of the Gini coefficient, coefficient of variation and Astana’s rank to alternative population-denominator assumptions, 2015–2025; Figure S1: Sample of Form 10-f (current index 13-PPR), title section and Table 1000 (rows 21–28), with an English translation of the rows used in this study.
Author Contributions
Conceptualization, Z.M., A.M., A.A. and M.D.; Methodology, M.D., A.M. and Z.M.; Formal analysis, A.U., A.T. and B.T.; Data curation, G.K., R.T. and D.I.; Writing—original draft preparation, Z.M., A.M., A.A., A.U., A.T., B.T. and M.D.; Writing—review and editing, Z.M., A.M., A.A., A.U., A.T., B.T., M.D., G.K., R.T. and D.I.; Visualization, Z.M.; Supervision, A.M. All authors have read and agreed to the published version of the manuscript.
Funding
This study received no funding.
Institutional Review Board Statement
The study was conducted in accordance with the principles of the Declaration of Helsinki and was approved by the Local Bioethics Commission of NJSC “Astana Medical University” (Protocol No. 9, dated 26 May 2026).
Informed Consent Statement
Not applicable. This study used exclusively aggregate, previously de-identified administrative data and did not involve access to individual-level or patient-identifiable information. Therefore, individual informed consent was not applicable to this retrospective, population-level ecological study.
Data Availability Statement
The regional and national ASD case-count, population, and rate data underlying the analyses are provided in Tables S1 and S2a–d (Supplementary Materials) and in the main-text tables. The underlying Form 10-f administrative records were provided by the Republican Center for Electronic Health Care of the Ministry of Health of the Republic of Kazakhstan and cannot be redistributed by the authors; additional data may be requested directly from the Ministry of Health. Regional and national child population data were obtained from the Bureau of National Statistics, Agency for Strategic Planning and Reforms of the Republic of Kazakhstan. For 2023–2025, child population denominators for Abai, Zhetysu, and Ulytau were estimated by the authors as described in Section 2.5 and are provided in the Supplementary Materials. Original population data are publicly available from the Bureau of National Statistics.
Acknowledgments
The authors thank the Republican Center for Electronic Health Care of the Ministry of Health of the Republic of Kazakhstan for providing the administrative data used in this study.
Conflicts of Interest
Author Marzhan Dauletyarova was employed by the company LLC “Next Event Group”. The remaining authors declare that the research was conducted in the absence of any commercial or financial relationships that could be construed as a potential conflict of interest.
References
- Kieling, C.; Baker-Henningham, H.; Belfer, M.; Conti, G.; Ertem, I.; Omigbodun, O.; Rohde, L.A.; Srinath, S.; Ulkuer, N.; Rahman, A. Child and adolescent mental health worldwide: Evidence for action. Lancet 2011, 378, 1515–1525. [Google Scholar] [CrossRef] [Scilit] [PubMed]
- GBD 2021 Autism Spectrum Collaborators. The global epidemiology and health burden of the autism spectrum: Findings from the Global Burden of Disease Study 2021. Lancet Psychiatry 2025, 12, 111–121. [Google Scholar] [CrossRef] [Scilit] [PubMed]
- Salari, N.; Rasoulpoor, S.; Rasoulpoor, S.; Shohaimi, S.; Jafarpour, S.; Abdoli, N.; Khaledi-Paveh, B.; Mohammadi, M. The global prevalence of autism spectrum disorder: A comprehensive systematic review and meta-analysis. Ital. J. Pediatr. 2022, 48, 112. [Google Scholar] [CrossRef] [Scilit] [PubMed]
- Talantseva, O.I.; Romanova, R.S.; Shurdova, E.M.; Dolgorukova, T.A.; Sologub, P.S.; Titova, O.S.; Kleeva, D.F.; Grigorenko, E.L. The global prevalence of autism spectrum disorder: A three-level meta-analysis. Front. Psychiatry 2023, 14, 1071181. [Google Scholar] [CrossRef] [Scilit] [PubMed]
- Qiu, S.; Lu, Y.; Li, Y.; Shi, J.; Cui, H.; Gu, Y.; Li, Y.; Zhong, W.; Zhu, X.; Liu, Y.; et al. Prevalence of autism spectrum disorder in Asia: A systematic review and meta-analysis. Psychiatry Res. 2020, 284, 112679. [Google Scholar] [CrossRef] [Scilit] [PubMed]
- Republic of Kazakhstan. Law on Social and Medical-Pedagogical Correctional Support for Children with Disabilities. 2002. Available online: https://adilet.zan.kz/eng/ (accessed on 22 August 2026).
- World Health Organization; United Nations Children’s Fund. Global Report on Children with Developmental Disabilities: From the Margins to the Mainstream; World Health Organization: Geneva, Switzerland; United Nations Children’s Fund: New York, NY, USA, 2023. [Google Scholar]
- Nukeshtayeva, K.; Bolatova, Z.; Galayeva, A.; Shintayeva, N.; Zhanalina, G. Epidemiological trends in autism and other neurodevelopmental disorders in Kazakhstan (2016–2022): A regional and national perspective. Front. Psychiatry 2025, 16, 1520460. [Google Scholar] [CrossRef] [Scilit] [PubMed]
- Baikatov, A.; Assemov, A.; Alimbetov, D.; Kustubayeva, A. Diverging trends in neurodevelopmental disorder diagnoses among children aged below 16 years in Kazakhstan (2014–2024): A national registry study. Front. Psychiatry 2026, 17, 1880419. [Google Scholar] [CrossRef] [Scilit] [PubMed]
- Mussina, K.; Syssoyev, D.; Gaipov, A.; Poddighe, D.; Almabayeva, D.; Galiyeva, D. Incidence of autism spectrum disorder in children in Kazakhstan and risk factors associated with all-cause hospitalizations. Sci. Rep. 2026, 16, 15256. [Google Scholar] [CrossRef] [Scilit] [PubMed]
- Ministry of Health of the Republic of Kazakhstan. Order of the Minister of Health of the Republic of Kazakhstan No. ҚP ДCM-313/2020 of 22 December 2020 “On Approval of the Forms of Reporting Documentation in the Field of Healthcare”, Appendix 13: Report on Diseases and Contingents of Patients with Mental and Behavioral Disorders (Index 13-PPR), as Amended by Order No. ҚP ДCM-144 of 30 November 2022. Available online: https://adilet.zan.kz/rus/docs/V2000021879 (accessed on 15 October 2026). (In Russian)
- World Health Organization. International Statistical Classification of Diseases and Related Health Problems; 10th Revision (ICD-10); World Health Organization: Geneva, Switzerland, 1992. [Google Scholar]
- Republican Center for Health Development. Clinical Protocol for Diagnosis and Treatment “Autism”; Recommended by the Expert Council of the Republican Center for Health Development, Ministry of Health and Social Development of the Republic of Kazakhstan, Protocol No. 9 of 15 September 2015; Republican Center for Health Development: Astana, Kazakhstan, 2015. (In Russian) [Google Scholar]
- Republican Center for Health Development. Clinical Protocol for Diagnosis and Treatment “Pervasive Developmental Disorders (Autism Spectrum Disorders)”; Approved by the Joint Commission on the Quality of Medical Services, Ministry of Health of the Republic of Kazakhstan, Protocol No. 145 of 30 July 2021; Republican Center for Health Development: Astana, Kazakhstan, 2021. (In Russian) [Google Scholar]
- Nukeshtayeva, K.; Omarkulov, B.; Lyubchenko, M.; Delellis, N.; Zhamantayev, O.; Dauletkaliyeva, Z.; Zhanalina, G.; Shintayeva, N.; Karshalova, G.; Kenzhekeyeva, M. Prevalence of autism risk among children undergoing regular psychophysical development screening in Kazakhstan. Clin. Epidemiol. Glob. Health 2024, 28, 101703. [Google Scholar] [CrossRef] [Scilit]
- Foster, F.; Kanderzhanova, A.; Tazhibay, M.; Tolegenova, A.; Colet, P.; Stolyarova, V.; Noble, J.G. Two sides of the spectrum: A cross-sectional study of autism diagnosis and treatment in Kazakhstan from the perspectives of parents and physicians. medRxiv 2025. [Google Scholar] [CrossRef] [Scilit]
- Bureau of National Statistics, Agency for Strategic Planning and Reforms of the Republic of Kazakhstan. Population of the Republic of Kazakhstan by Sex and Selected Age Groups, 2015–2025. Available online: https://stat.gov.kz (accessed on 6 October 2026).
- Hilbe, J.M. Negative Binomial Regression, 2nd ed.; Cambridge University Press: Cambridge, UK, 2011. [Google Scholar]
- O’Donnell, O.; Van Doorslaer, E.; Wagstaff, A.; Lindelow, M. Analyzing Health Equity Using Household Survey Data: A Guide to Techniques and Their Implementation; The World Bank: Washington, DC, USA, 2008. [Google Scholar]
- Lundström, S.; Reichenberg, A.; Anckarsäter, H.; Lichtenstein, P.; Gillberg, C. Autism phenotype versus registered diagnosis in Swedish children: Prevalence trends over 10 years in general population samples. BMJ 2015, 350, h1961. [Google Scholar] [CrossRef] [Scilit] [PubMed]
- Russell, G.; Stapley, S.; Newlove-Delgado, T.; Salmon, A.; White, R.; Warren, F.; Pearson, A.; Ford, T. Time trends in autism diagnosis over 20 years: A UK population-based cohort study. J. Child Psychol. Psychiatry 2022, 63, 674–682. [Google Scholar] [CrossRef] [Scilit] [PubMed]
- Rymkhanova, A.; Mulikova, S.; Sakayeva, A.; Akhmetzhanova, Z.; Zhanibekova, S.; Bekmaganbetova, A. Addressing the training gaps for ASD specialists in Kazakhstan: A forecast-based approach. J. Educ. Health Promot. 2025, 14, 316. [Google Scholar] [CrossRef] [Scilit] [PubMed]
- Somerton, M.; Stolyarova, V.; Khanin, S. Autism and the knowledge and beliefs of specialists in Kazakhstan. J. Autism Dev. Disord. 2022, 52, 1156–1168. [Google Scholar] [CrossRef] [Scilit] [PubMed]
- Kurmanalina, S.; Samambayeva, A.; Akhtayeva, N.; Kozhageldiyeva, L.; Kosherbayeva, L. Awareness of autism spectrum disorder among population of Kazakhstan. J. Autism Dev. Disord. 2025, 55, 2566–2572. [Google Scholar] [CrossRef] [Scilit] [PubMed]
- Robins, D.L.; Casagrande, K.; Barton, M.; Chen, C.M.; Dumont-Mathieu, T.; Fein, D. Validation of the Modified Checklist for Autism in Toddlers, Revised with Follow-up (M-CHAT-R/F). Pediatrics 2014, 133, 37–45. [Google Scholar] [CrossRef] [Scilit] [PubMed]
- Divan, G.; Bhavnani, S.; Leadbitter, K.; Ellis, C.; Dasgupta, J.; Abubakar, A.; Elsabbagh, M.; Hamdani, S.U.; Servili, C.; Patel, V.; et al. Annual Research Review: Achieving universal health coverage for young children with autism spectrum disorder in low- and middle-income countries: A review of reviews. J. Child Psychol. Psychiatry 2021, 62, 514–535. [Google Scholar] [CrossRef] [Scilit] [PubMed]

Disclaimer/Publisher’s Note: The statements, opinions and data contained in all publications are solely those of the individual author(s) and contributor(s) and not of MDPI and/or the editor(s). MDPI and/or the editor(s) disclaim responsibility for any injury to people or property resulting from any ideas, methods, instructions or products referred to in the content. |
© 2026 by the authors. Licensee MDPI, Basel, Switzerland. This article is an open access article distributed under the terms and conditions of the Creative Commons Attribution (CC BY) license.