


Highlights
What are the main findings?
- The frozen six-domain model ranked 90-day Pap-test noncompletion with an AUC of 0.866, but substantially underestimated average risk and required probability updating.
- Exploratory comparisons identified prevention attitude as the strongest single predictor. The added value of all 12 questions over simpler assessments remains uncertain.
What are the implications of the main findings?
- A short questionnaire may help identify women who could benefit from additional communication or navigation support after a Pap-test recommendation.
- Prediction models transferred from historical survey data require local recalibration and independent validation before their probabilities or risk thresholds are used to guide screening support.
Abstract
Background/Objectives: Brief assessments may help identify women requiring support after a cervical-screening recommendation. We investigated whether a questionnaire model estimated against a historical screening-history proxy could rank subsequent 90-day Pap-test noncompletion, and whether its probabilities required updating. Methods: Of 743 historical records, 601 met the analytical age criterion of 30–74 years; observed ages were 30–60. A 12-item questionnaire represented six content domains encoded as seven predictors in ridge logistic regression. The frozen equation was evaluated in 372 women with a Pap-test recommendation and prospectively recorded 90-day outcomes. Recalibration was assessed with repeated cross-validation. Additional analyses compared cohort characteristics, predictor contributions and simpler assessments. Results: The historical proxy comprised 36 never-screened and 102 uncertain-history responses, versus 463 affirmative histories. Prospectively, 126/372 women (33.9%) did not complete testing. Frozen AUC was 0.866, mean predicted risk 19.8% and Brier score 0.166. The updating slope was 0.448; the mean cross-validated Brier score after updating was approximately 0.134. Prevention attitude alone ranked outcomes with an AUC of 0.846; the paired AUC difference of 0.019 had a 95% bootstrap interval of −0.011 to 0.053. An exploratory attitude-only model had lower prediction error after matched cross-fitted updating. Conclusions: Questionnaire-based ranking transferred between related but different outcomes, whereas absolute probabilities required substantial updating. Comparative prospective evaluation is needed to establish the added value and clinical utility of the brief model.
1. Introduction
Cervical-cancer prevention depends on participation in screening and appropriate follow-up. The WHO elimination strategy links vaccination, screening and treatment [1]. Kazakhstan has an organised cytology-based screening programme, but participation remains incomplete. The WHO 2021 country profile reported that, among women aged 30–49 years in 2019, 58% had been screened within five years and 66% had ever been screened [2]. Official guidance amended in July 2026 specifies cervical screening every four years at designated ages from 30 to 74 [3].
Studies in Kazakhstan have linked screening participation with awareness of Pap testing and free screening opportunities, age and family characteristics [4]. Research comparing urban and rural women also identified differences in participation and programme awareness [5]. These findings support examining practical obstacles and healthcare perceptions when assessing subsequent screening completion.
The Health Belief Model provides a framework for examining perceived benefits, susceptibility, severity and barriers to preventive behaviour. The CCS-HBMS was developed and psychometrically tested in Turkey [6]. Adapted items from this instrument contributed to the present survey alongside general questions about prevention and healthcare. The resulting brief questionnaire combines selected content relevant to prediction of screening completion.
Prediction-based approaches to cervical-screening attendance include a study in Bogotá combining an HBM assessment with administrative-data modelling of nonattendance [7]. Risk-targeted navigation has also increased cancer-screening completion in a randomised trial using routinely available characteristics and attendance history [8]. In Kazakhstan, the practical value of a brief questionnaire depends on its ability to predict subsequent completion and provide useful information beyond simpler assessments.
Historical screening history is an imperfect development target. Current attitudes may be consequences as well as antecedents of previous screening, and uncertain recall does not establish that screening never occurred. A medical-record validation study illustrates how knowledge of the procedure can affect the accuracy of self-reported Pap testing, although its population differs from the present setting [9]. Accordingly, absence of an affirmative historical screening report was treated as a related proxy construct, distinct from future noncompletion.
Our working hypothesis was that attitudes, awareness and practical perceptions associated with the historical proxy would retain some ability to rank future noncompletion, whereas their absolute probabilities might not transport. The primary objective was to evaluate a fixed questionnaire model against 90-day Pap-test noncompletion in a separate prospective cohort. Secondary objectives were to assess probability updating and sensitivity to uncertain historical responses. Exploratory analyses examined cohort differences, predictor contributions and comparisons with simpler models. Calibration denotes agreement between predicted probabilities and observed event frequencies [10,11].
2. Materials and Methods
2.1. Design and Participants
The historical Pap survey formed part of parallel prevention surveys conducted after ethics approval on 27 February 2026 and through July 2026. Recruitment was voluntary and non-probability-based. Questionnaires were distributed through regional health administrations, participating healthcare organisations and professional or personal contacts, electronically and on paper. All 743 available Pap records documented consent and Kazakhstani citizenship. Applying the analytical age restriction of 30–74 years excluded 142 women, all of whom were younger than 30; none were excluded for age above 74 or missing age. The retained 601 women ranged from 30 to 60 years. Three missing awareness responses were imputed rather than excluded.
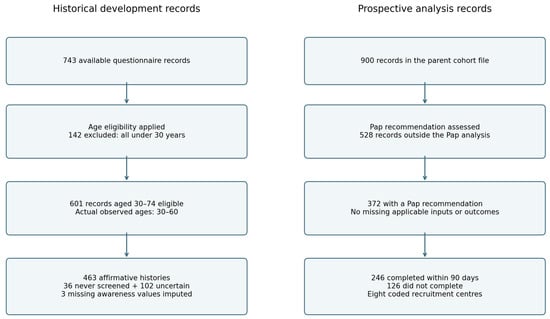
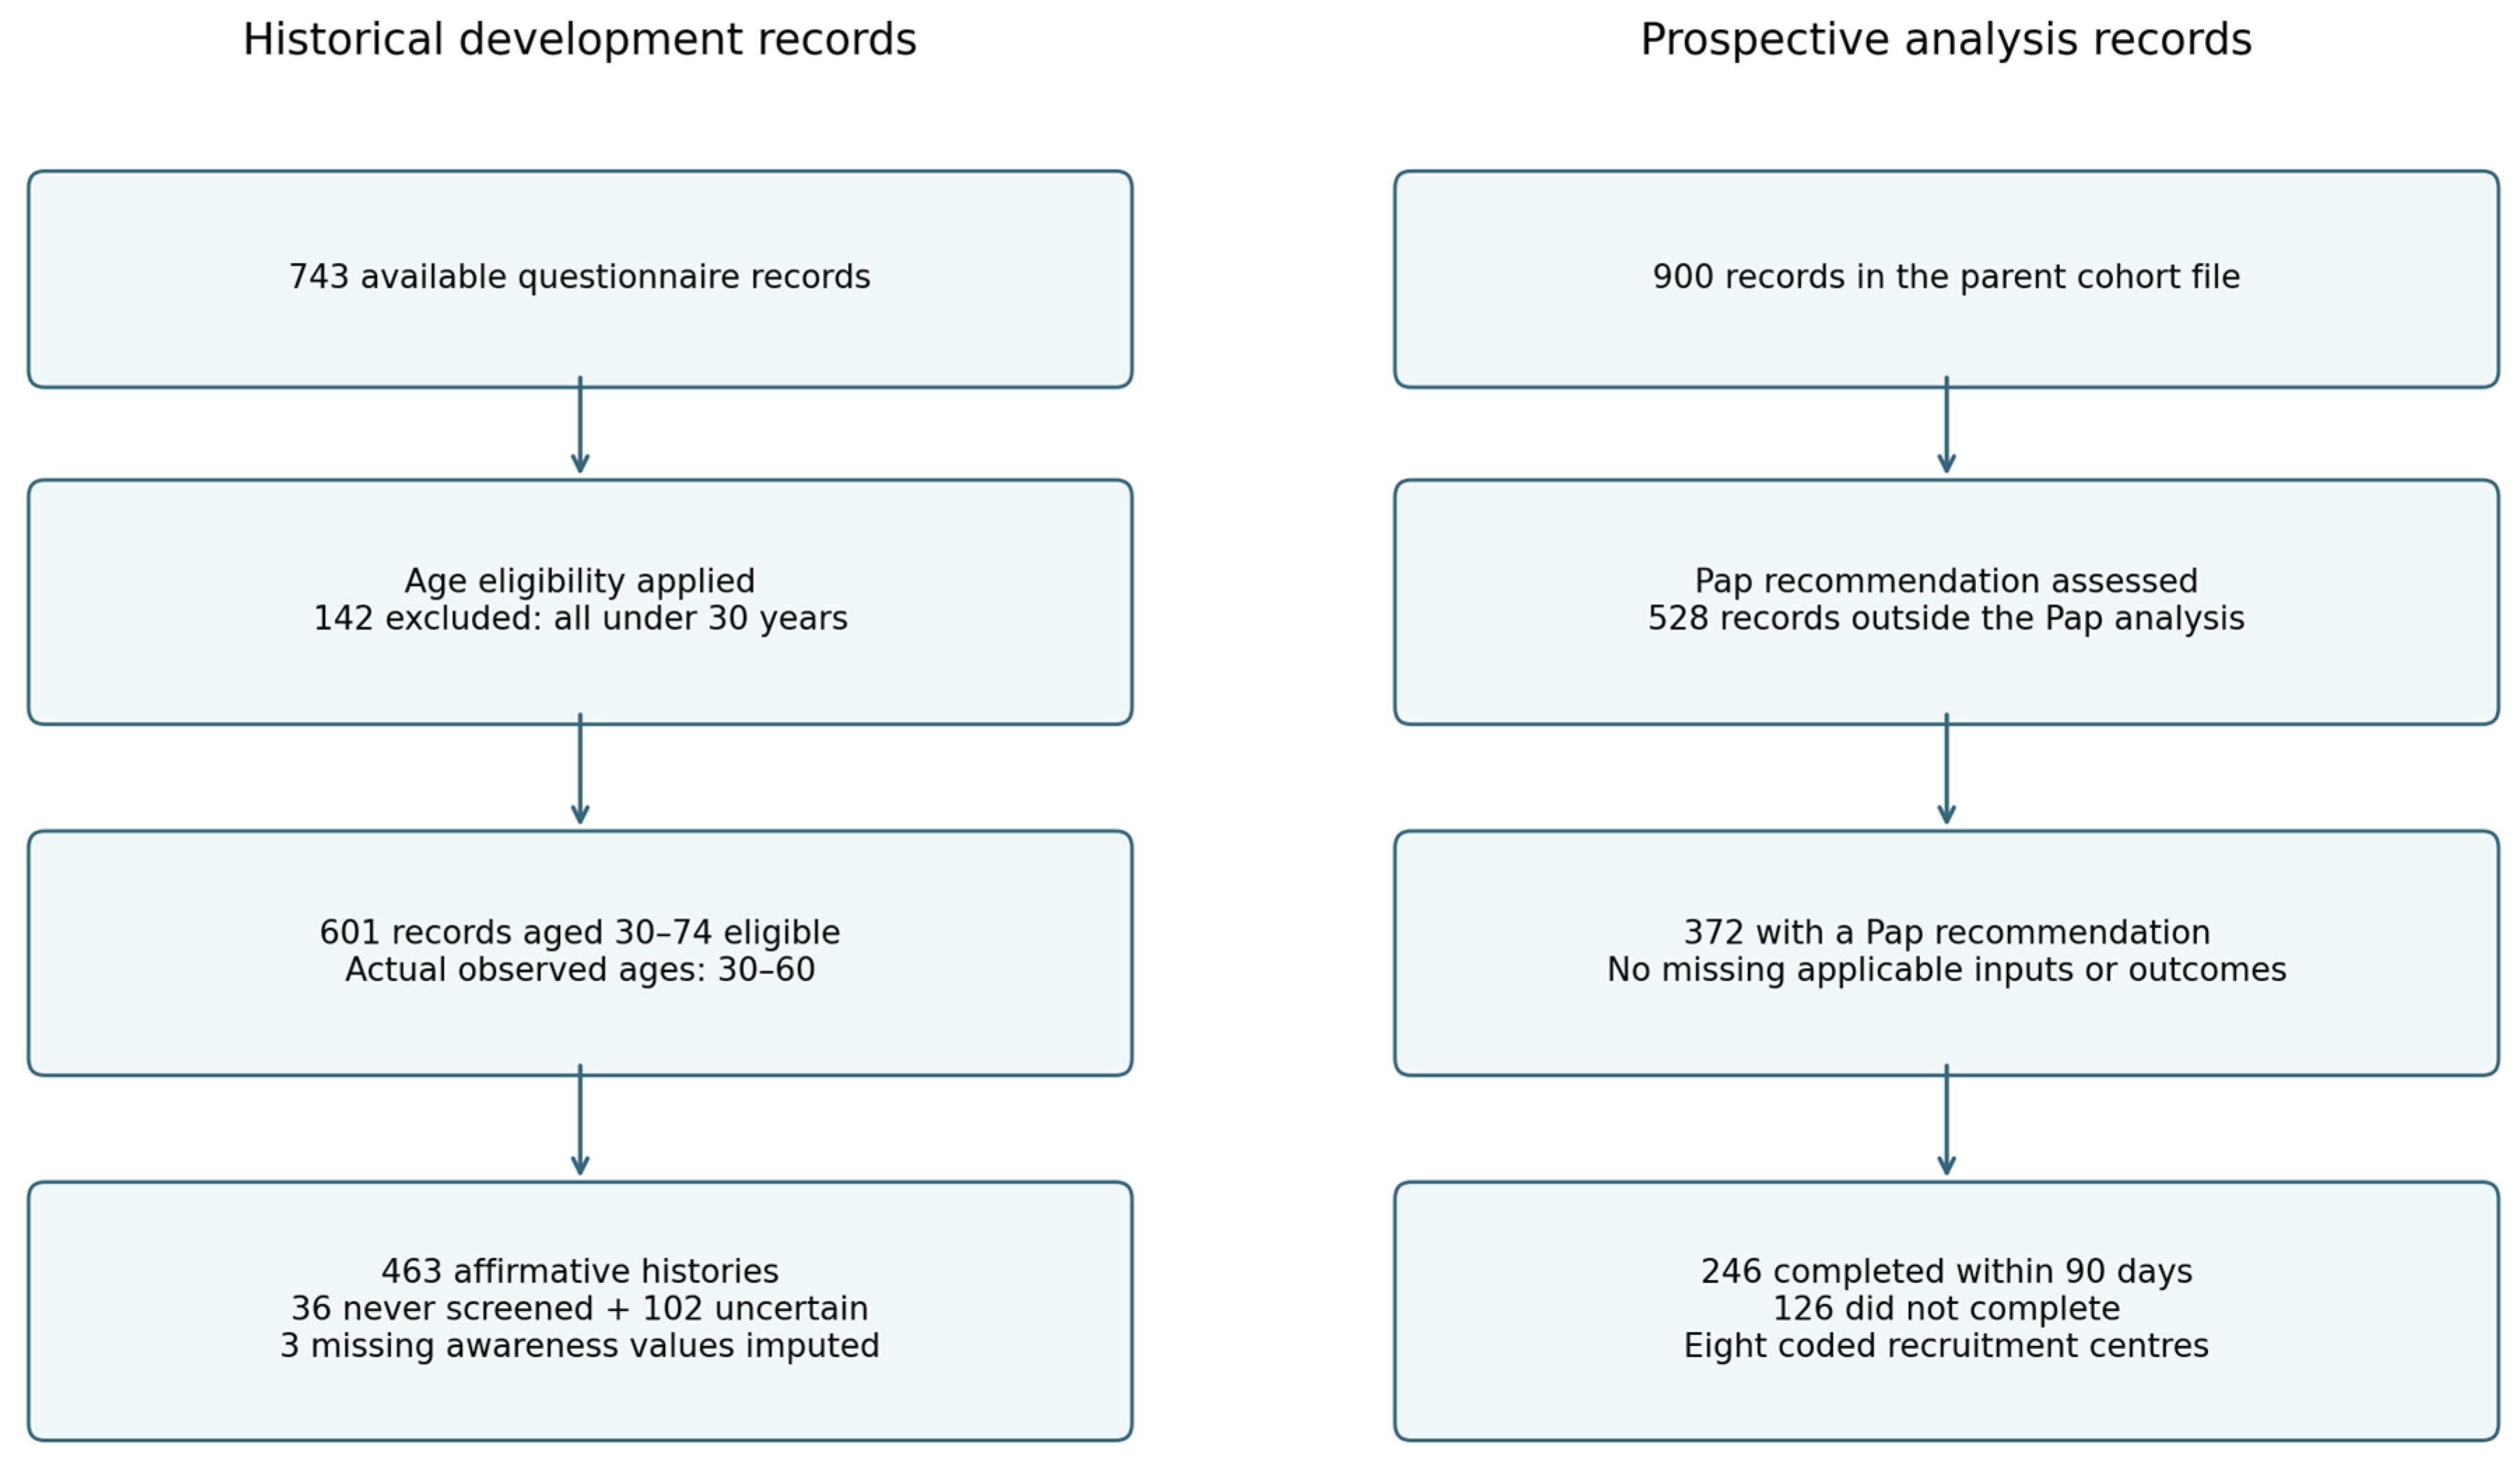
The parent prospective cohort contained 900 women across preventive programmes. Of these, 372 had a Pap-test recommendation; the remaining 528 were outside the Pap analysis. All 372 had complete applicable questionnaire inputs and a recorded 90-day Pap outcome. Their observed ages were 30–71 years. Recruitment stopped when the intended sample size had been reached. The numbers of individuals approached or invited, refusals and losses before inclusion in the final analytical cohort were not recorded; therefore, a recruitment response rate and a complete invitation-to-analysis flow could not be calculated. The flow of analysed records is shown in Figure 1.
Figure 1.
Flow of analysed records. Arrows indicate successive record-selection steps. Invitation, refusal and pre-analysis attrition counts were not recorded; recruitment stopped when the intended sample size had been reached.
The prospective study period, including outcome follow-up, was April–September 2026. Questionnaires were distributed electronically and on paper through eight recruitment bases using non-probability sampling. Recruitment bases were the organisational units coordinating questionnaire administration and subsequent physician follow-up. Physicians assessed completion of the recommended Pap test after each participant’s 90-day observation period.
Questionnaire development and prospective recruitment partly overlapped. Questionnaire responses were obtained before ascertainment of the subsequent 90-day outcome. The prediction equation was estimated from historical responses; prospective outcomes were used for performance evaluation and subsequent probability updating. Because the endpoints differed, the prospective evaluation assessed transferability from screening history to subsequent screening completion.
2.2. Source Questionnaire and Derivation of the Brief Form
The historical survey combined general questions on sociodemographic characteristics, health and healthcare use with Pap-test awareness, previous screening history, and the adapted 35-item Cervical Cancer and Pap Smear Test Health Belief Model Scale (CCS-HBMS) [6]. The general questions covered education, employment, family circumstances, insurance, health behaviours, preventive attitudes and healthcare-system trust. The disease-specific instrument supplied beliefs and perceptions concerning cervical screening. Previous screening history defined the development endpoint and was not included as a predictor. The source items and brief questionnaire are presented in Supplementary Materials S1–S3.
The source CCS-HBMS materials were adapted for bilingual Kazakh–Russian administration through forward translation, reconciliation, back-translation, expert review and pilot cognitive testing in 15 women. Three gynaecological experts reviewed the content, and all 35 source items were retained. The 12-question form combined selected source items with general questions and was evaluated as a prediction model.
The full candidate set represented 22 content blocks with 31 encoded terms, using 17 general-question and 19 Pap-specific inputs. These candidate structures originated in earlier modelling across three preventive programmes. The eight-domain candidate retained employment and marital status in addition to the six-domain structure. The fixed full, eight-domain and six-domain candidates contained 36, 14 and 12 question inputs, respectively.
The term domain denotes a content grouping used to organise model inputs, rather than a psychometrically established latent factor. Four domains each corresponded to one general question: preventive attitude, religious refusal, healthcare-system trust and insurance. The fifth domain used the Pap-awareness item. The sixth combined seven access and navigation items. Insurance contributed two regression terms, explaining why six domains produced seven encoded predictors. The resulting instrument is referred to here as the brief Pap questionnaire.
To examine the tradeoff between questionnaire length and predictive performance for Pap testing, we conducted a secondary comparison of the three previously defined candidate sets using the same 601 development records, endpoint, five outer folds, penalty grid, and internal calibration procedure. Each version was fitted as a standalone Pap model. The comparison used held-out AUC, Brier score and logarithmic loss. It evaluated fixed candidate sets; the earlier process of selecting those sets was not repeated within each fold. The external evaluation assessed the retained brief questionnaire.
The questionnaire contained four common questions and eight Pap-specific questions. The common questions assessed general prevention attitude, insurance status, healthcare-system trust, and previous refusal for religious reasons. The Pap module assessed awareness and seven access/navigation perceptions: uncertainty about where to attend, time burden, postponement or forgetting, competing priorities, perceived lack of a nearby facility, preference for a female clinician, and unwillingness to pay. These items represented six domains rather than 12 independently selected predictors.
The access/navigation input was an equally weighted index of seven practical and preference items. These included preference for a female clinician, which concerns service acceptability. Equal weighting provided a single summary input while limiting the number of model coefficients.
Prevention attitude and trust were coded from 1 to 3, and religious refusal from 0 to 1. Insurance was encoded as two indicators, uninsured and unknown, with insured as the reference. Awareness was transformed as (response −1)/2. The access/navigation composite was calculated as (mean of the seven 1–5 responses −1)/4. The resulting seven encoded predictors were retained without further feature selection using external outcomes.
The religious-refusal item referred to a cervical smear in the source survey and to recommended preventive care in the brief form. Item wording and mapping are presented in Supplementary Material S3.
Predictors were standardised using development-sample means and population standard deviations. There were three missing awareness values in the development data. Training-set mean imputation and standardisation were repeated within each resampling training fold; no held-out observations informed these transformations. External applicable predictor values were complete and were transformed using the final development parameters.
Attitude, trust and awareness entered as numerical scores, assuming a constant change in log odds between adjacent response levels. The access composite entered as a continuous term. The model was additive, without interactions or nonlinear terms.
2.3. Outcomes
The primary historical endpoint was absence of an affirmative previous Pap-test history: 36 never-screened and 102 do-not-remember responses were coded as events, while 463 affirmative responses were non-events. This endpoint captured lack of a confirmed screening history. We therefore performed a sensitivity analysis excluding all 102 uncertain responses, with 36 never-screened women and 463 women reporting previous testing.
The prospective endpoint was noncompletion of a newly recommended Pap test within 90 days of the baseline recommendation. After each participant’s 90-day observation period, the physician reviewed the medical record to determine whether the test had been completed during that interval. Completion was coded 0 and noncompletion 1. All 372 analysed women had a recorded binary outcome. Capture of tests performed outside the records available to the reviewing physician was not separately assessed.
The 90-day endpoint operationalises timely completion of a recommendation rather than permanent screening refusal or long-term adherence. Three-month assessments have precedent in cervical-screening research, including the STRATEGIC study [12]. Completion after 90 days was outside the defined endpoint.
2.4. Model Estimation and Internal Evaluation
A standalone ridge logistic regression included an intercept and the seven encoded predictors. The penalty was selected from 0.5, 2, 8, 32 and 128 by four-fold development-only cross-validation minimising logarithmic loss. Five outer folds assessed the modelling procedure, with penalty selection repeated inside each outer training sample. An internal logistic calibrator was estimated using four-fold out-of-fold predictions within each outer training sample and applied to the corresponding outer test fold.
Ridge logistic regression was selected to estimate individual probabilities while reducing instability from correlated inputs and uncommon religious-refusal and insurance categories. All seven predictor terms were retained.
For each woman, the raw linear predictor is the intercept plus the sum of coefficient-weighted standardised inputs. Each input is centred on its training mean and divided by its training population SD. Coefficients minimise summed binary negative log likelihood plus (λ/2) times the sum of squared slope coefficients; the intercept is not penalised. Numerical penalty values therefore refer to summed rather than mean likelihood. Training means and SDs use observed values, and missing awareness responses are replaced with the training mean.
For the final model, the penalty was selected using all development records under cross-validation. Regression coefficients were fitted using these development records, and the final internal calibration intercept and slope were estimated using development out-of-fold raw predictions. The external outcomes did not enter this estimation. Selection of the six-domain candidate structure preceded this standalone analysis; internal performance does not account for all uncertainty in that earlier domain selection.
After internal evaluation, the final regression coefficients were estimated using all development records and the development-selected penalty. The final internal calibration used the raw outer-fold predictions from the development procedure. The resulting preprocessing parameters, regression coefficients, and internal calibration parameters were fixed before evaluating the external outcomes. Internal calibration was therefore part of the development model; external recalibration was a separate subsequent step.
The definite-history sensitivity analysis repeated the same estimation procedure after excluding uncertain historical responses.
2.5. Prospective Transferability Evaluation and Updating
We first applied the frozen development model to all 372 externally eligible women. ROC-AUC measured discrimination, and Brier score and logarithmic loss measured probabilistic prediction error. Calibration-in-the-large was estimated with the model logit as an offset. A calibration intercept and slope were also jointly estimated by logistic regression of the external endpoint on the frozen model logit. Ideal values are zero and one, respectively [10,11].
The Brier score was the mean squared difference between predicted probability and observed outcome. Logarithmic loss provided a complementary measure of probability error, with greater penalties for confident incorrect predictions. Lower values indicate better performance for both measures.
Calibration was assessed by calibration-in-the-large and the jointly estimated calibration intercept and slope. Grouped calibration points were retained as descriptive information. Supplementary Material S4 adds a flexible calibration curve fitted by logistic regression with a restricted cubic spline of the prediction logit, with three knots at its empirical 10th, 50th and 90th percentiles. Pointwise 95% bands used 500 participant-bootstrap resamples conditional on the prediction vector and fixed knots. Curves are displayed over the 2.5th–97.5th percentile range to limit tail extrapolation.
The updating equation was logit(pupdated) = a + b × logit(pfrozen). Apparent updating performance was distinguished from internal validation of the updating procedure. Stratified participant-level 10-fold cross-validation was repeated 20 times: updating parameters were estimated in nine folds and tested in the remaining fold. We report the mean of the 20 complete out-of-fold performance estimates. This validates the updating procedure internally within the external cohort; it does not provide a second independent validation of the final updated coefficients.
External updating estimated only two parameters, a and b; it did not refit the seven predictor coefficients or reselect questionnaire items. In each of the 20 cross-validation repetitions, every external participant contributed once to a held-out assessment. The reported Brier score, logarithmic loss, and AUC were calculated separately for each repetition and then averaged. Predictions from different repetitions were not averaged before scoring. The distribution and calibration figures use the first repetition for a single held-out representation. Leave-one-base-out evaluation assessed the same updating procedure while holding out an entire recruitment base.
Confidence intervals for the primary estimates used 1000 participant-bootstrap samples conditional on the frozen development model. An exploratory bootstrap resampled the eight recruitment bases. Additional participant-bootstrap intervals, using seed 20261028, are reported separately in Supplementary Material S4. No clinical thresholds were selected. Reporting follows TRIPOD + AI [13].
2.6. Complete Prediction Equation
The complete primary model is specified in Table 1. The seven inputs are standardised using the listed development parameters. Raw coefficients define z; the development calibration then gives L = −0.122554 + 1.055929 × z and pfrozen = 1/(1 + exp(−L)). For the updated model, Lupdated = 0.753306 + 0.447913 × L and pupdated = 1/(1 + exp(−Lupdated)). Applying the external update to L, rather than directly to z, preserves both calibration stages.
Table 1.
Coding, standardisation and raw coefficients of the primary Pap model. SD, population standard deviation in the development data. Insurance indicators use insured women as the reference. Coefficients apply to standardised inputs; awareness missing values use the listed mean. Values are rounded to six decimals.
2.7. Additional Analyses
Additional analyses used Python 3.12.14 with NumPy 2.3.5, pandas 2.2.3, SciPy 1.17.0, scikit-learn 1.8.0 and Matplotlib 3.10.8. Penalised logistic regression was fitted by minimising the summed-likelihood objective with SciPy optimisers.
Cohorts were compared descriptively using available common variables, with sample standard deviations and standardised mean differences. Single-domain AUCs used the directions fixed by published coefficients. Domain permutation used 1000 permutations, with both insurance indicators permuted jointly; permutation ranges are not confidence intervals. The frozen full-model AUC was compared with attitude-only ranking by paired participant bootstrap. An attitude-only development model underwent the same 20 repetitions of prospective 10-fold updating as the full model, using matched folds. These analyses were exploratory.
Historical sensitivity analyses used five repetitions of nested five-fold outer/four-fold inner cross-validation, with fold-specific imputation, scaling, penalty selection and internal calibration. Comparators included attitude alone, omission of attitude, age-based models and an access index omitting female-clinician preference. A separate three-repetition analysis kept identical seven-predictor profiles together within folds. These analyses evaluated fixed candidate structures. The seed was 20261028; each repetition was scored separately before averaging.
3. Results
3.1. Development and Prospective Outcomes and Cohort Characteristics
The primary development sample contained 601 women and 138 historical events (23.0%). The selected ridge penalty was 0.5. Nested internal ROC-AUC was 0.990 and the Brier score was 0.015. The definite-history analysis included 499 women and 36 events (7.2%), with a selected penalty of 2.
The prospective Pap subset contained 372 women, with 126 noncompletions (33.9%) and 246 completions. Mean age was 41.40 years (SD 7.00) in development and 46.85 years (SD 8.77) prospectively. Cohorts also differed in trust, uncertain insurance status, awareness and the distribution of the access/navigation index (Table 2). Education, residence and other sociodemographic characteristics were available historically but not in the prospective cohort, preventing matched comparison of these characteristics. The prospective questionnaires were coded as Russian for 196 women and Kazakh for 176 women.
Table 2.
Available common characteristics of the development and prospective cohorts.
3.2. Comparison of Candidate Questionnaire Lengths
In the Pap-specific comparison, the full candidate model achieved a held-out AUC of 0.999, a Brier score of 0.014 and a logarithmic loss of 0.044. The eight-domain candidate achieved an AUC of 0.989, a Brier score of 0.017 and a logarithmic loss of 0.076; corresponding values for the six-domain candidate were 0.990, 0.015 and 0.066 (Table 3). Thus, the full candidate performed somewhat better, while the brief form retained high discrimination with 24 fewer predictor-question inputs, representing a reduction of 66.7%. The six-domain form also used two fewer inputs than the eight-domain form and had slightly better point estimates across the three measures.
Table 3.
Internal performance of the fixed Pap candidate sets under the same nested evaluation.
3.3. Prospective Discrimination and Calibration
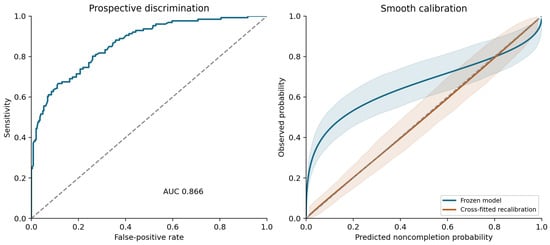
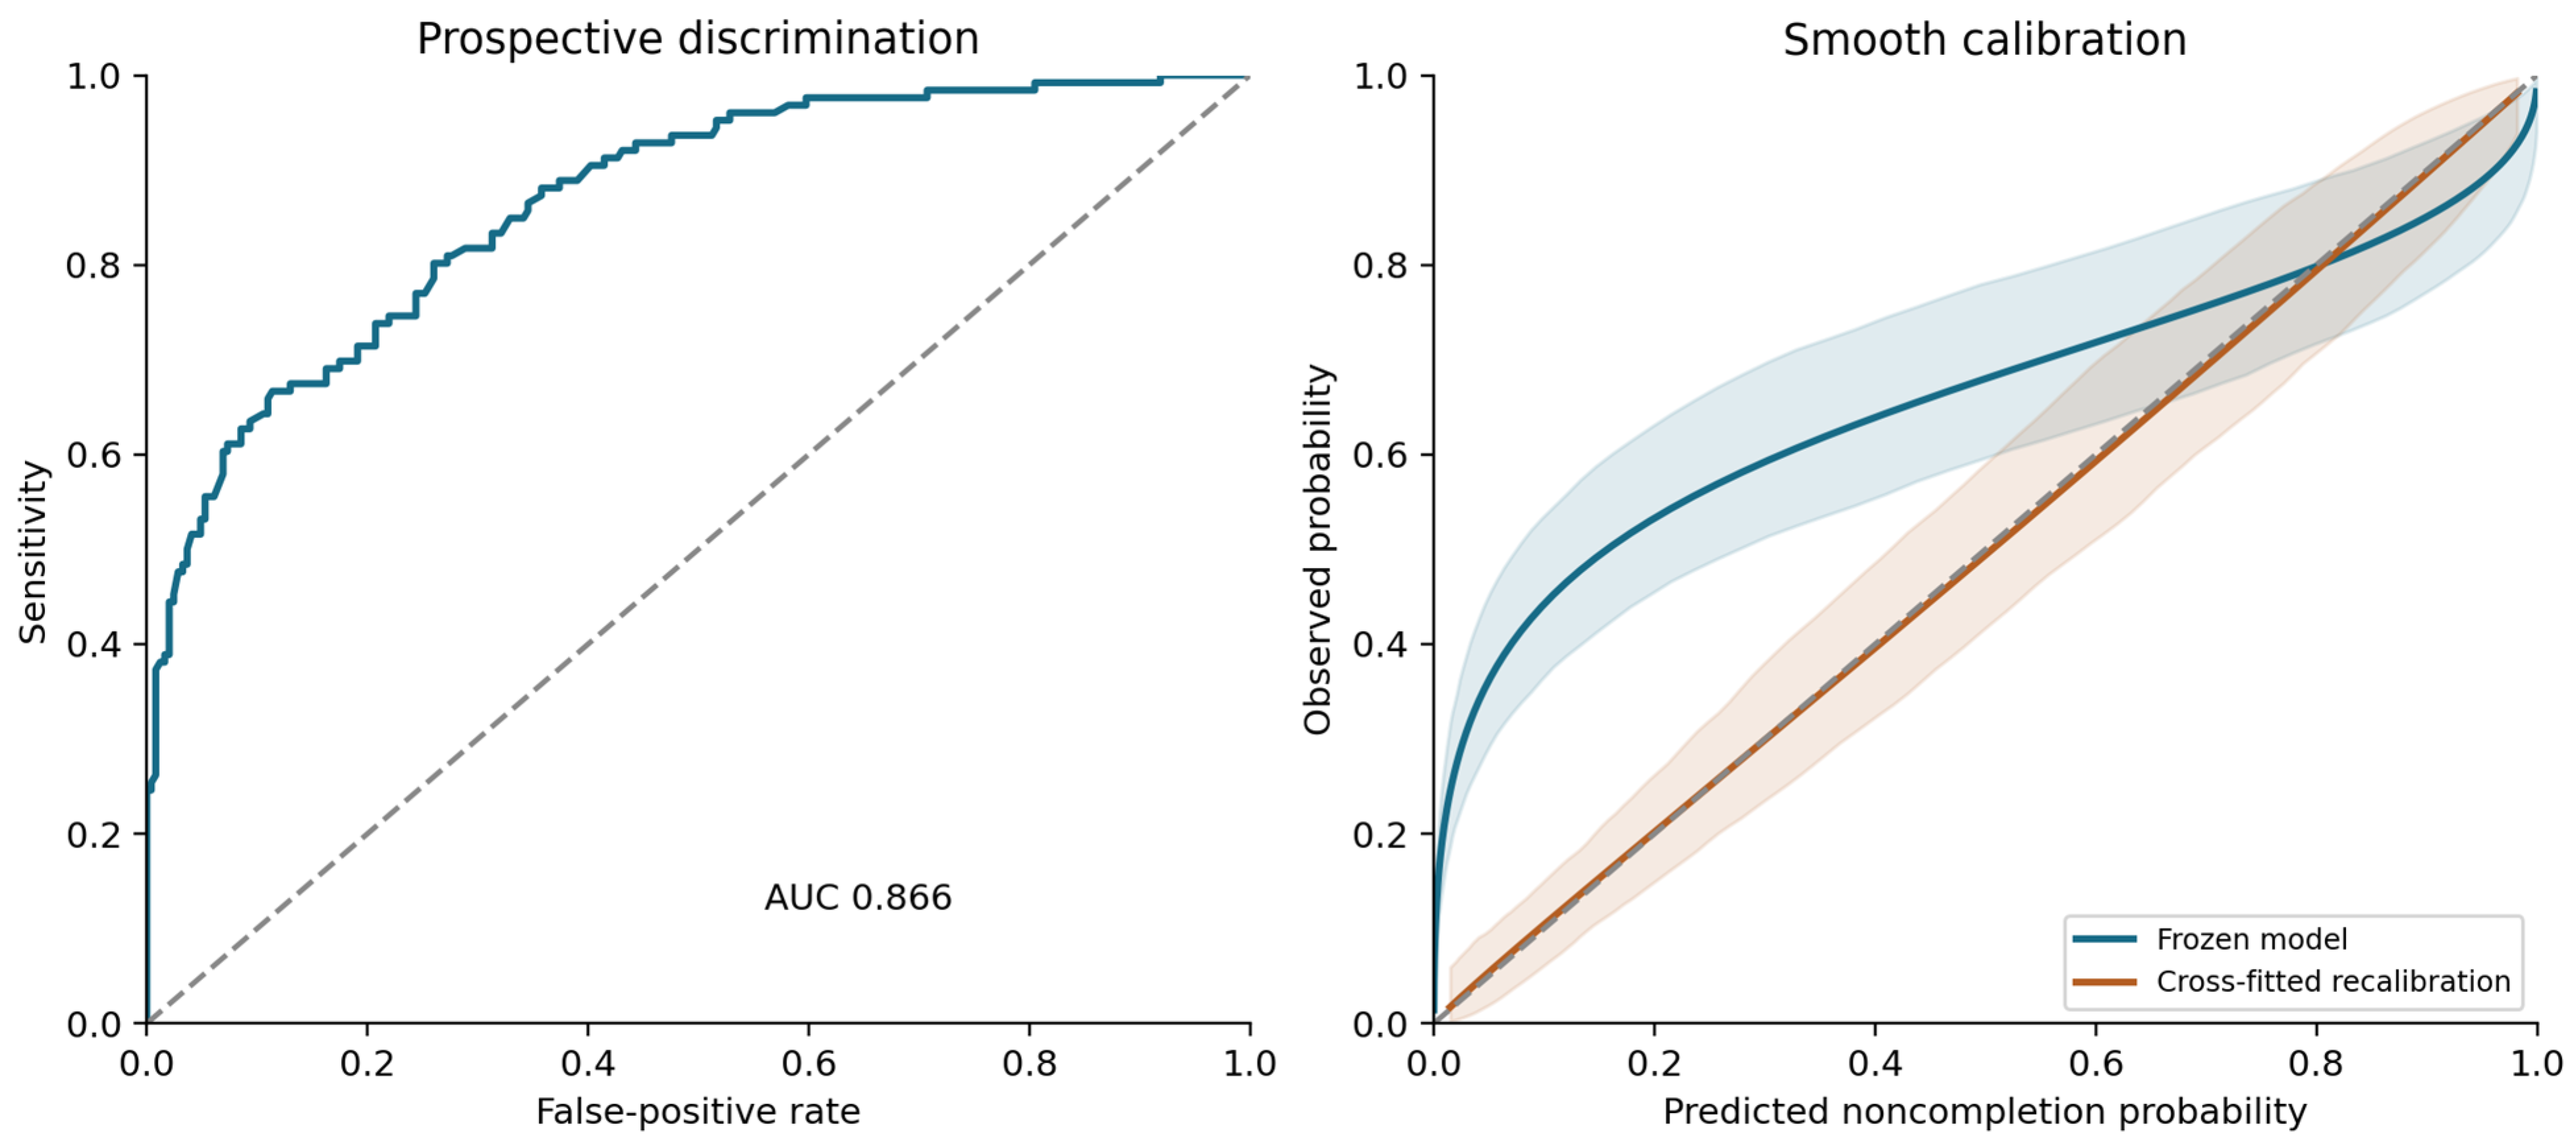
The frozen standalone model achieved an AUC of 0.866 (95% CI 0.827–0.903) (Table 4). Its mean predicted noncompletion was 19.8%, compared with an observed 33.9%, a shortfall of 14.0 percentage points. The Brier score was 0.166 and the logarithmic loss was 0.694. Calibration-in-the-large was 2.451 (95% CI 1.919–2.988). The jointly estimated calibration slope was 0.448 (95% CI 0.372–0.563), indicating that the transported predictions were too extreme in addition to underestimating average risk (Figure 2).
Table 4.
External performance and internal evaluation of recalibration.
Figure 2.
Prospective ROC curve and smooth calibration. Frozen predictions use the published equation. Updated curves use held-out predictions from the first cross-validation repetition. Blue lines and shading denote the frozen model, and orange lines and shading the cross-fitted recalibration. The dashed grey line indicates no discrimination (left panel) and perfect calibration (right panel). Bands are pointwise 95% participant-bootstrap intervals conditional on fixed predictions and spline knots; they do not include full model-development or updating-refit uncertainty. Curves are shown from the 2.5th to 97.5th prediction percentiles. Separate calibration panels and full methods are provided in Supplementary Material S4.
3.4. Recalibration and Sensitivity Analyses
The primary updating equation was logit(pupdated) = 0.753306 + 0.447913 × logit(pfrozen). The apparent updated Brier score was 0.133. The mean cross-validated Brier score was 0.134, compared with 0.166 before updating, and the cross-validated logarithmic loss was 0.417. Leave-base-out updating gave a Brier score of 0.135. Because the updating slope was positive, recalibration preserved ranking within a single fitted model; it improved probabilities rather than increasing its discrimination.
The cross-validated reduction in Brier score was approximately 18.8% relative to the frozen model. This improvement concerned probability accuracy. The AUC of the apparent updated model was unchanged because a positive calibration slope preserves ordering. Small differences in held-out AUC reflect the separate updating equations fitted across cross-validation folds.
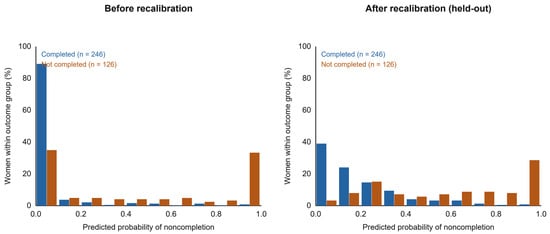
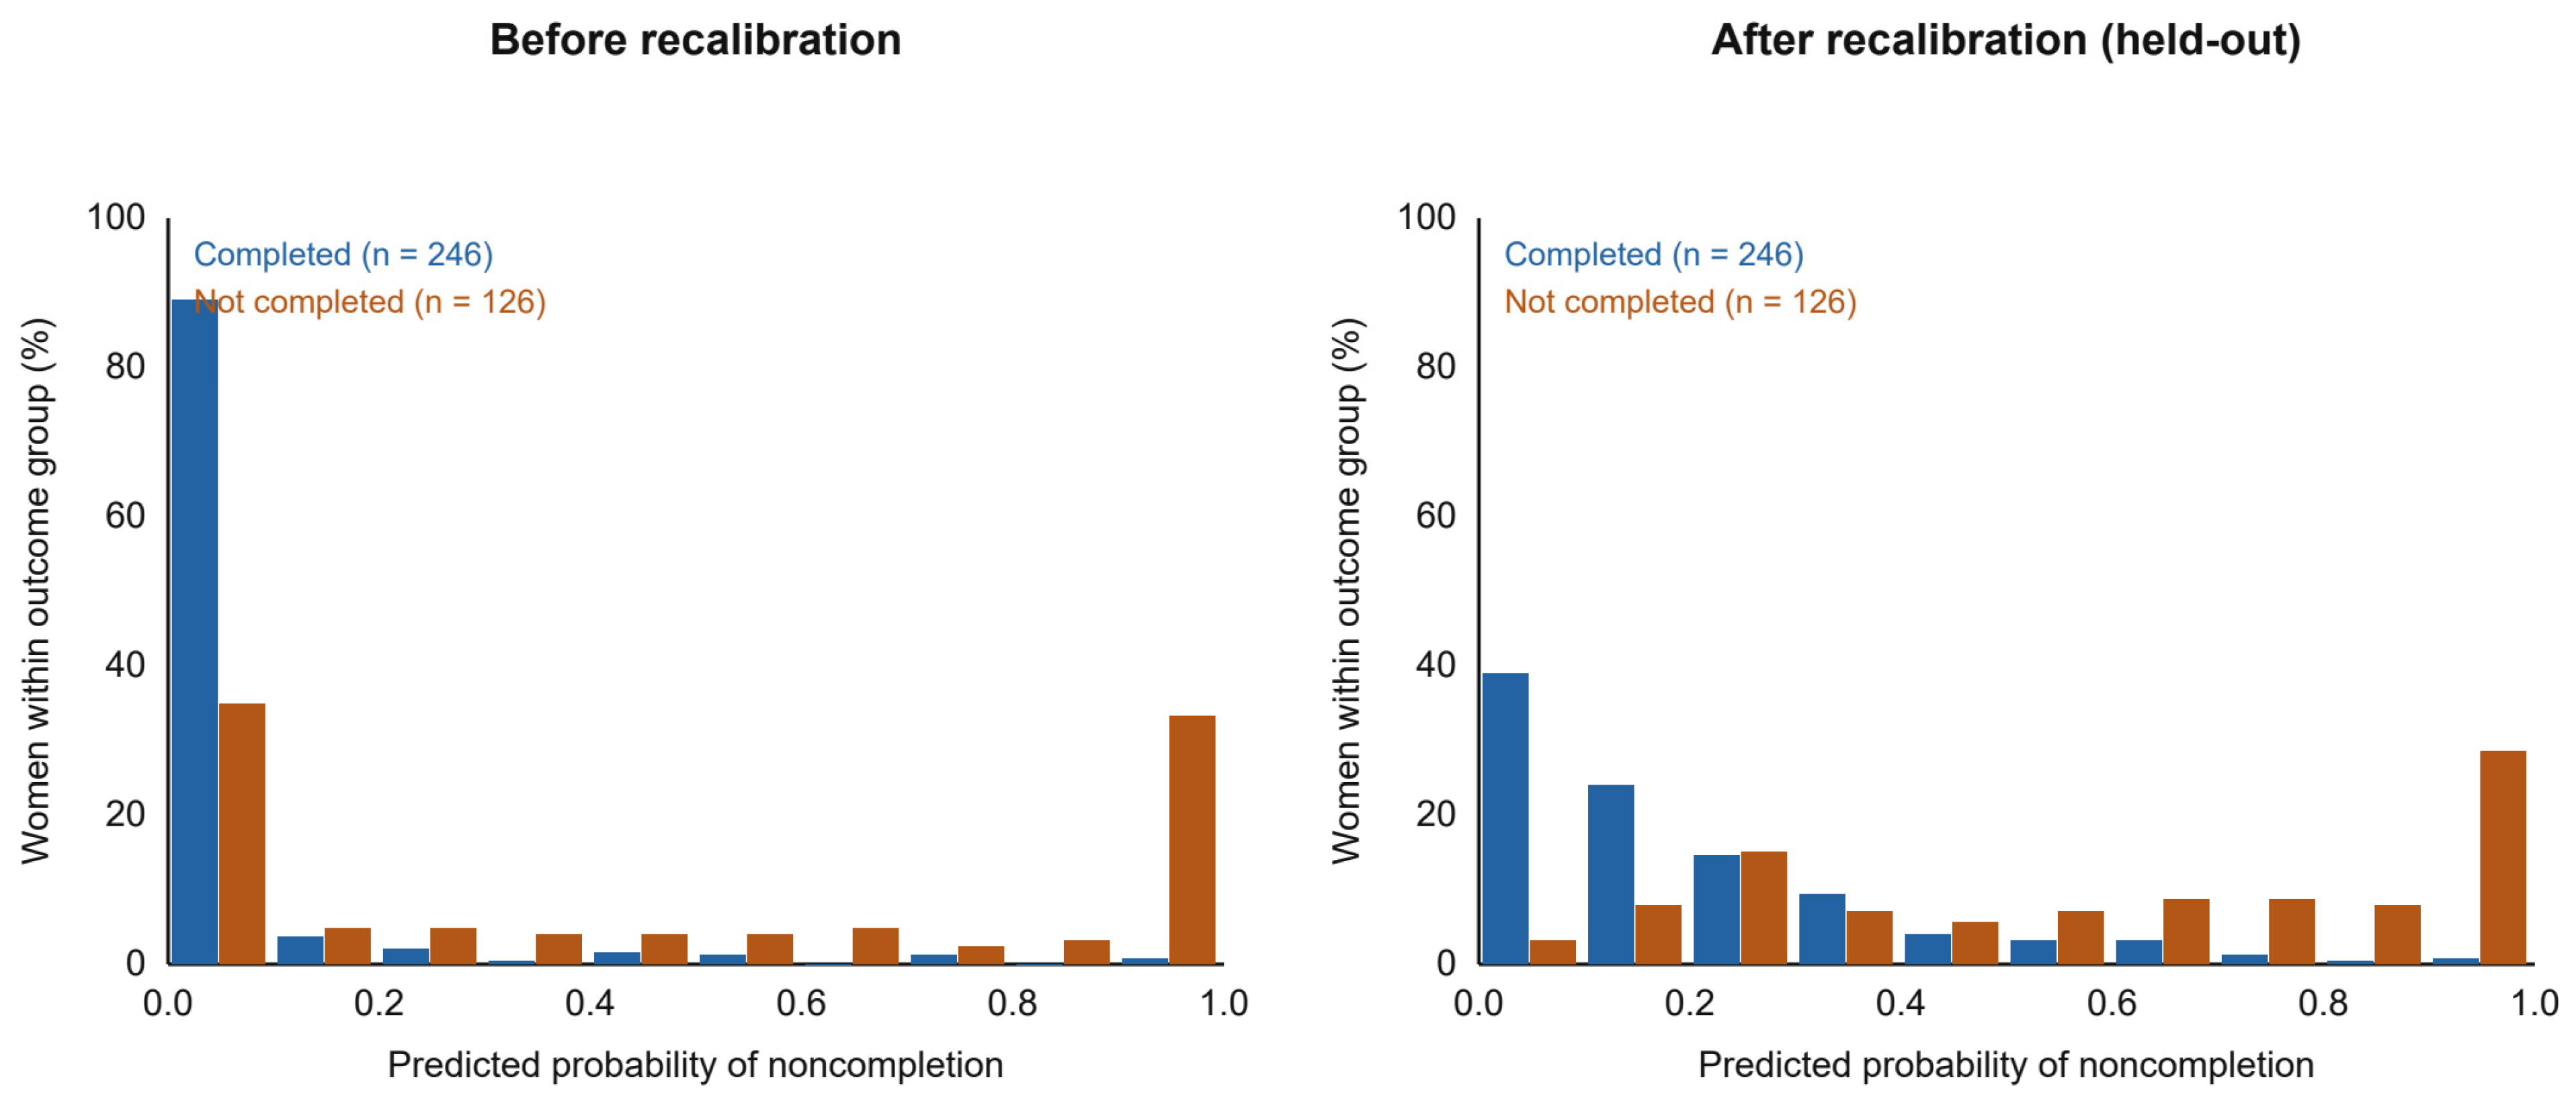
The effect of updating varies across the risk range. A frozen probability of 0.10 corresponds to an updated probability of 0.443; 0.20 corresponds to 0.533; and 0.80 corresponds to 0.798. These values illustrate the fitted transformation rather than observed subgroup event rates. In this cohort, updating primarily raised low predicted risks and moderated the spread of probabilities (Figure 3).
Figure 3.
Predicted noncompletion probabilities by observed outcome before and after recalibration. Bars show percentages within each outcome group in probability intervals of width 0.10. Updated predictions are held out from the first stratified 10-fold cross-validation repetition.
Excluding uncertain historical responses produced an external AUC of 0.872 (95% CI 0.836–0.908), with similar discrimination to the primary model but greater underestimation of mean risk. Its updated mean cross-validated Brier score was 0.133. Exploratory recruitment-base bootstrap intervals for the primary frozen model were 0.824–0.903 for the AUC and 0.382–0.548 for the calibration slope, consistent with the participant-level conclusions, subject to the small number of recruitment bases.
3.5. Exploratory Predictor and Simpler-Model Analyses
Prevention attitude alone ranked prospective outcomes with AUC 0.846 (95% bootstrap CI 0.804–0.886). The frozen full-model AUC exceeded this by 0.019, with paired 95% CI −0.011 to 0.053. Permuting prevention attitude reduced AUC by approximately 0.298 on average, compared with 0.061 for trust; these are predictive contributions within the frozen model rather than causal effects. Single-domain AUCs and permutation analyses are reported in Supplementary Material S4.
After matched cross-fitted updating, the exploratory attitude-only model had a mean Brier score of 0.110 and a log loss of 0.380, compared with 0.134 and 0.417 for the six-domain model. These exploratory results did not demonstrate a probability-accuracy advantage for the full questionnaire. Previous Pap-test history was not recorded in the prospective cohort, so incremental value beyond that clinically relevant comparator could not be evaluated.
Repeated participant-level nested cross-validation gave a mean AUC of 0.988 for the six-domain model. Keeping identical seven-predictor profiles together within folds reduced the mean AUC to 0.958, with variation across three repetitions (Supplementary Material S4).
The seven-item access/navigation index had a raw Cronbach’s alpha of 0.680 historically and 0.785 prospectively. The female-clinician preference item had a negative corrected item-total Spearman correlation historically (−0.595). An exploratory model refitted to historical data after omitting this item had a prospective AUC of 0.878. Item diagnostics and additional comparisons are provided in Supplementary Material S4.
4. Discussion
A questionnaire model developed against a historical screening-history proxy retained prospective discrimination, with an AUC of 0.866, but required substantial probability updating. The calibration slope of approximately 0.45 indicated that the original predictions were too extreme [10,11]. Recalibration reduced probability error in the prospective cohort.
The prospective analysis extends local cross-sectional evidence by measuring questionnaire responses before ascertainment of a timed subsequent outcome. Studies conducted in Kazakhstan have associated participation with awareness and have described differences between urban and rural women [4,5]. Our common-variable comparison also demonstrated appreciable shifts in age, trust, awareness and access-related responses. Such differences could contribute to transport problems, but neither case-mix comparisons nor recalibration identify the causes of those problems. Measurement changes and the different outcome definitions are additional explanations.
The historical endpoint is a central limitation. Most historical events were uncertain responses, and current attitudes were measured after the screening behaviour was recalled. Associations can therefore reflect prior healthcare experiences and reverse temporal relationships. Evidence that Pap-test knowledge affects self-report accuracy reinforces the need to distinguish uncertainty from verified nonattendance [9]. The definite-history sensitivity analysis preserved prospective discrimination but had only 36 historical events; it cannot make the historical and prospective outcomes equivalent.
The high internal AUC should be interpreted in light of candidate selection using the historical data. Selection of the six-domain structure was not repeated within resampling, so internal estimates may retain optimism from that process. Performance also varied when identical predictor profiles were kept together within folds. Independent evaluation should therefore assess the complete model-development process, including item selection [10,13].
Prevention attitude accounted for much of the prospective discrimination. The full model had a small, imprecisely estimated AUC increment over attitude alone, while the recalibrated attitude-only comparator had a lower Brier score and logarithmic loss. These findings support direct comparison of questionnaire lengths before choosing an instrument for clinical use.
The brief questionnaire combines general perceptions, insurance and selected CCS-HBMS items rather than reproducing the original HBM constructs [6]. Its predictive evaluation is distinct from psychometric validation. The access/navigation index includes heterogeneous practical and preference items; its dimensionality and test–retest reliability remain unestablished. Differences in religious-refusal wording may also affect comparability between cohorts.
Barrera Ferro and colleagues combined behavioural assessment with administrative-data modelling in Bogotá [7]. The present study extends this work by examining transfer from a historical screening-history proxy to timed Pap-test completion in Kazakhstan and assessing probability updating. Differences in populations and endpoints limit direct comparison of reported AUCs.
Navigation is a plausible application, but its effectiveness cannot be inferred from prediction accuracy. Percac-Lima and colleagues demonstrated improved screening completion with targeted navigation in a randomised trial using routine risk indicators [8]. The suitability of this questionnaire for targeting navigation remains to be evaluated. Future evaluation should compare a brief attitude assessment, routinely available demographics and prior attendance, and the full questionnaire, then assess uptake, workload, acceptability and equity.
The study used non-probability sampling. Invitation, refusal and pre-analysis attrition counts were unavailable, limiting assessment of recruitment-stage selection. The prospective cohort included eight recruitment units, and detailed matched sociodemographic variables were unavailable. Completion was assessed after 90 days using records available to the reviewing physician; tests performed elsewhere could have been missed. The endpoint captures timely completion of one recommendation. Recalibration was assessed internally by cross-validation and requires independent evaluation [10,11].
5. Conclusions
A fixed questionnaire model estimated against a historical screening-history proxy discriminated 90-day Pap-test noncompletion in a separate prospective cohort, but required substantial probability updating. Additional analyses indicate that prevention attitude carries much of the information and do not establish superiority of the 12-item model over a simpler assessment. The findings support further comparative prospective research, rather than clinical thresholds or routine adoption of the updated model.
Supplementary Materials
The following supporting information can be downloaded at https://www.mdpi.com/article/10.3390/healthcare14223868/s1, Supplementary Material S1: Original questionnaire on attitudes toward cervical cancer screening; Supplementary Material S2: Brief Pap questionnaire; Supplementary Material S3: Mapping and scoring of the brief questionnaire; Supplementary Material S4: Additional analyses, including Figure S1: Flow of analysed records; Figure S2: Flexible calibration of frozen and cross-fitted updated predictions; Figure S3: Spearman correlation matrices for the seven access/navigation-related items. Reference [6] is cited in the Supplementary Materials.
Author Contributions
Conceptualisation, A.K., G.D. and V.K.; methodology, A.K. and V.K.; software, A.K.; validation, A.K. and N.S.; formal analysis, N.S.; investigation, A.K., S.Y. and Z.G.; resources, G.D. and A.U.; data curation, A.K. and N.S.; writing—original draft preparation, A.K. and N.S.; writing—review and editing, G.D., V.K., A.U., N.S., S.Y., Z.G. and Ç.Ç.; visualisation, A.K.; supervision, G.D., A.U. and Ç.Ç.; project administration, A.K. and A.U. All authors have read and agreed to the published version of the manuscript.
Funding
This research received no external funding.
Institutional Review Board Statement
The study was conducted in accordance with the Declaration of Helsinki and approved by the Local Ethics Committee of NJSC Astana Medical University (Decision No. 1, Meeting No. 4, dated 27 February 2026). The approval covered the study, including its prospective phase.
Informed Consent Statement
Informed consent was obtained from all subjects involved in the study: written consent for paper-based administration or active electronic consent for online administration. The participant information sheet and consent form were provided to all participants before data collection: participants completing the paper questionnaire signed the written consent form, and participants completing the online questionnaire could access it only after actively selecting “I agree”. Consent included subsequent physician verification of Pap-test completion through the medical record. Written informed consent for publication was not required, as this article contains no information that could identify individual participants.
Data Availability Statement
Individual-level data are subject to privacy and ethical restrictions. The prediction equation is reported in Table 1. Analysis code and aggregate outputs are provided in the accompanying reproducibility package.
Acknowledgments
The authors thank the physicians and staff of the participating recruitment bases for their assistance with data collection and verification of Pap-test completion, and all women who took part in the study. During the preparation of this manuscript, the authors used Grammarly (Grammarly Inc.) for language editing of the English text. The authors have reviewed and edited the output and take full responsibility for the content of this publication.
Conflicts of Interest
The authors declare no conflicts of interest.
Abbreviations
| Abbreviation | Meaning |
| AUC | Area under the receiver operating characteristic curve |
| CCS-HBMS | Cervical Cancer and Pap Smear Test Health Belief Model Scale |
| CI | Confidence interval |
| CV | Cross-validation |
| HPV | Human papillomavirus |
| Pap | Papanicolaou |
| ROC | Receiver operating characteristic |
| SD | Standard deviation |
| TRIPOD + AI | Transparent Reporting of a multivariable prediction model for Individual Prognosis Or Diagnosis, updated for artificial intelligence |
References
- World Health Organization. Global Strategy to Accelerate the Elimination of Cervical Cancer as a Public Health Problem; World Health Organization: Geneva, Switzerland, 2020; Available online: https://www.who.int/publications/b/55745 (accessed on 28 October 2026).
- World Health Organization. Kazakhstan Cervical Cancer Profile 2021; WHO: Geneva, Switzerland, 2021; Available online: https://cdn.who.int/media/docs/default-source/country-profiles/cervical-cancer/cervical-cancer-kaz-2021-country-profile-en.pdf (accessed on 28 October 2026).
- Ministry of Healthcare of the Republic of Kazakhstan. Screening Age Groups and Frequency, Reflecting Order No. 75 of 10 July 2026 Amending Order No. ҚP ДCM-174/2020. Available online: https://www.gov.kz/situations/331/858?lang=ru (accessed on 28 October 2026).
- Issa, T.; Babi, A.; Azizan, A.; Alibekova, R.; Khan, S.A.; Issanov, A.; Chan, C.K.; Aimagambetova, G. Factors associated with cervical cancer screening behaviour of women attending gynaecological clinics in Kazakhstan: A cross-sectional study. Women’s Health 2021, 17. [Google Scholar] [CrossRef] [Scilit] [PubMed]
- Zhetpisbayeva, I.; Rommel, A.; Kassymbekova, F.; Semenova, Y.; Sarmuldayeva, S.; Giniyat, A.; Tanatarova, G.; Dyussupova, A.; Faizova, R.; Rakhmetova, V.; et al. Cervical cancer trend in the Republic of Kazakhstan and attitudes towards cervical cancer screening in urban and rural areas. Sci. Rep. 2024, 14, 13731. [Google Scholar] [CrossRef] [Scilit] [PubMed]
- Guvenc, G.; Akyuz, A.; Açikel, C.H. Health Belief Model Scale for Cervical Cancer and Pap Smear Test: Psychometric Testing. J. Adv. Nurs. 2011, 67, 428–437. [Google Scholar] [CrossRef] [Scilit] [PubMed]
- Barrera Ferro, D.; Bayer, S.; Brailsford, S.; Smith, H. Improving intervention design to promote cervical cancer screening among hard-to-reach women: Assessing beliefs and predicting individual attendance probabilities in Bogotá, Colombia. BMC Women’s Health 2022, 22, 212. [Google Scholar] [CrossRef] [Scilit] [PubMed]
- Percac-Lima, S.; Ashburner, J.M.; Zai, A.H.; Chang, Y.; Oo, S.A.; Guimaraes, E.; Atlas, S.J. Patient Navigation for Comprehensive Cancer Screening in High-Risk Patients Using a Population-Based Health Information Technology System: A Randomized Clinical Trial. JAMA Intern. Med. 2016, 176, 930–937. [Google Scholar] [CrossRef] [Scilit] [PubMed]
- Webb, S.; Kelly, P.J.; Wickliffe, J.; Ault, K.; Ramaswamy, M. Validating self-reported cervical cancer screening among women leaving jails. PLoS ONE 2019, 14, e0219178. [Google Scholar] [CrossRef] [Scilit] [PubMed]
- Riley, R.D.; Archer, L.; Snell, K.I.E.; Ensor, J.; Dhiman, P.; Martin, G.P.; Bonnett, L.J.; Collins, G.S. Evaluation of Clinical Prediction Models (Part 2): How to Undertake an External Validation Study. BMJ 2024, 384, e074820. [Google Scholar] [CrossRef] [Scilit] [PubMed]
- Van Calster, B.; McLernon, D.J.; van Smeden, M.; Wynants, L.; Steyerberg, E.W. Calibration: The Achilles heel of predictive analytics. BMC Med. 2019, 17, 230. [Google Scholar] [CrossRef] [Scilit] [PubMed]
- Kitchener, H.; Gittins, M.; Cruickshank, M.; Moseley, C.; Fletcher, S.; Albrow, R.; Gray, A.; Brabin, L.; Torgerson, D.; Crosbie, E.J.; et al. A cluster randomized trial of strategies to increase uptake amongst young women invited for their first cervical screen: The STRATEGIC trial. J. Med. Screen. 2018, 25, 88–98. [Google Scholar] [CrossRef] [Scilit] [PubMed]
- Collins, G.S.; Moons, K.G.M.; Dhiman, P.; Riley, R.D.; Beam, A.L.; Van Calster, B.; Ghassemi, M.; Liu, X.; Reitsma, J.B.; van Smeden, M.; et al. TRIPOD+AI statement: Updated guidance for reporting clinical prediction models that use regression or machine learning methods. BMJ 2024, 385, e078378. [Google Scholar] [CrossRef] [Scilit] [PubMed]

Disclaimer/Publisher’s Note: The statements, opinions and data contained in all publications are solely those of the individual author(s) and contributor(s) and not of MDPI and/or the editor(s). MDPI and/or the editor(s) disclaim responsibility for any injury to people or property resulting from any ideas, methods, instructions or products referred to in the content. |
© 2026 by the authors. Licensee MDPI, Basel, Switzerland. This article is an open access article distributed under the terms and conditions of the Creative Commons Attribution (CC BY) license.