


Highlights
What are the main findings?
- Presents an ecological framework linking place-based environmental factors with physical activity and cognitive health in youth.
- Demonstrates built and social environmental pathways for promoting youth health.
What are the implications of the main findings?
- Highlights the importance of neighborhood safety and the home media environment in shaping healthy behaviors.
- Provides a replicable framework for examining place-based environmental influences on health outcomes.
Abstract
Background/Objectives: Guided by the Social Ecological Model, this study examined the relationships between ecological environmental factors, executive function, physical activity, and sedentary behavior among youth. Methods: A cross-sectional study was conducted among 283 youth (Mage = 15 years; Male = 33.6%) in the North Texas region. Parent-report surveys were used to assess ecological environmental factors, executive function, physical activity, and sedentary behavior. Sociodemographic characteristics, including household income, ethnicity, age, and sex were also collected. Results: Neighborhood safety/crime was significantly associated with all components of executive function (p < 0.01). Community walkability was significantly associated with overall executive function and planning (β = 0.16 and 0.18, p < 0.05) and with screen-based sedentary behavior (r = −0.23, p < 0.01). Neighborhood safety/crime and the home media environment significantly predicted physical activity (β = −0.34; β = −0.29, p < 0.01; R2 = 20.4%), whereas the socioeconomic environment emerged as a significant predictor of daily sedentary behavior (β = 0.16; p < 0.05; R2 = 18.1%). The mediation model showed acceptable fit, chi-square (df = 25) = 420.32, p = 0.017, CFI = 0.956, and RMSEA = 0.050, 90% CI [0.021, 0.075]. The direct path from environmental factors to executive function was statistically significant (p < 0.01); however, the indirect effect of environmental factors on executive function through physical activity was not supported. Conclusions: These findings suggest that neighborhood safety and walkability are associated with executive function in school-aged youth, independent of physical activity levels. Because the data are cross-sectional, these implications should be tested in longitudinal and intervention studies before informing clinical guidelines.
1. Introduction
The World Health Organization (WHO) defines brain health as the state of brain functioning across cognitive, sensory, social–emotional, behavioral, and motor domains that allows a person to realize their full potential over the life course, irrespective of the presence or absence of disorders [1]. This functional definition extends beyond the absence of neurological disease, and conceptual analyses similarly describe brain health as a multidimensional construct [2]. Cognitive functioning is one domain within this broader construct and refers to mental processes, such as attention, memory, and reasoning, through which the brain supports learning and behavior. Executive function (EF) comprising working memory, planning, inhibitory control, and cognitive flexibility, represents one of the most consequential domains of cognitive development in school-aged youth [3]. These top-down regulatory processes govern goal-directed behavior, resistance to impulse, and the capacity to adapt flexibly to complex, rapidly changing environments [3,4]. Because the prefrontal cortex as the primary neural substrate of EF undergoes protracted maturation through late adolescence and into early adulthood [5], this developmental period is uniquely sensitive to both supportive and adverse environmental conditions. Deficits in EF during adolescence are strongly associated with attention-deficit/hyperactivity disorder (ADHD), poor academic achievement, elevated health-risk behavior, and compromised occupational outcomes [6], establishing EF as a priority target for public health research. It is important to understand how the environments in which adolescents live including the built environment, community infrastructure, residential location, and socioeconomic circumstances shape EF development, which also emerges urgent implications for community planning, public health policy, and educational practice.
A compelling and growing body of evidence notes physical activity (PA) as one of the most robust modifiable behavioral mechanisms linking environmental conditions to brain health in youth. Research documented that moderate-to-vigorous physical activity (MVPA) promotes EF through well-characterized neurobiological pathways, including increased cerebral blood flow, hippocampal neurogenesis, and upregulation of brain-derived neurotrophic factor (BDNF) in the prefrontal cortex [7]. Systematic reviews and meta-analyses confirm that both acute and chronic exercise yield significant improvements in working memory, inhibitory control, and cognitive flexibility in children and adolescents [8,9]. Conversely, sedentary behavior (SB), particularly recreational screen-based SB, is negatively associated with EF, most consistently for inhibitory control and cognitive flexibility [10]. Despite this well-established behavioral link between PA, SB, and EF, the literature remains unclear on what features of the ecological and built environment enable or constrain these associations.
The Social Ecological Model (SEM) [11,12] provides theoretical architecture for this investigation. The SEM posits that health behavior is shaped by multilevel influences including individual, interpersonal, organizational, community, and policy, that operate simultaneously and interactively. The SEM literature has demonstrated that community-level factors, including neighborhood safety, built environment design, recreational infrastructure, and socioeconomic conditions, are as consequential as individual-level determinants in predicting youth PA participation [13,14]. A multilevel meta-analysis by Zhao and colleagues [15] confirmed that community and environmental factors exerted significant independent effects on PA participation in children and adolescents across multiple nations. Smith and colleagues [16], in a systematic review linking built environment to PA and active transport, found consistent positive effects of walkability, park quality, and pedestrian infrastructure on PA, with effects moderated by socioeconomic status, underscoring the equity implications of built environment design for physical health outcomes. However, no study to date has integrated multiple ecological-level factors within a single model to simultaneously examine their effects on both PA behavior and EF in adolescents.
1.1. Built Environment and Pedestrian Infrastructure
The built environment encompassing neighborhood design, street connectivity, land use mix, residential density, and access to recreational facilities, constitutes the physical substrate within which adolescents’ daily movement behavior is embedded. Community walkability, derived from geospatial assessments of street network connectivity, destination density, and sidewalk continuity, is a structural property of urban and suburban infrastructure with well-documented effects on youth PA. Sallis et al. [17] found that adolescents in high-walkability neighborhoods accumulated significantly more transport walking and total PA, and spent less time in SB, relative to peers in low-walkability areas. Caetano et al. [18], using kernel density estimation and GIS-derived walkability indices in a community sample of 292 adolescents, demonstrated that proximity to PA-enabling destinations and higher walkability scores were associated with significantly greater odds of meeting PA guidelines. Loh et al. [19], using GIS-based street network buffers in a multilevel study, confirmed that walkability components, particularly land use mix and residential density, were positively associated with accelerometer-measured MVPA outside school hours, with safety perceptions moderating these built environment effects. The pedestrian infrastructure of a community directly structures the opportunity and safety conditions for active transport, outdoor play, and unstructured physical activity, the very behaviors that sustain prefrontal cortical health during development [7,20]. Integrating geospatial walkability measures alongside other ecological indicators is therefore essential for a comprehensive model of environmental influences on adolescent PA and EF.
1.2. Neighborhood Safety and Crime Exposure
Perceived and objective neighborhood safety represent critical community-level factors that moderate the built environment’s influence on PA. When adolescents or their caregivers perceive neighborhoods as unsafe due to crime, traffic, or community violence, opportunities for outdoor PA are constrained by parental restrictions on independent mobility and by the adolescents’ own fear-based avoidance of outdoor spaces [21]. A nationally representative cohort study of 11,726 UK adolescents found that both perceived neighborhood safety and objective crime index scores were significantly associated with PA, with fear of crime functioning as a barrier particularly for girls [21]. Beyond its suppression of PA, neighborhood safety also exerts direct neurobiological effects on EF. According to the data from the Adolescent Brain Cognitive Development (ABCD) Study, Lindsley and colleagues [22] found that perceived neighborhood safety was associated with adolescent cognitive performance and executive control. Chronic threat perception activates the hypothalamic–pituitary–adrenal (HPA) axis, elevating cortisol and constraining the neuroplasticity of the prefrontal cortex and hippocampus, regions most central to working memory, planning, and inhibitory control [22,23]. These converging behavioral and neurobiological pathways make neighborhood safety a foundational variable in any ecologically comprehensive model of adolescent EF.
1.3. Socioeconomic Environment and Household Income
Socioeconomic environment indexed by household income, area deprivation, and access to economic resources shape both PA behavior and EF through multiple, interacting pathways. Lower household income constrains access to safe recreational spaces, organized sports programs, and activity-enabling built environments, producing systematic disparities in MVPA and SB across socioeconomic strata [24]. Mesquita et al. [25] demonstrated that parent–child physical activity associations were strongest in low-income households, where modeling of sedentary behavior was also most pronounced. Beyond its behavioral effects, socioeconomic deprivation exerts a direct neurological burden on EF development, that is, poverty-associated chronic stress reduces gray matter volume in the dorsolateral prefrontal cortex and anterior cingulate cortex, disrupts prefrontal synaptic architecture, and alters amygdala-prefrontal functional connectivity in ways that impair cognitive regulation [26]. Using data from the ABCD Study, Dennis and colleagues [27] confirmed that household income was independently associated with EF performance and prefrontal cortical volume, with effects partially mediated by BMI, underscoring the co-occurring physical and cognitive health disparities that track socioeconomic disadvantages. These findings establish socioeconomic environment as both behavioral and neurobiological determinant of adolescent EF, operating through which mechanism remains unknown.
1.4. Geographic Environment/Residential Context
Geographic environment operationalized through residential ZIP code, urban–suburban–rural classification, and area-level indicators of resource concentration and environmental quality represent the broadest structural stratum of ecological influence on adolescent health behavior. ZIP code has been described as one of the strongest predictors of health outcomes in the United States, capturing the accumulated burden of socioeconomic disadvantage, environmental hazard exposure, and built environment quality that cluster geographically [20]. GIS-derived analyses have consistently demonstrated that residential location predicts access to walkable streets, parks, recreational infrastructure, and safe outdoor spaces that enable PA [18,19]. At the neurodevelopmental level, neighborhood disadvantage measured by area deprivation indices has been associated with reduced cortical surface area in the prefrontal cortex, altered amygdala-prefrontal connectivity, and lower performance on EF assessments in children and adolescents from the ABCD Study cohort [22,27]. These geospatial effects on brain development underscore the importance of including residential location, not simply as a covariate, but as an analytically meaningful ecological variable.
This study tested interdisciplinary framing to provide preliminary evidence on which ecological conditions most powerfully constrain adolescent behaviors and brain health and identifying the community infrastructure targets most amenable to intervention by public health practitioners, civil engineers, and urban planners alike. Neighborhood environments are not distributed at random. Residential segregation and structural racism concentrate crime, limited recreational resources, and environmental stressors in low-income communities and communities of color, making place of residence a fundamental cause of health disparities [28,29]. From an environmental justice perspective, unsafe or under-resourced neighborhoods are upstream determinants that can shape children’s development through several routes simultaneously, rather than through a single behavioral pathway. How the environment is measured also shapes what it can explain. Perceived and objective environmental measures capture related but distinct constructs [30,31]. For children, parents’ perceptions may be especially consequential, because parents act as gatekeepers who permit or restrict outdoor play according to how safe they judge the neighborhood to be. PA is one plausible pathway linking the environment to executive function, but other pathways are also likely, including the socioeconomic disadvantage and exposure to neighborhood violence [32,33]. The existing literature supports a robust evidence base for individual links among ecological environment; however, no published study has simultaneously examined the effects of multiple ecological factors on PA behaviors and EF components within a single integrated model. We therefore conceptualized ecological environmental factors as operating through multiple parallel pathways, as well as through direct associations with executive function.
Guided by the Social Ecological Model [12], the purpose of this study was to examine the relationships of ecological environmental factors, including neighborhood safety/crime, community walkability, home media environment, socioeconomic environment (i.e., household income), and geographic environment (i.e., ZIP code or residential location), with EF (i.e., working memory [WM], planning [PL], regulation [RE] and inhibition [IN]), and physical activity (PA; light PA [LPA], moderate-to-vigorous PA [MVPA]) and sedentary behavior (SB; screen-based SB and non-screen-based SB) among school-aged youth; and to test the potential mediating role of physical activity in the relationship between ecological environmental factors and executive function among youth.
2. Materials and Methods
2.1. Participants and Setting
A cross-sectional research design was implemented and a total of 283 parents/guardians of school-aged youth were recruited with most participants coming from the metropolitan areas of the United States. Each parent/guardian reported on one target child. The youth in this study had a mean age of 15 years (SD = 3.2 years), 33.6% were male, and 35.1% were identified as Hispanic. Age data were available for 244 participants; 39 had missing age data. Most participants were adolescents: 225 (92.2%) were aged 13–18 years, 17 (7.0%) were aged 11–12 years, and 2 (0.8%) were younger than 11 years.
Participants were recruited from various community events in the North Texas region, including school sport events and afterschool programs in local schools. Eligible participants were parents or legal guardians of a child aged 7–18 years who were able to complete the survey in English or Spanish. Surveys without informed consent were excluded. Data was collected through parent-reported surveys. Body mass index (BMI) was calculated using parent-reported height and weight and was used as a continuous covariate in the analyses. The full school-aged range was retained because the Social Ecological Model proposes that home, neighborhood, and community environments shape movement behaviors and EF across childhood and adolescence, and because the sample was predominantly adolescent. Child age was included as a covariate in all analyses.
The study was approved by the university institutional review board. After IRB approval, digital flyers with an embedded QuestionPro survey link were distributed as the primary recruitment method. Through the survey link, parents/guardians were able to review and sign informed consent before beginning the online survey. Participants who did not provide consent were automatically withdrawn from the study. All participants were fully informed about the purpose, procedures, risks, and benefits of the study before agreeing to participate. Participants were also informed that participation was voluntary and that they could refuse or discontinue participation at any time without penalty or loss of benefits.
2.2. Ecological Environmental Factors
Socioeconomic environment: The socioeconomic environment was assessed using parent-reported household income from the parent survey. Household income was used as an indicator of the family’s socioeconomic context, reflecting available economic resources that may influence children’s access to PA opportunities and resources.
Geographic environment: The geographic environment was assessed using parent-reported residential ZIP code from the parent survey. ZIP code was used to characterize participants’ residential location and broader geographic context, which may be linked to neighborhood-level environmental conditions and community resources, and was not analyzed as a numeric value [34]. Each ZIP code was matched to its primary 2020 Rural–Urban Commuting Area (RUCA) code from the U.S. Department of Agriculture Economic Research Service, which classifies areas by population density, urbanization, and daily commuting patterns [35]. RUCA codes were recorded into four ordered categories: 1 = metropolitan core (RUCA 1), 2 = metropolitan high commuting (RUCA 2), 3 = micropolitan core (RUCA 4), and 4 = rural (RUCA 10), with higher values indicating more rural residence. Most participants (98.2%) resided in metropolitan-core areas (Table 1).
Table 1.
Descriptive Statistics of Study Variables.
Home media environment: The home media environment was assessed using items adapted from the Neighborhood Impact on Kids (NIK) study parent survey [36]. Parents reported whether each of seven types of electronic devices was available in their child’s bedroom, including televisions, computers, game consoles, and cell phones. Each item was coded 1 (yes) or 2 (no), and items were summed (range = 7–14), with higher scores indicating fewer media devices in the child’s bedroom. Reliability of the home media environment scale was moderate in the present sample, with an average-measures intraclass correlation coefficient (two-way mixed, consistency) of 0.57 (95% CI [0.48, 0.65]) [37,38]. This domain captures the availability of bedroom-based media devices, which may contribute to increased screen time, SB, and shorter sleep duration.
Community walkability environment: Community walkability was assessed using the parent version of the Neighborhood Environment Walkability Survey for Youth (NEWS-Y) [39]. Parents completed 5 items assessing perceptions of neighborhood design and safety features that may support active travel and outdoor activity, including street connectivity, availability of alternative routes, adequacy of street lighting, and perceived safety from crime or stranger danger. Items were rated on a 4-point scale (1 = strongly disagree to 4 = strongly agree) and summed (range = 5–20), with higher scores indicating more supportive walking environments. The NEWS-Y parent and youth versions have shown test–retest reliability and associations with youth PA [39]; the parent version was evaluated among parents of children aged 5–11 years and of adolescents aged 12–18 years, which covers the age range of the present sample. Parent-reported perceptions of neighborhood walkability and safety have also shown acceptable construct validity (confirmatory factor analysis) and associations with PA in a large sample of U.S. youth aged 3–17 years [40].
Neighborhood safety/crime environment: Neighborhood safety and crime were assessed using items adapted from the Neighborhood Impact on Kids (NIK) questionnaire. Parents completed 9 items regarding perceived barriers to their child’s outdoor play and PA in nearby parks, playgrounds, or neighborhood streets, including lack of equipment, supervision, or peers, as well as concerns about crime, traffic, and poor lighting. Parents also reported whether they or someone they knew had been a victim of crime in the neighborhood. This domain reflects parents’ perceptions of neighborhood safety and social conditions that may limit children’s opportunities for outdoor play and PA within the community.
2.3. Physical Activity and Sedentary Behavior
Physical activity: The Godin–Shephard leisure-time physical activity questionnaire [41] was used to assess individuals’ participation in PA in their leisure time. Parents reported their child’s frequency of participating in vigorous–moderate and mild/light physical activities, respectively for more than 15 min in free time in the past 7 days. Based on the scoring guideline [42], LPA was calculated as LPA = mild frequency × three metabolic equivalents of task (MET); MVPA was calculated as MVPA = moderate frequency × five MET + strenuous frequency × nine MET, respectively. The calculated index for LPA and MVPA were used in the data analysis. The Godin–Shephard questionnaire has shown acceptable test–retest reliability among children and adolescents (r = 0.81) [42].
Sedentary behavior: Screen-based SB and non-screen-based SB were measured according to the amount of time engaged in eight sitting behaviors by the Sedentary Behavior Questionnaire (SBQ) [43]. The SBQ includes screen-based SB (i.e., sitting while watching television, using the computer for study, playing on computer/video games, and talking/texting on the phone) and non-screen-based SB (i.e., sitting while listening to music, doing paperwork or office work, reading and doing arts or crafts, and driving/taking cars or bus). Each sitting behavior was scaled in nine-time frames per day (i.e., 0, ¼, ½, 1, 2, 3, 4, 5, 6 and above 6 h). The sum of items from the screen-based and non-screen-based behaviors was used in the final data analysis.
2.4. Executive Functions
The Childhood Executive Function Inventory (CHEXI) for Parents & Teachers was used to assess EF [44]. The CHEXI includes 24 items across four domains: working memory (9 items), planning (4 items), regulation (5 items), and inhibition (6 items). Example items include “My child has difficulty remembering lengthy instructions” for working memory, “My child has difficulty with tasks or activities that involve several steps” for planning, “My child has clear difficulties doing things he/she finds boring” for regulation, and “My child has a tendency to do things without first thinking about what could happen” for inhibition. Parents rated each item on a 5-point scale ranging from 1 = Not true to 5 = Definitely true. Higher scores indicate greater EF difficulties, reflecting lower EF. The internal consistency of the CHEXI in the present study was excellent, with a Cronbach’s alpha of 0.90. The CHEXI used in the present study was developed specifically to assess EFs in everyday contexts and has demonstrated adequate reliability and validity in parent and teacher reports [44]. Parent-reported EF therefore provides a valid and practical behavioral indicator of the cognitive domain of brain health in population-based research [45,46].
2.5. Statistical Analysis
The data analyses were processed in the SPSS Version 30.1.1 (Armonk, NY, USA: IBM Corp.). The descriptive analyses including mean and standard deviation were calculated. Pearson product-moment correlation was used to examine the bivariate relationships among study variables. Then three hierarchical linear regression models were processed on PA, SB, and EF; another four models were further processed on working memory, planning, inhibition and regulation. Sex, age, and ethnicity were controlled in the regression models as confounding variables. Regression assumptions were examined for each model. Multicollinearity was evaluated with variance inflation factors (VIF) and tolerance, independence of residuals with the Durbin–Watson statistic, normality with residual skewness and kurtosis, and homoscedasticity with the Breusch-Pagan test. Influential observations were identified with Cook’s distance and leverage.
Two multivariate analyses of covariance (MANCOVA) were conducted to examine the effects of sex (boys vs. girls) and race (Hispanic vs. Non-Hispanic) on PA, SB, and EF by controlling age and BMI. For the MANCOVA, partial eta squared (ηp2) with 90% confidence intervals was computed for each univariate effect [47], and values of 0.01, 0.06, and 0.14 were interpreted as small, medium, and large effects, respectively [48,49]. Because eight outcomes were tested for each grouping factor, the Holm–Bonferroni procedure was applied within each factor to control the familywise error rate [50]. Sex and ethnic comparisons were treated as exploratory analyses [51]. For the hierarchical regression models, 95% confidence intervals are reported for all unstandardized coefficients. SPSS AMOS 31 were performed to test the combined effects of the multiple ecological-level factors on both PA behavior and EF in adolescents. Specifically, a structural equation model was further estimated to examine the mediation pathway from the ecological environmental factors to EF through PA. Model fit was evaluated with χ2, χ2/df, CFI, TLI, and RMSEA with its 90% confidence interval. Conventional cutoffs (CFI and TLI ≥ 0.90; RMSEA ≤ 0.08) were treated as guidelines rather than strict criteria [52,53].
2.6. Sample Size and Missing Data
Participants were recruited through community events, school sport events, and afterschool programs; and no a priori power analysis was conducted. A sensitivity power analysis in G*Power 3.1 [54] indicated that the smallest regression sample provided 80% power at α = 0.05 to detect an increment of f2 ≥ 0.08 for the five environmental predictors with three covariates. The SEM estimated 29 free parameters with N = 283, approximately 10 cases per parameter [55,56]; power for the RMSEA test of close fit was 0.69 [57]. The mediation analysis was therefore treated as exploratory. The SEM was estimated with full-information maximum likelihood, which uses all available data under the missing-at-random assumption [58]. Bivariate correlations used pairwise deletion, and the regression and MANCOVA models used listwise deletion. Little’s MCAR test was significant, χ2(477) = 559.66, p = 0.005 [59]; however, participants included in the analytic samples did not differ from excluded participants in age, sex, ethnicity, or BMI (all p ≥ 0.32). Finally, a sensitivity analysis was conducted in which the SEM was re-estimated with the five environmental domains entered as separate, correlated observed predictors of PA and EF, with PA retained as a latent factor (full-information maximum likelihood; Supplementary Table S1). This specification does not assume that the environmental domains share a common underlying construct.
3. Results
Descriptive statistics for eco-environmental factors, PA, and EF outcomes are summarized in Table 1. Most participants (98.2%) lived in metropolitan core areas based on the RUCA classification of their residential ZIP code.
On average, participants spent around 2.28 h (SD = 1.77) on screen-based SB and 5.54 h (SD = 4.14) on non-screen-based SB per day, respectively. The descriptive results indicated that 26.9% of adolescents were classified as insufficiently active (MET-weighted MVPA score < 14) [40] in this study. Participants’ average CHEXI scores were 14.28 (SD = 6.22), 6.13 (SD = 3.11), 8.82 (SD = 3.59), 10.03 (SD = 3.79), and 39.30 (SD = 15.16) on working memory, planning, regulation, inhibition, and overall executive function, respectively, with higher scores indicating greater difficulties. The large standard deviations of executive function outcomes indicated wide variation across participants. However, CHEXI has no normative data, so no cut-off values are available to classify executive function deficits.
The results of bivariate correlation analysis are presented in Table 2. MVPA but not LPA was significantly associated with all four EF subscales including working memory (r = −0.16, p < 0.05), planning (r = −0.17, p < 0.05), regulation (r = −0.28, p < 0.01), and inhibition (r = −0.14, p < 0.05). Both MVPA and LPA were significantly associated with daily screen-based SB (r = −0.15 and r = −0.14, p < 0.05, respectively). Screen-based SB was significantly related to neighborhood safety/crime, and community walkability (rs ranging from −0.16 to −0.23, p < 0.05), whereas non-screen-based SB were not significantly associated with any geographic environment factors. The ecological environment factors were significantly related to different EF subscales in this study. Specifically, both neighborhood safety/crime and community walkability were significantly associated with all components of EF (rs range from 0.16 to 0.42, p < 0.05). Socioeconomic environment was associated with working memory, planning, and inhibition (rs = −0.13 to −0.21, p < 0.05), geographic environment was associated with planning (r = 0.18, p < 0.01) and regulation (r = 0.15, p < 0.05), and home media environment was associated with planning (r = −0.14, p < 0.05). The correlation analyses also showed that home media environment and neighborhood safety/crime were significantly associated with MVPA (rhome = −0.24; rneighborhood = −0.23; p < 0.01), but not with LPA.
Table 2.
Bivariate Correlations Among Study Variables.
Diagnostics indicated no multicollinearity (VIF ≤ 1.33; tolerance ≥ 0.75) and no observation with Cook’s distance greater than 1. The results of hierarchical regression models of ecological environment in predicting overall PA, SB and EF are presented in Table 3 and Table 4a,b. The results of the regression analysis showed that neighborhood safety/crime and home media environmental were significant predictors of daily PA (β = −0.34; β = −0.29; R2 = 20.4%, p < 0.01; Table 3). After control for the demographic variables (i.e., sex, age, ethnicity), socioeconomic environment emerged as a significant predictor of daily overall SB (β = 0.16, R2 = 18.1%, p < 0.05; Table 3).
Table 3.
Hierarchical Regression Model Results for Physical Activity and Executive Function.
Table 4.
(a) Hierarchical Regression Model Results for Working Memory and Planning. (b) Hierarchical Regression Model Results for Regulation and Inhibition.
Furthermore, the EF was significantly predicted by the geographic environment, neighborhood safety/crime, and community walkability (β = 15, β = 0.16, β = 0.27, p < 0.05; Table 3), the model explained 27.4% of the variance. To further explore the predictive utility of the ecological environment factors in EF, additional regression analyses were further conducted to examine its associations with specific EF subscales, including working memory, planning, regulation, and inhibition.
The regression models (Table 4a,b) show that neighborhood safety/crime environment consistently predicted all subscales of EF including working memory (β = 0.26, R2 = 28.9%; p < 0.01), planning (β = 0.24, R2 = 30.5%; p < 0.01), regulation (β = 0.31, R2 = 20.4%; p < 0.01), and inhibition (β = 0.23, R2 = 22.6%; p < 0.01), after controlling for all covariates (i.e., age, sex, and ethnicity).
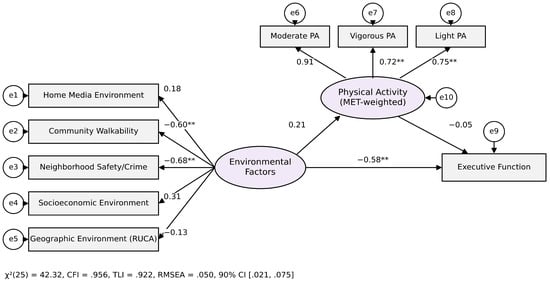
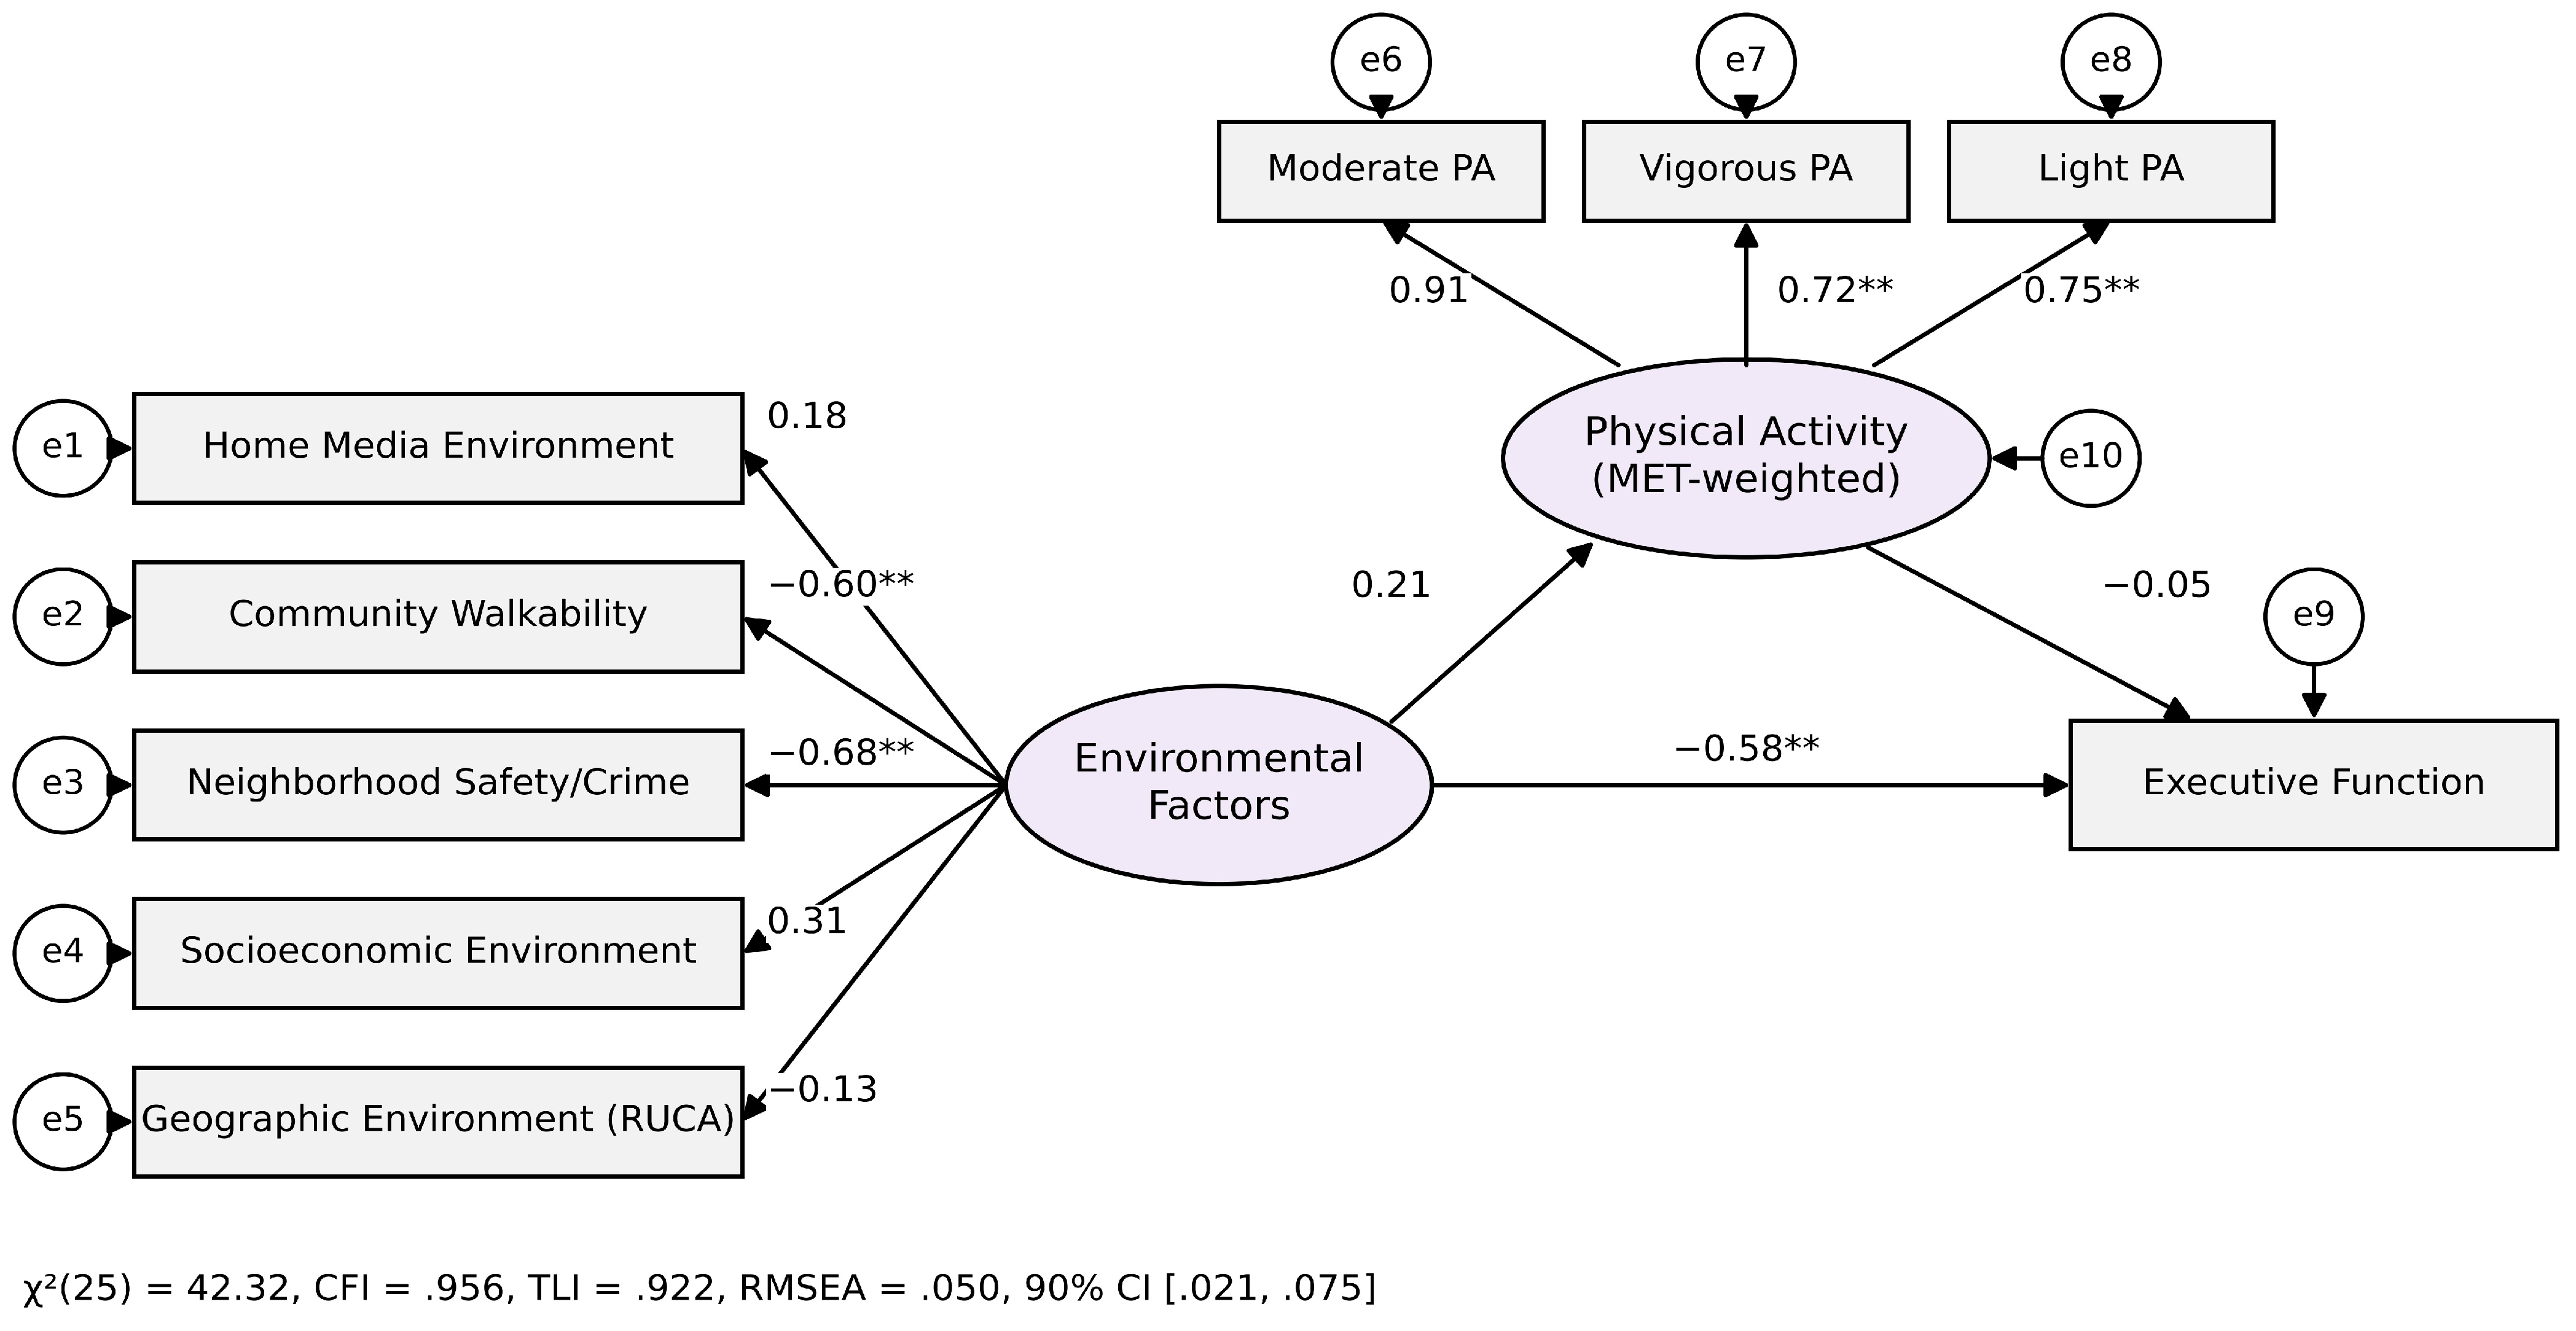
A structural equation model was further structured to examine the social-ecological pathway from the ecological environmental factors to EF by testing the mediation role of PA in this relationship (Figure 1). The ecological environmental factor was indicated by socioeconomic environment, geographic environment, home media environment, neighborhood safety/crime, and community walkability. PA was modeled as a latent factor indicated by LPA, MPA, and VPA. EF was included as an observed variable in the model. The model was estimated with full-information maximum likelihood and demonstrated acceptable fit, chi-square (df = 25) = 42.32, p = 0.017, Chi-square/df = 1.69, CFI = 0.956, IFI = 0.959, TLI = 0.922, NFI = 0.904, and RMSEA = 0.050, 90% CI [0.021, 0.075]. The structural path from the environmental factor to PA was positive but not significant (B = 5.377, SE = 2.971, β = 0.207, p = 0.07). The direct path from the environmental factor to EF was statistically significant (B = −27.96, SE = 8.732, β = −0.575, p < 0.001), whereas the direct path from PA to EF was not significant (β = −0.011, Monte Carlo 95% CI for the unstandardized effect [−2.60, 1.03]), and the standardized total effect was β = −0.586. The unstandardized and standardized SEM path coefficients are presented in Table 5.
Figure 1.
The Structural Equation Model for Social-Ecological Pathway; PA = physical activity. ** p < 0.01.
Table 5.
Model Fit Indices and Structural Path Coefficients of the SEM.
In the sensitivity analysis with the environmental domains entered as separate predictors (Supplementary Table S1), the model fit the data well, χ2(12) = 10.61, p = 0.563, CFI = 1.00, RMSEA = 0.00. Neighborhood safety/crime was associated with PA (β = −0.23, p = 0.002) and EF (β = 0.30, p < 0.001), community walkability with EF (β = 0.20, p = 0.005), and the home media environment with PA (β = −0.29, p < 0.001). PA was not associated with EF (β = −0.09, p = 0.184), and no indirect effect through PA was significant.
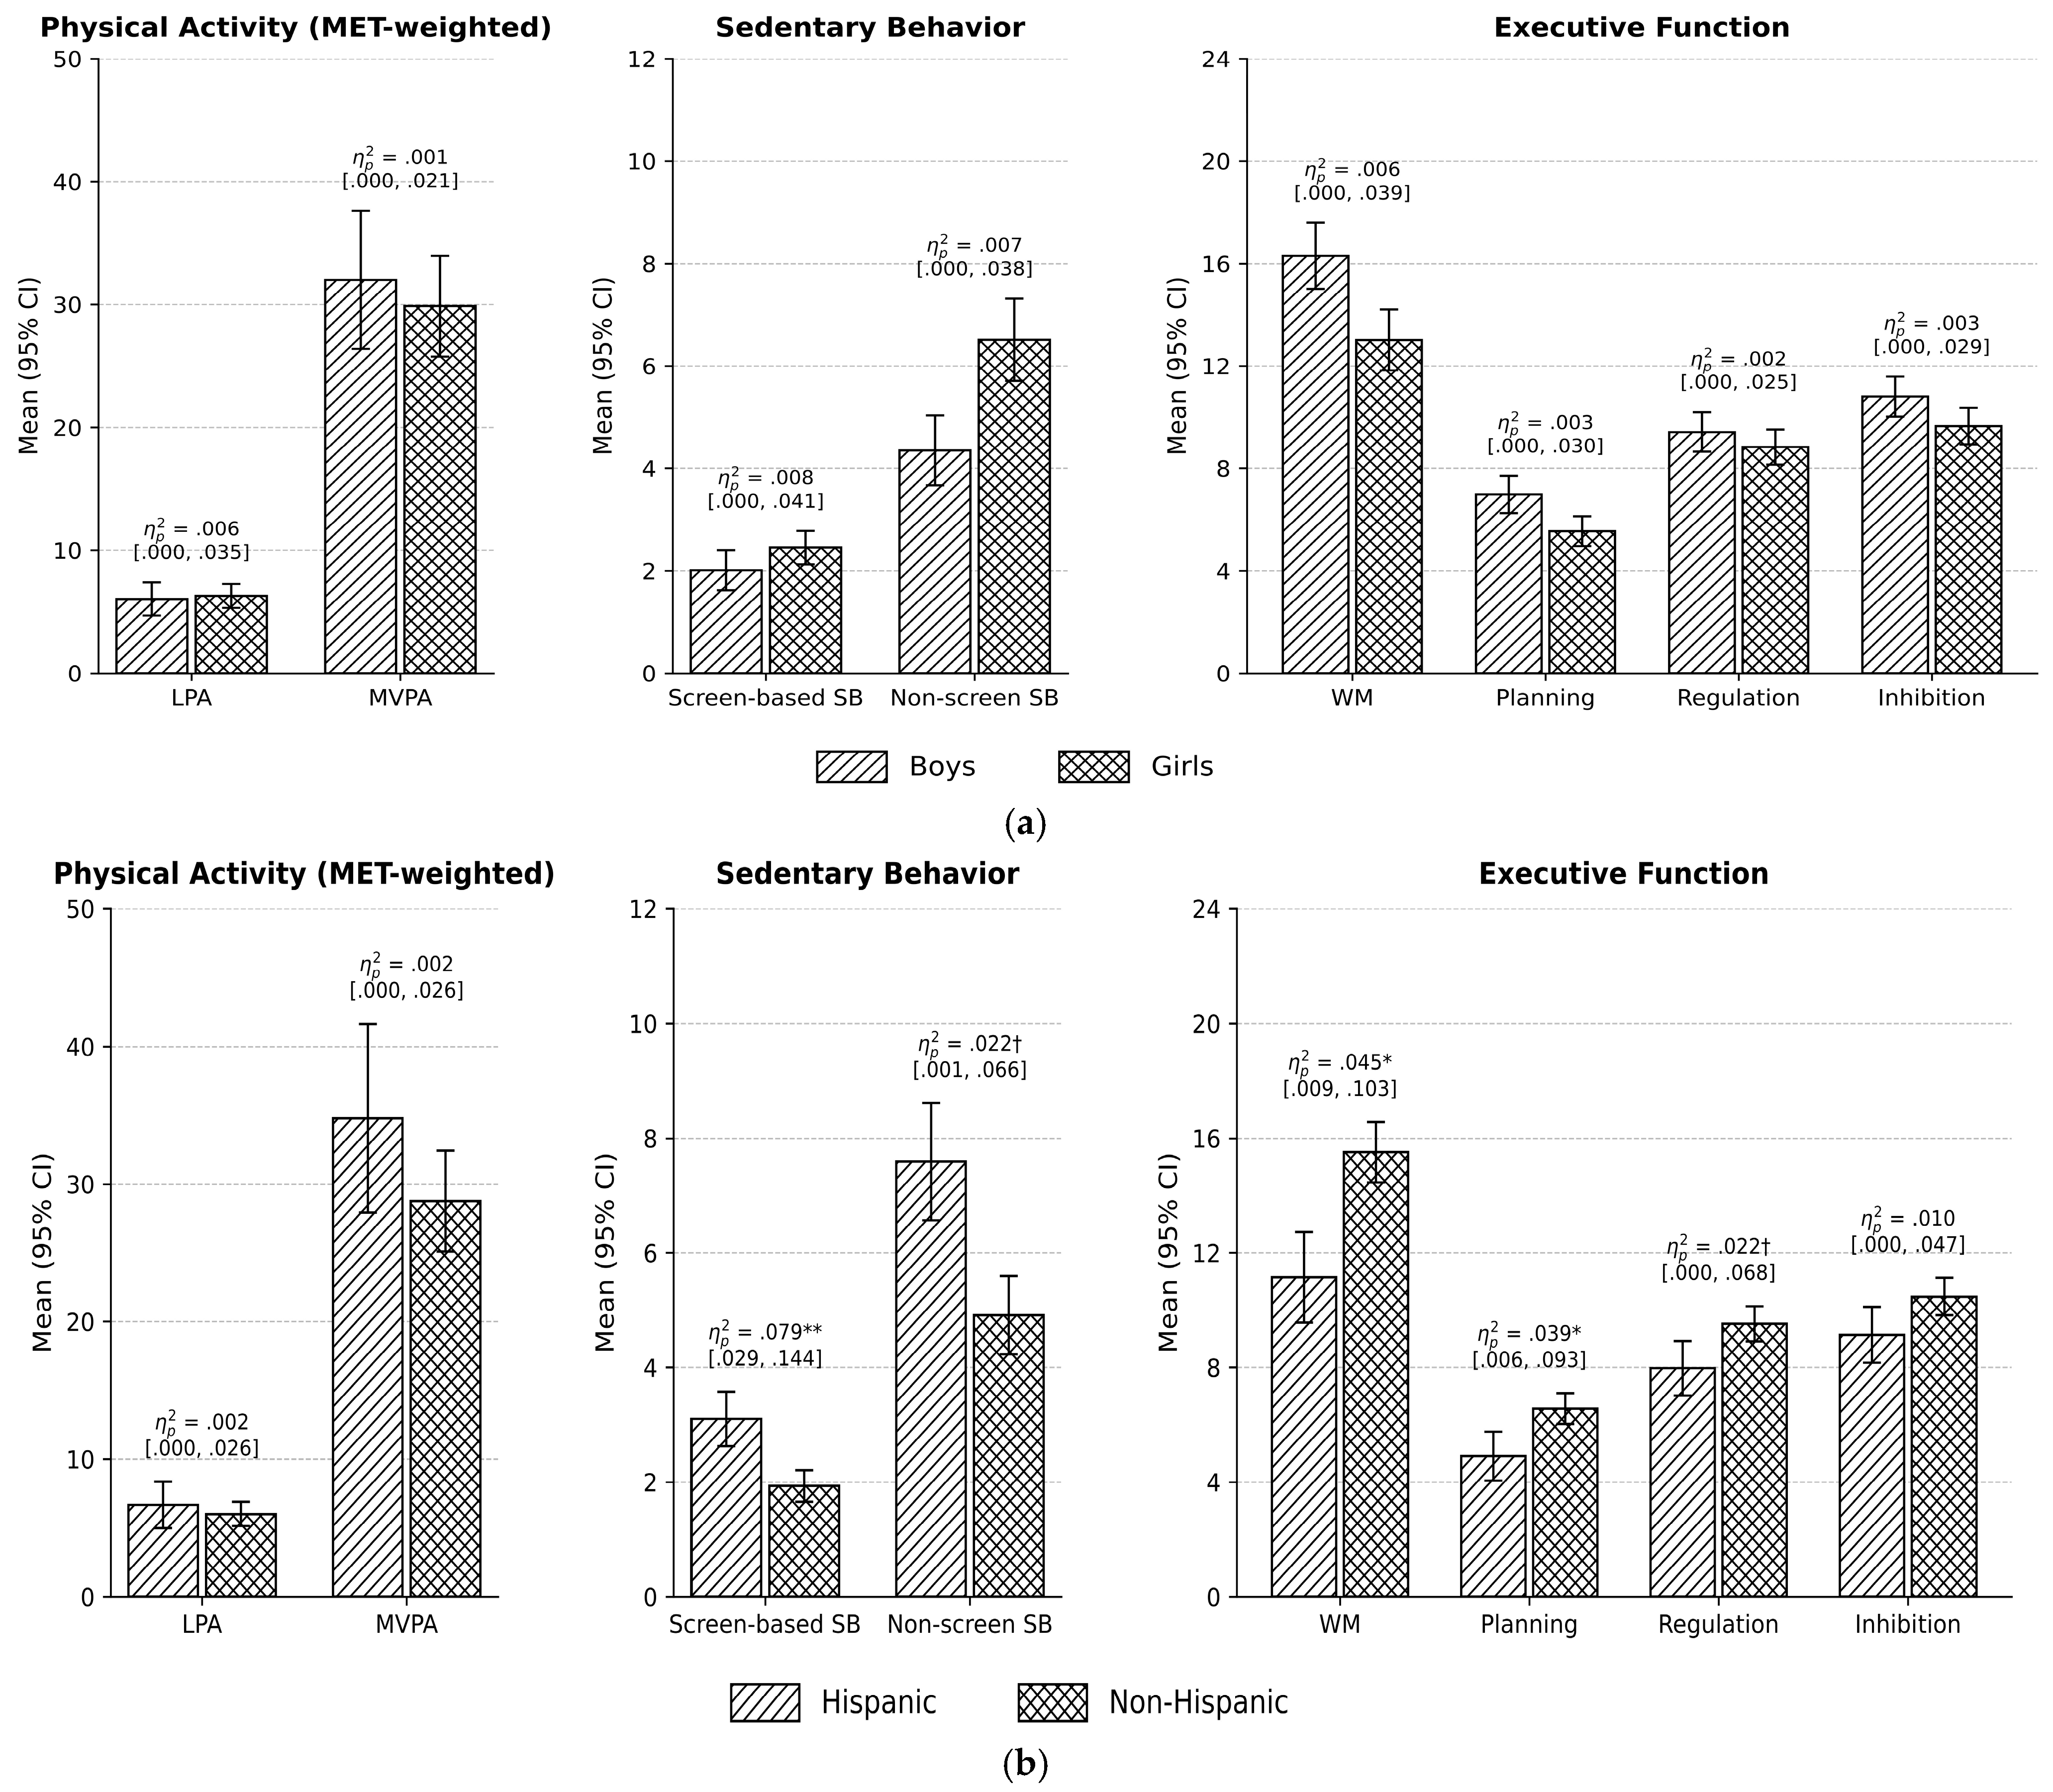
Two 2 (sex) × 2 (ethnicity) MANCOVAs were further conducted to examine the effects of sex and ethnicity on PA and SB (Model 1) and on EF (Model 2), controlling for age and BMI (Table 6). The first MANCOVA model indicated a significant multivariate effect of sex [Wilks’ Λ = 0.949, F (4, 197) = 2.66, p = 0.034, ηp2 = 0.051]. However, univariate tests showed no significant sex differences in LPA F (1, 200) = 1.11, p = 0.293, ηp2 = 0.006], MVPA F (1, 200) = 0.25, p = 0.618, ηp2 = 0.001], screen-based SB F (1, 200) = 1.67, p = 0.198, ηp2 = 0.008], or non-screen-based SB [F (1, 200) = 1.39, p = 0.240, ηp2 = 0.007], indicating that the multivariate effect reflected a combination of small differences rather than a difference in any single outcome. The second MANCOVA model revealed no significant multivariate effect of sex on EF [Wilks’ Λ = 0.972, F (4, 181) = 1.31, p = 0.267, ηp2 = 0.028], and none of the univariate tests was significant (all p ≥ 0.277; ηp2 ≤ 0.006). The sex × ethnicity interaction was not significant in either model (p = 0.137 and 0.642).
Table 6.
Multivariate Analysis on Sex and Ethnicity.
As shown in Table 6, girls tended to report slightly more LPA (Mgirls = 6.29 ± 5.77 vs. Mboys = 6.04 ± 5.82; p = 0.293, d = 0.04), screen-based SB (Mgirls = 2.45 ± 1.90 vs. Mboys = 2.01 ± 1.67; p = 0.198, d = 0.24), and non-screen-based SB (Mgirls = 6.51 ± 4.69 vs. Mboys = 4.35 ± 2.93; p = 0.240, d = 0.52), whereas boys reported slightly more MVPA than girls (Mboys = 32.01 ± 24.08 vs. Mgirls = 29.86 ± 23.89; p = 0.618, d = 0.09). For EF, boys showed a tendency toward higher EF scores, indicating more parent-reported difficulties, in working memory (Mboys = 16.30 ± 5.24 vs. Mgirls = 13.01 ± 6.67; p = 0.277, d = 0.53), planning (Mboys = 6.98 ± 2.95 vs. Mgirls = 5.54 ± 3.30; p = 0.446, d = 0.45), regulation (Mboys = 9.42 ± 3.15 vs. Mgirls = 8.83 ± 3.89; p = 0.580, d = 0.16), and inhibition (Mboys = 10.80 ± 3.17 vs. Mgirls = 9.65 ± 4.03; p = 0.471, d = 0.31). These descriptive patterns were not significant after controlling for age and BMI and should be interpreted with caution.
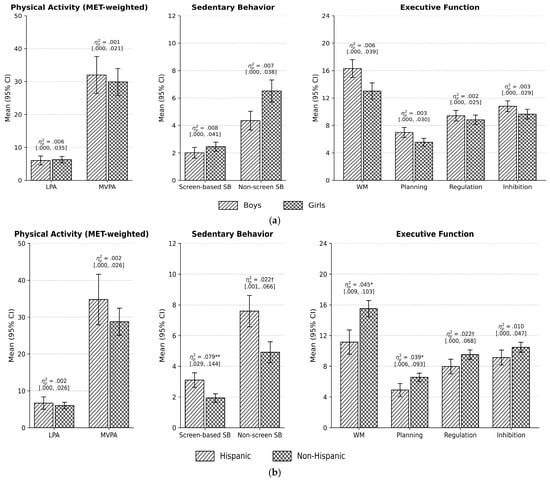
The first MANCOVA model indicated a significant multivariate effect of ethnicity [Wilks’ Lambda = 0.904, F (4, 197) = 5.24, p < 0.001, ηp2 = 0.096] after controlling for youth’s age and BMI (Figure 2b). Univariate tests showed a significant ethnic difference in screen-based SB F (1, 200) = 17.27, p < 0.001, p = 0.001, ηp2 = 0.079) and non-screen-based SB F (1, 200) = 4.53, p = 0.034, ηp2 = 0.022].
Figure 2.
(a) Sex Differences in Physical Activity and Executive Function. (b) Ethnic Differences in Physical Activity and Executive Function. Note: Means (95% CI) of outcomes by sex and ethnicity. Values above bars are partial eta squared (ηρ2) with 95% confidence intervals. LPA = light physical activity; MVPA = moderate-to-vigorous physical activity; SB = sedentary behavior; WM = working memory. † p < 0.10; * p < 0.05; ** p < 0.01.
The second MANCOVA model revealed a significant main effect of ethnicity [Wilks’ Lambda = 0.944, F (4, 181) = 2.70, p = 0.032, ηp2 = 0.056] on EF (i.e., working memory, planning, regulation, inhibition) after controlling for age and BMI (Figure 2b). Univariate tests showed a significant ethnic difference in working memory F (1, 184) = 8.70, p = 0.004, pHolm = 0.014, ηp2 = 0.045), planning F (1, 184) = 7.38, p = 0.007, pHolm = 0.022, ηp2 = 0.039), and regulation F (1, 184) = 4.10, p = 0.044, pHolm = 0.089, ηp2 = 0.022). As shown in Table 6, Hispanic youth reported significantly more screen-based SB than non-Hispanic youth (MHispanic = 3.10 ± 1.90 vs. Mnon-Hispanic = 1.93 ± 1.68; p < 0.001, d = 0.67). Hispanic youth also tended to report more non-screen-based SB (MHispanic = 7.59 ± 4.08 vs. Mnon-Hispanic = 4.91 ± 4.10; p = 0.034, d = 0.65). Hispanic youth had significantly lower EF scores, indicating fewer EF difficulties, in working memory (MHispanic = 11.14 ± 6.06 vs. Mnon-Hispanic = 15.51 ± 6.09; p = 0.004, d = 0.72), planning (MHispanic = 4.90 ± 3.29 vs. Mnon-Hispanic = 6.56 ± 3.11; p = 0.007, d = 0.52), and regulation (MHispanic = 7.97 ± 3.65 vs. Mnon-Hispanic = 9.52 ± 3.57; p = 0.044, d = 0.43).
4. Discussion
The purpose of this study was to examine how multiple ecological environmental factors, including neighborhood safety and crime, community walkability, home media environment, socioeconomic environment, and geographic environment, were associated with physical activity (PA), sedentary behavior (SB), and executive function (EF) among youth; and to test whether PA served as a mediating mechanism linking ecological environment to EF. Guided by the Social Ecological Model [11,12], the findings suggest that cognitive functioning among youth is not determined by individual-level characteristics alone, but is systematically embedded within broader home, neighborhood, socioeconomic, and geographic contexts. Across a comprehensive data analysis, ecological environmental factors demonstrated meaningful associations with PA, SB, and EF, with particularly consistent evidence for neighborhood safety/crime as a critical correlate of EF outcomes.
The pattern of associations among ecological environmental factors and PA and SB support that health behavior may be shaped simultaneously by contextual forces operating across multiple ecological levels [13]. The findings indicate that daily movement profiles among youth vary systematically across home and neighborhood contexts, and that the home media environment and perceived conditions in the surrounding community were both meaningful correlates of PA. Prior research has documented that the density of screen-based equipment in the home is positively associated with adolescent screen time and inversely associated with accelerometer-measured PA [60,61]. In contrast, youth with more types of media devices in their bedroom reported more MVPA in this study, and the home media environment was not associated with SB. Bedroom media availability may partly reflect household resources that also support participation in organized sport and recreation, and the measure captured device availability rather than use; this unexpected association should be replicated with objective measures of media use and PA.
Youth who perceive their neighborhoods as unsafe are less likely to walk, cycle, or engage in unstructured outdoor recreation, a behavioral suppression that has downstream consequences for cumulative daily PA. Geographic environment, captured here through residential location indicators, further contextualized these socioeconomic effects, consistent with the well-established concentration of resource constraints and activity-limiting conditions in specific residential areas [20]. These findings underscore that SB among youth is not simply a product of individual choice or motivation but is structured by the material and infrastructural conditions of their residential environments.
Neighborhood safety and crime and community walkability demonstrated the most consistent associations with EF in this study. These findings extend a growing literature documenting the direct effects of neighborhood conditions and built environment with adolescent cognitive development. Using data from the Adolescent Brain Cognitive Development (ABCD) Study, Lindsley et al. [22] found that perceived neighborhood safety over and above objective crime rates were associated with better working memory and reading comprehension in adolescents. Walkable community design promotes active transportation, outdoor play, and spontaneous PA, all of which contribute to prefrontal activation and neuroplastic adaptation [7]. Caetano et al. [18], using GIS-derived walkability indices and kernel density estimation, found that adolescents in higher-walkability neighborhoods were significantly more likely to meet PA guidelines, reinforcing the behavioral pathway that may partially link walkability to EF. From a developmental perspective, the consistent ecological associations with EF may carry clinical implications. Environmental stressors such as unsafe neighborhoods, limited walkable infrastructure, and socioeconomic resource constraints, may converge to restrict independent mobility, increase allostatic load, reduce opportunities for cognitively enriching activity, and thereby impair the regulatory processes that EF subsumes. Future research should test whether considering neighborhood safety and walkability as contextual factors, alongside individual behavioral counseling, improves the assessment of cognitive and behavioral concerns in pediatric and adolescent care.
The social-ecological pathway from the ecological environmental factors to EF by testing the mediation role of PA in this relationship is the unique contribution of this study. The structural model showed a strong direct association between the latent ecological environmental factor and EF, although the indirect effect of ecological environment on EF through PA was small in magnitude, and the mediation hypothesis was not supported in this sample. The non-significant indirect effect does not support PA as the pathway linking the environment to EF in this sample. Other pathways, such as stress, sleep, and cognitive stimulation, have been proposed in prior work [22,23,62], but they were not tested in this study. PA research conducted in naturalistic environmental contexts has demonstrated that the cognitive benefits of PA are moderated by environmental exposures including green space access, air quality, and sensory conditions, such that the same PA dose may produce different EF outcomes depending on the environmental context in which it occurs [63]. These considerations collectively suggest that PA, while an important health-promoting behavior, may not be the dominant mediating mechanism linking ecological environment to EF in cross-sectional community samples. Future studies should test more refined models incorporating objective PA measures, 24-h movement compositions, fitness indices, sleep quality, and stress-related biomarkers to decompose the relative contribution of behavioral versus psychosocial versus neurobiological pathways. Because walkability and neighborhood safety/crime loaded strongly on the environmental factor whereas socioeconomic, geographic, and home media environments loaded weakly, the latent factor primarily reflects parents’ perceptions of neighborhood safety and walkability. The sensitivity analysis with separate environmental domains supported that the association with EF was carried mainly by neighborhood safety/crime and walkability. Conclusions about a broad “ecological environment” should therefore be interpreted with caution, and future studies with larger and more geographically diverse samples should test whether these domains are better modeled separately or as a formative composite.
The MANCOVA analyses revealed significant ethnic differences in screen-based SB, non-screen-based SB and multiple EF components after controlling for age and BMI. Hispanic youth demonstrated higher overall SB and lower working memory, planning, and regulation scores relative to non-Hispanic peers, while no significant sex differences were observed in this study. These findings are consistent with prior evidence of ethnic disparities in both screen time exposure and EF performance during childhood and early adolescence. Zhang and colleagues [64] documented longitudinal ethnic disparities in EF and physical activity between Hispanic and non-Hispanic children from kindergarten through third grade, with Hispanic children demonstrating lower psychosocial and physical functioning trajectories over time. Nagata et al. [65], analyzing data from the ABCD Study, found that Black and Latinx/Hispanic adolescents were more likely to experience problematic screen use, attributing these disparities in part to neighborhood safety perceptions, reduced access to outdoor recreational spaces, and differential parental supervision time related to occupational demands.
The ethnic patterns observed in the present study should not be interpreted as reflecting group-level individual differences in ability or motivation. Differential ecological exposure is one possible explanation. Hispanic families in this sample reported lower household income than non-Hispanic families, but they did not report greater neighborhood safety concerns, and this study did not test whether environmental factors accounted for the ethnic differences. Perceptions of neighborhood safety have been specifically associated with increased screen time and decreased PA among minority youth [65] suggesting that screen time disparities may reflect behavioral adaptation to constrained neighborhood conditions rather than individual health behavior failure; this hypothesis requires direct testing. Socioeconomic status and race/ethnicity in the United States function as proxies for differential exposure to ecological risk and resource conditions, and healthcare and public health interventions must address these structural determinants rather than targeting individual behavior in isolation.
If confirmed in longitudinal research, these findings would have implications for pediatric and adolescent healthcare practice. Healthcare providers conducting well-child visits and adolescent health assessments could inquire about residential neighborhood conditions, including perceived safety, access to walkable streets and parks, availability of recreational programs, and household screen media environments, in addition to individual PA and dietary behaviors. Ecological screening of this kind aligns with the American Academy of Pediatrics’ advocacy for social determinants of health screening in clinical settings and reflects the growing recognition that neighborhood and community-level factors are as clinically relevant as individual behavioral factors in shaping adolescent cognitive and physical health outcomes [12].
At the community and policy level, the findings reinforce the argument that youth health promotion is an intersectoral responsibility requiring coordination among clinical healthcare, public health, education, transportation planning, and civil engineering. Community walkability is determined by street connectivity, pedestrian infrastructure design, land use mix, and traffic management; and it is not a healthcare variable in the traditional sense. Investment in pedestrian infrastructure, traffic-calming design, mixed-use zoning, and safe active transportation routes may represent a population-level lever for improving youth physical activity and brain health. Restricting household screen time through family-level education alone is unlikely to be sufficient when outdoor play and active transportation are limited by neighborhood safety concerns and infrastructural barriers. Future interventions could combine family media literacy and rule-setting with community-level provision of safe, accessible, and appealing alternatives for after-school activity, including supervised recreation programs, community lighting improvements, and school-community recreation partnerships.
These findings should be interpreted as associations rather than causal effects. Because the data were cross-sectional, the results cannot establish whether environmental factors preceded differences in PA or EF. The practical implications described should likewise be viewed as hypotheses for future longitudinal and intervention research rather than as evidence-based recommendations. Several limitations constrain the interpretation and generalizability of the findings. All environmental exposures and child outcomes were reported by a single parent, and the environmental items were adapted from existing instruments without validation in this population. The home media environment measure captured device availability in the bedroom but not media use, and the neighborhood safety scale combined perceived barriers with perceived crime rather than assessing victimization. The parent version of the NEWS-Y has been evaluated for test–retest reliability among parents of children aged 5–11 years and parents of adolescents aged 12–18 years [39,40]; however, the selected and adapted items used here have not been validated in this population.
Although the SEM specified a theoretically guided directional pathway from ecological environment through PA to EF, temporal ordering and directionality cannot be confirmed from these data. The null result is therefore inconclusive rather than evidence that PA does not link the environment to EF. Similarly, the ethnic differences in SB and EF may reflect differential ecological exposure, but this study did not test whether environmental factors accounted for these differences, so this explanation remains a hypothesis. Further mediation analyses examining whether environmental factors account for ethnic differences were not pursued because the environmental factor was not unidimensional, measurement invariance across ethnic groups could not be established with the available subgroup sizes, and power to detect indirect effects was limited.
In addition, the home media environment scale showed modest internal consistency. Because the scale is an inventory of distinct bedroom devices rather than a measure of a single underlying construct, modest consistency was expected; however, the resulting measurement error may have attenuated its associations with outcomes. The sample also provided limited power to detect small indirect effects, so the null mediation finding should be interpreted as inconclusive rather than as evidence of no mediation. Future studies should model ecological levels as separate predictors or as formative composites and test these specifications in larger, longitudinal samples. BMI was entered as a continuous covariate rather than as age- and sex-specific BMI percentiles or z-scores, and future studies should use BMI-for-age standards. Ecological environmental factors were similarly assessed through questionnaire-based measures rather than objective GIS-derived indicators of walkability, crime, or residential location, limiting the specificity of environmental characterization. Future studies should incorporate objective, geospatially derived environmental measures alongside device-based 24-h movement behavior monitoring and longitudinal designs to test the mediation hypothesis more rigorously.
5. Conclusions
This study provides evidence that ecological environmental factors are meaningfully associated with youth PA and cognitive health, with neighborhood safety and crime and community walkability demonstrating the most consistent associations with EF outcomes. Socioeconomic environment was the primary predictor of SB, while home media environment and neighborhood safety/crime played an important role for active lifestyle. In the SEM, the environmental factor was directly associated with EF, but the indirect pathway through PA was not supported; whether other behavioral or psychosocial pathways link the environment to EF was not tested and remains a question for longitudinal research. Ethnic differences were observed in screen-based SB and EF, with Hispanic youth reporting more screen-based SB but fewer parent-reported EF difficulties; whether these differences reflect differential ecological exposure is a hypothesis that this study did not test. Taken together, these cross-sectional findings support the application of the Social Ecological Model to youth cognitive health and suggest that future multilevel, equity-focused interventions could address individual health behaviors and the community, neighborhood, and infrastructural conditions that shape them.
Supplementary Materials
The following supporting information can be downloaded at: https://www.mdpi.com/article/10.3390/healthcare14213737/s1, Table S1. Sensitivity Analysis: Structural Equation Model With Environmental Domains as Separate Predictors.
Author Contributions
Conceptualization, X.G., Z.L., H.P. and T.Z.; methodology, X.G., Z.L., C.W., M.G. and T.Z.; software, X.G., C.W., H.P. and T.Z.; validation, X.G., Z.L., C.W. and T.Z.; formal analysis, X.G., C.W., M.G. and T.Z.; investigation, X.G., C.W., M.G. and T.Z.; resources, X.G., Z.L., and T.Z.; data curation, X.G., Z.L., C.W., M.G. and H.P.; writing—original draft preparation, X.G., Z.L., C.W. and T.Z.; writing—review and editing, X.G., Z.L., C.W., M.G., H.P. and T.Z.; visualization, X.G., and T.Z.; supervision, X.G., Z.L. and T.Z.; project administration, X.G., C.W. and M.G.; funding acquisition, X.G. and Z.L. All authors have read and agreed to the published version of the manuscript.
Funding
This project was supported by the Center for Research and Scholarship Pilot Project Grants at the University of Texas at Arlington, and the U.S. Department of Transportation PHMSA (No. 693JK32610019POTA). The views, interpretations, and conclusions presented in this paper are solely those of the authors and do not necessarily reflect those of the sponsors.
Institutional Review Board Statement
The study was conducted in accordance with the Declaration of Helsinki and approved by the Institutional Review Board of The University of Texas at Arlington (protocol code 2019–0489, date of approval: 24 January 2020).
Informed Consent Statement
Informed consent was obtained from all subjects involved in the study.
Data Availability Statement
The data that support the findings of this study are available from the corresponding author upon reasonable request. The data is not publicly available due to privacy and ethical considerations related to the study participants.
Acknowledgments
We thank all the parents and adolescents who participated in this study.
Conflicts of Interest
The authors declare no conflicts of interest.
References
- World Health Organization. Optimizing Brain Health Across the Life Course: WHO Position Paper; World Health Organization: Geneva, Switzerland, 2022; Available online: https://www.who.int/publications/i/item/9789240054561 (accessed on 2 October 2026).
- Chen, Y.; Demnitz, N.; Yamamoto, S.; Yaffe, K.; Lawlor, B.; Leroi, I. Defining brain health: A concept analysis. Int. J. Geriatr. Psychiatry 2022, 37, e5564. [Google Scholar] [CrossRef] [Scilit] [PubMed]
- Diamond, A. Executive functions. Annu. Rev. Psychol. 2013, 64, 135–168. [Google Scholar] [CrossRef] [Scilit] [PubMed]
- Zelazo, P.D.; Müller, U.; Frye, D.; Marcovitch, S.; Argitis, G.; Boseovski, J.; Chiang, J.K.; Hongwanishkul, D.; Schuster, B.V.; Sutherland, A. The development of executive function in early childhood. Monogr. Soc. Res. Child Dev. 2003, 68, vii–137. [Google Scholar] [CrossRef] [Scilit] [PubMed]
- Casey, B.J.; Getz, S.; Galvan, A. The adolescent brain. Dev. Rev. 2008, 28, 62–77. [Google Scholar] [CrossRef] [Scilit] [PubMed]
- Willcutt, E.G.; Doyle, A.E.; Nigg, J.T.; Faraone, S.V.; Pennington, B.F. Validity of the executive function theory of attention-deficit/hyperactivity disorder: A meta-analytic review. Biol. Psychiatry 2005, 57, 1336–1346. [Google Scholar] [CrossRef] [Scilit] [PubMed]
- Lubans, D.; Richards, J.; Hillman, C.; Faulkner, G.; Beauchamp, M.; Nilsson, M.; Kelly, P.; Smith, J.; Raine, L.; Biddle, S. Physical activity for cognitive and mental health in youth: A systematic review of mechanisms. Pediatrics 2016, 138, e20161642. [Google Scholar] [CrossRef] [Scilit] [PubMed]
- Donnelly, J.E.; Hillman, C.H.; Castelli, D.; Etnier, J.L.; Lee, S.; Tomporowski, P.; Lambourne, K.; Szabo-Reed, A.N. Physical activity, fitness, cognitive function, and academic achievement in children: A systematic review. Med. Sci. Sports Exerc. 2016, 48, 1197–1222. [Google Scholar] [CrossRef] [Scilit] [PubMed]
- Xue, Y.; Yang, Y.; Huang, T. Effects of chronic exercise interventions on executive function among children and adolescents: A systematic review with meta-analysis. Br. J. Sports Med. 2019, 53, 1397–1404. [Google Scholar] [CrossRef] [Scilit] [PubMed]
- Li, S.; Guo, J.; Zheng, K.; Shi, M.; Huang, T. Is Sedentary Behavior Associated With Executive Function in Children and Adolescents? A Systematic Review. Front. Public Health 2022, 10, 832845. [Google Scholar] [CrossRef] [Scilit] [PubMed]
- McLeroy, K.R.; Bibeau, D.; Steckler, A.; Glanz, K. An ecological perspective on health promotion programs. Health Educ. Q. 1988, 15, 351–377. [Google Scholar] [CrossRef] [Scilit] [PubMed]
- McNeill, L.H.; Kreuter, M.W.; Subramanian, S.V. Social environment and physical activity: A review of concepts and evidence. Soc. Sci. Med. 2006, 63, 1011–1022. [Google Scholar] [CrossRef] [Scilit] [PubMed]
- Sallis, J.F.; Owen, N.; Fisher, E.B. Ecological Models of Health Behavior. In Health Behavior and Health Education: Theory, Research, and Practice, 4th ed.; Glanz, K., Rimer, B.K., Viswanath, K., Eds.; Jossey-Bass: San Francisco, CA, USA, 2008; pp. 465–486. [Google Scholar]
- Hu, D.; Zhou, S.; Crowley-McHattan, Z.J.; Liu, Z. Factors that influence participation in physical activity in school-aged children and adolescents: A systematic review from the social ecological model perspective. Int. J. Environ. Res. Public Health 2021, 18, 3147. [Google Scholar] [CrossRef] [Scilit] [PubMed]
- Zhao, C.; Yuan, J.; Huang, W.W. Multilevel determinants of physical activity in children and adolescents: A meta-analysis guided by social ecological model. BMC Sports Sci. Med. Rehabil. 2025, 17, 202. [Google Scholar] [CrossRef] [Scilit] [PubMed]
- Smith, M.; Hosking, J.; Woodward, A.; Witten, K.; MacMillan, A.; Field, A.; Baas, P.; Mackie, H. Systematic literature review of built environment effects on physical activity and active transport—An update and new findings on health equity. Int. J. Behav. Nutr. Phys. Act. 2017, 14, 158. [Google Scholar] [CrossRef] [Scilit] [PubMed]
- Sallis, J.F.; Conway, T.L.; Cain, K.L.; Carlson, J.A.; Frank, L.D.; Kerr, J.; Glanz, K.; Chapman, J.E.; Saelens, B.E. Neighborhood built environment and socioeconomic status in relation to physical activity, sedentary behavior, and weight status of adolescents. Prev. Med. 2018, 110, 47–54. [Google Scholar] [CrossRef] [Scilit] [PubMed]
- Caetano, I.T.; Fermino, R.C.; Falcão, R.D.O.; Amorim, P.R.D.S. Built environment and physical activity in adolescents: Use of the kernel density estimation and the walkability index. PLoS ONE 2024, 19, e0299628. [Google Scholar] [CrossRef] [Scilit] [PubMed]
- Loh, V.H.Y.; Veitch, J.; Salmon, J.; Cerin, E.; Thornton, L.; Mavoa, S.; Villanueva, K.; Timperio, A. Built environment and physical activity among adolescents: The moderating effects of neighborhood safety and social support. Int. J. Behav. Nutr. Phys. Act. 2019, 16, 132. [Google Scholar] [CrossRef] [Scilit] [PubMed]
- Sallis, J.F.; Cerin, E.; Conway, T.L.; Adams, M.A.; Frank, L.D.; Pratt, M.; Salvo, D.; Schipperijn, J.; Smith, G.; Cain, K.L.; et al. Physical activity in relation to urban environments in 14 cities worldwide: A cross-sectional study. Lancet 2016, 387, 2207–2217. [Google Scholar] [CrossRef] [Scilit] [PubMed]
- Constable Fernandez, C.; Patalay, P.; Maddock, J.; Vaughan, L. P03-04 Perceived and objective indicators of neighbourhood safety and physical activity in early adolescence: A national cohort study. Eur. J. Public Health 2022, 32, ckac095.040. [Google Scholar] [CrossRef] [Scilit]
- Lindsley, P.M.; Elsayed, N.M.; Barch, D.M. Contributions of neighborhood violent crime and perceived neighborhood safety to cognition and mental health in the Adolescent Brain Cognitive Development Study. Dev. Cogn. Neurosci. 2026, 77, 101660. [Google Scholar] [CrossRef] [Scilit] [PubMed]
- Blair, C.; Raver, C.C. Child development in the context of adversity: Experiential canalization of brain and behavior. Am. Psychol. 2012, 67, 309–318. [Google Scholar] [CrossRef] [Scilit] [PubMed]
- Stalsberg, R.; Pedersen, A.V. Effects of socioeconomic status on the physical activity in adolescents: A systematic review of the evidence. Scand. J. Med. Sci. Sports 2010, 20, 368–383. [Google Scholar] [CrossRef] [Scilit] [PubMed]
- Mesquita, E.D.L.; Tebar, W.R.; Correia, D.C.Q.; Christofaro, D.G.D.; Ferrari, G.; Fisberg, M.; Silva, D.R. Physical activity and sedentary behaviour of adolescents and their parents: A specific analysis by sex and socioeconomic status. Arch. Public Health 2023, 81, 189. [Google Scholar] [CrossRef] [Scilit] [PubMed]
- Merz, E.C.; Myers, B.; Hansen, M.; Simon, K.R.; Strack, J.; Noble, K.G. Socioeconomic Disparities in Hypothalamic-Pituitary-Adrenal Axis Regulation and Prefrontal Cortical Structure. Biol. Psychiatry Glob. Open Sci. 2024, 4, 83–96. [Google Scholar] [CrossRef] [Scilit] [PubMed]
- Dennis, E.; Manza, P.; Volkow, N.D. Socioeconomic Status, BMI, and Brain Development in Children. Transl. Psychiatry 2022, 12, 33. [Google Scholar] [CrossRef] [Scilit] [PubMed]
- Williams, D.R.; Collins, C. Racial Residential Segregation: A Fundamental Cause of Racial Disparities in Health. Public Health Rep. 2001, 116, 404–416. [Google Scholar] [CrossRef] [Scilit] [PubMed]
- Bailey, Z.D.; Krieger, N.; Agénor, M.; Graves, J.; Linos, N.; Bassett, M.T. Structural Racism and Health Inequities in the USA: Evidence and Interventions. Lancet 2017, 389, 1453–1463. [Google Scholar] [CrossRef] [Scilit] [PubMed]
- Gebel, K.; Bauman, A.; Owen, N. Correlates of Non-Concordance between Perceived and Objective Measures of Walkability. Ann. Behav. Med. 2009, 37, 228–238. [Google Scholar] [CrossRef] [Scilit] [PubMed]
- McGinn, A.P.; Evenson, K.R.; Herring, A.H.; Huston, S.L.; Rodriguez, D.A. Exploring Associations between Physical Activity and Perceived and Objective Measures of the Built Environment. J. Urban Health 2007, 84, 162–184. [Google Scholar] [CrossRef] [Scilit] [PubMed]
- Sharkey, P. The Acute Effect of Local Homicides on Children’s Cognitive Performance. Proc. Natl. Acad. Sci. USA 2010, 107, 11733–11738. [Google Scholar] [CrossRef] [Scilit] [PubMed]
- Hackman, D.A.; Farah, M.J.; Meaney, M.J. Socioeconomic Status and the Brain: Mechanistic Insights from Human and Animal Research. Nat. Rev. Neurosci. 2010, 11, 651–659. [Google Scholar] [CrossRef] [Scilit] [PubMed]
- Grubesic, T.H.; Matisziw, T.C. On the Use of ZIP Codes and ZIP Code Tabulation Areas (ZCTAs) for the Spatial Analysis of Epidemiological Data. Int. J. Health Geogr. 2006, 5, 58. [Google Scholar] [CrossRef] [Scilit] [PubMed]
- Hart, L.G.; Larson, E.H.; Lishner, D.M. Rural Definitions for Health Policy and Research. Am. J. Public Health 2005, 95, 1149–1155. [Google Scholar] [CrossRef] [Scilit] [PubMed]
- Saelens, B.E.; Sallis, J.F.; Frank, L.D.; Couch, S.C.; Zhou, C.; Colburn, T.; Cain, K.L.; Chapman, J.; Glanz, K. Obesogenic Neighborhood Environments, Child and Parent Obesity: The Neighborhood Impact on Kids Study. Am. J. Prev. Med. 2012, 42, e57–e64. [Google Scholar] [CrossRef] [Scilit] [PubMed]
- Koo, T.K.; Li, M.Y. A Guideline of Selecting and Reporting Intraclass Correlation Coefficients for Reliability Research. J. Chiropr. Med. 2016, 15, 155–163, Erratum in J. Chiropr. Med. 2017, 16, 346. https://doi.org/10.1016/j.jcm.2017.10.001. [Google Scholar] [CrossRef] [Scilit] [PubMed]
- McGraw, K.O.; Wong, S.P. Forming Inferences about Some Intraclass Correlation Coefficients. Psychol. Methods 1996, 1, 30–46. [Google Scholar] [CrossRef]
- Rosenberg, D.; Ding, D.; Sallis, J.F.; Kerr, J.; Norman, G.J.; Durant, N.; Harris, S.K.; Saelens, B.E. Neighborhood Environment Walkability Scale for Youth (NEWS-Y): Reliability and Relationship with Physical Activity. Prev. Med. 2009, 49, 213–218. [Google Scholar] [CrossRef] [Scilit] [PubMed]
- Gu, X.; Keller, J.; Zhang, T.; Dempsey, D.R.; Roberts, H.; Jeans, K.A.; Stevens, W.; Borchard, J.; VanPelt, J.; Tulchin-Francis, K. Disparity in Built Environment and Its Impacts on Youths’ Physical Activity Behaviors during COVID-19 Pandemic Restrictions. J. Racial Ethn. Health Disparities 2023, 10, 1549–1559. [Google Scholar] [CrossRef] [Scilit] [PubMed]
- Godin, G. The Godin-Shephard Leisure-Time Physical Activity Questionnaire. Health Fit. J. Can. 2011, 4, 18–22. [Google Scholar] [CrossRef]
- Sallis, J.F.; Buono, M.J.; Roby, J.J.; Micale, F.G.; Nelson, J.A. Seven-Day Recall and Other Physical Activity Self-Reports in Children and Adolescents. Med. Sci. Sports Exerc. 1993, 25, 99–108. [Google Scholar] [CrossRef] [Scilit] [PubMed]
- Rosenberg, D.E.; Norman, G.J.; Wagner, N.; Patrick, K.; Calfas, K.J.; Sallis, J.F. Reliability and validity of the Sedentary Behavior Questionnaire (SBQ) for adults. J. Phys. Act. Health 2010, 7, 697–705. [Google Scholar] [CrossRef] [Scilit] [PubMed]
- Thorell, L.B.; Nyberg, L. The Childhood Executive Functioning Inventory (CHEXI): A New Rating Instrument for Parents and Teachers. Dev. Neuropsychol. 2008, 33, 536–552. [Google Scholar] [CrossRef] [Scilit] [PubMed]
- Isquith, P.K.; Roth, R.M.; Gioia, G. Contribution of Rating Scales to the Assessment of Executive Functions. Appl. Neuropsychol. Child 2013, 2, 125–132. [Google Scholar] [CrossRef] [Scilit] [PubMed]
- Toplak, M.E.; West, R.F.; Stanovich, K.E. Practitioner Review: Do Performance-Based Measures and Ratings of Executive Function Assess the Same Construct? J. Child Psychol. Psychiatry 2013, 54, 131–143. [Google Scholar] [CrossRef] [Scilit] [PubMed]
- Steiger, J.H. Beyond the F Test: Effect Size Confidence Intervals and Tests of Close Fit in the Analysis of Variance and Contrast Analysis. Psychol. Methods 2004, 9, 164–182. [Google Scholar] [CrossRef] [Scilit] [PubMed]
- Cohen, J. Statistical Power Analysis for the Behavioral Sciences, 2nd ed.; Lawrence Erlbaum Associates: Hillsdale, NJ, USA, 1988. [Google Scholar]
- Richardson, J.T.E. Eta Squared and Partial Eta Squared as Measures of Effect Size in Educational Research. Educ. Res. Rev. 2011, 6, 135–147. [Google Scholar] [CrossRef] [Scilit]
- Holm, S. A Simple Sequentially Rejective Multiple Test Procedure. Scand. J. Stat. 1979, 6, 65–70. [Google Scholar]
- Bender, R.; Lange, S. Adjusting for Multiple Testing—When and How? J. Clin. Epidemiol. 2001, 54, 343–349. [Google Scholar] [CrossRef] [Scilit] [PubMed]
- Hu, L.-T.; Bentler, P.M. Cutoff Criteria for Fit Indexes in Covariance Structure Analysis: Conventional Criteria versus New Alternatives. Struct. Equ. Model. 1999, 6, 1–55. [Google Scholar] [CrossRef] [Scilit]
- Marsh, H.W.; Hau, K.-T.; Wen, Z. In Search of Golden Rules: Comment on Hypothesis-Testing Approaches to Setting Cutoff Values for Fit Indexes and Dangers in Overgeneralizing Hu and Bentler’s (1999) Findings. Struct. Equ. Model. 2004, 11, 320–341. [Google Scholar] [CrossRef] [Scilit] [PubMed]
- Faul, F.; Erdfelder, E.; Buchner, A.; Lang, A.-G. Statistical Power Analyses Using G*Power 3.1: Tests for Correlation and Regression Analyses. Behav. Res. Methods 2009, 41, 1149–1160. [Google Scholar] [CrossRef] [Scilit] [PubMed]
- Jackson, D.L. Revisiting Sample Size and Number of Parameter Estimates: Some Support for the N:q Hypothesis. Struct. Equ. Model. 2003, 10, 128–141. [Google Scholar] [CrossRef] [Scilit] [PubMed]
- Wolf, E.J.; Harrington, K.M.; Clark, S.L.; Miller, M.W. Sample Size Requirements for Structural Equation Models: An Evaluation of Power, Bias, and Solution Propriety. Educ. Psychol. Meas. 2013, 73, 913–934. [Google Scholar] [CrossRef] [Scilit] [PubMed]
- MacCallum, R.C.; Browne, M.W.; Sugawara, H.M. Power Analysis and Determination of Sample Size for Covariance Structure Modeling. Psychol. Methods 1996, 1, 130–149. [Google Scholar] [CrossRef]
- Enders, C.K.; Bandalos, D.L. The Relative Performance of Full Information Maximum Likelihood Estimation for Missing Data in Structural Equation Models. Struct. Equ. Model. 2001, 8, 430–457. [Google Scholar] [CrossRef] [Scilit] [PubMed]
- Little, R.J.A. A Test of Missing Completely at Random for Multivariate Data with Missing Values. J. Am. Stat. Assoc. 1988, 83, 1198–1202. [Google Scholar] [CrossRef]
- Sirard, J.R.; Laska, M.N.; Patnode, C.D.; Farbakhsh, K.; Lytle, L.A. Adolescent physical activity and screen time: Associations with the physical home environment. Int. J. Behav. Nutr. Phys. Act. 2010, 7, 82. [Google Scholar] [CrossRef] [Scilit] [PubMed]
- Haug, E. Adolescents’ screen-based media use and the relationship with moderate-to-vigorous physical activity, sports club participation and active commuting. Scand. J. Public Health 2025, 53, 42–51. [Google Scholar] [CrossRef] [Scilit] [PubMed]
- Cai, T.; Yang, B.; Zhou, Z.; Ip, K.I.; Adam, E.K.; Haase, C.M.; Qu, Y. Longitudinal associations between neighborhood safety and adolescent adjustment: The moderating role of affective neural sensitivity. Dev. Cogn. Neurosci. 2024, 67, 101380. [Google Scholar] [CrossRef] [Scilit] [PubMed]
- Latino, F.; Tafuri, G.; Amato, G.; Romano, G. Physical activity, cognitive function, and learning processes: The role of environmental context. Behav. Sci. 2025, 15, 1630. [Google Scholar] [CrossRef] [Scilit] [PubMed]
- Zhang, X.; Chen, S.; Gu, X. Ethnic disparities in mental health and movement behaviors during childhood: Examining the longitudinal developmental patterns. J. Racial Ethn. Health Disparities 2020, 7, 1249–1257. [Google Scholar] [CrossRef] [Scilit] [PubMed]
- Nagata, J.M.; Singh, G.; Sajjad, O.M.; Ganson, K.T.; Testa, A.; Jackson, D.B.; Assari, S.; Murray, S.B.; Bibbins-Domingo, K.; Baker, F.C. Social epidemiology of early adolescent problematic screen use in the United States. Pediatr. Res. 2022, 92, 1443–1449. [Google Scholar] [CrossRef] [Scilit] [PubMed]

Disclaimer/Publisher’s Note: The statements, opinions and data contained in all publications are solely those of the individual author(s) and contributor(s) and not of MDPI and/or the editor(s). MDPI and/or the editor(s) disclaim responsibility for any injury to people or property resulting from any ideas, methods, instructions or products referred to in the content. |
© 2026 by the authors. Licensee MDPI, Basel, Switzerland. This article is an open access article distributed under the terms and conditions of the Creative Commons Attribution (CC BY) license.