


Abstract
Background: The Minnesota Satisfaction Questionnaire is a widely recognized and used self-reporting instrument designed to measure a person’s satisfaction with various aspects of their job, as well as to provide comparative values regarding general satisfaction and its components. Objective: This study first aimed to test and validate the psychometric properties of the Minnesota Satisfaction Questionnaire–Short Form (MSQ-SF). Its second objective was to assess the job satisfaction levels of employees working within the organization and the factors influencing job satisfaction. Methods: This descriptive cross-sectional study analyzed the responses of 435 hospital staff members using the Romanian version of the MSQ-20 scale. Results: Exploratory Factor Analysis identified a three-factor structure: Task Enrichment, Autonomy Satisfaction, and Supervisory Relationships. The three-factor model with eight MSQ items discarded provided an excellent statistical fit. The MSQ-SF with a 20-item questionnaire has excellent Internal Consistency, with a Cronbach alpha of 0.935, 95% CI (0.926–0.944). Conclusions: The Romanian version of the MSQ-20 has excellent construct validity and consistency, and it provides reliable and comparable data on the health of the workforce.
1. Introduction
People’s health needs and preferences are at the core of a health system evaluation framework, and both are important objectives of health systems [1]. The relationship between the professional satisfaction of workers within the healthcare field significantly influences the quality of the services provided. Relevant studies in the field support the idea that satisfied healthcare professionals are more likely to provide higher-quality, safer, and more compassionate healthcare to patients [2]. Thus, evaluating the level of work satisfaction in different healthcare settings might provide relevant information for the management of and support for relevant measures for improving the provided services.
Varied instruments have been described, ranging from standardized questionnaires to qualitative methods. Common instruments used for measuring job satisfaction include the “Job Satisfaction Questionnaire (JSS),” which assesses satisfaction across nine dimensions, such as pay, promotion, supervision, and nature of work [3]; the “Minnesota Job Satisfaction Questionnaire (MSQ),” which is available in both long and short forms and examines intrinsic and extrinsic aspects of a job [4]; the “Job Descriptive Index (JDI),” which assesses employee attitudes towards various aspects of their work, including the work itself, pay, promotion opportunities, supervision, and coworkers [5]; and the “Employee Net Promoter Score (eNPS)”, a metric used to gauge employee loyalty and engagement by measuring how likely they are to recommend their company as a place to work [6].
One widely used tool for assessing job satisfaction with broad international recognition is the MSQ [7,8,9,10,11]. The instrument is a self-report questionnaire that measures a person’s satisfaction with different aspects of their job, developed by Weiss, Dawis, England, and Lofquist in the 1960s [4], while the core constructs have been constantly adapted, it’s measures remain relevant. It exists in both long-form (100 items, assessing 20 facets of satisfaction) and short-form (20 items, providing scores for intrinsic, extrinsic, and general satisfaction) versions. The short-form version (MSQ-SF) is structured to reflect two primary satisfaction dimensions: intrinsic satisfaction, which refers to the satisfaction derived from the work itself, such as a feeling of achievement, using one’s abilities, and having variety, and extrinsic satisfaction, which relates to external job rewards and context, such as compensation, working conditions, and supervision [4]. The MSQ is based on the work/job adaptation theory pioneered by Dawis and Lofquist [12], which posits that job satisfaction stems from the congruence between an individual’s needs and the reinforcing factors provided by their work environment, making it a valuable tool for vocational counseling, organizational research, and evaluating the effectiveness of workplace interventions. The MSQ is useful when rating job satisfaction with various aspects of a job, such as compensation, supervision, coworkers, and opportunities for advancement or achievement, on a five-response Likert-type scale.
Existing data suggest that the MSQ-SF is a valid tool for evaluating the work satisfaction of employees within healthcare units [9,10,11,13]. Simultaneously, as a self-administered psychometric tool, the instrument should be translated and adapted to the local context in which it is applied. The MSQ-SF was specifically selected for this study due to its widely recognized international validity, its conciseness and the speed and ease with which respondents can complete it. While other instruments, such as the JSS, are available and free, they often contain a significantly higher number of items, which can negatively impact response rates in busy clinical settings.
Validation studies of the MSQ-SF across different countries and professional groups have frequently challenged the original two-factor (intrinsic/extrinsic) structure, leading to various factor solutions. A summary of factor analytic findings across different validation studies is presented in Table 1. This variation suggests that the original two-factor model may not adequately capture the nuances of job satisfaction across diverse cultural or professional settings. Therefore, the main objective of this study was to translate the MSQ-SF and measure the instrument’s psychometric characteristics. The second objective was to evaluate the factors that influence job satisfaction among personnel working at the private hospital where the study was conducted.
Table 1.
A summary of previous factor solutions found in the literature.
2. Materials and Methods
2.1. Translation Process
To translate and adapt the MSQ-SF into Romanian, a meticulous, multi-step process was undertaken. An expert panel consisting of two highly experienced English-to-Romanian translators (one with significant expertise in medical terminology) and several researchers from the medical and management fields was established [14].
Two panel members independently performed the initial translation. The translated versions were then reviewed and synthesized to create an intermediary Romanian draft. This draft was subsequently back-translated into English by two other panelists who were not involved in the initial translation and were unfamiliar with the original MSQ-SF. The back-translated versions were then critically analyzed and compared to the original English version to ensure accuracy and address any discrepancies. Throughout this process, wording was carefully adapted to align with Romanian semantic and syntactic nuances to ensure clarity and cultural relevance.
After translation and adaptation, the draft was pilot-tested by 15 hospital department chiefs. Their feedback on its clarity and comprehension led us to make final revisions, ensuring that the items were easy to understand and respond to. Appendix A presents the Romanian version of the MSQ-SF.
2.2. Study Population
This study was conducted between June and July 2025 in the southeastern region of the country at the largest private hospital in Romania. This medical institution offers all medical services for adults—outpatient, inpatient, medical, and surgical services—serving a population of almost one million people. The hospital has 521 employees (full-time and part-time employees).
The survey was distributed to all 521 employees at the institution, and 435 questionnaires were completed. Some employees were on holiday or refused to participate in this study. Written consent was obtained from participants, and all necessary measures to ensure anonymity were taken. This study was approved by the ethics committee.
Although the study sample was nonrandomized, a minimum sample size of 249 respondents was initially calculated to ensure that our findings would be representative of the hospital population with a 95% confidence level [15]. This calculation was based on standard statistical practices, assuming the highest variability in the population to guarantee sufficient representation. Ultimately, 435 of 521 employees (an 83.49% response rate) were included in this study. This approach maximized the representation of hospital staff and provided a more comprehensive and robust dataset [16].
2.3. Data Collection
To ensure cybersecurity and confidentiality, the questionnaire was self-administered on paper in the first week of June 2025. The Research Department put a person in charge, who was previously trained by the researchers, to offer support during the survey process to anyone in need of it.
After completion, the questionnaires were deposited by the participants in a specially arranged box to preserve their confidentiality and anonymity. After the papers were collected, they were added to an electronic system by a group of employees through Google Forms and delivered to an external team of researchers for data analysis to double-check for data quality issues and possible errors. All discrepancies were reviewed and corrected.
2.4. Minnesota Satisfaction Questionnaire
The MSQ-SF (20 items) was the primary measure of job satisfaction. As detailed in the Introduction, this self-report instrument is based on the work/job adaptation theory and provides scores for intrinsic, extrinsic, and overall satisfaction. Respondents rate their satisfaction with various job enhancers on a 5-point Likert-type scale [17,18]. The General Satisfaction Level (objective measure) is calculated by averaging the 20 items of the original MSQ-SF.
Other variables collected included demographic traits (age, sex, type of education) and specific organizational roles and experiences (department, professional background, employment status (full time or part time), working hours, total time of activity in the workforce and time of activity within their current organization) [19].
2.5. Statistical Analysis
The psychometric properties of the MSQ-SF-RO were evaluated using a series of factor and network analyses.
The primary psychometric and factor analyses were conducted using JASP 0.19.3 (Amsterdam, The Netherlands) statistical software due to its transparent, open-source nature and robustness for advanced psychometric methods. However, IBM SPSS Version 25 (Armonk, NY, USA) was only employed for managing missing data, specifically for conducting the MCAR test and the subsequent imputation of mean values.
Confirmatory Factor Analysis (CFA) was the primary method used to test whether the bi-dimensional structure (intrinsic and extrinsic satisfaction) of the original MSQ-SF, theorized in the literature and confirmed in other validation studies, fits well with the data collected in the Romanian sample [20].
Exploratory Factor Analysis (EFA) was used to examine the underlying factor structure of the 20 items of the MSQ-SF in case the initial CFA did not indicate an adequate fit for the original MSQ-SF or to confirm the validity of the new structure in the Romanian context [21].
Convergent Validity was evaluated using the correlation between the identified factors of the Romanian MSQ-SF and the general job satisfaction item. The Average Variance Extracted (AVE) and Composite Reliability were calculated to assess convergence at the construct level [22].
Discriminant Validity assessed whether the MSQ-SF factors were sufficiently distinct from one another. It examined whether the square root of the AVE for each factor was greater than the correlations between the specific analyzed factor and other factors [18].
Reliability (Internal Consistency) was assessed by calculating the Cronbach alpha coefficient for the overall scale of the MSQ-SF, as well as for each subscale comprising the factors obtained through the construct validity process [23].
Network Analysis was performed to visualize the interconnections and relationships among the MSQ-SF’s validated items, providing a graphical representation of the instrument’s structure within our study [24].
Statistical significance was set at p < 0.05. Google Forms, IBM SPSS, and JASP software were used for data gathering and statistical analysis.
3. Results
Of the 521 employees of the institution, 435 completed the questionnaire, representing an 83.49% response rate.
The study population was predominantly female (362 respondents, 83.21%), compared to males (58 respondents, 13.33%) and those with an undeclared gender (15 respondents; 3.44%). The age of respondents varied from 19 to 68 years, with a mean value of 40 (±11.9 std. dev.) and a mode of 24. On average, the respondents had been employed in the institution for 3 years and 7 months (43 months), with individual employment lengths ranging from 1 month to 14 years (168 months), with a mode of 3 years and 4 months (32 months). The Shapiro–Wilk Test values for both age and institutional tenure suggested a non-normal distribution of the values (p < 0.001)
Regarding the professional backgrounds of the employees, healthcare professionals constituted the majority (68.0%), followed by individuals with administrative and economic (9.9%), technical (6.2%), and customer service backgrounds (4.6%). A small proportion of the sample comprised military personnel (0.7%) and undergraduates (3.9%). Additionally, 6.7% of the respondents did not declare their professional background.
When considering the activity domain within the organization, we found that most of the respondents worked in daycare departments (31.3%, representing ambulatories/outpatients, pharmacy and radiology), followed by surgical fields (20.9%, representing anesthesiology, orthopedics, and other surgical specialties), clinical fields (19.8%, representing cardiology, oncology, radiotherapy, etc.), customer service (17.5%, representing call-center, reception and admissions office), and technical and administrative fields (9.4%). Additionally, 1.1% of participants did not declare their field of work at the institution. Only 5.97% of participants occupied a senior role at the hospital, and 84.82% were full-time employees. More demographic and professional characteristics of the study population can be found in Table 2.
Table 2.
The general demographic and professional characteristics of the study population (n = 435).
Among the 435 answered questionnaires obtained within this study, 88 missing item-wise responses were identified across the MSQ-SF items, representing 1.01% of the total item data (435 responders × 20 responses/ responder = 8700 total responses, of which 88 were missing). Little’s Missing Completely at Random (MCAR) test was conducted using IBM SPSS software to assess the randomness of missing data [25]. The results indicated that the data were completely missing at random (p > 0.05), allowing the use of imputation methods. Subsequently, missing values were imputed using the mean values for each item, allowing all 435 respondents to be retained for subsequent statistical analyses.
3.1. Construct Validity
3.1.1. Exploratory Factor Analysis
The initial CFA of the original two-factor model (intrinsic and extrinsic satisfaction) from the MSQ-SF was conducted using JASP software. The model was decisively rejected due to poor fit and highly concerning Discriminant Validity issues. The model fit indices were = 701.87 with df = 167 (p < 0.001). Factor analysis suitability was high, with a KMO value of 0.945 and Bartlett’s Test of Sphericity being statistically significant ( = 6481.56, df = 190, p < 0.001). However, the factor covariances were extremely high, with the correlation between intrinsic and extrinsic satisfaction being 0.941 and the HTMT being 0.966. These values far exceed the 0.85 threshold, definitively demonstrating a lack of Discriminant Validity between the two factors.
Consequently, EFA was performed to explore alternative factor structures. The initial EFA, using parallel analysis to determine the number of factors, suggested a model with six factors. This model indicated that seven items had loadings below 0.4 and would, thus, have been removed [26,27]. Furthermore, only three factors had eigenvalues above one, and factor correlations indicated poor Discriminant Validity [28].
Due to these unfavorable results, different combinations of factors were simulated to identify the best-fitting and favorable model. A final EFA was performed, manually specifying a three-factor model, while maintaining the Oblimin rotation and Maximum Likelihood (ML) factoring method. Oblimin rotation (an oblique method) was consistently selected because the underlying dimensions of job satisfaction are theoretically expected to be highly correlated in a real-world setting, making the use of orthogonal rotation methods (which assume factor independence) inappropriate and potentially distorting. ML was preferred over methods including Principal Axis Factoring because the former method has more statistical rigor and fit indices and significance tests are available.
The three-factor model demonstrated strong suitability for factor analysis [26]. The Kaiser–Meyer–Olkin (KMO) value was 0.927 (well above the 0.6 cutoff), and individual item values ranged from 0.84 to 0.97, indicating excellent sampling adequacy. Additionally, Bartlett’s Test of Sphericity was statistically significant (χ2 = 4059.534, df = 66, p < 0.001), confirming that the correlation matrix was suitable for factor analysis [29].
3.1.2. Confirmatory Factor Analysis
After identifying a three-factor structure, CFA was conducted on all 20 items of the MSQ-SF. This model demonstrated excellent fit to the data, as evidenced by several additional fit indices: the Comparative Fit Index (CFI), 0.986; the Tucker–Lewins Index (TLI), 0.985; the Bentler–Bonett Normed Fit Index (NFI), 0.974; the Root Mean Square Error of Approximation (RMSEA), 0.05; and the Standardized Root Mean Square Residual (SRMR), 0.04. These values met or exceeded the standard thresholds, confirming the model’s overall fit [30].
Furthermore, the model showed strong Convergent Validity, with most standardized factor loadings being robust and above the 0.7 threshold. The R-squared (R2) values for the items were also substantial across all three factors.
However, a critical issue was identified with Discriminant Validity between the two factors. The factor covariance between the first two factors was extremely high (0.885), being above the 0.85 cutoff, suggesting that these two latent constructs were not empirically distinct. This concern was further supported by the Heterotrait–Monotrait Ratio (HTMT) value of 0.858, which barely exceeded the 0.85 threshold, indicating a high degree of correlation between the factors [31].
To address these issues, eight items (MSQ1, MSQ7, MSQ8, MSQ10, MSQ11, MSQ12, MSQ17, and MSQ18) with low factor loadings were removed and a new CFA was performed on the remaining 12 items [30]. Table 3 provides details of the factor loadings after Oblimin rotation was applied to the three-factor model, with eight items discarded [20]. This 12-item model accounted for 70.2% of the variance, with Factor 1, Factor 2, and Factor 3 explaining 35.9%, 19.8%, and 14.5% of the variance after rotation.
Table 3.
Factor loadings after the Oblimin rotation.
The three different factors obtained are as follows:
Factor 1—Task Enrichment: This factor, comprising items MSQ13, MSQ14, MSQ15, MSQ16, MSQ19, and MSQ20, reflects an employee’s satisfaction with the work itself and the rewards derived from it. The items collectively highlight appreciation for professional rewards (MSQ13: “My pay”), professional growth (MSQ14: “The chances for advancement”), and the intrinsic satisfaction from a sense of accomplishment (MSQ20: “The feeling of accomplishment”). The inclusion of items MSQ15 and MSQ16 further emphasizes the importance of autonomy and freedom within the job itself, which we interpret as contributing to the enrichment of work tasks.
Factor 2—Autonomy Satisfaction: Composed of the items MSQ2, MSQ3, MSQ4, and MSQ9, this factor is a classic representation of intrinsic job satisfaction. It focuses on the ability to work independently (MSQ2: “The chance to work alone”), the variety of tasks performed (MSQ3: “The chance to do different things”), and the job’s personal and social significance (MSQ4: “The chance to be ‘somebody’ in the community” and MSQ9: “The chance to do things for other people”). This factor captures satisfaction derived from having control over one’s work and its impact.
Factor 3—Supervisory Relationship: This factor uniquely focuses on the hierarchical relationship between employees and their supervisors. It consists of only two items: MSQ5: “The way my boss handles his/her workers” and MSQ6: “The competence of my supervisor in making decisions.” These items directly assess satisfaction with a supervisor’s behavior and competence, highlighting the distinct importance of this relationship in the Romanian context.
For the final CFA that employed the three-factor models and discarded eight MSQ items, the fit indices demonstrated a robust solution. χ2 was 117.74 (df = 51, p < 0.001) and Bartlett’s Test of Sphericity was χ2 = 4059.47 (df = 66, p < 0.001). The additional fit measures were as follows: the CFI = 0.992, the TLI = 0.989, the NNFI= 0.989, the NFI = 0.986, the Parsimonious Normed Fit Index (PNFI) = 0.77, the Relative Fit Index (RFI) = 0.982, the Incremental Fit Index (IFI) = 0.992, and the Relative Non-Centrality Index (RNI) = 0.992. Other fit measures were represented by RMSEA = 0.055, RMSEA 90% CI lower bound = 0.042 and upper bound 0.068, RMSEA p-value = 0.253, SRMS 0.03, Hoerlter’s critical n with α at 0.05 = 491.208 and with α at 0.01 = 553.43, and the Goodness-of-Fit Index (GFI) = 0.998. The overall KMO value was 0.927, ranging from 0.84 (MSQ6) to 0.97 (MSQ14).
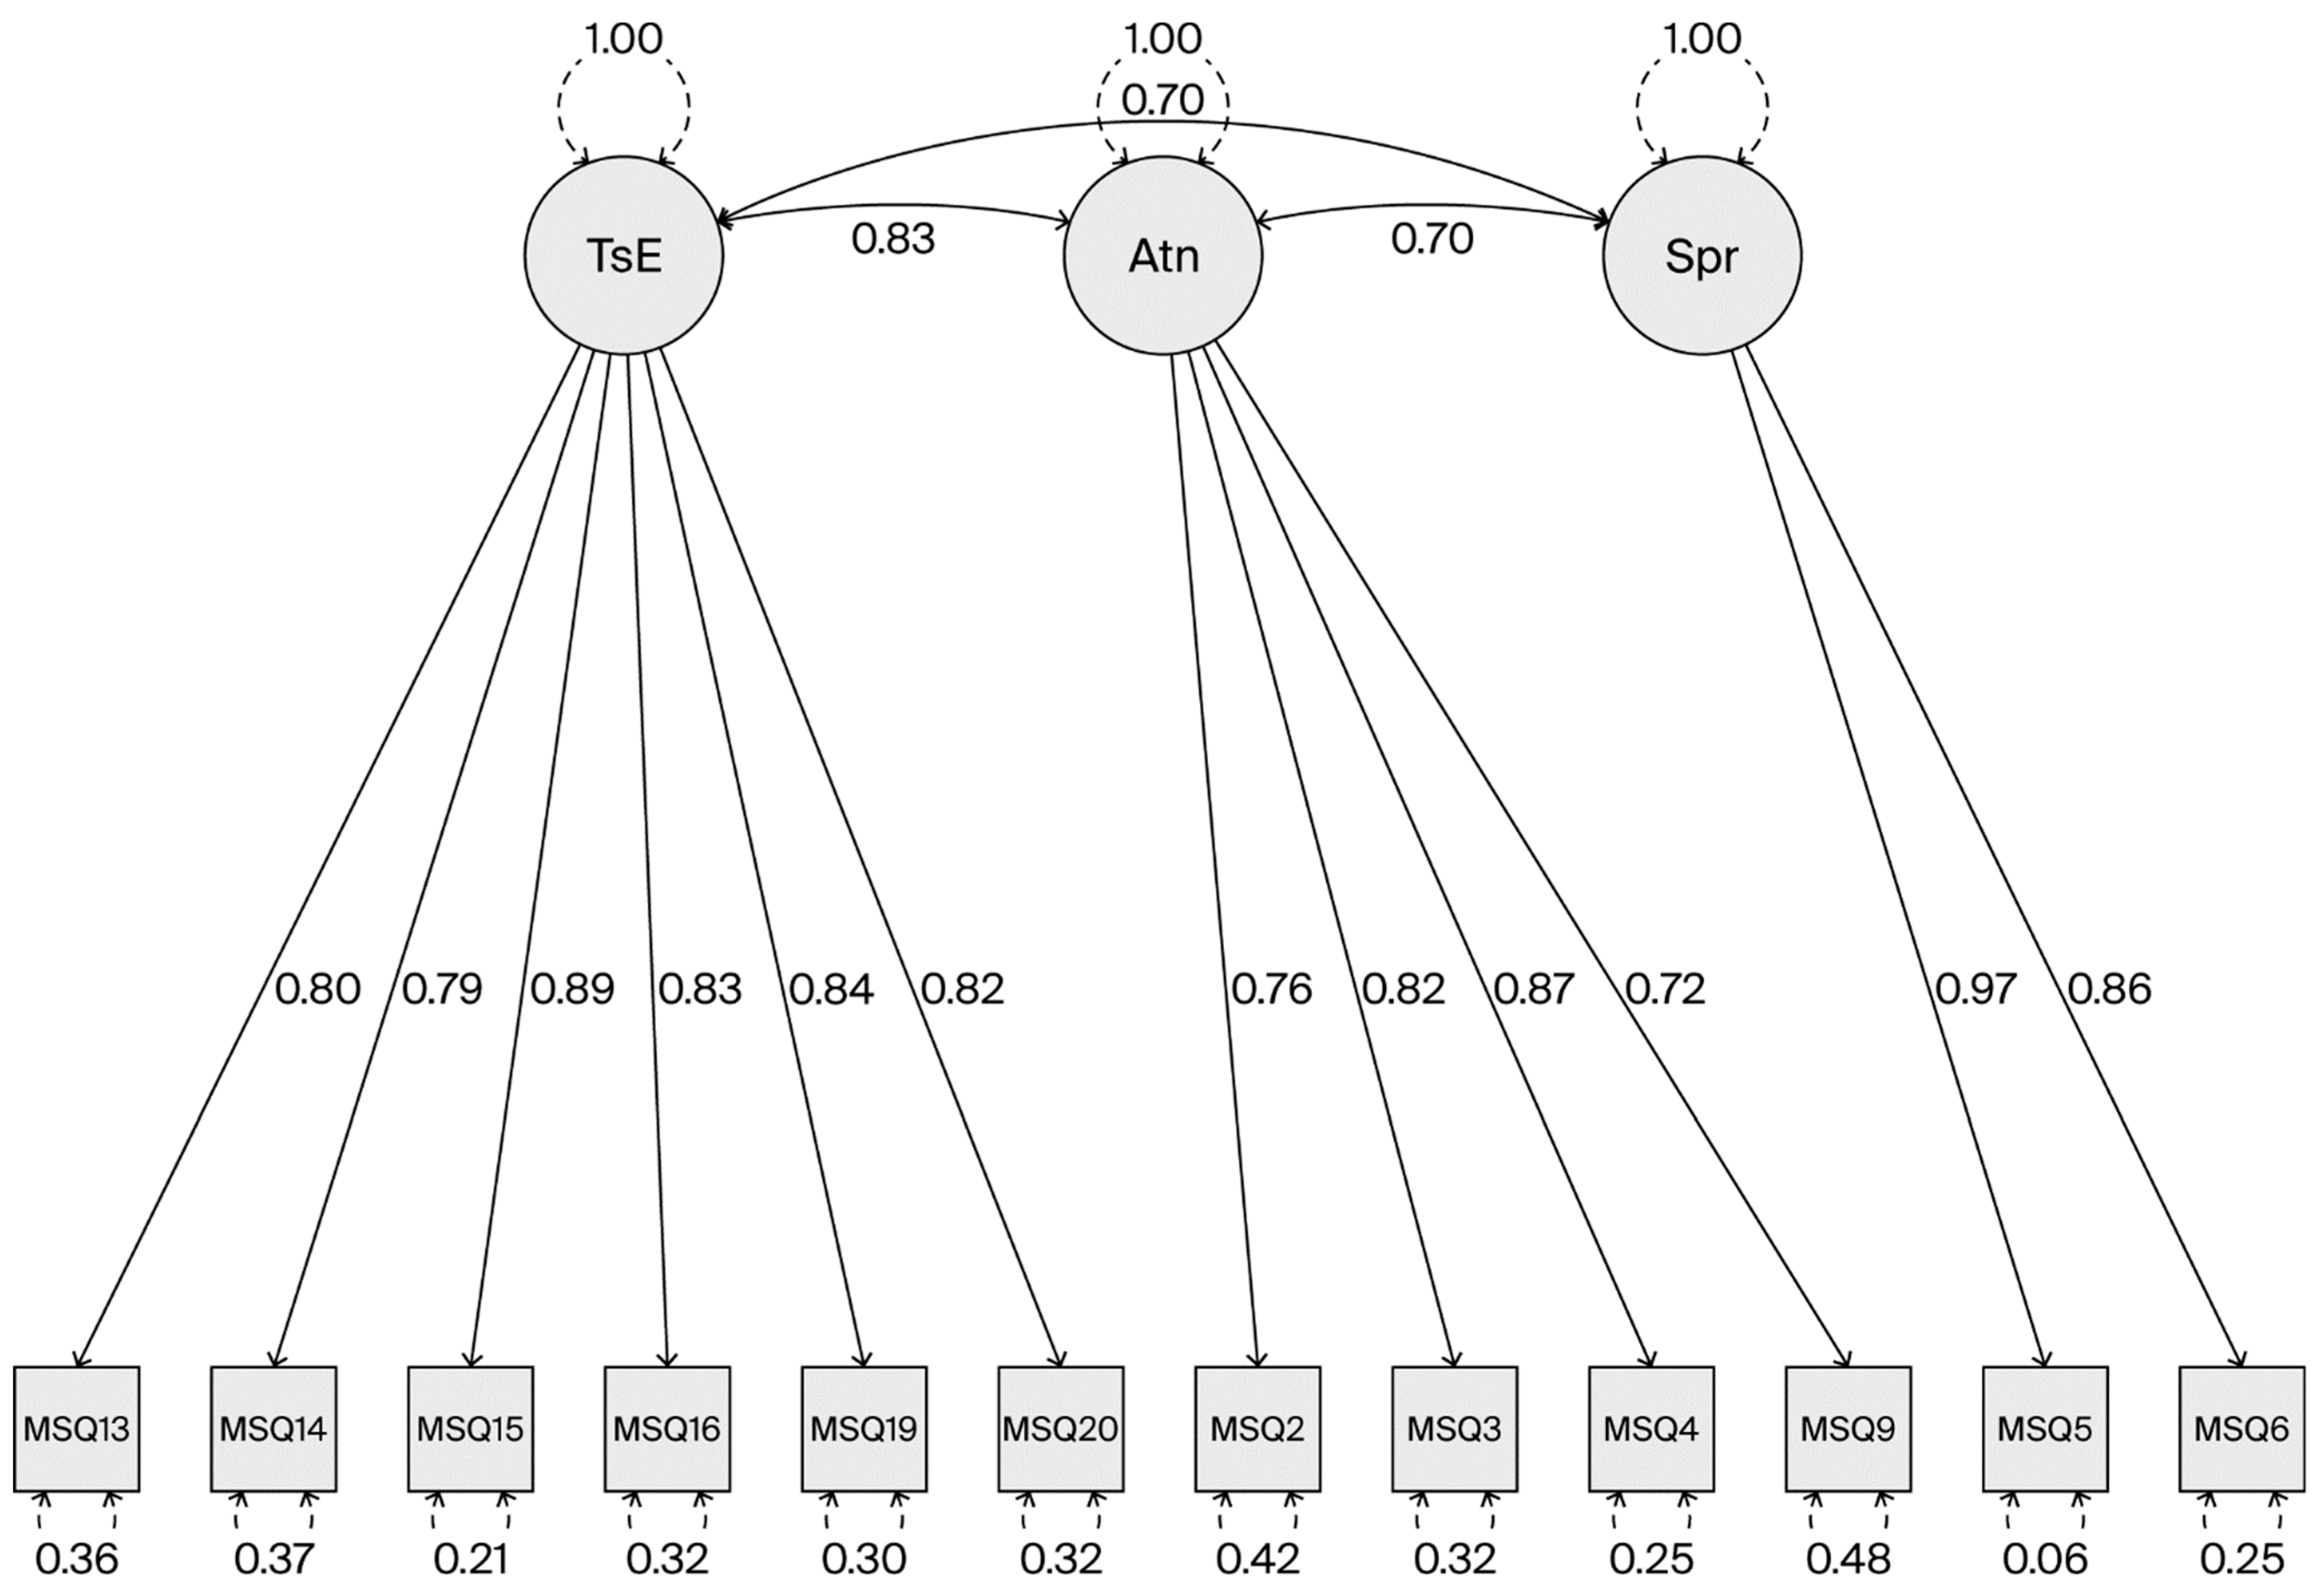
The R-squared values ranged from 0.519 (MSQ9) to 0.944 (MSQ5). Factor loadings varied from 0.793 (MSQ14) to 0.891 (MSQ15) for Task Enrichment, from 0.72 (MSQ9) to 0.866 (MSQ4) for Autonomy Satisfaction, and 0.865 (MSQ6) to 0.971 (MSQ5) for Supervisory Relationships. All standard estimates were improved using the new model.
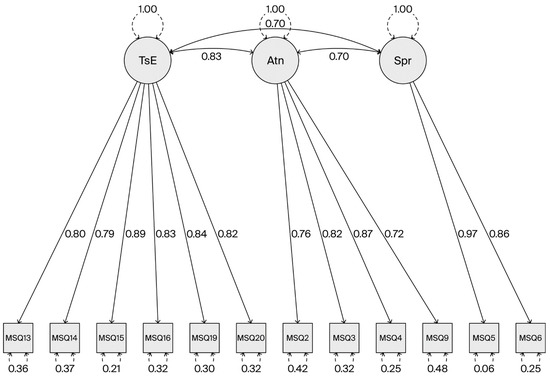
As presented in Figure 1, the covariance between Task Enrichment and Autonomy Satisfaction was 0.835 (std. error 0.022, p < 0.001), that between Task Enrichment and Supervisory Relationships was 0.697 (std. error 0.035, p < 0.001), and that between Autonomy Satisfaction and Supervisory Relationships was 0.7 (std. error 0.036, p < 0.001).
Figure 1.
Confirmatory Factor Analysis—factor structure (TsE—Task Enrichment; Atn—Autonomy; SpR—Supervisory Relationship).
The AVEs for Task Enrichment, Autonomy Satisfaction, and Supervisory Relationships were 0.688, 0.632, and 0.846, respectively. All factors showed good Convergent Validity [18].
Crucially, the Discriminant Validity was improved in this model. The HTMT values were significantly reduced, falling below the 0.85 threshold: 0.803 for Task Enrichment and Autonomy Satisfaction, 0.628 for Task Enrichment and Supervisory Relationships, and 0.654 for Autonomy Satisfaction and Supervisory Relationships; these results confirm that the three factors are empirically distinct latent constructs.
3.1.3. Internal Consistency
For reliability statistics, Cronbach’s alpha coefficient was calculated to express Internal Consistency [32,33]. For the extended survey, which included the overall satisfaction item, Cronbach’s alpha was 0.94, and for the MSQ-SF with 20 items, it was 0.935. Both results reflect excellent Internal Consistency above the 0.9 cutoff [23].
In the case of the three-factor structure with eight items discarded, Cronbach’s alpha was 0.911. The three factors independently showed the following results: Task Enrichment (0.888), Autonomy Satisfaction (0.801), and Supervisory Relationship (0.824); all factors demonstrated good Internal Consistency.
3.1.4. Network Analysis
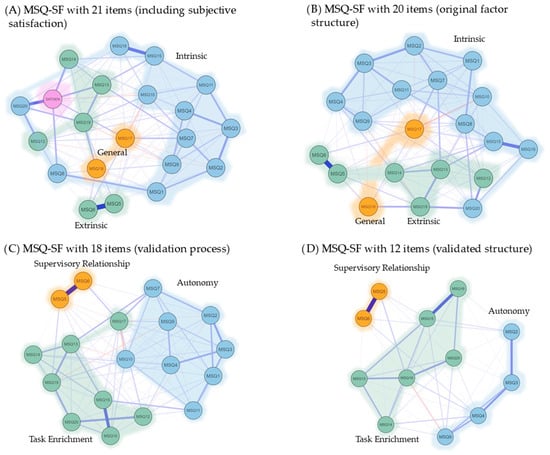
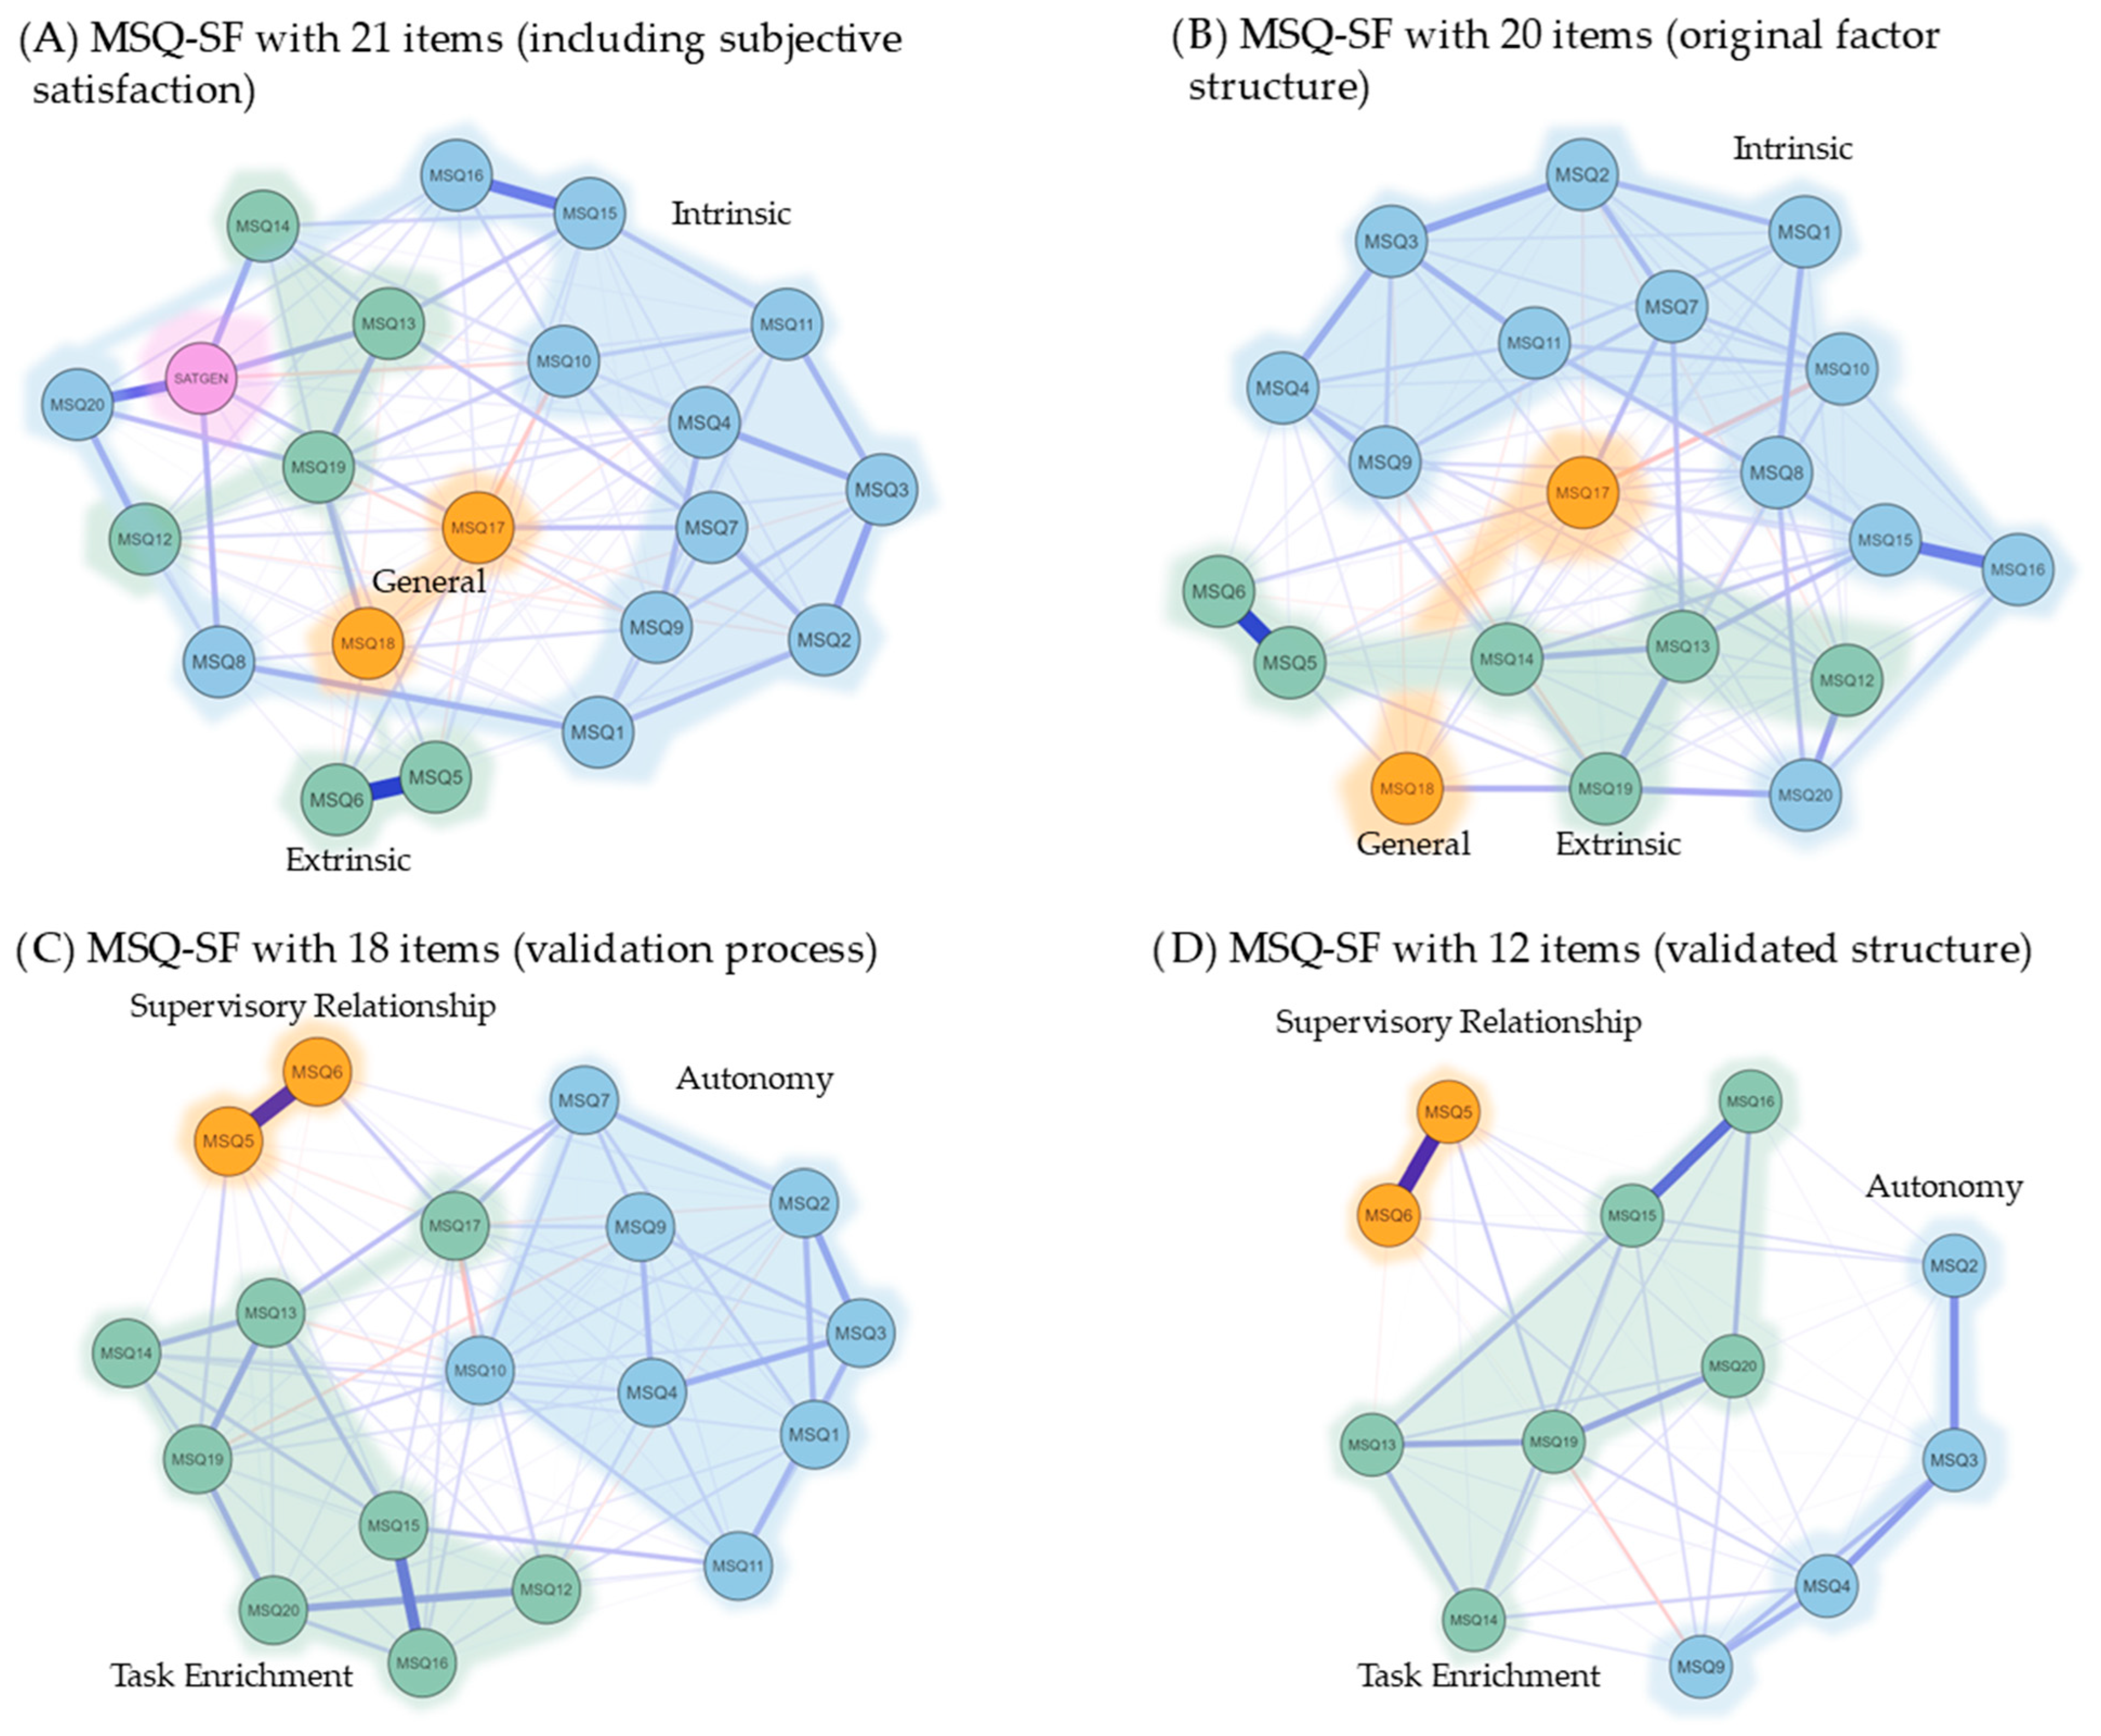
To complement the factor analysis findings, Network Analysis was conducted to visualize the underlying structure of the MSQ-SF items. Using the EBICglasso estimator, the network plots (Figure 2) provide a graphical representation of the direct correlations between items, offering a different perspective on their relationships [34,35]. In these plots, each circle (node) represents an item, and the lines (edges) connecting them signify a direct statistical relationship. Thicker lines indicate stronger correlations, whereas clusters of colored nodes represent identified factors [24,36].
Figure 2.
Network Plot—the underlying structure of each MSQ item correlation, considering the three latent factors obtained through the validation process.
The network plots clearly illustrate the shift from the original, less-defined structures of the final validated three-factor model.
Figure 2A (21-item MSQ—SF) and Figure 2B (20-item MSQ-SF) show a highly dense and interconnected network. The numerous non-zero edges (127/210 and 122/190, respectively) and higher sparsity values (0.395 and 0.358, respectively) indicate that nearly all items are related. This high density suggests a lack of distinct and empirically separate clusters, supporting the results of our initial CFA, which found poor model fit for the original two-factor structure. The items are not clearly grouped into well-defined domains, making it difficult to interpret a clear factor structure.
Figure 2D (12-item validated structure) depicts a markedly different and clearer structure. This final model has a significantly lower number of non-zero edges (54/66) and a reduced sparsity value (0.182), visually confirming that only the most direct and meaningful relationships between the items are retained. The plot distinctly shows three separate and well-defined clusters of items corresponding precisely to the three factors identified in our final CFA: Task Enrichment, Autonomy, and Supervisory Relationships. The items within each cluster are strongly connected, whereas the connections between the clusters are minimal. This clear modularity visually reinforces the statistical findings of our CFA, providing compelling evidence of the Discriminant Validity of the three-factor model.
4. Discussions
4.1. Principal Findings and Comparisons
The MSQ-SF has demonstrated robust psychometric properties across diverse cultural contexts, establishing it as a widely recognized and continuously validated instrument for assessing job satisfaction. Recent studies, along with the existing literature, affirm its cross-cultural applicability in various nations, including Portugal [10], Poland [11], Cyprus [9], South Africa [37], Tanzania [38], Ghana [7], Kuwait [39], India [40], and Vietnam [13]. These validation efforts consistently underscore the utility of the MSQ-SF in providing reliable and valid measures of job satisfaction across different professional landscapes globally [41].
This study aimed to validate the psychometric properties of the MSQ-SF in a Romanian organizational healthcare context. Consistent with the growing body of international literature, the initial attempt to confirm the original two-factor model distinguishing between intrinsic and extrinsic satisfaction was unsuccessful. The CFA of the original model was rejected because of inadequate fit and poor Discriminant Validity, a finding that mirrors observations from validation studies conducted in countries such as Portugal [10], Cyprus [9], and Vietnam [13], where the universal applicability of the original structure has been questioned [41]. The failure of the original model may be rooted in Romania’s high Power Distance and collectivistic culture. In such contexts, the strict separation between extrinsic (organizational) and intrinsic (personal) factors may break down, as employees’ sense of self and satisfaction are deeply tied to the social and hierarchical structure of the workplace, necessitating the use of a more nuanced, multi-factor model for accurate measurement [42]. This initial finding underscores the need for culture-specific model adaptation, validating the use of an exploratory approach to uncover a factor structure more representative of the Romanian healthcare professional environment [14,23].
This study utilized a diverse sample of 435 employees in a private healthcare context, encompassing healthcare professionals (48.04%), alongside professionals working in administrative, technical, and other supportive roles. This heterogeneity is consistent with the broad application of the MSQ-SF in the international literature that extends beyond the direct clinical care provider roles typical of nursing-centric studies. This robust sample composition is crucial for confirming the instrument’s structural integrity and relevance across varied organizational functions within a single institutional setting. While often validated in clinical contexts, the instrument’s utility extends significantly beyond this sector, as evidenced by successful validation studies conducted in public service (Tanzania, n = 50) [38], government (Ghana, n = 100) [7], and finance (Bangladesh, n = 103) [43] fields, demonstrating its wide applicability for organizational psychology research and management practices [22].
The current sample size is comparable to those of prior studies (e.g., Vietnam, n = 587 [13], Portugal, n = 140 [10]). Its occupational mix is a key distinction: while Poland (n = 177) and Cyprus (n = 292) focused almost exclusively on nurses (92.5% in Cyprus, 100% in Poland) [9,11], this study’s inclusion of nearly 30% non-clinical administrative, technical, and customer service staff provides insights into the MSQ-SF’s limit within a complex organizational ecosystem. Demographically, gender distribution is largely consistent across most samples, with this study (83.21% female), aligning closely with results from Portugal (79.3%) and Vietnam (83.6%). However, notable differences exist regarding age and tenure. The Cypriot sample was distinctly younger (56.5% under 30), whereas the Vietnamese sample reported a significantly older mean age (μ = 54.95 years) and focused on “grassroots healthcare workers” with substantial local responsibilities [13]. The Portuguese sample (μ = 43.4 years) is closer in age profile to this study (μ = 40.81 years). Encompassing diverse age groups, educational levels and varied professional roles, it underscores the MSQ-SF’s established robustness and enhances its overall generalizability across the international healthcare landscape.
A three-factor structure with 12 items was identified as the optimal solution for the Romanian sample, consisting of Task Enrichment, Autonomy Satisfaction, and Supervisory Relationship. This finding aligns with international validation studies that also departed from the original two-factor model to find a more suitable multifactorial structure. A Vietnamese validation study, for instance, yielded a three-factor model after discarding six items: Specificity, Autonomy, and Obligation [13]. In contrast, a study conducted in Poland found a two-factor model, slightly different from the original, without discarding any items [11]. A Portuguese study by Martins et al. (2012) identified a two-factor structure after discarding 10 items consisting of Supervisor/Empowerment and Task Enrichment [10]. This variation in factor structures across different cultures, from two-factor to three-factor models, sheds light on the importance of localized validation and suggests that the underlying dimensions of job satisfaction may be perceived differently depending on the cultural and professional context [2].
Our findings bear a particularly strong resemblance to the Greek-Cypriot validation study conducted by Lakatamitou et al. (2020) [9]. While that study yielded a combined Supervisory/Autonomy factor, our analysis resulted in Supervisory Relationship as a distinct, separate construct. This factor is critical and provides a cultural explanation for model refinement. Romania’s organizational environment is profoundly influenced by its national culture, which Hofstede’s framework characterizes as exhibiting a high Power Distance (PDI) and a tendency toward collectivism, albeit one that is currently in transition [42]. The high PDI suggests a preference for centralized and hierarchical structures, where authority is rarely challenged, which can directly influence how job satisfaction is derived and reported by employees in the hierarchical healthcare setting. Furthermore, the collectivist inclination means that team cohesion, relational dynamics, and group harmony often take precedence over individual achievement, suggesting that Autonomy and Task Enrichment Satisfaction may be heavily weighted by the perceived quality of the working group and the immediate supervisor.
These cultural traits manifest in the daily operation of organizations, creating what are termed the “particularities of Romanian management” [44]. Management styles are often characterized by paternalistic leadership, a focus on personal relationships (rather than strictly formal procedures), and centralized, top-down decision-making. In the rapidly evolving private healthcare domain, where adaptability is crucial, this traditional management approach can pose challenges. However, the private sector, in particular, is simultaneously driven by global and market-based forces that demand a high degree of organizational efficiency and employee engagement. In this competitive landscape, an organization’s culture is not merely a background factor but a critical component of its competitiveness [45]. A strong, adaptive organizational culture that supports positive job satisfaction dimensions, as measured using the MSQ-SF, becomes a vital non-material resource that enables rapid response to patient demands and technological change, thereby sustaining long-term success in the market [46].
The final three-factor model demonstrated an excellent fit to the Romanian data, as evidenced by robust fit indices, including a CFI of 0.992, a TLI of 0.989, an RMSEA of 0.055 (90% CI: 0.042–0.068), and an SRMR of 0.03. These values meet or exceed the established thresholds for a strong model fit, providing statistical support for the proposed structure [47]. The conceptual rationale for these factors is well defined by the items loaded on them. The excellent CFA fit indices and the Network Analysis results provide strong counter-evidence for their Discriminant Validity. The strong connections seen in the network within these clusters, contrasted with the sparse connections between them, visually reinforce the notion that they are distinct constructs.
The EFA resulted in a three-factor model with 12 items, accounting for 70.2% of the total variance. This result is comparable to the findings of other validation studies, highlighting the robust explanatory power of the developed model [48]. For instance, the Vietnamese study’s EFA resulted in a model with 14 items that accounted for 65.766% of the variance [13]. Lakatamitou et al. (2020) produced a two-factor model with 15 items accounting for 58.0% of the variance [9]. In Martins’ study (2012), the resulting two-group model with 10 items accounted for 61.185% of the variance [10].
The Internal Consistency results from our study are highly favorable compared to other international validations [29]. The overall Cronbach alpha of 0.933 recorded for the three-factor model was higher than the figure of 0.892 reported by Walkowiak et al. (2019) for their Polish study [11] and comparable to the figure of 0.924 from a Vietnamese study [13]. The global alpha of 0.955 from the Greek-Cypriot study was slightly higher than that of our study [9]. When examining the reliability of the individual factors, our alpha values for Task Enrichment (0.888), Autonomy Satisfaction (0.801), and Supervisory Relationships (0.824) were comparable to or exceeded those found in the literature. For instance, our Task Enrichment alpha is identical to the 0.888 figure for the Greek-Cypriot study [9] and higher than the 0.87 figure for Martins’s (2012) study in Portugal [10]. Our Autonomy Satisfaction alpha is lower than the 0.873 figure for the Greek-Cypriot Supervisor/Autonomy factor [9] but higher than the 0.78 figure for Martins’ (2012) Supervisory/Empowerment factor [10]. High reliability values recorded across both the total scale and individual factors provide strong evidence for the psychometric robustness of the Romanian version of the MSQ-SF [29].
The Network Analysis conducted in this study serves as a powerful visual confirmation of the quantitative findings, aligned with the growing use of this methodology in organizational psychology and psychometrics [49,50,51]. This approach moves beyond traditional factor analysis, offering a detailed item-level perspective on construct validity [24]. For instance, a recent study on job satisfaction among radiologists used Network Analysis to visualize the intricate relationships between various work-related factors, demonstrating the capacity of this method to reveal subtle but important connections within professional contexts [49]. The findings, particularly the transition from highly dense, undifferentiated initial networks to the sparse, modular structure of the final 12-item model, are consistent with the principles of parsimony and clarity sought in psychometric Network Analysis [52]. The clear separation of the three factors visually reinforces their Discriminant Validity and confirms that they are distinct and meaningful dimensions of job satisfaction in the studied population.
The application of Network Analysis to validate the MSQ in the Romanian context is a pioneering effort, providing a methodological contribution to the field of industrial and organizational psychology within the region and for MSQ validation. By applying the EBICglasso estimator, this study confirmed the statistical findings of the CFA and provided a transparent visual map of the MSQ structure [53]. This visual clarity is valuable for researchers, practitioners, and managers because it facilitates obtaining a deeper understanding of how specific items relate to each other and form meaningful clusters [54,55]. The successful use of this technique demonstrates that it is a novel and robust method for performing instrument validation in this specific cultural and provisional setting [35,52].
4.2. Practical Implications
Validating the twelve-item, three-factor MSQ-SF in the Romanian healthcare context provides actionable insights for organizational management, human resources, and policy-makers. Firstly, the clear differentiation of the Supervisory Relationship factor means that management must recognize the distinct importance of direct supervisors’ competence and conduct. Unlike intrinsic factors, this relationship is externally controllable and can be directly influenced by targeted leadership training programs focused on effective delegation and clear communication. For instance, human resources departments can use this validated instrument to benchmark supervisory performance and tailor interventions. Secondly, the confirmed importance of Autonomy Satisfaction and Task Enrichment suggests that simple financial rewards alone are insufficient to ensure job satisfaction. Hospitals and clinics can improve job satisfaction by redesigning roles to increase variety (MSQ3) and task control (MSQ2) and by linking performance to professional growth opportunities (MSQ14). This locally validated tool can be used to monitor the effectiveness of these structural and relational interventions in real time, allowing for evidence-based decision-making in organizational development [17,22]
4.3. Limitations
Despite its robust psychometric findings, this study has several limitations that constrain the generalizability and scope of the results.
First, the non-random sampling approach, confined to a single private healthcare institution in Romania, limits the generalizability of the findings to the broader Romanian workforce [15,16]. The positive reputation and specific context of this institution may give it unique characteristics that influence employee satisfaction in a different manner than the public sector or other private sector organizations.
Second, a significant limitation was the inability to perform a full Structural Equation Modeling (SEM) analysis with demographic predictors due to persistent issues with empirical non-identification and numerical instability. Despite extensive troubleshooting, the model could not provide reliable estimates of the structural paths from variables such as age and gender to the latent satisfaction factors. Key issues include a non-positive definite W matrix, which prevents the computation of robust standard errors, and the appearance of infinite factor covariances [56]. These problems likely stem from the inherently high correlation between the first two latent factors and the highly skewed, non-normal nature of ordinal (Likert-scale) data.
4.4. Further Works
Future research should extend the present findings to a broader and more representative sample of the Romanian healthcare sector, including multiple public and private institutions, to enhance the generalizability of the validated three-factor model. A larger and more diverse sample would also provide the statistical power necessary to address the empirical non-identification issues encountered in our SEM analysis [56].
The striking conceptual similarity between the Romanian factor structure and that of the Greek-Cypriot validation study suggests a compelling avenue for regional comparative research [9]. Future studies should investigate whether this factor structure is a geo-social phenomenon by exploring job satisfaction dimensions across the Balkans and South-Eastern European regions.
As science progresses into the digital and Artificial Intelligence era, these pencil-and-paper tools are evolving into digital instruments that will collect, analyze, and deliver results in a digital and automatic manner; this process has already been seen in different domains, such as preventive medicine [46], suggesting a clear direction for guiding future interest in this area.
5. Conclusions
The MSQ-SF is a widely used and highly regarded tool for assessing job satisfaction in various professional contexts. This study successfully validated a new context-specific factor structure in the Romanian organizational environment. By demonstrating that the original two-factor model of intrinsic and extrinsic satisfaction had an inadequate fit for the data, our findings align with the growing body of international literature underscoring the importance of local psychometric validation. We identified a robust and psychometrically sound three-factor model consisting of Task Enrichment, Autonomy Satisfaction, and Supervisory Relationships, which offers a more nuanced and culturally relevant framework for understanding job satisfaction in Romania. This new model provides researchers and organizational practitioners with a reliable and valid tool for measuring the key dimensions of employee satisfaction, enabling more effective interventions and human resource strategies.
The analysis of the construct validity provided strong support for the proposed three-factor model. Both EFA and CFA demonstrated an excellent fit to the data, as evidenced by the robust fit indices (CFI = 0.992, TLI = 0.989, RMSEA = 0.055, SRMR = 0.03). The Internal Consistency of the overall scale (Cronbach’s α = 0.933) and its individual factors was also high enough to provide a strong basis for reliability.
Author Contributions
Conceptualization, B.C.P., S.I.C., A.M. (Adrian Mociu); methodology, B.C.P., A.M. (Alin Maerean), D.G.M., C.P.R.; software, A.M. (Alin Maerean), N.C., S.I.C.; validation, B.C.P., S.I.C., N.C.; formal analysis, B.C.P., C.P.R., A.M. (Adrian Mociu), D.G.M., data curation, A.M. (Alin Maerean), N.C., V.C.; writing—original draft preparation, B.C.P., A.M. (Adrian Mociu), S.I.C., D.G.M., V.C.; writing—review and editing, B.C.P., D.G.M., A.M. (Alin Maerean), N.C., C.P.R., V.C.; visualization, A.M. (Alin Maerean), N.C., C.P.R.; supervision, B.C.P., N.C.; project administration, B.C.P., A.M. (Adrian Mociu), N.C. All authors have read and agreed to the published version of the manuscript.
Funding
This research received no external funding.
Institutional Review Board Statement
This study was approved on 19 May 2025 by the Institutional Review Board (IRB) at Ovidius Clinical Hospital Ethics Board (approval No. 115).
Informed Consent Statement
Informed consent was obtained from all subjects involved in this study.
Data Availability Statement
The original contributions presented in this study are included in the article. Further inquiries can be directed to the corresponding author.
Acknowledgments
We thank Alina Roxana Chirila and Ramona Aura Ion for translation and linguistic adaptation, as well as Cristina Florica Dobre, Elena Cotoban, and Carmen Florentina Andronache for their support with human resources and data collection tasks.
Conflicts of Interest
The authors declare no conflicts of interest.
Abbreviations
The following abbreviations are used in this manuscript:
| MSQ | Minnesota Satisfaction Questionnaire |
| MSQ-SF | Minnesota Satisfaction Questionnaire–Short Form |
| JSS | Job Satisfaction Questionnaire |
| eNPS | Employee Net Promoter Score |
| CFA | Confirmatory Factor Analysis |
| EFA | Exploratory Factor Analysis |
| AVE | Average Variance Extracted |
| MCAR | Missing Completely at Random |
| KMO | Kaiser–Meyer–Olkin |
| CFI | Comparative Fit Index |
| TLI | Tucker–Lewins Index |
| NFI | Bentler–Bonett Normed Fit Index |
| RMSEA | Root Mean Square Error of Approximation |
| SRMR | Standardized Root Mean Square Residual |
| HTMT | Heterotrait–Monotrait Ratio |
| PNFI | Parsimonious Normed Fit Index |
| RFI | Relative Fit Index |
| IFI | Incremental Fit Index |
| RNI | Relative Noncentrality Index |
| GFI | Goodness-of-Fit Index |
| PDI | Power Distance |
Appendix A
Table A1.
Item abbreviation and the Romanian translation from the original Minnesota Satisfaction Questionnaire–Short-Form.
References
- OECD. Rethinking Health System Performance Assessment: A Renewed Framework; OECD Health Policy Studies: Paris, France, 2024. [Google Scholar] [CrossRef] [Scilit]
- Gustavsson, K.; van Diepen, C.; Fors, A.; Axelsson, M.; Bertilsson, M.; Hensing, G. Healthcare professionals’ experiences of job satisfaction when providing person-centred care: A systematic review of qualitative studies. BMJ Open 2023, 13, e071178. [Google Scholar] [CrossRef] [Scilit]
- Spector, P.E. Job Satisfaction: Application, Assessment, Causes, and Consequences; SAGE Publications: Thousand Oaks, CA, USA, 1997. [Google Scholar]
- Weiss, D.J.; Dawis, R.V.; England, G.W. Manual for the Minnesota Satisfaction Questionnaire. Minn. Stud. Vocat. Rehabil. 1967, 22, 120. [Google Scholar]
- Smith, P.C.; Kendall, L.M.; Hulin, C.L. Job Descriptive Index; APA PsycTests: Washington, DC, USA, 1969. [Google Scholar] [CrossRef] [Scilit]
- Reichheld, F.F. The one number you need to grow. Harv. Bus Rev. 2003, 81, 46–54. [Google Scholar] [PubMed]
- Abugre, J.B. Job Satisfaction of Public Sector Employees in Sub-Saharan Africa: Testing the Minnesota Satisfaction Questionnaire in Ghana. Int. J. Public Adm. 2014, 37, 655–665. [Google Scholar] [CrossRef] [Scilit]
- Bello, S.; Adewole, D.A.; Afolabi, R.F. Work Facets Predicting Overall Job Satisfaction among Resident Doctors in Selected Teaching Hospitals in Southern Nigeria: A Minnesota Satisfaction Questionnaire Survey. J. Occup. Health Epidemiol. 2020, 9, 52–60. [Google Scholar] [CrossRef] [Scilit]
- Lakatamitou, I.; Lambrinou, E.; Kyriakou, M.; Paikousis, L.; Middleton, N. The Greek versions of the TeamSTEPPS teamwork perceptions questionnaire and Minnesota satisfaction questionnaire “short form”. BMC Health Serv. Res. 2020, 20, 587. [Google Scholar] [CrossRef] [Scilit]
- Martins, H.; Proença, M.T. Minnesota satisfaction questionnaire: Psychometric properties and validation in a population of portuguese hospital workers. Conferência Investig. Interv. Recur. Hum. 2014, 471, 1–23. [Google Scholar] [CrossRef] [Scilit]
- Walkowiak, D.; Staszewski, R. Nurses’ job satisfaction–the factor structure of the Minnesota satisfaction questionnaire. J. Health Study Med. 2019, 2, 77–96. [Google Scholar]
- Chen, H.; Fang, T.; Liu, F.; Pang, L.; Wen, Y.; Chen, S.; Gu, X. Career Adaptability Research: A Literature Review with Scientific Knowledge Mapping in Web of Science. Int. J. Environ. Res. Public Health 2020, 17, 5986. [Google Scholar] [CrossRef] [Scilit]
- Huynh, C.M.; Nguyen, C.H.; Le, K.N.D.; Tran, P.T.N.; Nguyen, P.M. Job Satisfaction within the Grassroots Healthcare System in Vietnam’s Key Industrial Region-Binh Duong Province: Validating the Vietnamese Version of the Minnesota Satisfaction Questionnaire Scale. Healthcare 2024, 12, 432. [Google Scholar] [CrossRef] [Scilit]
- Dhippayom, J.P.; Trevittaya, P.; Cheng, A.S.K. Cross-Cultural Adaptation, Validity, and Reliability of the Patient-Rated Michigan Hand Outcomes Questionnaire for Thai Patients. Occup. Ther. Int. 2018, 2018, 8319875. [Google Scholar] [CrossRef] [Scilit]
- Berndt, A.E. Sampling Methods. J. Hum. Lact. 2020, 36, 224–226. [Google Scholar] [CrossRef] [Scilit]
- Sarker, M.; AL-Muaalemi, M.A. Sampling Techniques for Quantitative Research. In Principles of Social Research Methodology; Islam, M.R., Khan, N.A., Baikady, R., Eds.; Springer: Singapore, 2022; pp. 221–234. [Google Scholar] [CrossRef] [Scilit]
- Hirschfeld, R.R. Does revising the intrinsic and extrinsic subscales of the Minnesota Satisfaction Questionnaire short form make a difference? Educ. Psychol. Meas. 2000, 60, 255–270. [Google Scholar] [CrossRef] [Scilit]
- Gillet, B.; Schwab, D.P. Convergent and Discriminant Validities of Corresponding Job Descriptive Index and Minnesota Satisfaction Questionnaire Scales. J. Appl. Psychol. 1975, 60, 313–317. [Google Scholar] [CrossRef] [Scilit]
- Sullivan, G.M.; Artino, A.R., Jr. Analyzing and interpreting data from likert-type scales. J. Grad. Med. Educ. 2013, 5, 541–542. [Google Scholar] [CrossRef] [Scilit]
- Bledsoe, J.C.; Brown, S.E. Factor Structure of the Minnesota Satisfaction Questionnaire. Percept. Mot. Ski. 1977, 45, 301–302. [Google Scholar] [CrossRef] [Scilit]
- Bowling, N.A.; Hammond, G.D. A meta-analytic examination of the construct validity of the Michigan Organizational Assessment Questionnaire Job Satisfaction Subscale. J. Vocat. Behav. 2008, 73, 63–77. [Google Scholar] [CrossRef] [Scilit]
- Hancer, M.; George, R.T. Factor structure of the Minnesota Satisfaction Questionnaire short form for restaurant employees. Psychol. Rep. 2004, 94, 357–362. [Google Scholar] [CrossRef] [Scilit] [PubMed]
- van Saane, N.; Sluiter, J.K.; Verbeek, J.H.A.M.; Frings-Dresen, M.H.W. Reliability and validity of instruments measuring job satisfaction—A systematic review. Occup. Med. 2003, 53, 191–200. [Google Scholar] [CrossRef] [Scilit] [PubMed]
- Dikopoulou, Z. Network Analysis, Accuracy and Stability of the Job-Satisfaction Structures. In Modeling and Simulating Complex Business Perceptions: Using Graphical Models and Fuzzy Cognitive Maps; Springer International Publishing: Cham, Switzerland, 2021; pp. 85–118. [Google Scholar] [CrossRef] [Scilit]
- Gomer, B.; Yuan, K.H. A Realistic Evaluation of Methods for Handling Missing Data When There is a Mixture of MCAR, MAR, and MNAR Mechanisms in the Same Dataset. Multivar. Behav. Res. 2023, 58, 988–1013. [Google Scholar] [CrossRef] [Scilit]
- Holgado-Tello, F.P.; Chacón-Moscoso, S.; Barbero-García, I.; Vila-Abad, E. Polychoric versus Pearson correlations in exploratory and confirmatory factor analysis of ordinal variables. Qual. Quant. 2010, 44, 153–166. [Google Scholar] [CrossRef] [Scilit]
- Olsson, U. Maximum Likelihood Estimation of the Polychoric Correlation Coefficient. Psychometrika 1979, 44, 443–460. [Google Scholar] [CrossRef] [Scilit]
- Henseler, J.; Ringle, C.M.; Sarstedt, M. A new criterion for assessing discriminant validity in variance-based structural equation modeling. J. Acad. Market Sci. 2015, 43, 115–135. [Google Scholar] [CrossRef] [Scilit]
- Taherdoost, H. Validity and Reliability of the Research Instrument; How to Test the Validation of a Questionnaire/Survey in a Research. SSRN Electron. J. 2016, 5, 3205040. [Google Scholar] [CrossRef] [Scilit]
- Mueller, R.O.; Hancock, G.R. Factor Analysis and Latent Structure Analysis: Confirmatory Factor Analysis. In International Encyclopedia of the Social & Behavioral Sciences, 2nd ed.; Wright, J.D., Ed.; Elsevier: Oxford, UK, 2015; pp. 686–690. [Google Scholar] [CrossRef] [Scilit]
- Sharif-Nia, H.; She, L.; Osborne, J.; Gorgulu, O.; Fomani, F.K.; Goudarzian, A.H. Statistical concerns, invalid construct validity, and future recommendations. Nurs. Pract. Tod 2024, 11, 16–21. [Google Scholar] [CrossRef] [Scilit]
- Adamson, K.A.; Prion, S. Reliability: Measuring Internal Consistency Using Cronbach’s α. Clin. Simul. Nurs. 2013, 9, E179–E180. [Google Scholar] [CrossRef] [Scilit]
- Vaske, J.J.; Beaman, J.; Sponarski, C.C. Rethinking Internal Consistency in Cronbach’s Alpha. Leisure Sci. 2017, 39, 163–173. [Google Scholar] [CrossRef] [Scilit]
- Costantini, G.; Perugini, M. The network of conscientiousness. J. Res. Pers. 2016, 65, 68–88. [Google Scholar] [CrossRef] [Scilit]
- Epskamp, S.; Cramer, A.O.J.; Waldorp, L.J.; Schmittmann, V.D.; Borsboom, D. qgraph: Network Visualizations of Relationships in Psychometric Data. J. Stat. Softw. 2012, 48, 1–18. [Google Scholar] [CrossRef] [Scilit]
- Epskamp, S.; Borsboom, D.; Fried, E.I. Estimating psychological networks and their accuracy: A tutorial paper. Behav. Res. Methods 2018, 50, 195–212. [Google Scholar] [CrossRef] [Scilit]
- Buitendach, J.H.; Rothmann, S. The Validation of the Minnesota Job Satisfaction Questionnaire in Selected Organisations in South Africa. S. J. Hum. Resour. Manag. 2009, 7, 1–8. [Google Scholar] [CrossRef] [Scilit]
- Marijani, R.; Yohana, M. The validation of the Minnesota job satisfaction questionnaire (MSQ) in Tanzania: A case of Tanzania public service college. Int. J. Afr. Asian Stud. 2016, 23, 162–172. [Google Scholar]
- Al-Enezi, N.; Chowdhury, R.I.; Shah, M.A.; Al-Otabi, M. Job satisfaction of nurses with multicultural backgrounds: A questionnaire survey in Kuwait. Appl. Nurs. Res. 2009, 22, 94–100. [Google Scholar] [CrossRef] [Scilit]
- Sai Pranav, K.; Deepika, S. Relationship between job satisfaction and organizational commitment of employees working in a public undertaking: A pilot study. Int. J. Indian Psychol. 2022, 7, 214–226. [Google Scholar]
- Ueltschy, L.C.; Laroche, M.; Tamilia, R.D.; Yannopoulos, P. Cross-cultural invariance of measures of satisfaction and service quality. J. Bus Res. 2004, 57, 901–912. [Google Scholar] [CrossRef] [Scilit]
- Mihut, I.; Lungescu, D. Cultural Dimensions in the Romanian Management. Manag. Mark. 2006, 1, 5–26. [Google Scholar]
- Ahmed, S.; Islam, M.T. Validating the MSQ of Job Satisfaction in Bangladesh: A Study on the Context of Public Commercial Banks. J. Bus. Stud. 2019, 40, 35–52. [Google Scholar]
- Vaduva, S.; Igor, P.; Lîsîi, A. The Particularities of Romanian Management. In Romanian Management Theory and Practice; Springer: Berlin/Heidelberg, Germany, 2024. [Google Scholar] [CrossRef] [Scilit]
- Maier, A.; Dan, H.; Coroian, A.; Gavris, O. The impact of organizational culture on the competitiveness of organizations in the current context. In Proceedings of the 33rd IBIMA Conference, Granada, Spain, 10–11 April 2019. [Google Scholar]
- Pana, B.C.; Ciufu, N.; Ciufu, C.; Furtunescu, F.L.; Turcu-Stiolica, A.; Mazilu, L. Digital technology for health shows disparities in cancer prevention between digital health technology users and the general population in Romania. Front. Oncol. 2023, 13, 1171699. [Google Scholar] [CrossRef] [Scilit]
- She, L.; Sharif, S.P.; Nia, H.S. Psychometric Evaluation of the Chinese Version of the Modified Online Compulsive Buying Scale among Chinese Young Consumers. J. Asia-Pac. Bus. 2021, 22, 121–133. [Google Scholar] [CrossRef] [Scilit]
- Purohit, H.; Goyal, S. Validation of Minnesota Satisfaction Questionnaire: A Study of Front-Line Retail Employees. SSRN Electron. J. 2016, 2864211. [Google Scholar] [CrossRef] [Scilit]
- Ji, J.; He, B.S.; Gong, S.C.; Sheng, M.H.; Ruan, X.W. Network analysis of occupational stress and job satisfaction among radiologists. Front. Public Health 2024, 12, 1411688. [Google Scholar] [CrossRef] [Scilit]
- Dokurugu, M.A.; Aninanya, G.A.; Alhassan, M.; Dowou, R.K.; Daliri, D.B. Factors influencing the level of patients’ satisfaction with mental healthcare delivery in Tamale Metropolis: A multicentre cross-sectional study. BMC Health Serv. Res. 2025, 25, 299. [Google Scholar] [CrossRef] [Scilit]
- Costantini, G.; Epskamp, S.; Borsboom, D.; Perugini, M.; Mottus, R.; Waldorp, L.J.; Cramer, A.O.J. State of the aRt personality research: A tutorial on network analysis of personality data in R. J. Res. Pers. 2015, 54, 13–29. [Google Scholar] [CrossRef] [Scilit]
- Adams, A.; Bond, S. Hospital nurses’ job satisfaction, individual and organizational characteristics. J. Adv. Nurs. 2000, 32, 536–543. [Google Scholar] [CrossRef] [Scilit]
- Beard, C.; Millner, A.J.; Forgeard, M.J.C.; Fried, E.I.; Hsu, K.J.; Treadway, M.T.; Leonard, C.V.; Kertz, S.J.; Bjögvinsson, T. Network analysis of depression and anxiety symptom relationships in a psychiatric sample. Psychol. Med. 2016, 46, 3359–3369. [Google Scholar] [CrossRef] [Scilit] [PubMed]
- Lin, L.Q.; Zhang, X.Q.; Wang, P. Interconnected Stressors and Well-being in Healthcare Professionals. Appl. Res. Qual. Life 2025, 20, 459–481. [Google Scholar] [CrossRef] [Scilit]
- Ma, G.Y.; Ma, X.Q. Network analysis of the relationship between error orientation, self-efficacy, and innovative behavior in nurses. Sci. Rep. 2025, 15, 5004. [Google Scholar] [CrossRef] [Scilit] [PubMed]
- Fornell, C.; Larcker, D.F. Evaluating Structural Equation Models with Unobservable Variables and Measurement Error. J. Mark. Res. 1981, 18, 39–50. [Google Scholar] [CrossRef] [Scilit]

Disclaimer/Publisher’s Note: The statements, opinions and data contained in all publications are solely those of the individual author(s) and contributor(s) and not of MDPI and/or the editor(s). MDPI and/or the editor(s) disclaim responsibility for any injury to people or property resulting from any ideas, methods, instructions or products referred to in the content. |
© 2025 by the authors. Licensee MDPI, Basel, Switzerland. This article is an open access article distributed under the terms and conditions of the Creative Commons Attribution (CC BY) license (https://creativecommons.org/licenses/by/4.0/).