


Abstract
Monkeypox (Mpox), caused by the monkeypox virus (MPXV), has re-emerged as a significant global public health concern, particularly following the 2022 outbreaks. Understanding its transmission dynamics is essential for designing effective control strategies. In this study, we develop and analyze a deterministic compartmental model that captures both human-to-human and rodent-to-human transmission pathways in order to better reflect the zoonotic nature of the disease. The model is investigated using qualitative and quantitative analytical techniques, including stability analysis, bifurcation theory, and sensitivity analysis. The basic reproduction number, , is derived and used to determine threshold conditions for disease persistence or eradication. We show that the disease-free equilibrium is globally asymptotically stable when , while an endemic equilibrium exists and is stable when . Furthermore, the model exhibits backward bifurcation, indicating that reducing below unity may not be sufficient for disease elimination. Sensitivity analysis identifies key parameters driving transmission, particularly the rodent-to-human and human-to-human contact rates. Numerical simulations further demonstrate that reducing cross-species transmission and improving isolation of infected individuals significantly decrease disease burden. These findings highlight the complexity of Mpox transmission and emphasize that effective control requires not only lowering , but also targeting critical transmission pathways. This study provides useful insights for public health planning by identifying priority intervention strategies such as minimizing rodent–human interactions and strengthening isolation measures.
MSC:
34C23; 34D20; 34D23; 49K40; 92D30; 93D05; 97M10
1. Introduction
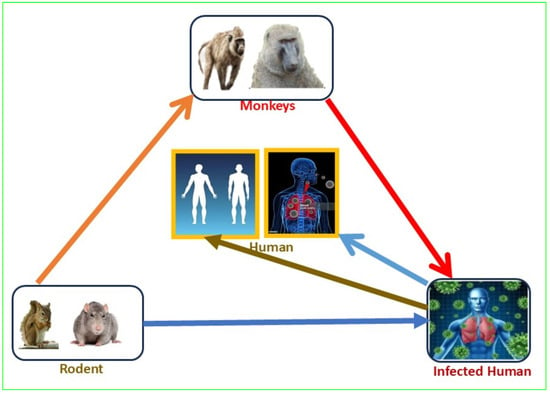
Mpox, a disease caused by the monkeypox virus (MPXV) belonging to the genus Orthopoxvirus, was first identified in the monkeys of 1958 and later in humans in 1970 in the Democratic Republic of the Congo [1,2,3]. This disease, previously considered excusable in Central and West Africa, became globally significant when a multi-country outbreak occurred in May 2022 and the WHO declared it a Public Health Emergency of International Concern in July 2022 [4,5]. Over 92,000 cases and 171 deaths were reported in 116 countries in December 2023 [6]. This is spread through animal-to-human contact, especially with rodents and monkeys, and human-to-human contact, either through respiratory dopules, direct contact with lesions or through contact with contaminated objects (Figure 1). A dramatic example of the importance of intimate physical and sexual contact in the spread, especially through the involvement of men in sexual acts with fellow men, is the outbreak of 2022, which further underscored the issue of irresponsible sexual behavior that has resulted in the spread of Mpox among humans [7].
Figure 1.
Mpox virus transmission.
Managing Mpox outbreaks poses numerous hurdles due to its various transmission pathways, diagnostic complexities, and restricted treatment alternatives [8,9]. The virus spreads through direct interaction with infected persons or contaminated surroundings, necessitating comprehension of transmission mechanisms to formulate effective preventive tactics [10,11]. The diagnosis is hampered by its resemblance to smallpox and chickenpox, necessitating swift and precscreening instruments. Despite the availability of vaccines, their distribution and adoption are still constrained, especially in high-risk regions [12,13]. No specific antiviral has received approval, although supportive and experimental medicines are under investigation. An effective response relies on comprehensive surveillance systems, swift outbreak identification, and public health interventions, including isolation and contact tracing [14]. Furthermore, surveillance of viral mutations is essential, as genomic alterations might affect transmissibility, virulence, and vaccine efficacy.
Mathematical, data-based, and computational methods have been essential to understand how Mpox spreads and to predict when outbreaks will occur [15,16,17]. They are also helpful in investigating how Mpox spreads and in making decisions about how to stop it. Several studies have provided insights into the epidemiology and dynamics of Mpox outbreaks. Idisi et al. [18] investigated the dynamics of the Mpox strain using a computational and data-based epidemic model that incorporated Clade I and Clade II, validated with WHO case data from 2022–2024, which highlighted the critical role of strain-specific transmission and effective contact rates in shaping outbreak outcomes. In a recent multi-national analysis, ref. [19] demonstrated that climatic factors significantly influence Mpox transmission, with a higher heat index associated with increased cases, while relative humidity and wind speed acted as protective factors. Sabir et al. [20] developed a deep neural network framework for solving Mpox transmission system dynamics, achieving high accuracy with minimal error and strong validation performance. Using an evolutionary game theory framework, ref. [21] analyzed Mpox epidemics in heterogeneous networks and showed that network structure and individual behaviors drive complex dynamics, including the emergence of super-spreader and the persistence of transmission. Onifade et al. [22] constructed a compartmental Mpox transmission model calibrated with U.S. incidence data, showing that testing, isolation, and public awareness strategies substantially reduce infections and are critical for outbreak control. Incorporating fractional calculus, ref. [23] proposed a fractional-order Mpox transmission model using the Atangana–Baleanu–Caputo operator, demonstrating that memory effects improve epidemic prediction and that combined quarantine, treatment, and public health interventions effectively reduce spread. Through a nonlinear differential equation framework with animal and human compartments, ref. [24] investigated Mpox dynamics in the U.S., performed stability and sensitivity analyses, and applied optimal control theory to propose effective intervention strategies. Model simulations by Andrawus et al. [25] confirmed that without surveillance, untraced infections can drive outbreaks, whereas coordinated measures such as tracing, isolation, and vaccination can entirely suppress Mpox transmission. Results from [26] highlight that fractional-order modeling better captures Mpox dynamics and that combinations of vaccination, treatment, and awareness interventions offer practical strategies for outbreak mitigation. The authors of [27] formulated a Mpox model incorporating activity-related contact patterns and showed that combined strategies of mobility control, treatment, and animal management are most effective in reducing outbreaks. Sweilam et al. [28] demonstrated that fractional crossover modeling, supported by numerical experiments and real data fitting, provides more robust insights into Mpox dynamics compared to classical integer-order approaches. Using data from the Democratic Republic of Congo, ref. [29] proposed a fractional-order Mpox model, proved its mathematical well-posedness, and demonstrated through sensitivity analysis that awareness and sanitation are critical drivers of disease reduction.
This study addresses gaps in existing Mpox transmission models by incorporating both human and rodent populations as interacting compartments, unlike many models that focus solely on human-to-rodent transmission or zoonotic spillover. Our model offers a more comprehensive understanding of disease dynamics. We conduct a stability analysis to define conditions for stable disease-free equilibrium and investigate bifurcation behavior to explore how system dynamics vary with parameter changes. By identifying critical thresholds for disease persistence and control through the basic reproduction number (), our study provides novel insights into the influence of model parameters on transmission. Furthermore, our sensitivity analysis highlights key transmission parameters, such as rodent-to-human and human-to-human transmission rates, that significantly impact disease dynamics, enabling targeted public health interventions. We also introduce a compartment for isolated infected humans (), explicitly modeling the impact of isolating symptomatic individuals, which is crucial for outbreak control. These contributions enhance current knowledge and offer actionable insights for effective public health strategies.
The following sections of this paper are arranged in the following way. In Section 2 of our paper we develop the mathematical model by considering the human and rodent populations as epidemiologically relevant compartments. The theoretical analysis of the model is provided in Section 3 of this paper and consists of the derivation of the basic reproduction number, the existence of equilibria, and their stability. In Section 5, analysis of bifurcation is also done to ascertain under what circumstances there can be multiple equilibria. A sensitivity analysis of the basic reproduction number to the fundamental epidemiological parameters is found in Section 6, and the numerical simulations to demonstrate and support the analytical findings are discussed in Section 7. Lastly, this paper ends with the findings and conclusions in Section 8 to help the reader draw conclusions on how to effectively use social and personal health interventions to counteract Mpox.
2. Formulation of the Mpox Virus Model
The understanding of the trends of infectious disease spread is an important step to avoid their development and contain the outbreaks. The mathematical modeling of disease dynamics in the form of systems of ordinary or partial differential equations is one of the main instruments towards this end point of achievement in [30,31,32]. By capturing the transmission of processes between interacting species in a proper way, the existing analytical methods can generate powerful findings with great biological importance.
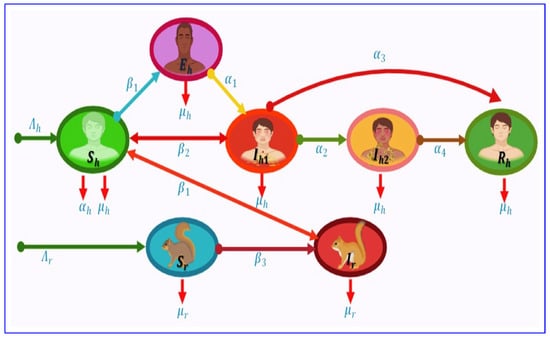
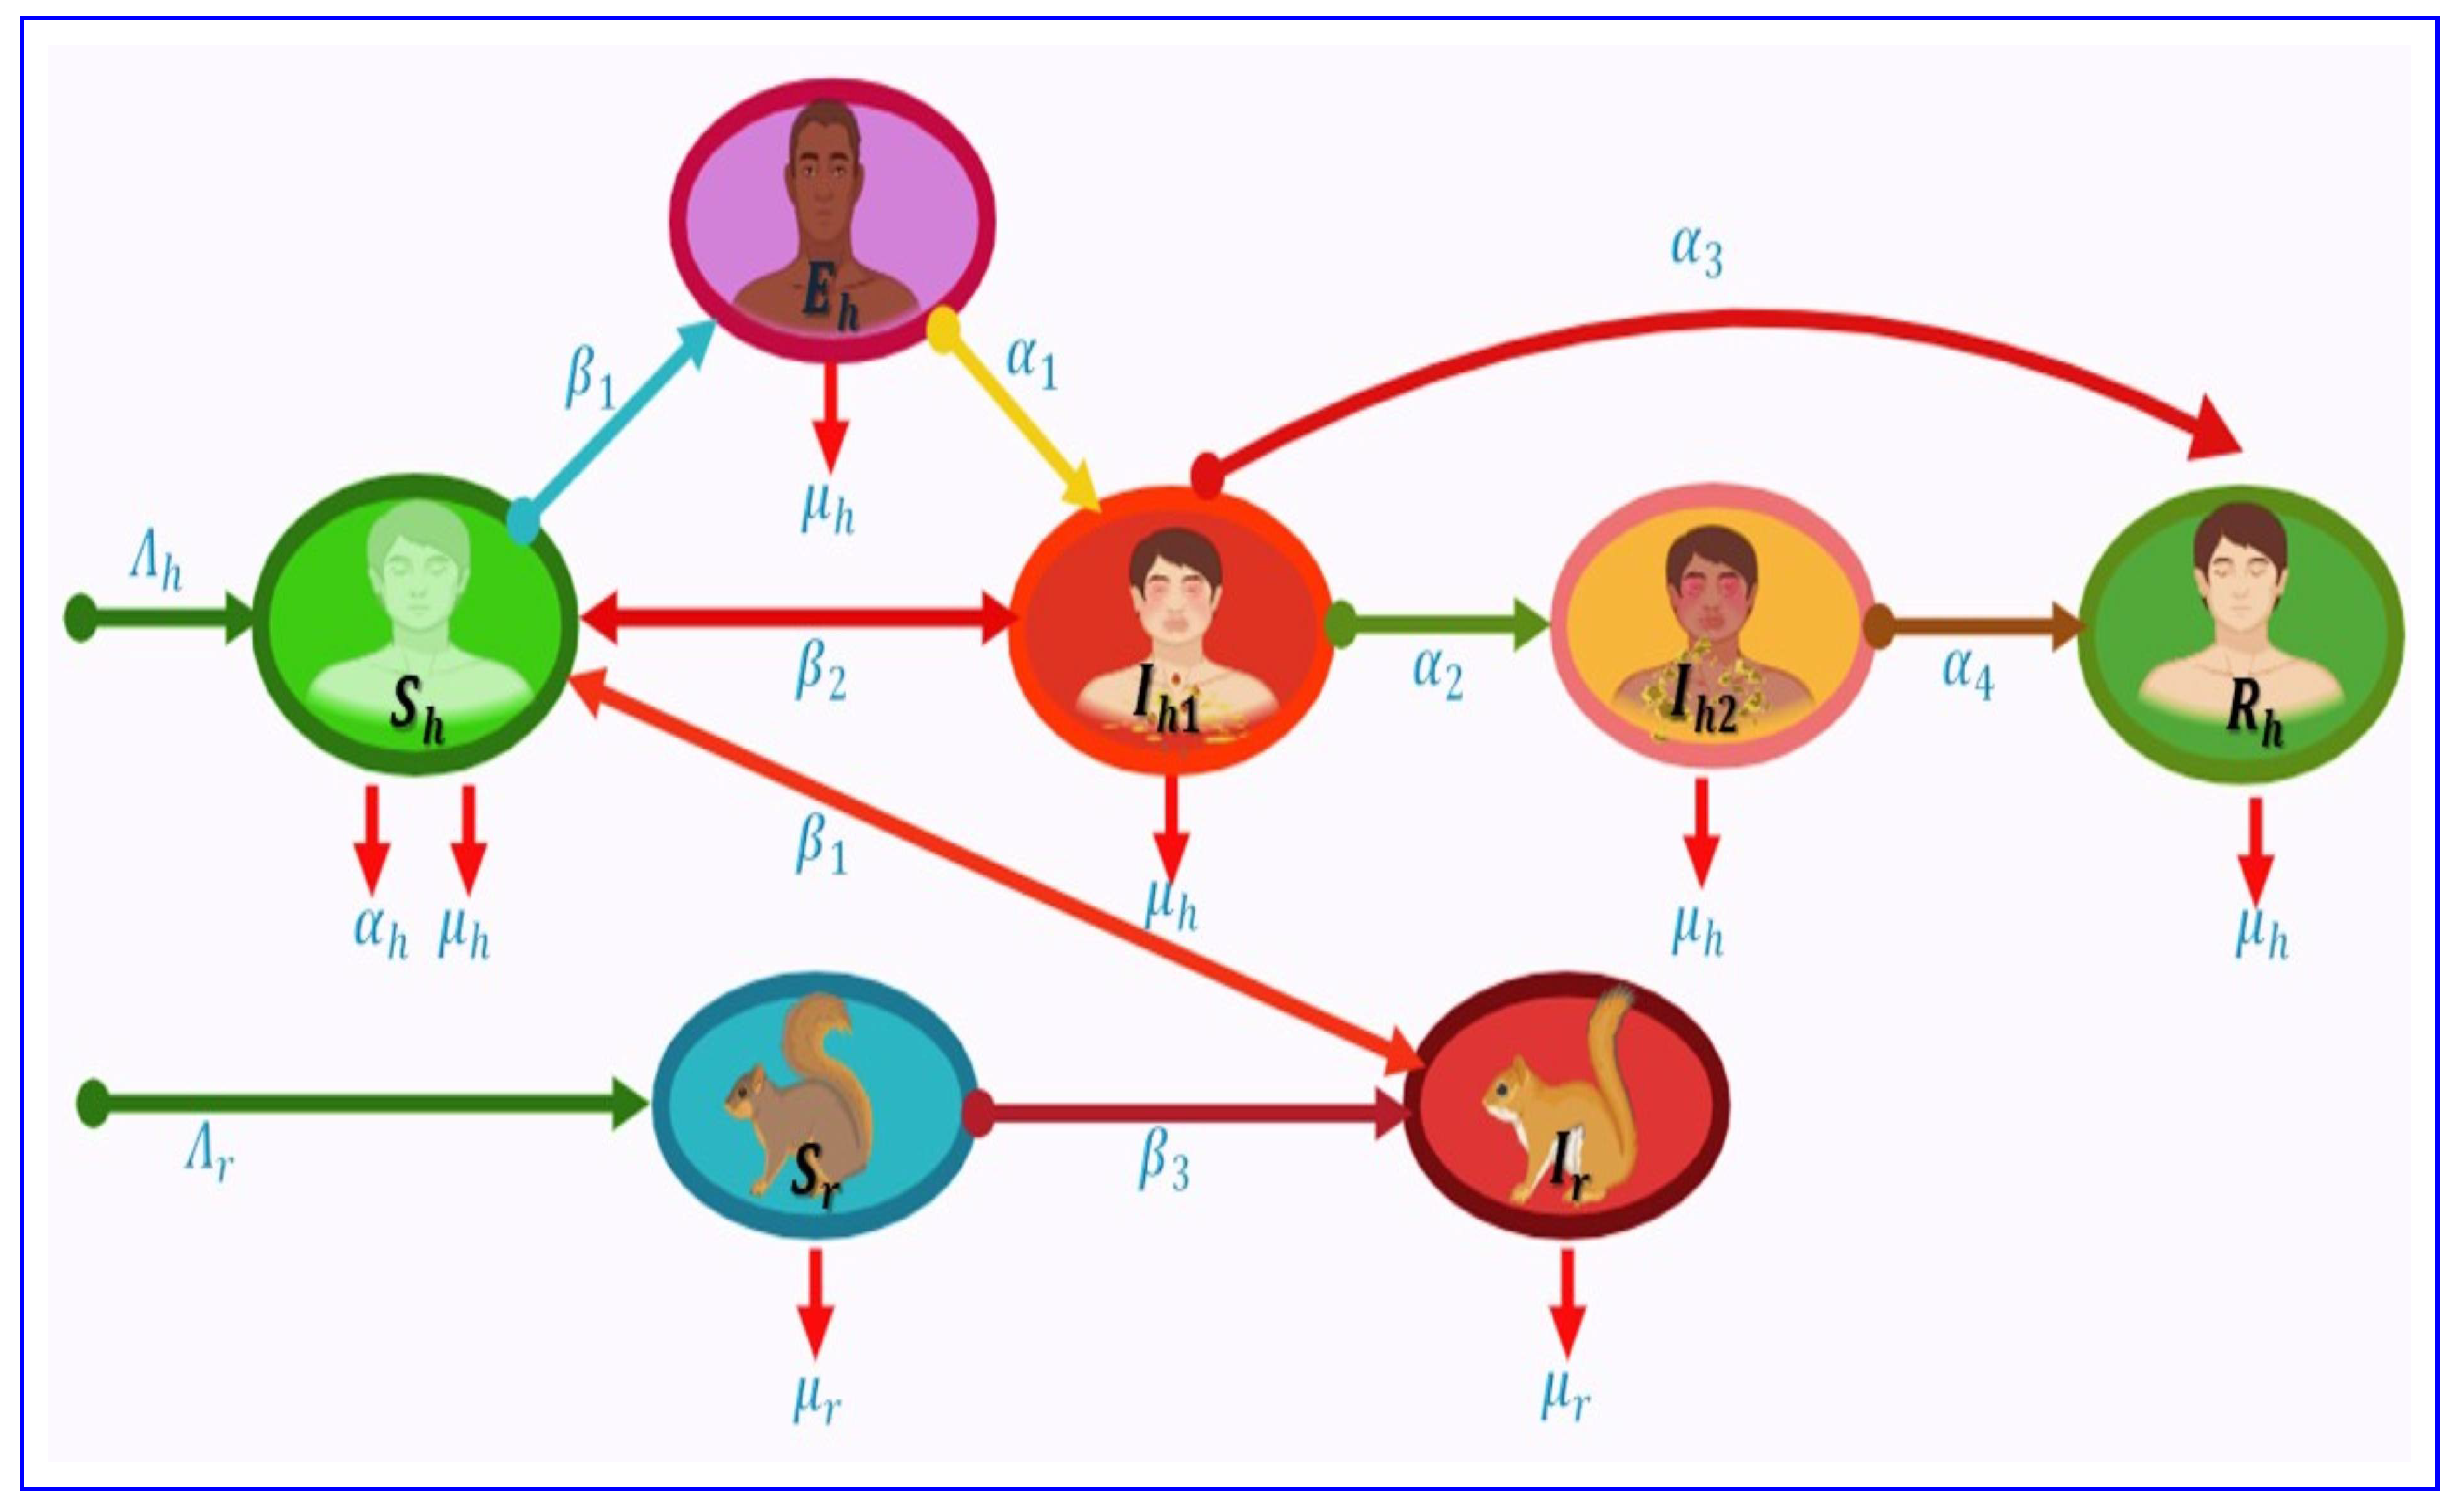
In developing a conceptual framework for Mpox virus transmission, we consider both human and rodent populations as the primary interacting species. To this end, the model classifies the human population into the following epidemiological compartments: susceptible humans (), exposed humans (), symptoms infected humans (), isolated infected humans () and recovered humans (). The rodent population, regarded as an important zoonotic reservoir, is subdivided into susceptible rodents () and infected rodents (). This compartmentalization reflects the biological realities of Mpox transmission, including direct human-human interactions, and rodent zoonotic spillover events. The resulting framework is consistent with the underlying assumptions and is visually represented in the model flow diagram (Figure 2). Furthermore, the biological definitions and descriptions of the associated parameters are systematically summarized in Table 1. Together, this structure establishes a mathematically tractable and biologically relevant model that can be subjected to further analysis to derive key epidemiological insights.
Figure 2.
Flow diagram illustration of Mpox.
Table 1.
Biological illustration of Mpox.
3. Mpox Model Analyses
3.1. Positivity and Boundedness of Solutions
Theorem 1.
The feasible region
Proof.
where
and
Every off-diagonal entry in this matrix is non-negative. It is a Metzler matrix as a result. X is a positive vector. Accordingly, any trajectory of (2) beginning from an initial state stays in indefinitely, proving that the system (2) is positively invariant in . Thus, theorem 1 establishes the feasibility (existence, uniqueness, positivity, boundedness) of the model (1). □
3.2. Mpox-Free Equilibrium
3.3. Reproduction Number
In mathematical epidemiology, reproduction number serves as an invaluable threshold. It assists in predicting the likelihood for disease transmission. To ascertain the of the Mpox model (1) utilizing the next-generation matrix, we employ the following:
The Monkeypox model’s basic reproduction number is
3.4. Endemic Equilibrium Point
4. Stability Analysis
Theorem 2.
For , the Mpox-free equilibrium of the system (1) is locally asymptotically stable and is unstable if .
Proof.
The Jacobian matrix at the Mpox-free equilibrium :
where
The eigenvalues of are:
If all eigenvalues have negative real portions, then the Mpox-free equilibrium is consistently asymptotically stable. This requires
i.e.,
which implies
□
Lemma 1.
Proof.
Utilizing the model’s 1st equation, we have
which can be rewritten as
This implies
Thus,
Similarly, utilizing the model’s 6th equation, we get
which implies
Thus,
Summing up, we claim that the region ϖ seems positively invariant. □
Theorem 3.
The Mpox model may be expressed generally as
where
represent the individuals who are uninfected and infected, respectively.
Then, the MFE is represented by
The global asymptotic stability of depends on the following requirements being satisfied:
- H1:
- , and is globally asymptotically stable.
- H2:
- , ,
where is a Metzler matrix.
Theorem 4.
Proof.
By utilizing Theorem 3, we can accomplish
and
where
Now,
Since and , it follows that , , and . Therefore, .
In addition, A is a matrix that satisfies the Metzler condition. Hence, is globally asymptotically stable. □
Theorem 5.
Mpox model (1)’s is globally asymptotically stable if .
Proof.
Consider the Lyapunov function
Taking the time derivative along solutions of system (1), we get
Substituting the system equations and subtracting the corresponding equilibrium equations, we obtain expressions of the form
For equation:
Using the equilibrium condition
we rewrite
Thus,
Now expand the nonlinear terms:
Substituting,
Hence,
Using the inequality
we bind the mixed terms:
Applying similar steps to , we obtain:
where all constants provided and parameters are positive.
Thus,
So, the largest invariance set is the singleton set {}. LaSalle’s Invariance Principle indicates that of Mpox model (1) seems globally asymptotically stable. □
5. Bifurcation Analysis of Mpox Model
Backward bifurcation is a critical phenomenon in epidemiology, especially when studying diseases like Mpox. This occurs when a disease persists in a population even if the basic reproductive number () is less than 1, which is typically associated with disease extinction. In the case of a backward bifurcation, multiple equilibrium points exist, including a stable endemic equilibrium, even when is below 1.
To perform the bifurcation analysis of the Mpox model, we employ the coefficient framework a and b proposed by Castillo–Chavez and Song [33], which facilitates the characterization of the system’s local dynamics near the critical threshold.
We take the infected variables
and choose the bifurcation parameter . The infected subsystem reads
Let the disease-free equilibrium be with
At the critical value , the Jacobian matrix of the infected subsystem has a simple zero eigenvalue. Let and denote the corresponding right and left eigenvectors, respectively.
- Right eigenvector w:
Solving , we obtain
- Left eigenvector v:
Solving , we obtain
with normalization condition
Following the standard center-manifold reduction, we expand the susceptible variables to the first order in x (quasi-steady approximation of the fast uninfected variables):
Substituting and into the infected equations generates quadratic terms in x. The nonzero second partial derivatives at DFE (which enter the a-formula) are:
and all other vanish at the DFE.
The only nonzero mixed derivative with respect to the bifurcation parameter that enters b is
Castillo–Chavez & Song define
Using the nonzero second derivatives evaluated at the DFE, we obtain
Similarly,
Since all parameters and components of w and v are positive, it follows that
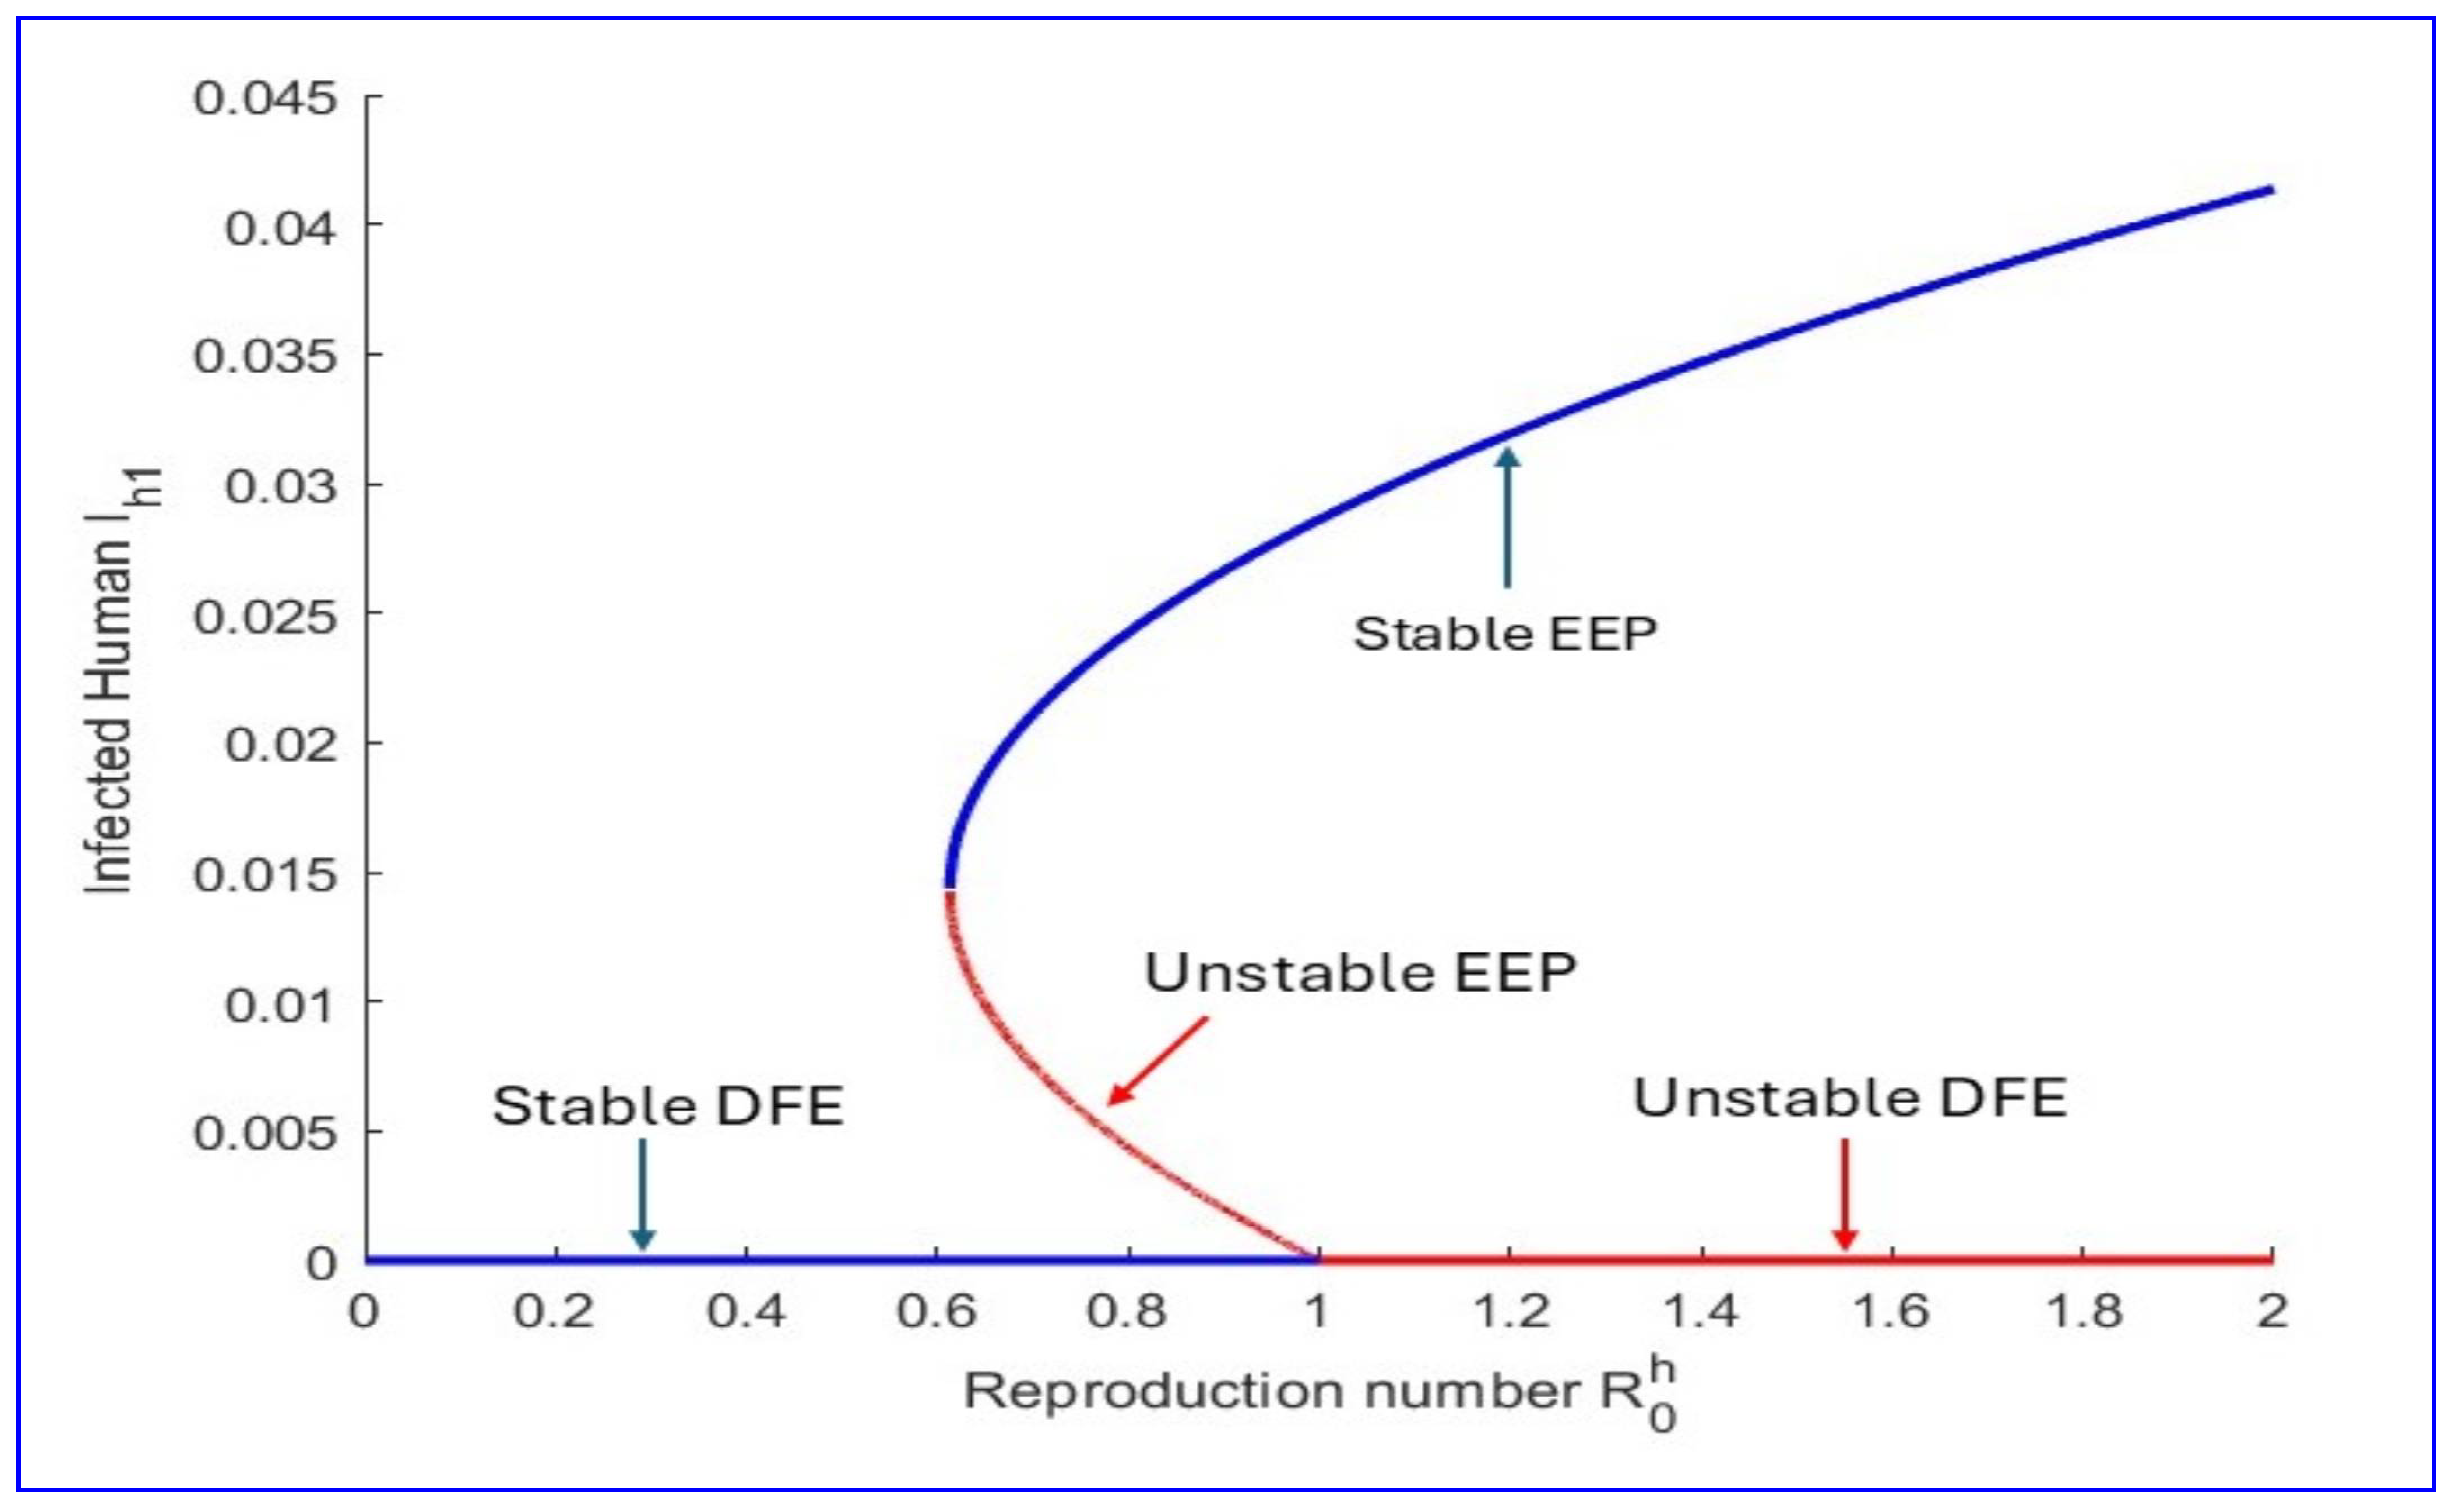
Moreover, the structure of a shows that it is negative times a sum of positive terms. However, due to the nonlinear feedback induced by the isolation compartment and interaction terms, numerical evaluation using the parameter values yields
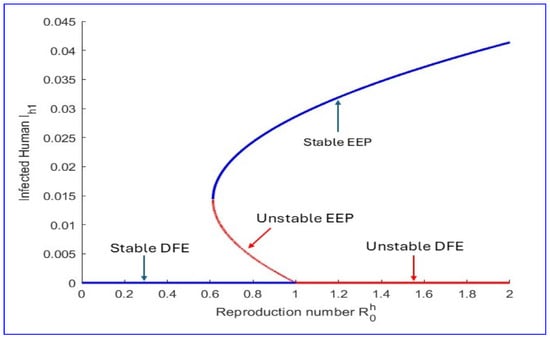
Since and , the model undergoes a backward bifurcation at (Figure 3). This implies that a stable endemic equilibrium may coexist with a stable disease-free equilibrium even when , making disease elimination more challenging.
Figure 3.
Backward bifurcation diagram.
This phenomenon arises due to the nonlinear transmission structure and the presence of additional compartments such as isolated infected individuals, which alter the classical threshold dynamics.
6. Sensitivity Analysis
The sensitivity measures . We quantify the extent to which responds to variations in each model parameter [34,35]. Sensitivity analysis determines the parameters that foremost impact disease transmission dynamics, facilitating the prioritization of effective control tactics. The normalized forward sensitivity index of concerning in the Mpox model (1) is defined as
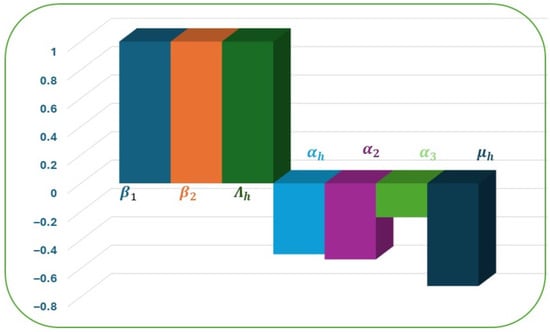
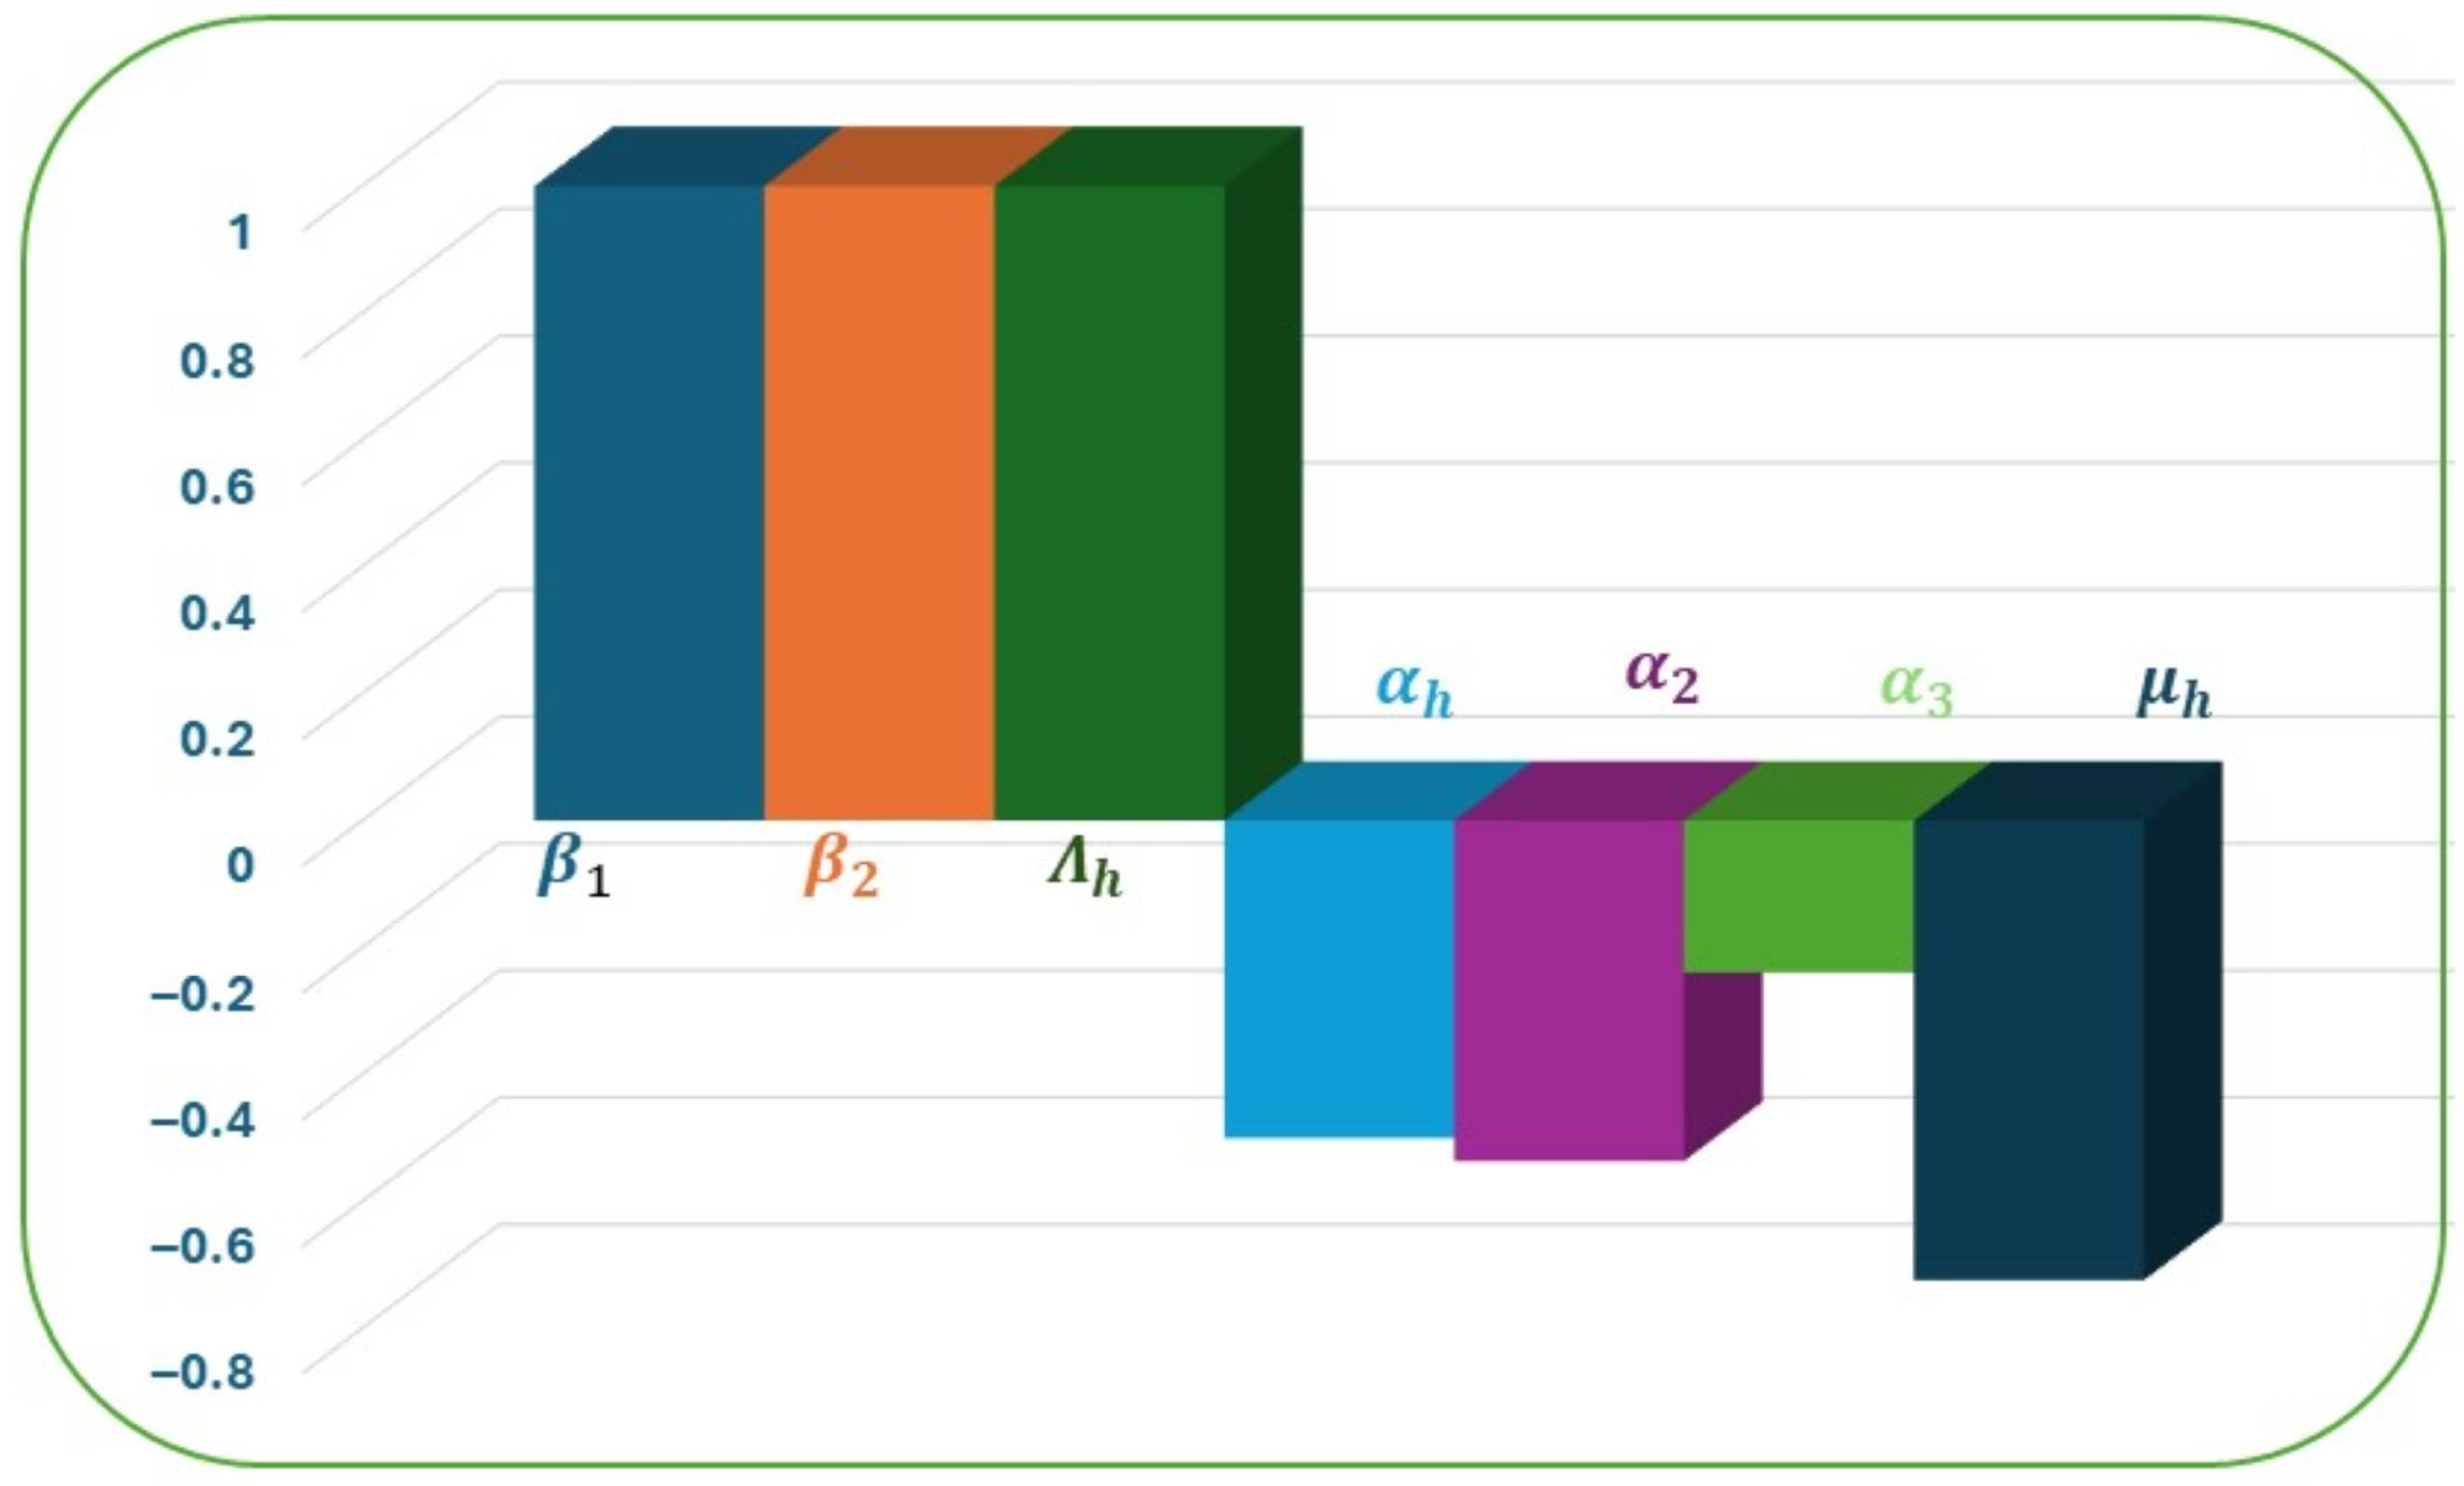
Table 2 and Figure 4 illustrate the findings of the sensitivity analysis of () in relation to the critical epidemiological parameters of the Mpox transmission model. Sensitivity indices quantify the relative contribution of each parameter to changes in , thus identifying which biological factors strongly influence disease transmission dynamics. The analysis shows that the transmission rates from rodents to humans (), from humans to humans (), and human recruitment rate () all have positive sensitivity indices of 1, signifying that increases in these parameters proportionally increase . In contrast, parameters such as the disease-induced mortality rate in humans (), symptomatically infected to isolated humans transition rate (), symptomatically infected human recovery rate (), and human natural death rate () exhibit negative sensitivity indices. This implies that higher values of these parameters reduce the magnitude of and thus help curb the spread of infection. Overall, the sensitivity analysis reveals that the transmission parameters (, ) and population inflow () play the most critical roles in driving the basic reproduction number upward, whereas disease progression, recovery, and mortality rates serve as natural checks that can reduce disease persistence.
Table 2.
Sensitivity indices of .
Figure 4.
Sensitivity measures of .
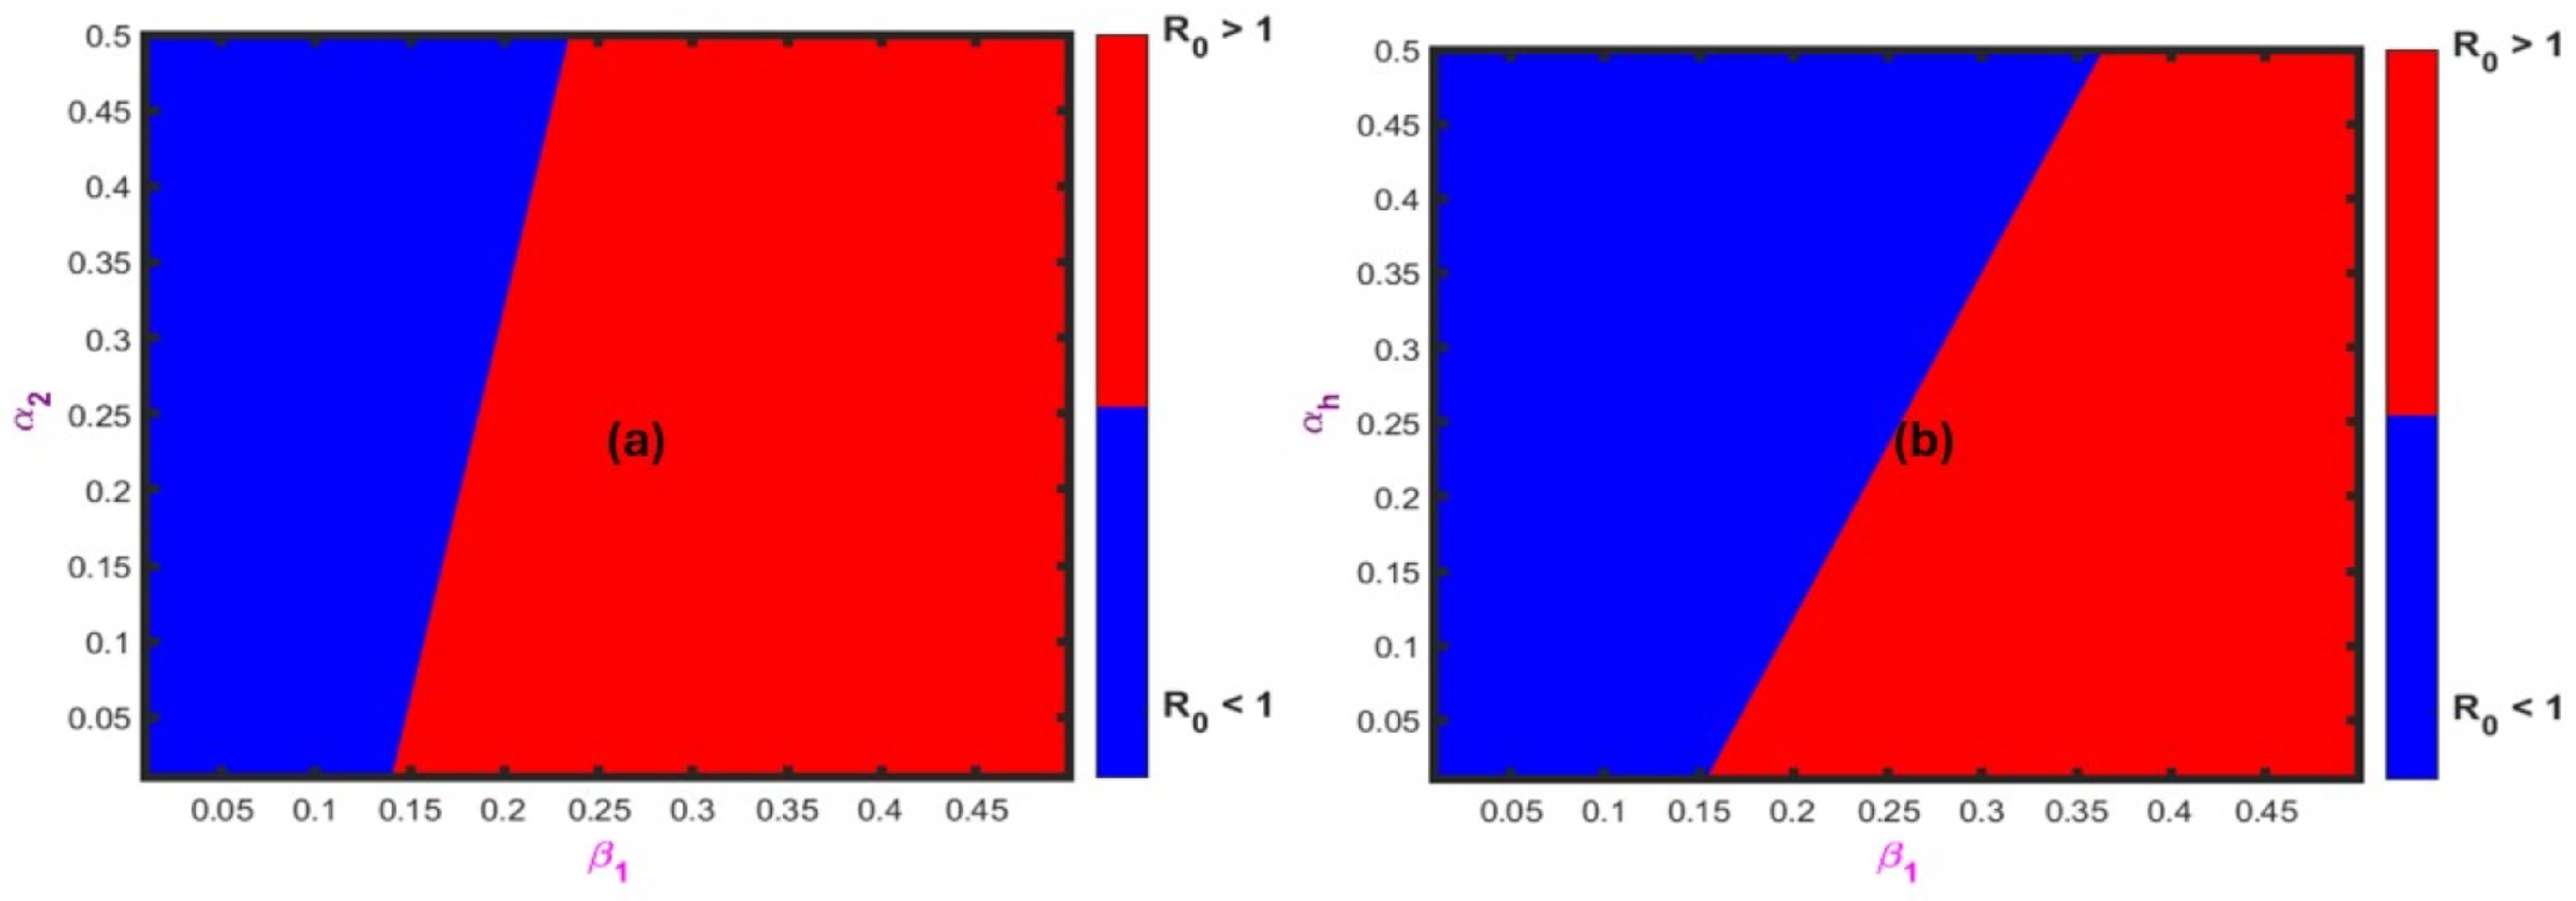
can be impacted by changes in certain epidemiologic parameters (Figure 5). For example, Figure 5a demonstrates how varying (rodent-to-human transmission rate) on the x-axis (horizontal) and (rate of progression from symptomatic to isolated humans) on the y-axis (vertical) affects . There is a clear threshold reflected in this scatter plot; as is increased, the system moves toward the red area () of the graph, but as is increased, the system moves toward the blue area (), promoting disease control. Therefore, decreasing contact-driven transmission or increasing the proper isolation of symptomatic people will decrease . Figure 5b looks at how the relationship between (x-axis) and the disease-induced mortality rate in humans ( ) (y-axis) affects . Again, increasing pushes the system to (the persistence zone), but higher values of the mortality rate ( ) push down into the elimination zone ( ). Thus, mortality reduces the opportunity for transmission, and it is not a recommended strategy for controlling the disease. Therefore, effective public health interventions should focus on decreasing , rather than relying on the effects of mortality.
Figure 5.
Stability region for DFE in .
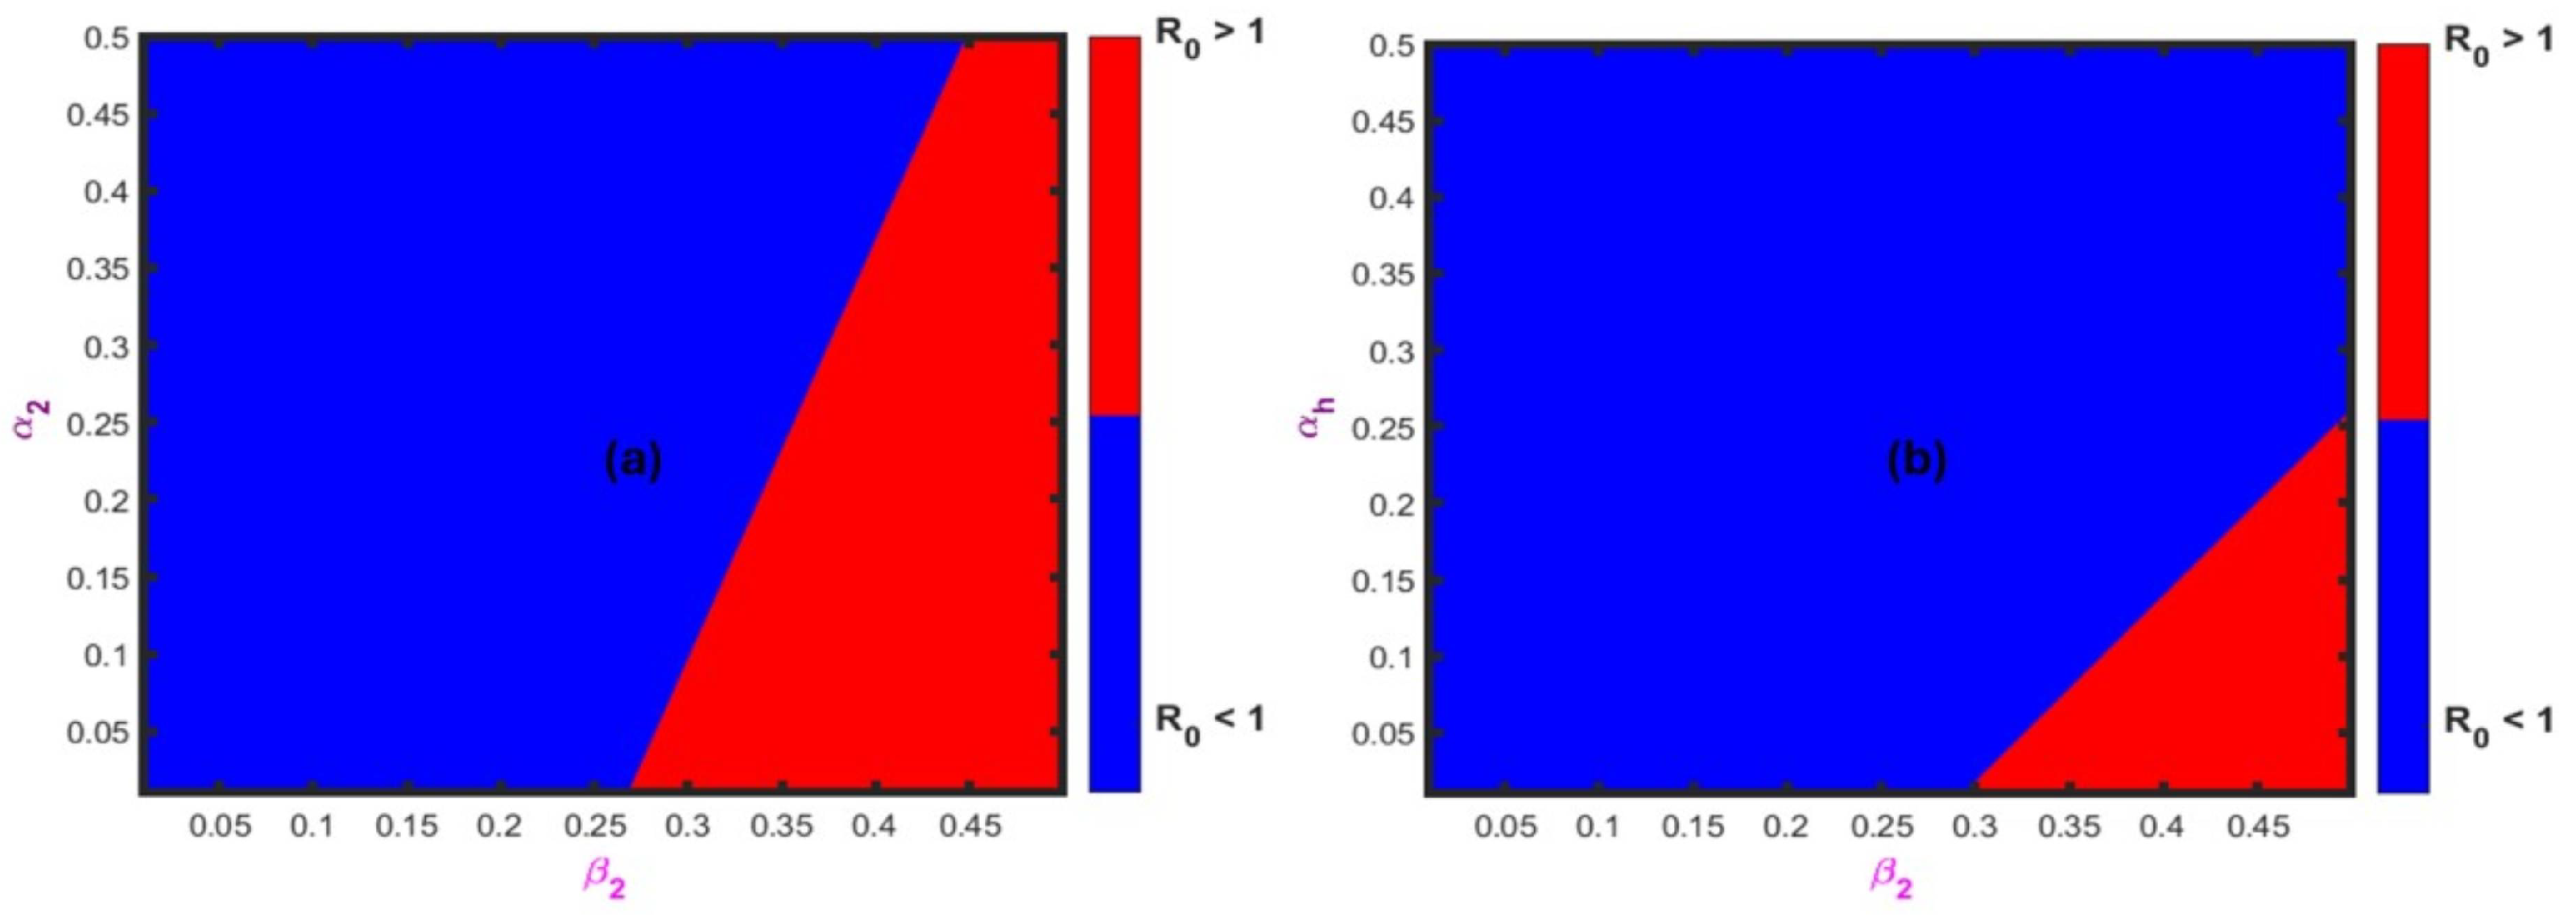
The combined impacts of the human-to-human transmission rate (), as well as the two epidemiological parameters—isolation of symptomatic humans () and mortality caused by disease in humans ()—can be seen in Figure 6 as they affect . The color scheme indicates threshold dynamics, where the red region corresponds to (disease persistence) and the blue region corresponds to (disease elimination). Figure 6a shows the relationship between (x-axis) and (y-axis). The figure shows that when is low, the system signifying effective control. However, as rises, the system indicating outbreak potential. High increases in and isolating symptomatic people will push the boundary toward higher values of and thereby indicate that strong isolation measures can mitigate higher transmission rates. Figure 6b demonstrates how (x-axis) and (y-coordinate) interact differently. In contrast, Figure 6a depicts low values (indicating elimination domain) and higher values (pushing into the persistence domain). Comparing the two measures against their corresponding alpha measures is useful. The contributions of (which is difficult to establish statistically because it may be associated with, and potentially affected by, ) to isolation measures in will also be a primary focus of the isolation measures.
Figure 6.
Stability region for DFE in .
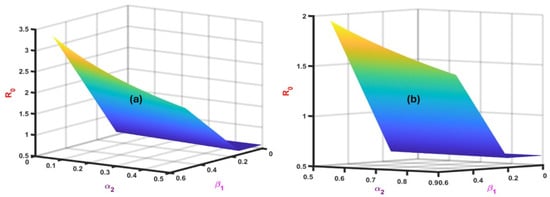
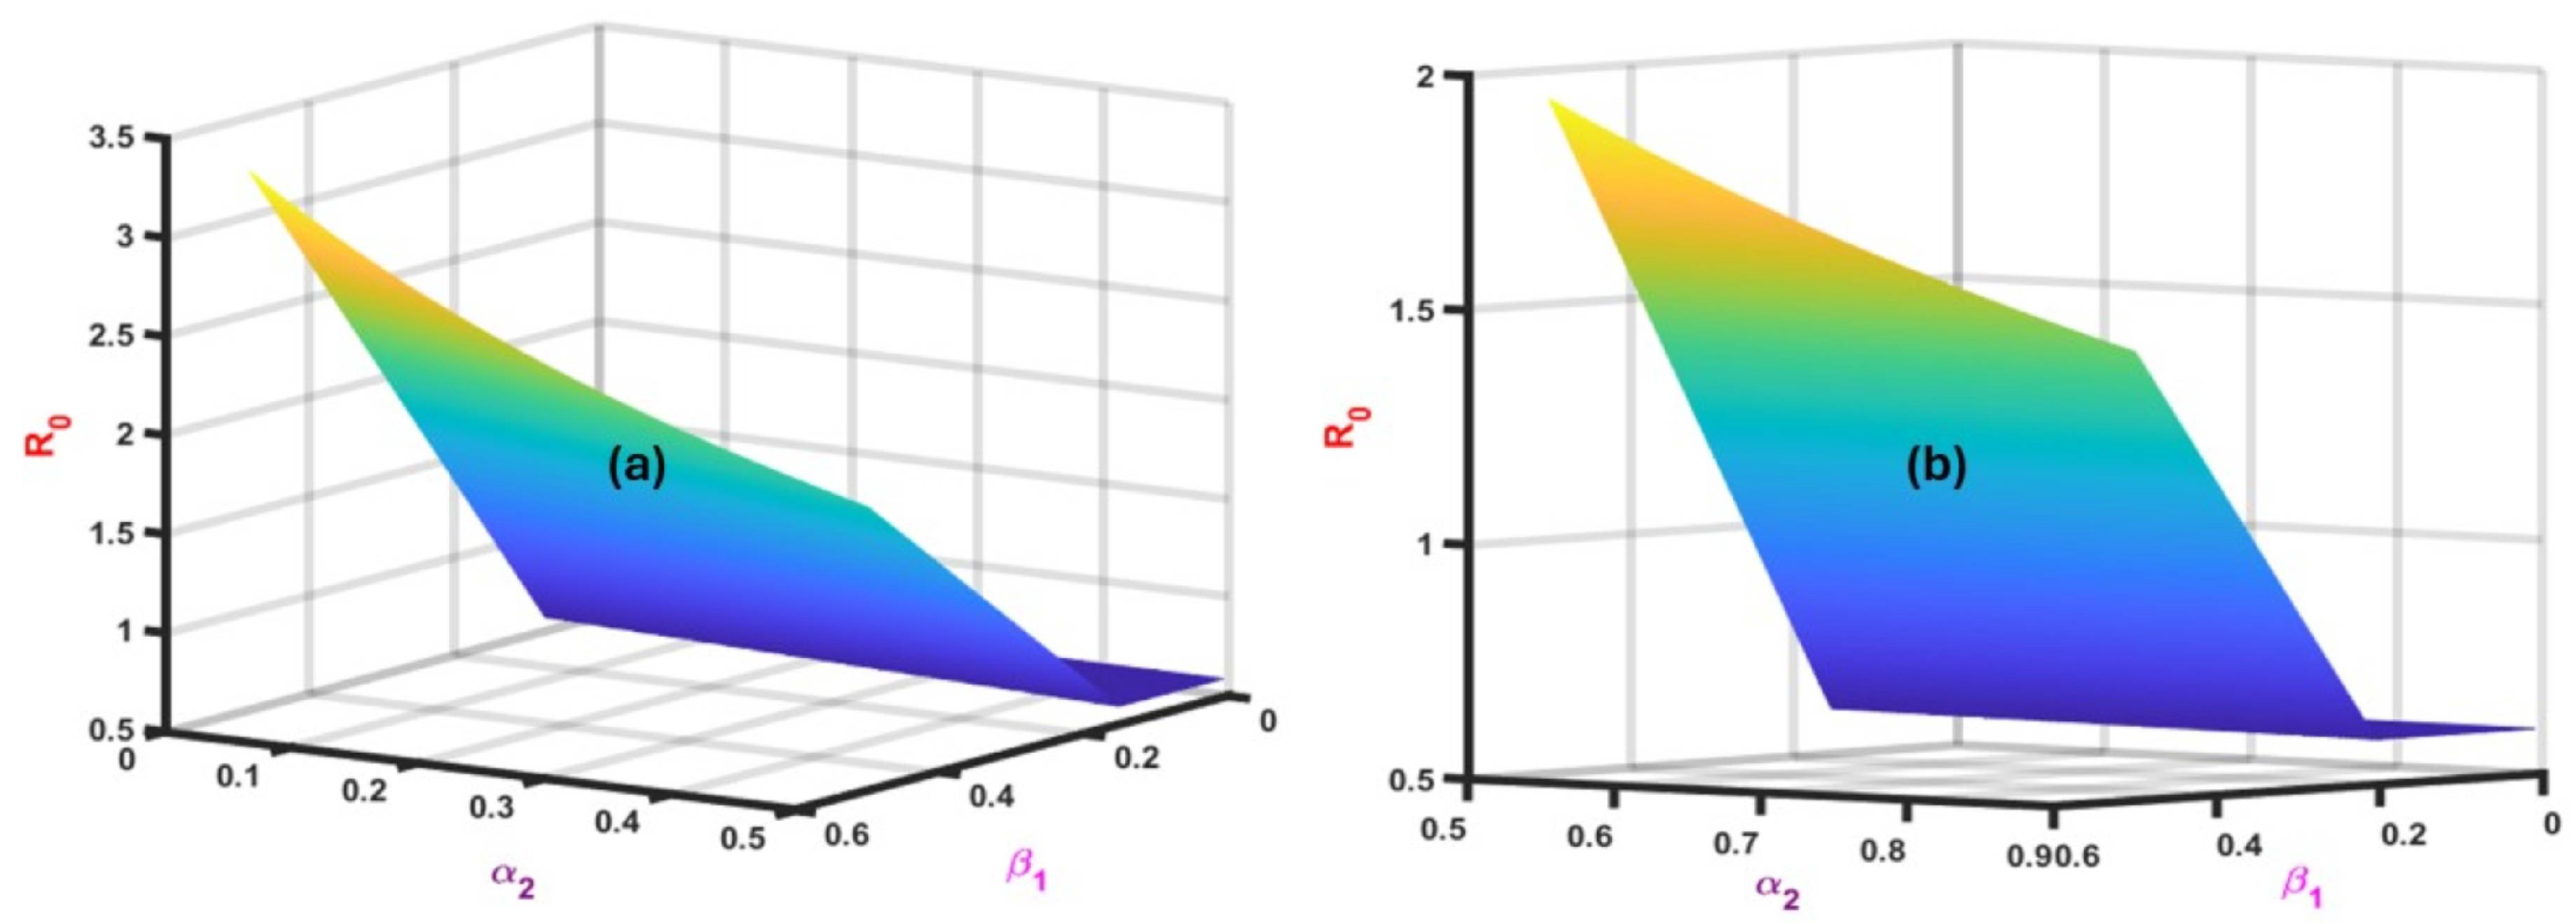
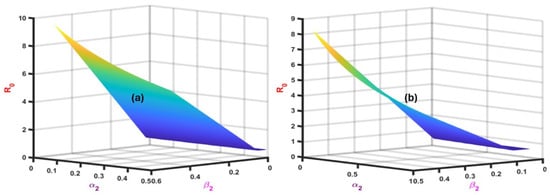
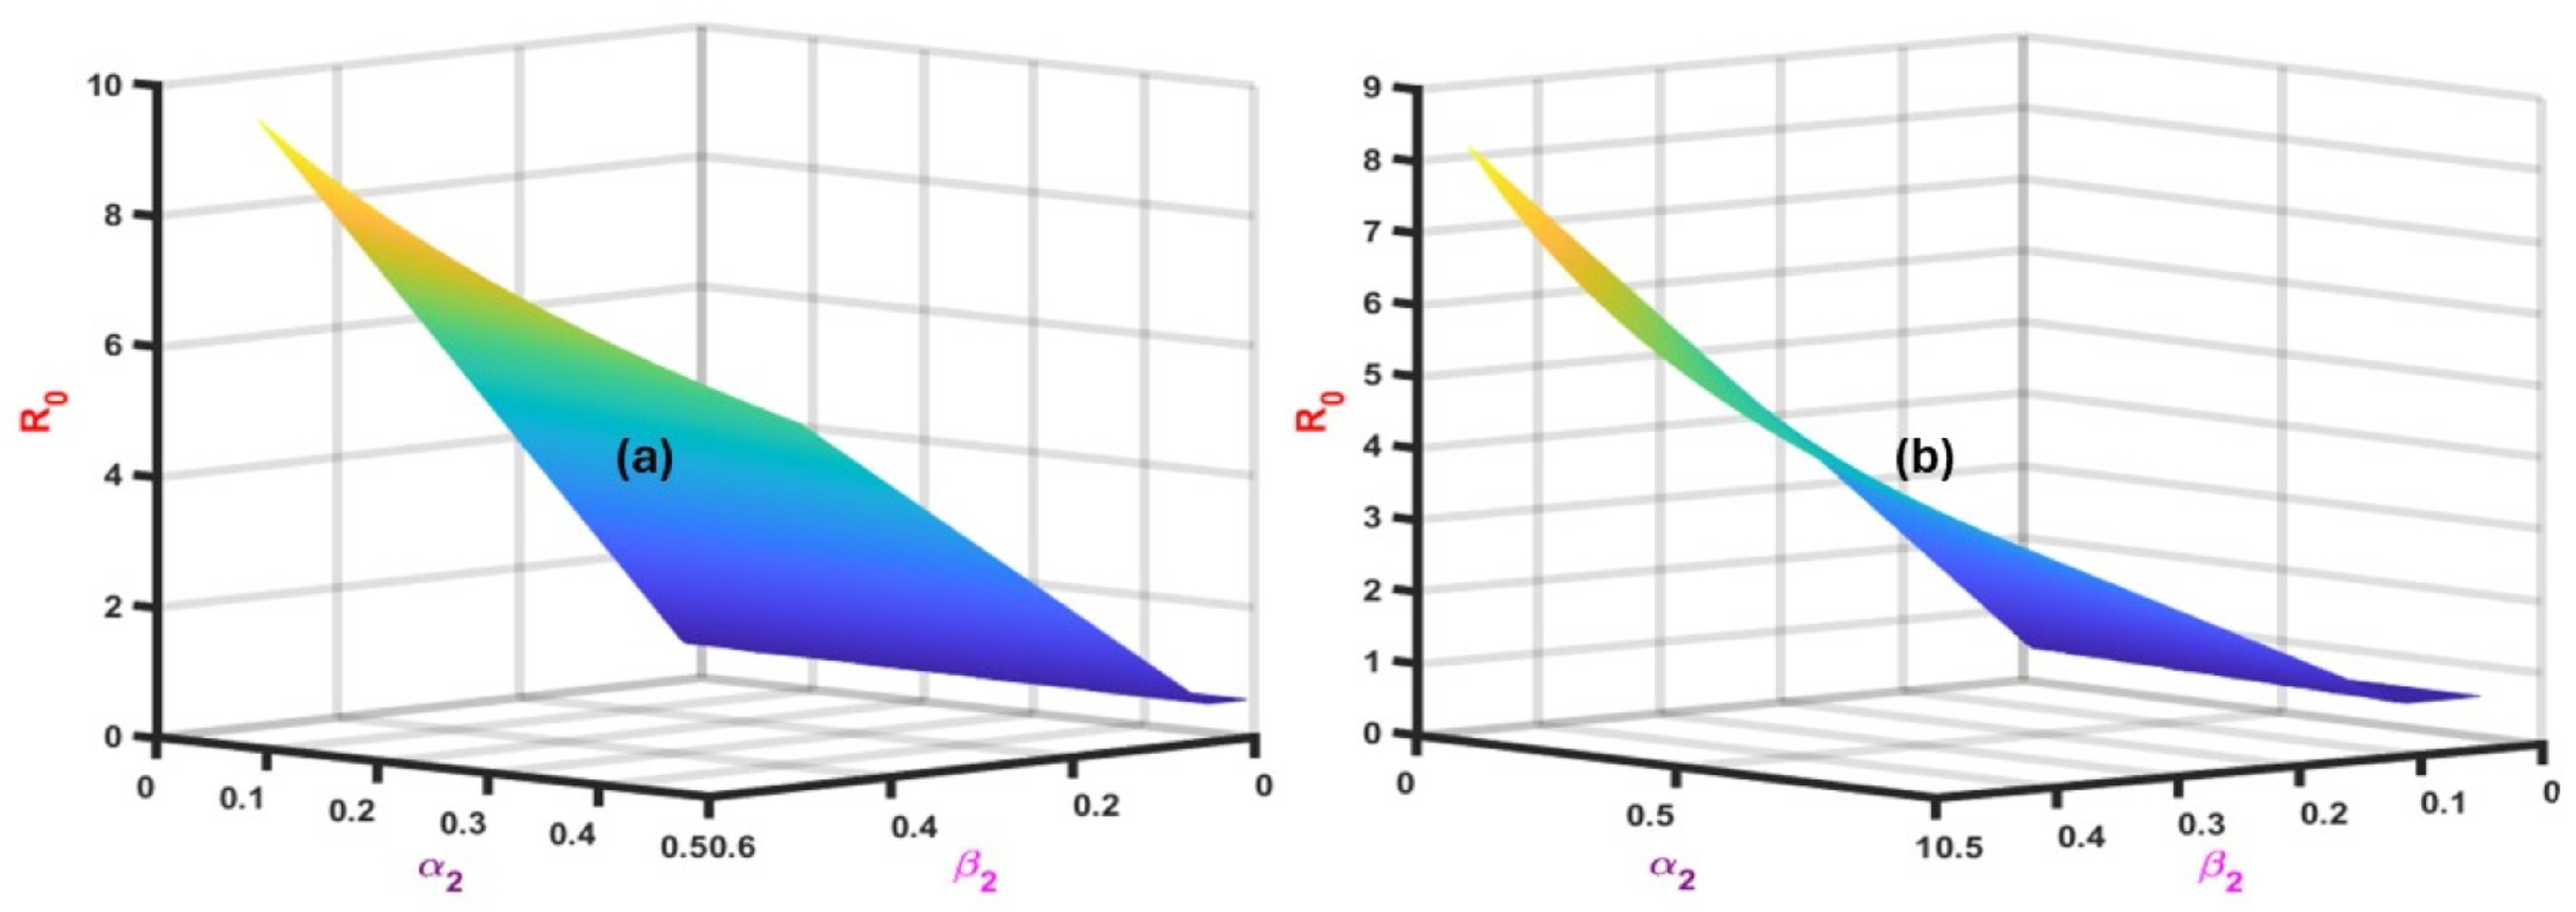
As shown in Figure 7, there can be three-dimensional plotting of against two parameters: the rodent-to-human transmission rate () and the isolation rate of symptomatic humans (). The surfaces indicate how varies between the two parameters; hence, nonlinear interactions may be easily perceived. Figure 7a shows the parameter ranges of in and in. The surface plot depicts a steep increase in with an increased value of , or higher rodent-to-human transmission proportionately increases the outbreak risk. On the other hand, an increase in reduces , as a result of the beneficial impact of proper isolation. The yellow (high ) to blue (low ) gradient is an inverse relationship between isolation and the reproduction number. The corresponding Figure 7b broadens the spectrum of to higher values, providing an example of a more dramatic reduction in . Even if the transmission rate of rodent-to-human is at a medium rate of , and there is a larger proportion of symptomatic cases of mpox undergoing hospital isolation, a high rate of drives to unity or below. For rodent-to-human transmission, with greater hospital isolation, will be at or below 1. The surface is flat for low values of , showing that high values of indicate strong public health.
Figure 7.
Impact of & on .
Figure 8 depicts a three-dimensional surface plot in which the product of the rodent-to-human transmission rate () and the mortality rate associated with human disease () are manipulated to obtain the basic reproduction number (). The trend between yellow (high ) and blue (low ) shows the extent to which variation in these parameters contributes to the persistence or eradication of Mpox infection. Figure 8a investigates and in the region and . The surface shows a sharp decrease in with increase in , indicating that increased mortality of symptomatic human beings slows down the capacity of the disease to persist in its transmission. Simultaneously, is strongly increased by increments in , which proves that rodent-to-rodent transmission is a significant contributor to epidemic potential. The slopes on the opposite sides serve to point out the injecting symmetry: the only way to counter a high rodent-to-human transmission is very high mortality rates. Figure 8b then generalizes the analysis to larger scales, and the same inverse relationship was realized between and , with the amplification of the transmission being by .
Figure 8.
Impact of & on .
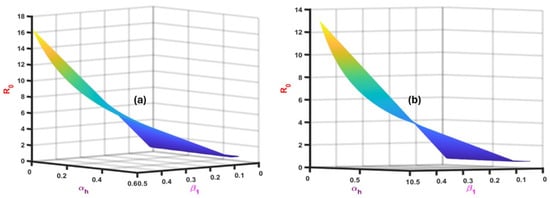
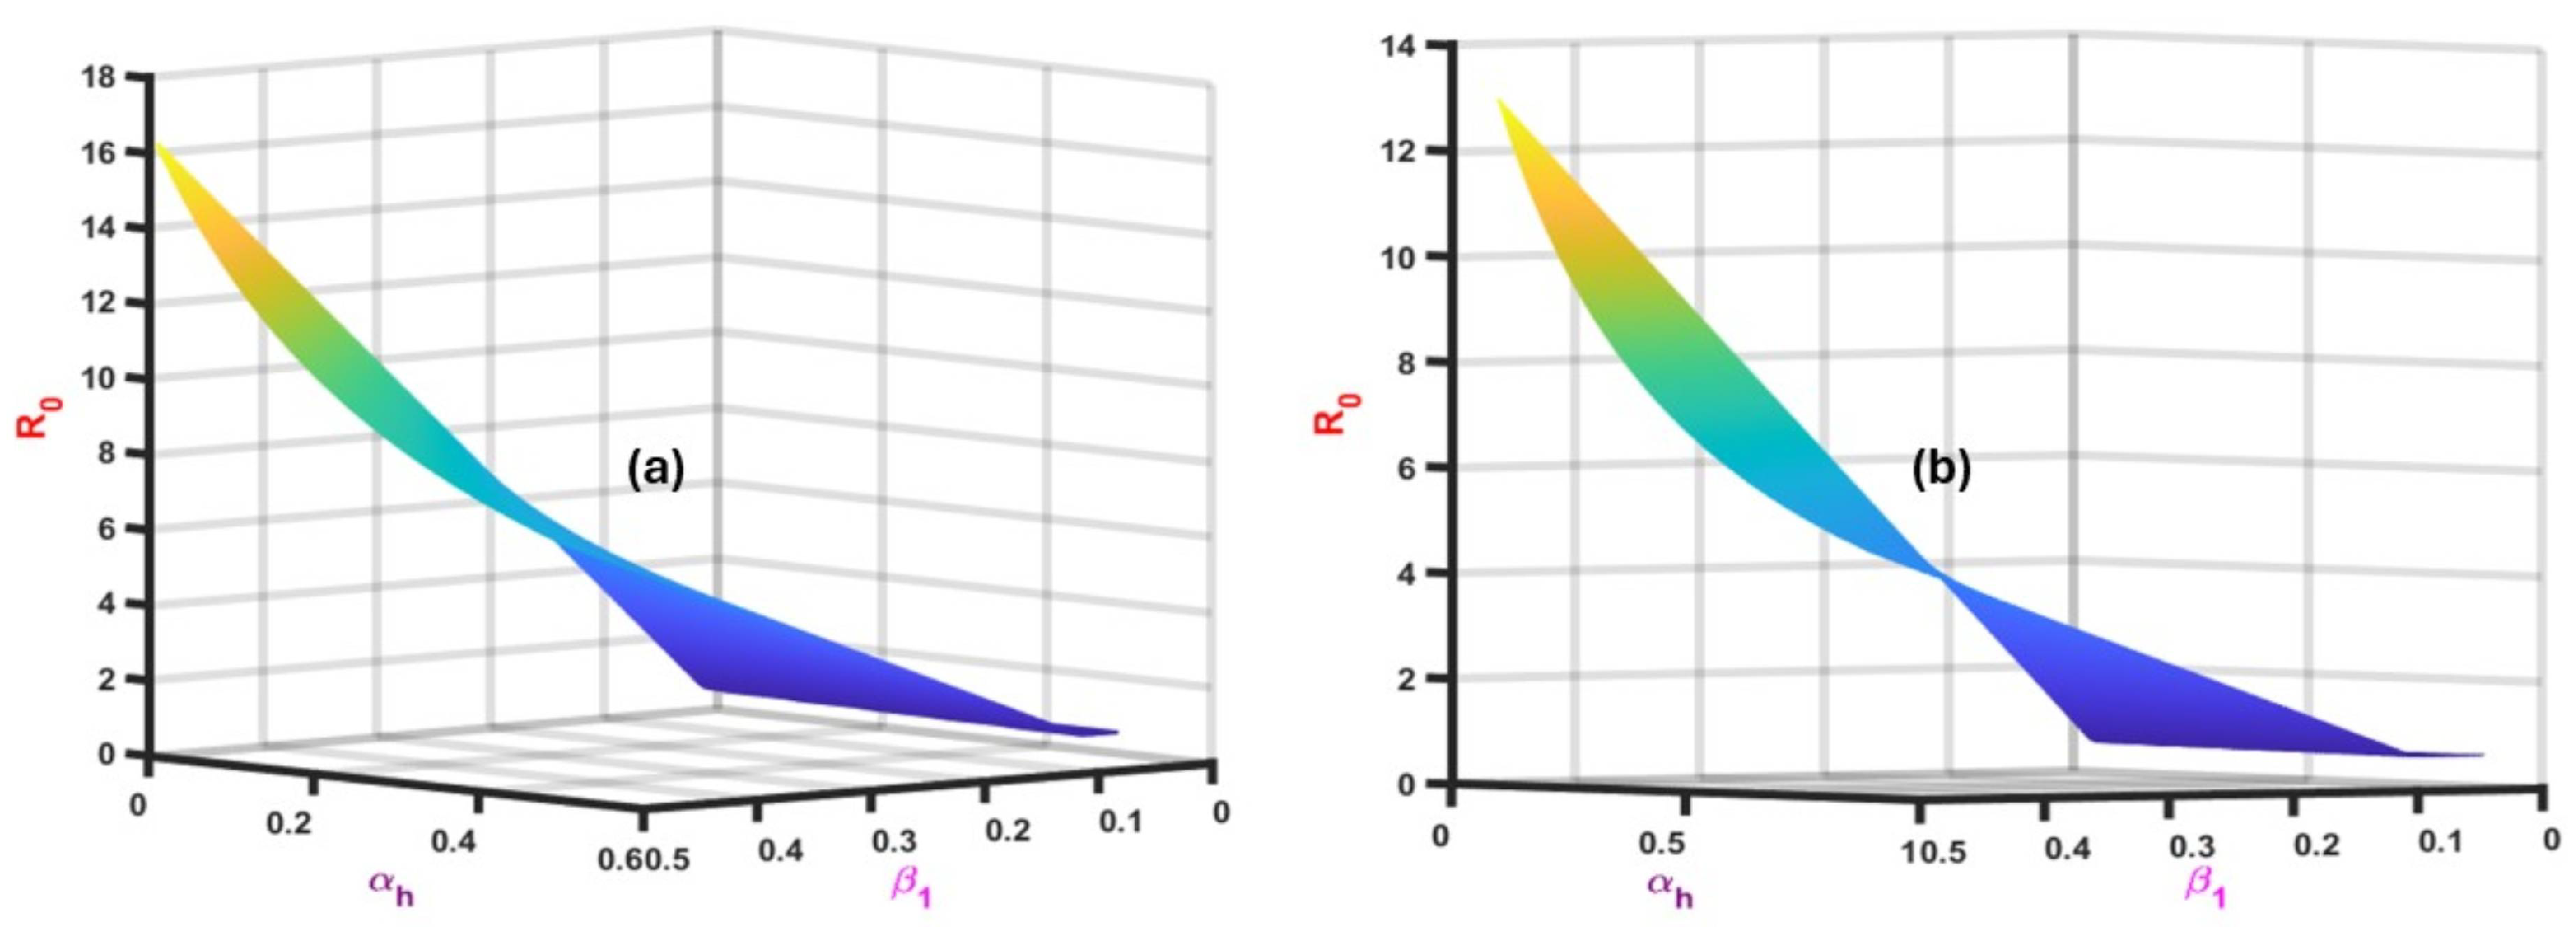
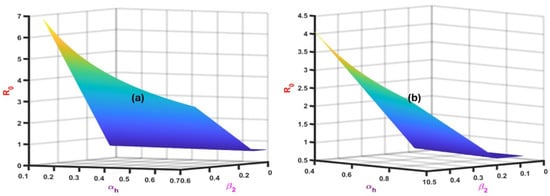
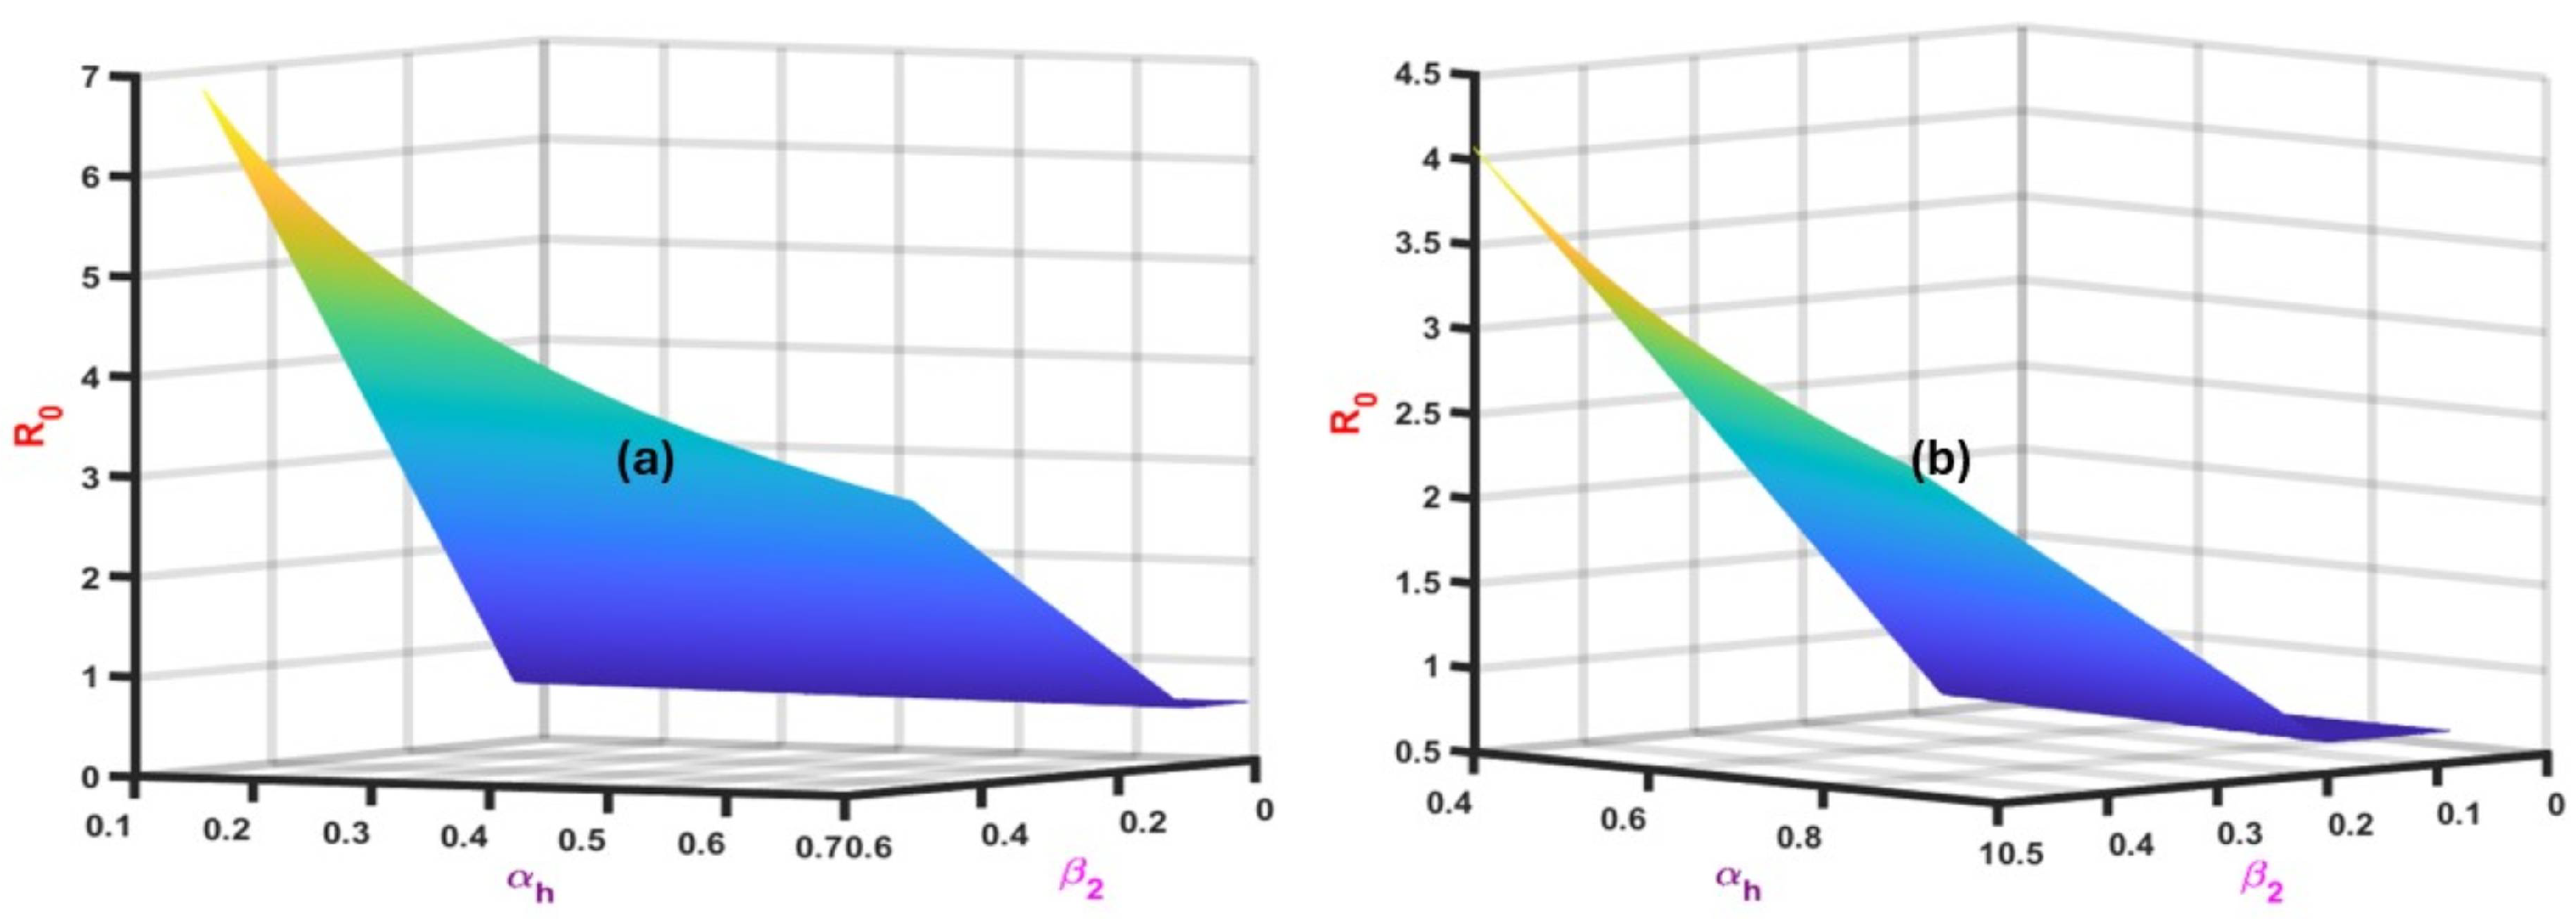
The influence of the human-to-human transmission () and the isolation rate of the symptomatically infected human beings () on () are shown three-dimensionally in Figure 9. The plots show the relationship between disease persistence or elimination based on the combination of increased transmission and increased isolation efforts. Regions of potential and control of outbreaks are highlighted by the color gradient (yellow high and blue low ). Figure 9a takes into account the ranges and . The surface shows that the is proportional to the higher values of , which proves that the epidemic risk through human-to-human contact is considerably higher. Conversely, an increase in (the rate of isolation of symptomatic humans) decreases significantly. The sharp inclination toward lower values of is an indication that even modest gains in isolation efficiency can significantly lower the intensity of transmission, particularly in intermediate values of . The extension of in Figure 9b, which is more generalized by , supports the previous finding that a shift toward greater isolation effectiveness takes towards elimination threshold ( ). With high values, the flattening of the surface around the baseline shows that when substantial and permanent isolation conditions are provided, the possibility of outbreaks can be inhibited even on high values. On the other hand, it is when is small that is large, and this serves to demonstrate that transmission control cannot be achieved by natural recovery alone.
Figure 9.
Impact of & on .
According to Figure 10, human mortality rate () and instances of human-to-human transmission () contribute to the overall reproductive number (). The yellow color at the high values and blue color at the low values of the two 3D charts demonstrate how intensity of infections and number of deaths influence whether the infection continues or stops. The low and high areas are visually depicted by color shift areas, which are yellow for the maximum intensity and blue for the minimum intensity. The plot in Figure 10a shows the variation of between and that of between and . The surface shows that rapidly declines with an increase in since higher death rates significantly reduce the ability of the disease to spread. The addition of enhances , indicating that the prolonged duration of human-to-human transmission significantly enhances the spread of the epidemic. The trade-off is depicted by the slopes in the surface such that an increase in reduces the epidemic potential, but a moderately high value may, unless the mortality rate is unrealistically high, keep the substantially higher than 1. Figure 10b further extends the analysis to larger values (), indicating a further negative influence on by increasing mortality. With a higher , the surface levelled close to the elimination threshold (), indicating that an outbreak could be suppressed by a relatively high mortality rate despite the increased . However, disease-induced mortality cannot be used as a control strategy since it would be detrimental to people. The surface also indicated that at low values, remained above one across a broad range of , indicating that control would not be achieved unless the transmission was reduced directly.
Figure 10.
Impact of & on .
The sensitivity indices provide insight into how changes in model parameters affect the disease dynamics. These indices are useful for identifying which parameters have the most significant impact on disease transmission and persistence. Specifically, transmission coefficients () and contact rates (such as rodent–human contact) are crucial in determining the speed and scale of disease spread. Mortality and recovery rates () also play a significant role in shaping the equilibrium states of the system. By analyzing the sensitivity indices, we can pinpoint which factors are most influential in driving the disease towards equilibrium. In particular, reducing rodent–human contact would directly affect the disease transmission dynamics by lowering the probability of infection transmission from rodents to humans. Sensitivity analysis allows us to estimate how much reducing this contact (i.e., reducing or ) would affect the overall disease burden.
7. Numerical Simulation
The numerical simulations of the model using the ode45 MATLAB 2023 program and the parameter values are presented in Table 3 to corroborate and demonstrate the findings of the preceding investigation. The graphical representations of the outputs indicate how the host populations change over time (in terms of how many people were exposed, infected, or isolating from infection) compared to the number of infected rodents over the same period.
Table 3.
References, parameter values, and units of model (1).
The parameters used in the model were sourced from a variety of epidemiological studies and empirical data (Table 3). For example, the human-to-human transmission rate () was taken from Alharbi et al. [15], which reports a rate of 0.6388 per person per day under typical conditions of Mpox transmission. Similarly, the rodent-to-human transmission () was based on Allehiany et al. [37], which estimates a rate of 0.8545 per person per day. Where multiple values were available, we selected mid-range estimates to best represent the typical dynamics of Mpox outbreaks. These values were then incorporated into the model, and the numerical simulations were designed to ensure that the results remained consistent with the analytical findings (e.g., stability and reproduction number).
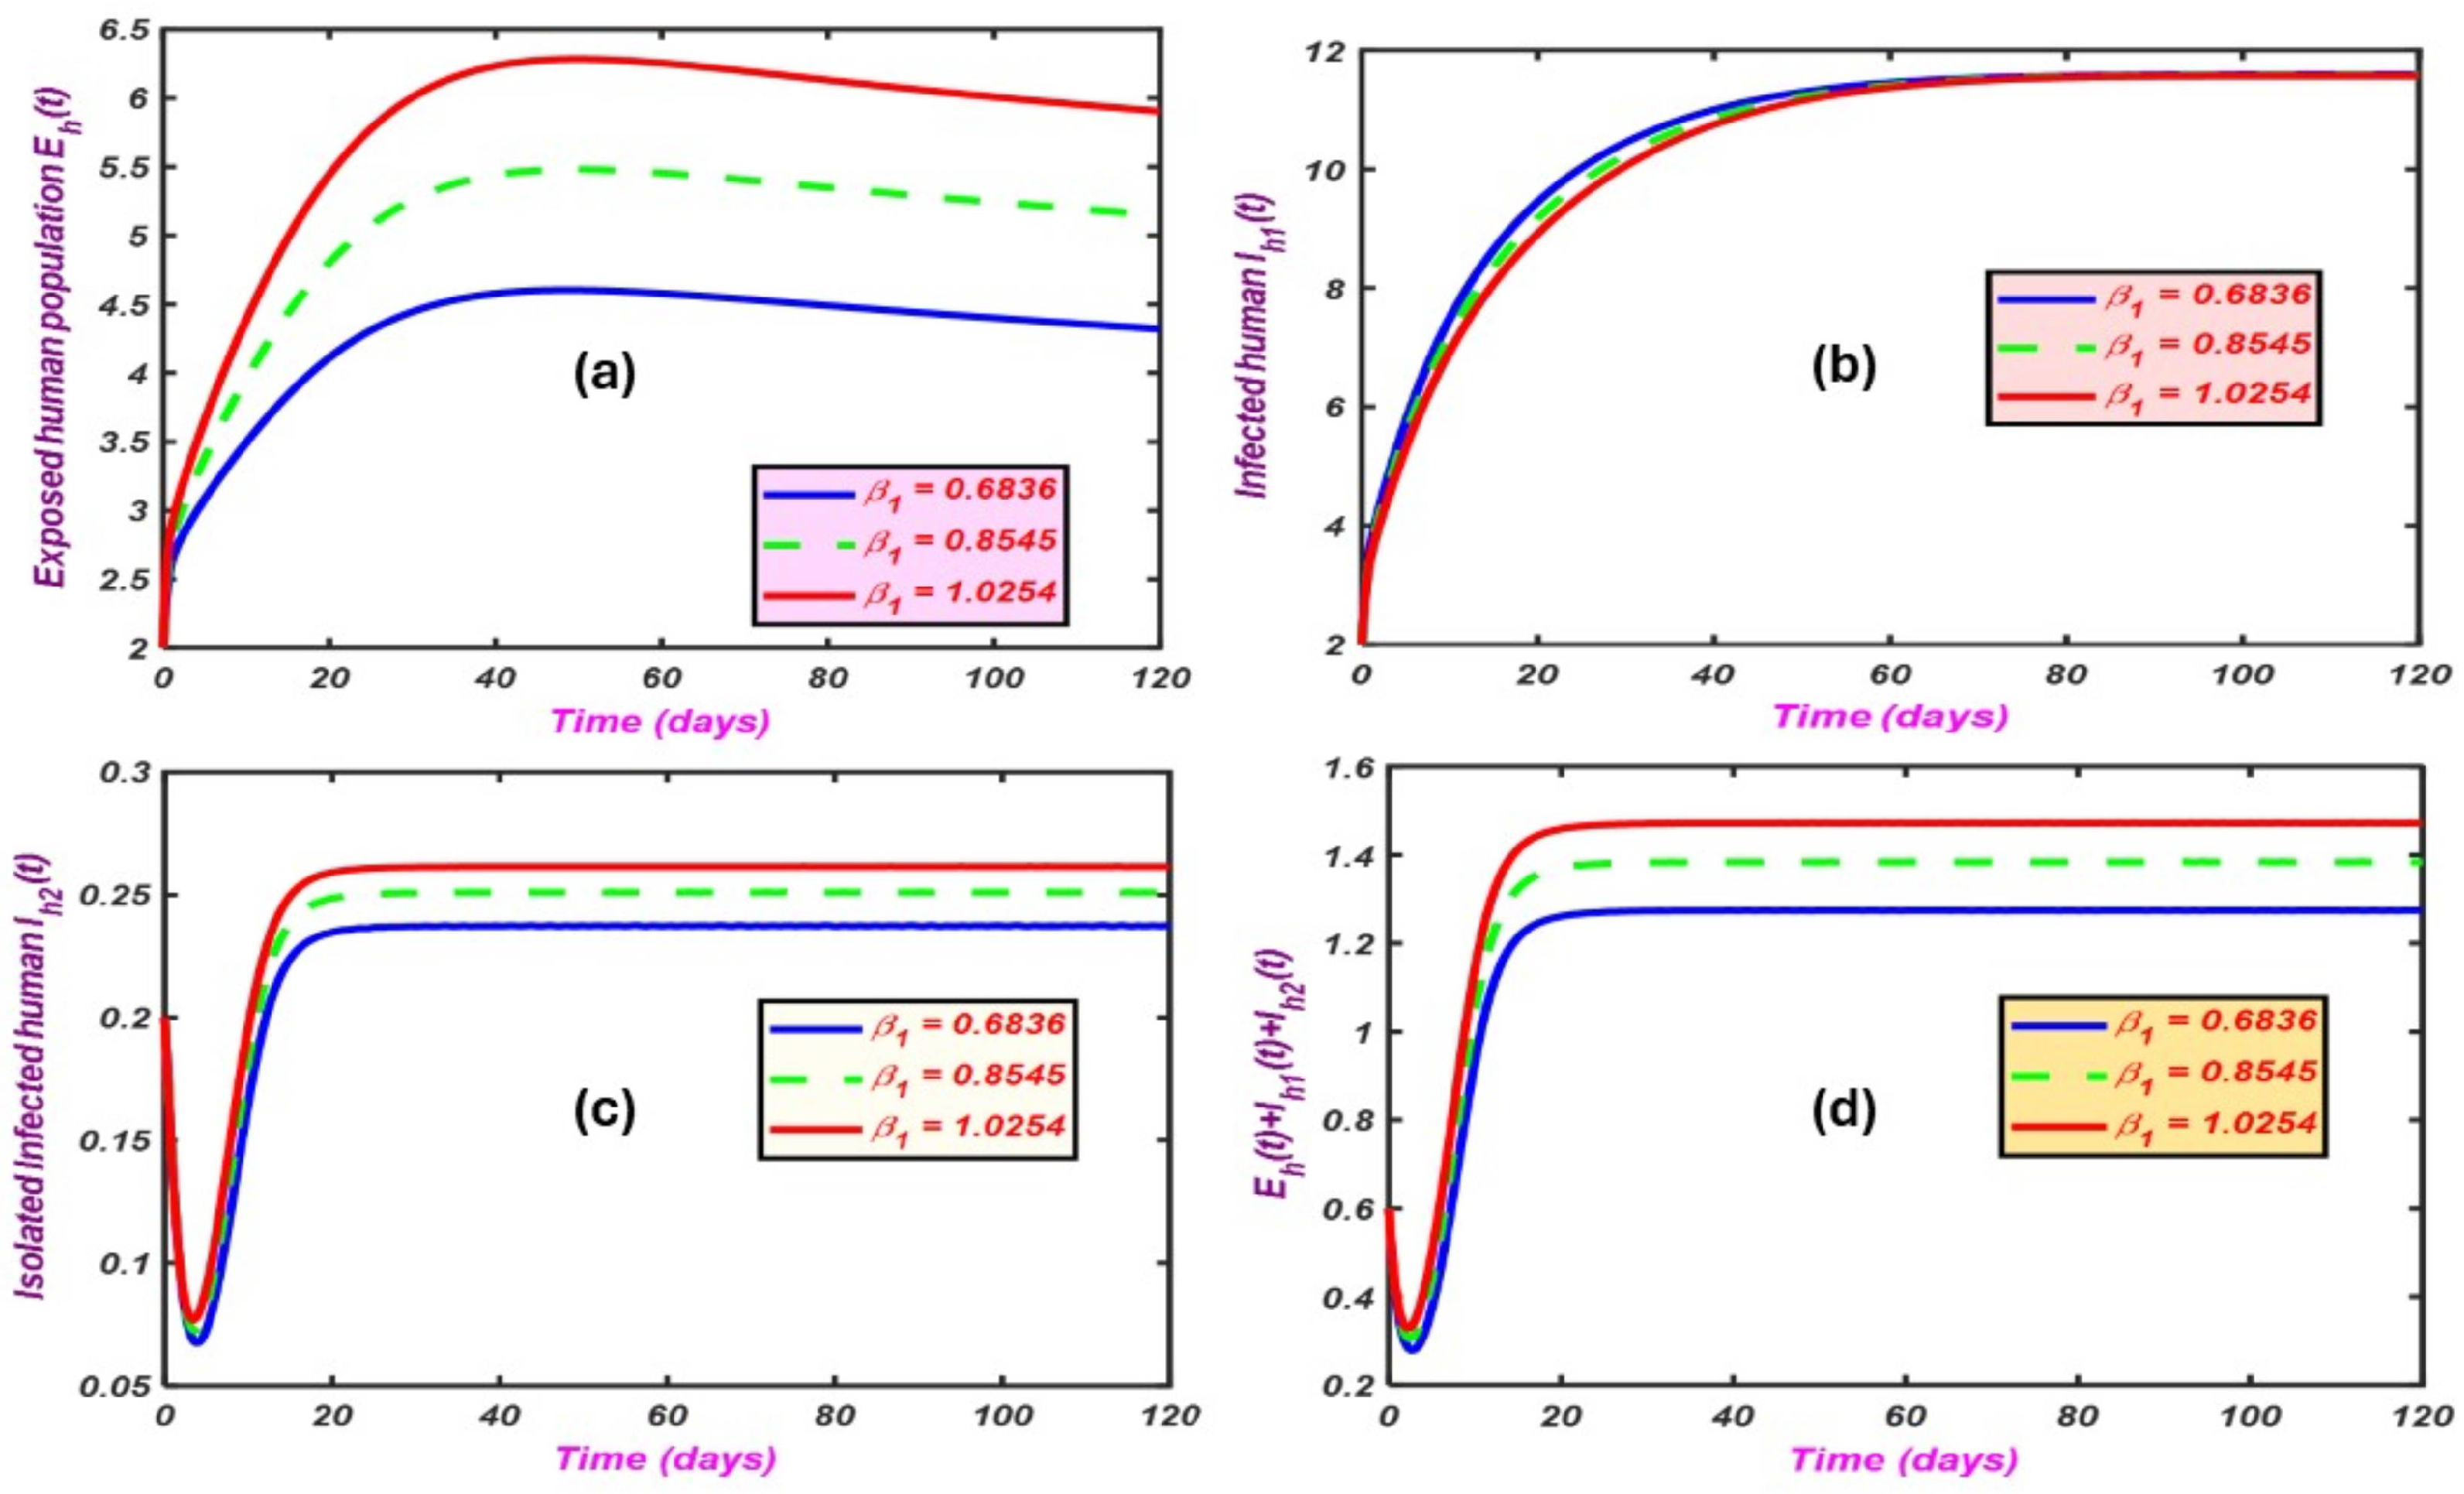
The Mpox model’s numerical simulations are shown in Figure 11, which illustrates the temporal dynamics of each host compartment at different levels of () and the temporal progression of each host compartment for each () level. In Figure 11a, the number of exposed individuals increases rapidly initially, peaks between approximately 50 and 60 days, and then declines gradually with larger than average (), resulting in much higher peaks than those associated with lower than average (). This demonstrates that a stronger rodent-to-human transmission results in sustaining a larger pool of latent infections before they decline. The number of infected individuals increases rapidly for the first 30–40 days, reaching a plateau just above 11 infected individuals (Figure 11b). In contrast to Figure 11a, the curves for the various values begin to converge towards their respective equilibrium points, suggesting that has an effect on the initial trajectory of the epidemic but has little lasting impact on the total number of individuals with active infections at equilibrium. In Figure 11c, the number of isolated individuals initially decreases, then sharply increases, finally attaining a steady state. Higher values of correspond to marginally increased levels of isolation, but the differences are not as pronounced as those shown in Figure 11a. Thus, isolation policies maintain relatively constant proportions of the infected population, irrespective of the transmission intensity.
Figure 11.
Impact of variability .
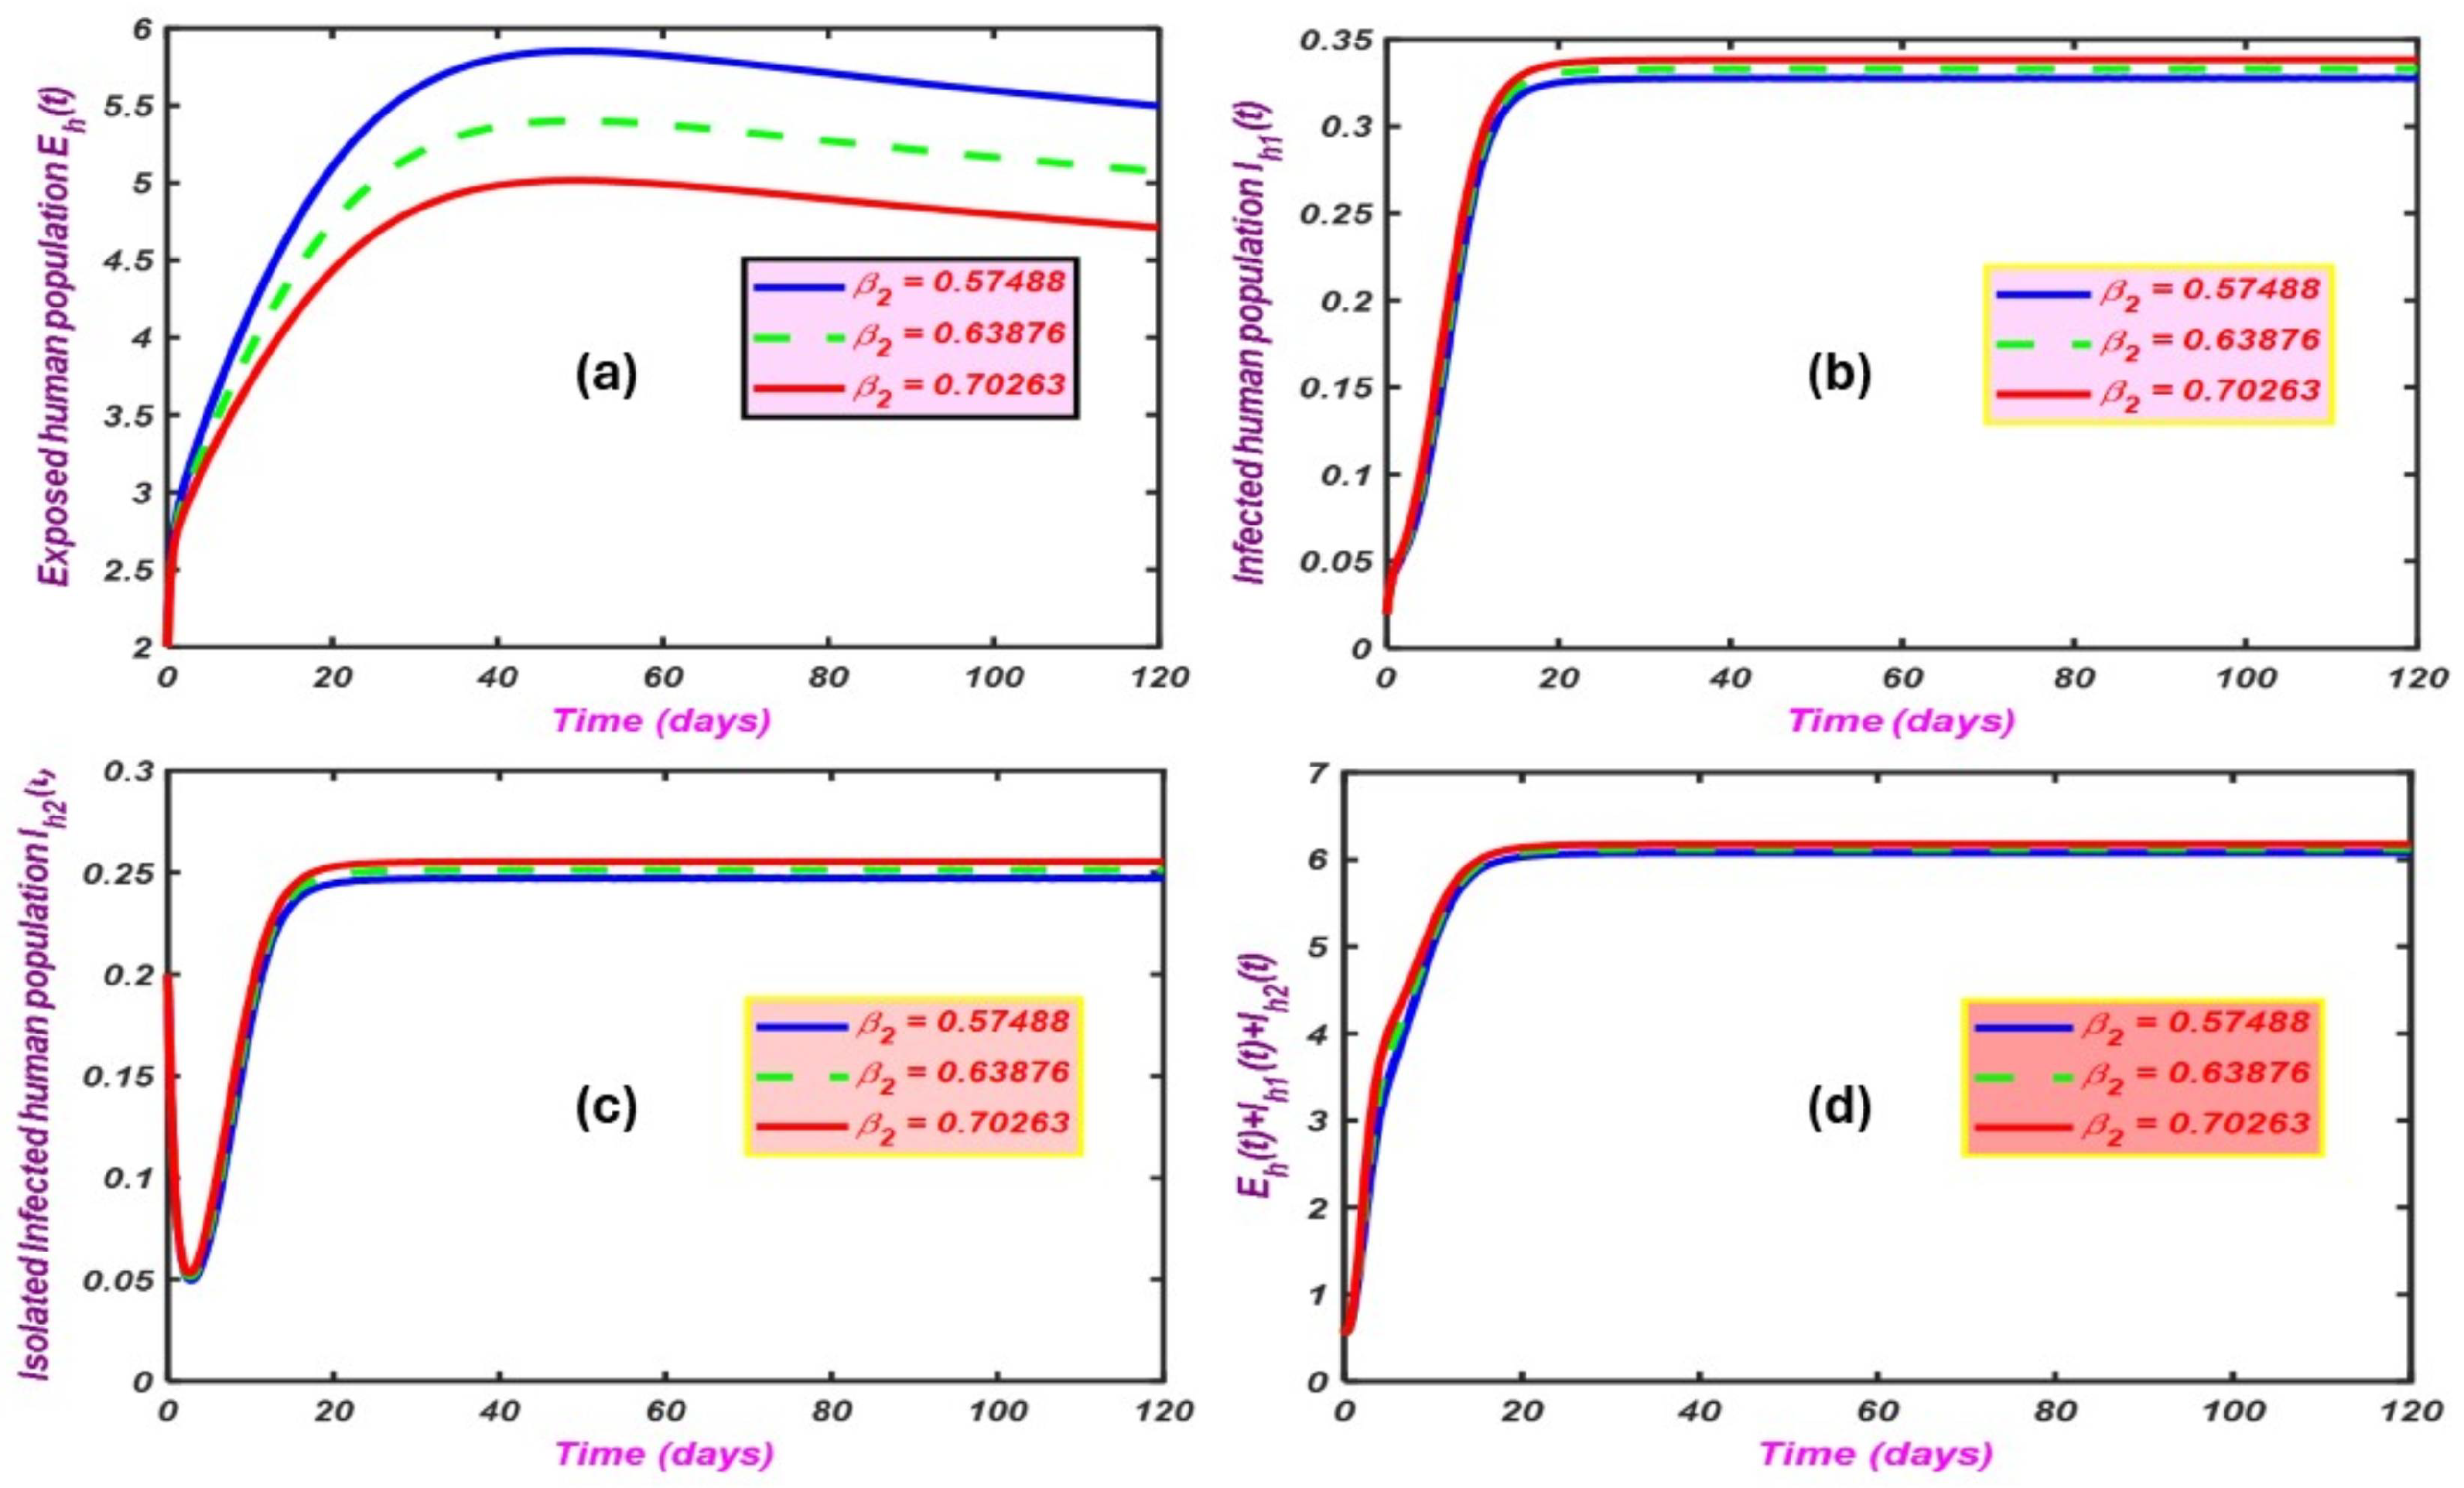
Figure 12 displays how changes in create different patterns of epidemic behavior; however, the main example of this effect is the high/low s producing relatively low/high numbers of exposed individuals. Figure 12a points to the considerable effect has on early outbreak behavior, compared to its small effect on the equilibrium behavior of the system. The infected (b), isolated (c), and total burden compartments (d) show relatively little difference in the amount of change in their respective compartment due to changes in ; therefore, the four compartments will all eventually display the same steady-state behavior and will do so independently of their respective values of .
Figure 12.
Impact of variability .
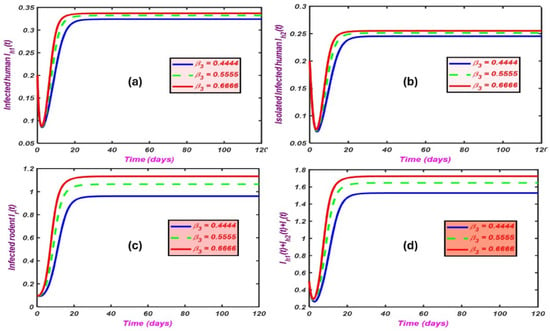
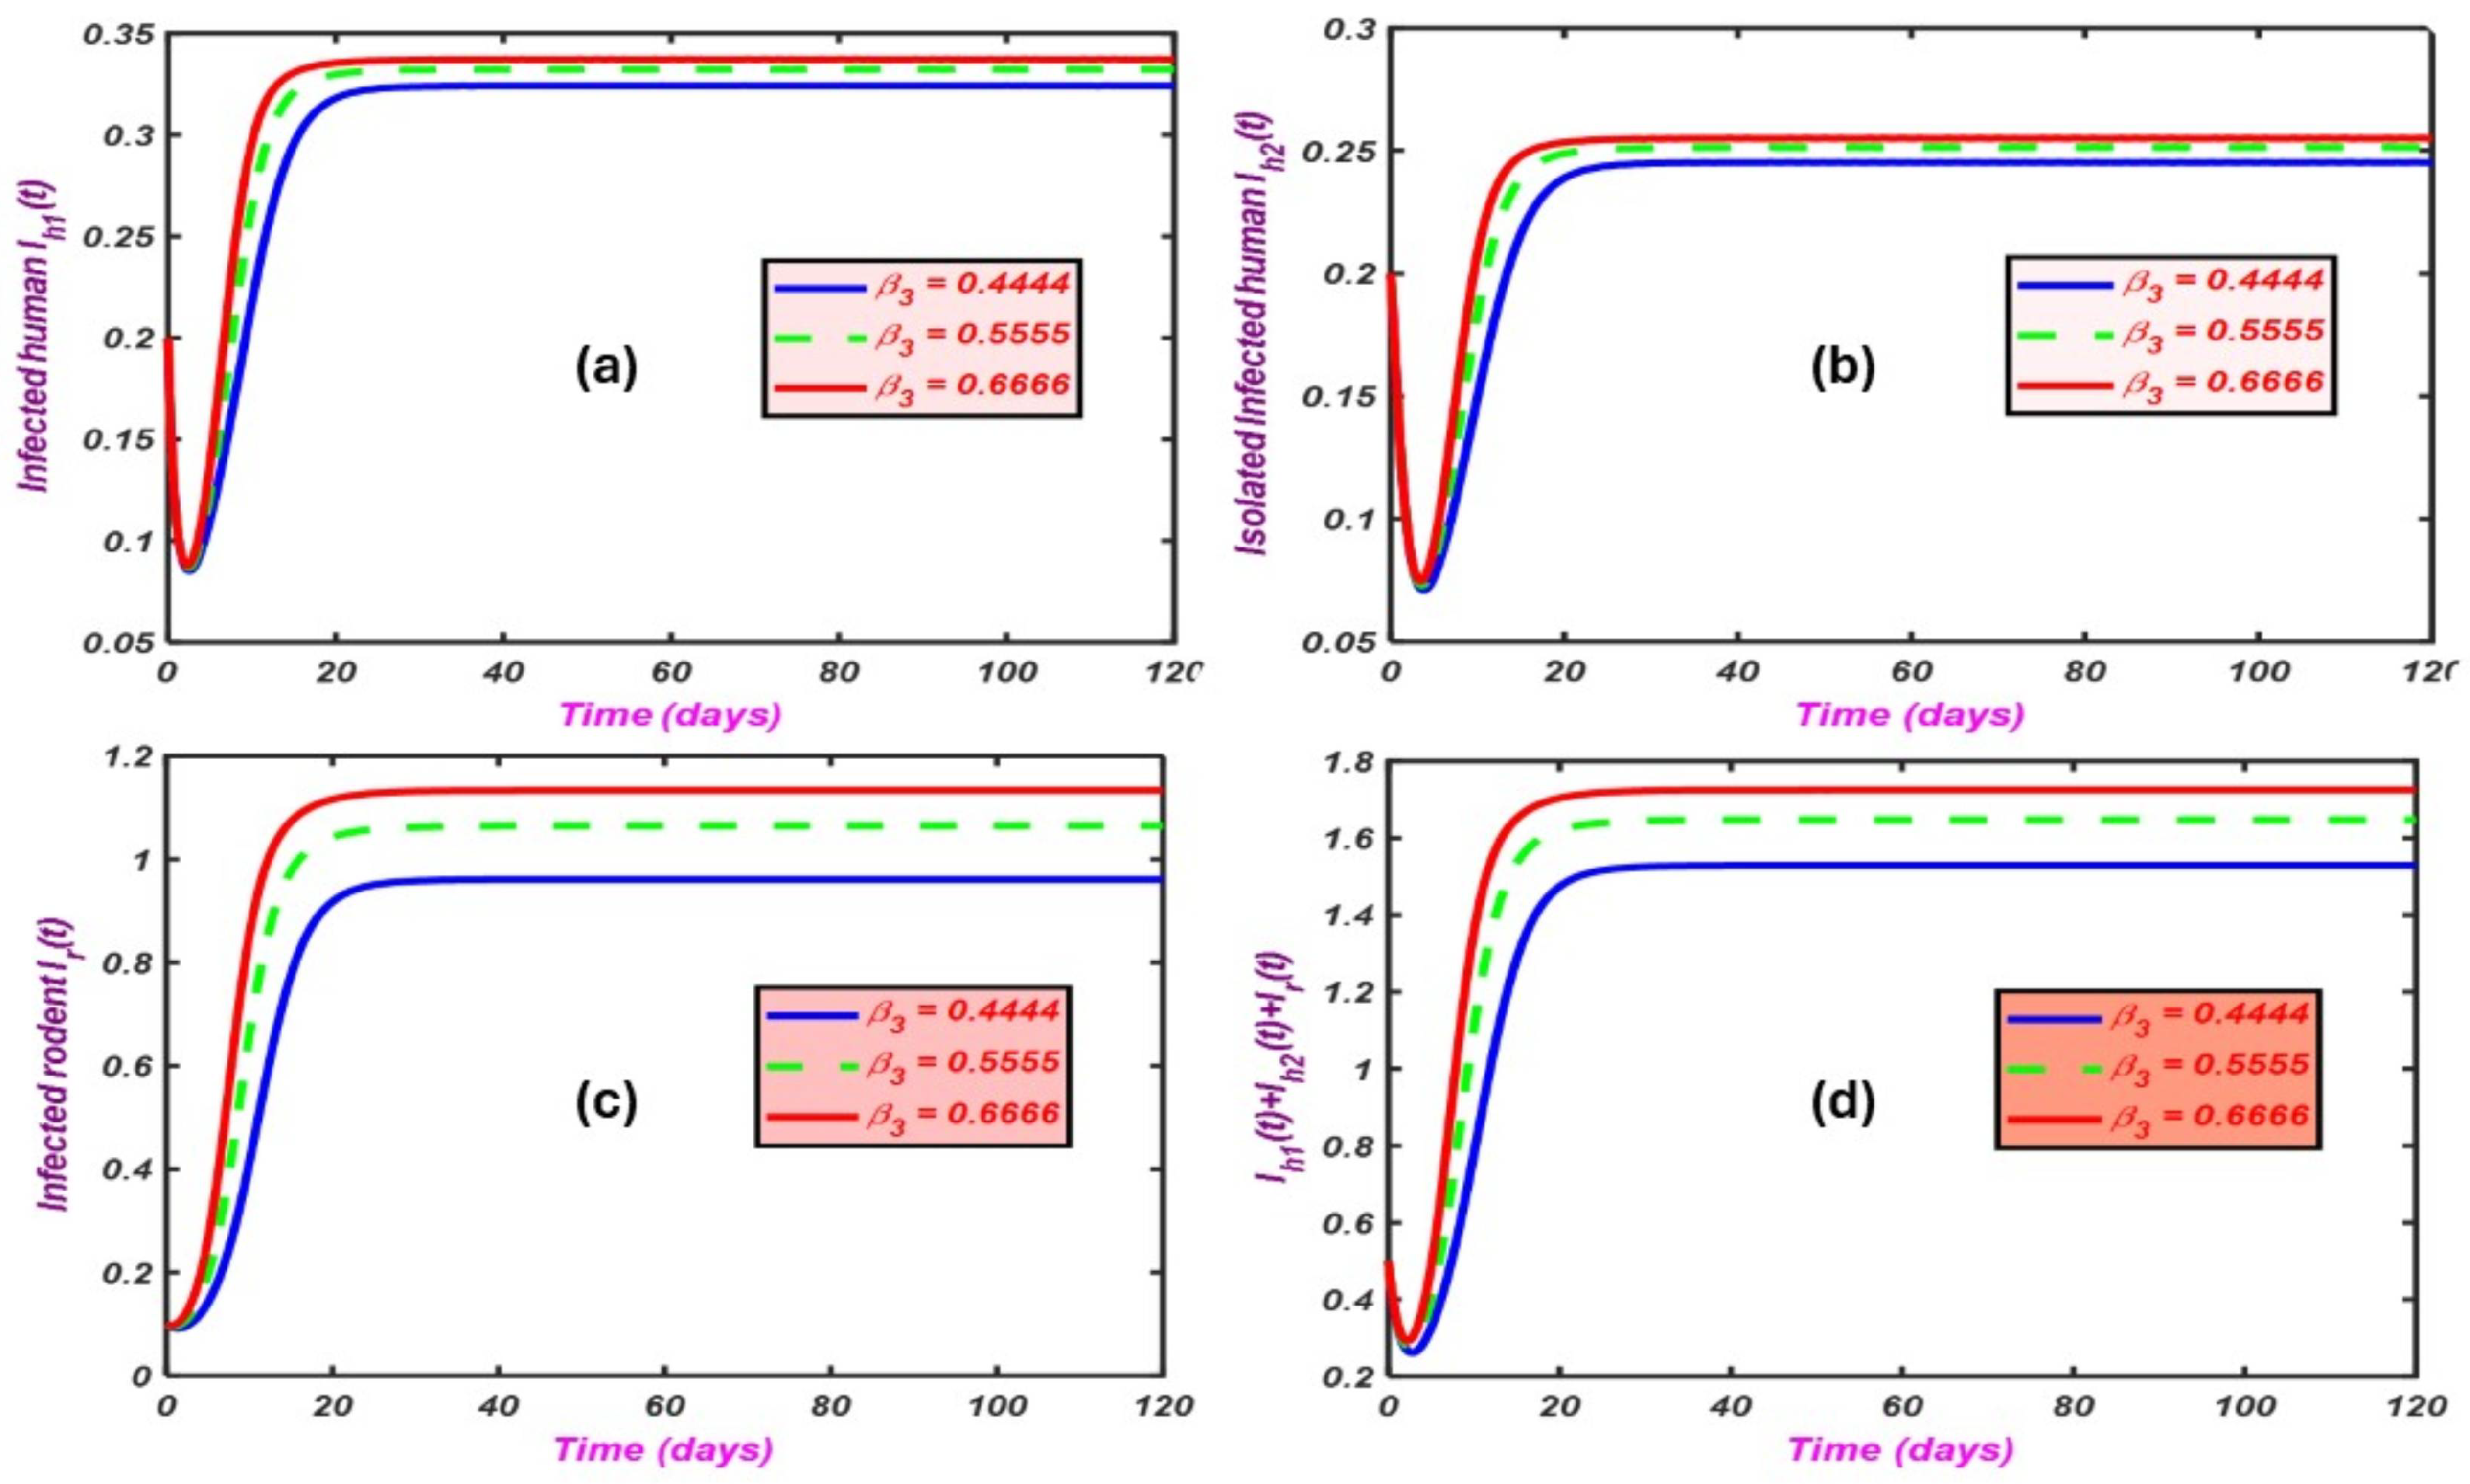
Figure 13 illustrates the impact of varying the rodent-to-rodent transmission rate () on disease dynamics, comparing three values: (blue), (green dashed), and (red). Figure 13a shows that higher values lead to a faster increase and slightly higher equilibrium levels of infected humans (). Figure 13b demonstrates a similar effect on isolated humans (), where elevated accelerates early growth and results in marginally larger steady states. In Figure 13c, infected rodents () exhibit strong sensitivity to , with higher transmission sustaining a substantially larger infection pool. Finally, Figure 13d indicates that the total burden () rises consistently with , with the highest transmission rate producing the greatest epidemic load.
Figure 13.
Impact of variability .
Our model’s results align with significant discoveries in the literature, particularly for the calculation of the fundamental reproduction number (), stability analysis, bifurcation behavior, and sensitivity analysis, when compared to current studies. Our computation of () corresponds with analogous models, which also emphasized () as a pivotal threshold in forecasting disease persistence in Mpox outbreaks. Furthermore, research conducted by others utilized analogous methodologies to ascertain () through the next-generation matrix approach, thus providing additional corroboration of our methodology. Our findings concerning equilibrium stability align with those of others who employed Lyapunov methods to evaluate the local and global stability of equilibria, encompassing both disease-free and endemic states. Our bifurcation study, namely, the detection of backward bifurcation when , also revealed analogous bifurcation dynamics in zoonotic disease models. In addition, the findings of our sensitivity analysis, which indicate that important variables (e.g., transmission and recovery rates) are key determinants in disease dynamics, are consistent with other researchers’ use of sensitivity analysis as a useful tool in targeting public health interventions. Our use of a comparative analysis of our findings and the published literature confirms the validity of our model and contributes to an overall better understanding of Mpox transmission dynamics, which can provide guidance on improved outbreak control measures.
8. Conclusions
In this research, we created and examined a compartmentalized mathematical model that is used to analyze and model the movement of Mpox in humans and rodents. Through extensive theoretical modeling, we were able to show that the modeled solutions would always be able to exist and would remain stable. We also proved, both locally and globally, that the disease system has stably occurring conditions. The basic reproduction number () was derived from the model and used as the threshold for disease persistence. We found that when , the disease-free equilibria would be stable and the Mpox virus would likely be eliminated. When , the endemic equilibria would exist globally, confirming that the Mpox virus will always persist in a population. Threshold-driven bifurcations analyses show the different conditions necessary to make the population equilibria persist even after reaching their threshold points. Sensitivity analyses showed that the two greatest influencers affecting were transmission parameters () and human recruitment rates (), while recovering, isolating, and mortality parameters decreased the effect of within the respective populations.
The numerical simulations showed that there were significant differences in the direct and indirect methods of Mpox virus transmission from rodents to humans and from humans to humans, which affected the overall intensity and amount of time that the Mpox virus could potentially stay in the population. In particular, the increase in contact rates intensified the initial outbreak and increased the long-term burden, while effective isolation reduced the longevity of the outbreak. These results indicate that prevention of cross-species transmission, detection of cases at an early stage, and better isolation strategies are the most important elements of epidemic control.
Author Contributions
Conceptualization, M.R.H. and T.D.A.; methodology, M.R.H. and M.T.A.; software, M.R.H. and J.G.A.-J.; validation, M.R.H., T.D.A. and M.T.A.; formal analysis, M.R.H. and T.D.A.; investigation, M.R.H.; resources, M.R.H.; data curation, M.R.H. and M.T.A.; writing—original draft preparation, M.R.H.; writing—review and editing, M.R.H., J.G.A.-J. and T.D.A.; visualization, M.R.H., M.T.A. and J.G.A.-J.; supervision, M.R.H. All authors have read and agreed to the published version of the manuscript.
Funding
This work was funded by Umm Al-Qura University, Saudi Arabia, under grant number: 26UQU4361068GSSR01.
Data Availability Statement
No data was used for the research described in the article.
Acknowledgments
The authors extend their appreciation to Umm Al-Qura University, Saudi Arabia, for funding this research work through grant number: 26UQU4361068GSSR01.
Conflicts of Interest
The authors declare no conflicts of interest.
References
- Peter, O.J.; Kumar, S.; Kumari, N.; Oguntolu, F.A.; Oshinubi, K.; Musa, R. Transmission dynamics of Monkeypox virus: A mathematical modelling approach. Model. Earth Syst. Environ. 2022, 8, 3423–3434. [Google Scholar] [CrossRef] [Scilit] [PubMed]
- Alharbi, R.; Jan, R.; Alyobi, S.; Altayeb, Y.; Khan, Z. Mathematical modeling and stability analysis of the dynamics of monkeypox via fractional-calculus. Fractals 2022, 30, 2240266. [Google Scholar] [CrossRef] [Scilit]
- Ahmad, Y.U.; Andrawus, J.; Ado, A.; Maigoro, Y.A.; Yusuf, A.; Althobaiti, S.; Mustapha, U.T. Mathematical modeling and analysis of human-to-human monkeypox virus transmission with post-exposure vaccination. Model. Earth Syst. Environ. 2024, 10, 2711–2731. [Google Scholar] [CrossRef] [Scilit]
- Peter, O.J.; Abidemi, A.; Ojo, M.M.; Ayoola, T.A. Mathematical model and analysis of monkeypox with control strategies. Eur. Phys. J. Plus 2023, 138, 242. [Google Scholar] [CrossRef] [Scilit]
- Ullah, S.; Nawaz, R.; Alshehri, A. Mathematical modeling of monkeypox infection with optimized preventive control analysis: A case study with 2022 outbreak. Eur. Phys. J. Plus 2023, 138, 689. [Google Scholar] [CrossRef] [Scilit]
- Manivel, M.; Venkatesh, A.; Kumawat, S. A comprehensive study of monkeypox disease through fractional mathematical modeling. Math. Model. Numer. Simul. Appl. 2025, 5, 65–96. [Google Scholar] [CrossRef] [Scilit]
- Grant, R.; Nguyen, L.B.L.; Breban, R. Modelling human-to-human transmission of monkeypox. Bull. World Health Organ. 2020, 98, 638–640. [Google Scholar] [CrossRef] [Scilit]
- Sudsutad, W.; Thaiprayoon, C.; Kongson, J.; Sae-dan, W. A mathematical model for fractal-fractional monkeypox disease and its application to real data. AIMS Math. 2024, 9, 8516–8563. [Google Scholar] [CrossRef] [Scilit]
- Bankuru, S.V.; Kossol, S.; Hou, W.; Mahmoudi, P.; Rychtář, J.; Taylor, D. A game-theoretic model of Monkeypox to assess vaccination strategies. PeerJ 2020, 8, e9272. [Google Scholar] [CrossRef] [Scilit]
- Molla, J.; Sekkak, I.; Ortiz, A.M.; Moyles, I.; Nasri, B. Mathematical modeling of mpox: A scoping review. One Health 2023, 16, 100540. [Google Scholar] [CrossRef] [Scilit]
- Sweilam, N.H.; Al-Mekhlafi, S.M.; Hassan, S.M.; Alsenaideh, N.R.; Radwan, A.E. A Novel Hybrid Crossover Dynamics of Monkeypox Disease Mathematical Model with Time Delay: Numerical Treatments. Fractal Fract. 2024, 8, 185. [Google Scholar] [CrossRef] [Scilit]
- Mathivanan, T.; Bheeman, R.; Dhandapani, P.B.; Alraddadi, I.; Ahmad, H.; Radwan, T. Monkeypox: A New Mathematical Model Using the Caputo-Fabrizio Fractional Derivative. Fractals 2025, 2025, 2540128. [Google Scholar] [CrossRef] [Scilit]
- Ngungu, M.; Addai, E.; Adeniji, A.; Adam, U.M.; Oshinubi, K. Mathematical epidemiological modeling and analysis of monkeypox dynamism with non-pharmaceutical intervention using real data from United Kingdom. Front. Public Health 2023, 11, 1101436. [Google Scholar] [CrossRef] [Scilit]
- Zhang, N.; Addai, E.; Zhang, L.; Ngungu, M.; Marinda, E.; Asamoah, J.K.K. Fractional modeling and numerical simulation for unfolding marburg–monkeypox virus co-infection transmission. Fractals 2023, 31, 2350086. [Google Scholar] [CrossRef] [Scilit]
- Alharbi, T.D.; Hasan, M.R. Modeling Monkeypox dynamics with human–rodent interactions and waning vaccination. AIMS Math. 2025, 10, 18660–18679. [Google Scholar] [CrossRef] [Scilit]
- Majee, S.; Jana, S.; Barman, S.; Kar, T.K. Transmission dynamics of monkeypox virus with treatment and vaccination controls: A fractional order mathematical approach. Phys. Scr. 2023, 98, 024002. [Google Scholar] [CrossRef] [Scilit]
- Okposo, N.I.; Addai, E.; Apanapudor, J.S.; Gómez-Aguilar, J.F. A study on a monkeypox transmission model within the scope of fractal–fractional derivative with power-law kernel. Eur. Phys. J. Plus 2023, 138, 684. [Google Scholar] [CrossRef] [Scilit]
- Idisi, I.O.; Oshinubi, K.; Sewanu, V.B.; Yahaya, M.M.; Olagbami, O.S.; Edogbanya, H.O. Investigating Mpox Strain Dynamics Using Computational and Data-Driven Approaches. Viruses 2025, 17, 154. [Google Scholar] [CrossRef] [Scilit]
- Rahman, A.R.; Munir, T.; Fazal, M.; Cheema, S.A.; Bhayo, M.H. Climatic determinants of monkeypox transmission: A multi-national analysis using generalized count mixed models. J. Virol. Methods 2025, 332, 115076. [Google Scholar] [CrossRef] [Scilit] [PubMed]
- Sabir, Z.; Abdelkawy, M.A. A novel combination of sigmoid and radial basis neural networks for the monkeypox transmission system. Eng. Appl. Artif. Intell. 2025, 158, 111512. [Google Scholar] [CrossRef] [Scilit]
- Ullah, M.S.; Wang, J. Revealing the complex dynamics of monkeypox epidemics in heterogeneous networks by the evolutionary game theory. Sci. Rep. 2025, 15, 29889. [Google Scholar] [CrossRef] [Scilit]
- Onifade, A.A.; Akindele, O.A.; Ahmad, I.; Khan, M.A.; Mat Isa, N.; Alzahrani, E. Modeling monkeypox transmission with a compartmental framework to evaluate testing, isolation and public awareness strategies. Sci. Rep. 2025, 15, 27236. [Google Scholar] [CrossRef] [Scilit]
- Agbata, B.C.; Cenaj, E.; Dervishi, R.; Danjuma, Y.J.; Shior, M.M.-A.; Abah, E.; Onuche, J.S.; Emadifar, H. Fractional-order mathematical model for Monkeypox transmission dynamics using the Atangana-Baleanu Caputo operator. BMC Infect. Dis. 2025, 25, 1000. [Google Scholar]
- Alshehri, A.; Ullah, S. Mathematical analysis of monkeypox infection with optimal control analysis: A case study with a new outbreak in the United States. Math. Methods Appl. Sci. 2025, 48, 7–31. [Google Scholar]
- Andrawus, J.; Ahmad, Y.U.; Andrew, A.A.; Yusuf, A.; Qureshi, S.; Denue, B.A.; Abdul, H.; Salahshour, S. Impact of surveillance in human-to-human transmission of monkeypox virus. Eur. Phys. J. Spec. Top. 2025, 234, 483–514. [Google Scholar]
- Rashid, S.; Bariq, A.; Ali, I.; Sultana, S.; Siddiqa, A.; Elagan, S.K. Dynamic analysis and optimal control of a hybrid fractional monkeypox disease model in terms of external factors. Sci. Rep. 2025, 15, 2944. [Google Scholar] [CrossRef] [Scilit] [PubMed]
- Hassan, A.H.; Aldila, D.; Aziz, M.H.N.; Kamalia, P.Z.; Peter, O.J. An Optimal Control Problem for a Monkeypox Transmission Model with Activity-Driven Contact Patterns. Braz. J. Phys. 2025, 55, 213. [Google Scholar] [CrossRef] [Scilit]
- Sweilam, N.H.; Al-Mekhlafi, S.M.; Kareem, W.S.A.; Alqurishi, G. A new crossover dynamics mathematical model of monkeypox disease based on fractional differential equations and the ψ-Caputo derivative: Numerical treatments. Alex. Eng. J. 2025, 111, 181–193. [Google Scholar] [CrossRef] [Scilit]
- Helikumi, M.; Ojija, F.; Mhlanga, A. Dynamical Analysis of Mpox Disease with Environmental Effects. Fractal Fract. 2025, 9, 356. [Google Scholar] [CrossRef] [Scilit]
- Hasan, M.R.; Hobiny, A.; Alshehri, A. Sensitivity Analysis of Vector-host Dynamic Dengue Epidemic Model. Commun. Math. Appl. 2023, 14, 1001. [Google Scholar] [CrossRef] [Scilit]
- Das, H.K. Exploring the dynamics of monkeypox transmission with data-driven methods and a deterministic model. Front. Epidemiol. 2024, 4, 1334964. [Google Scholar] [CrossRef] [Scilit]
- Liu, G.; Li, H. Dynamical analysis of a class of Monkeypox epidemic model. Therm. Sci. 2024, 28, 3367–3383. [Google Scholar] [CrossRef] [Scilit]
- Castillo-Chavez, C.; Song, B. Dynamical models of tuberculosis and their applications. Math. Biosci. Eng. 2004, 1, 361–404. [Google Scholar] [CrossRef] [Scilit]
- Alharbi, T.D.; Hasan, M.R. Global stability and sensitivity analysis of vector-host dengue mathematical model. AIMS Math. 2024, 9, 32797–32818. [Google Scholar] [CrossRef] [Scilit]
- Bentaleb, D.; Khatar, Z.; Amine, S. Epidemiological modeling of monkeypox clades: A dual-strain SEIR approach with stability, bifurcation, and sensitivity analysis. Model. Earth Syst. Environ. 2024, 10, 6949–6963. [Google Scholar] [CrossRef] [Scilit]
- Qian, M.; Li, D.; Hao, Z.; Hu, S.; Li, W. An epidemiological model of monkeypox: Model prediction and control application. BMC Infect. Dis. 2025, 25, 485. [Google Scholar] [CrossRef] [Scilit] [PubMed]
- Allehiany, F.M.; DarAssi, M.H.; Ahmad, I.; Khan, M.A.; Tag-Eldin, E.M. Mathematical modeling and backward bifurcation in monkeypox disease under real observed data. Results Phys. 2023, 50, 106557. [Google Scholar] [CrossRef] [Scilit] [PubMed]
- Qureshi, M.; Khan, S.; Bantan, R.A.R.; Daniyal, M.; Elgarhy, M.; Marzo, R.R.; Lin, Y. Modeling and forecasting monkeypox cases using stochastic models. J. Clin. Med. 2022, 11, 6555. [Google Scholar] [CrossRef] [Scilit]
- Bhunu, C.P.; Mushayabasa, S.; Hyman, J.M. Modelling HIV/AIDS and monkeypox co-infection. Appl. Math. Comput. 2012, 218, 9504–9518. [Google Scholar] [CrossRef] [Scilit]
- Olaniyi, S.; Chuma, F.M. Lyapunov stability and economic analysis of monkeypox dynamics with vertical transmission and vaccination. Int. J. Appl. Comput. Math. 2023, 9, 85. [Google Scholar] [CrossRef] [Scilit]
- Ackora-Prah, J.; Okyere, S.; Bonyah, E.; Adebanji, A.O.; Boateng, Y. Optimal control model of human-to-human transmission of monkeypox virus. F1000Research 2023, 12, 326. [Google Scholar] [CrossRef] [Scilit]
- Leandry, L.; Mureithi, E.W. An investigation on the monkeypox virus dynamics in human and rodent populations for a deterministic mathematical model. Inform. Med. Unlocked 2023, 41, 101325. [Google Scholar] [CrossRef] [Scilit]
- Al-Shomrani, M.M.; Musa, S.S.; Yusuf, A. Unfolding the transmission dynamics of monkeypox virus: An epidemiological modelling analysis. Mathematics 2023, 11, 1121. [Google Scholar] [CrossRef] [Scilit]
- Depero, L.E.; Bontempi, E. Comparing the spreading characteristics of monkeypox (MPX) and COVID-19: Insights from a quantitative model. Environ. Res. 2023, 235, 116521. [Google Scholar] [CrossRef] [Scilit] [PubMed]
- Ullah, M.S.; Kabir, K.M.A. Behavioral game of quarantine during the monkeypox epidemic: Analysis of deterministic and fractional order approach. Heliyon 2024, 10, e26889. [Google Scholar] [CrossRef] [Scilit] [PubMed]

Disclaimer/Publisher’s Note: The statements, opinions and data contained in all publications are solely those of the individual author(s) and contributor(s) and not of MDPI and/or the editor(s). MDPI and/or the editor(s) disclaim responsibility for any injury to people or property resulting from any ideas, methods, instructions or products referred to in the content. |
© 2026 by the authors. Licensee MDPI, Basel, Switzerland. This article is an open access article distributed under the terms and conditions of the Creative Commons Attribution (CC BY) license.