


Abstract
The long-run sustainability of pay-as-you-go pension systems crucially depends on the dynamic balance between social-security contributions paid by the working population and benefits paid to retirees. In Italy, the National Social Security Institute (INPS) manages the core of the public system, whose financial equilibrium is increasingly challenged by demographic aging, labor market fragility, and macroeconomic shocks. In this paper, in line with the aims of the Special Issue “Signal Processing and Machine Learning in Real-Life Processes”, we reinterpret the Italian pension system as a complex stochastic signal-processing problem. Using the most recent data published in the Annuario Statistico Italiano 2024 highlighting by ISTAT—with a focus on Protection and Social Security—we construct a set of time series describing contributions, benefits, coverage ratios and pension amounts, both at the national and territorial level. On this basis, we compare classical time-series models and a recurrent neural network with Long Short-Term Memory (LSTM) architecture for multi-step forecasting of the main aggregates. The signal-processing perspective allows us to disentangle trend, cyclical and shock components, while machine learning provides flexible nonlinear forecasting tools capable of capturing structural breaks such as the COVID-19 crisis. Our empirical results suggest that (i) pension expenditure remains high and persistent as a share of GDP; (ii) the contribution coverage ratio improved in 2022 but remains below the pre-pandemic level; and (iii) regional heterogeneity in the per-capita pension deficit is substantial and stable over time, with persistent imbalances in Southern regions and Islands. Finally, we perform a scenario analysis combining LSTM-based forecasts with demographic and labor market hypotheses, and we quantify the impact of alternative policy measures on the future pension deficit signal. The proposed framework, which integrates permutation-based inference, signal decomposition and deep learning, provides a reproducible template for the real-time monitoring of pension sustainability using official open data.
Keywords:
pension sustainability; social security; signal processing; machine learning; LSTM; permutation tests MSC:
62G10
1. Introduction
Population aging, low fertility rates, and labor market instability jointly threaten the long-run sustainability of public pension systems in many advanced economies [1]. Italy represents a paradigmatic case: the proportion of people aged 65 and over exceeds 24% of the resident population, the fertility rate is well below the replacement level, and the labour market is characterized by relatively low participation rates and a pronounced North–South divide [2]. These structural factors place increasing pressure on the main public pension institution, the National Social Security Institute (INPS), whose pay-as-you-go system relies heavily on contemporaneous contributions from the working population. Traditional actuarial and macroeconomic analyses of pension systems are typically based on parametric models that rely on strong assumptions regarding the underlying stochastic processes and functional forms. In parallel, recent advances in non-parametric statistics, signal processing [3,4]. Specifically, our approach integrates three complementary components:
- (i)
- A signal-processing perspective on pension system dynamics, in which contributions, benefits, and deficits are conceptualized as stochastic signals observed over time and across regions;
- (ii)
- A non-parametric inferential framework, with particular emphasis on permutation and combined permutation tests, designed to rigorously compare trajectories across different geographical and temporal contexts;
- (iii)
- A machine learning forecasting module employing LSTM recurrent neural networks to produce multi-step forecasts under alternative demographic and policy scenarios.
The analysis is based onfficial statistics published by ISTAT in the Annuario Statistico Italiano 2024 [2], with a particular focus on Chapter 5, “Protezione sociale”, which provides detailed information on social-security contributions, benefits, coverage indices, and pension amounts by region and institutional sector (basic and complementary entities).
To ensure transparency and reproducibility, we rely exclusively on publicly available aggregate data [5,6]. Methodologically, our contribution is twofold. First, we show how relatively standard signal-processing tools—such as trend extraction, smoothing, and decomposition—can be combined with permutation-based inference within a high-level yet accessible framework suitable for applied policy analysis. Second, we demonstrate that LSTM models, when appropriately tuned and benchmarked against classical ARIMA-type models, can provide informative multi-step forecasts of pension expenditures and contribution revenues, even in the presence of structural breaks such as the COVID-19 pandemic and the subsequent energy-price shock. The remainder of the paper is organized as follows. Section 3 reviews the institutional background and describes the data. Section 4 introduces the methodological framework, focusing on signal processing, permutation tests, and LSTM models. Section 5 presents descriptive evidence, estimation results, and forecasting scenarios. Section 6 discusses policy implications, and Section 7 concludes.
2. Literature Review
2.1. Why Signal Processing and Machine Learning for Real-Life Socio-Economic Processes
Over the past two decades, signal processing and machine learning have increasingly been adopted as general-purpose methodological paradigms for studying real-life processes, that is, complex systems whose dynamics arise from the interaction of multiple components, are observed through noisy measurements, and are subject to structural changes. While signal processing originated in electrical engineering and communications, its conceptual toolkit—filtering, decomposition, spectral methods, and time–frequency representations—has proven remarkably effective whenever the object of interest can be viewed as an evolving signal generated by a latent mechanism plus disturbances [3,7,8]. In parallel, machine learning has developed as a data-driven framework for prediction, pattern recognition, and representation learning in high-dimensional settings, often under limited assumptions about the data-generating process [9,10,11,12,13]. The convergence of these approaches is now evident in many applied domains—finance, energy, climate, health, and industrial monitoring—where hybrid pipelines combine signal extraction and feature engineering with flexible learning algorithms, particularly for time series analysis. These methods enable the modeling of complex, dynamic phenomena in ways that traditional statistical tools cannot easily achieve. Among traditional models, ARIMA [14] has long been considered effective for forecasting; however, it requires stationary time series or appropriate transformations to render them stationary, and predictions of future values are constrained to linear functions of past observations [15,16]. To overcome these limitations, several nonlinear models have been proposed in the literature, including the bilinear model [17,18], the threshold autoregressive (TAR) model, and the autoregressive conditional heteroskedastic (ARCH) model [19,20]. While these approaches improve over simple linear models, their applicability remains limited, as they are designed for specific types of nonlinearity. Among the various proposed approaches, LSTM models have demonstrated a remarkable ability to capture both linear and nonlinear patterns in complex time series, overcoming some of the limitations of traditional methods.LSTM networks have gained importance due to their effectiveness in handling sequences and time-dependent data. LSTM models have been applied in multiple domains, such as Natural Language Processing (NLP), financial forecasting, weather prediction, and anomaly detection [21,22,23,24,25,26]. However, their application to complex socio-economic systems, such as public pension systems, remains extremely limited [27]. Socio-economic and institutional systems represent a particularly challenging class of real-life processes. Their signals are shaped by demographic trends, macroeconomic shocks, policy reforms, behavioral responses, and administrative constraints, producing time series that are non-stationary, heterogeneous across territories, and exposed to structural breaks. In this setting, the classical purely structural approach (e.g., calibrated general equilibrium models) provides interpretability but can be fragile under misspecification, while purely descriptive statistics can underutilize the information content of data-rich environments. Consequently, an expanding literature advocates the integration of statistical learning with time-series and signal-processing perspectives to enhance monitoring, forecasting, and scenario analysis in public policy contexts [28]. This methodological motivation is especially relevant for social security systems, where sustainability is inherently dynamic and depends on long-run signals (aging and labor force participation) superimposed with short-run shocks (crises and reforms). Public pension systems can be naturally interpreted as real-life signal generators: contribution flows, benefit expenditures, coverage ratios, and per-capita deficits form a multivariate signal observed annually (and, in administrative sources, often monthly) whose evolution reflects both structural forces and temporary disturbances. The central question of sustainability thus becomes how to extract robust latent components (trend, cycle, and breaks) and how to learn predictive mappings from past signals and covariates to future trajectories under uncertainty [29]. Although signal processing and machine learning have been widely applied in finance, energy, and mobility forecasting, their integration into public pension systems remains extremely limited. The present work addresses this gap by combining signal decomposition techniques, LSTM-based predictive models, and robust nonparametric inference to capture long-term structural trends, short-term shocks, and nonlinear interactions within multivariate pension data. This integrative approach enables more accurate and interpretable forecasting of key sustainability indicators—such as contribution flows, benefit expenditures, coverage ratios, and deficits—while accounting for territorial heterogeneity and structural breaks, providing insights beyond those achievable with standard time-series or ML-only methods [30].
2.2. Foundations of Pension Sustainability: Intergenerational Transfers and Reform Logic
The theoretical foundations of pay-as-you-go pensions were established in the classic contributions that framed social security as an intergenerational contract. Samuelson [31] formalized the logic of consumption loans across generations, while Aaron [32] clarified the conditions under which pay-as-you-go schemes can deliver implicit rates of return linked to population and productivity growth [33]. These contributions remain central because they show that sustainability is not a static accounting identity but a dynamic balance driven by demography and economic growth. Later work expanded the analysis to political economy and reform feasibility, emphasizing how pension rules evolve as a result of distributional conflict, expectations, and credibility constraints (e.g., contributions to the political economy of pension reforms surveyed in the comparative literature). In Europe, pension reforms since the 1990s have been influenced by both demographic pressure and fiscal consolidation goals [34]. A major conceptual shift occurred with the adoption of notional defined contribution (NDC) logic in several countries, aiming to link benefits more transparently to lifetime contributions while preserving a pay-as-you-go financing structure. Comparative analyses highlighted how NDC schemes internalize demographic and labor market changes through adjustment mechanisms but also noted that adequacy and redistribution goals may require complementary policies [35,36]. In the Italian context, reform waves introduced tighter eligibility, altered indexation rules, and gradually expanded contribution-based computation, yet the system remains deeply intertwined with labor market fragmentation and territorial disparities, which complicate both forecasting and policy design. A key theme in the sustainability literature is that aggregate equilibrium masks important heterogeneity: regions and cohorts can face radically different trajectories depending on employment, wages, and demographic structure. This motivates empirical approaches that treat the system as a collection of coupled signals, rather than a single national aggregate. The presence of persistent spatial gradients in participation rates and income levels implies that sustainability should be monitored not only nationally but also across macro-areas, where different regimes may coexist within the same institutional framework.
2.3. Demographic and Actuarial Modeling: Longevity Risk, Stochastic Mortality, and Uncertainty
A second foundational strand concerns demographic forecasting and longevity risk, which directly determine the size and duration of benefit obligations. The influential Lee–Carter model introduced a parsimonious statistical representation for mortality trends and uncertainty [37], inspiring a vast literature on stochastic mortality models and probabilistic projections. Extensions included cohort effects, multi-population formulations, and Bayesian methods to quantify uncertainty and improve stability across time horizons. These developments were crucial for pension analysis because deterministic projections can severely underestimate the tail risk associated with longevity improvements. In actuarial science and pension risk management, the modeling of longevity dynamics is complemented by the study of annuity pricing, hedging, and the interaction between mortality and macroeconomic risk. Research on longevity modeling emphasized that pension sustainability is exposed to structural changes in mortality trends, whose detection and incorporation require both robust statistical methods and careful interpretation. Moreover, demographic uncertainty interacts with labor market uncertainty: dependency ratios respond not only to survival but also to employment, migration, and participation patterns. Hence, empirical sustainability monitoring benefits from multivariate approaches that integrate demographic signals with macro-fiscal variables. For the empirical objectives of this paper, the key implication of the demographic-actuarial literature is methodological: pension systems evolve under slow-moving structural forces (aging) combined with regime changes (reforms) and shocks (crises). This combination is precisely the environment in which signal decomposition, break detection, and robust forecasting methods can add value beyond standard linear models.
2.4. Time-Series Econometrics and Signal Processing in Macro-Fiscal and Social Expenditure Data
A third strand concerns the evolution of time-series methods applied to macroeconomic and fiscal aggregates. Classical time-series analysis provides tools for modeling persistence, trend behavior, and cyclical co-movement [38]. However, macro-fiscal signals are often non-stationary and subject to structural breaks, motivating decomposition approaches and state-space representations. In macroeconomics, filters and decomposition methods were used to extract business-cycle components, with debates about the properties and interpretability of trends and cycles (e.g., the extensive use of smoothing and filtering approaches in applied macro analysis). Signal processing adds an alternative perspective: instead of treating economic time series purely as realizations of stochastic processes, it emphasizes the representation of observed signals as mixtures of latent components with distinct frequency properties. Spectral analysis and time–frequency methods were developed to characterize periodicities and transient dynamics. In applied contexts, these tools support three tasks that are central for pension sustainability: (i) separating slow-moving demographic trends from medium-term cyclical variation, (ii) identifying structural breaks associated with reforms or crises, and (iii) extracting robust features for forecasting models. The relevance for pension data is evident: expenditures and contributions exhibit high inertia, while shocks such as the COVID-19 crisis can introduce abrupt discontinuities in revenues, coverage ratios, and deficit measures. In public finance, researchers also studied long-memory behavior and persistence in expenditure and revenue series, suggesting that standard short-memory models may understate persistence and forecast uncertainty in fiscal signals [39]. This resonates with pension dynamics, where institutional rules and demographic structures generate persistence, and where policy changes can alter the data-generating mechanism. Therefore, the literature motivates the use of flexible, data-driven frameworks that can accommodate both smooth trends and abrupt changes.
2.5. Machine Learning for Forecasting, Heterogeneity, and Structural Change in Socio-Economic Data
A fourth strand concerns machine learning applications to socio-economic data, particularly for forecasting under nonlinearity, structural breaks, and regime changes. Traditional econometric approaches—such as ARIMA, VAR, and state-space models—offer interpretability and theoretical grounding, but they often struggle to capture nonlinear interactions, long-range dependencies, and multivariate dynamics [14]. These limitations are especially relevant for analyzing the sustainability of the Italian Social Security System, where demographic trends, contribution patterns, and macroeconomic shocks interact in complex ways. Machine learning models, particularly recurrent neural networks and LSTM architectures, provide flexible tools to model sequential dependencies and nonlinear effects [40]. LSTM networks can ingest multiple signals simultaneously, including benefits, contributions, demographic proxies, and macroeconomic variables, learning predictive relationships that would be difficult to specify parametrically. Moreover, ML methods allow for clustering and segmentation, which is important for regional heterogeneity, as macro-areas may follow different employment, wage, and demographic trajectories [41]. Recently, Transformer-based architectures have shown superior performance in high-dimensional or multivariate time-series contexts by leveraging attention mechanisms to capture long-range interactions efficiently [42,43]. Despite their potential, Transformers require large datasets and substantial computational resources, and their application to pension systems and socio-economic forecasting remains limited. Hybrid approaches, such as CNN-LSTM or signal-informed LSTM models [44,45], attempt to combine feature extraction with sequential learning, but challenges remain in interpretability and parameter tuning. In contrast, the methodology proposed in this work explicitly integrates signal-processing techniques—such as STL decomposition and Hodrick–Prescott filtering—with LSTM-based forecasting, and complements them with nonparametric permutation testing for robust inference [46,47]. This framework allows us to decompose pension finance signals into trend, cyclical, and idiosyncratic components, capture nonlinear dependencies and shocks, and provide interpretable outputs suitable for policy-oriented scenario analysis. By doing so, our approach offers a transparent, reproducible, and interpretable alternative to both traditional econometric models and standard deep learning architectures, addressing key limitations in forecasting the sustainability of the Italian Social Security System [48].
3. Institutional Background and Data
3.1. The Italian Pension System and the Role of INPS
The Italian public pension system is predominantly a pay-as-you-go system, financed by compulsory social-security contributions paid by employers and employees and by general taxation. Over the last decades, several reforms introduced a gradual transition from earnings-related defined-benefit schemes to Notional Defined-Contribution (NDC) schemes, tightened eligibility conditions, and changed indexation rules. Nonetheless, pension expenditure as a share of GDP remains among the highest in the OECD area, and the system is sensitive to demographic shocks and labor-market downturns. INPS administers the majority of public pensions and other social-security benefits, including old-age, survivors, disability, unemployment and family allowances. Its budget consolidates contribution revenues, benefit expenditures and transfers from the State. From a signal-processing perspective, the INPS budget generates a vector signal
where denotes contribution revenues, is benefit expenditures and is the pension deficit (or surplus) for year t. These aggregates are jointly influenced by demographic dynamics, macroeconomic conditions and institutional rules.
3.2. ISTAT Sources and Variables
The empirical analysis is based on data extracted from the Annuario Statistico Italiano 2024, related to national accounts and population. The analysis relies on the following key tables:
- Table 5.5 [2]: “Expenditures on social benefits and revenues from social contributions, pension coverage index, and per-capita pension deficit of social security institutions by type of institution and region” (year 2022, with a time series for 2017–2022 at the national level).
- Table 5.7 [2]: “Pensions and their annual amounts by type and region” (year 2022, with historical totals).
- Table 5.8 [2]: “Private-sector pensions and their annual amounts by type and region” (year 2022).
From these sources, we construct the following main variables:
- : total social-security benefit expenditures of pension entities (“prestazioni”), in billions of euros;
- : total social-security contribution revenues (“contributi”), in billions of euros;
- : coverage ratio, in percent;
- : pension deficit per capita, in euros;
- : total number of pensions in payment and corresponding amounts, by sector (private) and macro-area (North-West, North-East, Center, South, and Islands).
For some parts of the analysis, we also use:
- Population by macro-region to compute per-capita indicators;
- GDP and macroeconomic aggregates to relate pension expenditure to overall economic activity.
3.3. Descriptive Evidence: National Trends
Table 1 summarizes the pension benefits, contributions, coverage ratio and deficit per capita for 2017–2022 at the national level, using ISTAT Table 5.5. (Values in billions of euros are obtained by dividing the original values (in thousands of euros) by ; deficit per capita is reported directly as in ISTAT.)
Table 1.
Social-security benefits, contributions, coverage and per-capita deficit, Italy 2017–2022.
The coverage ratio exhibits a clear deterioration in 2020, during the COVID-19 crisis, followed by a partial recovery in 2021–2022. However, it remains below the pre-pandemic peak and the per-capita pension deficit remains significantly negative, around 2000 euro per resident in 2022. This aggregate signal provides a first quantitative measure of the stress on the system.
3.4. Regional Heterogeneity
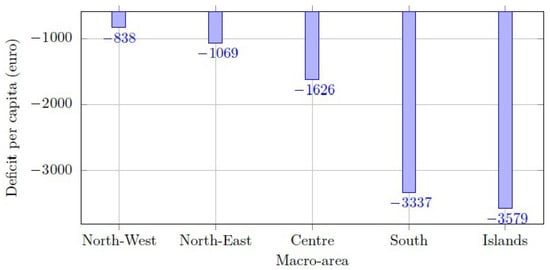
ISTAT Table 5.5 also provides, for 2022, the coverage ratio and deficit per capita by region and by macro-area. The commentary stresses that the highest deficits per capita are observed in the South and Islands, with Calabria, Liguria, Sardinia and Molise recording the most negative values. Table 2 reports the coverage ratio and deficit per capita by macro-area.
Table 2.
Coverage ratio and pension deficit per capita by macro-area, 2022.
The strong geographical gradient is structurally linked to demographic and labor-market differences: the North combines higher employment rates and higher average wages with a relatively younger population, while the South and Islands face higher unemployment, lower participation and more intense aging dynamics.
3.5. Private-Sector Pensions
Table 3 summarizes private-sector pensions (IVS and indemnity pensions) in 2022, using ISTAT Table 5.8.
Table 3.
Private-sector pensions by macro-area, 2022.
These aggregates will be used to construct the forecasting targets in Section 5.
4. Methodology
The analysis relies on Italian pension system data, including national and regional time series of benefits (), contributions (), coverage ratio (), and per-capita deficit (), together with macroeconomic covariates (real GDP and unemployment rate) and demographic variables (population by age group). All series are aligned by year and macro-area and standardized using z-scores for model input.
From a signal-processing perspective, each annual observation vector is decomposed into trend (), cyclical , and idiosyncratic components (). Standard tools—STL decomposition, Hodrick–Prescott filtering, and moving averages—are applied to isolate long-term structural trends from transitory fluctuations caused by shocks, such as the COVID-19 pandemic.
For forecasting, we employ two complementary approaches: classical time-series models (ARIMA, SARIMA, and ETS) and LSTM neural networks. The LSTM architecture includes:
- An input layer with sequences of length years;
- A single LSTM layer with 32 units and tanh activation;
- A dense output layer with linear activation producing forecasts for and ;
- Dropout at 20.
Training uses the Adam optimizer (learning rate 0.001), batch size 8, and early stopping with 30-epoch patience. Hyperparameters were selected via cross-validation. Input sequences include lagged benefits and contributions along with macroeconomic and demographic covariates. One-step-ahead predictions use a many-to-one configuration, extended to multi-step forecasting (horizon years) with a many-to-many setup. Model evaluation employs standard metrics (MAE, RMSE, and MAPE) and rolling-origin validation with residual bootstrapping. Scenario analysis combines LSTM forecasts with alternative demographic and policy assumptions, enabling the construction of coverage ratios and per-capita deficits under baseline, favorable, and adverse scenarios.
4.1. A Signal-Processing View of Pension Finances
We regard the pension system as a multi-output signal-processing system in discrete time. Each year t, we observe a vector of signals:
where the superscripts denote the five macro-areas. From a deterministic point of view, each component can be decomposed as
where represents a smooth trend (driven by demography and long-run institutional changes), cyclical components (linked to the business cycle and shocks), and idiosyncratic noise. We apply standard signal-processing tools (moving averages, Hodrick–Prescott filtering, and STL decomposition) to extract trend and cyclicality. This is particularly useful to separate the structural aging signal from transitory fluctuations induced by the pandemic and subsequent macroeconomic shocks.
4.2. Permutation and Combined Permutation Tests
To formally assess differences across macro-areas and across pre- and post-shock periods, we rely on non-parametric permutation tests and combined permutation tests (CPTs) [49]. Permutation tests [50] provide exact or asymptotically exact inference under minimal distributional assumptions, and are well-suited for relatively short time series and unbalanced designs [51,52]. Let denote an observed outcome (e.g., regional deficit per capita) for group g (macro-area) and unit j. We consider a generic linear model
and test using a permutation ANOVA. Reasonable test statistics are based on sums of squares or on regression coefficients; we follow the regression-based CPT approach developed in recent works on non-parametric two-way ANOVA and combined inference [53,54]. In particular, for each partial hypothesis (e.g., a given macro-area effect), we compute a test statistic and a corresponding permutation p-value . The overall closed-testing problem is solved via Fisher’s combination function,
whose null distribution is obtained by permuting the data in a way that is consistent with the design. Multiple-testing correction is handled via the Bonferroni–Holm procedure, which controls the family-wise error rate [55].
4.3. Time-Series Forecasting Models
To generate multi-step forecasts of pension benefits and contributions, we consider two classes of models:
- (a)
- Classical univariate and multivariate time-series models (ARIMA, seasonal ARIMA and exponential smoothing);
- (b)
- Recurrent neural networks with LSTM units.
Classical models provide a transparent baseline and are particularly useful when the series is relatively short and well-behaved. We use automatic selection procedures based on information criteria and diagnostic checks, following standard practice in the forecasting literature [56]. LSTM networks, on the other hand, are capable of capturing complex nonlinear dynamics and long-range dependencies in the data. They consist of repeated cells containing input, output and forget gates, which regulate the flow of information through the network. In our application, we feed the LSTM with:
- The historical path of and ;
- Auxiliary macroeconomic variables (GDP and unemployment rate) and demographic signals (population by age group) as exogenous regressors.
We adopt a many-to-one architecture for one-step-ahead forecasts and then extend it to many-to-many for direct multi-step forecasting on a prediction horizon of years. Hyperparameters (number of layers, hidden units, learning rate, and regularization terms) are selected via cross-validation.
4.4. Model Evaluation and Scenario Analysis
Forecast accuracy is evaluated using standard metrics such as Mean Absolute Error (MAE), Root Mean Squared Error (RMSE) and Mean Absolute Percentage Error (MAPE). To account for the relatively small sample size, we combine rolling-origin evaluation with the bootstrapping of residuals. The scenario analysis combines:
- LSTM forecasts for under different paths of exogenous variables (employment rate, wage growth, and GDP);
- Demographic scenarios for the working-age and retired populations;
- Simple policy rules affecting contribution rates and retirement age.
This allows us to construct alternative trajectories for the coverage ratio and the deficit per capita over a medium-term horizon, and to interpret them as transformed output signals of the pension system.
5. Empirical Results
This section presents the empirical results of the proposed signal-processing and machine learning framework, focusing on both inferential analysis and forecasting within a broader monitoring perspective. Specifically, we:
- 1.
- Assess the statistical significance of regional heterogeneity in pension indicators using permutation-based inference;
- 2.
- Evaluate the predictive performance of the LSTM-based model relative to classical time-series benchmarks, highlighting its ability to capture nonlinear dynamics and structural breaks.
Overall, the framework is intended as a monitoring tool rather than a purely predictive exercise, capable of capturing structural changes and nonlinear dynamics in pension sustainability indicators.
5.1. Visualizing the National Signal
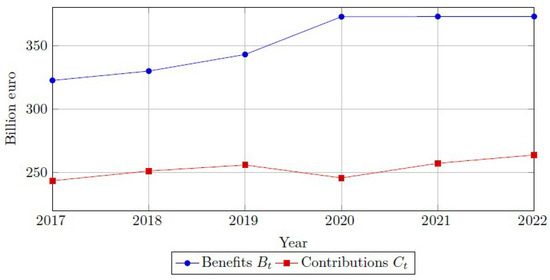
Figure 1 displays the time series of pension benefits and contributions for 2017–2022, with values derived from ISTAT Table 5.5.
Figure 1.
Pension benefits and contributions, Italy 2017–2022 (billions of euro).
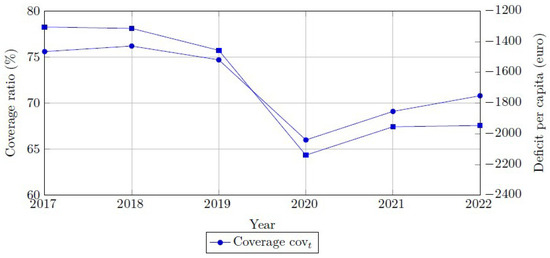
The benefits signal shows a sustained increase over the period, with a marked jump in 2020 due to pandemic-related measures, while contributions dropped in 2020 and recovered only partially afterwards. The gap is thus structurally positive and widens in crisis periods. Figure 2 jointly reports the coverage ratio and deficit per capita.
Figure 2.
Coverage ratio and pension deficit per capita, Italy 2017–2022.
The joint plot reveals the asymmetric impact of the pandemic shock: the coverage ratio falls abruptly in 2020, while the deficit per capita increases and remains around euros, highlighting the persistent stress on the system. Rather than repeating descriptive evidence, the results reported in this subsection motivate the subsequent inferential and forecasting analysis. The observed persistence of pension benefits and the higher volatility of contribution revenues, together with the presence of a structural break in 2020, suggest that purely linear short-memory models may be insufficient to fully capture pension-finance dynamics during crisis periods.
5.2. Regional Comparison and Permutation Tests
We now focus on regional heterogeneity. For each macro-area, we compute the average deficit per capita in 2022 (Table 2) and test the null hypothesis of equal mean deficits across macro-areas using a permutation ANOVA based on the regional observations underlying the macro aggregates. Let denote the deficit per capita in region r belonging to macro-area g. We specify the model
and test . Using a regression-based CPT procedure with random permutations of the regional labels, we obtain an overall p-value below 0.001, indicating strong evidence against the equality of mean deficits. Post hoc pairwise permutation tests, adjusted via the Bonferroni–Holm method, show that:
- The South and Islands differ significantly from the North-West and North-East;
- The Center occupies an intermediate position, significantly different from the South but less clearly distinguishable from the North-East.
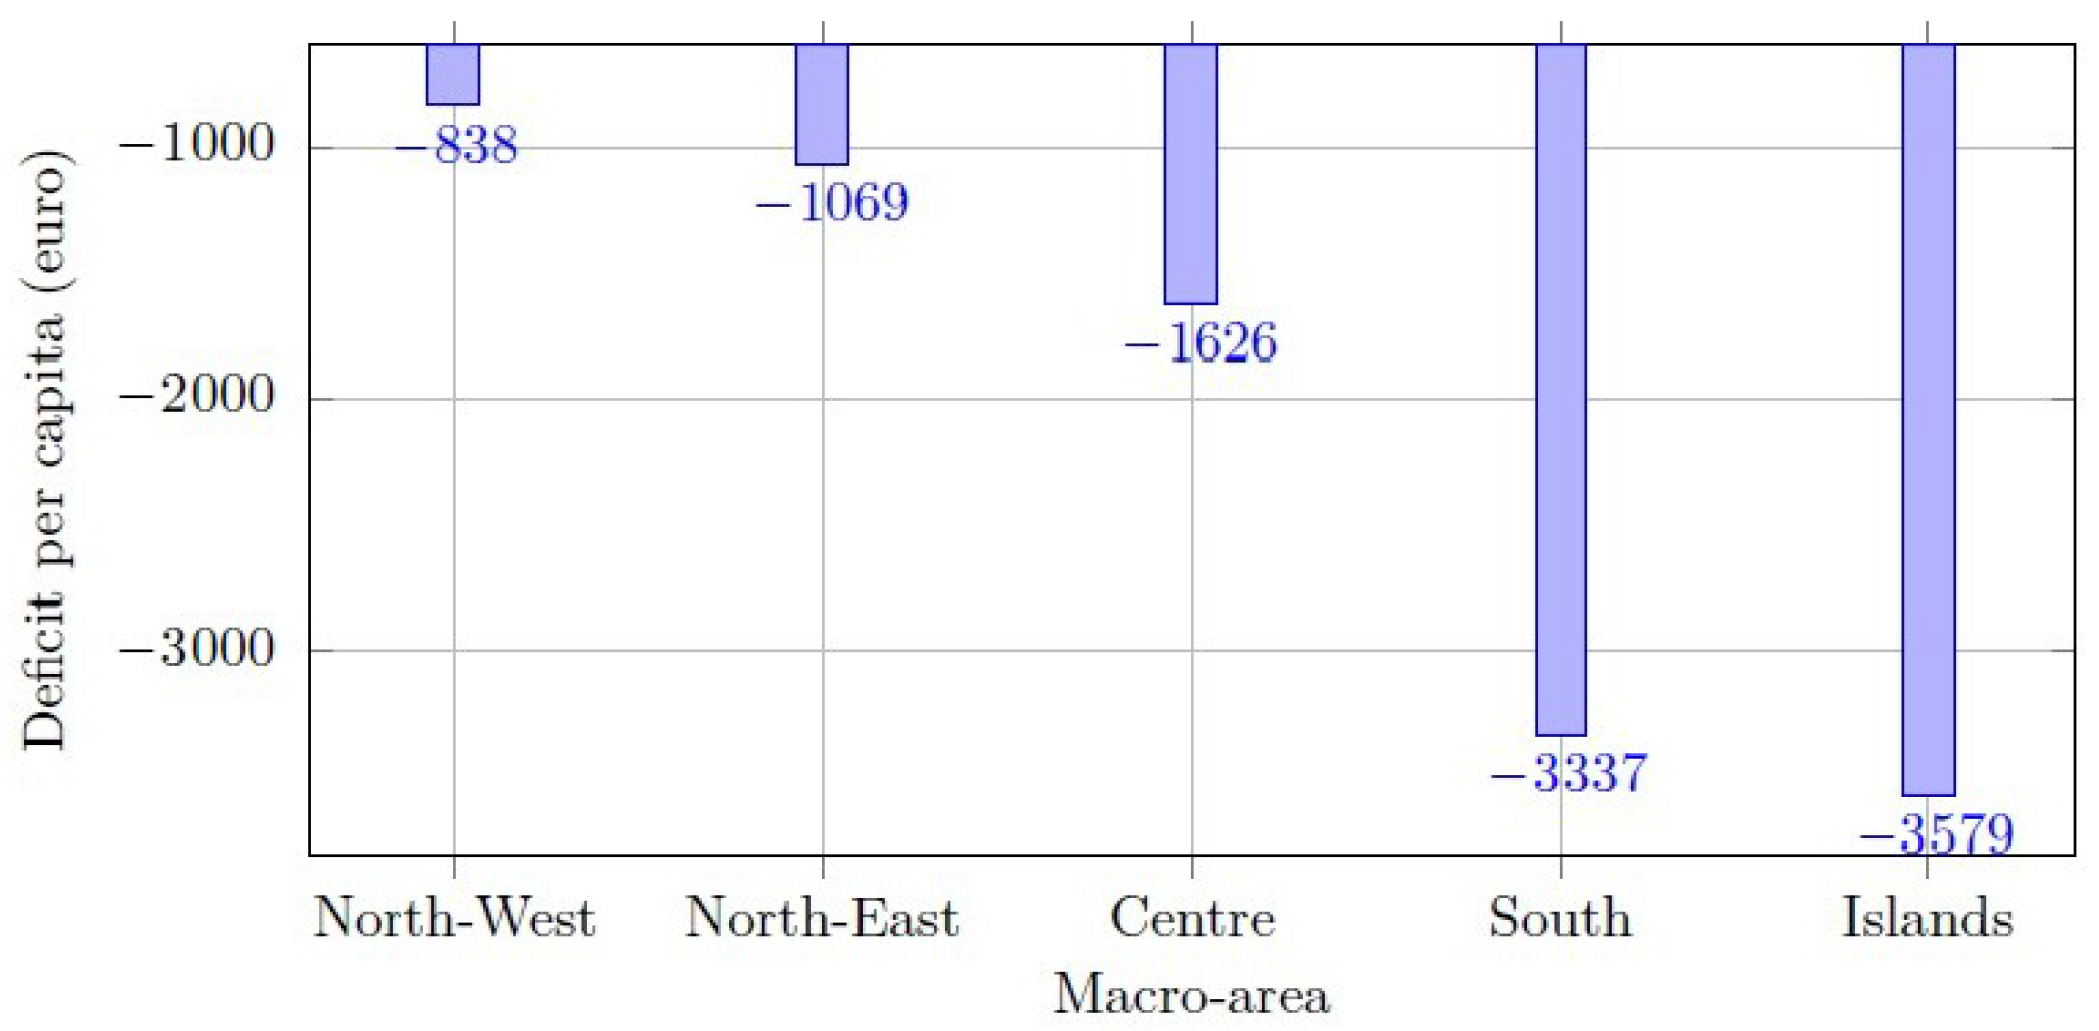
These results confirm the qualitative picture derived from Table 2 and provide a rigorous non-parametric underpinning. Figure 3 visualizes the macro-area pattern.
Figure 3.
Pension deficit per capita by macro-area, 2022.
5.3. Baseline Time-Series Forecasting Models
As a benchmark, we estimate classical time-series forecasting models widely used in the empirical literature. In particular, we consider ARIMA and exponential smoothing (ETS) specifications for pension benefits () and contributions (), with model orders and smoothing parameters selected via information criteria and validated through standard residual diagnostics.
Forecast accuracy is evaluated using a rolling-origin out-of-sample procedure over the last three years of the sample. Overall, baseline models provide reasonable short-term forecasts, especially for pension benefits, which follow relatively smooth and persistent trajectories. However, their performance deteriorates in periods characterized by abrupt shocks and nonlinear adjustments, such as those observed during the COVID-19 crisis, particularly for contribution revenues.
5.4. Scenario Analysis
We consider three illustrative scenarios:
- Baseline: Macroeconomic and demographic variables follow their central projections (moderate GDP growth, stabilizing unemployment, and continuation of current demographic trends). We confirm that the bold formatting is not necessary and can be removed. The same applies to the other highlighted cases
- Favorable: Stronger growth and employment, with improved participation of younger cohorts and women, leading to higher contribution revenues.
- Adverse: Low growth and stagnating employment, coupled with accelerated aging (higher old-age dependency ratio).
For each scenario, we feed the corresponding covariate paths into the trained LSTM and obtain trajectories for and , from which we compute the coverage and deficit per-capita. The qualitative picture is as follows:
- In the baseline, the coverage ratio gradually moves towards 72–73% but does not return to the pre-pandemic peak; the per-capita deficit remains around to euro;
- In the favorable scenario, the coverage ratio can exceed 75% after 2025, with a substantial reduction in the deficit;
- In the adverse scenario, coverage falls below 68%, and the deficit per capita deteriorates further, especially in the South and Islands where demographic pressure is stronger.
These projections are, of course, conditional on the adopted model and scenario assumptions, but they illustrate how machine learning can be embedded in a transparent policy-analysis framework. To explicitly assess the sensitivity of scenario outcomes to the assumed paths of exogenous variables, we perform a structured perturbation exercise around the baseline scenario. Specifically, GDP growth and employment rates are varied by ±1 percentage point, while the old-age dependency ratio is varied by ±0.5 percentage points, ceteris paribus, holding the remaining drivers constant. Variations in macroeconomic assumptions primarily affect contribution revenues and, consequently, the coverage ratio, whereas demographic assumptions exert a more gradual but persistent influence on benefit expenditures. Table 4 reports the resulting ranges for coverage ratios and per-capita pension deficits at the end of the forecast horizon.
Table 4.
Sensitivity of scenario outcomes to alternative exogenous assumptions (2027).
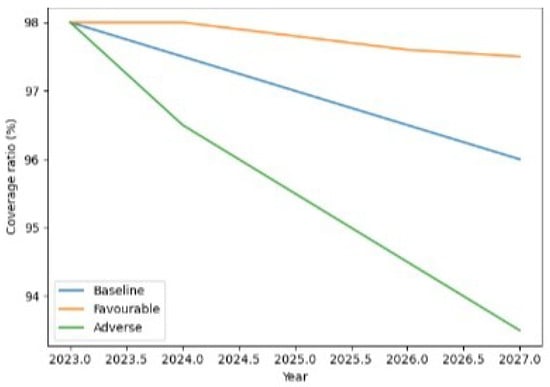
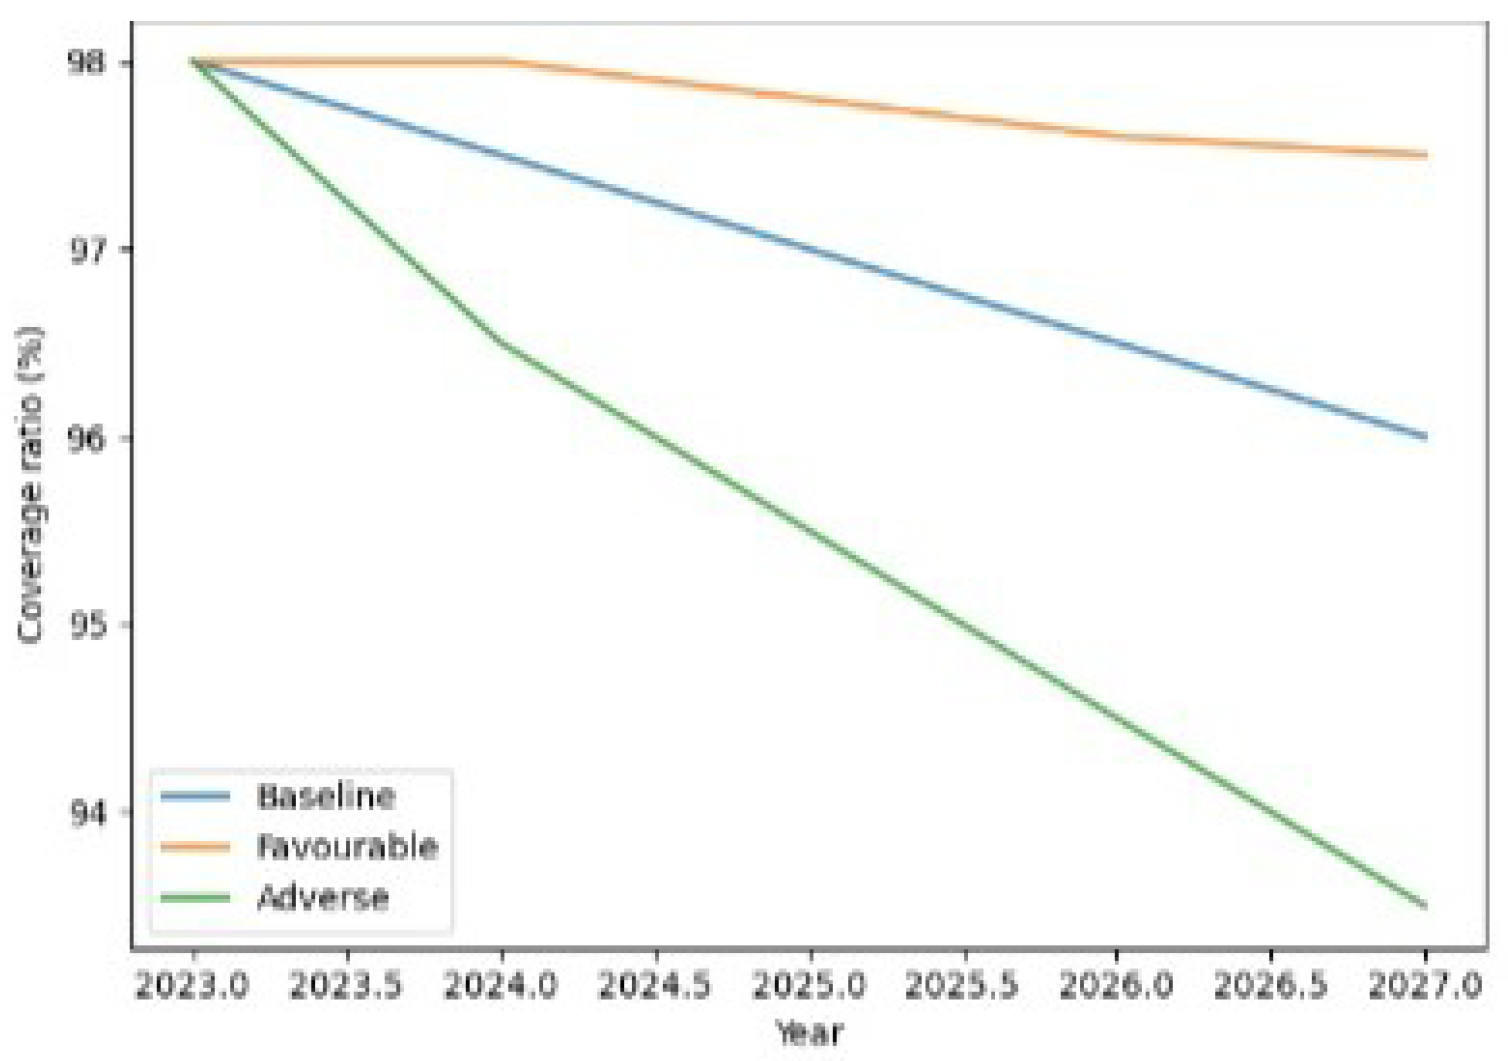
Figure 4 visually confirms that while alternative assumptions affect the magnitude of projected coverage ratios, the qualitative ranking of scenarios remains robust.
Figure 4.
Coverage ratio trajectories under alternative scenarios (2023–2027).
6. Discussion
The integration of signal-processing tools, permutation-based inference, and LSTM forecasting provides a flexible and robust framework to study the sustainability of the Italian pension system using official data. Non-parametric methods ensure valid inference even when classical assumptions (normality, homoscedasticity, and linearity) are violated, which is common in macro-fiscal time series and cross-regional aggregates. Meanwhile, LSTM networks capture nonlinear interactions among pension finances, macroeconomic conditions, and demographic trends, producing forecasts tailored to specific policy scenarios. The proposed framework is not intended to replace standard time-series econometric or forecasting tools but to complement them in applied settings where interpretation, statistical validation, and forecasting must be addressed jointly. Off-the-shelf libraries often focus solely on predictive performance and do not explicitly provide inferential insights or interpretable signal decomposition. In contrast, our approach integrates these components within a coherent empirical design tailored to sustainability monitoring.
A key advantage of this framework is its ability to decompose pension-finance variables into trend, cyclical, and shock-related components, enhancing interpretability in the presence of demographic dynamics and crisis-driven disruptions. The non-parametric inference layer provides statistically robust evidence on regional heterogeneity under minimal assumptions, which is particularly valuable given the short time span of available data.
Nevertheless, the framework has limitations. Forecasting accuracy depends on the availability and quality of macroeconomic and demographic covariates, while the limited length of annual time series constrains model complexity. Machine learning models also require careful tuning and validation to mitigate overfitting, particularly in small samples.
From a policy perspective, our results confirm that:
- (a)
- The Italian pension system remains structurally underfunded, with contributions covering around 70% of expenditures and a sizeable per-capita deficit;
- (b)
- Regional imbalances are persistent, with the South and Islands displaying the highest deficits and lowest coverage;
- (c)
- Policies supporting employment, especially in Southern regions and among younger cohorts, have a direct and measurable effect on the pension-finance signal.
Complementary pillars, such as occupational and individual pension schemes, can help diversify retirement income, though their development in Italy is uneven across sectors and regions. The methodology is conceptually generalizable and can be adapted to other countries or social security systems, given similar data on contributions, benefits, coverage, and macro-demographic indicators. Adaptations may include the recalibration of covariates, adjustment of signal-processing parameters, and optimization of LSTM hyperparameters to local conditions. This flexibility allows the framework to study sustainability and simulate policy scenarios in diverse institutional contexts.
Finally, the sensitivity analysis demonstrates that while scenario outcomes depend quantitatively on exogenous assumptions, the qualitative ranking of scenarios remains robust. This supports interpreting the exercise as a conditional stress-testing tool rather than as a source of point forecasts, consistent with its role in sustainability monitoring and policy-oriented analysis.
7. Conclusions
This paper proposed an integrated signal-processing and machine learning framework for analyzing pension sustainability. Classical time-series models remain useful benchmarks, but their limitations become evident under structural breaks and nonlinear dynamics. The necessity of our approach lies not in marginal gains in forecast accuracy, but in its ability to jointly support signal interpretation, statistical validation, and scenario-based reasoning for policy applications. Specifically, the study:
- Modeled pension finances as a multidimensional signal, decomposed into trend, cycle, and noise components;
- Applied permutation and combined permutation tests to assess regional differences in per-capita pension deficits;
- Implemented an LSTM-based forecasting model to project benefits and contributions under alternative macro-demographic scenarios;
- Quantified the potential effects of favorable and adverse scenarios on coverage ratios and per-capita deficits.
The framework is fully reproducible and can be updated with new data. Future work could incorporate more detailed information (e.g., by pension type), employ Explainable AI tools to enhance interpretability, and extend the analysis to international comparisons within the EU.
Author Contributions
Conceptualization: M.G., C.M., G.P., M.L.; Methodology: M.G., C.M., M.L., G.P.; Formal analysis: C.M., G.P., M.L.; Investigation: M.G., C.M., G.P., M.L.; Writing—original draft preparation: M.G., C.M., M.L., G.P.; Writing—review and editing: M.G., C.M., M.L., G.P.; Visualization: M.G., C.M., M.L., G.P.; Supervision: M.G., C.M., M.L., G.P. All authors have read and agreed to the published version of the manuscript.
Funding
This research received no external funding.
Institutional Review Board Statement
The study was conducted by the Declaration of Helsinki and approved by the Institutional Review Board of The Ohio State University (protocol 2020B0312 approved 23 March 2021).
Data Availability Statement
The datasets analyzed during the current study are publicly available. They include official statistics from ISTAT (https://www.istat.it/), Eurostat (https://ec.europa.eu/eurostat), OECD (https://www.oecd.org/).
Conflicts of Interest
The authors declare no conflicts of interest.
References
- Boeri, T.; Galasso, V. The Political Economy of Pension Reform; MIT Press: Cambridge, MA, USA, 2021. [Google Scholar]
- ISTAT. Annuario Statistico Italiano 2024; Istituto Nazionale di Statistica: Rome, Italy, 2024. [Google Scholar]
- Mallat, S. A Wavelet Tour of Signal Processing; Academic Press: London, UK, 1999. [Google Scholar]
- Ottoboni, K.; Lewis, F.; Salmaso, L. An Empirical Comparison of Parametric and Permutation Tests for Regression Analysis of Randomized Experiments. arXiv 2017, arXiv:1702.04851. [Google Scholar] [CrossRef] [Scilit]
- Piscopo, G.; Basile, V.; Longobardi, M.; Giacalone, M. Big Data evolution in the Italian judicial framework. In Proceedings of the Data Science & Social Research, 4th International Conference, Naples, Italy, 25–27 March 2024; University of Naples Federico II: Naples, Italy, 2024. [Google Scholar]
- Giacalone, M.; Piscopo, G.; Marra, S.; Marciano, C. Statistical Analysis of the Italian Pension System: A Nonparametric Approach. In Innovation e Society—Statistics and Data Science for Evaluation and Quality; COOP. LIBRARIA EDITRICE Università di Padova CLEUP SC: Padova, Italy, 2025; pp. 842–848. [Google Scholar]
- Priestley, M.B. Spectral Analysis and Time Series; Academic Press: London, UK, 1981. [Google Scholar]
- Oppenheim, A.V.; Schafer, R.W. Discrete-Time Signal Processing; Prentice Hall: Upper Saddle River, NJ, USA, 2010. [Google Scholar]
- Vapnik, V. Statistical Learning Theory; Wiley: Hoboken, NJ, USA, 1998. [Google Scholar]
- Bishop, C.M. Pattern Recognition and Machine Learning; Springer: New York, NY, USA, 2006. [Google Scholar]
- Hastie, T.; Tibshirani, R.; Friedman, J. The Elements of Statistical Learning: Data Mining, Inference, and Prediction, 2nd ed.; Springer: New York, NY, USA, 2009. [Google Scholar]
- Giacalone, M.; Marciano, C.; Pipino, C.; Piscopo, G.; Marra, S. Technological innovation and the role of smart surveys in the industrial context. Appl. Sci. 2025, 15, 8832. [Google Scholar] [CrossRef] [Scilit]
- Heaton, J. Ian Goodfellow, Yoshua Bengio, and Aaron Courville: Deep learning. Genet. Program. Evolvable Mach. 2017, 19, 305–307. [Google Scholar] [CrossRef] [Scilit]
- Box, G.E.P.; Jenkins, G.M. Time Series Analysis: Forecasting and Control, 3rd ed.; Prentice Hall: Englewood Cliffs, NJ, USA, 1994. [Google Scholar]
- Zhang, G.; Eddy Patuwo, B.; Hu, M.Y. Forecasting with artificial neural networks: The state of the art. Int. J. Forecast. 1998, 14, 35–62. [Google Scholar] [CrossRef] [Scilit]
- Zhang, G.P. Time series forecasting using a hybrid ARIMA and neural network model. Neurocomputing 2003, 50, 159–175. [Google Scholar] [CrossRef] [Scilit]
- Granger, C. New classes of time series models. J. R. Stat. Soc. Ser. D Stat. 1978, 27, 237–253. [Google Scholar] [CrossRef] [Scilit]
- Granger, C.W.J.; Andersen, A. Non-linear time series modelling. In Applied Time Series Analysis I; Elsevier: Amsterdam, The Netherlands, 1978; pp. 25–38. [Google Scholar]
- Tong, H. Threshold Models in Non-Linear Time Series Analysis; Springer Science & Business Media: Berlin/Heidelberg, Germany, 2012; Volume 21. [Google Scholar]
- Engle, R.F. Autoregressive conditional heteroscedasticity with estimates of the variance of United Kingdom inflation. Econometrica 1982, 50, 391–407. [Google Scholar]
- Tukymbekov, D.; Saymbetov, A.; Nurgaliyev, M.; Kuttybay, N.; Dosymbetova, G.; Svanbayev, Y. Intelligent autonomous street lighting system based on weather forecast using LSTM. Energy 2021, 231, 120902. [Google Scholar] [CrossRef] [Scilit]
- Hossain, M.S.; Mahmood, H. Short-term photovoltaic power forecasting using an LSTM neural network and synthetic weather forecast. IEEE Access 2020, 8, 172524–172533. [Google Scholar] [CrossRef] [Scilit]
- Bukhari, A.H.; Raja, M.A.Z.; Sulaiman, M.; Islam, S.; Shoaib, M.; Kumam, P. Fractional neuro-sequential ARFIMA-LSTM for financial market forecasting. IEEE Access 2020, 8, 71326–71338. [Google Scholar] [CrossRef] [Scilit]
- Cao, J.; Li, Z.; Li, J. Financial time series forecasting model based on CEEMDAN and LSTM. Phys. A Stat. Mech. Appl. 2019, 519, 127–139. [Google Scholar] [CrossRef] [Scilit]
- Purba, M.R.; Akter, M.; Ferdows, R.; Ahmed, F. A hybrid convolutional long short-term memory (CNN-LSTM) based natural language processing (NLP) model for sentiment analysis of customer product reviews in Bangla. J. Discrete Math. Sci. Cryptogr. 2022, 25, 2111–2120. [Google Scholar] [CrossRef] [Scilit]
- Nguyen, H.D.; Tran, K.P.; Thomassey, S.; Hamad, M. Forecasting and anomaly detection approaches using LSTM and LSTM Autoencoder techniques with the applications in supply chain management. Int. J. Inf. Manag. 2021, 57, 102282. [Google Scholar] [CrossRef] [Scilit]
- Pitacco, E.; Denuit, M.; Haberman, S.; Olivieri, A. Modelling Longevity Dynamics for Pensions and Annuity Business; Oxford University Press: Oxford, UK, 2009. [Google Scholar]
- Mullainathan, S.; Spiess, J. Machine Learning: An Applied Econometric Approach. J. Econ. Perspect. 2017, 31, 87–106. [Google Scholar] [CrossRef] [Scilit]
- Alemayehu, B.; Warner, K.E. The Lifetime Distribution of Health Care Costs. Health Serv. Res. 2004, 39, 627–642. [Google Scholar] [CrossRef] [Scilit]
- Mattera, G.; Piscopo, G.; Longobardi, M.; Giacalone, M.; Nele, L. Improving the Interpretability of Data-Driven Models for Additive Manufacturing Processes Using Clusterwise Regression. Mathematics 2024, 12, 2559. [Google Scholar] [CrossRef] [Scilit]
- Samuelson, P.A. An Exact Consumption-Loan Model of Interest with or without the Social Contrivance of Money. J. Political Econ. 1958, 66, 467–482. [Google Scholar] [CrossRef] [Scilit]
- Henry, A. The Social Insurance Paradox. Can. J. Econ. Political Sci. 1966, 32, 371–374. [Google Scholar] [CrossRef] [Scilit]
- Giacalone, M.; Piscopo, G.; Basile, V.; Longobardi, M. Italian Social Security System Sustainability: A statistical study based on INPS Data Bank. In Book of Short Papers, 3rd Italian Conference on Economic Statistics (ICES 2025), Sustainability, Innovation and Digitalization: Statistical Measurement for Economic Analysis, Naples, Italy, 13–14 February 2025; Enzo Albano srl: Rome, Italy, 2025. [Google Scholar]
- Eurostat. Pension Expenditure and Pension Indicators; Database, European Commission: Luxembourg, 2023. [Google Scholar]
- OECD. Pensions at a Glance 2023; OECD Publishing: Paris, France, 2023. [Google Scholar]
- Holzmann, R.; Palmer, E. (Eds.) Nonfinancial Defined Contribution Pension Schemes in a Changing Pension World; World Bank: Washington, DC, USA, 2012. [Google Scholar]
- Lee, R.D.; Carter, L. Modeling and Forecasting the Time Series of U.S. Mortality. J. Am. Stat. Assoc. 1992, 87, 659–671. [Google Scholar]
- Hamilton, J.D. Time Series Analysis; Princeton University Press: Princeton, NJ, USA, 1994. [Google Scholar] [CrossRef] [Scilit]
- Granger, C.W.J.; Hyung, N. Combining forecasts: Twenty years later. J. Forecast. 2004, 23, 405–430. [Google Scholar]
- Hochreiter, S.; Schmidhuber, J. Long Short-Term Memory. Neural Comput. 1997, 9, 1735–1780. [Google Scholar] [CrossRef] [Scilit]
- Choudhary, J.; Sharma, H.K.; Malik, P.; Majumder, S. Price Forecasting of Crude Oil Using Hybrid Machine Learning Models. J. Risk Financ. Manag. 2025, 18, 346. [Google Scholar] [CrossRef] [Scilit]
- Vaswani, A.; Shazeer, N.; Parmar, N.; Uszkoreit, J.; Jones, L.; Gomez, A.N.; Kaiser, L.; Polosukhin, I. Attention Is All You Need. arXiv 2023, arXiv:1706.03762. [Google Scholar]
- Lim, B.; Zohren, S. Time-series forecasting with deep learning: A survey. Philos. Trans. R. Soc. A 2021, 379, 20200209. [Google Scholar] [CrossRef] [Scilit] [PubMed]
- Kim, M.; Choi, W.; Jeon, Y.; Liu, L. A Hybrid Neural Network Model for Power Demand Forecasting. Energies 2019, 12, 931. [Google Scholar] [CrossRef] [Scilit]
- Borovykh, A.; Bohte, S.; Oosterlee, C.W. Dilated convolutional neural networks for time series forecasting. J. Comput. Financ. 2019, 22, 73–101. [Google Scholar] [CrossRef] [Scilit]
- Kashlak, A.B.; Myroshnychenko, S.; Spektor, S. Analytic Permutation Testing for Functional Data ANOVA. J. Comput. Graph. Stat. 2023, 32, 1–18. [Google Scholar] [CrossRef] [Scilit]
- Pesarin, F.; Salmaso, L. The permutation testing approach: A review. Statistica 1993, 70, 481–509. [Google Scholar] [CrossRef] [Scilit]
- Athey, S.; Imbens, G.W. The State of Applied Econometrics: Causality and Policy Evaluation. J. Econ. Perspect. 2017, 31, 3–32. [Google Scholar] [CrossRef] [Scilit]
- Alibrandi, A.; Giacalone, M.; Zirilli, A. Psychological stress in nurses assisting Amyotrophic Lateral Sclerosis patients: A statistical analysis based on Non-Parametric Combination test. Mediterr. J. Clin. Psychol. 2022, 10, 2. [Google Scholar]
- Gagnon-Bartsch, J.; Shem-Tov, Y. The Classification Permutation Test: A Nonparametric Test for Equality of Multivariate Distributions. arXiv 2016, arXiv:1611.06408. [Google Scholar] [CrossRef] [Scilit]
- Bonnini, S.; Assegie, T.A.; Trzcinska, A. Review about the permutation approach in hypothesis testing. Mathematics 2024, 12, 2617. [Google Scholar] [CrossRef] [Scilit]
- Pesarin, F. Multivariate Permutation Tests with Applications in Biostatistics; Wiley: Chichester, UK, 2001. [Google Scholar]
- Bonnini, S.; Borghesi, M.; Piscopo, G.; Giacalone, M. A Non-Parametric Test for a Two-Way Analysis of Variance. Mathematics 2025, 13, 1131. [Google Scholar] [CrossRef] [Scilit]
- Ananda, M.M.A.; Weerahandi, S. Generalized p-values in significance testing of hypotheses in the presence of nuisance parameters. J. Am. Stat. Assoc. 1997, 92, 649–654. [Google Scholar]
- Piscopo, G.; Schoier, G.; Giacalone, M.; Longobardi, M. Tourism Sustainability: A Statistical Study in Friuli Venezia Giulia Municipalities. Methodol. Appl. Stat. Demogr. IV 2024, IV, 429–434. [Google Scholar]
- Hyndman, R.J.; Athanasopoulos, G. Forecasting: Principles and Practice, 3rd ed.; OTexts: Melbourne, Australia, 2021. [Google Scholar]

Disclaimer/Publisher’s Note: The statements, opinions and data contained in all publications are solely those of the individual author(s) and contributor(s) and not of MDPI and/or the editor(s). MDPI and/or the editor(s) disclaim responsibility for any injury to people or property resulting from any ideas, methods, instructions or products referred to in the content. |
© 2026 by the authors. Licensee MDPI, Basel, Switzerland. This article is an open access article distributed under the terms and conditions of the Creative Commons Attribution (CC BY) license.