


Abstract
The empowerment provided by third-party intelligent information platforms has emerged as a crucial driving force for facilitating the digital transformation of supply chain enterprises. Whether and how intelligent information platforms are engaged is a key to the digital transformation of the supply chain. This essay endeavors to establish theoretical underpinnings for supply chain digital transformation and assist enterprises in resolving transformation-related issues. Based on the tripartite evolutionary game, this essay analyzes the digital transformation of supply chain from the behavioral strategies of the third-party intelligent information platform, manufacturers and retailers, respectively. Combined with numerical simulation analysis, we explored the digital transformation patterns and characteristics of supply chains under different scenarios. The results suggest that joining an intelligent information platform will always be a balanced strategy for supply chain digital transformation, and that an increase in the level of platform enablement will accelerate the process, while potential threats to cybersecurity will slow it down. However, manufacturers may also build their own platforms when their initial digitization level is high or the cost of building their own platforms is not prohibitive, resulting in higher word-of-mouth benefits and digital longevity. This paper provides new perspectives for analyzing the impact of intelligent information platforms on supply chain digital transformation decisions, and ultimately proposes practical operation and management recommendations for related practices.
MSC:
91-10; 90B06; 90B50
1. Introduction
In today’s era, the digital economy occupies an increasingly important position in China’s economic system. It not only has a significant positive impact on the high-quality development of China’s economy [1] but also promotes the digital transformation of enterprises and contributes to enterprise innovation [2]. In this context, the digital transformation of supply chain enterprises has become a general trend [3,4,5]. For supply chain enterprises, digital transformation is not only an upgrade of technology, but also a strategic choice. Through digital transformation, enterprises can break the limitations of the traditional supply chain and realize the synergy and mutual benefit of the whole chain. More and more companies are focusing on supply chain management platforms, while digital R&D and design tools and industrial internet platforms are becoming more and more popular.
At present, there are two main modes of supply chain digital transformation: One approach involves independently developing a smart supply chain platform by leveraging a manufacturer or retailer’s robust capabilities. This platform then enables participation from other upstream and downstream cooperative enterprises. The other is to access the third-party platform through the manufacturers and retailers respectively, so that the upstream and downstream enterprises of the supply chain can realize the coupling and coordination. Midea is a typical case of digital transformation of supply chain through self-built platform [6]. Midea Group has actively explored the path of digital and intellectual transformation, relying on the data and research and development capabilities of the group’s Midea Cloud Intelligent Digital, and perfected its self-developed intelligent supply chain platform. On the one hand, Midea’s intelligent supply chain platform closely connects logistics providers, sellers and other parties to facilitate real-time sharing of order information, inventory information, logistics information, etc. On the other hand, Midea delivers its own quality standards, technical requirements and other data in real time to manufacturers through the platform to help manufacturers improve product quality. 1688 is an important B2B platform under Alibaba Group that integrates retailers and manufacturers’ resources. 1688 can provide manufacturers with accurate market demand information according to different regions, industries, seasons and other factors, helping them to rationally arrange their production plans and inventory management plans; at the same time, 1688 also provides SMEs with more convenient, efficient and cost-effective purchasing and supply chain services, which helps them to reduce their purchasing costs and enhance market competitiveness [7].
However, supply chain digital transformation is still in an early stage of trying to find out, and still faces many problems and obstacles [8,9]. From one perspective, data quality and information security risks face challenges [10,11]. The supply chain has a huge amount of data circulating in various nodes, and it is difficult for enterprises to ensure that the data will not be leaked or tampered with. Once a data security problem occurs, individual enterprises and even the entire supply chain ecosystem will suffer huge losses. Moreover, enterprise digital transformation requires high costs investment. SMEs are cash-strapped, and the high upfront investment and ongoing expenses make it difficult for them to keep pace with the wave of digitalization [12].
While evolutionary game theory has been applied to study supply chain coordination, existing literature often focuses on two-party interactions (e.g., manufacturer-retailer) or treats digital platforms as static entities with fixed roles. This study extends this stream of research by developing a novel tripartite evolutionary game model that explicitly incorporates the third-party platform’s empowerment level as a core strategic variable. This modeling approach captures a more dynamic and realistic scenario where the platform can actively shape the digital ecosystem through its strategic investment decisions, rather than merely serving as a passive infrastructure. By doing so, this paper addresses a critical theoretical gap in understanding the co-evolutionary dynamics among platforms, manufacturers, and retailers in the context of digital transformation.
Given these challenges, this paper will study the digital transformation of supply chain enterprises, exploring whether manufacturers and retailers will adopt digital transformation strategies under varying conditions, the types of strategies implemented, and the role of third-party platforms in this process.
Our study is designed to investigate several salient theoretical mechanisms inherent to supply chain digital transformation. Specifically, the evolutionary game model developed herein allows us to examine the presence and impact of threshold effects, which may dictate non-linear adoption behaviors; cross-side network effects, which capture the strategic interdependence among platform participants; and multi-stability, which reflects the coexistence of distinct digitalization pathways for heterogeneous enterprises. Unpacking these mechanisms provides a deeper theoretical understanding of the dynamic decision-making processes involved.
This paper constructs a tripartite asymmetric evolutionary game model comprising the third-party platform, manufacturers, and retailers. This model formalizes the platform’s choice of empowerment level, the manufacturer’s choice of joining the platform or building its own, and the retailer’s choice of joining or not joining a platform into their respective strategy spaces. Informed by Service-Dominant (S-D) Logic, we frame the platform’s “empowerment level” not merely as a technical specification but as a value proposition offered to enterprises. The act of “joining” the platform is thus an engagement in value creation, where the platform provides the service infrastructure and enterprises realize value through its use. On the other hand, the Resource-Based View (RBV) informs our modeling of a manufacturer’s decision to “join” a platform (accessing its digital resources) versus “self-build” (relying on its own resource base). Additionally, Network Effect Theory provides the lens through which we analyze the cross-side interdependencies—how a retailer’s decision to join influences the manufacturer’s payoff, and vice versa—which are central to the platform’s value proposition. By defining the payoff matrix for different strategy combinations and introducing replicator dynamic equations to describe the evolution of strategy proportions, we can systematically analyze the evolutionarily stable states of each party’s strategies and the impact of key parameters on the system’s equilibrium. This mathematical model provides a solid analytical framework for understanding the path dependence and equilibrium outcomes of supply chain digital transformation from a dynamic perspective.
2. Literature Review
This study constructs a novel theoretical framework to systematically analyze the multi-dimensional composition and intrinsic mechanisms of supply chain digital transformation. The framework integrates four interconnected core dimensions: the technological foundation, the behavioral strategies of participating entities, inter-entity interactions, and critical contextual factors, thereby providing a comprehensive lens for examining digital practices within supply chains.
While a unified definition of supply chain digitization remains elusive in current research, a consensus exists that its core lies in the deep application of digital technologies across the supply chain [13,14,15]. A set of key technological pillars, such as the IoT, Big Data analytics, and AI, underpin these deep applications. These technologies form the foundational layer of digital transformation and influence overall supply chain performance through multiple pathways. Specifically, Internet of Things (IoT) technologies shorten the time between data capture and decision-making, enabling real-time responsiveness and enhancing both internal operations and collaboration with external partners [16]. Artificial Intelligence (AI) helps overcome information constraints inherent in traditional supply chains, streamlining problem identification and solution prototyping to foster process innovation and performance improvement [17]. Digital supply chains leveraging big data analytics have demonstrated superior performance in sustainability and flexibility [18]. Overall, digitization enhances cost-effectiveness and information/communication efficiency [14]. Furthermore, the depth and breadth of deploying a combination of technologies—such as Big Data, Cloud Computing, AI, and IoT—positively impact supply chain visibility, agility, and performance [19]. This underscores a key theme of our study: the critical importance of technological synergy, rather than the adoption of isolated tools, which in turn sets the stage for understanding the subsequent challenges of inter-entity interaction and integration discussed in the following sections.
The impact and strategic adoption of digital transformation vary significantly across different supply chain entities. This framework focuses on manufacturers, retailers, third-party platforms, and their interactions.
For Retailers, digital transformation, often mediated through platforms, drives business growth, marketing efficiency, and enhanced commercial capabilities. Digital platforms can assist small and medium-sized enterprises (SMEs) in their operations [20], influence cross-border expansion strategies based on network externalities [21], and facilitate business model transformation and operational capability reconstruction for SMEs [22]. For Manufacturers, digital transformation leads to more rational production planning, higher productivity, and strategic shifts. It enables the construction of data-centric business processes [23], allows for the provision of higher-quality digital services [24], and motivates a strategic shift from cost-based to differentiated competition through continuous innovation [25]. For Third-Party Platforms and Inter-Entity Collaboration, digital transformation reshapes collaborative relationships. Business-to-Business (B2B) platforms digitize inter-firm networks by connecting activities, resources, and participants [26]. From a strategic resource perspective, digital technologies are not merely tools but foundational assets that build dynamic capabilities. They enhance a firm’s ability to sense market shifts through data analytics, seize opportunities via agile digital platforms, and reconfigure resources for innovation, thereby establishing a sustainable competitive advantage. Besides, this research highlights the critical role of platform-centric interaction mechanisms, which are fundamentally explained by theories of network effects (driving platform value), social embeddedness (fostering or hindering trust and collaboration), and platform governance (structuring the rules of engagement). Effective co-innovation between suppliers and partners is facilitated under conditions of similar digital technology maturity and complementary digital resources [27]. Conversely, a vicious cycle can emerge between limited trust and limited digitization levels among value chain firms [28].
Beyond strategic adoption, the digital transformation journey is moderated by critical contextual factors and impeded by significant barriers, areas often underexplored in the prior literature. Digital platforms offer pathways for brand co-creation, making reputation control a pertinent issue [29]. Technologies like cloud computing, AI, and IoT can provide a competitive advantage, with corporate reputation being a notable aspect of this advantage [30]. Digitization introduces significant risks. Big data and cloud-based systems, while driving development, can lead to sensitive information leakage and privacy breaches [31]. Security and privacy are paramount concerns in data-driven intelligent applications [32], posing a potential threat to digital supply chains [33]. A core practical challenge is that many enterprises, particularly SMEs, fail to fully leverage digital technologies. Barriers such as technical inadequacies, data privacy/security concerns, and financial constraints hinder transformation progress—a gap not sufficiently addressed in existing research. These barriers represent concrete manifestations of the ‘critical contextual factors’ dimension in our framework, which act as significant moderators that can impede the digital transformation journey. This framework synthesizes the above dimensions to guide analysis. It acknowledges that while existing literature offers valuable theoretical insights into potential benefits and preliminary practical explorations [34,35,36], it often lacks depth in analyzing behavioral strategies among heterogeneous entities and systematically integrating critical contextual factors like reputation and cybersecurity.
Therefore, this study positions itself to address these deficiencies. It departs from the extant literature by: (1) accounting for the heterogeneous conditions and strategic behaviors of different supply chain entities (manufacturers, retailers, platforms); (2) incorporating a detailed examination of inter-entity interactions and collaboration dynamics; and (3) integrating previously underexplored but critical contextual factors—brand reputation and cybersecurity—alongside prevalent implementation barriers. These departures are analyzed while acknowledging the technological foundation as the essential infrastructure upon which these strategic behaviors and interactions are built and examined. By doing so, the framework aims to provide a comprehensive, multi-level analysis for deconstructing the digital transformation of supply chains, bridging theoretical potential with practical complexities. The novelty of this proposed framework lies in its synthesis of these diverse dimensions, offering a consolidated lens specifically constructed to address the research gaps identified in the literature above.
3. Materials and Methods
This study employs a combined approach of theoretical modeling and numerical simulation to investigate the strategic interactions and evolutionary equilibria among third-party intelligent information platforms, manufacturers, and retailers in the context of supply chain digital transformation.
The core analytical tool of this research is evolutionary game theory. Unlike classical game theory which assumes complete rationality, evolutionary game theory posits that players are boundedly rational, adjusting their strategies through trial-and-error, learning, and imitation. This makes it particularly suitable for analyzing the dynamic evolution of group behavior within complex economic systems. Given that supply chain digital transformation involves long-term strategic interactions and adaptive adjustments among multiple parties (manufacturers, retailers, platforms) under conditions of incomplete information, evolutionary game theory provides an appropriate theoretical framework. Specifically, we construct a Three-Party Asymmetric Evolutionary Game Model.
3.1. Players in the Game
The evolutionary game model involves three primary players in the process of supply chain digital transformation: manufacturers, retailers, and the third-party platform. In the process of market trading, all types of players possess limited information and have bounded rationality. They dynamically adjust their trading strategies during the trading decision-making process. Therefore, evolutionary game models can be used for simulation analysis for the participation of these three types of players in the market trading process.
3.2. Strategic Choices of Players
In an evolutionary game framework, all players are boundedly rational. Their strategic choices are not made with perfect information from the outset but are shaped by continuous adaptation to the internal state changes of other players and shifts in the external environment. Drawing on established practices in evolutionary game theory, this paper identifies the core factors that influence the decision-making of each player, combining general economic principles with the specific characteristics of supply chain digitalization.
The primary motive driving each player’s behavioral strategy is the pursuit of maximizing their own utility, which encompasses not only direct financial gains but also intangible benefits such as competitive advantage and long-term sustainability. The degree of satisfaction derived from a strategy, which is a function of these perceived benefits, is a key psychological driver of their decisions.
For the third-party platform, its strategic choice is the level of empowerment it provides, represented by the set {High empowerment, Low empowerment}. A high-empowerment strategy entails a greater upfront investment but promises higher service fees and significant word-of-mouth gains by attracting reputable enterprises. Conversely, a low-empowerment strategy minimizes initial costs but may lead to extra service expenses due to low operation efficiency and forgoes the reputational advantages of being a market leader. The platform continuously adjusts its strategy based on the perceived willingness of manufacturers and retailers to join, seeking the most profitable equilibrium.
For the Manufacturer, its strategic choice concerns the channel for digital transformation, represented by the set {Join the third-party platform, Build own digital platform}. A manufacturer may find the benefits of joining a platform compelling. However, if the cost of self-building is manageable and it can attract retailers to its own platform, self-building becomes an attractive path to independence and control. The manufacturer’s choice evolves by weighing the empowerment benefits, costs, risks, and the potential for disintermediation.
For the retailer, its strategic choice is one of participation, represented by the set {Join a platform, Not join a platform}. Joining a powerful platform provides access to superior digital tools, demand information, and broader market connectivity. However, this comes at the costs of service fees and potential risks. The retailer’s strategy evolves by comparing the net benefit of platform membership against the certainty of its own standalone digital operation. The retailer is particularly sensitive to the choices of the manufacturer and the platform’s empowerment level, as these decisions directly impact the value and security the retailer can derive from the digital ecosystem.
The interaction of these factors forms the foundation of the tripartite evolutionary game. Consequently, the payoff for each player is a function of the strategic choices made by all three players. We denote the payoff for the platform, manufacturer, and retailer as πp (sp, sm, sr), πm (sp, sm, sr), πr (sp, sm, sr), respectively, where sp, sm, sr represent the specific strategies chosen by each player. The payoff matrix presented in the following section quantitatively captures the outcomes of these strategic interactions under different scenarios, allowing for the analysis of their evolutionary paths towards stable states.
4. Theoretical Framework
4.1. Underlying Assumptions and Parameter Setting
This study is guided by the following core research questions: Under what conditions will a third-party platform choose to invest in a high-empowerment strategy rather than risk disintermediation by powerful manufacturers capable of self-building their own platforms? What are the key factors that drive a manufacturer, particularly one with substantial digital resources, to choose between joining a third-party platform and building its own platform? How do the interdependent choices of the platform and the manufacturer influence the retailer’s decision to join a digital ecosystem, and how does this tripartite interaction shape the overall evolutionary path of the supply chain?
With the continuous advancement of supply chain digital transformation, third-party platforms catering to the supply chain are emerging more prevalently and engaging intensively in market competition. Meanwhile, in the context of the manufacturing supply chain, where the digital transformation has progressed to the mid-stage, manufacturers, as the core entities within the supply chain, have already amassed certain digital transformation resources and devised elaborate plans. They also possess the capacity to construct their own supply chain platforms. Under such circumstances, a platform-enabled supply chain gaming system is devised, which comprises third-party platforms, core enterprise manufacturers, and retailers. The third-party platforms exhibit their own discretionary behaviors regarding the level of platform empowerment; manufacturers, depending on their enterprise digitalization levels, can opt to either join third-party platforms or establish self-owned supply chain platforms; and retailers, on the other hand, have the option to either affiliate with the platforms or refrain from doing so.
Assumption 1.
The game involves three players: the third-party platform, the manufacturer and the retailer, and each game player chooses different strategies with a certain probability. Among them, the third-party platform provides digitization services for supply chain enterprises through platform construction, and its strategy choice is {high empowerment level, low empowerment level}, and the probability of choosing high empowerment level is x, x ϵ [0, 1]. The manufacturer’s strategy choice is {join the third-party platform, build own digital platform}, and the probability of choosing to join third-party platform is y, y ϵ [0, 1]. The retailer’s strategy choice is {join a platform, not join a platform}, and the probability of choosing to join the platform is z, z ϵ [0, 1]. If the manufacturer chooses to build its own platform, the retailer’s option to “join a platform” specifically refers to joining the manufacturer’s self-built platform.
Assumption 2.
Assume that the construction cost of the third-party platform is Ch for choosing a high level of empowerment, and the construction cost of the third-party platform is Cl for choosing a low level of empowerment, and Ch > Cl. The third-party platform charges manufacturers and retailers accessing the platform a service fee of U1 and U2 respectively. When the third-party platform chooses the high empowerment strategy, if the enterprise chooses to join the platform, the third-party platform can obtain additional word-of-mouth (WOM) gain, which is positively correlated with the WOM gain coefficient λ and the enterprise’s WOM influence. Manufacturers and retailers joining the high-empowerment third-party platform can bring λI1 and λI2 word-of-mouth gain to the platform, where I1 and I2 are the word-of-mouth influence of the manufacturers and retailers, respectively, and is the coefficient of word-of-mouth gain. Conversely, a platform opting for a low-empowerment strategy provides basic services that are less likely to generate significant market acclaim; thus, we assume its word-of-mouth gain is negligible and set it to zero in our model. A platform opting for a low-empowerment strategy typically uses inferior digital infrastructure. Therefore, when the third-party platform chooses the low empowerment strategy, due to the low level of digitization, it will need to bear the extra service cost to meet the specific integration and operational demands of enterprises, which is d1 when both the manufacturer and retailer choose to join, and when only the manufacturer joins. These costs arise from non-standardized customization and manual intervention and extra operational overhead due to lack of automated monitoring and smart troubleshooting tools. Serving two heterogeneous enterprises (manufacturer and retailer) involves more complex integration scenarios, data reconciliation, and coordination efforts than serving a single enterprise type. Thus, d1 > d2.
Assumption 3.
The manufacturer joins the platform of high empowerment level and can get the digital empowerment benefit of Sh1, and if the retailers join the platform at the same time, it will be increased to (1 + α)Sh1. The parameter quantifies the direct value that a platform provides to an enterprise. It is a measure of the platform’s core service capability. On the contrary, if the manufacturer joins the platform of low empowerment level, it will get the digital empowerment benefit of Sl1, and Sh1 > Sl1, and if the retailers join the platform at the same time, it will cause additional cybersecurity risk θ to the manufacturer. The manufacturer has a certain digital level benefit of e1, and its cost of building its own platform is CZ, and it charges a service fee UZ to the retailers who join the platform. If the retailers choose to join the manufacturer’s self-built platform, the manufacturer can also get the word-of-mouth gain λI2. The manufacturer’s capability to self-build a platform is quantitatively expressed by two parameters: the self-building cost CZ and the initial digitization-level benefit e1. A manufacturer with high capability (substantial internal resources) is modeled as having a low CZ (due to existing technical expertise) and a high e1 (allowing it to gain significant value from its own platform). Conversely, a low-capability manufacturer faces a high CZ and has a low e1.
Assumption 4.
A retailer can gain Sh2, Sl2, SZ from joining a highly empowered third-party platform, a low-empowered third-party platform, and a manufacturer’s own platform, respectively. If the retailer chooses not to join the platform, it has only a certain level of digitization benefit e2. The retailer will also bear the cybersecurity risk θ when it joins the third-party platform with a low level of empowerment.
Assumption 5.
When only the manufacturer joins the third-party platform with a high level of empowerment, the retailer will bear the loss due to the unequal level of digital information. This loss stems from a strategic informational disadvantage. Specifically, these information disadvantages include the following: (1) Platforms may provide manufacturers with analytical reports on raw material price fluctuations, potential market trends, and even competitor dynamics. Without this information, the retailer’s bargaining power is severely weakened when facing terms such as prices and delivery dates proposed by manufacturers. (2) Manufacturer data obtained by non-member retailers is passive, filtered, and delayed, and is excluded from the efficient collaborative process of the platform, requiring higher communication and coordination costs. (3) Highly Empowering Platforms typically integrate AI algorithms, enabling precise demand forecasting and intelligent replenishment recommendations for manufacturers. Leveraging these insights, manufacturers can optimize their production plans. Retailers who have not joined the platform lack such advanced analytical capabilities, and their decisions are more based on experience and historical data, leading to misjudgments and missed business opportunities. Conversely, when the platform is low-empowerment, the digital capabilities it offers are limited, resulting in a negligible informational advantage for the manufacturer and thus a minimal loss R for the retailer (implicitly set to zero in this case).
Informed by Service-Dominant Logic, the third-party platform’s strategic choice of empowerment level represents a fundamental value proposition. A high-empowerment value proposition (Sh1, Sh2) signifies a commitment to providing deep, integrated services that enable significant value creation. Conversely, a low-empowerment proposition (Sl1, Sl2) offers more basic services. The service fees (U1, U2) are the price of accessing this value proposition. The actual value is realized by the enterprises only when they join and use the platform’s services.
Based on Resource-Based View (RBV), the manufacturer’s “self-building” option and its cost model the decision to develop a valuable, rare, and inimitable (VRIO) resource internally. The platform’s empowerment benefits (Sh1, Sl1) represent the resource bundles that the manufacturer can access by “joining,” a decision weighed against the service fee (U1). The manufacturer’s initial digital capability (e1) is its existing resource endowment.
According to Network Effect Theory, the parameters for word-of-mouth gains (λI1, λI2) and the additional benefit from joint participation (α) directly quantify cross-side network effects. The platform’s payoff increases with the number and quality (I) of participants, and the manufacturer’s benefit increases when the retailer also joins, capturing the essence of network value creation.
Table 1 lists relevant parameters of the tripartite evolutionary game.
Table 1.
Relevant parameters of the evolutionary game model.
Based on the above assumptions, the payoff matrix of the three-party evolutionary game is shown in Table 2.
Table 2.
Payoff matrix of the tripartite evolutionary game.
From Table 2, it can be seen that manufacturer, retailer, and third-party platform jointly form eight evolutionary game strategies. The different decision-making behaviors of different game subjects will have an impact on the game behaviors of the other two types of subjects. The specific situation is as follows:
Strategies Combination 1: Third-party platform chooses high empowerment level, manufacturer chooses to join, retailer chooses to join. Payoff of third-party platform is . Payoff of manufacturer is ; Payoff of retailer is .
Strategies Combination 2: Third-party platform chooses high empowerment level, manufacturer chooses to join, retailer chooses not to join. Payoff of third-party platform is . Payoff of manufacturer is ; payoff of retailer is .
Strategies Combination 3: Third-party platform chooses high empowerment level, manufacturer chooses to build own digital platform, retailer chooses to join the manufacturer’s self-built platform. Payoff of third-party platform is . Payoff of manufacturer is ; payoff of retailer is .
Strategies Combination 4: Third-party platform chooses high empowerment level, manufacturer chooses to build own digital platform, retailer chooses not to join. Payoff of third-party platform is . Payoff of manufacturer is ; payoff of retailer is .
Strategies Combination 5: Third-party platform chooses low empowerment level, manufacturer chooses to join, retailer chooses to join. Payoff of third-party platform is . Payoff of manufacturer is ; payoff of retailer is .
Strategies Combination 6: Third-party platform chooses low empowerment level, manufacturer chooses to join, retailer chooses not to join. Payoff of third-party platform is . Payoff of manufacturer is ; payoff of retailer is .
Strategies Combination 7: Third-party platform chooses low empowerment level, manufacturer chooses to build own digital platform, retailer chooses to join the manufacturer’s self-built platform. Payoff of third-party platform is . Payoff of manufacturer is ; payoff of retailer is .
Strategies Combination 8: Third-party platform chooses low empowerment level, manufacturer chooses to build own digital platform, retailer chooses not to join. Payoff of third-party platform is . Payoff of manufacturer is ; payoff of retailer is .
4.2. Discussion on the Evolutionary Mechanism
4.2.1. Replicator Dynamic Equation
When the third-party platform chooses the strategy of {high empowerment level}, its expected return is ; when it chooses the strategy of {low empowerment level}, its expected return is . The average return of the third-party platform is U1.
The replicator dynamic equation of the third-party platform is as follows:
Proposition 1.
For the third-party platform, x = 0 is an evolutionary stable strategy when , and x = 1 is an evolutionary stable strategy when . .
Proof.
According to the principle of differential stability, it can be seen that the probability of the third-party platform firms with high empowerment being in a steady state must satisfy and .
Let , then . Since , G(y) is an increasing function about y, i.e., is the unique solution of G(y) = 0.
Therefore, when , G(y) = 0 and F′(x) ≡ 0, the third-party platform is unable to generate a stabilization strategy.
When , we have . At the equilibrium point , the derivative of the replicator dynamic is . Since , the condition for an asymptotically stable equilibrium, and , is satisfied. Therefore, is an evolutionary stable strategy.
When , we have . At the equilibrium point , the derivative of the replicator dynamic is . Since , the condition for an asymptotically stable equilibrium, and , is satisfied. Therefore, is an evolutionary stable strategy. □
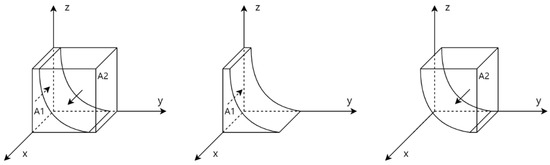
The strategy evolution phase diagram for the third-party platform is shown below:
According to Figure 1 and the expression of , the two points where the surface intersects the projection y-o-z plane are and . The two regions A1 and A2 in Figure 1 represent the conditions under which the strategic choices of the third-party platform will evolve and stabilize to {low empowerment level} and {high empowerment level}, respectively. Intuitively, this stability condition indicates that the platform will opt for a high-empowerment strategy only when the expected benefits—comprising service fees and the word-of-mouth gains from manufacturer and retailer participation—sufficiently outweigh the additional investment cost Ch − Cl.
Figure 1.
Strategic diagram of the third-party platform. Arrows represent the evolutionary directions of different regions.
Inference 1.
Over the course of the evolution, the probability of a high level of empowerment by the third-party platform rises as the probability of manufacturers and retailers opting in to the third-party platform increases.
Proof.
Shifting the expression in Proposition 1 yields that x = 0 is an evolutionary stable strategy when or , and when or , x = 1 is an evolutionary stabilization strategy. □
At low levels of platform empowerment, firms joining brings some risk of loss, while at high levels of platform empowerment, firms joining brings additional word-of-mouth benefits. Thus, as the probability of manufacturers and retailers opting to join the third-party platform increases, the probability of the third-party platform opting for a high level of empowerment increases.
When the manufacturer chooses the strategy of {join the third-party platform}, its expected return is ; when it chooses the strategy of {build own digital platform}, its expected return is . The average return of the manufacture is .
The replicator dynamic equation of the manufacture is as follows:
Proposition 2.
For the manufacturer, y = 0 is an evolutionary stable strategy when , and y = 1 is an evolutionary stable strategy when ..
Proof.
According to the principle of differential stability, it can be seen that the probability of the manufacturer joining the third-party platform being in a steady state must satisfy and . Let , then . Since , H(x) is an increasing function about x, i.e., is the unique solution of H(x) = 0.
Therefore, when , H(x) = 0 and F′(y) ≡ 0, the manufacture is unable to generate a stabilization strategy.
When , we have . At the equilibrium point , the derivative of the replicator dynamic is . Since , the condition for an asymptotically stable equilibrium, and , is satisfied. Therefore, is an evolutionary stable strategy.
When , we have . At the equilibrium point , the derivative of the replicator dynamic is . Since , the condition for an asymptotically stable equilibrium, and , is satisfied. Therefore, is an evolutionary stable strategy. □
The strategy evolution phase diagram for the manufacture is shown below:
According to Figure 2 and the expression of , the two points where the surface intersects the projection x-o-z plane are and . The two regions B1 and B2 in Figure 2 represent the conditions under which the strategic choices of the manufacturer will evolve and stabilize to {join the third-party platform} and {build own digital platform}, respectively. This equilibrium reveals the manufacturer’s strategic calculus: joining the platform is preferred when the net benefits of platform empowerment (considering service fees and cybersecurity risks) exceed the net value of independence, which includes the self-built platform’s profit potential minus its associated investment cost.
Figure 2.
Strategic diagram of the manufacturer. Arrows represent the evolutionary directions of different regions.
Inference 2.
Over the course of the evolution, the probability that a manufacturer chooses to join a third-party platform increases with the probability of a high level of empowerment by the third-party platform firm and the probability that a retailer joins.
Proof.
Shifting the expression in Proposition 2 yields that y = 0 is an evolutionary stable strategy when or , and when or , y = 1 is an evolutionary stabilization strategy. □
Because a third-party platform with a high level of empowerment brings higher digital empowerment benefits to manufacturers, and because retailer participation brings a certain percentage of additional information benefits to manufacturers, the probability of manufacturers choosing to join a third-party platform increases as the probability of third-party platform firms with a high level of empowerment and the probability of retailers joining increases.
When the retailer chooses the strategy of {join a platform}, its expected return is ; when it chooses the strategy of {not join a platform}, its expected return is . The average return of the retailer is .
The replicator dynamic equation of the manufacture is as follows:
Proposition 3.
For the retailer, z = 0 is an evolutionary stable strategy when , and z = 1 is an evolutionary stable strategy when . .
Proof.
According to the principle of differential stability, it can be seen that the probability of the retailer joining a platform being in a steady state must satisfy and .
Let , then . Since , J(x) is an increasing function about x, i.e., is the unique solution of J(x) = 0.
Therefore, when , J(x) = 0 and F′(z) ≡ 0, the retailer is unable to generate a stabilization strategy.
When , we have . At the equilibrium point , the derivative of the replicator dynamic is . Since , the condition for an asymptotically stable equilibrium, and , is satisfied. Therefore, is an evolutionary stable strategy.
When , we have . At the equilibrium point , the derivative of the replicator dynamic is . Since , the condition for an asymptotically stable equilibrium, and , is satisfied. Therefore, is an evolutionary stable strategy. □
The strategy evolution phase diagram for the retailer is shown below:
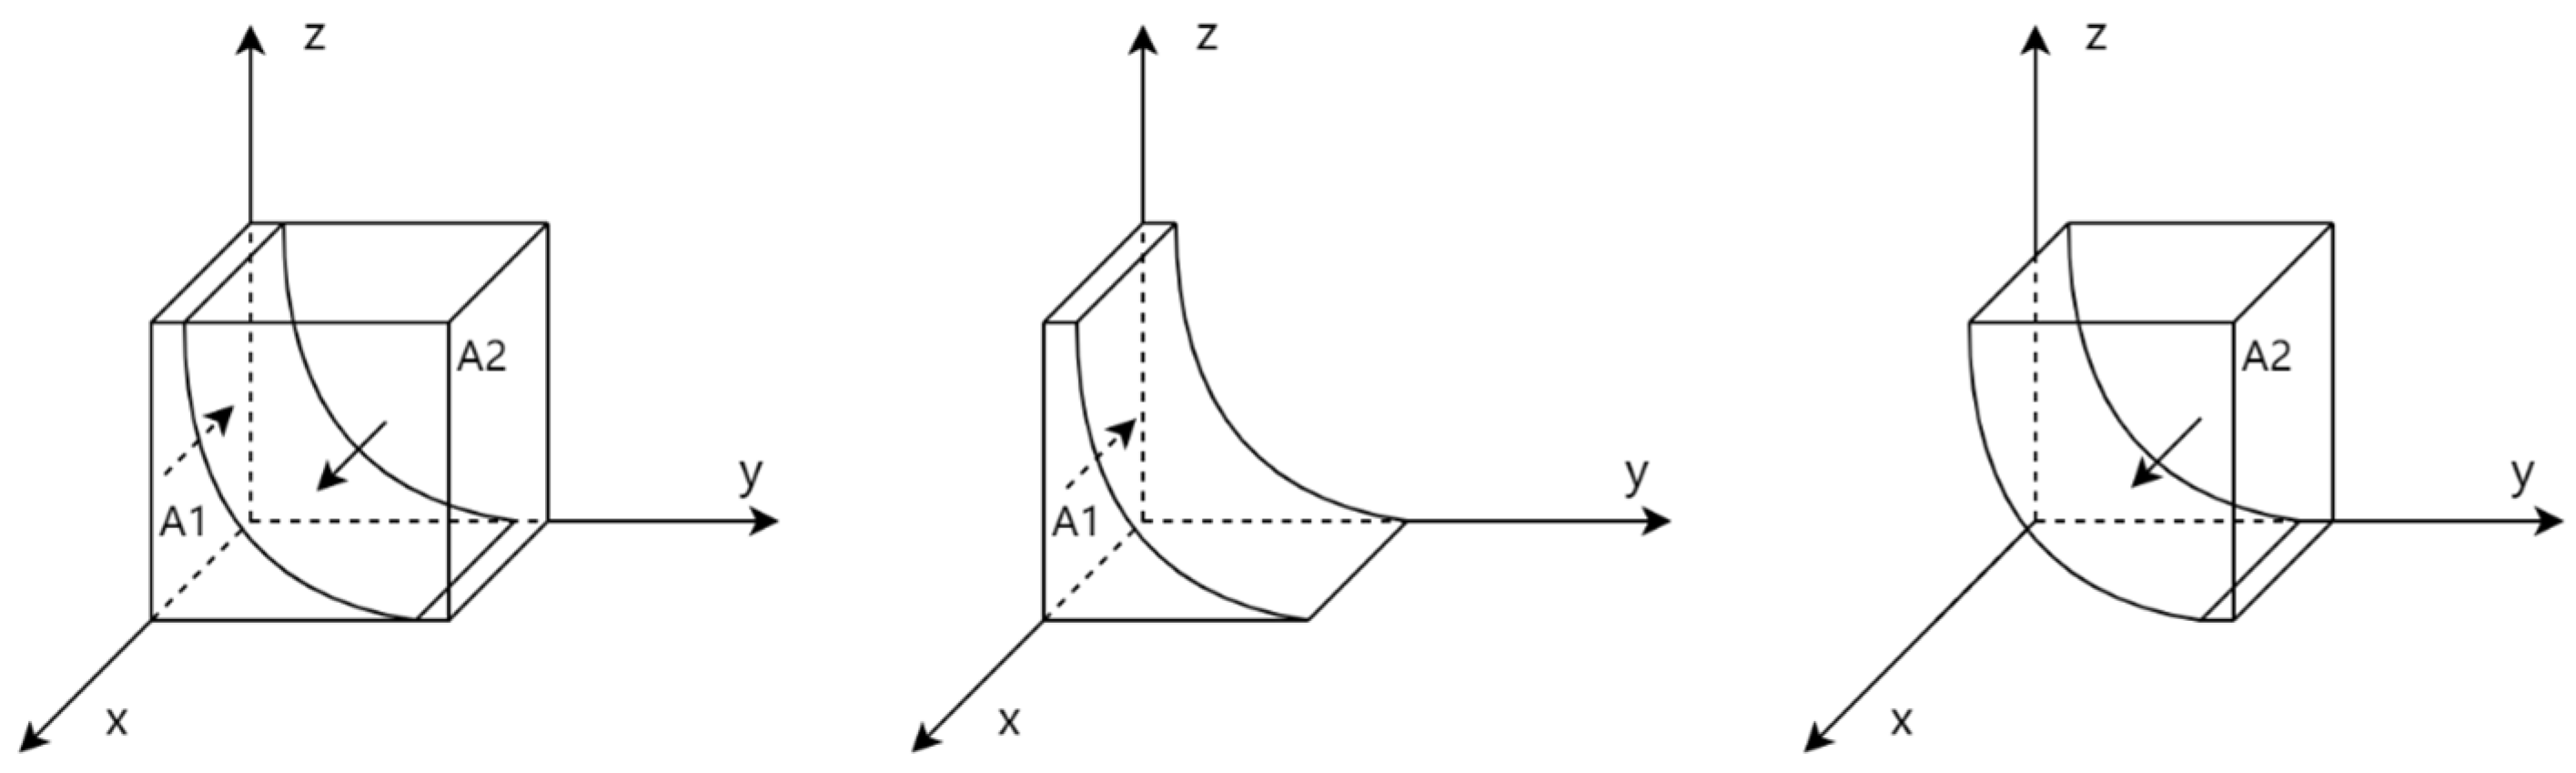
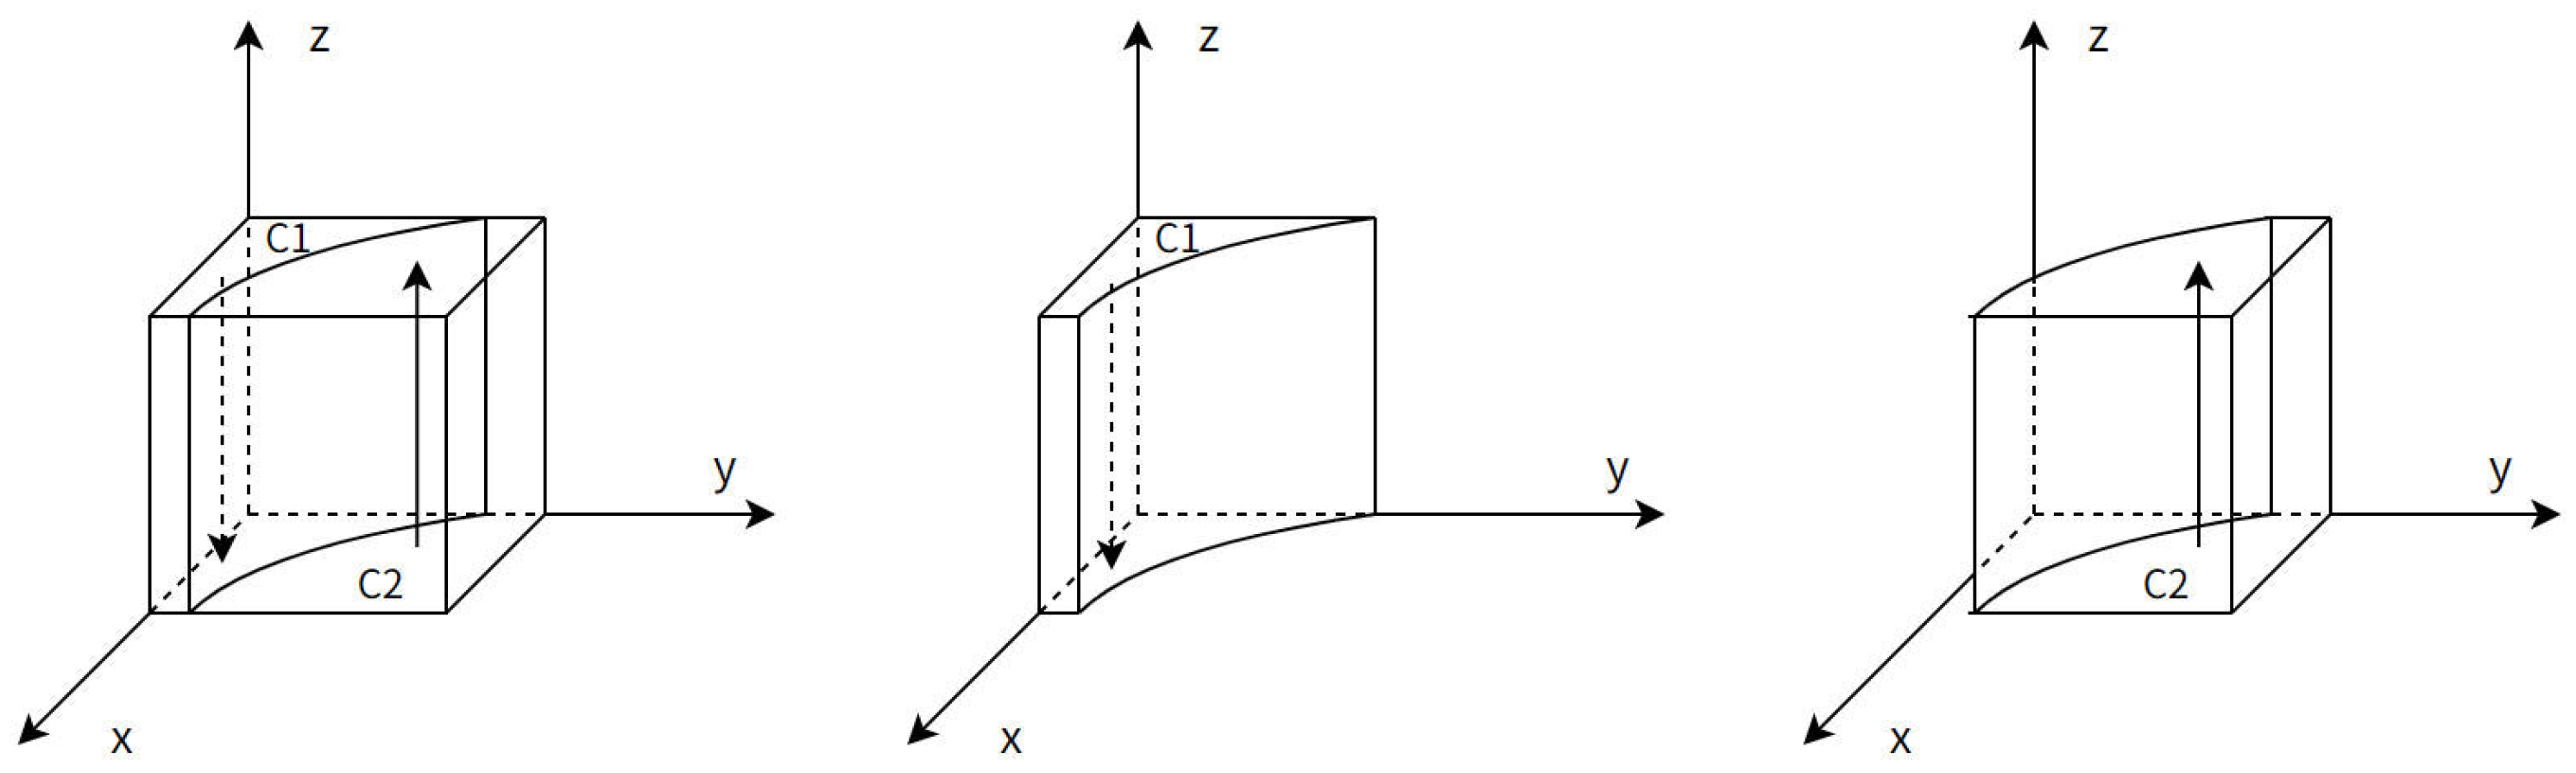
According to Figure 3 and the expression of , the two points where the surface intersects the projection x-o-y plane are and . The two regions C1 and C2 in Figure 3 represent the conditions under which the strategic choices of the retailer will evolve and stabilize to {join a platform} and {not join a platform}, respectively. The retailer’s decision hinges on a simple trade-off: it will join a platform if the perceived digital benefits and the advantage of avoiding informational asymmetry outweigh the membership costs and any perceived risks.
Figure 3.
Strategic diagram of the retailer. Arrows represent the evolutionary directions of different regions.
4.2.2. Analysis on Evolutionary Equilibrium Strategy
Based on the above subject analysis of the tripartite evolutionary game, the Jacobi matrix can be obtained as shown below:
According to the evolutionary stabilization strategy of each game subject, there are eight equilibrium points in this paper, which are (0, 0, 0), (0, 0, 1), (0, 1, 0), (0, 1, 1), (1, 0, 0), (1, 0, 1), (1, 1, 0), (1, 1, 1). The eight equilibrium points are substituted into the Jacobi matrix, and the local stability of the system at these equilibrium points is analyzed by the local stability of the corresponding Jacobi matrix of this system, and the eigenvalues of the matrix can be obtained as shown in Table 3.
Table 3.
Eigenvalues of the equilibrium points of the Jacobi matrix.
By analyzing the revenue payoff matrix, it is possible to determine the positivity and negativity of some of the eigenvalues:
For the third-party platform, selecting a low level of empowerment incurs additional service costs, whereas a high level generates word-of-mouth benefits. Thus, to maximize gains, the platform tends to choose a higher empowerment level, as illustrated in the scenario where both manufacturer and retailer join simultaneously; there is , and by shifting the term, we can get . Similarly, , i.e., .
For the manufacturer, when the platform chooses high empowerment, due to the maturity of the third-party platform’s information level and digitization technology, then the benefit of joining the platform with the retailer will be greater than that of the self-built platform, i.e., . When the platform chooses low empowerment, joining the third-party platform with the retailer will, on the contrary, bring the manufacturer additional cybersecurity risk, so the benefit of the manufacturer’s self-built platform in this case will be greater than the benefit of joining the third-party platform, i.e., ; when the retailer chooses not to join the platform, since the manufacturer chooses to self-build the platform can’t create additional benefit for itself, the manufacturer chooses to join the third-party platform at this time, which will have a greater benefit than the revenue of the self-built platform, so there are as well as .
For the retailer, when the platform chooses high empowerment and the manufacturer chooses to join the platform, if the retailer joins the platform together, they will be able to obtain the digitized gains; if they do not join the platform, they will bear the losses caused by information inequality, i.e., , and the shifted term is . When the platform chooses low empowerment, the retailer joins the platform and bears the cost of the risk, so the benefit of not joining the platform is higher in this case, i.e., , and shifting the term yields .
In addition to the above eigenvalues that can be judged as positive or negative, the positivity or negativity of the remaining eigenvalues, , changes with parameter variations and requires further categorization and discussion.
The stability of each equilibrium point is analyzed using Liapunov’s first method, i.e., the equilibrium point where all eigenvalues are negative in the real part is stable, the equilibrium point where at least one of the eigenvalues is positive in the real part is unstable, and the equilibrium point where some of the eigenvalues are zero and the rest of the eigenvalues are negative will be in a critical state. The evolutionary stability of each equilibrium point is analyzed as shown in Table 4.
Table 4.
Evolutionary stability of each equilibrium point.
From Table 4, we can see that there exists at least one equilibrium stable point in the evolutionary game, as well as two equilibrium points and that need further discussion; the rest are unstable equilibrium points. The stability conditions for equilibrium points and are given in the following Propositions 4 and 5.
Proposition 4.
When , the replicated dynamical system has two asymptotically stable points (1, 1, 1) and (0, 0, 0); the rest of the equilibrium points are unstable.
Proof.
From Table 4, when , none of the eigenvalues of the equilibrium point (0, 0, 0) have a positive real part, and thus (0, 0, 0) is an asymptotically stable point; the eigenvalues of the equilibrium point (0, 0, 1) have a positive real part, and thus (0, 0, 1) is not an equilibrium stabilization point. □
Proposition 4 suggests that a retailer is unlikely to join a manufacturer’s own platform if the net benefit from joining the manufacturer’s own platform is less than the retailer’s own digitization benefit; in this case, the system converges to a combination of {high empowerment level, join the platform, join the platform} and {low empowerment level, build own platform, do not join the platform} strategies.
Proposition 5.
When , the replica dynamical system has two asymptotically stable points (1, 1, 1) and (0, 0, 1), and the rest of the equilibrium points are unstable.
Proof.
From Table 4, when , the eigenvalues of the equilibrium point (0, 0, 0) have a positive real part, and thus (0, 0, 0) is not an equilibrium stable point; none of the eigenvalues of the equilibrium point (0, 0, 1) have a positive real part, and thus (0, 0, 1) is an asymptotically stable point. □
The situation in Proposition 4 is the opposite of Proposition 5. The proposition suggests that a retailer will join the manufacturer’s own platform if the net benefit from joining the manufacturer’s own platform is higher than the retailer’s own digitization benefit; at this point, the system converges to a combination of {high empowerment level, join the platform, join the platform} and {low empowerment level, build own platform, join the platform} strategies.
5. Results
This section conducts a numerical simulation analysis to solve the evolutionary game model and visually explore the dynamics of supply chain digital transformation. The simulation serves two primary objectives: to validate the theoretical stability conditions derived in the previous section, and to investigate the impact of key parameters—such as the platform’s empowerment level, enterprises’ reputations, and their initial digital capabilities—on the strategic evolution paths of the platform, manufacturers, and retailers. The overarching findings reveal the conditions for different transformation equilibria to emerge and highlight the critical trade-offs faced by each participant.
5.1. Simulation Analysis
To solve for the model’s Evolutionarily Stable Strategies and visualize the evolutionary paths, we conducted a systematic numerical simulation analysis. The simulations were performed in the MATLAB R2023a software environment.
MATLAB was selected for this study due to its robust suite of numerical ODE solvers and powerful graphical capabilities, which are essential for reliably simulating the replicator dynamic system and visualizing the resulting high-dimensional evolutionary trajectories. The system of ordinary differential equations was integrated numerically using the ode45solver, which is based on an explicit Runge–Kutta (4,5) formula. To ensure computational accuracy and the reproducibility of our results, the relative error tolerance (RelTol) and absolute error tolerance (AbsTol) for the solver were set to 1 × 10⁻⁶ and 1 × 10⁻⁸, respectively. The simulations were run over a time interval of [0, 50], which was sufficient for all trajectories to converge to an equilibrium state.
In order to ensure the scientific rigor, traceability, and real-world relevance of the numerical simulations, the parameter values in this study were determined through a two-step process.
Industry Reports: Macro-level data from authoritative sources, such as databases published by the Ministry of Industry and Information Technology (MIIT), were used to ground the economic scales and adoption trends in the real-world context of the Chinese manufacturing industry.
Expert Validation via the Delphi Method: To enhance the practical validity of the parameter set, we employed a two-round Delphi method with a panel of 12 experts and scholars specializing in supply chain management and digital transformation (comprising five professors, five junior faculty members, and two PhD researchers). Through iterative, anonymous feedback rounds, the experts assessed the reasonableness, relative magnitudes, and inter-relationships of the parameters. Their consensus feedback was integrated to finalize the parameter values used in Simulation Array 1 (Table 5) and Array 2 (Table 6). Parameter sources and Delphi process: Initial parameter ranges were derived from industry reports (e.g., MIIT databases) and preliminary model analysis. The Delphi instrument used a 5-point Likert scale (1 = Very Unreasonable, 5 = Very Reasonable) for experts to assess parameter reasonableness and relative magnitudes. Experts also provided qualitative feedback on inter-parameter relationships. Consensus was measured using the Interquartile Range (IQR) for each parameter’s rating. An IQR ≤ 1.0 on the 5-point scale after the second round was considered indicative of sufficient consensus. Over 90% of parameters achieved this level of agreement, and minor adjustments were made to others based on expert comments to reach final consensus.
Table 5.
Simulation Array 1. The definitions of all parameters correspond to those provided in Table 1 of Section 4.1.
Table 6.
Simulation Array 2. Parameter definitions are consistent with Table 1 in Section 4.1.
On the basis of the selected array, by controlling and adjusting the values of parameters, we study the benefits of digital empowerment brought by the third-party platform to the supply chain enterprises, as well as the reputation of the manufacturer and retailer and their own digitalization-level benefits . These parameter variations affect the outcome of the system evolution game.
5.1.1. Evolutionary Paths of Each Game Player
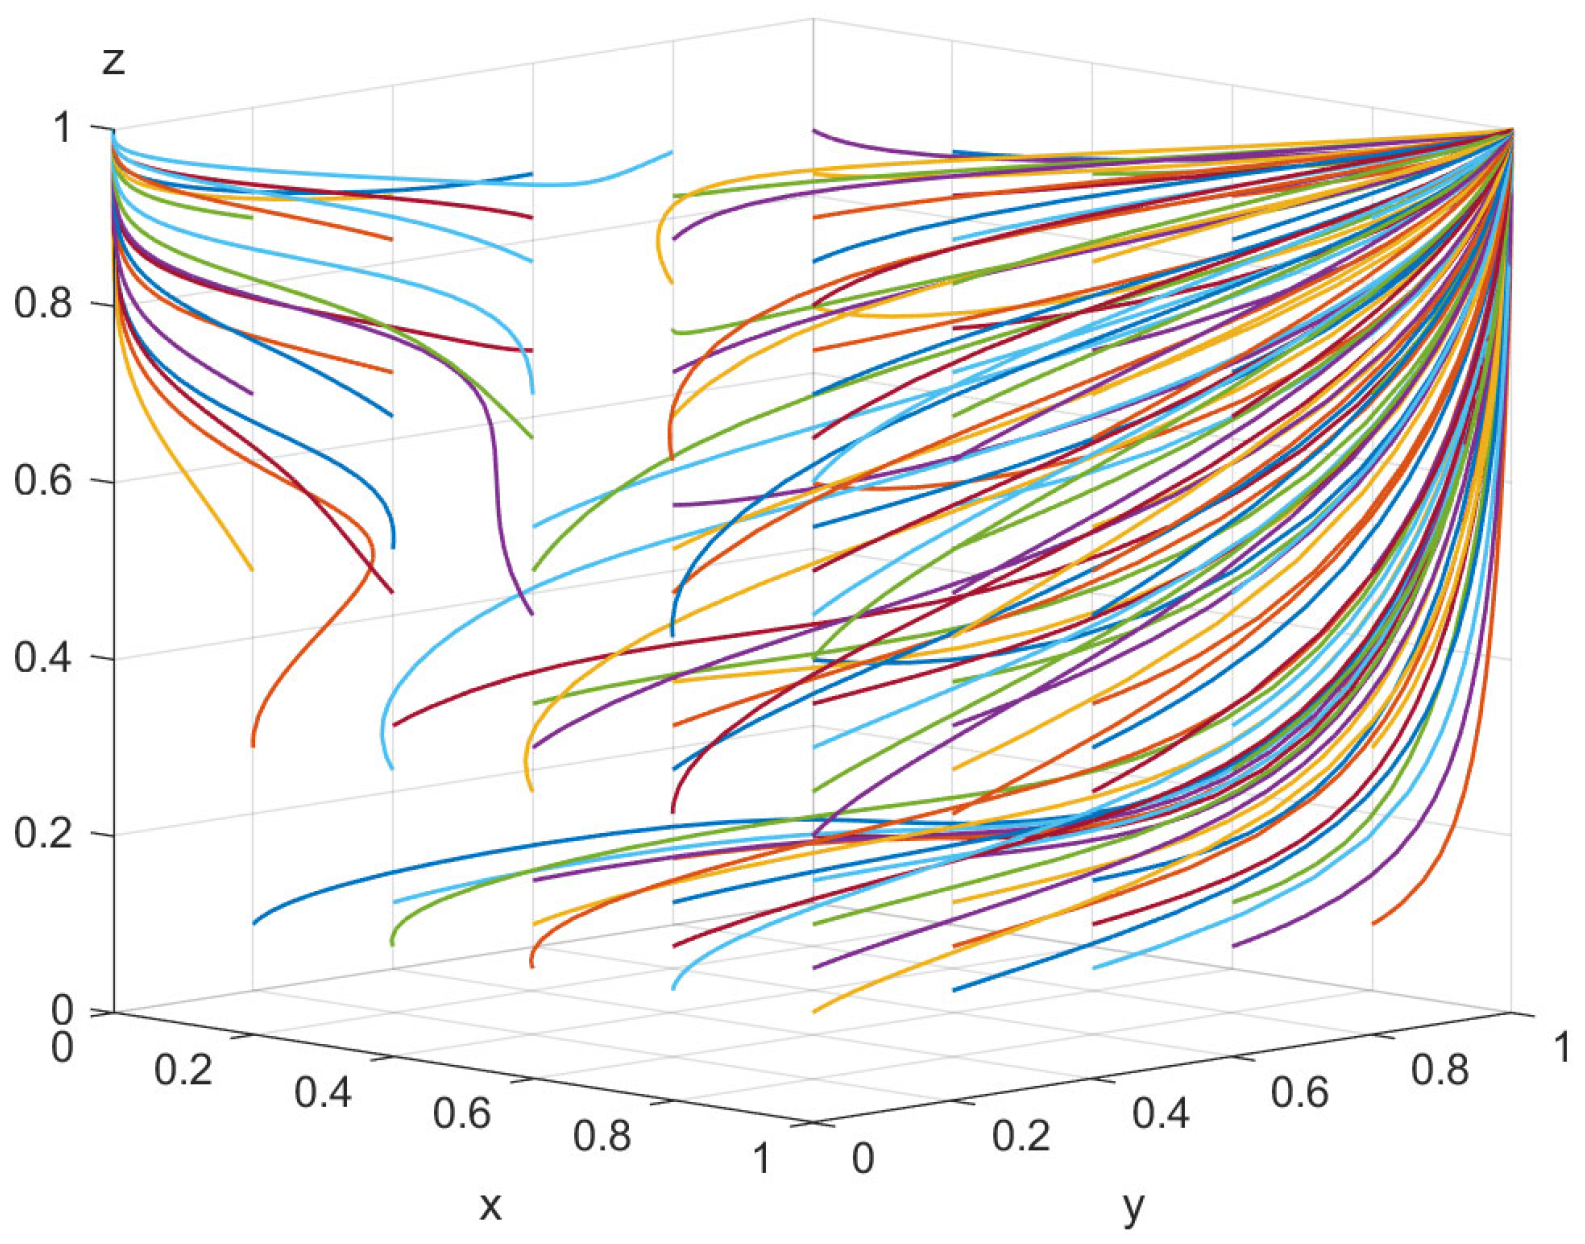
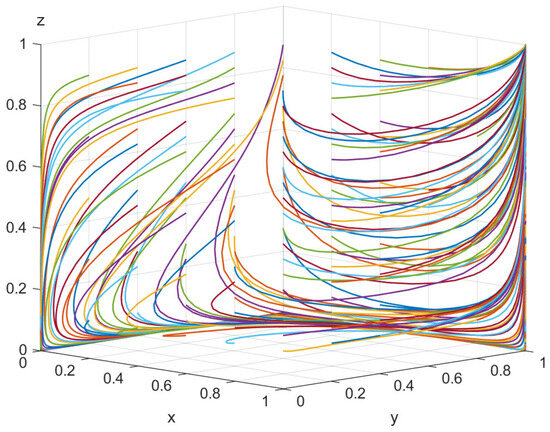
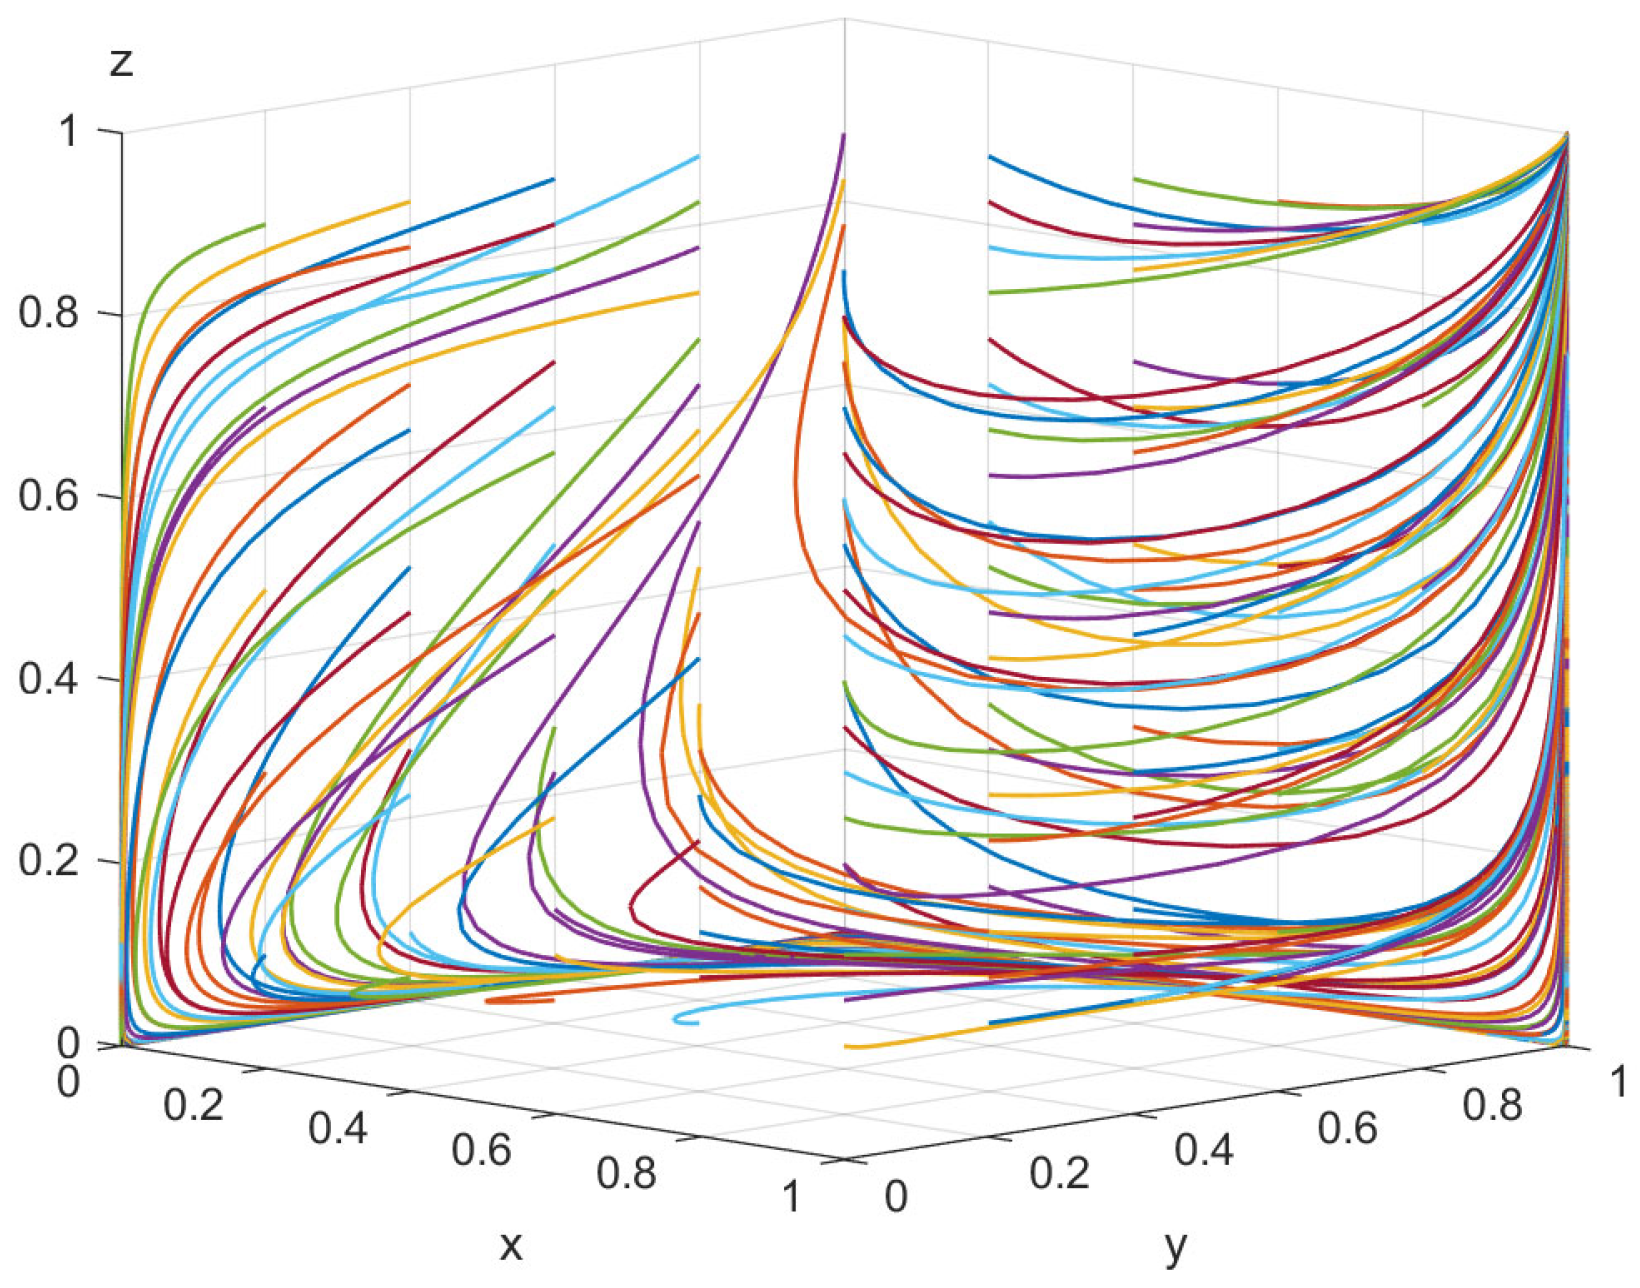
Array 1 in Table 5 satisfies Proposition 5. Additionally, Array 2, which satisfies Proposition 4, is shown in Table 6. To comprehensively map the evolutionary paths and the basins of attraction within the three-dimensional strategy space, we conducted numerical simulations of the replicator dynamic system. The system of ordinary differential equations was integrated numerically using MATLAB’s ode45 solver over a time interval of [0, 50], which was sufficient for all trajectories to converge to an equilibrium.
To achieve a representative sample of the state space, we performed 125 independent simulations from a systematically sampled set of initial conditions (x0, y0, z0) forming a uniform grid within the unit cube [0, 1]3. This approach allows us to visualize the basins of attraction for different equilibria and observe the system’s behavior from diverse starting points.
Figure 4.
Evolutionary simulations on Array 1. Each colored trajectory shows the evolution path from a specific initial condition toward the stable equilibrium.
Figure 5.
Evolutionary simulations on Array 2. Each colored trajectory shows the evolution path from a specific initial condition toward the stable equilibrium.
As can be seen from the evolution results of the above figures, the results of the system evolution will vary with the values of the parameters taken. Array 1, which satisfies Propositions 5, will have two evolutionary stable points, point (1, 1, 1) and point (0, 0, 1), during the evolution process. Notably, the emergence of the (0, 0, 1) equilibrium in Array 1 reveals a pattern of ‘platform disintermediation’. In this scenario, the platform, perceiving a low willingness from enterprises to join, opts for a low-empowerment strategy. This, in turn, incentivizes the capable manufacturer to self-build its own platform, with the retailer choosing to join the manufacturer’s ecosystem. From a business perspective, this signifies a failure of the platform’s strategy and the ‘disintermediation’ of the core enterprise. For the platform, this is an unsustainable state as it is marginalized from the primary value creation loop, earning only minimal returns. This outcome underscores the critical importance for a platform to initially attract high-quality enterprises to build network effects and avoid being bypassed. And Array 2 satisfying Proposition 4 will have another evolutionary stable point (0, 0, 0) in addition to the point (1, 1, 1). From the above results, it can be seen that there exists at least one evolutionary stable point (1, 1, 1) for this system, i.e., the evolutionary stable strategy of {high empowerment level, join platform, join platform}.
Notably, the emergence of the (0, 0, 1) equilibrium in Array 1 reveals a pattern of ‘platform disintermediation’. In this scenario, the platform, perceiving a low willingness from enterprises to join, opts for a low-empowerment strategy. This, in turn, incentivizes the capable manufacturer to self-build its own platform, with the retailer choosing to join the manufacturer’s ecosystem. From a business perspective, this signifies a failure of the platform’s strategy and the ‘disintermediation’ of the core enterprise. For the platform, this is an unsustainable state as it is marginalized from the primary value creation loop, earning only minimal returns. This outcome underscores the critical importance for a platform to initially attract high-quality enterprises to build network effects and avoid being bypassed.
More significantly, the emergence of the (0, 0, 0) equilibrium in Array 2 signifies a complete collapse of the digital cooperation ecosystem. By contrasting Array 2 with Array 1, this fundamental shift can be directly attributed to two key parameter changes highlighted in Table 6: a substantial increase in the manufacturers’ and retailers’ initial digitization-level gains (high e1 and e2).
Establishing this causal link is central to our analysis: when individual enterprises possess strong in-house digital capabilities (high e1 and e2), their perceived value of third-party platform empowerment diminishes. The manufacturer finds the relative benefit of self-building to be greater, while the retailer also deems it optimal to operate standalone, relying on its own capabilities rather than joining any platform. Consequently, the enhancement of individual digital capabilities can, under specific conditions, inhibit the formation of a platform-mediated ecosystem and even lead to its total disintegration.
5.1.2. Impact of Changes in the Empowerment Level of the Third-Party Platform
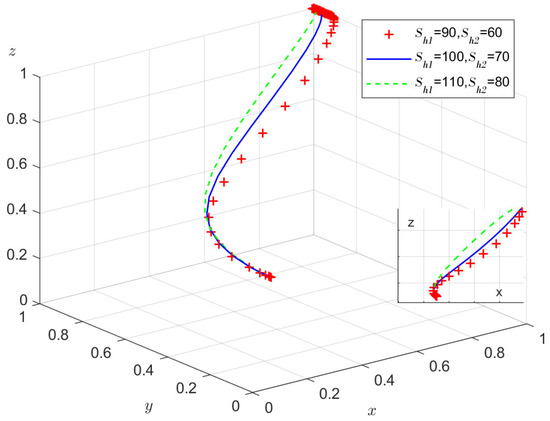
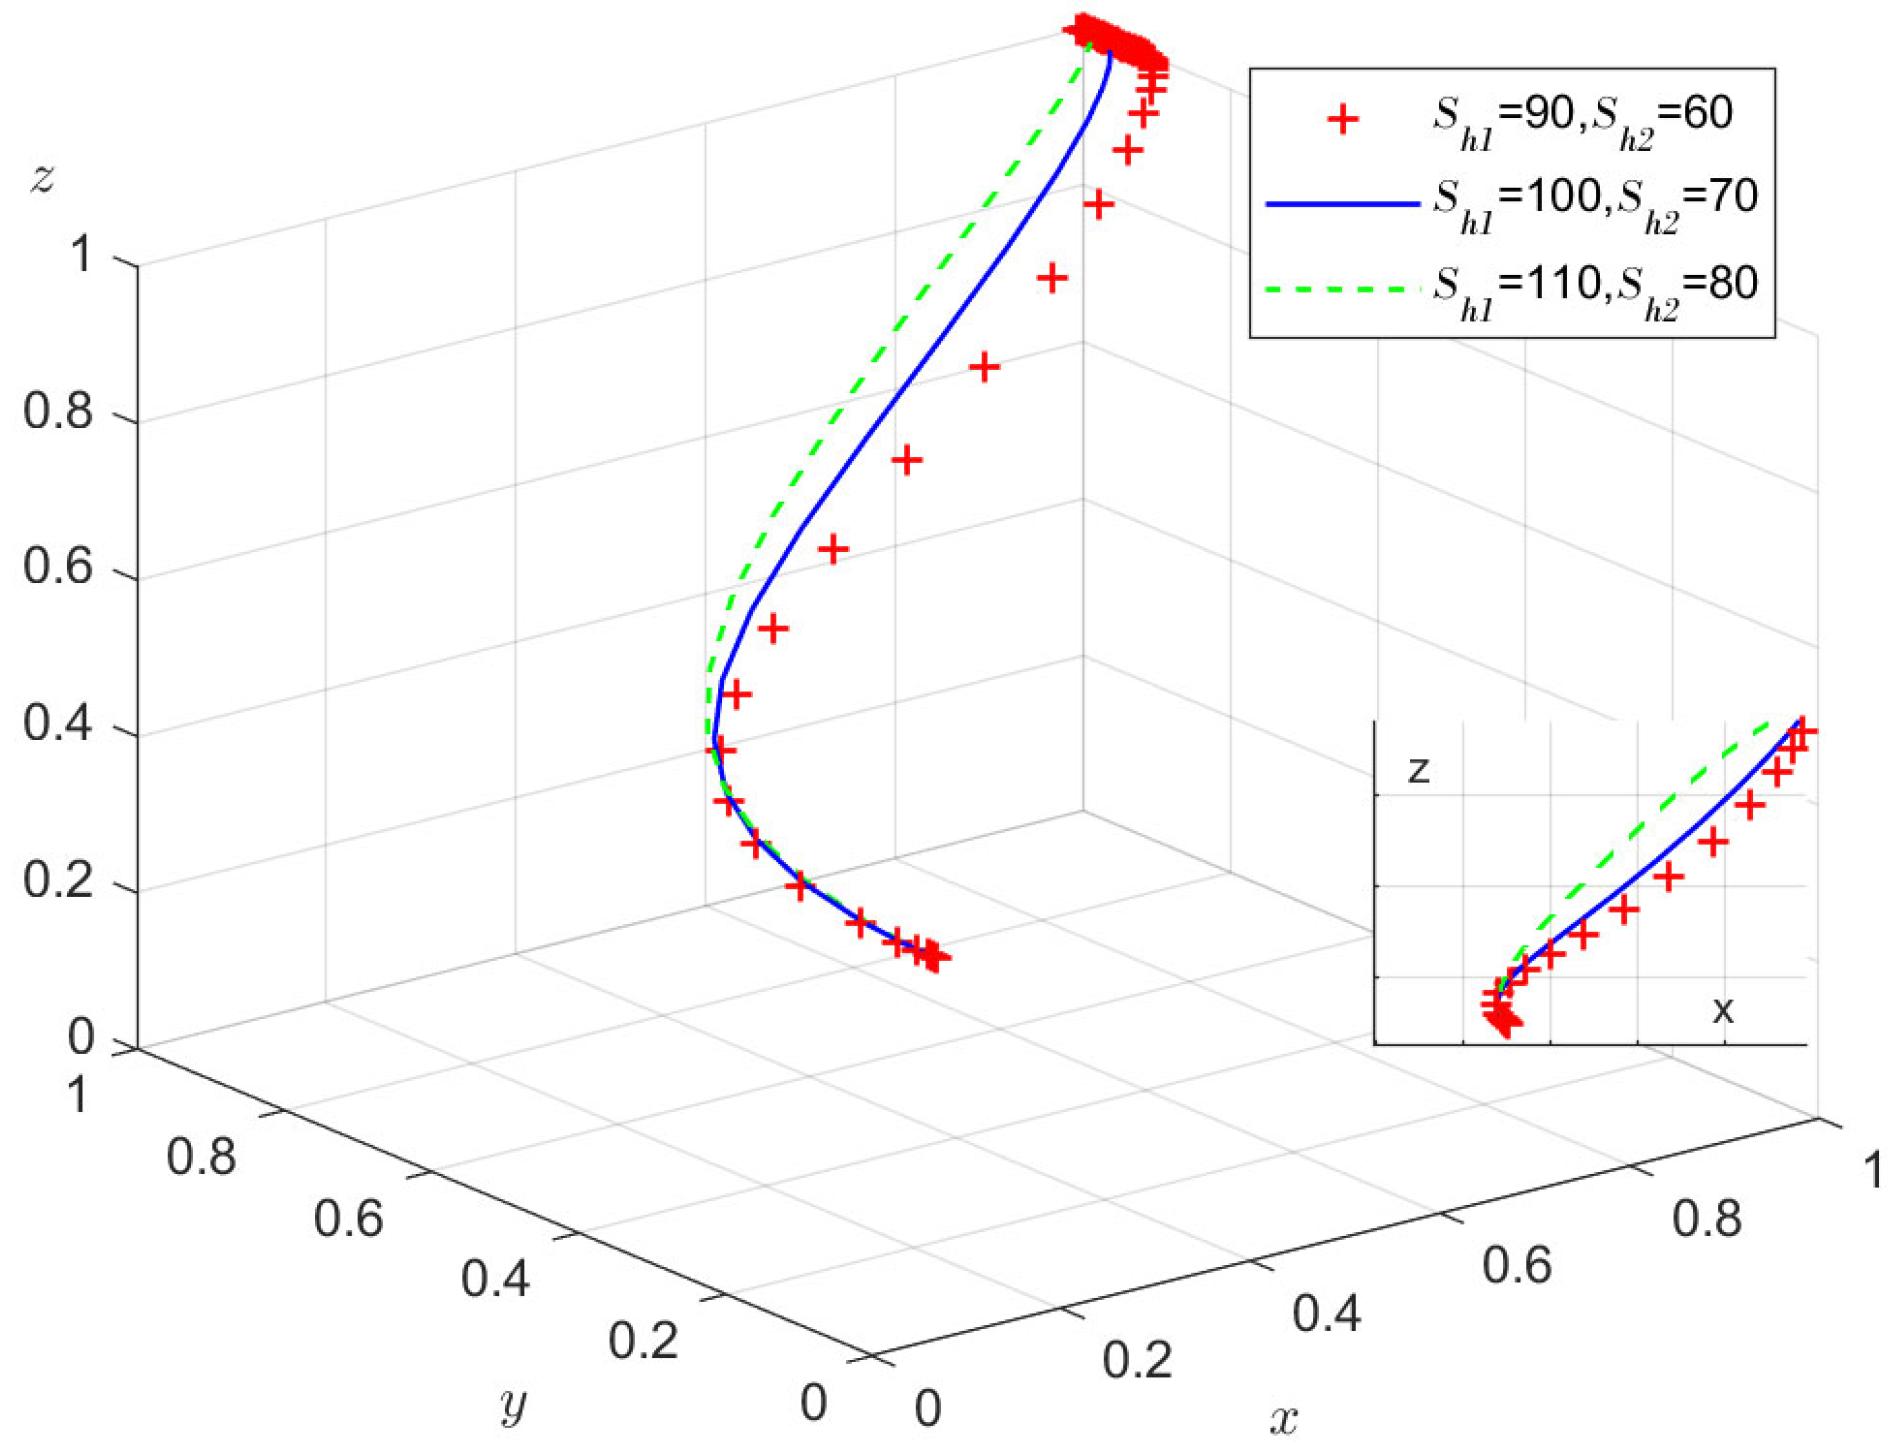
On the basis of Array 1, keep the values of other parameters unchanged, change the values of Sh1 and Sh2, and select the values of and as well as , respectively, to carry out the numerical simulation, and observe the effect of changes in the benefits of third-party platforms’ empowerment on the evolution results. The simulation results of the system evolving over time for 50 times are shown in Figure 6.
Figure 6.
Evolutionary simulation of changes in empowerment benefits of third-party platform.
From Figure 6, it can be seen that the dynamic change of the empowerment level of the third-party platform will also affect the evolution rate of manufacturers and retailers joining. When the third-party platform continuously strengthens its own enabling capabilities and improves the level of enabling, the growth rate of manufacturers’ and retailers’ willingness to join will be significantly accelerated, and the whole system accelerates its evolution in the direction of win–win cooperation. It is particularly noteworthy that as the two parameters Sh1 and Sh2 gradually increase, reflecting a shift in the market environment or internal conditions of enterprises towards a more favorable direction for digital collaboration, the probability of manufacturers and retailers choosing to join third-party platforms shows an upward trend. Moreover, retailers’ decisions are more strongly influenced than those of manufacturers, perhaps because retailers are closer to the consumer market and are more sensitive to the direct benefits of digital enablement, such as precision marketing and fast replenishment. A high level of empowerment means that third-party platforms are able to provide retailers and manufacturers with a greater depth and breadth of support, such as accurate data insights, efficient supply chain collaboration solutions, and advanced digital operational tools, which are critical to improving their competitiveness and have a direct impact on their joining decisions. It can be seen that third-party platforms play a key role in promoting supply chain digitization, which also puts forward higher requirements for the platform’s own digital technology development and application construction.
5.1.3. Impact of the Manufacturer’s Reputation and the Retailers’ Reputation
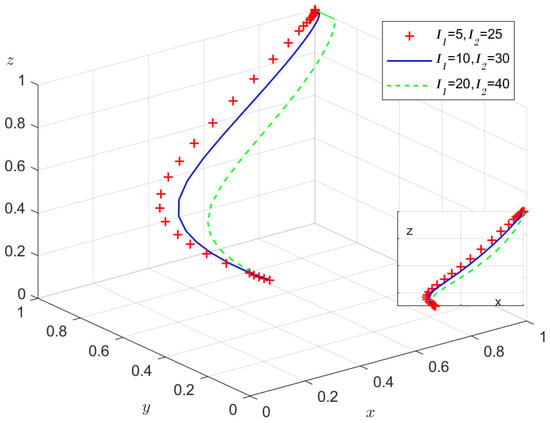
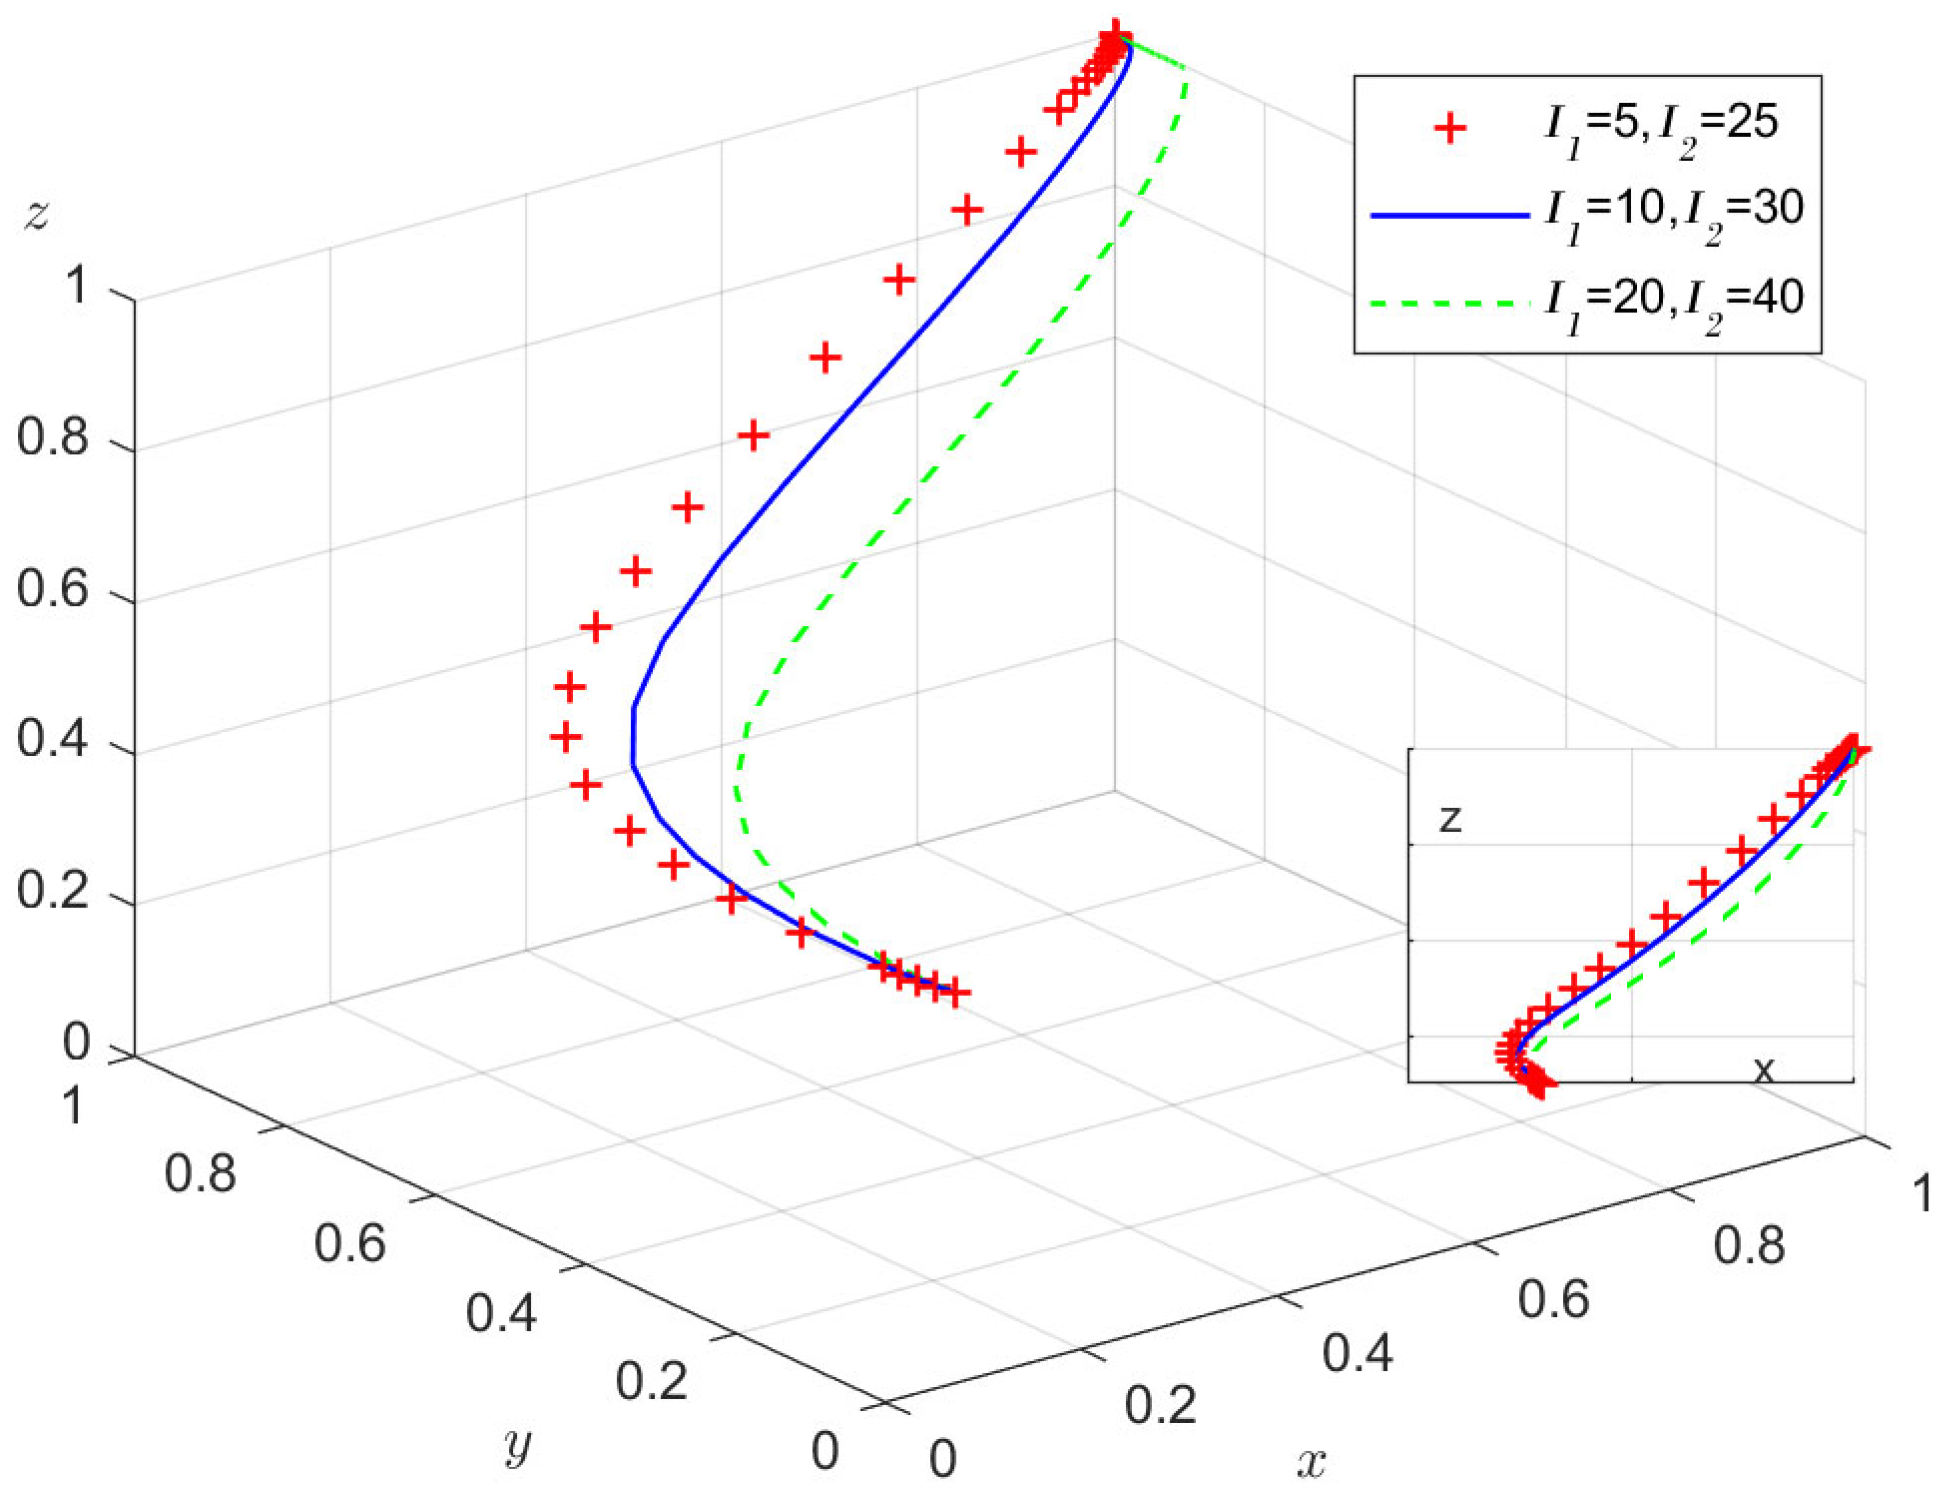
On the basis of Array 1, keep the values of other parameters unchanged, change the values of I1 and I2, and select the values of and as well as respectively, to carry out the numerical simulation, and observe the influence of the reputation of manufacturers and retailers on the evolution results. The simulation results of the system evolving over time for 50 times are shown in Figure 7.
Figure 7.
Evolutionary simulation of changes in enterprises’ reputations.
As can be seen in Figure 7, the enterprises’ reputations likewise affect the evolutionary rate at which the manufacturer and retailer join the third-party platform. The rate of growth of willingness to join third-party platforms decreases when the manufacturer and retailer have higher levels of reputation. From the manufacturer’s perspective, this is because the joining of high-reputation retailers can bring additional word-of-mouth benefits to the manufacturer’s self-built platform strategy, which attracts more retailers to join. It can be seen that small and medium-sized manufacturers and retailers with average or low reputations are more likely to join third-party platforms, which means that small and medium-sized manufacturers and retailers can accelerate their digitization process by relying on the powerful data and information aggregation capabilities of third-party platforms.
5.1.4. Impact of Enterprises’ Initial Digitization-Level Gains
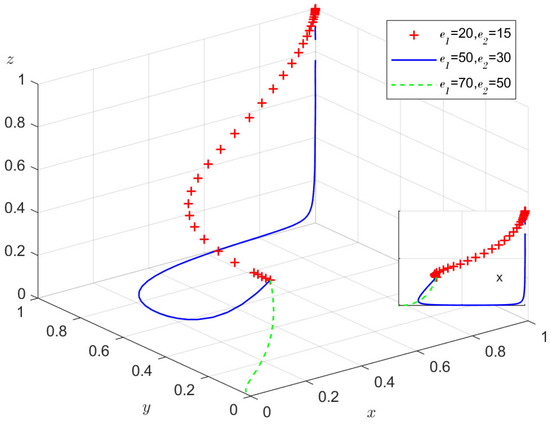
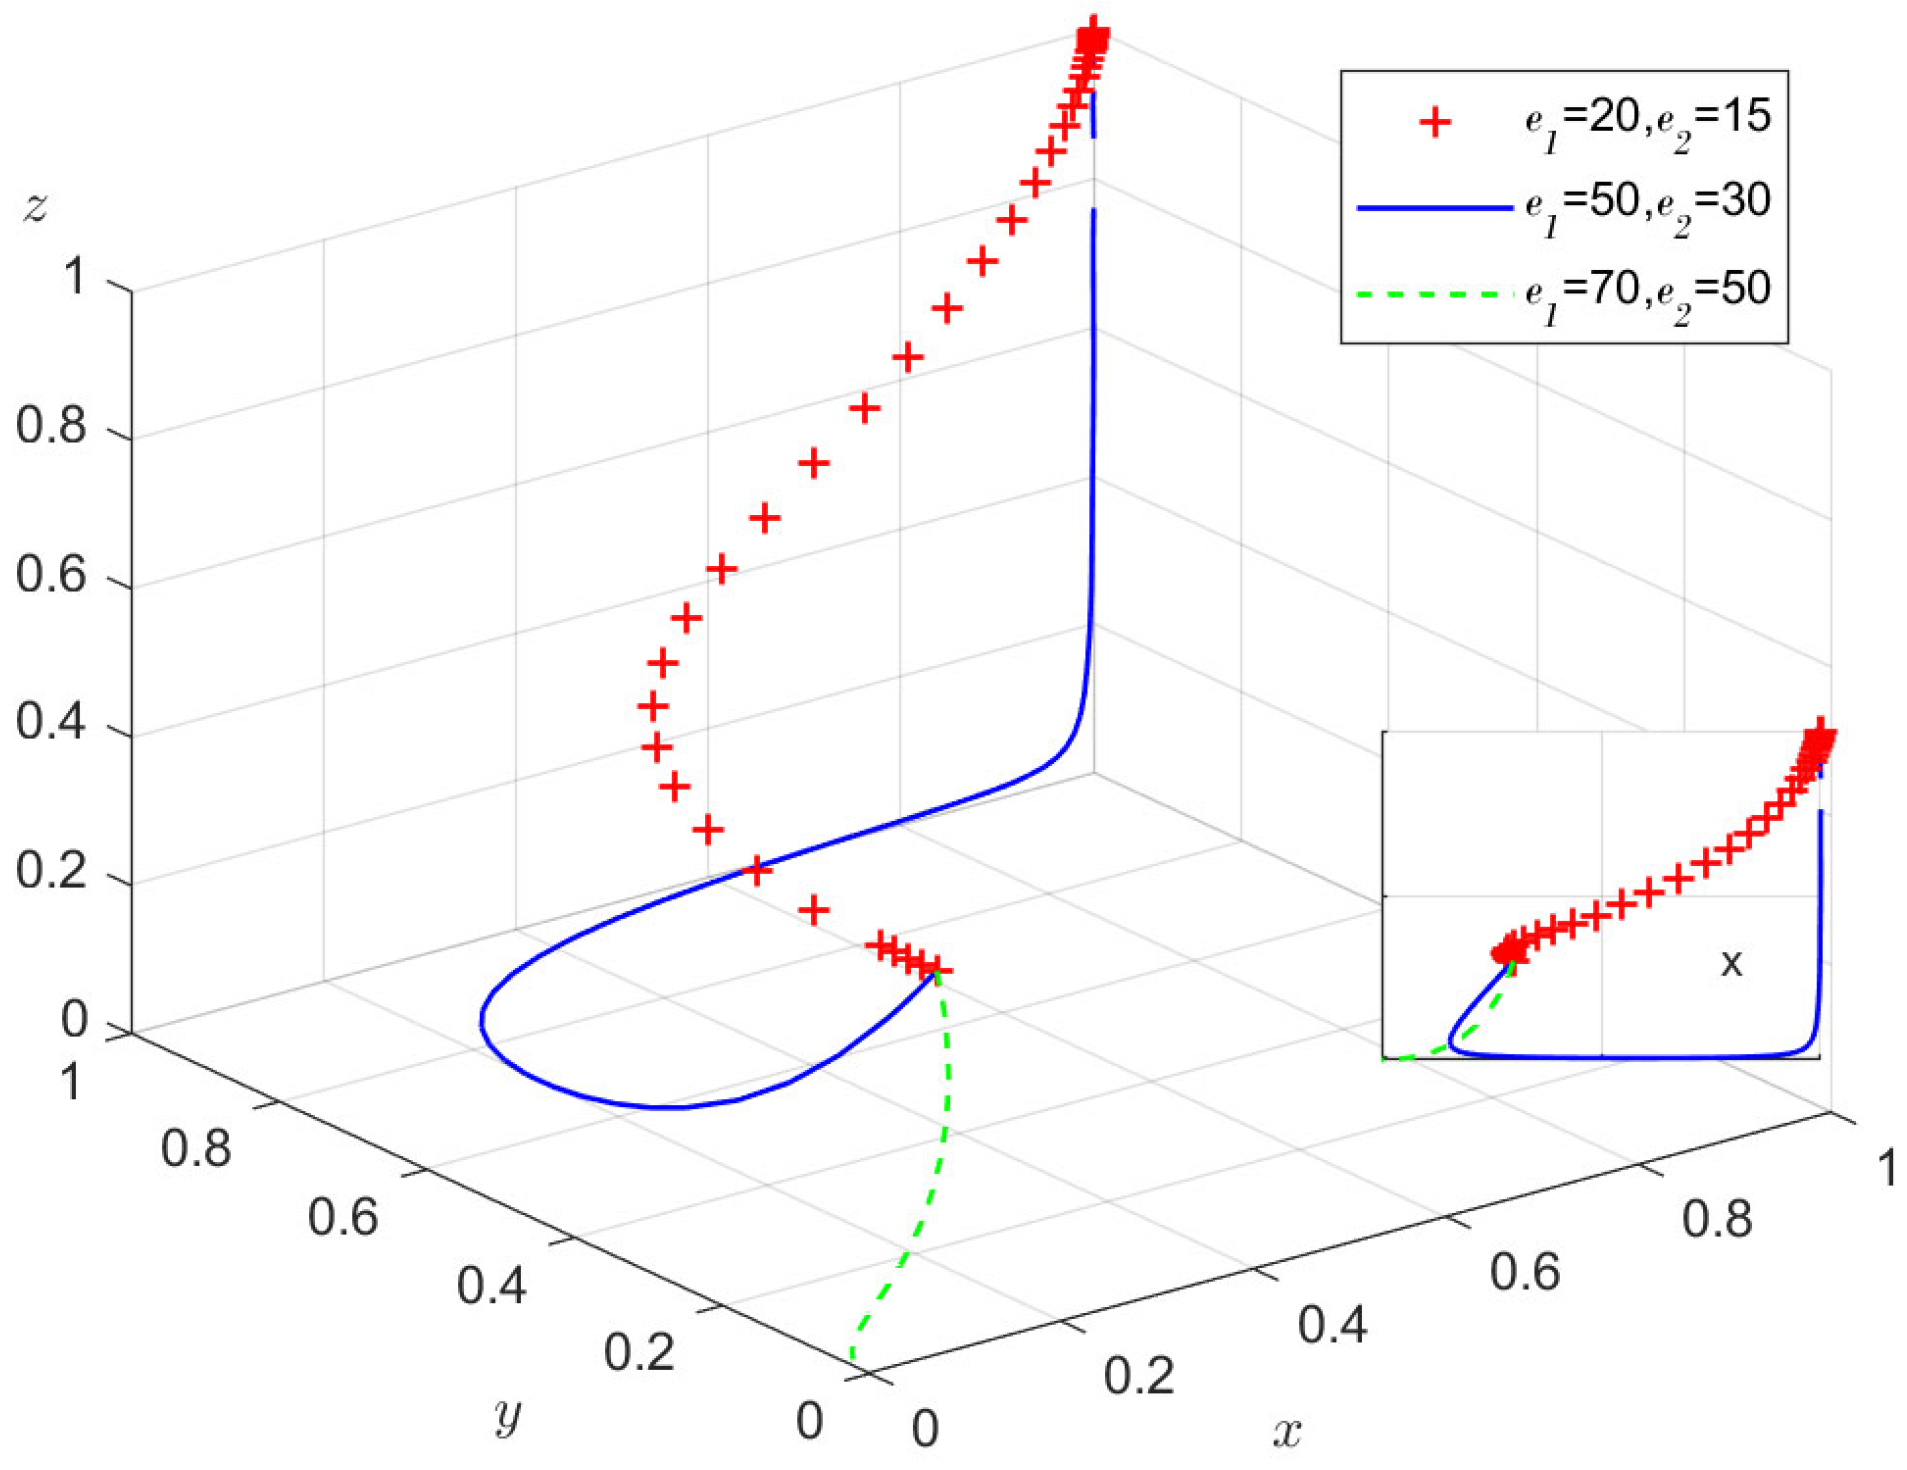
On the basis of Array 1, keep the values of other parameters unchanged, change the values of e1 and e2, and select the values of and as well as respectively, to carry out the numerical simulation, and observe the influence of the reputation of manufacturers and retailers on the evolution results. The simulation results of the system evolving over time for 50 times are shown in Figure 8.
Figure 8.
Evolutionary simulation of enterprises’ initial digitization-level gains.
As concluded in Proposition 4 and Proposition 5, the manufacturer’s and retailer’s own digitization-level gains will have an impact on the outcome of the system evolution game. Specifically, when the manufacturer and retailer are at a low stage of digitization-level gain, they tend to use the third-party platform to obtain data empowerment and realize upgrading and development due to their own limited capabilities. In this case, the system evolves relatively quickly. This is because third-party platforms are able to pool resources and quickly provide enterprises with the data support and technology upgrade paths they need, helping them improve their digital operation capabilities in the short term. However, as the digitization process progresses and the benefits of digitization gradually increase, manufacturers and retailers become less reliant on third-party platforms, and the probability of choosing to join a third-party platform decreases accordingly. When the digitization benefits of enterprises exceed a certain threshold, the empowerment benefits provided by third-party platforms can no longer meet the growing needs of enterprises. At this point, the outcome of the evolutionary game will shift significantly from the original {high level of empowerment, join the platform, join the platform} to {low level of empowerment, build your own platform, do not join the platform}. This means that enterprises have enough strength to build their own digital platforms and carry out digital operations independently and no longer rely on the support of external third-party platforms. In summary, in the process of supply chain digitization, there is a close interdependence between enterprises and third-party digital platforms. On the one hand, the initial stage of enterprise’s digital development cannot be separated from the support of the third-party platform; on the other hand, as the enterprise’s digitization-level gains continue to rise, the third-party digital platform, in order to stabilize the cooperative relationship with the enterprise, needs to make greater efforts to improve its own digital technology standard and application capabilities to ensure that it can continue to output higher quality that is more suitable for the enterprise’s demand for empowerment gains. This shift aims to achieve synergistic development and common development between the two sides in the wave of supply chain digitization and realize the synergistic development and win–win situation in the wave of supply chain digitalization.
6. Discussion
Based on a tripartite evolutionary game model of a platform, manufacturer, and retailer, our analysis reveals several non-linear dynamics governing digital transformation decisions. Keys among these are threshold effects and path dependence, as detailed below.
Our analysis reveals that digital transformation in supply chains is not a linear process but exhibits distinct threshold effects. For instance, the stability conditions in Propositions 4 and 5 hinge on critical parameter combinations. This implies that incremental improvements by a platform may not alter enterprise decisions until a critical threshold is surpassed, triggering a discontinuous shift in strategy. Furthermore, the initial digital capabilities of enterprises create a path dependence that can “lock in” their strategic trajectories. As visualized in the phase portraits (Figure 8), once the system’s state evolves into the basin of attraction for a particular equilibrium like manufacturer self-building, it becomes resilient to minor parameter fluctuations, demonstrating a form of hysteresis. This underscores the importance of large-scale, strategic-level digital investments—in terms of both financial commitment and the adoption of advanced technologies—rather than marginal adjustments. Such substantial investments are necessary to achieve the critical threshold required to trigger a fundamental shift in the digital ecosystem and avoid being trapped in a suboptimal equilibrium.
Additionally, a key insight is the pivotal role of cross-side network effects in platform ecosystem formation. Corollary 2 and the simulation in Figure 7 demonstrate that a manufacturer’s willingness to join a platform (y) increases with the retailer’s probability of joining (z). This interdependence suggests that the value proposition for one side of the market is co-created by the participation of the other side. Consequently, a platform’s empowerment strategy cannot be designed in isolation. It must be conceived as an integrated “combo” that simultaneously enhances value for both manufacturers and retailers. For example, a platform could bundle advanced analytics for manufacturers with seamless market access tools for retailers to create mutually reinforcing incentives for joint adoption.
The coexistence of multiple stable equilibria indicates that different digitalization strategies will serve different segments of enterprises. High-empowerment platforms and self-building options are predominantly viable for “leading” enterprises with strong initial digital capabilities (e1) and brand influence (I1). In contrast, low-empowerment platforms or hybrid equilibria (e.g., where only the manufacturer joins) may represent a pragmatic choice for small and medium-sized enterprises (SMEs) with limited resources. This provides a theoretical foundation for platforms to adopt a segmentation strategy, tailoring their service offerings and fee structures to distinct enterprise profiles rather than pursuing a one-size-fits-all approach.
Based on the above conclusions, in order to better promote supply chain digital transformation, this paper puts forward some management enlightenments for third-party digital platforms and supply chain enterprises for reference and decision-making. In the process of supply chain digital transformation, third-party enabling platforms play a key role. As an important catalyst, the platform can play its own initiative to promote the sharing of key resources and tools of the industrial Internet, reduce the digitalization threshold of SMEs, and jointly promote the in-depth development of digital transformation. Secondly, it should conduct a comprehensive survey and demonstration analysis of the market, deeply understand the practical needs of enterprise digital upgrading, and offer tailor-made differentiated digital solutions for the pain points and difficulties faced by different enterprises in the process of digital transformation so as to enhance its own level of service and empowerment effect. Also, it should move beyond generic needs assessment to quantify the critical benefit thresholds for target enterprises. Investment should aim to decisively exceed these thresholds. Strategy should focus on creating synergistic value packages that incentivize concurrent adoption by both manufacturers and retailers, leveraging cross-side network effects. Digital transformation pathways must be tailored to the specific conditions of different enterprises. Companies that already possess foundational digital capabilities but face financing constraints, such as small and medium-sized technology firms, may consider independently advancing their digital transformation. In contrast, enterprises with sufficient capital, such as certain large retailers, ought to comprehensively evaluate platforms established by the third-party platforms or manufacturers and make well-considered decisions regarding participation. On the other hand, enterprises should regularly diagnose their digital posture relative to industry thresholds. Platform selection should consider not only current features but also the partner’s evolutionary potential and the quality of its existing ecosystem, prioritizing platforms that can co-evolve.
This study deliberately focuses on a tripartite game involving a single third-party platform and assumes risk-neutral participants to establish a clear and tractable baseline model. These defined boundaries are not oversights but necessary simplifications that allow us to isolate and rigorously analyze the core strategic interactions between the platform, manufacturer, and retailer—specifically, how empowerment levels, joining decisions, and cost–benefit parameters drive the system’s evolution. The primary contribution of this work lies in establishing this foundational framework and offering practical guidance for digital transformation of supply chains.
The tripartite evolutionary game framework developed in this study offers a foundational analytical tool for understanding digital transformation in multi-actor supply chains. Future research can build directly upon this framework by incorporating important dimensions such as heterogeneous risk preferences and multi-platform competition, which would significantly enhance the model’s applicability to specific, complex real-world scenarios.
Author Contributions
Conceptualization, Y.L.; Methodology, Y.S., H.T. and Y.L.; Validation, Y.S. and H.T.; Investigation, Y.S., H.T. and Y.L.; Resources, Z.Z.; Writing—original draft, Y.S. and H.T.; Writing—review & editing, Y.S.; Supervision, Z.Z.; Project administration, Z.Z.; Funding acquisition, Z.Z. All authors have read and agreed to the published version of the manuscript.
Funding
This work was supported by the National Natural Science Foundation of China (Grant No. 72461004) and the Guangxi Natural Science Foundation Program (Grant No. 2023GXNSFAA026308).
Institutional Review Board Statement
Not applicable.
Informed Consent Statement
Not applicable.
Data Availability Statement
The data presented in this study are available on request from the corresponding author due to policies and privacy protocols adhered to by our research group.
Conflicts of Interest
The authors declare no conflicts of interest.
References
- Zhang, W.; Zhao, S.Q.; Wan, X.Y.; Yao, Y. Study on the effect of digital economy on high-quality economic development in China. PLoS ONE 2021, 16, e0257365. [Google Scholar] [CrossRef] [Scilit] [PubMed]
- Li, R.; Rao, J.; Wan, L.Y. The digital economy, enterprise digital transformation, and enterprise innovation. Manag. Decis. Econ. 2022, 43, 2875–2886. [Google Scholar] [CrossRef] [Scilit]
- Ghadge, A.; Kara, M.E.; Moradlou, H.; Goswami, M. The impact of Industry 4.0 implementation on supply chains. J. Manuf. Technol. Manag. 2020, 31, 669–686. [Google Scholar] [CrossRef] [Scilit]
- Ghobakhloo, M.; Fathi, M. Corporate survival in Industry 4.0 era: The enabling role of lean-digitized manufacturing. J. Manuf. Technol. Manag. 2020, 31, 1–30. [Google Scholar] [CrossRef] [Scilit]
- Plekhanov, D.; Franke, H.; Netland, T.H. Digital transformation: A review and research agenda. Eur. Manag. J. 2023, 41, 821–844. [Google Scholar] [CrossRef] [Scilit]
- Han, X.; Zheng, Y. Driving Elements of Enterprise Digital Transformation Based on the Perspective of Dynamic Evolution. Sustainability 2022, 14, 9915. [Google Scholar] [CrossRef] [Scilit]
- Feng, M.; Si, H.R.; Li, Y.; Zhang, J.R. Evaluating the drivers of B2B performance: An empirical analysis based on Alibaba. PLoS ONE 2024, 19, e0306919. [Google Scholar] [CrossRef] [Scilit]
- Stentoft, J.; Wickstrom, K.A.; Philipsen, K.; Haug, A. Drivers and barriers for Industry 4.0 readiness and practice: Empirical evidence from small and medium-sized manufacturers. Prod. Plan. Control 2021, 32, 811–828. [Google Scholar] [CrossRef] [Scilit]
- Skare, M.; de Obesso, M.D.; Ribeiro-Navarrete, S. Digital transformation and European small and medium enterprises (SMEs): A comparative study using digital economy and society index data. Int. J. Inf. Manag. 2023, 68, 102594. [Google Scholar] [CrossRef] [Scilit]
- Choi, T.M.; Luo, S.Y. Data quality challenges for sustainable fashion supply chain operations in emerging markets: Roles of blockchain, government sponsors and environment taxes. Transp. Res. Part E-Logist. Transp. Rev. 2019, 131, 139–152. [Google Scholar] [CrossRef] [Scilit]
- Shen, B.; Choi, T.M.; Minner, S. A review on supply chain contracting with information considerations: Information updating and information asymmetry. Int. J. Prod. Res. 2019, 57, 4898–4936. [Google Scholar] [CrossRef] [Scilit]
- Xu, G.Y.; Li, G.G.; Sun, P.B.; Peng, D. Inefficient investment and digital transformation: What is the role of financing constraints? Financ. Res. Lett. 2023, 51, 103429. [Google Scholar] [CrossRef] [Scilit]
- Tiwari, S.; Sharma, P.; Choi, T.M.; Lim, A. Blockchain and third-party logistics for global supply chain operations: Stakeholders? perspectives and decision roadmap*. Transp. Res. Part E-Logist. Transp. Rev. 2023, 170, 103012. [Google Scholar] [CrossRef] [Scilit]
- Zhao, N.; Hong, J.; Lau, K.H. Impact of supply chain digitalization on supply chain resilience and performance: A multi-mediation model. Int. J. Prod. Econ. 2023, 259, 108817. [Google Scholar] [CrossRef] [Scilit]
- Park, A.; Li, H. The Effect of Blockchain Technology on Supply Chain Sustainability Performances. Sustainability 2021, 13, 1726. [Google Scholar] [CrossRef] [Scilit]
- Ben-Daya, M.; Hassini, E.; Bahroun, Z. Internet of things and supply chain management: A literature review. Int. J. Prod. Res. 2019, 57, 4719–4742. [Google Scholar] [CrossRef] [Scilit]
- Belhadi, A.; Mani, V.; Kamble, S.S.; Khan, S.; Verma, S. Artificial intelligence-driven innovation for enhancing supply chain resilience and performance under the effect of supply chain dynamism: An empirical investigation. Ann. Oper. Res. 2024, 333, 627–652. [Google Scholar] [CrossRef] [Scilit]
- Cheng, T.; Kamble, S.S.; Belhadi, A.; Ndubisi, N.O.; Lai, K.H.; Kharat, M.G. Linkages between big data analytics, circular economy, sustainable supply chain flexibility, and sustainable performance in manufacturing firms. Int. J. Prod. Res. 2022, 60, 6908–6922. [Google Scholar] [CrossRef] [Scilit]
- Ye, F.; Liu, K.; Li, L.; Lai, K.; Zhan, Y.; Kumar, A. Digital supply chain management in the COVID-19 crisis: An asset orchestration perspective. Int. J. Prod. Econ. 2022, 245, 108396. [Google Scholar] [CrossRef] [Scilit]
- Li, L.; Su, F.; Zhang, W.; Mao, J.Y. Digital transformation by SME entrepreneurs: A capability perspective. Inf. Syst. J. 2018, 28, 1129–1157. [Google Scholar] [CrossRef] [Scilit]
- Stallkamp, M.; Schotter, A. Platforms without borders? The international strategies of digital platform firms. Glob. Strategy J. 2021, 11, 58–80. [Google Scholar] [CrossRef] [Scilit]
- Xie, X.M.; Han, Y.H.; Anderson, A.; Ribeiro-Navarrete, S. Digital platforms and SMEs’ business model innovation: Exploring the mediating mechanisms of capability reconfiguration. Int. J. Inf. Manag. 2022, 65, 102513. [Google Scholar] [CrossRef] [Scilit]
- Björkdahl, J. Strategies for Digitalization in Manufacturing Firms. Calif. Manag. Rev. 2020, 62, 17–36. [Google Scholar] [CrossRef] [Scilit]
- Tronvoll, B.; Sklyar, A.; Sörhammar, D.; Kowalkowski, C. Transformational shifts through digital servitization. Ind. Mark. Manag. 2020, 89, 293–305. [Google Scholar] [CrossRef] [Scilit]
- Wen, H.W.; Zhong, Q.M.; Lee, C.C. Digitalization, competition strategy and corporate innovation: Evidence from Chinese manufacturing listed companies. Int. Rev. Financ. Anal. 2022, 82, 102166. [Google Scholar] [CrossRef] [Scilit]
- Pagani, M.; Pardo, C. The impact of digital technology on relationships in a business network. Ind. Mark. Manag. 2017, 67, 185–192. [Google Scholar] [CrossRef] [Scilit]
- Liu, W.H.; Wei, S.; Liu, Y.F.; Hou, J.H. Cooperative partners’ heterogeneity and supplier empowerment: Impact on the performance of digital technology collaborative innovation in supply chain. Int. J. Logist.-Res. Appl. 2024, 28, 1642–1658. [Google Scholar] [CrossRef] [Scilit]
- Rijswijk, K.; de Vries, J.R.; Klerkx, L.; Turner, J.A. The enabling and constraining connections between trust and digitalisation in incumbent value chains. Technol. Forecast. Soc. Change 2023, 186, 122175. [Google Scholar] [CrossRef] [Scilit]
- Swaminathan, V.; Sorescu, A.; Steenkamp, J.; O’Guinn, T.; Schmitt, B. Branding in a Hyperconnected World: Refocusing Theories and Rethinking Boundaries. J. Mark. 2020, 84, 24–46. [Google Scholar] [CrossRef] [Scilit]
- Ling, F.; Heng, G.; Chang-Richards, A.; Chen, X.C.; Yiu, T.W. Impact of Digital Technology Adoption on the Comparative Advantage of Architectural, Engineering, and Construction Firms in Singapore. J. Constr. Eng. Manag. 2023, 149, 04023125. [Google Scholar] [CrossRef] [Scilit]
- Yang, P.; Xiong, N.X.; Ren, J.L. Data Security and Privacy Protection for Cloud Storage: A Survey. IEEE Access 2020, 8, 131723–131740. [Google Scholar] [CrossRef] [Scilit]
- Bodkhe, U.; Tanwar, S.; Parekh, K.; Khanpara, P.; Tyagi, S.; Kumar, N.; Alazab, M. Blockchain for Industry 4.0: A Comprehensive Review. IEEE Access 2020, 8, 79764–79800. [Google Scholar] [CrossRef] [Scilit]
- Dai, D.M.; Wu, X.Y.; Si, F.S.; Feng, Z.N.; Chu, W.S. Complex characteristics analysis of time-delay digital supply chain driven by cybersecurity. Kybernetes 2023, 52, 3362–3390. [Google Scholar] [CrossRef] [Scilit]
- Ivanov, D.; Dolgui, A.; Sokolov, B. Cloud supply chain: Integrating Industry 4.0 and digital platforms in the “Supply Chain-as-a-Service”. Transp. Res. Part E Logist. Transp. Rev. 2022, 160, 102676. [Google Scholar] [CrossRef] [Scilit]
- Lin, J.; Lin, S.; Benitez, J.; Luo, X.R.; Ajamieh, A. How to build supply chain resilience: The role of fit mechanisms between digitally-driven business capability and supply chain governance. Inf. Manag. 2023, 60, 103747. [Google Scholar] [CrossRef] [Scilit]
- Treiblmaier, H.; Garaus, M. Using blockchain to signal quality in the food supply chain: The impact on consumer purchase intentions and the moderating effect of brand familiarity. Int. J. Inf. Manag. 2023, 68, 102514. [Google Scholar] [CrossRef] [Scilit]





Disclaimer/Publisher’s Note: The statements, opinions and data contained in all publications are solely those of the individual author(s) and contributor(s) and not of MDPI and/or the editor(s). MDPI and/or the editor(s) disclaim responsibility for any injury to people or property resulting from any ideas, methods, instructions or products referred to in the content. |
© 2026 by the authors. Licensee MDPI, Basel, Switzerland. This article is an open access article distributed under the terms and conditions of the Creative Commons Attribution (CC BY) license.