


Highlights
How does this work contribute to systems practice, theory, and/or methodology?
- Integrates supply-side and demand-side risks into a unified analytical framework, overcoming the one-sided focus of prior studies on single risk sources or individual markets.
- Constructs a China-specific Energy Demand–Supply Risk Index via text mining of over 610,000 official media articles, capturing policy signals and market sentiment that international indices cannot reflect.
- Combines the TVP-VAR-DY connectedness framework with the GARCH-MIDAS model, linking daily return spillovers to monthly EDRI and separating short-run sentiment-driven associations from long-run risk-narrative associations.
- China’s energy equity markets form a closely connected network, with new ener-gy and electricity as net transmitters, and storage and fossil fuels as net receivers.
- The associations between EDRI and market responses are heterogeneous and lagged: oil and gas respond rapidly, energy storage mainly in the short term, and coal slowly but persistently.
- The transmission core gradually shifts from traditional fossil fuels toward the new energy–electricity chain, with energy storage acting as a key shock absorber and buffering node.
Abstract
This study adopts the TVP-VAR-DY framework to examine time-varying return spillovers within China’s energy sector equity market system. Based on textual data from major Chinese media, the Energy Demand–Supply Risk Index (EDRI) is constructed, and the GARCH-MIDAS model is applied to examine short- and long-term associations between energy demand–supply risks and dynamic return spillovers. Findings show: (1) Spillovers change over time and form a closely connected network, where new energy and electricity markets are main transmitters, while storage and traditional energy equity markets mainly receive. Storage is therefore better characterized as a systemically important buffer rather. (2) Effects differ across markets with lagged responses. Oil and natural gas react first, coal more slowly. (3) Each market’s position changes over time, while traditional fossil energy remains the primary source of fundamental demand–supply risks; new energy and electricity act as the dominant static net return transmitters in the equity market network, with traditional fuels surging into net transmitter roles specifically during crisis windows and pairwise transmission channels.
MSC:
91-08
1. Introduction
The international energy system is undergoing a fundamental restructuring driven by geopolitical tensions, changes in consumption patterns, and increasing uncertainty in energy supply and demand [1]. Under these circumstances, energy security can no longer be interpreted solely from the perspective of resource availability; instead, it increasingly reflects the capacity of an energy system to withstand external shocks and maintain stable economic operations [2]. Meanwhile, the interaction between energy transition policies, industrial transformation, and changing consumption structures has generated new sources of uncertainty on the demand side. When these factors interact with supply disruptions and resource constraints, risk transmission across interconnected energy equity markets may be further amplified [3,4,5,6]. As the largest energy consumer worldwide, China faces the challenge of simultaneously ensuring fossil energy supply stability and accelerating the transition toward a low-carbon energy system under the “dual carbon” goals [7]. Therefore, exploring how energy demand–supply risks evolve and how they influence return spillovers among energy equity markets is crucial for understanding the resilience and stability of modern energy systems [5,6].
Existing studies on energy equity markets’ return spillovers have mainly examined the effects of specific external uncertainties, including geopolitical risk (GPR) and climate policy uncertainty (CPU), on energy price fluctuations [8,9,10]. For instance, Apergis and Fahmy [8] investigated the role of geopolitical risks in driving sharp declines in major fossil fuel prices, while Padhan et al. [11] demonstrated the influence of economic policy uncertainty on crude oil market volatility. However, these studies only focus on the supply-side impact caused by geographical conflicts or the demand-side fluctuations caused by economic policies, but rarely consider the supply and demand risk under a unified framework, and often deal with supply and demand separately, ignoring the interactive spillover effect of the two. Bento et al. [12] believe that energy security is not only related to the continuity of supply, but also to the stability of dynamic matching between supply and demand. On the one hand, geographical conflict spillover and key mineral constraints are intertwined, infrastructure construction costs and energy transportation risks are increased [13], and oil and gas supply interruption affects coal, power and energy storage scheduling through fuel substitution and cost transmission, which all affect the security of supply. On the other hand, extreme climate, AI computing power surge and electrification transformation jointly push up the peak load of power, highlighting the risk of imbalance between supply and demand [14,15]. High electricity demand reversely drives fossil energy power generation, while energy storage allocation is jointly restricted by the fluctuation of fossil energy prices, which all have an impact on demand. Such bilateral risks of supply and demand have formed a complex risk spillover network among oil and gas, coal and electricity, which is very likely to induce systemic risks in the energy system [16]. Therefore, this paper puts oil and gas, coal, electricity and energy storage into a unified analysis framework, and systematically measures the return spillover effect and its dynamic evolution characteristics between energy equity markets from the perspective of supply and demand.
Currently, for the study of dynamic return spillovers between energy equity markets, the physical quantity index, price volatility or international general index, such as geopolitical risk index (GPR) and economic policy uncertainty index (EPU), is usually used to measure the level of energy equity market risk [17,18]. Although these indicators can better reflect the impact of changes in the international macro-environment and external shocks on the energy equity markets, there are still some limitations in their ability to identify the risk changes caused by policy orientation, supply and demand structure adjustment and energy transformation in China’s energy equity markets. Especially in the context of China’s unique energy policy, the policy signals and risk narratives released by the official media often contain deeper supply and demand early warning information, which is difficult to describe in a timely and effective manner by traditional indicators. At the same time, the energy-related policy reports and guidance information released by China’s official media have a profound impact on the future trend and fluctuation of energy prices through market expectations [19]. Integrating big data text mining technology can accurately extract market perception and policy signals from massive unstructured text [20]. Based on this, this paper combines the word2vec word vector expansion and semantic word-density weighting method, and uses mainstream media texts such as People’s Daily to construct China’s energy supply and demand risk index (EDRI). Through semantic space mapping, the index not only quantifies the supply side guarantee and demand-side pressure, but also improves the foresight and context adaptability of risk quantification.
To address the limitations of existing studies that isolate supply-side shocks or demand uncertainties and rely on generic proxies, this study investigates the dynamic risk transmission across China’s major energy equity markets under a unified bilateral supply–demand framework. While standard single-frequency models fail to disentangle short-term market sentiment from long-term structural variance, we bridge text mining and hybrid econometrics by fusing a novel China-specific Energy Demand–Supply Risk Index (EDRI)—constructed from over 610,000 official media articles—with a combined TVP-VAR-DY and GARCH-MIDAS framework. Moving beyond conventional volatility correlation, this integrated approach uncovers the multiscale risk transmission mechanism, demonstrating how monthly fundamental shifts continuously shape the long-term conditional variance of daily return spillovers. The contributions of this study are threefold. First, unlike previous studies focusing on single risk sources or individual energy equity markets, this study develops a multi-market framework covering major energy sectors to investigate cross-market risk transmission under supply–demand uncertainty. Second, an EDRI tailored to China’s energy context is constructed by integrating policy information and market sentiment from textual data, enabling a more comprehensive measurement of energy risks from both supply and demand perspectives. Third, the results reveal a structural shift in the return transmission pattern of China’s energy equity markets, with the transmission core gradually moving from traditional fossil fuels toward the new energy–electricity chain, with energy storage serving as an absorptive and buffering node. Meanwhile, oil and gas markets exhibit stronger short-term responses, whereas coal shows greater persistence and buffering capacity.
2. Mechanisms and Theoretical Analysis
2.1. Mechanisms of Interactions Among Energy Equity Markets
The linkage between energy equity markets is not simply driven by price changes, but through industrial chain transmission, energy substitution effects and financial correlation to form a complex fluctuation transmission network. The specific performance is as follows:
First, the cost transmission mechanism based on the industrial chain. In the oil, gas, coal, electricity and storage systems, electricity is the core hub of energy conversion. As the main power generation fuel, coal and natural gas supply risk and price fluctuation will be transmitted to the power market through the fuel cost channel. Research shows that Brent crude oil, Chinese coal and LNG prices significantly enhance the transmission effect of fluctuations between energy equity markets, especially during the period of the COVID-19 pandemic and the conflict between Russia and Ukraine [21,22]. As an important part of power system flexibility regulation, the energy storage market is not only affected by the supply constraints of upstream minerals such as lithium, but also closely related to the fluctuation rate of the power market, thus forming an endogenous fluctuation linkage between fuel, electricity and energy storage [23].
Second, the mechanism of substitution and complementarity among energy varieties. There is a significant cross-price elasticity between different energy varieties. When the international oil and gas supply chain is impacted and the price rises rapidly, the energy demand of the industrial and power generation sectors will shift to alternative energy such as coal, thus enhancing the fluctuation correlation between the relatively independent markets. Research shows that there is a strong fluctuation linkage relationship between traditional fossil energy and new energy equity markets, and the substitution effect will be further amplified during the impact of extreme events [24,25]. Moreover, a long-term cointegration link is observed between new and traditional energy prices, with return spillovers predominantly flowing from renewable energy equity markets to fossil fuel markets. This pattern becomes more pronounced in the volatile period following 2020 [26]. With the increasing synergy between emerging energy such as hydrogen energy, new energy storage and traditional fossil energy in the power system, the linkage between energy equity markets has gradually evolved from a single price correlation to a multi-level fluctuation transmission network [27].
Third, energy equity markets are increasingly influenced by financial factors, through which macroeconomic shocks can reshape cross-market risk transmission [28]. As energy assets become more closely integrated with financial markets, unexpected events may alter investors’ expectations and risk preferences, thereby amplifying return spillovers among energy sectors. Existing evidence indicates that global uncertainty and financial market turbulence can strengthen the linkages between China’s crude oil futures market and other energy equity markets, particularly during periods of heightened stress, such as the 2018 China–US trade dispute, the COVID-19 outbreak in 2020, and the Russia–Ukraine conflict in 2022 [29]. Meanwhile, media information and policy signals can rapidly influence market sentiment and trigger capital adjustments across energy futures and related financial assets [30]. Therefore, crisis events often lead to stronger dependence and closer connectedness among energy submarkets, further increasing the potential for return spillovers [31,32,33].
2.2. Mechanisms Through Which Energy Demand–Supply Risk Affects Return Spillovers Across Energy Equity Markets
The Energy Demand–Supply Risk Index (EDRI), as a comprehensive indicator reflecting the turbulence of the external environment, has a heterogeneous impact on dynamic return spillovers between energy equity markets through the following paths:
First, information transmission and market expectation path. The Energy Demand–Supply Risk Index (EDRI) based on news texts can capture the early signals of policy orientation and supply and demand gap. When news and public opinion focus on energy security or supply constraints, the energy equity markets will generate scarcity expectations, pushing up the level of risk spillovers. The research shows that the economic narrative index based on natural language processing technology (NLP) can significantly predict the stock returns of the energy equity markets, which verifies the driving effect of news narratives on market expectations [34]. Nguyen [35] believes that the news sentiment extracted based on the RoBERTa language model can effectively predict the volatility of energy prices, and negative news has a more significant effect on the price rise. As the oil and gas market is deeply integrated into the global value chain, its market is the most sensitive to the Energy Demand–Supply Risk Index (EDRI) signal, showing the characteristics of high sensitivity [36].
Second, resource endowment and energy inertia path. The breadth and depth of the impact of risk shocks depend on the resource endowment of each market. The pattern of “rich coal, poor oil and little gas” in China determines that the coal market plays the role of bedrock in risk hedging [37]. Compared with the drastic fluctuations in the oil and gas market, the coal market is more defensive in the face of supply and demand risks, and its impact path often lags behind. However, due to the complex capacity planning and long-term agreement contracts involved, the impact will last longer. The study found that even under the background of rapid growth of new energy, the change in power elasticity coefficient still reveals the long-term toughness of coal demand, indicating that the basic position of coal in power supply is difficult to replace in the short term [38]. This inertia is essentially caused by the path dependence of the energy system.
Third, low carbon transformation pressure and policy-driven path. China’s Dual Carbon strategy has reshaped the nature of energy demand–supply risk by extending it beyond conventional concerns over physical supply shortages to encompass risks associated with the transition toward a low-carbon energy system. Policy signals related to green transformation and carbon constraints captured by the Energy Demand–Supply Risk Index (EDRI) can directly increase volatility in the new energy and energy storage markets. Prior studies using the environmental dynamic stochastic general equilibrium (E-DSGE) framework find that transition risk increases the systemic vulnerability of energy firms, largely by intensifying frictions within financial markets. These effects are more evident during the implementation of the Dual Carbon strategy [39]. Evidence from China’s pilot carbon markets also shows significant time-varying return spillovers from carbon markets to the electricity and new energy equity markets. Higher-order distributional characteristics, including volatility, skewness, and kurtosis, further strengthen risk contagion [40]. As renewable energy capacity expands, the main source of energy security risk is shifting from upstream resource supply to midstream electricity dispatch and system balancing. As a result, flexible resources such as energy storage play a more important role in the energy return spillover network and have become essential for maintaining the stability and resilience of the energy system [41].
Energy equity markets and news media are both highly sensitive to external shocks, and geopolitical events play an important role in shaping their interactions. Geopolitical shocks are associated with heightened market volatility and strengthened cross-market return connectedness and affect the stability of the global energy demand–supply balance. Figure 1 presents the mechanisms through which energy demand–supply risk influences return spillovers across energy equity markets.
Figure 1.
A framework for return spillover mechanisms across energy equity markets driven by energy demand–supply risks.
3. Analysis of Return Spillovers Across Energy Equity Markets
3.1. TVP-VAR-DY Model Specification
The dynamic linkages in energy equity market volatility are examined using a TVP-VAR model coupled with the Diebold–Yilmaz [42] spillover framework. Unlike the standard DY approach, which depends on a predefined rolling window, the TVP-VAR-DY framework removes this arbitrary requirement and enables a more flexible representation of evolving market connectedness under structural change in China’s energy system.
The analysis is based on a first-order TVP-VAR model, and its mathematical representation is given as follows:
where Δxt and Δxt−1 denote the changes in the logarithmic returns of the energy equity markets indices at time t and t − 1, respectively. The residual vector εt has dimension N × 1. Both βt and are N × N matrices, while vec(βt) and vt are N2 × 1 vectors. The covariance matrix Rt has dimension N2 × N2.
vec(βt) = vec(βt−1) + vt, vt ∼ N(0, Rt)
The TVP-VAR model can be expressed in a time-varying moving-average form, which is used to derive the generalized forecast error variance decomposition.
The GFEVD is constructed based on the moving-average coefficient matrices to quantify how innovations in one variable explain the forecast error variance of another variable.
The total connectedness index (TCI) is calculated from the GFEVD as follows:
The TCI measures the overall level of return connectedness across China’s energy equity markets. By incorporating both direct and indirect spillover effects, it reflects the degree of interconnectedness within the energy system and the overall transmission of return shocks across markets.
The Total Directional Return Spillover Index (TO) is calculated as follows:
This index measures the return spillovers transmitted from one variable to all other variables.
The Total Directional Return Inflow Index (FROM) is defined as
This index measures the return spillovers received by one variable from all other variables.
The net return spillover index (NET) is obtained by subtracting the Total Directional Return Inflow Index (FROM) from the Total Directional Return Spillover Index (TO). It is defined as
This index measures the net position of each market in the return spillover network. A positive value indicates that the market is a net transmitter of return shocks, whereas a negative value indicates that the market is a net receiver.
3.2. Data Sources and Descriptive Statistics
The analysis considers six key segments of China’s energy system, namely renewable power generation, energy storage, oil, natural gas, coal, and electricity. These sectors are examined within a unified framework to capture their evolving interactions over time. Market-level dynamics are proxied using wind sector indices. These indices are widely used in the energy finance literature and are regarded as reliable representations of the corresponding markets. Table 1 provides a detailed description of each index together with the relevant data sources.
Table 1.
Selection of energy equity market indices.
The sample interval is from 1 December 2016 to 30 November 2025, and 2185 daily observations are obtained. This interval completely covers a series of major events, such as Sino-US trade frictions, the entry into force of the OPEC+ production reduction agreement, the global outbreak of the COVID-19 pandemic, the Russia–Ukraine War, the escalation of the Israeli–Palestinian confrontation, and the proposal and implementation of China’s “double carbon” goal, providing a wealth of realistic scenarios for studying the return spillover effect of energy equity markets under external shocks.
For China’s energy equity markets, this paper selects representative core energy varieties based on the wind market index, the authoritative benchmark recognized by the domestic capital market, and following the general standards for energy research. The analysis system constructed in this paper covers many key fields, such as coal, oil and gas, electricity and energy storage. The research data is strictly preprocessed. The specific steps are as follows: First, we collect the closing prices of each energy equity market index and perform a standardization treatment. Second, the log-return transformation method is applied as follows:
where pt and pt−1 denote the closing values of a given index on days t and t − 1, respectively.
Rt = Ln(Pt/Pt−1)
In order to facilitate the follow-up analysis, the six selected energy equity market indexes are abbreviated in this paper. The specific correspondence is Wind New Energy Power Generation Index (WNEPI), Wind Energy Storage Index (WESI), Wind Oil and Gas Index (WOGI), Wind Coal Index (WCI), Wind Electricity Power Index (WEPI) and Wind Gas Index (WGI).
Table 2 presents the descriptive statistical results of six energy equity markets’ return series. It can be seen from Table 2 that the mean return of Wind Coal Index (WCI) is the highest, followed by Wind Energy Storage Index (WESI), Wind Electricity Power Index (WEPI), Wind Oil and Gas Index (WOGI), Wind New Energy Power Generation Index (WNEPI) and Wind Gas Index (WGI). From the perspective of return dispersion, the fluctuation range of the WESI market is the largest, followed by the WCI market, WGI market, WNEPI market, WOGI market and WEPI market. The return variability of WCI and WESI markets is relatively high, reflecting the sensitivity of the two in the current energy supply and demand pattern to a certain extent. As the main energy in China, the price of coal is very sensitive to the bilateral uncertainty of supply and demand. WESI carries the key function of stabilizing the fluctuation of new energy and flexible dispatching of power systems, so it exhibits higher return variability driven by market expectations and policy signals. From the perspective of distribution pattern, the skewness of all return series is negative, showing a left skew feature, and each series exhibits a distinct leptokurtic and heavy-tailed distributional profile. The unit root test results show that the ADF statistics of all series are significant at the 1% level, rejecting the original assumption that there is a unit root, indicating that all return time series are stationary and can be applied to subsequent empirical analysis.
Table 2.
Descriptive statistics for energy equity market index returns.
3.3. Analysis of Static Return Spillovers Across Energy Equity Markets
To examine the overall characteristics and transmission structure of return spillovers in China’s energy equity markets, a full-sample spillover analysis is initially performed. The optimal lag length of the TVP-VAR model is selected as one based on the Schwarz information criterion (SC), with the forecast horizon set to H = 10. The corresponding static connectedness matrix is then estimated, and the results are reported in Table 3.
Table 3.
Static return spillover table.
Table 3 reports the static spillover results based on the returns of six energy equity market indices. The results reveal that China’s energy equity markets exhibit a closely connected return spillover network with notable structural features.
First, the overall linkage of the system is very strong. The total connectedness index (TCI) reached 62.30%, indicating that the return movements of China’s energy equity markets are highly correlated, and the systematic return shocks are smoothly conducted among different markets. The contribution of each market to its own return variance ranges from 31.78% to 46.73%, of which the own variance contribution of the Wind Energy Storage Index (WESI) is the highest, while other markets are more sensitive to external return spillovers.
Second, electricity and new energy are the main exporters of return spillovers among energy equity markets. From the net spillover index (NET), both Wind New Energy Power Generation Index (WNEPI) and Wind Electricity Power Index (WEPI) are positive, and they are active transmitters of return spillovers. In particular, the total return spillover (TO) of WNEPI to other markets is as high as 79.69%, which is mainly transmitted to power and energy storage. This reflects that under the “double carbon” goal, the expansion and uncertainty of the installed scale of new energy directly shape the return dynamics of the downstream power system and supporting WESI market.
Third, energy storage and traditional energy equity markets mainly act as net receivers of return shocks. WESI records the lowest net spillover value, indicating its dominant receiving position within the return spillover network. Its main return spillover inflows originate from the WNEPI and WEPI markets, suggesting that energy storage is highly exposed to return shocks from upstream power-related sectors. Although serving as a net recipient, the storage market also plays an important role in absorbing and transmitting external return shocks within the energy system. Similarly, traditional energy equity markets, including the WCI and WOGI, exhibit negative net return spillover values. The strong bidirectional return spillovers between coal and oil-gas markets indicate that fossil energy sectors remain closely connected under external disturbances.
Moreover, return spillovers among energy equity markets display clear asymmetry and are closely associated with the structure of China’s energy industry chain. The renewable energy generation and electricity markets show the strongest interaction, with the return spillover from WNEPI to WEPI reaching 24.18%, substantially exceeding the reverse transmission. This suggests that the increasing integration of renewable generation into the power system has enhanced its influence on electricity market return movements. In addition, renewable energy equity markets transmit return shocks to traditional energy sectors, including oil and coal, through channels such as price adjustments, substitution effects, and changing market expectations. These findings highlight the evolving role of emerging energy sectors in reshaping the return spillover pattern during China’s energy transition.
To examine the impact of forecast horizon specifications on dynamic return spillover measures, this study performs robustness checks using forecast horizons of H = 5, H = 10, and H = 20, respectively, while holding other model specifications constant. The results show that the average total connectedness index (TCI) and its standard deviation remain largely consistent across different horizons, and both the magnitudes and signs of the average net spillovers for each market remain stable. This indicates that the primary spillover characteristics are robust to the choice of forecast horizons. Furthermore, after altering the lag orders and employing the traditional rolling window method, the signs of net spillovers across markets remain generally consistent, suggesting that the core net spillover relationships remain unaltered and further confirming the robustness of the empirical findings. The detailed results are presented in Table 4 below.
Table 4.
Robustness analysis: alternative forecast horizons, lag lengths, and rolling window specifications.
We quantify uncertainty via the residual-based multivariate moving block bootstrap [43]. For the full-sample VAR, we resample overlapping residual blocks, reconstruct returns recursively, and recompute the GFEVD and connectedness measures. The 95% percentile confidence intervals are based on 500 replications with block length 20, and are reported in Appendix A, Table A1. These results confirm that the main conclusions are statistically significant and robust.
3.4. Analysis of Dynamic Return Spillovers Across Energy Equity Markets
3.4.1. Overall Dynamic Spillover Index
Figure 2 presents the evolution of the total connectedness index (TCI) for China’s energy equity markets from December 2016 to November 2025. The pattern of return spillovers is jointly influenced by major energy-related events, changes in the international geopolitical environment, and domestic policy developments. Based on these factors, the evolution of return spillovers can be divided into four phases.
Figure 2.
Total Dynamic Return Spillover Index.
The first stage is a policy-driven stabilization period from December 2016 to the end of 2019. During this period, the total connectedness index (TCI) remained relatively stable at around 60–62%, with a temporary decline in late 2017 followed by recovery. The return spillover pattern was mainly influenced by domestic energy supply-side reforms. As coal capacity reduction progressed, return shocks from traditional energy equity markets gradually transmitted to electricity and downstream sectors [44]. Since the “dual carbon” targets had not yet been introduced, the role of renewable energy in the return spillover network remained limited [45]. In March 2019, the TCI reached a local peak of 62.1%, coinciding with a recovery of crude oil price after the OPEC+ production cuts, a period characterized by stronger return spillover linkages between the WOGI and WCI markets.
The second stage is the external shock and transition adjustment period, spanning from early 2020 to the end of 2021. During this period, the TCI experienced several short-term increases and reached a peak above 64.5% in March 2020, coinciding with the outbreak of the COVID-19 pandemic, the collapse of global energy demand, and the international negative oil price event. These extreme market conditions align temporally with heightened cross-market return transmission by altering market expectations [46,47]. Following the announcement of China’s “dual carbon” targets in 2020, the TCI gradually returned to around 60% in 2021, indicating that the energy system maintained considerable resilience during the early stage of low-carbon transition.
The third stage covers the period from early 2022 to the first half of 2024 and is characterized by intensified geopolitical risks and accelerated energy transition. The TCI fluctuated within a wider range of 57–65% and reached a historical high of 64.91% in March 2022 amid the Russia–Ukraine conflict, a period characterized by global energy supply disruptions and elevated oil and gas market volatility. Subsequent events, including the crude oil price ceiling policy and the Red Sea crisis, maintained external uncertainty. Meanwhile, rapid renewable energy expansion also created new challenges related to grid integration and consumption, increasing return spillover interactions between new energy and traditional sectors [48,49].
The fourth stage represents a multi-risk resonance period from the second half of 2024 to October 2025. The TCI increased from approximately 57% to nearly 60% as multiple uncertainties accumulated. Geopolitical tensions, adjustments in energy storage and renewable energy policies, and extreme weather events jointly intensified supply–demand imbalances and market fluctuations. As the energy transition deepens, the interaction between external shocks and structural transformation has increased the sensitivity of the energy system, resulting in stronger return spillover resonance among WOGI, WCI, WEPI, and WESI markets [50].
3.4.2. Dynamic Net Return Spillover Index for Individual Energy Equity Markets
Figure 3a,b respectively depict the dynamic net return spillover index of new energy power generation, energy storage market and other energy equity markets. From the perspective of time-varying characteristics, the new energy generation index continued to perform as a net exporter of return spillovers during the observation period. This conclusion is consistent with the static analysis results, highlighting the leading role of green power as the core driving force of energy transformation. In sharp contrast, the energy storage index is always at the net receiver of return spillovers during crisis episodes, and the net return spillover index (net) fluctuates between −14.22 and −12.75. This confirms that the return spillover transmission logic of the industrial chain, that is, the energy storage market, as a supporting link of new energy consumption, highly depends on the expansion speed of upstream wind and solar installation and the pressure of grid connection, highlighting the position of the energy storage market in the return spillover transmission among energy equity markets. It is worth noting that since the “double carbon” target was put forward in 2020, the return spillover output capacity of new energy power generation has been maintained at a relatively high level, reflecting that the capital boom promoted by the policy has enhanced the return spillover effect of the whole energy system.
Figure 3.
Dynamic net return spillover indices for the renewable power generation market and the energy storage market. (a) and (b) correspond to the renewable power generation market (WNEPI) and the energy storage market (WESI), respectively.
Figure 4a,b show the dynamic net return spillover indices of the coal and electricity markets with other energy equity markets. The coal index mainly acts as the net receiver of return spillovers during the sample period, indicating that the coal market has a strong passive absorption characteristic in the face of macro-control. The electricity index, on the other hand, is a stable net exporter of return spillovers, reflecting that the electricity market is affected by both upstream cost fluctuation and downstream consumption structure transformation in the deep-water period of energy transformation, and its price fluctuation will be transmitted rapidly to the whole system. Data monitoring shows that the return spillover output capacity of the coal index has dropped significantly in early 2024. This is closely related to the return of coal prices to a reasonable range and the stabilization of market expectations under the domestic policy of increasing production and ensuring supply. At this time, the return spillover effect of the power index is still stable, which confirms that the power system, as the hub of energy transformation, is increasingly playing a central role in the return spillover network.
Figure 4.
Dynamic net return spillover indices for the coal market and the electricity market. (a) and (b) correspond to the electricity market (WEPI) and coal market (WCI), respectively.
Figure 5a,b show the dynamic net return spillover indices between the Wind Oil and Gas Index (WOGI), Wind Gas Index (WGI) markets and other energy equity markets. During the observation period, the WOGI showed a weak net receiving characteristic of return spillovers, and the net value remained between −3.0% and −1.9% throughout the year. Its fluctuation was very sensitive to the change in international crude oil geopolitical premium. In contrast, the WGI shows a stronger ability to transmit external return spillovers. During the conflict between Russia and Ukraine in 2022 and the Red Sea crisis in 2023, its net return spillover index (net) rose several times, reflecting the significant disturbance of the reconstruction of the global energy supply chain to the domestic WGI market. In addition, the return spillover between the WGI and the WOGI is synergistic. When the international oil price experiences sharp fluctuations, the trend of the two tends to be synchronized, revealing the deep return spillover linkage within the fossil energy industry under the linkage of the industrial chain and the energy substitution mechanism.
Figure 5.
Dynamic net return spillover indices for the oil and gas market and the natural gas market. (a) and (b) correspond to the oil and gas market (WOGI) and natural gas market (WGI), respectively.
3.4.3. Paired Net Directional Dynamic Return Spillover Index
Figure 6 shows the evolution of pairwise net directional return spillovers among China’s energy equity markets over the sample period. The bilateral return spillover links between different markets show several clear features of the return spillover network.
Figure 6.
Paired Dynamic Return Spillover Index.
First, traditional fossil energy equity markets remain an important source of return spillovers for the renewable power generation market and other transition-related markets. For most of the sample period, pairwise net spillovers from the coal market and the natural gas market to the renewable power generation market exceeded those in the opposite direction, particularly during periods of external turbulence in global energy equity markets. The increase in pairwise net return spillovers during the global energy crisis in 2022 indicates that fluctuations in traditional fossil energy prices continued to influence volatility in the renewable power generation market. Although China’s energy system is gradually shifting toward the renewable power generation–electricity–energy storage chain, traditional fossil energy equity markets still play an important role in the transmission of system-wide return spillovers.
The relationship between upstream power generation and downstream supporting markets is also asymmetric. The renewable power generation market and the energy storage market keep strong spillover links over the whole sample period. Although return transmission exists in both directions, spillovers from the renewable power generation market to the energy storage market are stronger in most periods. This result shows that changes in renewable power generation are still an important source of return spillovers for the energy storage market. It also reflects the strong dependence of the energy storage market on renewable power expansion and changes in grid integration conditions.
The traditional fossil energy equity market also remained closely linked. Pairwise net return spillovers between the coal market and the oil and natural gas market, as well as between the oil and natural gas market and the natural gas market, change substantially over time. During 2022–2023, geopolitical conflicts increase global energy demand–supply imbalance and strengthen the co-movement of fossil fuel prices. This leads to several clear increases in bilateral return spillovers within the fossil energy system. During 2024–2025, pairwise net spillovers between the coal market and the oil and natural gas market become smaller. This may be related to domestic policies that aim to increase production, ensure supply, and improve energy security. Even so, fossil fuel prices continued to play an important role in marginal pricing and cost transmission across the energy system, and the traditional fossil energy equity market remained major channels for return spillovers.
Taken together, the pairwise spillover results show that China’s energy equity markets have developed a multi-layered return spillover network. The traditional fossil energy equity market continued to provide an important source of system-wide return spillovers, while the electricity market and the energy storage market served as key transmission and adjustment nodes. The renewable power generation market has become more closely connected with the rest of the energy system through cross-market return spillovers. Although renewable energy has expanded rapidly in recent years, its market pricing and volatility remain closely linked to the traditional fossil energy equity market. This indicates that the traditional fossil energy equity market is likely to remain the main source of return spillovers in the short term, while renewable power generation and related transition sectors will continue to respond strongly to external shocks.
3.4.4. Network Diagram of Return Spillovers Across Energy Equity Markets Under the Impact of Major Events
Figure 7 illustrates the return spillover network among energy equity markets before and after the 2020 international oil price collapse. On April 20, 2020, the negative oil price event coincided with a sharp shock in global energy equity markets, which was accompanied by rapid transmission to China’s energy sectors. Following this shock, the WOGI market shifted from a net return receiver to a net transmitter, with its spillovers to the WCI and WEPI markets turning from negative to positive. This indicates that extreme oil price movements can rapidly generate return spillovers through energy supply and demand linkages. However, by mid-May, the net return spillover intensity of WOGI declined significantly, suggesting that the association was mainly short-lived. Meanwhile, return spillover inflows to the WGI market increased, indicating that the traditional fossil energy equity market absorbed part of the external shock. Overall, the oil market acted as the primary source of short-term return spillovers during the crisis, while the long-term return spillover structure among energy equity markets remained relatively stable.
Figure 7.
Network of return spillovers across energy equity markets before and after the collapse of international crude oil prices.
Figure 8 presents the return spillover network before and after the thermal coal supply crisis in September 2021. Prior to the crisis, the coal market mainly acted as a net receiver of return spillovers. Following the outbreak on 24 September 2021, coal-related return shocks rapidly spread to electricity and energy storage markets, turning the coal market into a net transmitter of return spillovers. After the implementation of energy security policies, overall market volatility gradually declined, and return spillovers from coal to oil, gas, and electricity markets weakened. Meanwhile, the electricity market shifted from a net transmitter of return spillovers to a net receiver, reflecting the transmission of coal price shocks through the power generation chain. The increased return spillovers absorbed by the storage market further highlights its role in balancing short-term supply–demand fluctuations during energy system adjustments.
Figure 8.
Network of energy equity markets’ return spillovers before and after coal shortages, rising coal prices, and policy interventions.
Figure 9 presents the return spillover network surrounding the outbreak of the Russia–Ukraine conflict. Prior to the conflict, return spillovers among China’s energy equity markets remained relatively stable. Following the escalation of geopolitical tensions, supply chain disruption expectations were temporally associated with heightened return spillovers from oil, gas, and natural gas markets to other energy sectors, highlighting the rapid transmission of external geopolitical shocks. In the following weeks, oil and gas markets maintained positive net return spillovers to coal and renewable energy equity markets. Meanwhile, the renewable power generation market shifted from a weak net transmitter of return spillovers to a net receiver, suggesting that soaring fossil fuel prices increased the influence of the traditional energy equity market on emerging energy sectors. The energy storage market also absorbed significantly more return spillovers and reached its highest net receiving level during this period. These findings emphasize the importance of enhancing energy storage capacity and cross-market risk management to improve resilience against geopolitical shocks.
Figure 9.
Network of return spillovers across energy equity markets before and after the outbreak of the Russia–Ukraine conflict.
4. The Impact of the Energy Demand–Supply Risk Index on Return Spillovers Across Energy Equity Markets
4.1. Measuring the Level of Energy Demand–Supply Risk
The textual dataset used in this study consists of news reports published in three major Chinese official newspapers, the People’s Daily, the Economic Daily, and the Guangming Daily, covering the period from December 2016 to July 2025. These newspapers provide authoritative policy information and wide coverage of energy-related topics. They are therefore suitable for tracking changes in China’s energy security conditions and energy demand–supply dynamics.
Before model construction, the textual data were carefully preprocessed. The complete corpus was first segmented using the jieba word-segmentation toolkit implemented in Python (3.8.10). To improve the identification of newly emerging energy-related terms after 2024, including intelligent computing centers, green certificate trading, and computing-power load, a domain-specific dictionary was manually developed and updated throughout the data-processing stage. News reports that were extremely short or unrelated to energy economics were then removed. After preprocessing, the final corpus contained approximately 616,000 news articles and more than 210 million word-frequency observations.
Following Al-Haschimi et al. [51], this study uses a machine learning approach to extract semantic information rather than relying only on word frequencies. A set of 40 seed words was first selected to represent five dimensions of energy demand–supply risk, including supply-side risk, price volatility, computing-power demand, low-carbon transition constraints, and system emergency resilience. Representative terms include shortage, price spikes, computing power, decarbonization, and peak shaving. Because of the large size of the corpus, an iterator-based streaming procedure was adopted so that model training could be completed without loading the entire corpus into memory. A Word2Vec model was trained on the full tokenized corpus using the Skip-gram algorithm, with a vector dimension of 300, a context window of 7, a minimum word count of 5, four workers, and five training epochs. Cosine similarity between word vectors was subsequently calculated to identify the 100 most closely related terms within each risk dimension. In the computing-power dimension, the model identified terms such as intelligent computing workloads, liquid cooling technology, and IDC (Internet Data Center) energy efficiency, reflecting the characteristics of China’s energy development during 2024–2025.
The specific initial keyword dictionary and extended vocabulary are shown in Appendix B.
Based on the framework proposed by Baker et al. [52] and the text-analysis method developed by Dang et al. [53], the monthly Energy Demand–Supply Risk Index (EDRI) is constructed using the word-density weighting approach proposed by Xu et al. [54]:
where EDRIt denotes the Energy Demand–Supply Risk Index in month t; K is the number of risk dimensions; αk represents the weight assigned to the k-th risk dimension; Mt denotes the number of news articles published in month t; fi,d is the frequency of feature word i in news articles d; sik denotes the semantic similarity between feature word i and the seed words of the k-th risk dimension, computed using the Word2Vec model; and Lengthd is the total number of words in news article d. The Energy Demand–Supply Risk Index is constructed by aggregating the weighted semantic risk words across different risk dimensions and then applying text-length normalization and monthly averaging.
Figure 10 shows the evolution of the Energy Demand–Supply Risk Index (EDRI). The index captures several major episodes of stress in China’s energy system, including the thermal coal supply shortage in 2021, the surge in international energy prices after the outbreak of the Russia–Ukraine conflict in 2022, and the growing policy focus on the energy implications of computing-power development after 2024. The EDRI also moves closely with the international crude oil volatility index and domestic energy price indicators, indicating that it responds effectively to changes in energy-related risks. The EDRI constructed from large-scale news text reflects not only demand–supply pressures arising from market conditions but also policy signals and transition-related risks contained in China’s energy news. Unlike widely used international risk indices, the EDRI is developed using China’s policy and media environment and is therefore better able to capture changes in policy orientation, energy transition, and official risk narratives. As a result, it provides an appropriate textual measure for examining return spillovers across China’s energy equity markets.
Figure 10.
Time series of energy demand–supply risk levels.
4.2. The GARCH-MIDAS Model
The connectedness index estimated by the TVP-VAR-DY model is based on daily observations, whereas the EDRI is constructed at a monthly frequency. Although the daily net return spillover indices are available through November 2025, because the monthly EDRI is only available through July 2025, the GARCH-MIDAS estimation window is determined by EDRI availability, and all specifications end in July 2025. Daily observations from August to November 2025 are therefore excluded from the estimation. The specific sample alignment rules and effective estimation periods under different values of K are provided in Appendix C. Direct aggregation of daily connectedness measures may smooth short-term market dynamics and weaken the information contained in high-frequency fluctuations. To accommodate this mixed-frequency feature, Ghysels et al. [55] proposed the MIDAS framework, which was further extended by Engle et al. [56] through the GARCH-MIDAS model. This approach decomposes volatility into short- and long-term components, allowing high-frequency information to capture short-run movements and low-frequency variables to explain persistent volatility changes [57,58].
Following Engle et al. [56], this study introduces lagged EDRI into the long-run component of the GARCH-MIDAS model, while the daily net return spillover index derived from the TVP-VAR-DY framework is modeled as the dependent variable. This mixed-frequency specification allows the model to examine whether energy demand–supply risks are persistently associated with the long-run conditional variance of return spillover dynamics across China’s energy equity markets [57]. EDRI is treated as a predetermined low-frequency covariate rather than a strictly exogenous determinant. Only lagged EDRI observations enter the long-run component, so the estimated relationship is interpreted as a conditional predictive association rather than a structural causal effect.
The conditional variance of the net return spillover index is therefore decomposed into two interconnected components:
The short-run component (gi,t) captures high-frequency fluctuations in the net return spillover index arising from market sentiment and unexpected news. A mean-reverting GARCH (1,1) process is as follows:
In particular, αi and βi satisfy the stationarity conditions αi + βi < 1.
The long-run component (τi,t) represents the persistent variation in the conditional variance of the net return spillover index associated with energy demand–supply risks. To capture the nonlinear effect of risk transmission, the logarithm of this component is modeled using a MIDAS weighting function based on the low-frequency explanatory variable:
In this specification, mi denotes the intercept in the long-run variance equation, and θi is the key parameter to be estimated. It captures the direction and magnitude of the effect of energy demand–supply risk on the long-run conditional variance of the net return spillover index. Specifically, a positive and significant θi indicates that higher EDRI increases the long-run volatility of spillover dynamics.
The influence of macroeconomic risk on energy equity markets is generally gradual rather than immediate. The contribution of past energy demand–supply risk information is allowed to vary with the lag length. Following Ghysels et al. [55] and Engle et al. [56], a parsimonious one-parameter Beta weighting function φk is employed to characterize the persistence pattern of lagged risk information:
During model estimation, the weighting parameter w is estimated jointly with other parameters by maximum likelihood estimation. The parameter w controls the decay pattern of lagged EDRI information, allowing the model to capture different persistence characteristics of energy demand–supply risks across energy equity markets. To check the robustness of the results, the model is estimated using three lag specifications (6, 12, and 24 months).
The parameters of the GARCH-MIDAS-EDRI model are estimated by maximum likelihood estimation (MLE). Let Θ = {μi, αi, βi, mi, θi, w} denote the parameter vector to be estimated for energy equity market i. Assuming that the standardized residuals of the high-frequency component are independently and identically distributed with a standard normal distribution, the corresponding log-likelihood L(Θ) function is
where T denotes the total number of observations, and Ri,t represents the daily net return spillover index of energy equity market i at time t. The conditional variance is decomposed into a combination of high-frequency and low-frequency components as follows:
The GARCH-MIDAS model evaluates how EDRI affects the volatility dynamics of net return spillover indices.
4.3. Empirical Results
The GARCH-MIDAS model is used in this study with alternative low-frequency lag structures (K = 6, 12, and 24). It is used to examine the effect of the monthly Energy Demand–Supply Risk Index (EDRI) on the conditional variance dynamics of net return spillover indices across six energy equity markets. The results in Table 5, Table 6 and Table 7 show that the coefficients of the ARCH term (α) and the GARCH term (β) are positive and significant in all specifications, and they satisfy the stationarity condition α + β < 1. In most cases, the estimated value of β is close to 1, and α + β is also close to 1. This indicates strong volatility clustering and persistence in the conditional variance of the net return spillover index across China’s energy equity markets. The significant GARCH parameters suggest that shocks to the volatility of net return spillover indices are persistent over time, implying that fluctuations in return spillover dynamics do not immediately disappear after market disturbances. These findings are consistent with the volatility persistence commonly observed in high-frequency financial time series.
Table 5.
Parameter estimation results for the GARCH-MIDAS-EDRI model (K = 6).
Table 6.
Parameter estimation results for the GARCH-MIDAS-EDRI model (K = 12).
Table 7.
Parameter estimation results for the GARCH-MIDAS-EDRI model (K = 24).
The Impact of the Energy Demand–Supply Risk Index (EDRI) on the Conditional Variance of Net Return Spillover Indices
Table 5, Table 6 and Table 7 report results of the GARCH-MIDAS-EDRI model under different lag settings. The effects of EDRI on the conditional variance of net return spillover indices differ across markets and lag structures. The heterogeneous responses observed across energy equity markets can largely be attributed to differences in market structure, pricing mechanisms, and the ongoing low-carbon transition. Aggregating the demand-side and supply-side risks into a single index will lead to loss of risk source information [59]. Therefore, the coefficient of EDRI is only used to explain the net correlation between demand-side and supply-side risks, rather than the independent causal effect of any type of shock.
First, the Wind Oil and Gas Index (WOGI) market has the most rapid and stable response to fluctuations in energy supply and demand. Under different lag settings, the corresponding coefficients of the WOGI market are significantly positive, indicating that increases in EDRI significantly raise the long-run conditional variance of the net return spillover index for the WOGI market. This is mainly due to the high degree of marketization of the WOGI market, which is closely linked with international energy prices and is vulnerable to geopolitics, changes in international supply and demand and global capital flows, so external energy risks can quickly correspond to amplified uncertainty in its return spillover dynamics. Secondly, the fluctuation response of the Wind Coal Index (WCI) market shows a certain lag. When K=6, the corresponding coefficient of the WCI market is not significant, but gradually increases when K=12 and K=24. This shows that the response of the WCI market to the impact of external fluctuations is relatively slow. The reason is that the WCI market is affected by factors such as long-term agreement pricing, supply guarantee policy and inventory adjustment. Short-term price fluctuations are restrained to a certain extent. Fluctuations usually need to be gradually transmitted to the market after supply and demand adjustment. Therefore, the WCI market plays a buffer role in the energy system.
Second, the Wind New Energy Power Generation Index (WNEPI), Wind Electricity Power Index (WEPI) and Wind Energy Storage Index (WESI) markets show more obvious differentiation characteristics. The WESI market is significantly affected by the Energy Demand–Supply Risk Index (EDRI) in the short term, but with the extension of the lag period, the impact is weakened. The WNEPI and WEPI market show no significant or negative impact in some medium- and long-term lag stages. This shows that the fluctuation in the new energy-related market is not only affected by the change in traditional energy supply, but also closely related to policy adjustment, power system coordination ability and market expectations. With the continuous expansion of renewable energy capacity, the volatility dynamics of the NET return spillover indices for WNEPI, WEPI, and WESI have become increasingly sensitive to external energy risks, reflecting the growing uncertainty associated with the transition toward a low-carbon energy system.
Third, the heterogeneous response of different energy equity markets to the Energy Demand–Supply Risk Index (EDRI) reflects that the sources of fluctuations in China’s energy equity markets are changing. Traditional fossil energy is still an important source of spillover volatility, while the volatility dynamics of renewable energy and energy storage markets become increasingly sensitive during the energy transition. This shows that the fluctuation in China’s energy equity markets not only comes from the impact of traditional energy supply, but is also increasingly affected by factors such as new energy consumption, power regulation and industrial chain synergy efficiency.
To sum up, the reasons for the above differences may be related to the marketization degree and fluctuation transmission mechanism of different energy equity markets. The WOGI market is closely linked with the international energy equity markets, and the price is sensitive to geopolitics, changes in international supply and demand and global capital flows, so external shocks can rapidly amplify the short-run volatility of NET return spillover dynamics. In contrast, as an important basis for China’s energy supply, the price formation of WCI is affected by factors such as the long-term cooperation mechanism, supply guarantee policy and inventory regulation. Market fluctuations have certain buffering characteristics, so external fluctuations usually take longer to gradually transmit to the market level through supply and demand adjustment.
5. Conclusions
This paper explores the evolution of risk transmission across China’s energy equity markets, including oil, natural gas, coal, electricity, renewable energy generation, and energy storage, over the period 2016–2025. The time-varying connectedness among these markets is examined using the TVP-VAR-DY framework. Meanwhile, an Energy Demand–Supply Risk Index (EDRI) is constructed by applying text mining techniques to large-scale news data from the People’s Daily, Guangming Daily, and Economic Daily. The GARCH-MIDAS model is further introduced to examine whether this risk measure is related to the long-run conditional variance of the connectedness measures. The main conclusions are summarized as follows.
(1) China’s energy equity markets exhibit significant time-varying connectedness and heterogeneous transmission roles across sectors. Within the return spillover network, the Wind New Energy Power Generation Index (WNEPI) and the Wind Electricity Power Index (WEPI) mainly serve as net transmitters of return spillover, whereas traditional energy equity markets, represented by the Wind Oil and Gas Index (WOGI) and the Wind Coal Index (WCI), primarily act as net receivers. During the sample period, the total connectedness index experienced several fluctuations coinciding with major external disturbances, including the Russia–Ukraine conflict, extreme weather events, and macroeconomic uncertainty.
(2) The impact of the Energy Demand–Supply Risk Index (EDRI) on return spillovers between energy equity markets is characterized by market heterogeneity and lag. The response of the WOGI market is rapid and robust, showing an immediate positive driving effect. In the GARCH-MIDAS estimation, where the net spillover measure is the dependent variable, a positive θ indicates that EDRI is associated with a higher long-run conditional variance of that spillover measure rather than its level. The association of the Wind Energy Storage Index (WESI) market is concentrated in the short and medium term. The WCI market has lagged, and its impact has gradually appeared and lasted for a long time. In contrast, the WEPI market shows high resilience to external supply and demand shocks.
(3) China’s energy equity markets present a dynamic transition between the net transmitters and net receivers. Traditional fossil energy remains an important source of system-wide fluctuations in certain periods and pairwise channels, although it appears as a net receiver in the full-sample average net results. As the energy transition advances, the new energy–power–energy storage chain is becoming more closely connected and increasingly important for system stability. Meanwhile, the WCI market plays a stabilizing role in absorbing longer-term fluctuations, reflecting its supply resilience and cyclical buffering capacity.
Despite these contributions, several limitations should be acknowledged. The EDRI is constructed from reports published in major Chinese official newspapers and therefore captures national policy signals and macroeconomic information more effectively than local or firm-level developments. Moreover, because the index is available at a monthly frequency, it cannot fully reflect the high-frequency fluctuations observed in financial markets, even though the GARCH-MIDAS framework partially mitigates this mismatch by combining variables observed at different frequencies. Furthermore, while our current results are robust across various lag structures, additional robustness checks involving alternative EDRI constructions, alternative energy-market proxies, and crisis-exclusion periods (e.g., excluding the COVID-19 pandemic and the Russia–Ukraine conflict) could provide useful directions for future research.
Future work may expand this analysis by constructing event-tailored textual datasets for major energy-related shocks. Integrating official documents released throughout the lifecycle of notable events with modern text-mining methods allows researchers to trace the dynamics of energy demand–supply risk more granularly and shed further light on the transmission of event-linked information across energy equity markets. Such an approach would also offer further evidence on the mechanisms through which major external shocks shape return spillovers during China’s ongoing energy transition.
Author Contributions
L.W. was responsible for model construction and derivation, as well as revising and polishing the full paper. J.Z. was responsible for data collection, data cleaning, and drafted the initial manuscript. T.C., as the corresponding author, led the formulation of key hypotheses and the design of model algorithms, provided research funding and project support, supervised and guided the research throughout, and critically reviewed and revised the logical framework and final version of the paper. T.X. performed the statistical analysis and literature review, and was also responsible for the formatting and typesetting of the manuscript. All authors have read and agreed to the published version of the manuscript.
Funding
This research is supported by Major Projects of the National Social Science Foundation (22&ZD122), Youth Project of the National Social Science Foundation (25CJY108), Youth Project of Jiangsu Pro-vincial Social Science Foundation (25GLC003) and General Project of Basic Science (Natural Science) Research in Higher Education Institutions in Jiangsu Province (25KJB630008).
Data Availability Statement
The original contributions presented in this study are included in the article. Further inquiries can be directed to the corresponding author.
Conflicts of Interest
The authors declare no conflicts of interest.
Appendix A. Statistical Inference for Connectedness Measures
This appendix reports the full-sample Diebold–Yilmaz connectedness table with 95% percentile confidence intervals from the residual-based multivariate moving block bootstrap. We use 500 bootstrap replications and a block length of 20. Statistical significance for net spillover (NET) is assessed by checking whether the 95% bootstrap confidence interval excludes zero.
Table A1.
Full-sample static connectedness measures with 95% percentile bootstrap confidence intervals.
Appendix B. Dictionaries for EDRI Construction
This appendix provides the core information required to replicate the Energy Demand–Supply Risk Index (EDRI). The corpus consists of news articles from the People’s Daily, Guangming Daily, and Economic Daily, covering December 2016 to July 2025. After cleaning, approximately 610,000 articles are retained. Initial Seed Terms and Word2Vec Expanded Terms are presented in Table A2.
Table A2.
This table shows the initial seed terms and Word2Vec expanded vocabulary for constructing the Energy Demand–Supply Risk Index (EDRI).
Appendix C. Sample Harmonization and Data Alignment Procedure
To make the temporal coverage of the data and the frequency mismatch between the series fully transparent, this appendix outlines the sample alignment procedure for the high-frequency financial measures and the low-frequency news-based index. The daily net return spillover indices from the TVP-VAR-DY framework are available through November 2025. The monthly Energy Demand–Supply Risk Index (EDRI), constructed from Chinese news corpora, ends in July 2025. Because the hybrid GARCH-MIDAS models require the low-frequency EDRI series, the empirical estimation window is determined by EDRI availability and therefore ends in July 2025 in all specifications.
The MIDAS weighting polynomials are estimated under alternative low-frequency lag structures, with K = 6, 12, and 24 months. Each specification requires K prior monthly EDRI observations to initialize the weighting matrix, so the effective start date of the daily sample varies with K. For K = 6, 12, and 24, the sample begins 6, 12, and 24 months after the first EDRI observation, respectively; in each case, it runs through July 2025.
References
- Overland, I.; Bazilian, M.D.; Uulu, T.I.; Vakulchuk, R.; Westphal, K. The GeGaLo index: Geopolitical gains and losses after energy transition. Energy Strategy Rev. 2019, 26, 100406. [Google Scholar] [CrossRef] [Scilit]
- Novikau, A. Energy Security in Security Studies: A Systematic Review of Twenty Years of Literature. Cent. Eur. J. Int. Secur. Stud. 2022, 17, 34–64. [Google Scholar] [CrossRef] [Scilit]
- Ewald, C.O.; Huang, C.; Ren, Y. On the Effects of Physical Climate Risks on the Chinese Energy Sector. J. Risk Financ. Manag. 2024, 17, 458. [Google Scholar] [CrossRef] [Scilit]
- Jin, X.; Liu, Y.; Yu, J.; Chen, N. Extreme risk spillovers in international energy markets: New insights from multilayer networks in the frequency domain. Energy Econ. 2024, 139, 107908. [Google Scholar] [CrossRef] [Scilit]
- Lin, B.; Zhang, Z. Anchoring security in uncertainty: The dynamic responses of China’s energy imports to geopolitical risk shocks. Energy 2025, 335, 137996. [Google Scholar] [CrossRef] [Scilit]
- Liu, Z.; Wang, Y.; Yuan, X.; Ding, Z.; Ji, Q. Geopolitical risk and vulnerability of energy markets. Energy Econ. 2025, 141, 108055. [Google Scholar] [CrossRef] [Scilit]
- Peng, Y.; Liao, H.; Wang, F.; Ye, H. Optimal path of China’s economic structure and energy demand to carbon neutrality. Energy Econ. 2025, 141, 108046. [Google Scholar] [CrossRef] [Scilit]
- Apergis, N.; Fahmy, H. Geopolitical risk and energy price crash risk. Energy Econ. 2024, 140, 107975. [Google Scholar] [CrossRef] [Scilit]
- Xu, T.; Wang, L.; Chen, T.; Zheng, X. China’s Energy Risk Spillover Networks Under Major Events and External Uncertainty Shocks: An Analysis Based on LASSO-VAR-DY and TVP-SV-VAR Models. Systems 2025, 13, 1037. [Google Scholar] [CrossRef] [Scilit]
- Chen, S.; Kuang, H.; Meng, B. The dependence structures between geopolitical risks and energy prices: New evidence from regional heterogeneity and quantile-on-quantile perspective. Energy 2024, 310, 133325. [Google Scholar] [CrossRef] [Scilit]
- Padhan, H.; Kocoglu, M.; Tiwari, A.K.; Haouas, I. Economic activities, dry bulk freight, and economic policy uncertainties as drivers of oil prices: A tail-behaviour time-varying causality perspective. Energy Econ. 2024, 138, 107845. [Google Scholar] [CrossRef] [Scilit]
- Bento, N.; Grubler, A.; Boza-Kiss, B.; De Stercke, S.; Krey, V.; McCollum, D.L.; Zimm, C.; Alves, T. Leverage demand-side policies for energy security. Science 2024, 383, 946–949. [Google Scholar] [CrossRef] [Scilit] [PubMed]
- Ye, Z.; Elahi, E.; Peng, B.; Wan, A. From geopolitical risks to sustainable energy security: A tripartite game approach for resilient cross-border infrastructure. J. Clean. Prod. 2026, 555, 148108. [Google Scholar] [CrossRef] [Scilit]
- Zhu, Z.; Hunjra, A.I.; Alharbi, S.S.; Zhao, S. Global energy transition under geopolitical risks: An empirical investigation. Energy Econ. 2025, 145, 108495. [Google Scholar] [CrossRef] [Scilit]
- Ji, Y.; Hao, X.; Pang, Z. Spread of supply risks in the trade network of critical metals for energy transition: A case study of manganese ore. Energy Econ. 2026, 158, 109337. [Google Scholar] [CrossRef] [Scilit]
- Kou, H.; Chai, J.; Zhang, Z.; Wang, S. Does the Energy Transition Affect Return Spillovers Between Multiple Energy Sources and Chinese Industry Indices? Network Evidence of Asymmetric Dynamic Spillovers. Energy 2025, 320, 135112. [Google Scholar] [CrossRef] [Scilit]
- Zheng, J.; Wen, B.; Jiang, Y.; Wang, X.; Shen, Y. Risk spillovers across geopolitical risk and global financial markets. Energy Econ. 2023, 127, 107051. [Google Scholar] [CrossRef] [Scilit]
- Zhao, N.; He, P. The Response of Oil Shocks to Economic Policy Uncertainty: Evidence from a Cross-Quantilogram Approach. Energy Res. Lett. 2024, 6, 123843. [Google Scholar] [CrossRef] [Scilit]
- Xu, Z.; Gan, S.; Hua, X.; Xiong, Y. Can the sentiment of the official media predict the return volatility of the Chinese crude oil futures? Energy Econ. 2024, 140, 107967. [Google Scholar] [CrossRef] [Scilit]
- Bui, T.-D.; Ha, H.M.; Tran, T.P.T.; Lim, M.K.; Tseng, M.-L. An energy security strategic causality model using text mining for world region comparisons. Energy Strategy Rev. 2024, 52, 101345. [Google Scholar] [CrossRef] [Scilit]
- Zhou, S.; Yuan, D.; Zhang, F. Multiscale systemic risk spillovers in Chinese energy market: Evidence from a tail-event driven network analysis. Energy Econ. 2025, 142, 108151. [Google Scholar] [CrossRef] [Scilit]
- Chen, L.; He, L.; Liu, R.; Fu, Y. Mapping risk transmission in China’s energy industry chain: Insights derived from the industry chain structure. Econ. Anal. Policy 2025, 87, 971–996. [Google Scholar] [CrossRef] [Scilit]
- Dumitrescu, R.; Silvente, R.; Tankov, P. Price impact and long-term profitability of energy storage. SIAM J. Financ. Math. 2026, 17, 281–322. [Google Scholar] [CrossRef] [Scilit]
- Fasanya, I.O.; Mubaiwa, D.T. Dynamics of extreme spillovers between clean energy stocks and fossil fuels: The role of climate policy uncertainty and geopolitical risk. Energy 2025, 335, 138267. [Google Scholar] [CrossRef] [Scilit]
- Elsayed, A.H.; Hoque, M.E.; Billah, M. Multilayer connectedness across geopolitical risks, clean, and dirty energy markets: The role of global uncertainty factors and climate surprise. Energy Econ. 2025, 144, 108342. [Google Scholar] [CrossRef] [Scilit]
- Palomba, G.; Tedeschi, M. Commodity price dynamics in the era of energy transition: Exploring the substitutability of clean energy. Econ. Anal. Policy 2025, 88, 214–236. [Google Scholar] [CrossRef] [Scilit]
- Ji, Q.; Zhang, D.; Geng, J.-B. Information linkage, dynamic spillovers in prices and volatility between the carbon and energy markets. J. Clean. Prod. 2018, 198, 972–978. [Google Scholar] [CrossRef] [Scilit]
- Wang, L.; Xu, T.; Chen, T. Optimal Strategies in Green Supply Chains When Considering Consumers’ Green Preferences and Government Subsidies. Mathematics 2025, 13, 2209. [Google Scholar] [CrossRef] [Scilit]
- Goldstein, I.; Yang, L. Commodity financialization and information transmission. J. Finance 2022, 77, 2613–2667. [Google Scholar] [CrossRef] [Scilit]
- Kočenda, E.; Albrecht, P.; Pastorek, D. Geopolitical risk and extreme spillovers among oil-based energy commodities. Energy Econ. 2025, 152, 108977. [Google Scholar] [CrossRef] [Scilit]
- Jiang, W.; Dong, L.; Liu, X.; Zou, L. Volatility spillovers among economic policy uncertainty, energy and carbon markets—The quantile time-frequency perspective. Energy 2024, 307, 132683. [Google Scholar] [CrossRef] [Scilit]
- Mensi, W.; Gök, R.; Gemici, E.; Kang, S.H. Tail risk contagion and connectedness between crude oil, natural gas, heating oil, precious metals, and international stock markets. Int. Econ. 2025, 181, 100570. [Google Scholar] [CrossRef] [Scilit]
- Charteris, A.; Obojska, L.; Szczygielski, J.J.; Brzeszczyński, J. Energy market connectedness: A tale of two crises. Energy Econ. 2026, 153, 108787. [Google Scholar] [CrossRef] [Scilit]
- Ma, T.; Li, G.; Zhang, H. Stock return predictability using economic narrative: Evidence from energy sectors. J. Commod. Mark. 2024, 35, 100418. [Google Scholar] [CrossRef] [Scilit]
- Nguyen, B.N. A sentiment-based approach to predict energy price volatility using distilRoBERTa and GARCH models. Energy Econ. 2025, 149, 108646. [Google Scholar] [CrossRef] [Scilit]
- Yan, W.L.; Cheung, A.W.K. Quantile connectedness among climate policy uncertainty, news sentiment, oil and renewables in China. Res. Int. Bus. Finance 2025, 76, 102814. [Google Scholar] [CrossRef] [Scilit]
- Siddiki, J.; Singh, P. The cost of uncertainty: Analysing the influence of coal price changes, the Russia-Ukraine war and geopolitical risk on risk premiums in the Indian electricity spot market. Energy Econ. 2025, 141, 108129. [Google Scholar] [CrossRef] [Scilit]
- Ye, S.Q.; Zhang, H.Y.; Zhou, M.; Zheng, T.G. Assessing energy sector resilience to adverse shocks: A scenario-based QVAR approach. Energy Econ. 2025, 149, 108733. [Google Scholar] [CrossRef] [Scilit]
- Bolton, P.; Kacperczyk, M. Global pricing of carbon-transition risk. J. Finance 2023, 78, 3677–3754. [Google Scholar] [CrossRef] [Scilit]
- Yu, Q.; Rahman, R.B.; Wu, Y. Risk spillovers between China’s pilot carbon markets and energy markets: Evidence from higher-order moments. Environ. Dev. Sustain. 2025. [Google Scholar] [CrossRef] [Scilit]
- Dawn, S.; Manideep, S.; Rekha, S.S.; Rao, C.R.; Rao, K.D.; Al Mansur, A.; Ustun, T.S. Advancing renewable energy integration in deregulated markets: The role of energy storage, EVs, and policy frameworks. Energy Explor. Exploit. 2025, 43, 2745–2797. [Google Scholar] [CrossRef] [Scilit]
- Korobilis, D.; Yilmaz, K. Measuring Dynamic Connectedness with Large Bayesian VAR Models; SSRN Working Paper No. 3099725; Koç University-TÜSİAD Economic Research Forum: Istanbul, Turkey, 2018. [Google Scholar]
- Künsch, H.R. The Jackknife and the Bootstrap for General Stationary Observations. Ann. Stat. 1989, 17, 1217–1241. [Google Scholar] [CrossRef] [Scilit]
- Li, J.; Xie, C.; Long, H. The roles of inter-fuel substitution and inter-market contagion in driving energy prices: Evidences from China’s coal market. Energy Econ. 2019, 84, 104525. [Google Scholar] [CrossRef] [Scilit]
- Badshah, I.; Demirer, R.; Suleman, M.T. The effect of economic policy uncertainty on stock-commodity correlations and its implications on optimal hedging. Energy Econ. 2019, 84, 104553. [Google Scholar] [CrossRef] [Scilit]
- Wu, F.; Zhang, D.; Ji, Q. Systemic risk and financial contagion across top global energy companies. Energy Econ. 2021, 97, 105221. [Google Scholar] [CrossRef] [Scilit]
- Akyildirim, E.; Cepni, O.; Molnár, P.; Uddin, G.S. Connectedness of energy markets around the world during the COVID-19 pandemic. Energy Econ. 2022, 109, 105900. [Google Scholar] [CrossRef] [Scilit] [PubMed]
- Gong, X.; Xu, J. Geopolitical risk and dynamic connectedness between commodity markets. Energy Econ. 2022, 110, 106028. [Google Scholar] [CrossRef] [Scilit]
- Su, C.-W.; Pang, L.-D.; Qin, M.; Lobonţ, O.-R.; Umar, M. The spillover effects among fossil fuel, renewables and carbon markets: Evidence under the dual dilemma of climate change and energy crises. Energy 2023, 274, 127304. [Google Scholar] [CrossRef] [Scilit]
- Dong, F.; Li, Z.; Huang, Z.; Liu, Y. Extreme weather, policy uncertainty, and risk spillovers between energy, financial, and carbon markets. Energy Econ. 2024, 137, 107761. [Google Scholar] [CrossRef] [Scilit]
- Al-Haschimi, A.; Apostolou, A.; Azqueta-Gavaldon, A.; Ricci, M. Assessing financial risk in China: A text-based indicator approach. J. Int. Money Finance 2026, 162, 103514. [Google Scholar] [CrossRef] [Scilit]
- Baker, S.R.; Bloom, N.; Davis, S.J. Measuring economic policy uncertainty. Q. J. Econ. 2016, 131, 1593–1636. [Google Scholar] [CrossRef] [Scilit]
- Dang, T.H.-N.; Nguyen, C.P.; Lee, G.S.; Nguyen, B.Q.; Le, T.T. Measuring the energy-related uncertainty index. Energy Econ. 2023, 124, 106817. [Google Scholar] [CrossRef] [Scilit]
- Xu, X.; An, H.; Huang, S.; Jia, N.; Qi, Y. Measurement of daily climate physical risks and climate transition risks faced by China’s energy sector stocks. Int. Rev. Econ. Finance 2024, 93, 625–640. [Google Scholar] [CrossRef] [Scilit]
- Ghysels, E.; Sinko, A.; Valkanov, R. MIDAS regressions: Further results and new directions. Econom. Rev. 2007, 26, 53–90. [Google Scholar] [CrossRef] [Scilit]
- Engle, R.F.; Ghysels, E.; Sohn, B. Stock market volatility and macroeconomic fundamentals. Rev. Econ. Stat. 2013, 95, 776–797. [Google Scholar] [CrossRef] [Scilit]
- Wu, X.; Zhao, A.; Cheng, T. A real-time GARCH-MIDAS model. Finance Res. Lett. 2023, 56, 104103. [Google Scholar] [CrossRef] [Scilit]
- Tumala, M.M.; Salisu, A.; Nmadu, Y.B. Climate change and fossil fuel prices: A GARCH-MIDAS analysis. Energy Econ. 2023, 124, 106792. [Google Scholar] [CrossRef] [Scilit]
- Bekaert, G.; Engstrom, E.; Ermolov, A. Macro risks and the term structure of interest rates. J. Financ. Econ. 2021, 141, 479–504. [Google Scholar] [CrossRef] [Scilit]
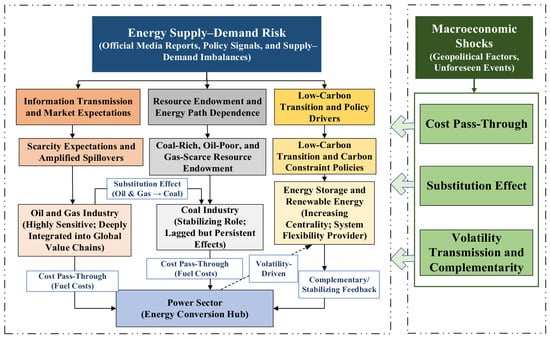
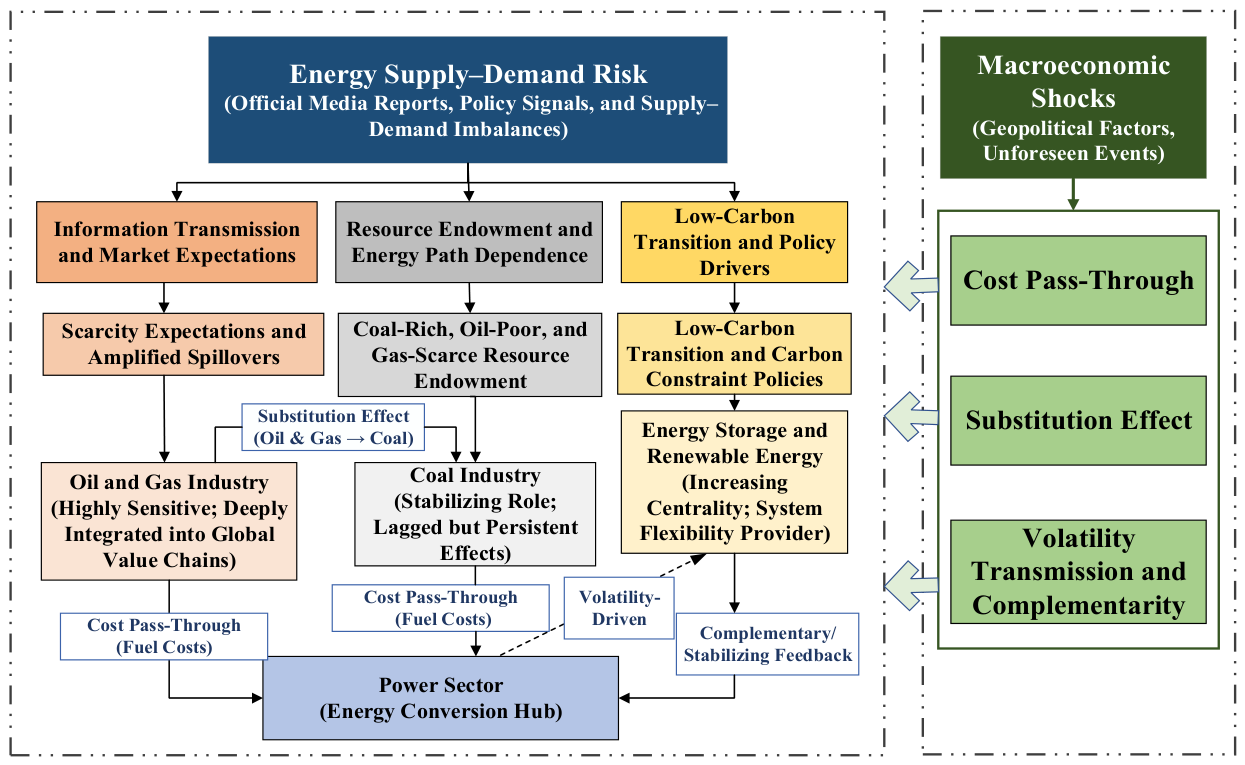
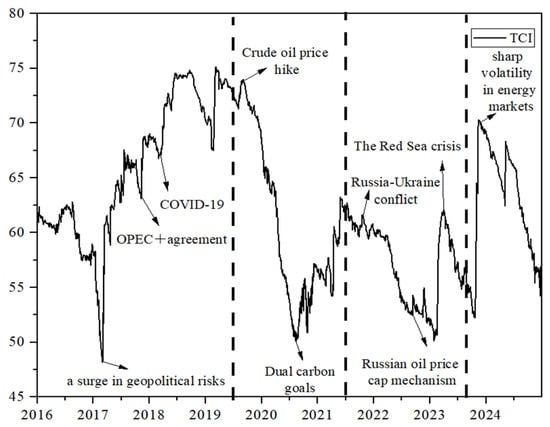
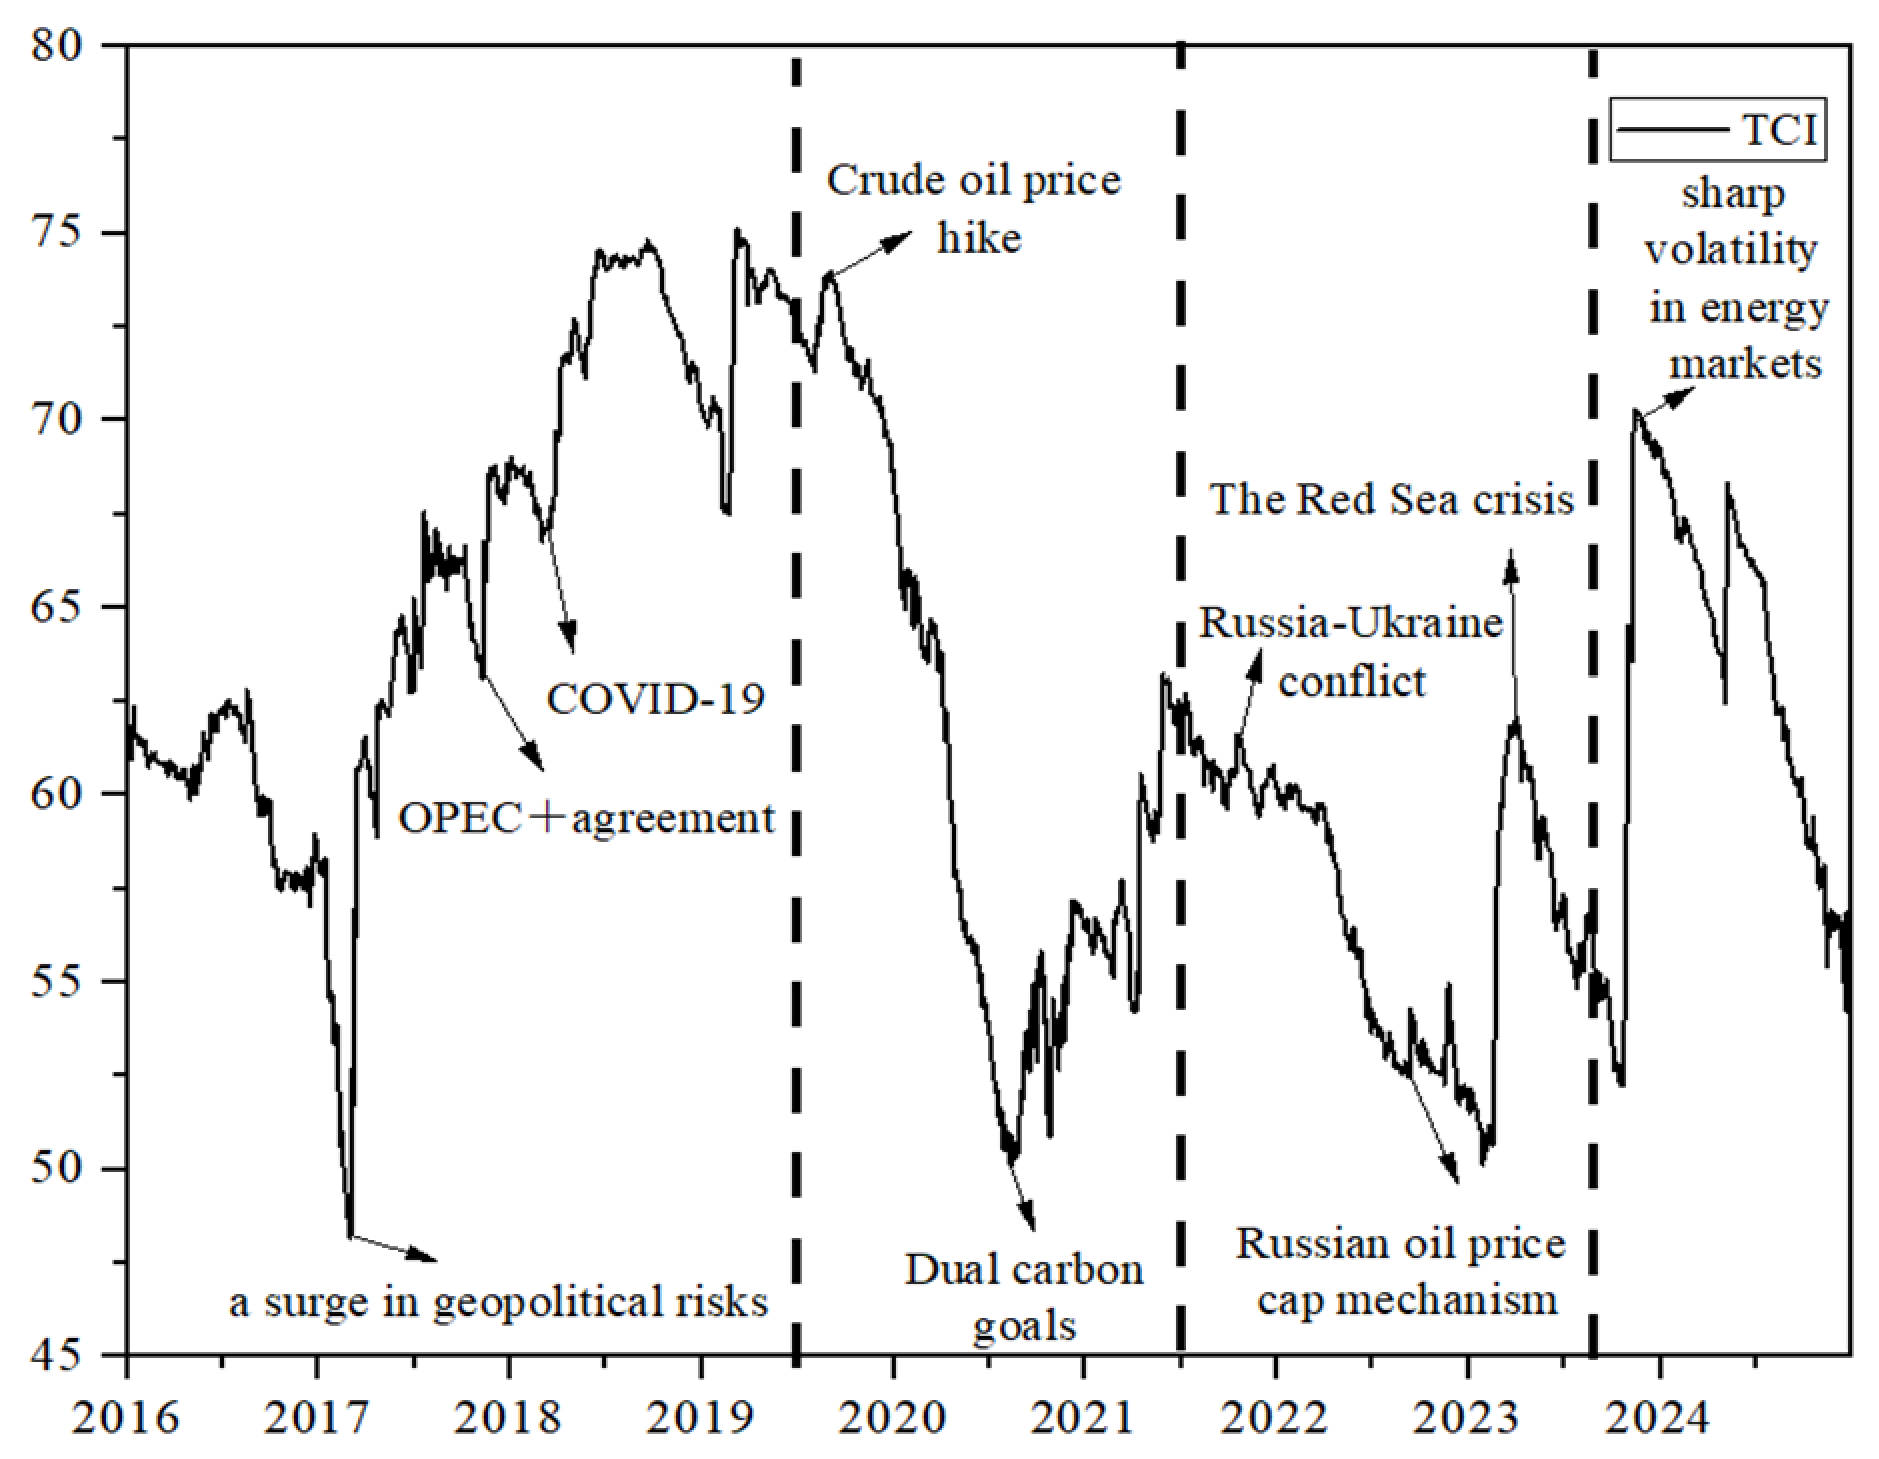
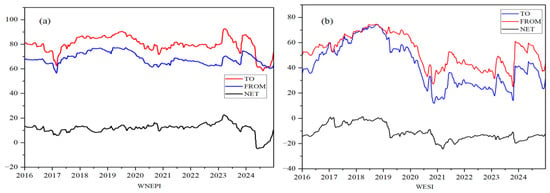
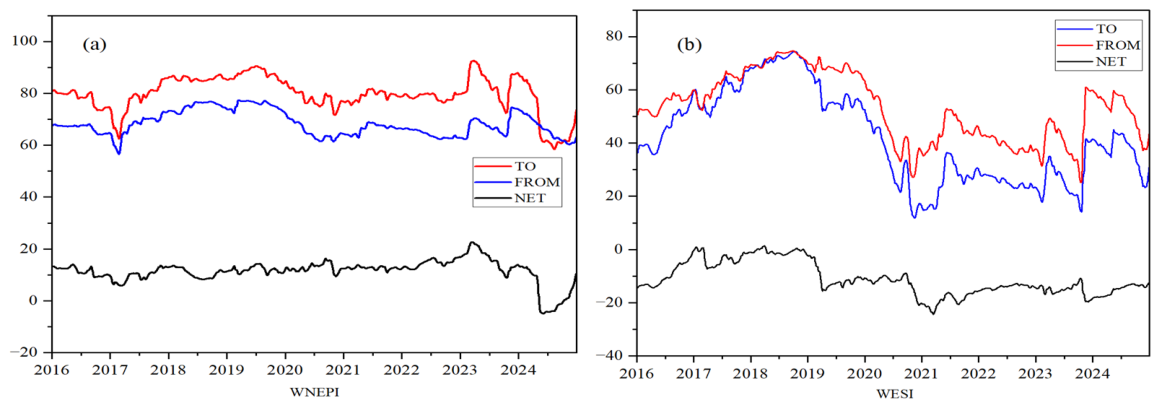
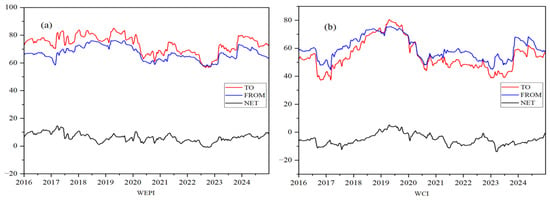
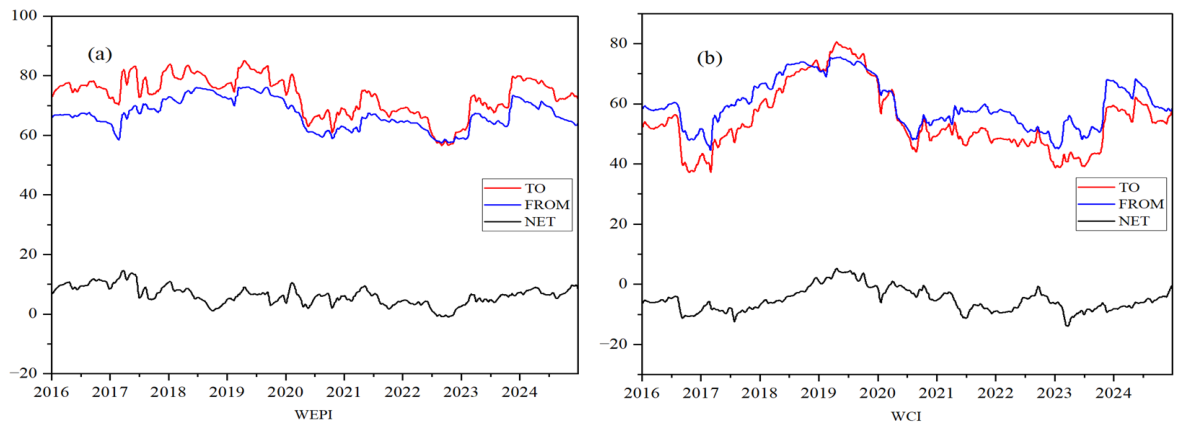
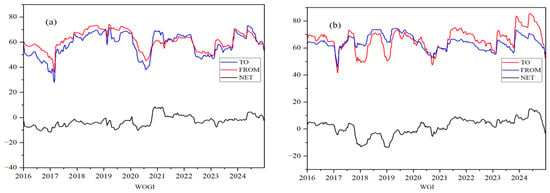
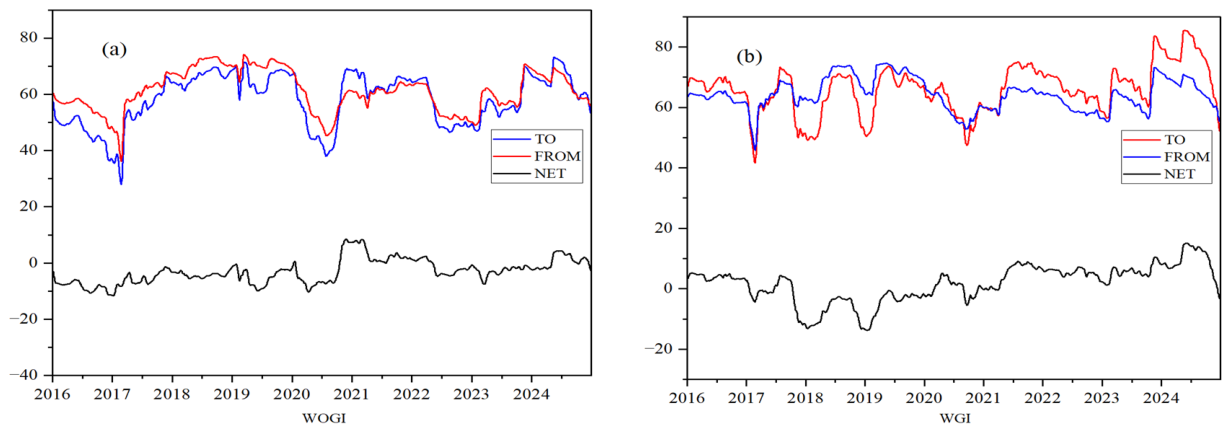
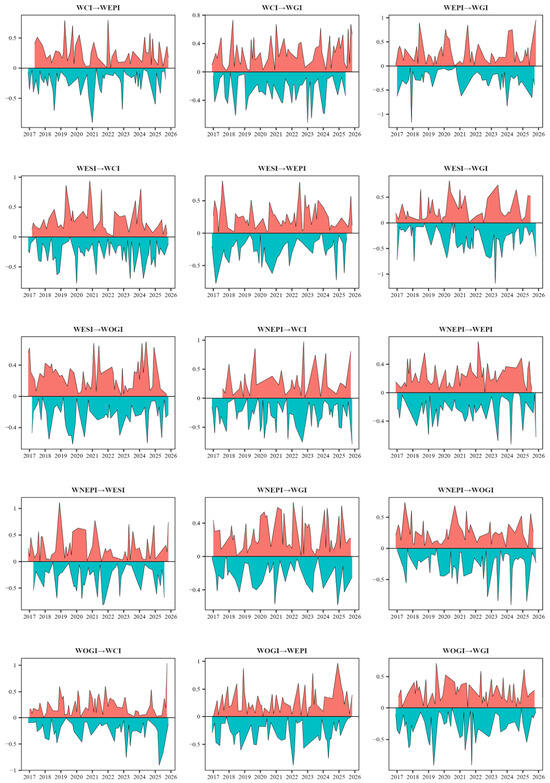
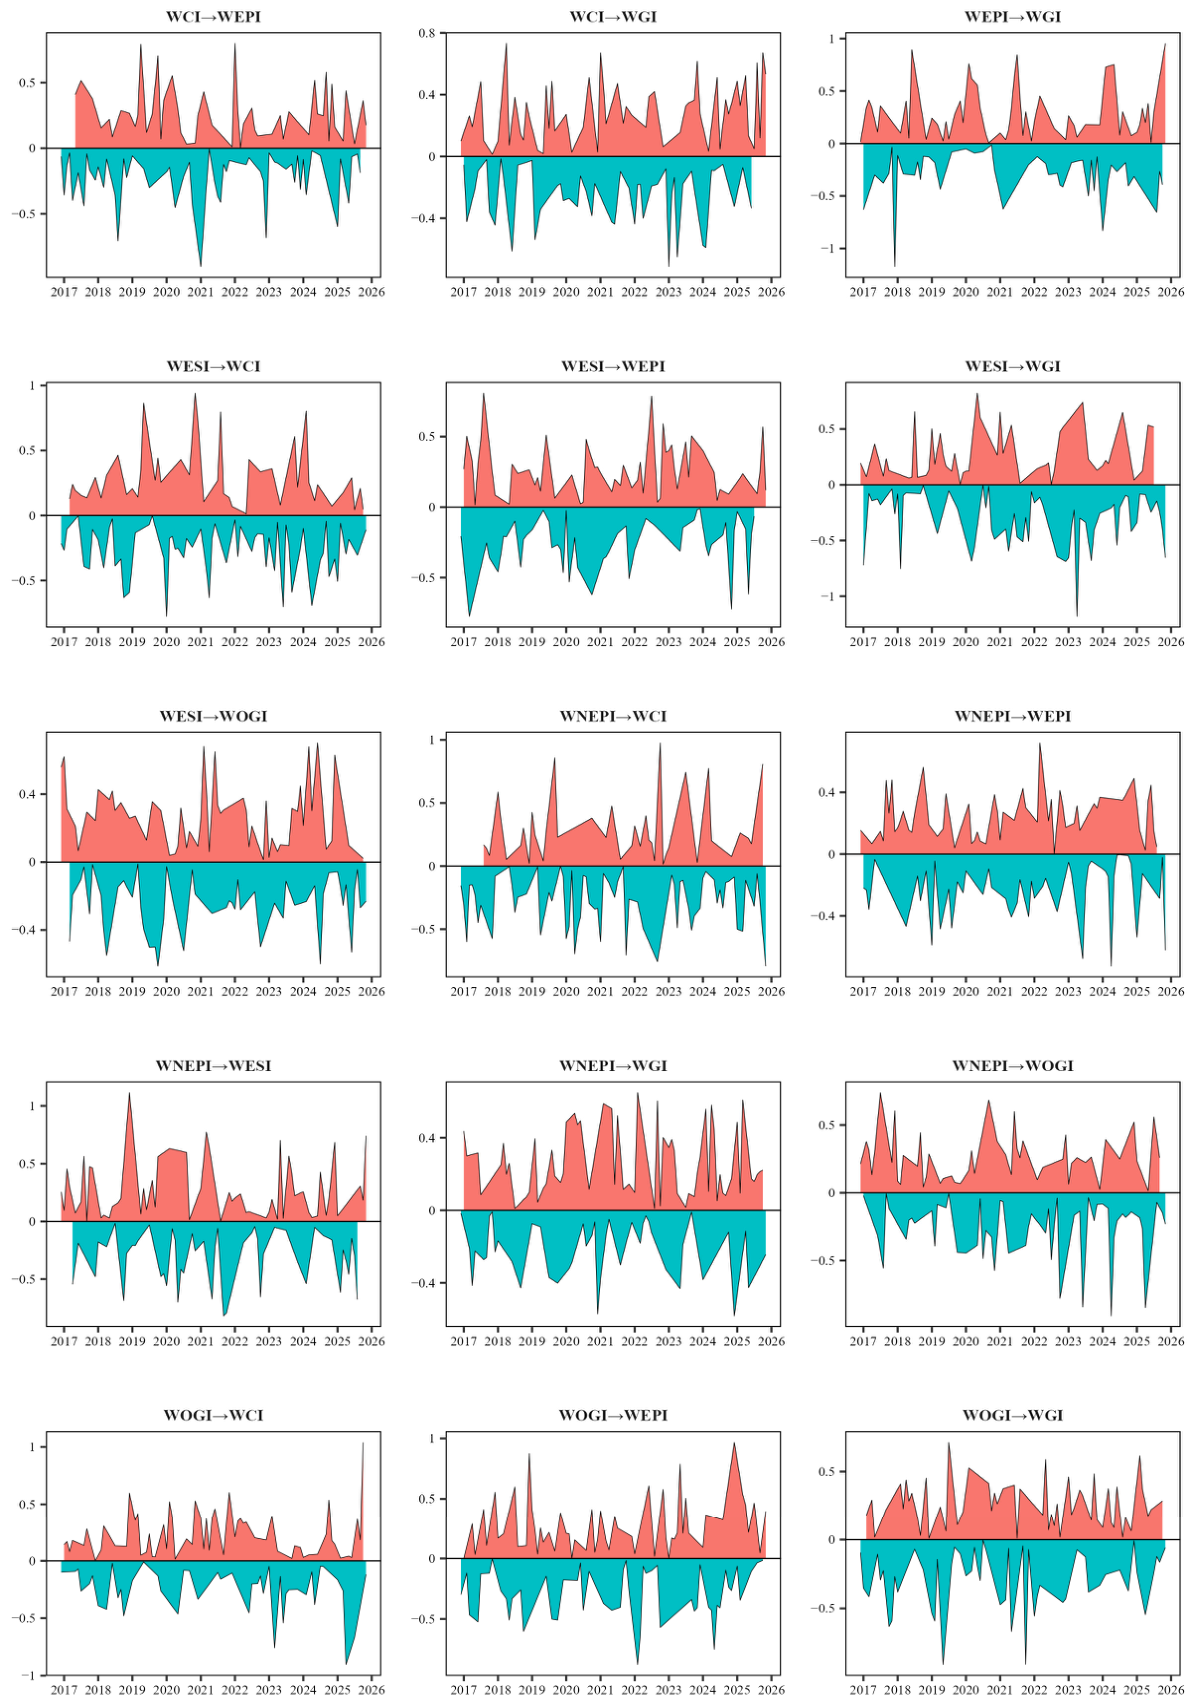
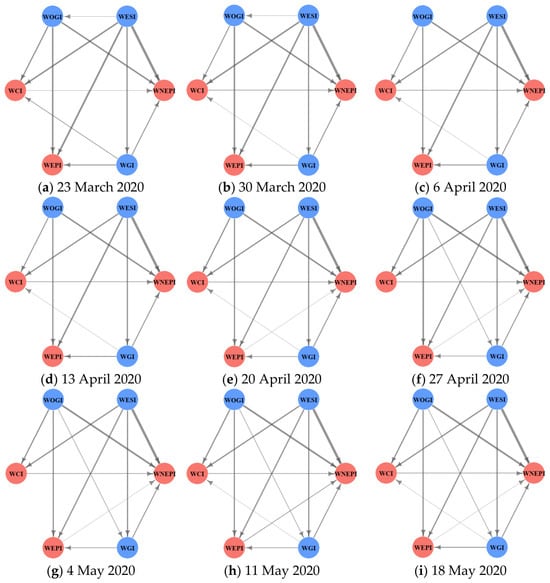
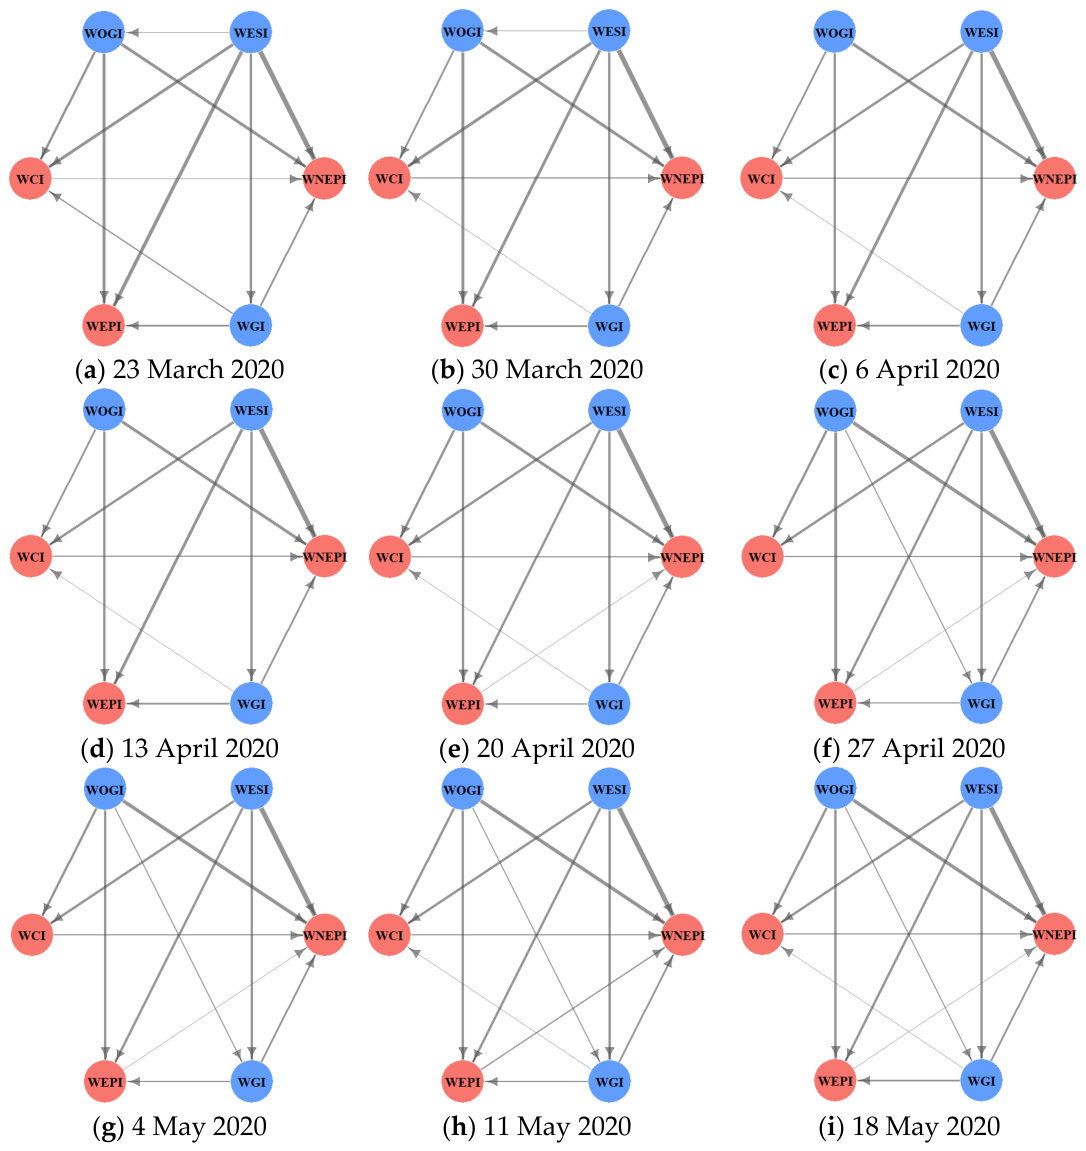
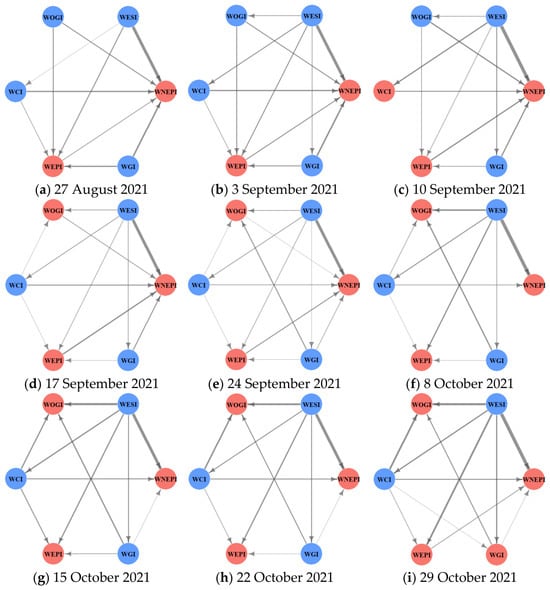
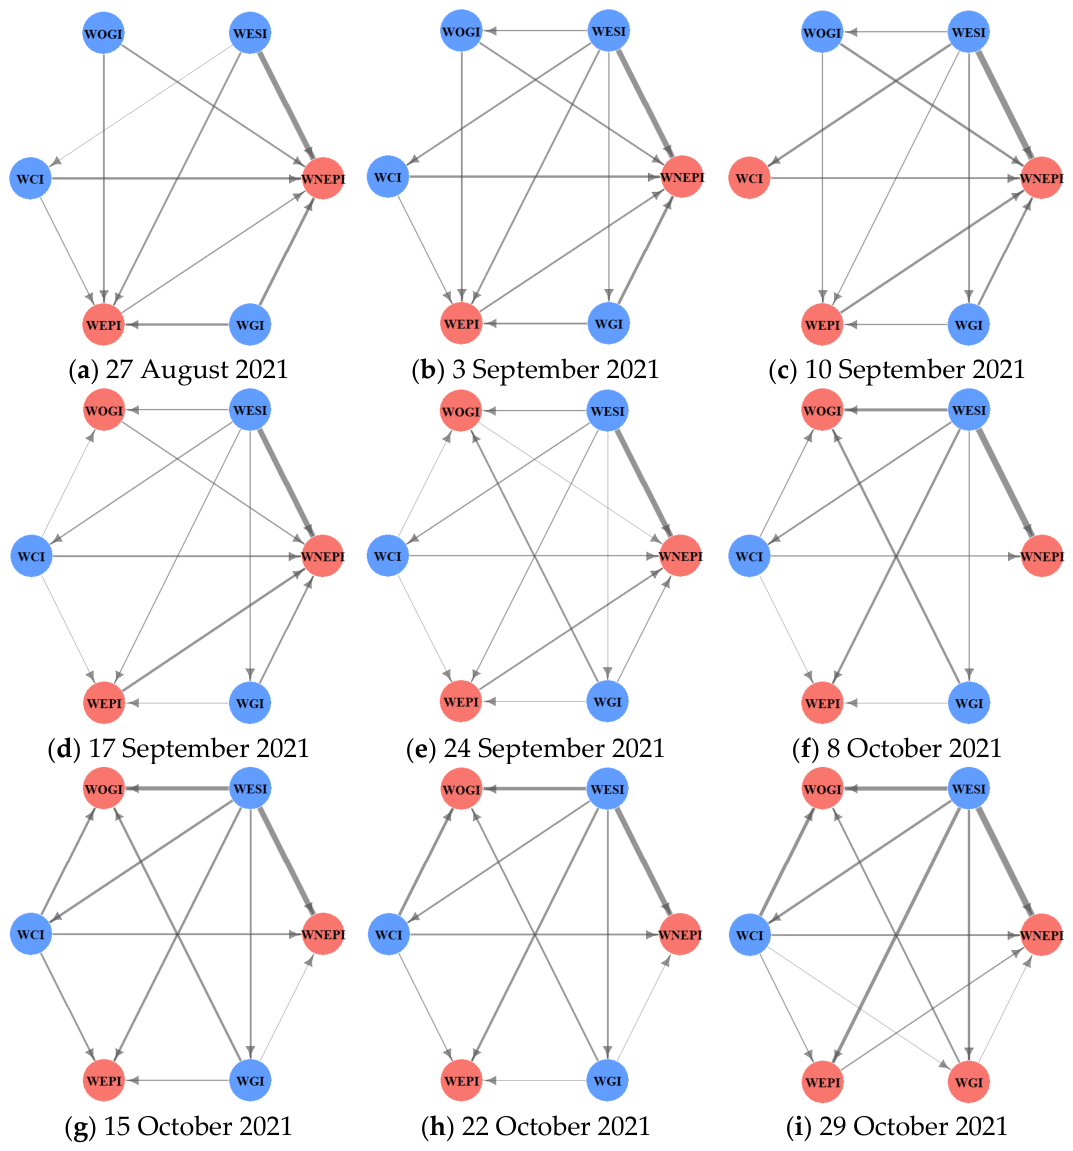
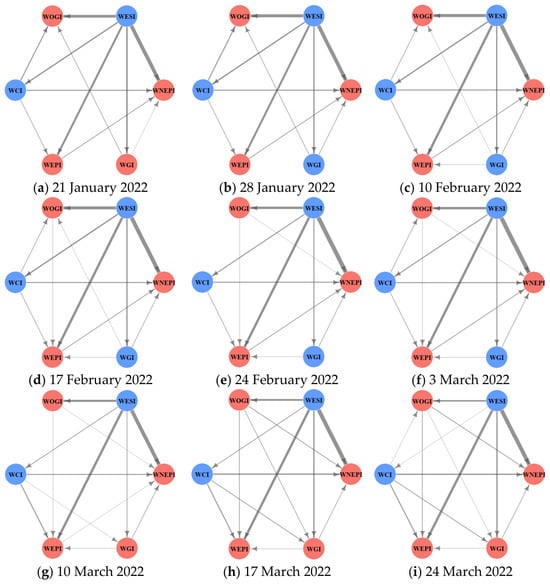
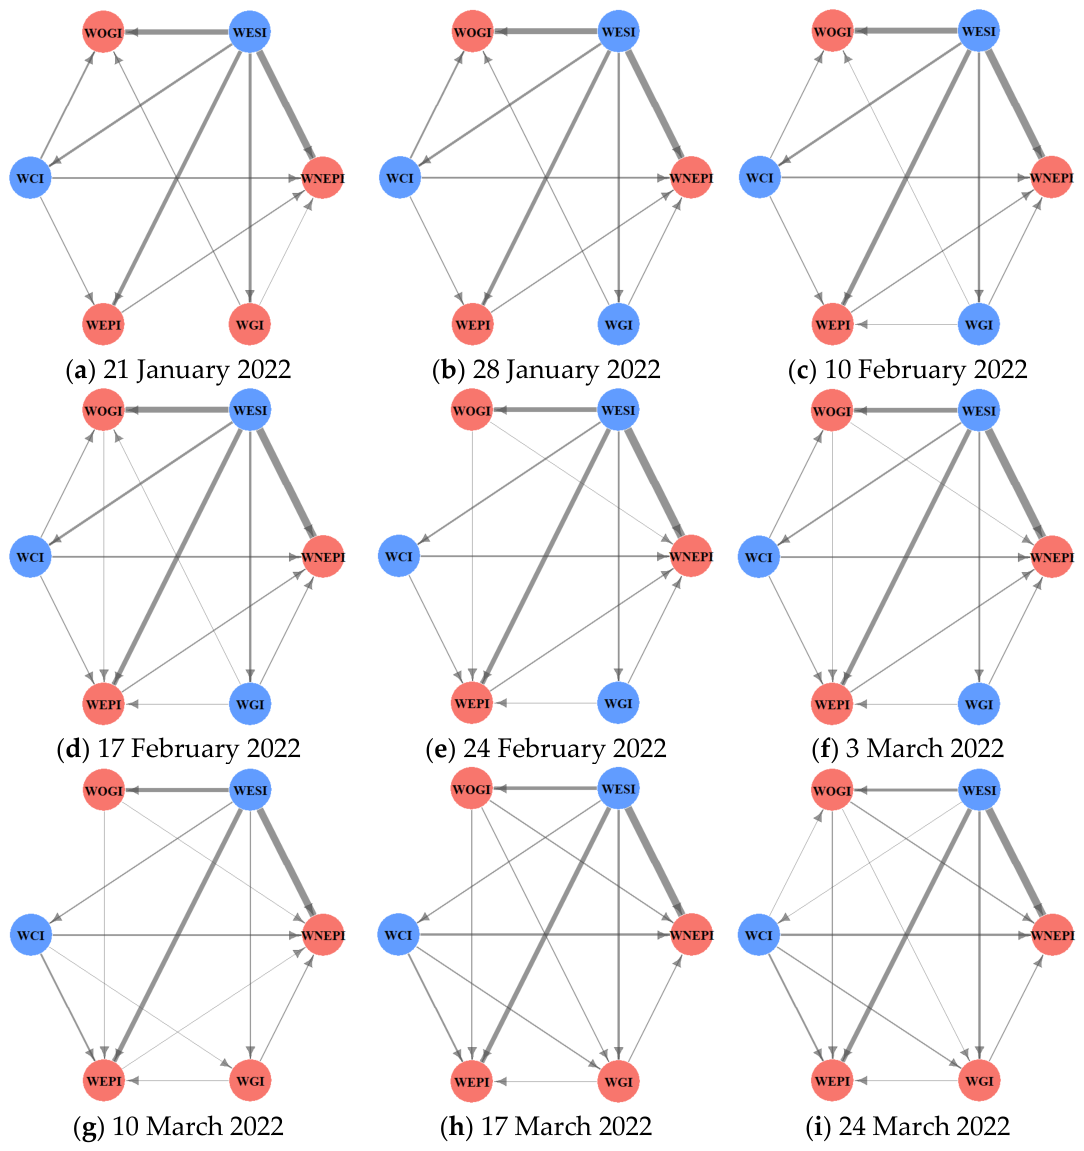
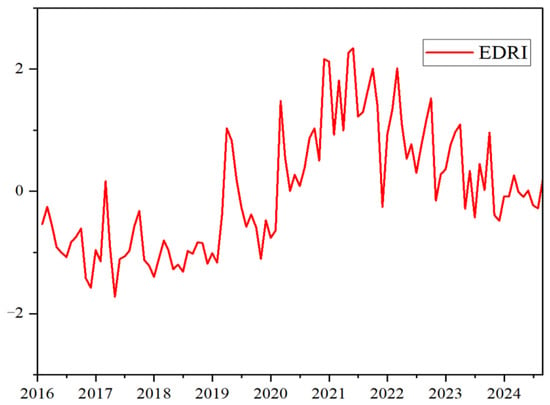
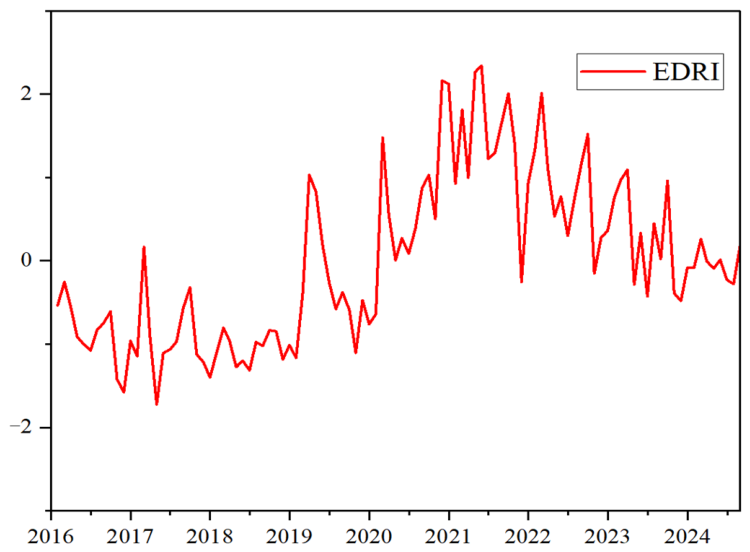

Disclaimer/Publisher’s Note: The statements, opinions and data contained in all publications are solely those of the individual author(s) and contributor(s) and not of MDPI and/or the editor(s). MDPI and/or the editor(s) disclaim responsibility for any injury to people or property resulting from any ideas, methods, instructions or products referred to in the content. |
© 2026 by the authors. Licensee MDPI, Basel, Switzerland. This article is an open access article distributed under the terms and conditions of the Creative Commons Attribution (CC BY) license.