


Abstract
Coal and gas outburst disasters severely restrict the safe and sustainable development of deep coal resources. Outburst fluid migration is violent and highly nonlinear, posing significant challenges to its mathematical modeling. This paper presents a high-Mach-number compressible flow model for outburst fluid migration. By combining physical and numerical simulation methods, the spatiotemporal evolution characteristics of the outburst two-phase flow were revealed, and the influence of the turning angle on the migration law of the outburst fluid was analyzed. The results show that the impact pressure presents a strong–weak alternating distribution characteristic in the roadway. In the straight roadway, the impact pressure under the non-arc condition is generally higher than that under the arc condition. In the turning roadway, the impact pressure of arc and non-arc roadways increases sharply, especially in the non-arc roadway. The arc turning structures are helpful in promoting the passing ability of pulverized coal when compared with the non-arc turning structures. An arrangement of acute and right angles effectively reduces the disaster intensity of the dynamic pressure of airflow in the straight roadway but increases the disaster intensity after the turning roadway. An obtuse angle arrangement increases the disaster intensity of static pressure in the whole roadway.
Keywords:
coal and gas outburst; coal-gas two-phase flow; impact dynamics; particle size distribution; turning structure; disaster-causing MSC:
76-05
1. Introduction
Energy is an important material basis for the survival and development of human society. Our demand for energy is increasing day by day with the rapid development of the world economy [1]. The rapid economic and industrial development of China, which is the second largest economy in the world, cannot be separated from the rapid consumption of energy [2]. China is the largest coal producer and consumer in the world, and it is also one of the few countries in the world where coal is the main energy source [3,4]. In 2024, coal consumption of China reached the highest level in the past decade, accounting for 55.8% of the global coal consumption [5,6]. In the same period, the coal production of China has exceeded 50% of the total production in the world [7]. Coal will remain the main energy and basic energy in China for a long period [8].
At present, it has become a necessary trend to promote the exploitation of deep resources due to the gradual depletion of shallow coal resources in China. With the deepening of mining depth, the coal seam gas pressure, in situ stress, and ground temperature are constantly increasing, and the stope structure is becoming more and more complex, making it easier for coal and gas outburst accidents to occur under mining disturbance [9,10]. The coal and gas outburst (abbreviated as “CGO”) is a mechanical process in which a large amount of coal is ejected from the coal seam to mining space by outburst airflow under the coupling action of coal deformation and gas flow [11,12]. In a zone with complex geological structures (fault and fold), it is easy to form gas accumulation areas. In the process of mining, when the coal seam is jointly affected by structural stress and mining stress, a CGO phenomenon is most likely to occur [13]. In the process of the outburst, the shock wave, impact airflow, and coal–gas two-phase flow generated in the roadway will cause strong impact disasters to underground workers, production equipment and mining space [14].
Studies showed that a CGO mainly occurs under the comprehensive action of gas pressure, in situ stress, the physical and mechanical properties of coal, and other factors [15,16]. In underground mining spaces, a CGO is transient, violent, and destructive. It is difficult to effectively monitor it [17]. Therefore, physical simulation tests and numerical simulation analysis are the most effective means to explore CGO disasters [18]. Valliappan and Zhang [19] preliminarily proposed an analysis method that explains the role of gas energy in the CGO process. Wang et al. [20] found through experiments that the contribution of gas pressure to the energy required by a CGO is hundreds of times that of in situ stress. Among factors such as gas pressure, in situ stress, coal seam thickness and temperature, temperature has the smallest influence on outburst intensity. Tu et al. [21,22] analyzed the guiding effect of tectonic coal on outburst via case analysis and physical simulation, and they compared the pore structure and gas desorption between tectonic and intact coals to derive a gas energy release model. Tian et al. [23] explored the surface micro-adhesion between coal samples which are not prone to outburst and coal samples which are prone to outburst, analyzed the physical adsorption mechanism of coal seam gas, and proposed the concept of critical velocity Vcr of gas adsorption. Zhao et al. [24] and Xue et al. [25] established multi-field coupling models of a damage field, seepage field, stress field, and gas diffusion field. The mining process of fault coal seams and horizontal coal seams was numerically simulated and analyzed, and the influence of gas pressures, the mechanical properties of coal, the geological structure and the stress of overlying strata was discussed. Kursunoglu and Onder [26] used the statistical method of structural equation modeling to explore the influence of the coal seam gas content, mining depth, water content, coal seam thickness, distance from the fault and the coal seam dip angle on a CGO. Xie et al. [27] explored the influence of different gas pressures on coal failure by using a self-developed visual gas–solid coupling mechanical device. Zhou et al. [28] explored the influence of in situ stress on CGOs through experiments and analyzed the evolution laws of physical field parameters such as in situ stress, elastic strain energy and gas pressure during CGOs.
The above researchers started with three factors—the physical and mechanical properties of coal, in situ stress, and gas pressure—and conduct in-depth explorations of the outburst mechanism, aiming at curbing the occurrence of CGOs from the source. However, with the gradual deepening of the mine, the geological conditions are becoming more and more complex, and the current research results still cannot completely prevent it [29]. Therefore, some researchers have made a preliminary exploration on the flow law and disaster-causing characteristics of outburst fluid, aiming at guiding the reasonable arrangement of disaster prevention and relief facilities in coal mines, and designing a safe and effective CGO disaster emergency rescue scheme. Wang et al. [30,31] analyzed the formation of outburst shock waves and airflow, clarified their influence on the far-field ventilation network, and used PPERR to investigate the effect of roadway size on outburst two-phase flow dynamics. Zhou et al. [32,33,34,35] deeply discussed the influence of rapid gas desorption on outburst fluid and studied the propagation law of outburst shock waves in near-field and far-field modes by using FLUENT software, which provided a new method for studying the airflow disturbance caused by underground ventilation networks. Cao et al. [36,37] clarified the formation mechanism of prominent shock waves, analyzed the role of gas adsorption in CGO dynamics, and obtained the evolution law of gas overpressure in roadways during CGOs. Jin et al. [38] studied the formation and migration mechanism of outburst airflow and evaluated the influence of gas desorption on airflow migration in the CGO process. Based on the theories of pneumatic conveying of pulverized coal and coal crushing, Zhao et al. [39] studied the flow state of coal–gas two-phase flow in the CGO process and found the blockage phenomenon in the two-phase flow process. Xu et al. [40,41] clarified the influence of different roadway layout patterns on fluid migration within roadways and revealed the differences between gas outburst and CGOs in terms of dynamic behavior. Zhou et al. [42,43,44] carried out outburst tests under different gas pressures and in situ stresses by using the self-developed test system, and they emphatically analyzed the evolution law of impact pressure of coal–gas two-phase flow in roadways, the movement characteristics of pulverized coal and its accumulation characteristics, and put forward an expansion–contraction flow field model including key structures.
In summary, a large number of researchers have conducted in-depth research on the migration law of outburst fluid and dynamic disaster-causing characteristics from the perspective of experiment and numerical simulation. Most of them focus on outburst shock waves and outburst airflow. In addition, the layout of the underground roadway is complex and changeable, but in the above research, the layout of the roadway is single. In addition, it is rare to study the migration law of outburst fluid and its dynamic disaster-causing characteristics from different roadway layouts. In the turning roadway, the different turning structures (arc and non-arc, different angles) will make the weak disturbance and strong disturbance generated in the process of airflow migration have different distribution in the roadway, thus leading to different migration laws of outburst airflow. However, the essence of outburst two-phase flow migration is that gas drives pulverized coal to move through drag force. The migration of pulverized coal flow is closely related to the flow state of outburst airflow. Therefore, studying the influence of different turning structures on coal–gas two-phase flow is the key topic for properly highlighting dynamic disasters from outbursts. To this end, first, the outburst tests of the non-arc and arc turning roadways were carried out using the self-developed multi-field coupling physical simulation test system of coal mine disasters. In addition, the distribution and sorting characteristics of the outburst pulverized coal in roadways under non-arc and arc conditions were compared as well as the evolution law of coal-gas two-phase flow impact pressure in roadways. Simultaneously, the evolution curve of the gas pressure inside the coal seam close to the outburst hole was obtained through experiments. Numerical simulations were performed using COMSOL Multiphysics 5.6 software, and the influence of different turning angles on the outburst airflow during the CGO process was discussed. The results of this study have important reference significance in understanding the mechanism of the outburst dynamic disaster-causing and implementing passive disaster prevention and mitigation measures on the premise that outburst disasters cannot be eliminated from the source.
2. Experimental Method
2.1. Experimental System
Experiments were conducted using the self-developed large-scale physical simulation test system of multi-field coupling coal mine dynamic disasters, as shown in Figure 1 [45]. The system consists of roadway, power, data acquisition and control, gas injection, and forming subsystems. The roadway subsystem is composed of straight roadways, cross roadways, cameras, sensors, and its support. The effective size of the internal section of the roadway is 400 × 400 mm. This subsystem can simulate the disaster-causing process of the outburst fluid in the roadway during the process of outburst under different roadway layout modes. The power subsystem is composed of a servo loading device, sample box, and main bearing bracket, which can reproduce the state of coal seams under triaxial stress. The data acquisition and control subsystem is used to collect the data of the flow pattern and impact characteristics of coal–gas two-phase flow during outbursts, in which the impact characteristics are measured by an impact sensor (piezoelectric pressure sensor) with a sampling rate of 1000 Hz. The gas injection subsystem is composed of gas cylinders, pipelines, flowmeters, electromagnetic valves, and intelligent electronic instruments, which realize constant speed and quantitative gas injection. The forming subsystem includes the main bearing bracket, oil cylinder, and console, which is used to produce outburst coal samples.
Figure 1.
Large-scale physical simulation test system of multi-field coupling dynamic disasters.
2.2. Experiment Scheme
Domestic and foreign researchers presented various studies on the occurrence mechanism and risk control theory of coal and gas dynamic disasters and achieved remarkable results. However, the study on the migration and flow of coal–gas two-phase flow and its disaster-causing process in the outburst process under different roadway layout forms is insufficient. Therefore, in this study, the outburst tests of right-angle (non-arc and arc) roadways were performed, and the initial conditions, including a coal seam gas pressure of 2.0 MPa, outburst diameter of 30 mm, and room temperature of 30 °C, were set uniformly. The influences of different structures of the turning roadway on the migration and flow characteristics of coal–gas two-phase flow during outbursts, the evolution characteristics of the impact pressure, and the distribution and sorting characteristics of pulverized coal in the roadway after outbursts were analyzed to fully discuss the law of coal–gas two-phase flow and its disaster-causing process.
Figure 2 shows the schematic diagram of the roadway structure layout and sensor layout in the test. The non-arc right-angle roadway consisted of eight straight-through roadways, seven cross-through roadways, and one flared section roadway. The lengths of the straight section and after turning were 12.8 and 3.8 m, respectively. A dust bag was placed at the end to collect pulverized coal. The arc roadway only replaces the cross roadway at the corner, as shown in the red area of Figure 2. A total of 10 impact pressure sensors and a high-definition camera were arranged in the test. Figure 2 shows the detailed layout positions. Table 1 presents the detailed experimental scheme, and the coal seam three-dimension stress loading method is shown in the literature [43,45].
Figure 2.
Schematic diagram of the roadway structure and sensor layouts.
Table 1.
Experimental scheme of the physical experiments.
2.3. Experiment Procedure
Figure 3 illustrates the detailed experimental procedure. First, raw coal was crushed, dried, and sieved. Then, the processed coal samples were mixed in a predetermined proportion and pressed four times [44]. Next, the specimen box was sealed, and its airtightness was verified. Under satisfactory airtightness conditions, the specimen box was connected to the roadway via the expansion section. Following the above preparations, the vacuum pump was activated to initiate vacuuming. After 1 h, outburst gas was injected into the specimen chamber in stages until the preset gas pressure of 2.0 MPa was achieved. Once the coal seam gas pressure reached adsorption equilibrium, in situ stress was applied to the predetermined value [44]. To attain adsorption equilibrium, the whole adsorption process continued for over 40 h. Subsequently, the data acquisition system was activated and calibrated. With a two-stage pressure-relief device, rapid gas injection breaks the first-stage rupture disc on the exterior, instantly reducing pressure to one atmosphere. The pressure differential between the coal-seam gas and the external gas then immediately ruptures the second-stage rupture disc inside, inducing a CGO. Finally, the collected data were saved, and the pulverized coal accumulated in different regions of the roadway was collected.
Figure 3.
Schematic of the experimental procedure.
3. Experimental Results
3.1. Movement of the Pulverized Coal
After the outburst was triggered, the coal near the exposed surface was pulverized under the combined action of high-pressure gas and high in situ stress. Under the traction of high-speed airflow, massive coal samples were also pulverized. The pulverized coal was rapidly sprayed out to the roadway, forming a coal–gas two-phase flow with high-strength damage characteristics that migrated along the roadway and caused disasters.
Figure 4 shows the movement characteristics of pulverized coal in the roadway after non-arc and arc roadway structures during outbursts. Based on the comparison, the pulverized coal has reached the turning structure (t = 1.4 s) under the condition of the non-arc roadway. However, there is no apparent sign of moving to the roadway after turning with the airflow, while the pulverized coal under the condition of an arc roadway has moved to the end of the first section of the roadway after turning the structure with the airflow. The visibility of the roadway after turning under the condition of the on-curved roadway is higher than that under the condition of the curved roadway (t = 2.0 s). In summary, the arc roadway can help promote the ability of gas to carry pulverized coal forward when coal–gas two-phase flow migrates through the turning roadway. On the contrary, the non-arc roadway can inhibit the forward flow of the pulverized coal.
Figure 4.
Movement characteristics of the pulverized coal.
3.2. Mass Distribution of the Pulverized Coal
Exploring the mass distribution of pulverized coal after CGOs has a certain reference value for the research on the disaster characteristics of outburst burial, the law of outburst energy dissipation and the design of a post-disaster safety rescue scheme. The roadway subsystem was divided into eight regions from forward to backward. The division standards under the conditions of non-arc and arc roadways are the same. After CGO, the pulverized coal was collected and weighed according to the area to obtain the mass distribution diagram of the outburst pulverized coal in the roadway, as shown in Figure 5.
Figure 5.
Mass distribution of the outburst pulverized coal.
The mass of pulverized coal in each area of the non-arc roadway is 3542, 4240, 3642, 3062, 2987, 3958, 5076, and 34 g, respectively. The straight roadway area (zones 1 to 6) shows the distribution characteristics (i.e., increasing at first, then decreasing, and finally increasing). Among them, the mass of pulverized coal in the second area is the largest, accounting for 16.0% of the total mass of outburst pulverized coal. The pulverized coal (zones 7 and 8) is mainly distributed in zone 7, accounting for 19.1% of the total mass of outstanding pulverized coal. The mass of pulverized coal in each area of the curved roadway is 4509, 6728, 6192, 3690, 2378, 1224, 703, and 58 g, respectively. The straight roadway area presents the distribution law (i.e., increasing at first and then it will decrease). Similarly, the mass of pulverized coal in the second region is the largest, accounting for 26.4% of the total mass of outburst pulverized coal. The pulverized coal in the turning roadway area is also mainly distributed in zone 7, accounting for 2.8% of the total mass of outburst pulverized coal. Significantly, under the two test conditions, the mass of pulverized coal in the straight roadway area shows the maximum in the second area. The pulverized coal in the turning roadway area is mainly distributed in the 7th area, and most of the pulverized coal in the 7th area is distributed at the turning structure. However, the proportion of pulverized coal in different regions varies. There is a certain commonality in the distribution of pulverized coal mass in the right-angle turning roadway. Simultaneously, non-arc and arc structures also have great influence on the mass distribution of the outburst pulverized coal.
In the process of a CGO, most of the outburst pulverized coal will be deposited in the front end of the roadway (zones 2 and 3). In the early stage of the outburst, a high-pressure airflow drives part of the pulverized coal to move and settle deep into the roadway through drag force. With the development of the outburst, the outburst energy decreases continuously, the drag force of the airflow gradually weakens, and the kinetic energy obtained by the pulverized coal decreases, eventually leading to most pulverized coal settling in the middle and front end of the roadway. The cohesive energy of the two-phase flow is larger at the initial stage of the outburst, and it gradually decreases with time. This energy directly influences the transportation distance of pulverized coal. Therefore, more pulverized coal will be emitted from the working face as the outburst energy that is released in the early stage greatens. On the contrary, the smaller the outburst energy released in the early stage, the smaller the distribution of pulverized coal far away from the working face, leading to the increased mass of pulverized coal near the working face. The different turning structures will affect the release of outburst energy, thus making the distribution of pulverized coal mass in the roadway different. That is, compared with the arc-shaped structure, the non-arc-shaped structure enhances the accumulation and release of outburst energy in the early stage, thereby increasing the pulverized coal mass in zones 6 and 7. Under the condition of a non-curved turning roadway, there are lots of pulverized coal deposits at the turning structure and the roadway before the turning (zone 6). The non-arc structure inhibits the pulverized coal from moving to the roadway after the turning when the pulverized coal is driven by the high-pressure airflow to the turning structure. Thus, it finally settles in the front of the 6th and 7th areas.
3.3. Sorting Characteristics of the Pulverized Coal
In the process of a CGO, a large amount of pulverized coal carried by high-pressure airflow is rapidly ejected from the coal seam to the roadway space, forming a highly destructive coal–gas two-phase flow and moving along the roadway to cause disasters that destroy underground facilities and equipment and endanger the lives of underground personnel. On the one hand, the solid phase in coal–gas two-phase flow is pulverized coal particles. The flow characteristics of pulverized coal particles can be regarded as ordinary fluid when the velocity of high-pressure airflow is high enough during an outburst, which has strong dynamic disaster-causing characteristics during its migration. In the process of an outburst, there is an interaction force between gas and pulverized coal, and there is an exchange of momentum and energy. The effect of gas on pulverized coal is largely influenced by the pulverized coal particle size [46]. Note that there are also interaction forces between pulverized coal particles. When the pulverized coal particle size is more than 1 mm, the force between pulverized coal particles is not compared with gravity. However, the force between pulverized coal particles cannot be ignored and even plays a decisive role compared with gravity as the pulverized coal particle size decreases gradually [47]. On the other hand, in the process of coal and gas outbursts, the dissipation of outburst energy is mainly manifested in the transportation and crushing of coal. Coal crushing is the process in which the coal body that receives energy produces a new surface and is separated from the raw coal body. After coal crushing, the new surface area is closely related to the proportion of the pulverized coal particle size [48]. Therefore, the study on the proportion of particle size and distribution characteristics of the outburst pulverized coal is helpful to further understand the dynamic disaster-causing characteristics of the coal–gas two-phase flow.
The outburst pulverized coal was sieved and divided into <0.15, 0.15–0.2, 0.2–0.25, 0.25–0.3, 0.3–0.35, 0.35–0.4, 0.45–0.5, 0.5–1, 1–2, and >2 mm according to the particle size (i.e., from small to large). Figure 6 shows the mass proportion of each pulverized coal particle size in eight areas, respectively. Based on Figure 6a, in the first region, the particles with a particle size less than 0.15 mm account for the largest mass proportion of outburst pulverized coal under non-arc and arc conditions, accounting for 65.86% and 62.63%, respectively. Second, the particles with a particle size of 0.15–0.2 mm account for 11.70% and 9.77%, respectively. The particles with a particle size range of 0.2–0.5 mm account for less than 5%. The total mass of large particles with a particle size larger than 0.5 mm accounts for less than 13%. Compared with areas 2–8, the mass proportion of the pulverized coal particle size in area 1 and areas 2–8 is similar, but there is only a small difference. In general, the outburst pulverized coal under non-arc and arc conditions is mainly composed of small particles with a particle size less than 0.15 mm, and the pulverized coal has a high degree of crushing. Simultaneously, the mass proportion of the outburst pulverized coal particle sizes in each area of the roadway is similar, and the mass proportion of particle sizes < 0.15 mm decreases as the distance from the working face increases, whereas the mass proportion of particle sizes > 0.5 mm tends to increase.
Figure 6.
Mass proportion of each particle size of the outburst pulverized coal. (a) zone1; (b) zone2; (c) zone3; (d) zone4; (e) zone5; (f) zone6; (g) zone7; (h) zone8.
Based on the comparison of the mass proportion of each particle size under the non-arc and arc conditions, in the first region, the mass proportion of particles with particle sizes of <0.15, 0.15–0.2, and 0.4–0.45 mm under the non-arc condition is significantly higher than that under the arc condition. In other regions, the mass proportion under a non-arc condition is lower than that under the arc condition. In the 2nd, 3rd, and 4th regions, the mass proportion is higher in the non-arc condition than in the arc condition only for the particle sizes < 0.15 mm. In the 5th, 6th and 7th regions, except for when the particle sizes < 0.15 mm, the mass proportions of particle size ranges of 0.15–0.2 and 0.2–0.25 mm in the non-arc condition are higher than those under the arc condition as the distance from the working face increases. In the 8th region, the particle size of pulverized coal under non-arc conditions only obviously exists in the two ranges of <0.15 and 0.15–0.2 mm, while that under the arc condition is 0.2–0.25, 0.25–0.3, 0.3–0.35 and 0.4–0.45 mm. In summary, the mass proportion of small particles with particle sizes < 0.15 mm in the non-arc condition is higher than that in the arc condition (i.e., the fragmentation degree of pulverized coal in the non-arc condition is higher than that in the arc condition). As previously mentioned in Section 3.2, the analysis shows that the different structure of the turning roadway will affect the release of the outburst energy. Compared with the arc structure, the non-arc structure enhances the accumulation and release of outburst energy; the dissipation of this energy is reflected not only in the ability to transport pulverized coal but also in the ability to crush it. Therefore, the fragmentation degree of pulverized coal under non-arc conditions is higher than that under arc conditions. After the turning structure (zone 8), the non-arc and arc structures can only make the coal particle sizes of <0.2 and <0.45 mm pass smoothly, respectively. The different turning structures of the roadway will lead to there being a different passing capacity of each particle size of pulverized coal. The arc roadway helps promote the ability of large particles of pulverized coal to flow forward, while the non-arc roadway inhibits the flow of large particle pulverized coal.
Figure 7 shows the distribution of the mass proportion of each particle size along the roadway under non-arc and arc conditions. The mass proportions of regions 1–6 vary according to the pulverized coal particle size. However, in terms of the single particle size range, the difference in the spatial distribution of the mass proportion along the straight roadway is small and relatively uniform. There is no single particle size mass proportion mutation in a certain area. Based on areas 7–8 in the figure, the structure of the turning roadway has a great influence on the mass proportion of single particle, and there is a sudden increase or decrease. Based on the comparison of the mass ratio under the two conditions, the distribution curve of the mass proportion under the non-arc condition is higher than that under the arc condition when the particle size is less than 0.15 mm. When the particle sizes were 0.15–0.2, 0.2–0.25, and 0.4–0.45 mm, the non-arc and arc mass proportions were in a staggered distribution.
Figure 7.
Distribution of mass proportion of each particle size along the roadway. (a) <0.15 mm; (b) 0.15–0.2 mm; (c) 0.2–0.25 mm; (d) 0.25–0.3 mm; (e) 0.3–0.35 mm; (f) 0.35–0.4 mm; (g) 0.4–0.45 mm; (h) 0.45–0.5 mm; (i) 0.5–1 mm; (j) 1–2 mm; (k) >0.2 mm.
In addition, for other particle sizes, the mass proportion of those in the arc conditions is higher than those in the non-arc conditions. The mass proportion of pulverized coal in the roadway shows three distribution states according to particle size from small to large: single non-arc high, staggered, and single arc high. Note that the distribution trends of mass proportions of each particle size along the roadway under non-arc and arc conditions are similar. Moreover, the distribution similarity under the two conditions is more apparent as the particle size increases. For example, based on Figure 7a, under both conditions, it shows an evolutionary trend (i.e., decreasing first and then it increases). In Figure 7d, the trend shows that it decreases first, then it increases, and finally it decreases. In Figure 7i,j, the trend increases and then decreases. Overall, the distribution of the mass proportion of each particle size in the roadway space reflects a certain uniformity. Moreover, the distribution trend of the mass proportion of particle size under non-arc and arc conditions is similar.
3.4. Time–History Evolution of the Impact Pressure in Straight Roadway
A coal and gas outburst is a violent and destructive dynamic disaster process. The coal–gas two-phase flow formed in the outburst process produces a strong impact, which can instantly cause casualties and destroy underground equipment and facilities. This becomes a major issue in terms of safety, efficiency, and achieving green mining in coal mines. Therefore, a study on the evolution law of impact pressure in the roadway during the outburst process plays a significant role in reasonably arranging the layout of facilities, such as the outburst damper, outburst fence, and refuge chamber, and formulating an effective post-disaster emergency rescue plan.
Figure 8 shows the evolution process of the impact pressure at different positions in a straight-line roadway under non-arc and arc conditions. From the working face, one measuring point is arranged at 2, 4, 6, 8, 10, and 12 m from near to remote, which are F1, F2, F3, F4, F5, and F6, respectively. At 2 m away from the working face, the impact pressure of non-arc and arc conditions shows an evolutionary trend of first rapid increase, then gentle fluctuation, and finally slow decline. Before 2.5 s, the impact pressure of non-arc conditions is always higher than that of arc conditions, and their maximum impact pressures are 97.66 and 45.67 kPa, respectively. At a distance of 4 m from the working face, the evolution trend of impact pressure under non-arc and arc conditions is similar. The maximum impact pressure is 29.94 kPa and 28.16 kPa, respectively, and the difference between them is small. Overall, the impact pressure shows the evolution law of first decreasing, then rapidly increasing, and then fluctuating decreasing, which indicates that the injection of coal–gas two-phase flow occurs intermittently many times during an outburst (i.e., the outburst process is paroxysmal).
Figure 8.
Evolution of impact pressure with time in straight section roadway. (a) F1(2 m); (b) F2(4 m); (c) F3(6 m); (d) F4(8 m); (e) F5(10 m); (f) F6(12 m).
At a distance of 6 m from the working face, the fluctuation times of the impact pressure decrease and the curve is relatively smooth. The evolution trends of non-arc and arc impact pressures are very similar. However, the value of non-arc impact pressure is higher than that of arc impact pressure, and the maximum impact pressure is 62.57 and 36.26 kPa, respectively. At a distance of 8 m from the working face, the non-arc and arc impact pressures showed four stages: rapid rise–rapid decline–rapid rise–slow decline. Similarly, the impact pressure value of the non-arc is higher than that of the arc. The non-arc impact pressure and arc impact pressure reached the maximum at the first stage, which were 57.42 and 55.99 kPa, respectively. In the second stage of rapid decline, the drop value of the impact pressure in the arc condition is larger than that in the non-arc condition. In the third stage of the impact rebound, the values of non-arc and arc rebound are similar, and the values of impact after rebound are 50.29 and 25.78 kPa, respectively. At a distance of 10 m from the working face, the evolution trend of their impact pressure is similar to that at 8 m, but its impact pressure value is less than that at 8 m. The maximum impact pressure of the non-arc and arc conditions is 7.94 and 14.19 kPa, respectively, and the maximum impact pressure of the arc condition is higher than that of the non-arc condition. Moreover, the maximum impact pressures of the arc and non-arc condition are in the first and second rapid rising processes, respectively. Simultaneously, the starting time of the second rise of arc impact pressure is obviously earlier than that of the non-arc impact pressure. At a distance of 12 m from the working face, the non-arc and arc impact pressures show an evolutionary trend of slowly rising at first and then slowly decreasing with the maximum impact pressure of 20.94 and 20.87 kPa, respectively.
In summary, the evolution trend of impact pressure under non-arc and arc conditions is similar at each position in the straight section roadway (i.e., in the turning roadway, the different turning structures have little influence on the evolution trend of impact pressure in the straight roadway before turning). Different from this, in the front and middle ends of the straight roadway (F1–F4), the value of non-arc impact pressure is generally higher than that of arc impact pressure, and the difference of the higher amplitude is quite large. At the back end of the straight roadway (F5–F6), the arc impact pressure is higher than that of the non-arc impact pressure in the early stage of the outburst and lower than that of non-arc in the late stage of the outburst. Different turning structures have a great influence on the impact pressure in straight roadways before turning. In addition, its influence intensity is different based on different positions. Generally speaking, the arc structure generally reduces the disaster-causing intensity of coal–gas two-phase flow in a straight roadway before turning. Significantly, at F1, F3 and F5, the difference amplitudes of the maximum non-arc and arc impact pressure are 113.8%, 72.4%, and 78.7%, respectively, by comparing the maximum impact pressure of the two. However, the difference amplitudes of the maximum impact pressure at F2, F4, and F6 are 6.3%, 2.5%, and 0.3%, respectively. The influence intensity of different turning structures on the maximum impact pressure in the straight roadway before turning presents a strong–weak distribution law along the roadway.
3.5. Time–History Evolution of Impact Pressure After Turning Structure
Figure 9 shows the evolution process of impact pressure at different positions in the roadway after turning under non-arc and arc conditions. Subjected to the distance from the central axis, one measuring point is arranged at 13, 14, 14.4, and 15.2 m away from the working face, which are F7, F8, F9, and F10, respectively, as shown in Figure 2. At a distance of 13 m from the working face, the non-arc impact pressure rapidly rises to 223.27 kPa, then slowly decreases, and last rises slightly (t = 2.75 s). The impact pressure of the arc rapidly rises to 12.66 kPa, then drops rapidly, then rises slowly to 9.14 kPa (t = 2.24 s), and then drops slowly. At a distance of 14 m from the working face, the non-arc impact pressure rapidly rises to 7.63 kPa, slowly decreases, then continuously rises, and reaches the maximum value of 11.55 kPa (t = 3.56 s). The arc-shaped impact pressure rises slowly, reaching the maximum value of 6.15 kPa (t = 2.84 s). At a distance of 14.4 m from the working face, the evolution trend of non-arc impact pressure and arc impact pressure is similar to that of F7, and its maximum impact pressure is 156.06 and 48.13 kPa, respectively. At a distance of 15.2 m from the working face, the evolution trend of non-arc and arc-shaped impact pressure is the same, and the arc-shaped impact pressure rises to the maximum value before the non-arc-shaped impact pressure, and the maximum impact pressure of non-arc and arc-shaped impact pressure is 13.86 and 11.62 kPa, respectively.
Figure 9.
Evolution of the impact pressure roadway with time after turning. (a) F7(13 m); (b) F8(14 m); (c) F9(14.4 m); (d) F10(15.2 m).
Note that the maximum impact pressure at F7 and F9 under the non-arc condition is as high as 223.27 and 156.06 kPa, which is higher than other measuring points in the roadway, especially the measuring points in the straight section, and the impact pressure rises sharply after turning. Similarly, the impact pressure under the arc condition has a similar phenomenon, and the maximum value at F9 reaches 48.13 kPa, which is higher than the maximum value of other measuring points except for F4. In addition, in the roadway after turning, the non-arc impact pressure is generally higher than the arc impact pressure. It can be seen that when the outburst fluid flows through the turning structure, its impact pressure rises sharply, and the phenomenon of a sharp rise in the impact pressure appears. Therefore, the disaster-causing intensity of coal–gas two-phase flow will be improved and the hazard of outburst will be enhanced. At the same time, compared with the non-arc structure, the layout of the arc structure at the corner also has the phenomenon of a steep increase in impact pressure, but its maximum value is far less than that of the non-arc condition, which can effectively reduce the disaster-causing intensity of coal–gas two-phase flow.
3.6. Distribution of Impact Pressure in Roadway at Different Times
Figure 10 shows the distribution of impact pressure along the roadway at different time points. There are slight changes from F1 to F5 (t = 20 ms). Here, the distribution of the non-arc and arc impact pressures along the roadway is relatively consistent. The coal–gas two-phase flow has migrated to the turning structure (t = 40 ms). Moreover, the distribution of non-arc and arc impact pressures along the roadway is gradually different. At F1 near the working face, the non-arc impact pressure rises rapidly to 32.38 kPa, while the arc impact pressure has no apparent change. At F4, in the middle of the straight roadway, the non-arc and arc impact pressures rise to 18.96 and 29.06 kPa, respectively. The arc impact pressure is greater than the non-arc impact pressure at F3–F5. At the tail of the straight roadway, the non-arc and arc impact pressures at F6 rise synchronously to 10.21 kPa. After turning the structure, the non-arc impact pressure tends to rise, while the arc impact pressure has no obvious response. The non-arc and arc impact pressure at F4 increased continuously (t = 60 ms), reaching 38.31 and 52.93 kPa, respectively. At F6, the arc impact pressure drops to −10.71 kPa. At F7 and F9, the non-arc impact pressure rises rapidly to 43.81 and 47.49 kPa, while the arc impact pressure rises only to 26.24 kPa at F9. Note that the impact pressure of the arc is still higher than that of the non-arc at F5 and F6 in the middle and rear ends of the roadway. The non-arc impact pressure at F4 caught up with the arc impact pressure (T = 80 ms), and its impact pressure at F7 and F9 continued to rise. However, the arc impact pressure at F9 has decreased to 14.52 kPa. The impact pressure of the non-arc roadway is higher than that of the arc roadway. Within 100–200 ms of outburst, the non-arc impact pressure continuously increases at F7 and F9. On the other hand, under the arc condition, the impact pressure at F1 gradually increases, while the impact pressure at F4 gradually decreases to zero. Within an outburst of 400–1600 ms, the non-arc impact pressure gradually decreased at F1, F7, and F9, while the impact pressure at F3 gradually increased and was higher than that at F4. Finally, it became the largest impact pressure in the straight roadway. However, the impact pressure of the arc has a relatively small change. On the other, the impact pressure of the middle and front ends of the roadway has a slight upward trend, leading to a relatively strong impact pressure that causes the disaster area to transfer from the middle to the front end of the roadway.
Figure 10.
Evolution of the impact pressure along the roadway at different times. (a) t = 20 ms; (b) t = 40 ms; (c) t = 60 ms; (d) t = 80 ms; (e) t = 100 ms; (f) t = 200 ms; (g) t = 400 ms; (h) t = 800 ms; (i) t = 1600 ms.
In general, the distribution of the impact pressure in the roadway is not decreasing along the way but rather alternating with the strength in the entire outburst process. According to gas dynamics, when high-speed airflow passes through a variable-cross-section structure, it generates a complex wave pattern of alternating expansion and compression waves distributed along the roadway [42,44,45]. This complex wave pattern causes impact pressure in straight roadways to form alternating strong and weak regions, as evidenced by the local peaks at F3–F4. In addition, disturbances in the turning structure substantially affect the distribution of strong and weak impact-pressure regions and their disaster-causing intensity.
Simultaneously, the different structures of the turning roadway make the impact distribution of a straight roadway before turning and a roadway after turning quite different. In the entire outburst process, only in the straight roadway in the early stage of outburst is the arc impact pressure greater than the non-arc impact pressure. In general, the impact pressure of the non-arc structure is higher than that of the arc structure. In the straight roadway, the disaster area of the non-arc structure stabilizes near the working face and the middle area of the roadway. However, the disaster area of the arc slowly transfers from the middle to the front of the roadway. After the turning structure, there is a sharp increase area of the impact pressure in both. On the other hand, the impact pressure in the sharply increased area under the non-arc condition is much higher than that under the arc condition. Therefore, the arc structure layout can effectively reduce the disaster-causing intensity of the coal–gas two-phase flow in a right-angle turning roadway.
4. Numerical Simulation Analysis Based on High Mach Number Flow Model
4.1. High Mach Number Flow Model
During the outburst process, the coupled effects of in situ stress and gas pressure lead to instantaneous instability and failure of the coal-rock mass. High-pressure gas rapidly desorbs and expands outward, with its flow exhibiting significant compressibility, and local regions may develop shock waves and supersonic jets [44,49]. Coal seam gas, the primary energy source of a CGO, directly shapes the CGO two-phase flow dynamic impact behavior to some extent. Thus, only gas-phase flow is simulated here, and solid coal particle motion is omitted. This simplification restricts an accurate reproduction of impact pressure characteristics within a turning roadway. On this basis, we will construct a gas–solid two-phase flow model to guide experiments and field applications more accurately.
Therefore, for the present gas-phase simulation, a high-Mach-number compressible flow model is adopted. This model, based on the Favre-averaged Navier–Stokes equations and coupled with the Spalart–Allmaras one-equation turbulence model, effectively captures the unsteady evolution of high-pressure gas within the roadway space during the outburst process, including high-speed propagation, accelerated expansion, and drastic variations in aerodynamic parameters (density, velocity, temperature, and pressure) [50].
4.1.1. Compressible Navier–Stokes Equations Based on Favre Averaging
The mass conservation equation is the continuity equation for compressible turbulence in the Favre-averaged framework, which is used to solve the mean density field [51]. This equation states that the local time rate of change in the average mass per unit volume is precisely balanced by the net mass flux outflow. During outburst airflow dynamics, density and velocity are strongly coupled. The transient terms and the convective terms in divergence form within the equation are essential for capturing strong compressible structures such as shock waves and expansion waves, ensuring that mass conservation holds in weak solution form even across shock discontinuities.
where is the average density (kg·m−3), and is the average velocity vector (m·s−1).
The momentum conservation equation represents Newton’s second law applied to the mean motion of compressible turbulent flows, which is used to solve for the mean velocity vector [52]. On the left-hand side are, in sequence, the local rate of change in momentum and the divergence of the momentum flux, where is the velocity dyadic and , when taken as the divergence of this dyadic, contributes the convective acceleration term. On the right-hand side are the pressure gradient and the divergence of the effective viscous force. Based on the Boussinesq eddy viscosity hypothesis, the Reynolds stress is modeled as an eddy viscosity term linearly related to the mean strain rate, following the standard implementation of the SA model while neglecting the isotropic turbulent kinetic energy term. The effective dynamic viscosity is taken as the sum of the molecular dynamic viscosity and the turbulent eddy viscosity coefficient with the volume expansion effect accounted for according to the Stokes assumption. This equation can uniformly describe the effects of molecular diffusion and turbulent mixing on momentum transport in high-speed gas flows, which is particularly suitable for strong shear layers formed by the interaction between gas-phase jets and roadway walls following outbursts.
where is the pressure (Pa), is the dynamic viscosity (Pa·s), is the turbulent eddy viscosity coefficient (Pa·s), is the average temperature (K), and is the unit tensor.
The total energy conservation equation, based on the first law of thermodynamics, uses specific total energy as the conserved variable to couple the solution of temperature and pressure fields. The left-hand side represents the local time rate of change in total energy density plus the convective transport of total enthalpy. The first term on the right-hand side accounts for the net input of work completed by effective viscous stresses on fluid elements, while the second term represents energy transport due to molecular conduction and turbulent heat diffusion. Turbulent heat flux is modeled using the gradient diffusion hypothesis, introducing a constant turbulent Prandtl number . Within the SA model framework, contributions from mean turbulent kinetic energy are neglected. This equation fully considers energy conversion during rapid gas expansion, shock heating, and wall conduction, forming the core equation for analyzing energy propagation and temperature disturbances in coal and gas outbursts.
where is the specific total energy (J·kg−1), is the specific total enthalpy (J·kg−1), is the thermal conductivity (W·m−1·K−1), is the specific heat capacity at constant pressure (J·kg−1·K−1), is the specific heat capacity at constant volume (J·kg−1·K−1), and is the turbulence Prandtl number.
4.1.2. Spalart–Allmaras Turbulent Variable Transport Equation
The Spalart–Allmaras turbulent variable transport equation represents the conservative form of the S-A one-equation turbulence model for compressible flows, with the transported variable used to determine the turbulent eddy viscosity , thereby closing the momentum and energy equations [53]. The left-hand side consists of the transient term and convective flux of . On the right-hand side, the four terms represent, in sequence, turbulent production driven by the modified vorticity , conservative diffusion including both molecular and turbulent contributions, cross-diffusion reflecting non-local pulsation propagation, and turbulent dissipation controlled by the wall distance in near-wall regions. In high-Mach-number flows, the transition function is often introduced to enhance computational robustness [54]. The single-equation structure of the SA model significantly reduces computational cost while maintaining accuracy in simulating near-wall turbulence, making it suitable for simulating gas-phase transport during coal and gas outburst processes.
where is the SA working variable (m2·s−1), is the modified vorticity (s−1), is the generation term coefficient, is the cross-diffusion coefficient, is the coefficient of the destructive term, is the turbulence diffusion constant, is the von Kármán constant, is the wall distance (m), is a transition function, and is a destruction function.
4.2. Geometric Model and Boundary Conditions
Research shows that the high Mach number flow model can more accurately characterize the gas movement state under high-speed flow [51]. During the process of a coal and gas outburst, the gas flow velocity can reach the transonic to supersonic range [49]. Therefore, this study, based on the high Mach number flow model, used COMSOL Multiphysics 5.6 software to simulate the migration and propagation characteristics of the outburst gas at different turning angles of 45°, 90° and 135° in order to reveal the influence of turning structures on the behavior of high-speed gas flow.
Take the outburst geometric model of the 90° turn structure as an example, as shown in Figure 11. The geometry model is divided into three parts: coal seam, outburst hole and roadway space. The length and width of the coal seam are 0.1 and 0.4 m, respectively, which can simulate the gas flow law in the area near outburst holes in the coal seam. The length and the width of the outburst hole are 0.2 and 0.03 m. The roadway space is composed of tapered flare and a turning roadway. The width of the roadway, the length of the straight line, and the length of the turning section are 0.4, 12.4, and 3.7 m, respectively. There are four measuring points in the roadway space to monitor the gas velocity and gas static pressure, which are v1(P1), v2(P2), v3(P3), and v4(P4), respectively. The boundary conditions are set as shown in Figure 11. It is worth noting that the inlet pressure value is determined by the measured curve of the gas pressure near the coal seam outburst hole in the experiment. Based on the figure, the process of the gas pressure drop is divided into two stages: rapid drop and slow drop. Moreover, there is a phenomenon of gas pressure rising in the process of falling, which is closer to the actual situation on site compared with setting a constant value.
Figure 11.
Geometric model of the outburst.
4.3. Comparison of Numerical Simulation Results with Experimental Data
Figure 12a plots the outburst shock wave travel distance versus time. Experimental and simulated propagation agree well, both following a linear trend and essentially reaching the straight roadway end at 35 ms. Figure 12b compares the along-path decay of experimental impact force with that of simulated airflow velocity. The roadway space was divided into four sections, yielding attenuation coefficients for impact pressure along the route of 2.47, 1.88, and 0.21. In the numerical simulations, the gas-phase velocity attenuation coefficients were 2.06, 1.36, and 0.37. This indicates that impact pressure attenuates faster than gas-phase velocity in straight roadways, while the growth rate is greater in turning roadways. This may be related to the influence of the solid phase. However, it is worth noting that in the numerical simulations, the attenuation trend of gas-phase velocity along the route is consistent with that of impact pressure with the attenuation coefficient gradually decreasing as distance increases.
Figure 12.
Comparison curve between numerical simulation data and experimental. (a) Outburst shock wave travel distance versus time; (b) Along-path decay of experimental impact force and simulated airflow velocity.
In summary, numerically simulated shock wave transport in the straight roadway deviates slightly from experimental data but remains broadly consistent. Although the simulated attenuation distribution for gas-phase velocity differs from that for experimental impact pressure, the overall decay trends are generally consistent. The consistent patterns observed in both experiment and simulation confirm the validity and reliability of the high Mach number fluid model for simulating fluid migration during coal and gas outbursts, and they provide a basis for future work.
4.4. Influence of the Turning Angle on the Outburst Gas Flow
4.4.1. Evolution of the Velocity
Figure 13 shows the velocity evolution law of the outburst gas flow at different turning angles (timeline and cloud chart). At measuring point v1 in the front of the straight roadway, the airflow velocity first increases rapidly to 482.5 m/s and decreases rapidly and fluctuates around 200 m/s for a long period when the turning angle is 45°. On the other hand, when the turning angles are 90° and 135°, the airflow velocity first increases rapidly to 561.9 and 565.9 m/s, respectively, then maintains the peak velocity and develops steadily for a long period, and last decreases rapidly and fluctuates approximately 200 m/s. By comparing the different turning angles, in the front of the straight roadway, the peak velocity increases gradually as the turning angle increases. However, when the peak velocity increases to a certain value, it will not change greatly as the turning angle increases. Simultaneously, the larger the turning angle, the longer the stable development time of the peak velocity. Note that no matter what the turning angle is, an apparent speed rebound will occur after the speed decreases.
Figure 13.
Velocity evolution law of outburst gas flow at different turning angles. (a) Time curve; (b) Distribution cloud map.
At measuring point v2 in the middle of the straight roadway, when the turning angles are 45° and 90°, the peak velocities at this point decrease sharply compared with the front end of the roadway, which are 236.3 and 234.6 m/s, respectively. When the turning angle is 135°, the peak velocity is 560.6 m/s, which is similar to the front of the roadway. However, its duration is reduced. At measuring point v3 at the tail of a straight roadway, the peak velocities at 45° and 90° continue to decrease. In addition, the peak velocity at 135° decreases, but it is much higher than that at 45° and 90°. Based on Figure 13a, at measuring point v4 of a roadway after turning, the velocities of turning angles of 45°, 90°, and 135° increase rapidly at first; then, they decrease and fluctuate at 100 m/s. The peak velocities are 424.2, 404.2, and 339.0 m/s, respectively. The peak velocity of a roadway after the turning decreases gradually as the turning angle increases.
In conclusion, the influence of turning angle on the speed for the straight roadway is much higher than that for the roadway after turning. In the straight roadway, the peak velocity and the action time of the peak velocity increase gradually as the turning angle increases. When the turning angle increases to a certain extent, the peak velocity does not change significantly, but the action time of the peak velocity is still different. Simultaneously, in the front of the straight roadway, the velocity difference under the three conditions is greater than that of the middle and back ends. At the middle and rear ends of the straight roadway, the velocity of 45° and 90° drop sharply, and the difference between them is gradually small. When the turning roadway is arranged into acute or right angles, it helps to reduce the dynamic pressure of airflow in the straight roadway. In the roadway after turning, the peak velocity of the roadway after turning decreases gradually as the turning angle increases. Note that when the turning angles are 45° and 90°, the airflow velocity increases sharply after the turning structure. Meanwhile, the airflow decreases gradually after passing through the turning structure when the turning angle is 135°. The turning layouts of both the acute and right angles effectively reduce the dynamic pressure disaster degree of the airflow in the straight roadway but improve the disaster degree in the roadway after the corner. On the contrary, an obtuse angle arrangement increases the dynamic pressure disaster degree of airflow in the straight roadway, and it gradually decreases along the whole turning roadway.
4.4.2. Evolution of the Static Pressure
Figure 14 shows the static pressure evolution law of the outburst gas flow at different turning angles (timeline and cloud chart). Note that the absolute pressure is adopted in this study, and the starting point of the static pressure is the standard atmospheric pressure of 101.325 kPa. When it is higher than this value, it is in the positive pressure state. On the other hand, it is in the negative pressure state when it is lower than this value. At the P1 measuring point in the front of the straight roadway, the static pressure at 45°, 90°, and 135° rapidly increases first to the peak of positive pressure, which is 207.2, 207.7, and 207.8 kPa, respectively. Subsequently, it rapidly decreased to the peak point of negative pressure, which is 10.8, 7.8, and 6.2 kPa, respectively. Then, it evolves stably near the peak value of negative pressure for a long period, and it finally rises rapidly and tends to a certain fixed value fluctuation. At the P2 measuring point in the middle of the straight roadway, the static pressure at 45° is in a positive pressure state, and the static pressure at 90° only has a negative pressure effect in the early stage. The evolution of static pressure at 135° is similar to that at P1, and the negative pressure action time is reduced. The peak positive pressures at 45°, 90°, and 135° are 200.4, 197.2, and 199.2 kPa, respectively. At the P3 measuring point at the end of the straight roadway, the static pressure at 45° and 90° is in the positive pressure state, and the peak positive pressures at 45°, 90°, and 135° are 218.1, 205.5, and 192.5 kPa, respectively. At the P4 measuring point after turning the roadway, the static pressure under the three conditions rises to the positive pressure peak first, then it falls to the negative pressure peak, and then slowly it rises to the standard atmospheric pressure. The peak positive and negative pressures at 45°, 90°, and 135° are 187.1, 184.8, and 187.7 kPa, respectively, and 32.0, 34.1, and 37.6 kPa, respectively.
Figure 14.
Static pressure evolution law of the outburst gas flow under different turning angles. (a) Time curve; (b) Distribution cloud map.
In summary, the damage caused by the static pressure is mainly reflected in less than 1.0 s after outburst. The disaster effect is not apparent when the static pressure rises to approximately the standard atmospheric pressure. When the gas static pressure is in the negative pressure state, the influence of turning angle is greater than when it is in a positive pressure state. The influence of the turning angle on the static pressure of the straight roadway is much higher than that of the roadway after turning. At the front of the straight roadway, the gas static pressure is mainly caused by negative pressure. With the increase in the turning angle, the peak value of the negative pressure and the action time of the peak negative pressure increase gradually. In the back end of the straight roadway, the positive pressure action time in the roadway increases gradually as the distance increases. When the turning angle is either an acute or right angle, the gas static pressure is mainly caused by the positive pressure. On the other hand, the positive pressure is as serious as the negative pressure when the turning angle is an obtuse angle. In the roadway after turning, the static pressure evolution of 45°, 90° and 135° is approximate, and the static pressure disaster intensity is lower than that of the straight roadway. The arrangement of the obtuse angle at the turning will increase the disaster degree of static pressure during the process of the outburst.
4.5. Limitations and Future Outlook
While these findings clarify gas–solid two-phase outburst dynamics in turning roadways, several limitations remain. Although the scaled system was designed according to similarity principles, it cannot reproduce in situ spatial variability or wall irregularities, nor can it establish fully developed flow conditions. In addition, each large-scale outburst test required a coal specimen measuring 1050 mm × 400 mm × 400 mm and weighing approximately 220 kg along with numerous sensors, complex and costly procedures, long preparation periods, and considerable safety hazards. Because outbursts are violent and sudden, the risk of test failure is high, and strictly repeated tests under identical conditions were not performed. Consequently, statistical repeatability is limited, and data scatter, measurement uncertainty, and error estimates are not adequately constrained. Future work should thus adopt feasible repeated-test designs and formal uncertainty analyses.
Likewise, the present computational framework accounts only for the gas phase and does not resolve particulate motion. This simplification is partly justified by the dominant role commonly attributed to gas expansion energy in the CGO and by the considerable difficulty of resolving dense gas–solid turbulence under abrupt transient conditions. Nevertheless, its implications should be interpreted with caution. In dense coal particle-gas flows, pulverized coal particles can affect gas-flow dynamics through momentum exchange, turbulence modulation, local blockage, energy dissipation, and impact pressure generation. Because these particle-scale processes are not represented in the model, the CFD results should be understood primarily as gas-phase estimates that reveal underlying physical mechanisms and comparative trends rather than as broadly applicable quantitative predictions of two-phase outburst behavior. In particular, predictions of pressure evolution, gas velocity, and impact pressure should be treated as indicative of gas-phase behavior and may deviate from those in dense gas–solid systems, especially under high particle loading or severe transient conditions. Future investigations should therefore prioritize both the development of coupled gas-particle models capable of resolving dense gas–solid turbulence in severe CGO scenarios and the systematic examination of more realistic roadway geometries to assess how particle transport, local blockage, and momentum coupling alter outburst dynamics.
5. Conclusions
The main conclusions of this study are as follows:
- (1)
- The pulverized coal after outburst is mainly composed of particles with a particle size less than 0.15 mm. Different turning structures will affect the distribution of pulverized coal mass in roadways. The non-arc structure makes a large amount of pulverized coal accumulation at the end of the straight roadway, showing the increasing (first), decreasing, and then increasing distribution characteristics. The arc structure shows the increasing and decreasing in the distribution characteristics. Moreover, different turning structures affect the passing ability of different particle sizes of pulverized coal to the right-angle roadway. Only small-size pulverized coal enters the roadway after turning under non-arc conditions in the process of coal–gas two-phase flow migration. The arc structure helps in promoting the passing ability of pulverized coal, especially the large-size pulverized coal, compared with the non-arc structure.
- (2)
- In the straight roadway, the impact pressure of a non-arc structure is generally higher than that of an arc structure. However, the evolution trend of an impact pressure is similar. In the roadway after turning, the impact pressure of non-arc and arc structures at some measuring points rises sharply, resulting in the sharp increase in the impact pressure. The steep increase in the non-arc impact pressure is much higher than that of the arc. In the entire outburst process, the impact pressure in the roadway shows strong–weak alternating distribution characteristics. In summary, the existence of the right-angle roadway enhances the harm of the outburst, and the arc structure arrangement can effectively reduce the disaster-causing intensity of coal–gas two-phase flow in the right-angle roadway.
- (3)
- After turning, the influence of the turning angle on the velocity and static pressure of a straight roadway is higher than that of a roadway. The airflow velocity increases sharply after passing through the turning structure only when the turning angles are 45° and 90°. The arrangement of acute and right angles effectively reduces the disaster intensity of airflow dynamic pressure in a straight roadway, while it improves the disaster intensity of airflow dynamic pressure in a roadway after turning. The influence of the turning angle is greater than that of the positive pressure state when the gas static pressure is in the negative pressure state. The obtuse angle arrangement will increase the disaster intensity of static pressure in the process of an outburst.
Author Contributions
L.C.: Methodology, Writing—original draft, Funding acquisition. J.L.: Software, Writing—review and editing. B.Z.: Investigation, Writing—review and editing. H.S.: Conceptualization, Resources, Funding acquisition. J.X.: Methodology, Project administration. S.L.: Validation, Supervision. S.P.: Methodology, Validation. Q.L.: Data curation, Funding acquisition. All authors have read and agreed to the published version of the manuscript.
Funding
This work was financially supported by the National Natural Science Foundation of China (Grant No. 52304224, 52604364), the Natural Science Foundation of Shaanxi Province, China (Grant No. 2025JC-YBQN-658, 2025JC-YBMS-369), and the Education Department of Shaanxi Province, China (Grant No. 24JK0546).
Data Availability Statement
The original contributions presented in the study are included in the article. Further inquiries can be directed to the corresponding authors.
Acknowledgments
Financial support for this study from the National Natural Science Foundation of China; the Natural Science Foundation of Shaanxi Province, China; and the Education Department of Shaanxi Province, is gratefully acknowledged.
Conflicts of Interest
The authors declare no conflict of interest.
Abbreviations
The following abbreviations are used in this manuscript:
| CGO | Coal and gas outburst |
References
- Kuznetsov, G.V.; Syrodoy, S.V.; Zamaltdinov, R.R.; Kostoreva, Z.A.; Borisov, B.V.; Nigay, N.A.; Gutareva, N.Y.; Tamashevich, M.S. Influence of the velocity gradient of the carrier medium on the crushing characteristics of non-Newtonian liquid droplets on the example of a highly concentrated coal-water suspension. Exp. Therm. Fluid Sci. 2026, 171, 111598. [Google Scholar] [CrossRef] [Scilit]
- Zhang, M.; Liu, P.; Zhang, L.; Zhou, A.; Li, B.; Zhang, X. The size effect of chamber on the dynamic characteristics of coal and gas outburst. Fuel 2025, 389, 134628. [Google Scholar] [CrossRef] [Scilit]
- Hu, B.; Lei, X.; Zhang, L.; Long, H.; Ji, P.; Wang, L.; Ding, Y.; Wang, C. Study on Gas Pre-Extraction Law of Along-Layer Boreholes Based on Thermo-Hydro-Mechanical-Damage Coupled Model. Mathematics 2025, 13, 3375. [Google Scholar] [CrossRef] [Scilit]
- Gao, M.; Li, Q.; Yang, Y. Study on the energy evolution characteristics of coal-rock combined bodies under uniaxial compression. Results Eng. 2025, 26, 105361. [Google Scholar] [CrossRef] [Scilit]
- Wang, C.; Zhou, B.; Li, S.; Lin, H.; Shuang, H.; Zhang, D.; Peng, S.; Cheng, L.; Yang, H. Dominant governing mechanisms of deformation-seepage and dynamic evolution model of permeability in gas-containing coal under coupled stress-pore pressure. Fuel 2026, 404, 136408. [Google Scholar] [CrossRef] [Scilit]
- Zhang, X.; Tang, J.; Pan, Y.; Ren, L.; Huang, L.; Zhang, Z. Experimental study on compound dynamic disaster in deep coal rock under gas and stress loading and unloading. Adv. Geo-Energy Res. 2025, 16, 60–76. [Google Scholar] [CrossRef] [Scilit]
- Wang, D.; Cheng, Y.; Yuan, L.; Wang, L.; Zhou, H. Experimental Study of Multiple Physical Properties of Tectonic Coal near a Minor Fault: Implications for Coal and Gas Outburst. Energy Fuels 2023, 37, 5878–5894. [Google Scholar] [CrossRef] [Scilit]
- Shu, X.; He, D.; Ren, K.; Wang, H.; Shi, T.; Lei, M. Target-Free Multi-Source Domain Adaptation with Data-Augmented Triplet-Aware Learning for Coal Moisture Prediction. Mathematics 2026, 14, 790. [Google Scholar] [CrossRef] [Scilit]
- Zhang, W.; He, M.; Wang, J. Study on deformation and energy of coal and gas outburst coal seam mined without coal pillar. Bull. Eng. Geol. Environ. 2025, 85, 17. [Google Scholar] [CrossRef] [Scilit]
- Hou, W.; Wang, H.; Yuan, L.; Wang, W.; Xue, Y.; Ma, Z. Experimental research into the effect of gas pressure, particle size and nozzle area on initial gas-release energy during gas desorption. Int. J. Min. Sci. Technol. 2021, 31, 253–263. [Google Scholar] [CrossRef] [Scilit]
- Lei, Y.; Cheng, Y.; Ren, T.; Tu, Q.; Shu, L.; Li, Y. The Energy Principle of Coal and Gas Outbursts: Experimentally Evaluating the Role of Gas Desorption. Rock Mech. Rock Eng. 2020, 54, 11–30. [Google Scholar] [CrossRef] [Scilit]
- Zhang, J.; Fang, Z.; Zhang, X.; Wang, S.; Cao, Y.; Lutynski, M. Coupling characteristics of crack propagation-energy dissipation-damage evolution of coal-like material under impact loading. Results Eng. 2025, 28, 107333. [Google Scholar] [CrossRef] [Scilit]
- Meng, H.; Yang, Y.; Guo, H.; Hou, W.; Li, X.; An, F.; Zhang, R.; Chen, L.; Rong, T.; Yang, D.; et al. Experimental investigation on the gas pressure influence laws and mechanical mechanism of coal and gas outbursts. Phys. Fluids 2024, 36, 096614. [Google Scholar] [CrossRef] [Scilit]
- Ren, L.; Tang, J.; Pan, Y.; Yang, S. Outburst Precursor Characteristics of Loaded Coal: Analysis of Coal Damage and Fracture Degree from the Perspective of Energy. Rock Mech. Rock Eng. 2024, 57, 11223–11237. [Google Scholar] [CrossRef] [Scilit]
- Zhang, R.; Kang, J.; Zhou, F.; Peng, C.; Wang, Y. Gas desorption characteristics of coal particles under dynamic temperature changes: Implication for the lost gas estimation during borehole coal sampling. Measurement 2024, 237, 115278. [Google Scholar] [CrossRef] [Scilit]
- Zhang, C.; Wang, Y.; Wang, E.; Zhou, X.; Wang, P.; Zeng, W. Influence of coal seam gas pressure on the propagation mechanism of outburst two-phase flow in visual roadway. Fuel 2022, 322, 124296. [Google Scholar] [CrossRef] [Scilit]
- Tu, Q.; Cheng, Y.; Liu, Q.; Guo, P.; Wang, L.; Li, W.; Jiang, J. Investigation of the formation mechanism of coal spallation through the cross-coupling relations of multiple physical processes. Int. J. Rock Mech. Min. Sci. 2018, 105, 133–144. [Google Scholar] [CrossRef] [Scilit]
- Yang, D.; Chen, Y.; Tang, J.; Li, X.; Jiang, C.; Wang, C.; Zhang, C. Experimental research into the relationship between initial gas release and coal-gas outbursts. J. Nat. Gas Sci. Eng. 2018, 50, 157–165. [Google Scholar] [CrossRef] [Scilit]
- Valliappan, S.; Zhang, W.H. Role of gas energy during coal outbursts. Int. J. Numer. Methods Eng. 1999, 44, 875–895. [Google Scholar] [CrossRef] [Scilit]
- Wang, C.; Yang, S.; Yang, D.; Li, X.; Jiang, C. Experimental analysis of the intensity and evolution of coal and gas outbursts. Fuel 2018, 226, 252–262. [Google Scholar] [CrossRef] [Scilit]
- Tu, Q.; Cheng, Y.; Xue, S.; Ren, T. Effect of particle size on gas energy release for tectonic coal during outburst process. Fuel 2022, 307, 121888. [Google Scholar] [CrossRef] [Scilit]
- Tu, Q.; Xue, S.; Cheng, Y.; Zhang, W.; Shi, G.; Zhang, G. Experimental study on the contribution of desorbed gas to the propagation and disaster-causing of coal-gas outbursts. Fuel 2022, 309, 122087. [Google Scholar] [CrossRef] [Scilit]
- Tian, X.; Song, D.; He, X.; Li, Z.; Liu, H.; Wang, W. Investigation on micro-surface adhesion of coals and implications for gas occurrence and coal and gas outburst mechanism. J. Nat. Gas Sci. Eng. 2021, 94, 104115. [Google Scholar] [CrossRef] [Scilit]
- Zhao, Y.; Lin, B.; Liu, T.; Zheng, Y.; Kong, J.; Li, Q.; Song, H. Mechanism of multifield coupling-induced outburst in mining-disturbed coal seam. Fuel 2020, 272, 117716. [Google Scholar] [CrossRef] [Scilit]
- Xue, S.; Yuan, L.; Wang, Y.C.; Xie, J. Numerical Analyses of the Major Parameters Affecting the Initiation of Outbursts of Coal and Gas. Rock Mech. Rock Eng. 2014, 47, 1505–1510. [Google Scholar] [CrossRef] [Scilit]
- Kursunoglu, N.; Onder, M. Application of structural equation modeling to evaluate coal and gas outbursts. Tunn. Undergr. Space Technol. 2019, 88, 63–72. [Google Scholar] [CrossRef] [Scilit]
- Xie, G.; Yin, Z.; Wang, L.; Hu, Z.; Zhu, C. Effects of Gas Pressure on the Failure Characteristics of Coal. Rock Mech. Rock Eng. 2017, 50, 1711–1723. [Google Scholar] [CrossRef] [Scilit]
- Zhou, B.; Xu, J.; Peng, S.; Yan, F.; Yang, W.; Cheng, L.; Ni, G. Influence of Geo-stress on Dynamic Response Characteristics of Coal and Gas Outburst. Rock Mech. Rock Eng. 2020, 53, 4819–4837. [Google Scholar] [CrossRef] [Scilit]
- Wang, K.; Du, F. Coal-gas compound dynamic disasters in China: A review. Process Saf. Environ. Prot. 2020, 133, 1–17. [Google Scholar] [CrossRef] [Scilit]
- Zhang, M.; Yin, T.; Wang, K.; Zhou, A.; Cao, X.; Li, B.; Zhang, X. The size effect of pressure-relief roadway on coal-gas outburst dynamics. Case Stud. Therm. Eng. 2026, 80, 107917. [Google Scholar] [CrossRef] [Scilit]
- Wang, K.; Zhang, X.; Wang, L.; Li, L.; Zhang, M.; Zhou, A. Experimental study on propagation law of shock wave and airflow induced by coal and gas outburst in mine ventilation network. Process Saf. Environ. Prot. 2021, 151, 299–310. [Google Scholar] [CrossRef] [Scilit]
- Zhou, A.; Zhang, M.; Wang, K.; Zhang, X.; Feng, T. Quantitative study on gas dynamic characteristics of two-phase gas-solid flow in coal and gas outbursts. Process Saf. Environ. Prot. 2020, 139, 251–261. [Google Scholar] [CrossRef] [Scilit]
- Zhou, A.; Zhang, M.; Wang, K.; Elsworth, D.; Wang, J.; Fan, L. Airflow disturbance induced by coal mine outburst shock waves: A case study of a gas outburst disaster in China. Int. J. Rock Mech. Min. Sci. 2020, 128, 104262. [Google Scholar] [CrossRef] [Scilit]
- Zhou, A.; Zhang, M.; Wang, K.; Elsworth, D. Near-source characteristics of two-phase gas–solid outbursts in roadways. Int. J. Coal Sci. Technol. 2020, 8, 685–696. [Google Scholar] [CrossRef] [Scilit]
- Zhou, A.; Zhang, M.; Wang, K.; Elsworth, D.; Deng, N.; Hu, J. Rapid gas desorption and its impact on gas-coal outbursts as two-phase flows. Process Saf. Environ. Prot. 2021, 150, 478–488. [Google Scholar] [CrossRef] [Scilit]
- Cao, J.; Hu, Q.; Dai, L.; Yang, X. Experimental study on the transporting and crushing effect of gas on coal powder during the develop stage of coal and gas outburst in roadway. Sci. Rep. 2023, 13, 18792. [Google Scholar] [CrossRef] [Scilit]
- Sun, D.; Cao, J.; Dai, L.; Li, R.; Liu, Y. Investigation of Formation Process and Intensity of Coal and Gas Outburst Shockwave. Processes 2023, 11, 659. [Google Scholar] [CrossRef] [Scilit]
- Jin, K.; Cheng, Y.; Ren, T.; Zhao, W.; Tu, Q.; Dong, J.; Wang, Z.; Hu, B. Experimental investigation on the formation and transport mechanism of outburst coal-gas flow: Implications for the role of gas desorption in the development stage of outburst. Int. J. Coal Geol. 2018, 194, 45–58. [Google Scholar] [CrossRef] [Scilit]
- Zhao, W.; Cheng, Y.; Guo, P.; Jin, K.; Tu, Q.; Wang, H. An analysis of the gas-solid plug flow formation: New insights into the coal failure process during coal and gas outbursts. Powder Technol. 2017, 305, 39–47. [Google Scholar] [CrossRef] [Scilit]
- Cheng, L.; Yang, H.; Xu, J.; Li, S.; Shuang, H.; Hu, B.; Yang, Z. Effect of branch roadways on dynamic disaster-causing and energy dissipation characteristics of outburst gas-solid two-phase flow. Sci. Rep. 2026, 16, 20205. [Google Scholar] [CrossRef] [Scilit]
- Xu, J.; Wang, X.; Cheng, L.; Peng, S.; Yang, H.; Zhou, B.; Jiao, F. Experimental study on the influence of roadway shape on the evolution of outburst fluid static pressure. Int. J. Coal Sci. Technol. 2024, 11, 59. [Google Scholar] [CrossRef] [Scilit]
- Zhou, B.; Xu, J.; Peng, S.; Yan, F.; Yang, W.; Cheng, L.; Ni, G. Experimental Analysis of the Dynamic Effects of Coal–Gas Outburst and a Protean Contraction and Expansion Flow Model. Nat. Resour. Res. 2019, 29, 1617–1637. [Google Scholar] [CrossRef] [Scilit]
- Zhou, B.; Xu, J.; Peng, S.; Yan, F.; Gao, Y.; Li, Q.; Cheng, L. Effects of geo-stress on the dynamic response of multi-physical field parameters during coal and gas outbursts under true triaxial stress. Int. J. Rock Mech. Min. Sci. 2021, 142, 104759. [Google Scholar] [CrossRef] [Scilit]
- Zhou, B.; Xu, J.; Yan, F.; Peng, S.; Gao, Y.; Li, Q.; Cheng, L. Effects of gas pressure on dynamic response of two-phase flow for coal–gas outburst. Powder Technol. 2021, 377, 55–69. [Google Scholar] [CrossRef] [Scilit]
- Cheng, L.; Zhou, B.; Xu, J.; Li, S.; Lin, H.; Peng, S.; Hu, B.; Li, Q. Study on the evolution characteristics of dynamic behavior and two-phase flow migration mechanism in coal and gas outburst disasters. Geomech. Geophys. Geo-Energy Geo-Resour. 2026, 12, 125. [Google Scholar] [CrossRef] [Scilit]
- Kong, L. Two-Phase Fluid Mechanics; Higher Education Press: Beijing, China, 2004. [Google Scholar]
- Xu, P. Investigation on Gas-Solid Flow Characteristics of High Pressure Dense Phase Pneumatic Conveying. Ph.D. Thesis, Southeast University, Nanjing, China, 2019. [Google Scholar]
- Luo, J. Study on Energy Source and Energy Dissipation Mechanism of Coal and Gas Outburst. Ph.D. Thesis, Chongqing University, Chongqing, China, 2016. [Google Scholar]
- Cheng, L.; Xu, J.; Peng, S.; Yang, H.; Jiao, F.; Zhou, B.; Yan, F. Dynamic behavior of outburst two-phase flow in a coal mine T-shaped roadway: The formation of impact airflow and its disaster-causing effect. Int. J. Min. Sci. Technol. 2023, 33, 1001–1017. [Google Scholar] [CrossRef] [Scilit]
- Anderson, J.D. Modern Compressible Flow; McGraw-Hill: Boston, MA, USA, 2003. [Google Scholar]
- Cheng, L.; Xu, J.; Peng, S.; Qin, L.; Yan, F.; Bai, Y.; Zhou, B. Influence of Different Coal Seam Gas Pressures and their Pulse Characteristics on Coal-and-gas Outburst Impact Airflow. Nat. Resour. Res. 2022, 31, 2749–2767. [Google Scholar] [CrossRef] [Scilit]
- Bazdidi-Tehrani, F.; Abouata, A.; Hatami, M.; Bohlooli, N. Investigation of effects of compressibility, geometric and flow parameters on the simulation of a synthetic jet behaviour. Aeronaut. J. 2016, 120, 521–546. [Google Scholar] [CrossRef] [Scilit]
- Cakmakcioglu, S.C.; Bas, O.; Kaynak, U. A correlation-based algebraic transition model. Proc. Inst. Mech. Eng. Part C J. Mech. Eng. Sci. 2017, 232, 3915–3929. [Google Scholar] [CrossRef] [Scilit]
- Bourgoin, A.; El Kadi Abderrezzak, K.; Benhamadouche, S.; Ata, R. An adoption of the Spalart–Allmaras turbulence model for two- and three-dimensional free surface environmental flows. J. Hydraul. Res. 2020, 59, 314–328. [Google Scholar] [CrossRef] [Scilit]
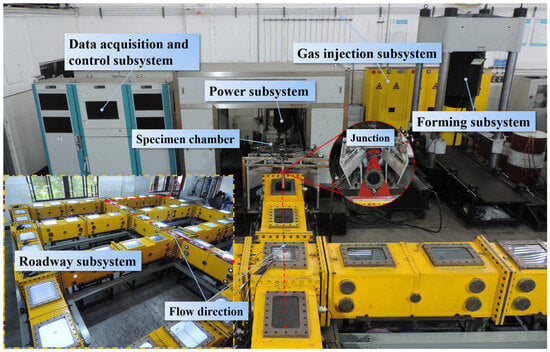
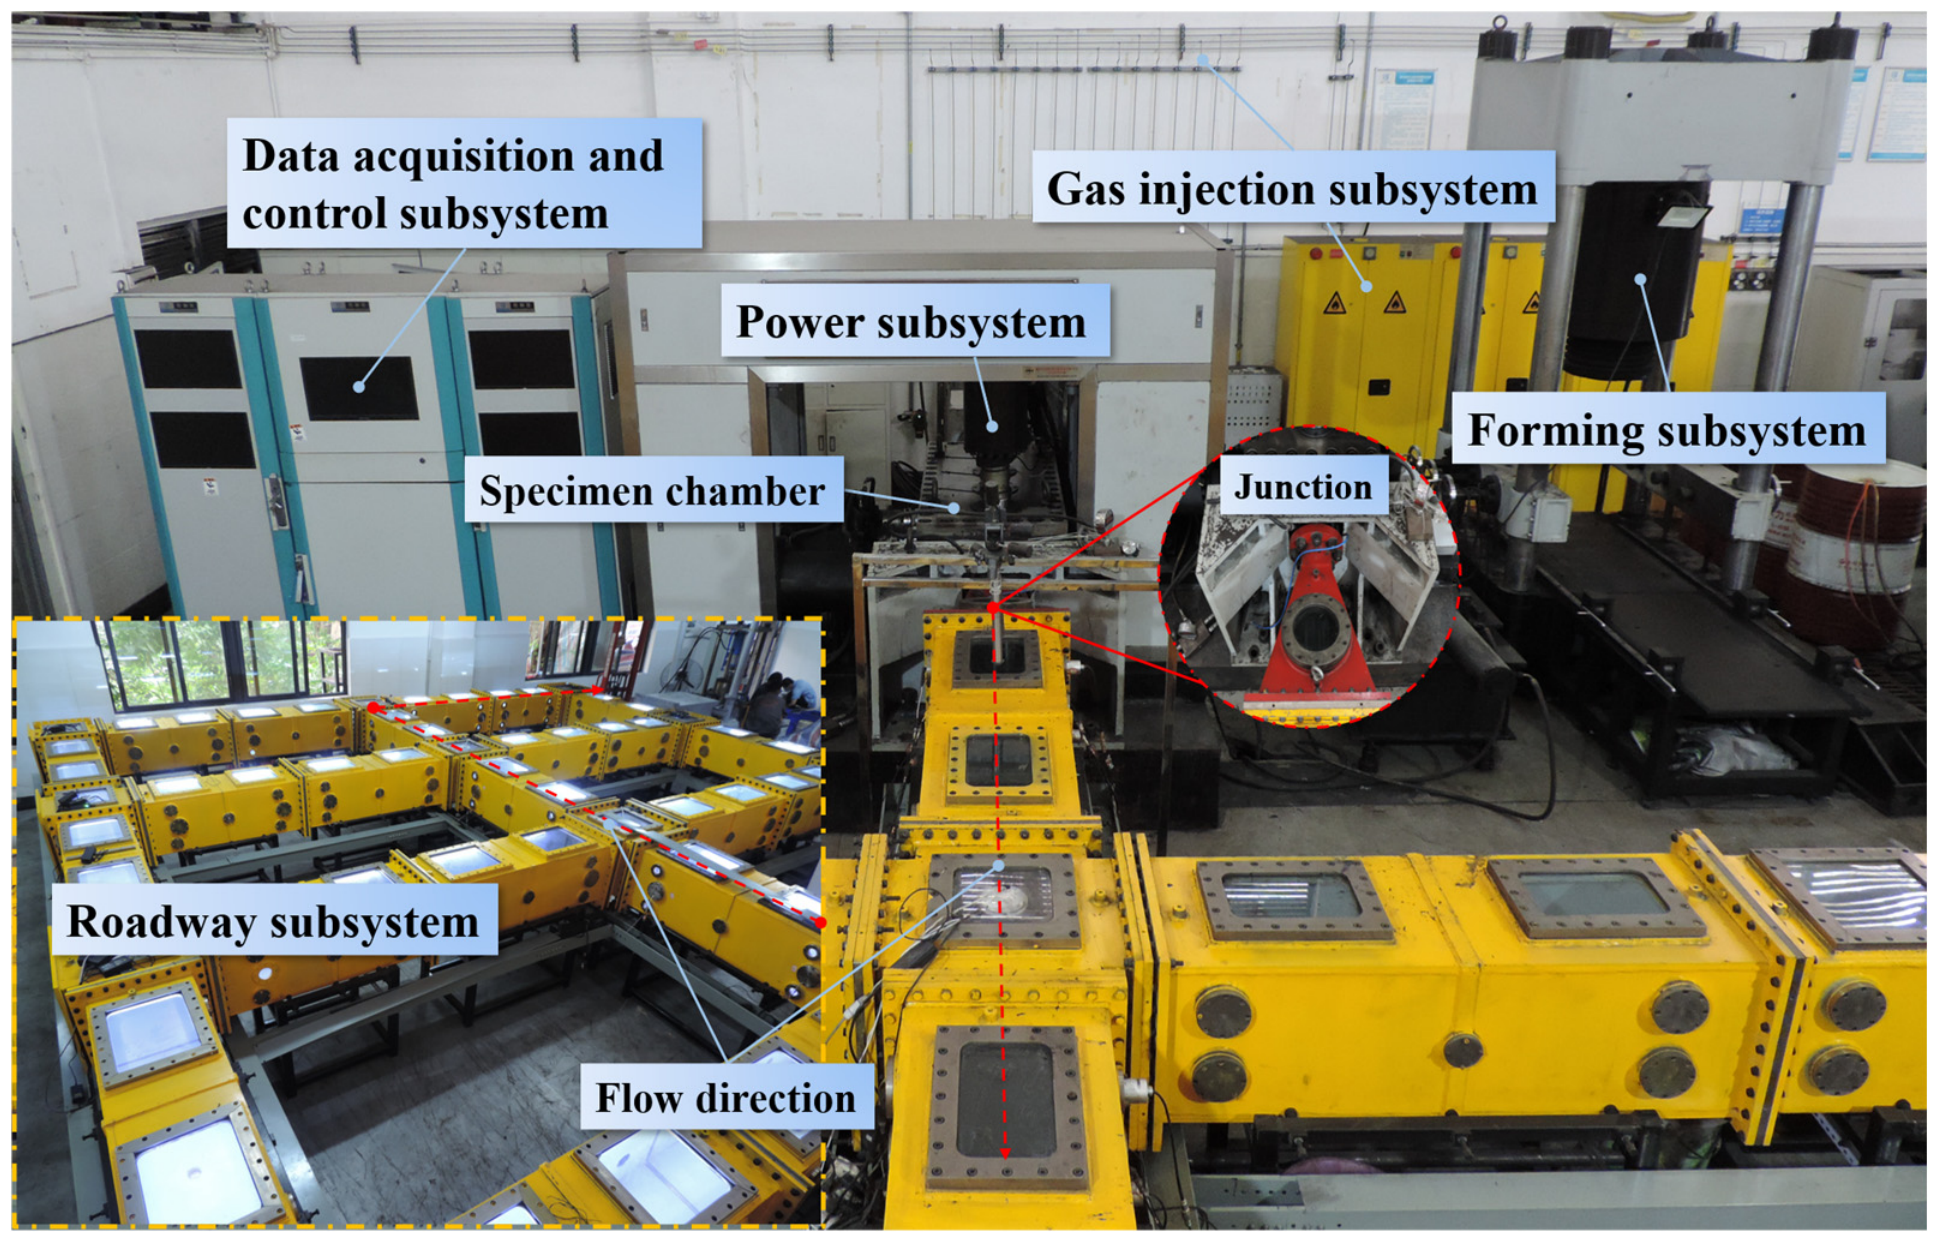
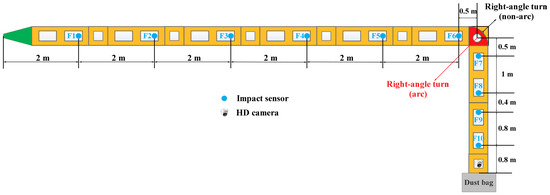
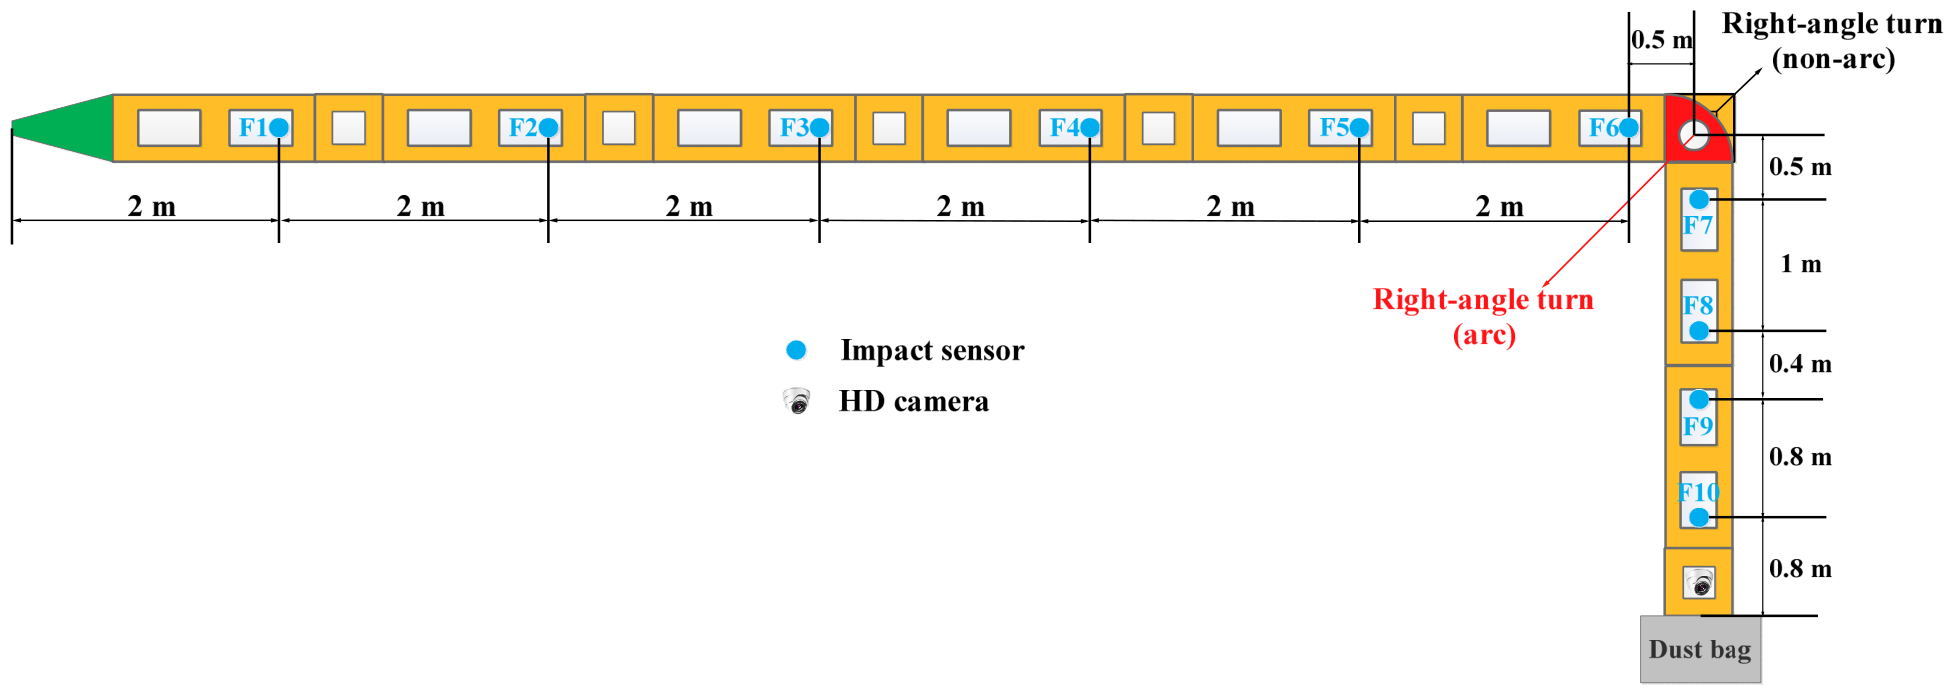
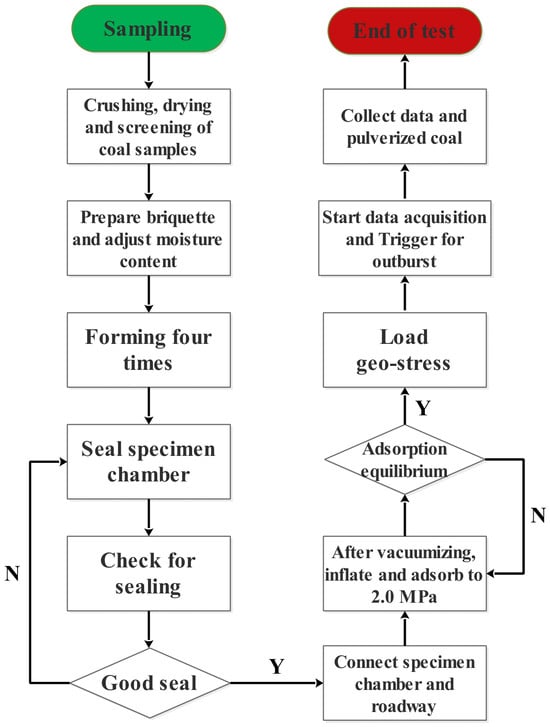
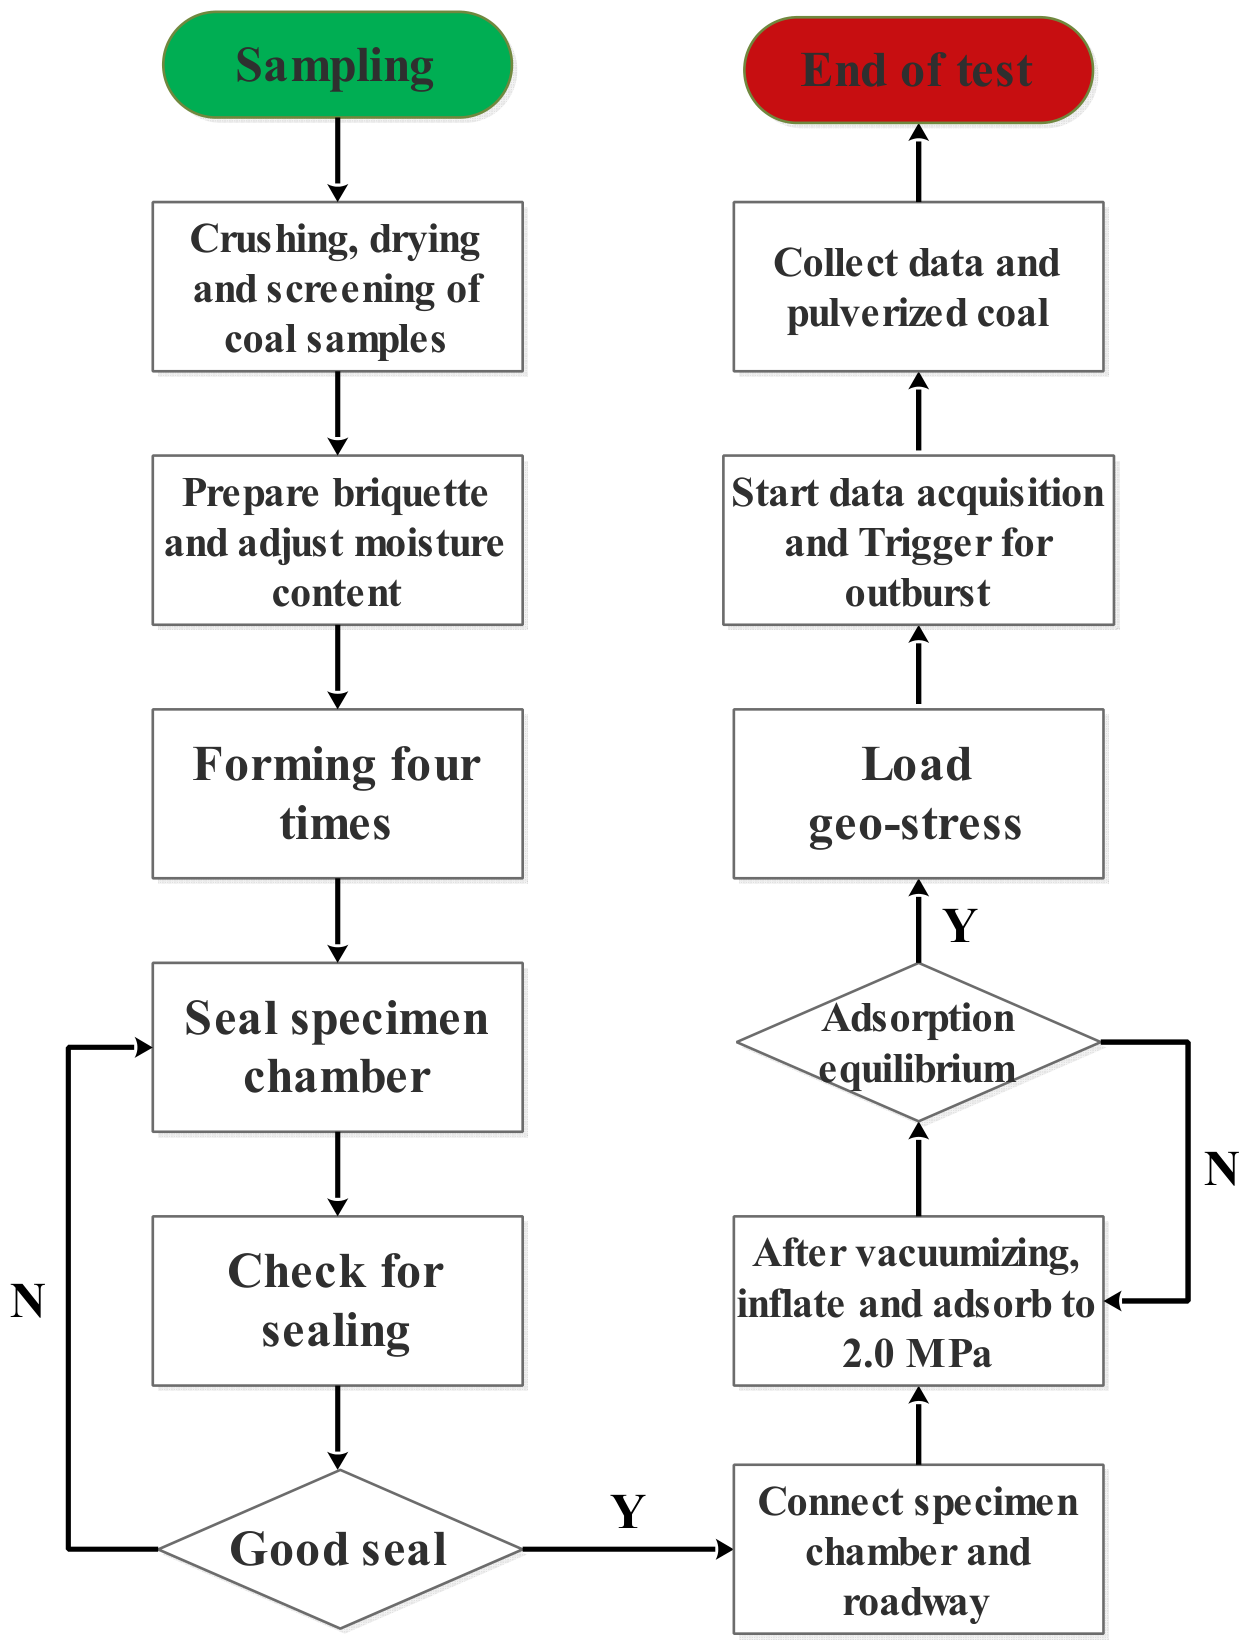
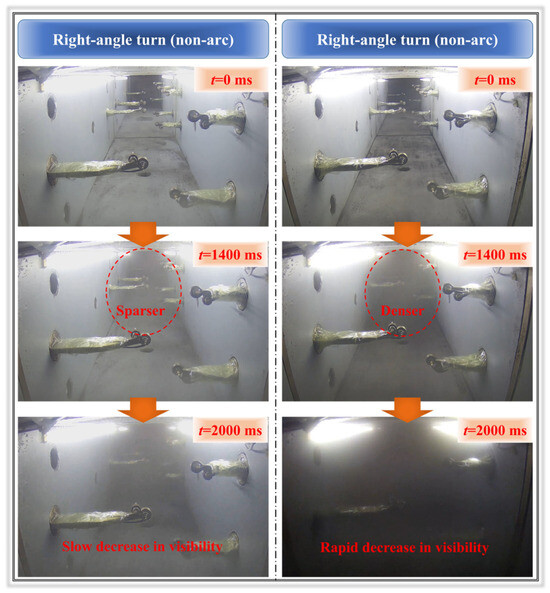
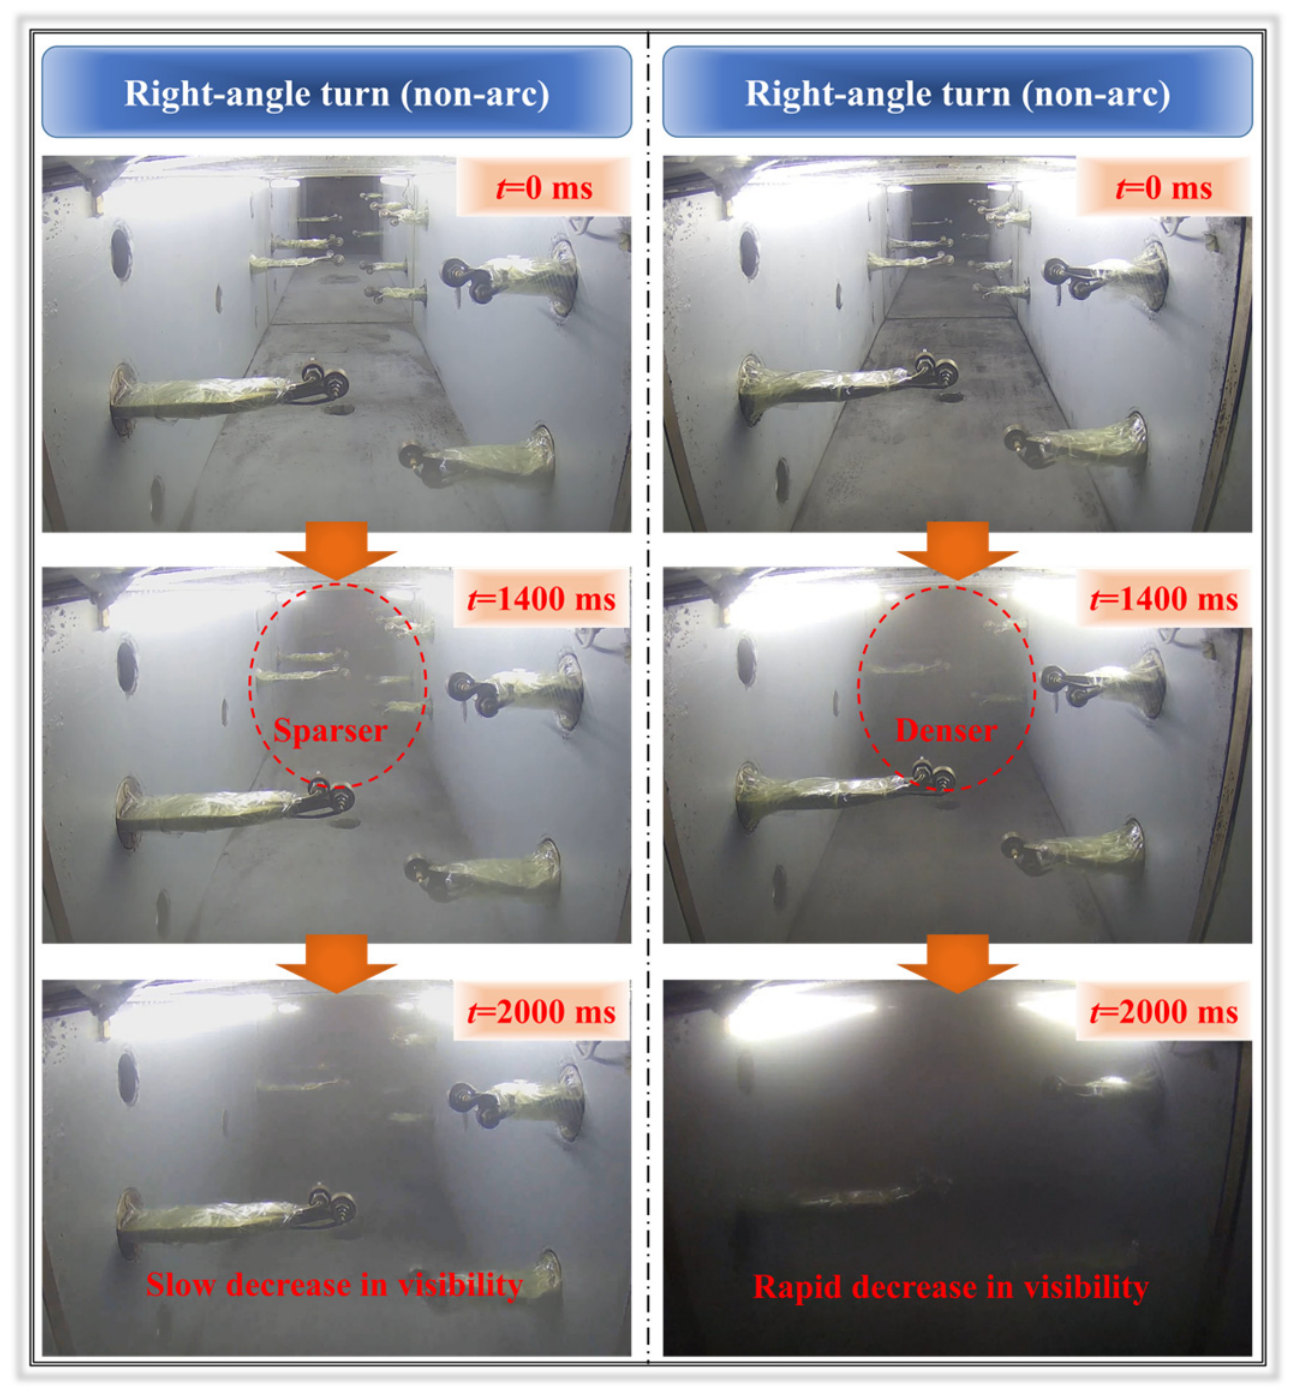
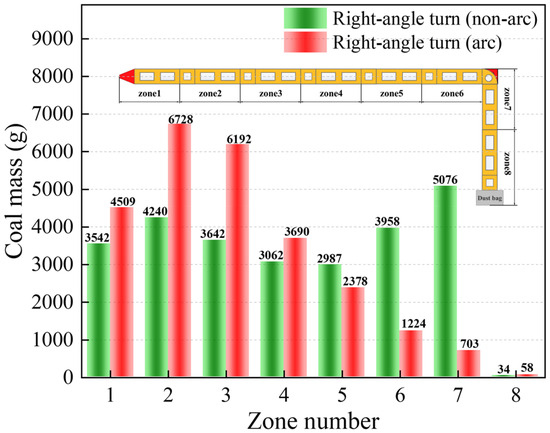
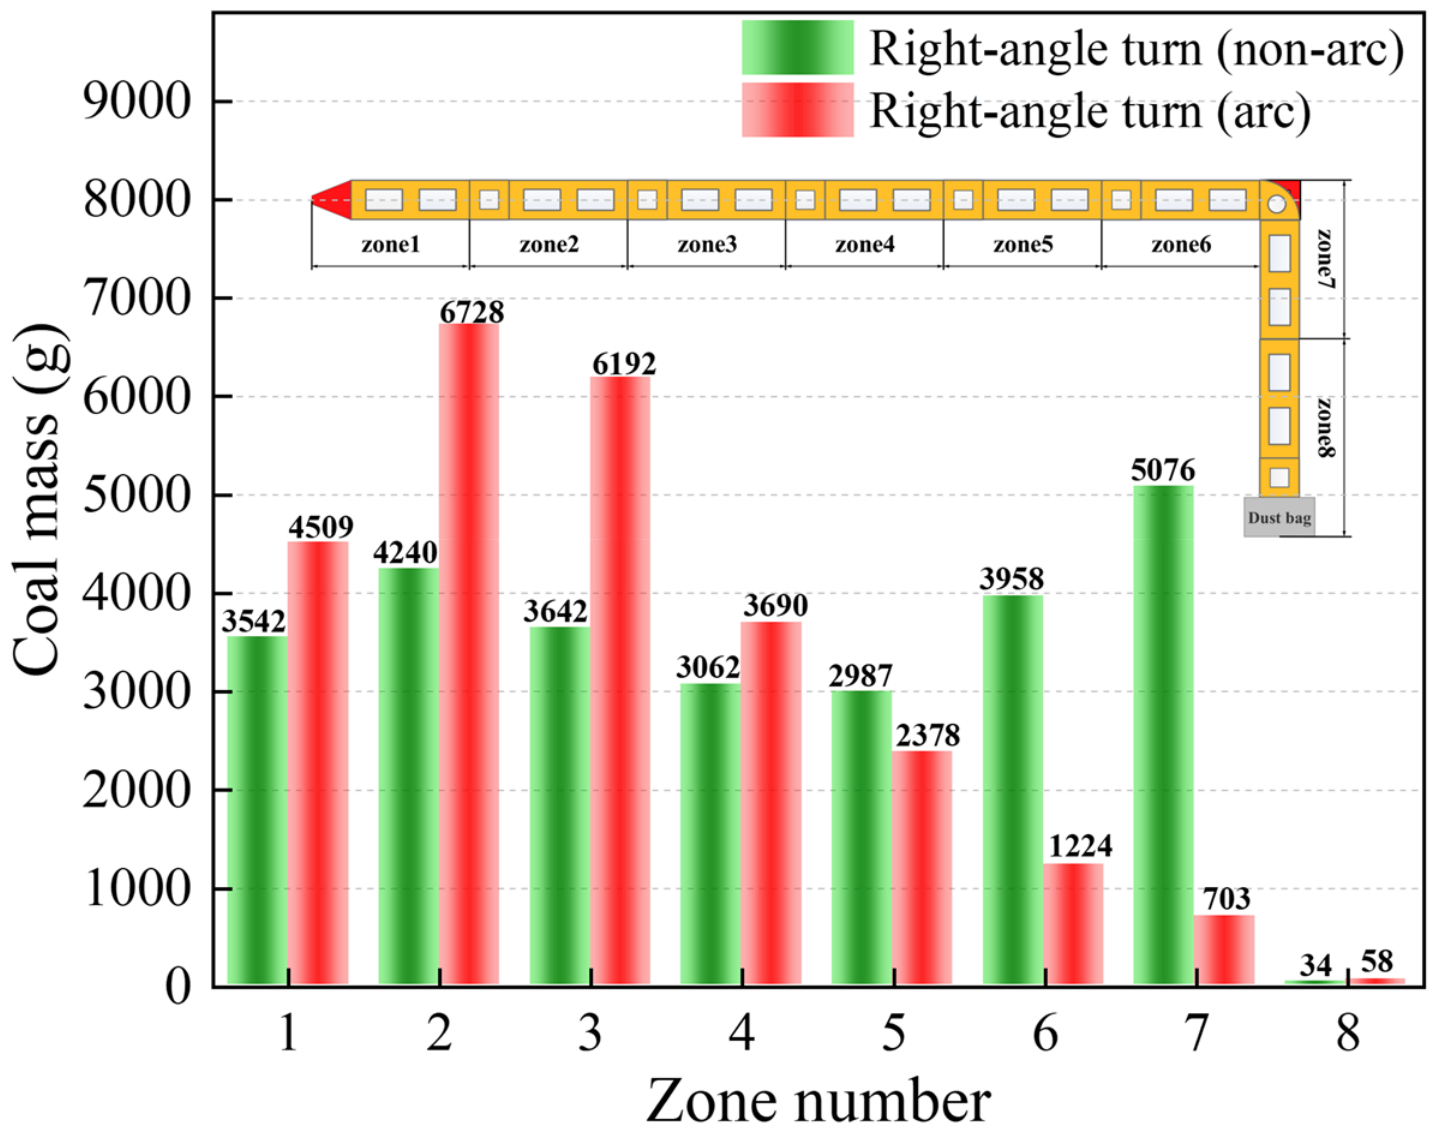
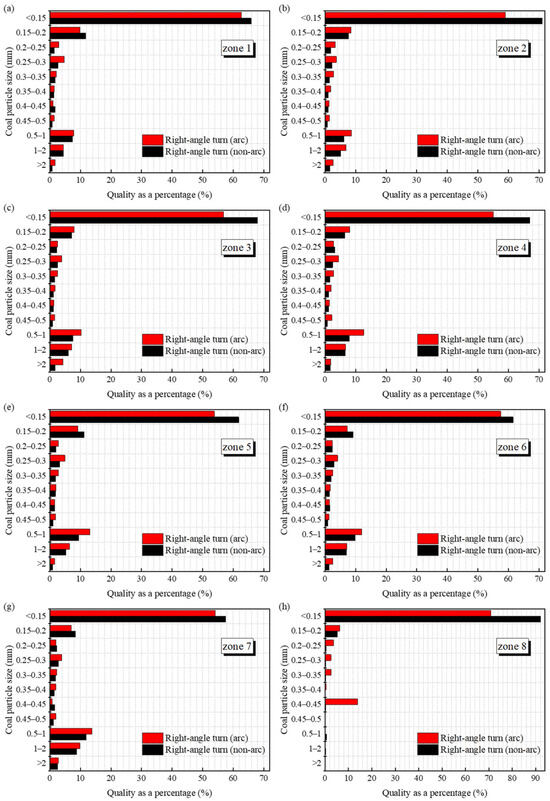
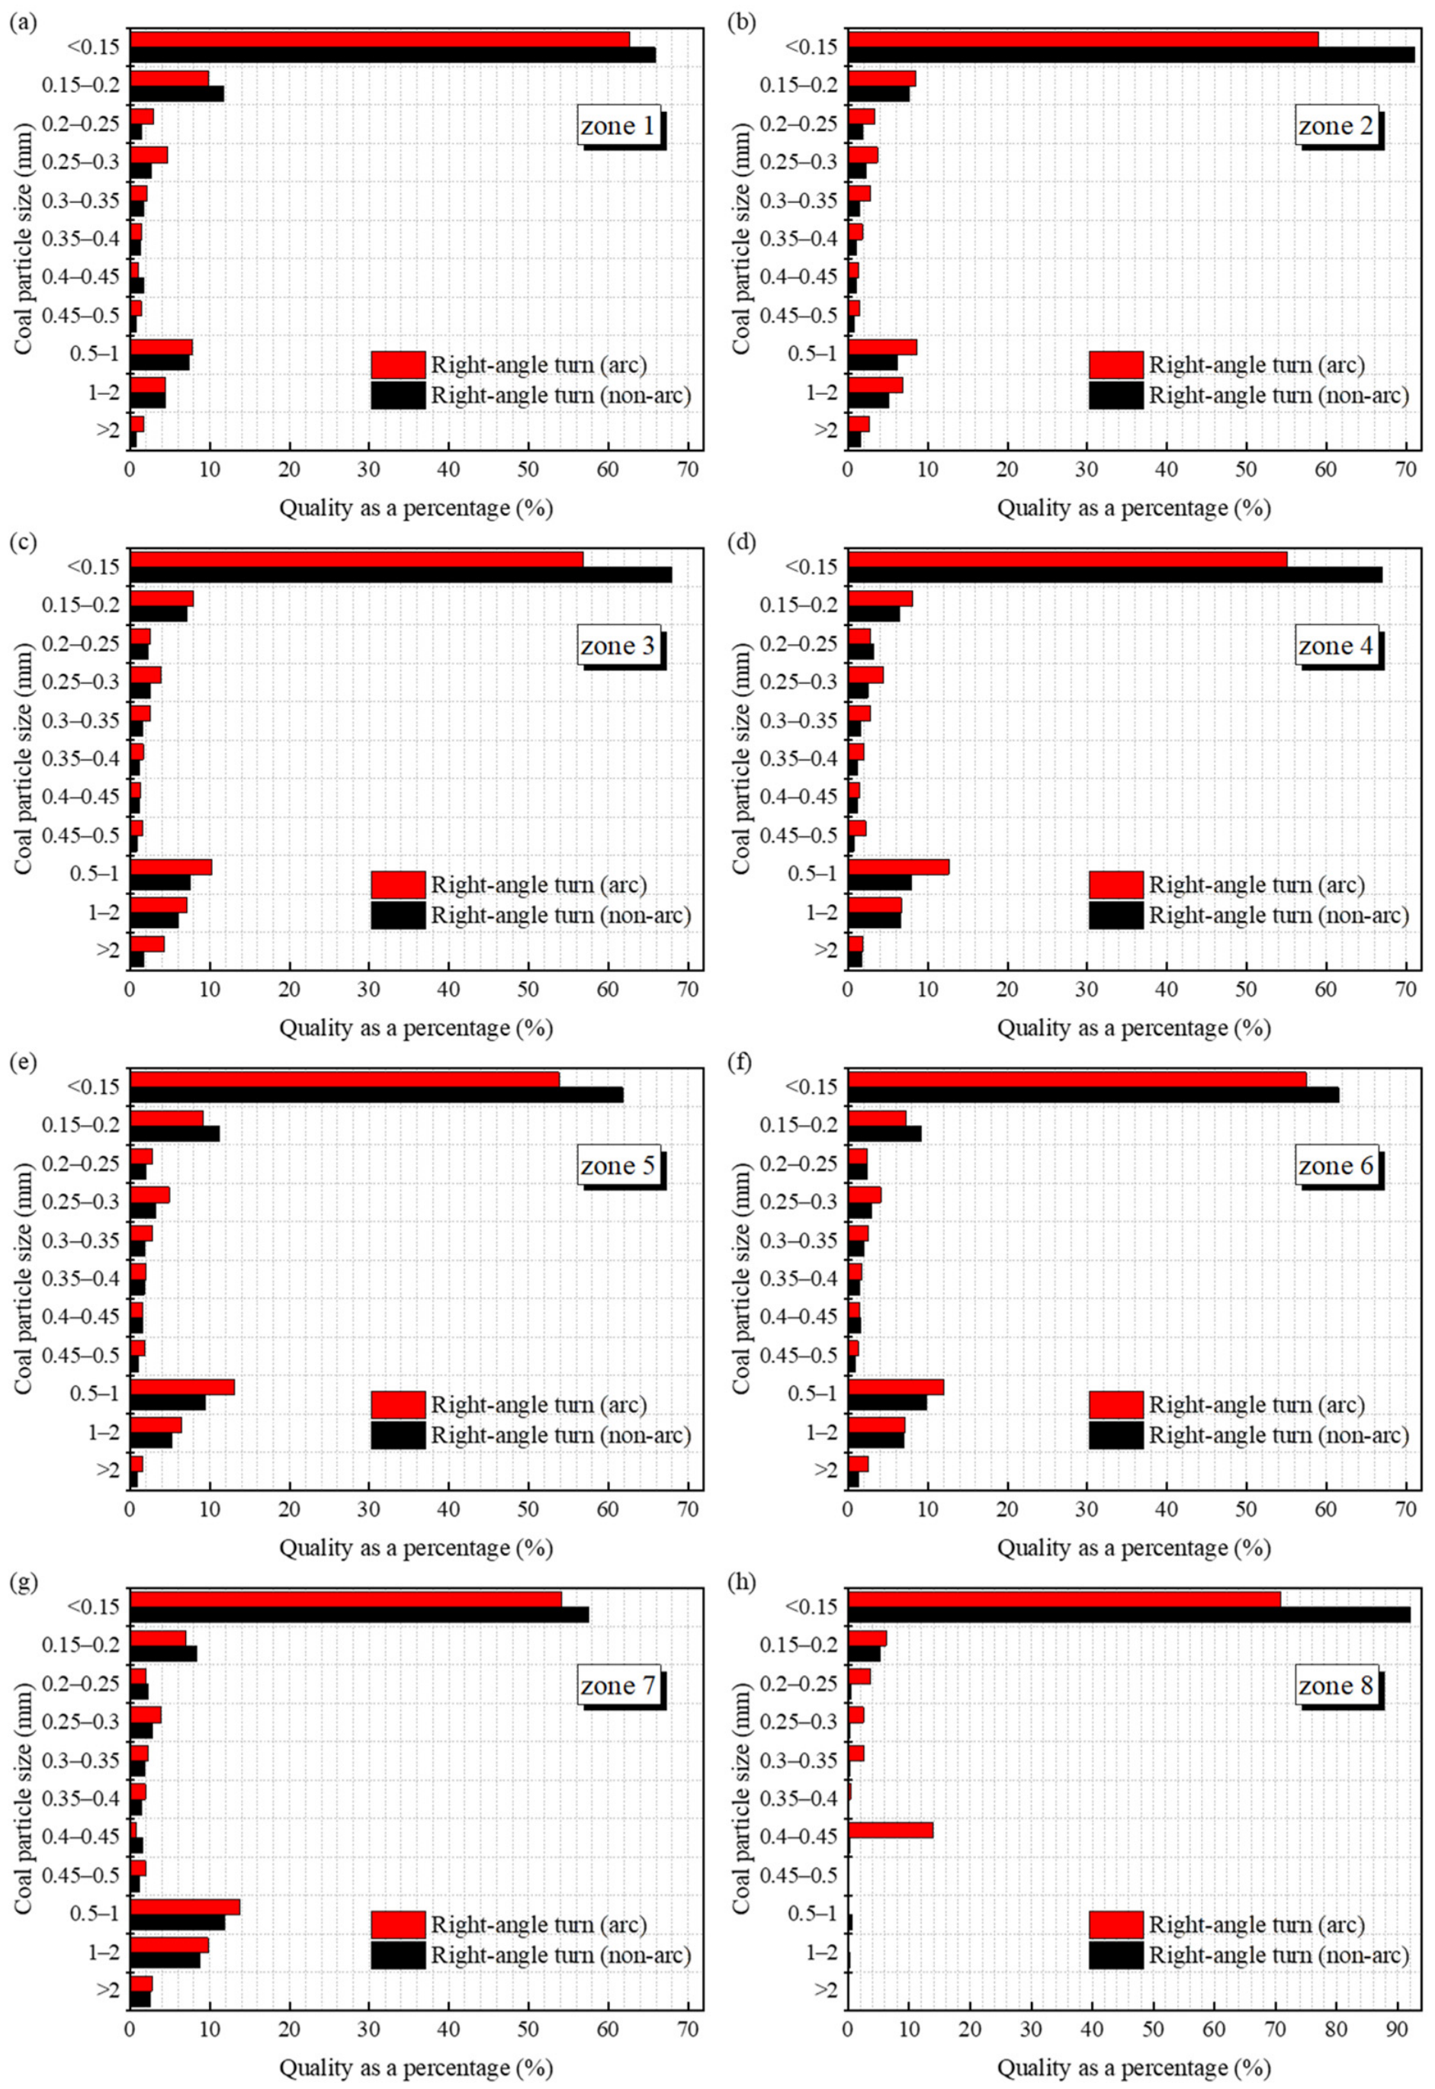
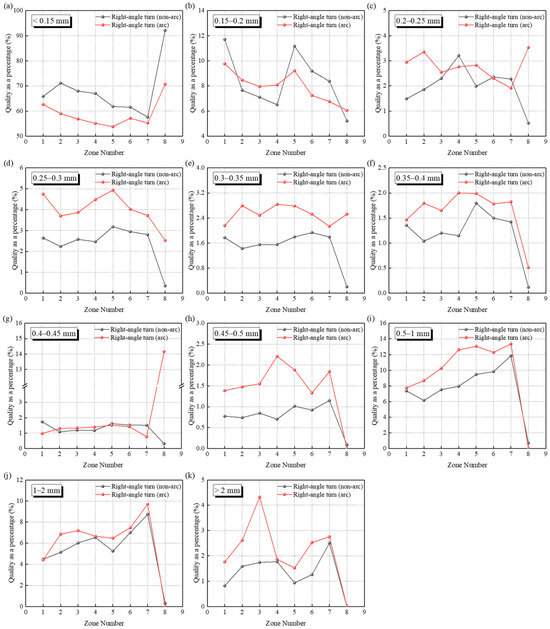
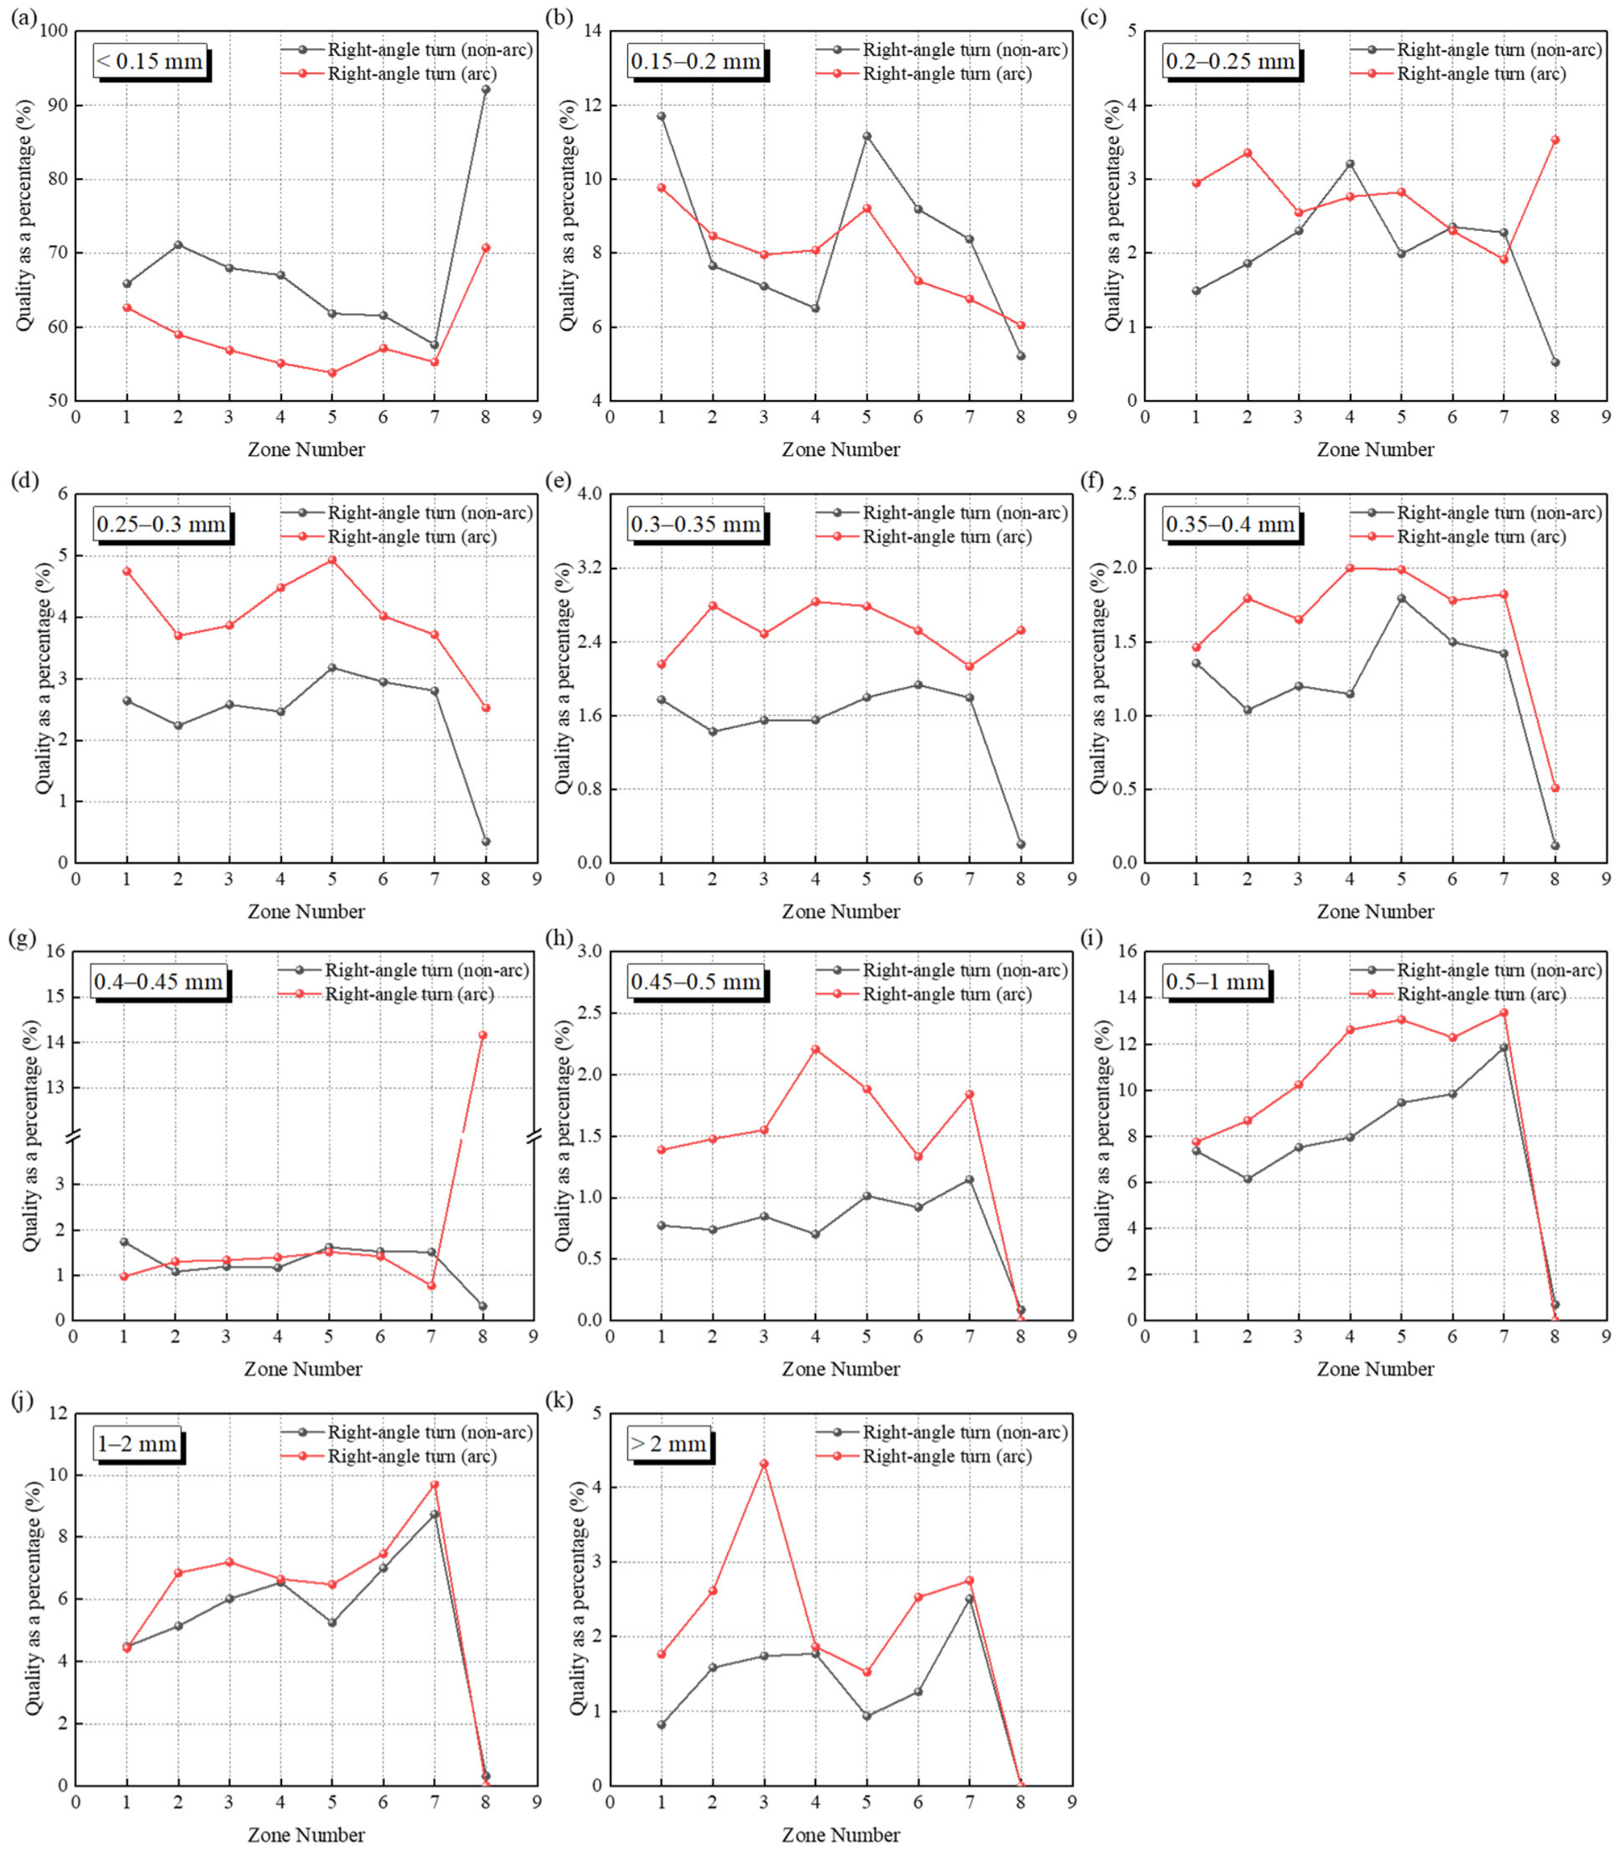
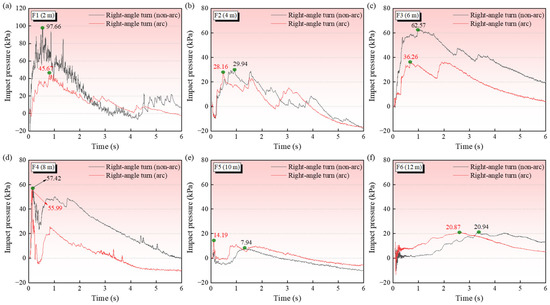
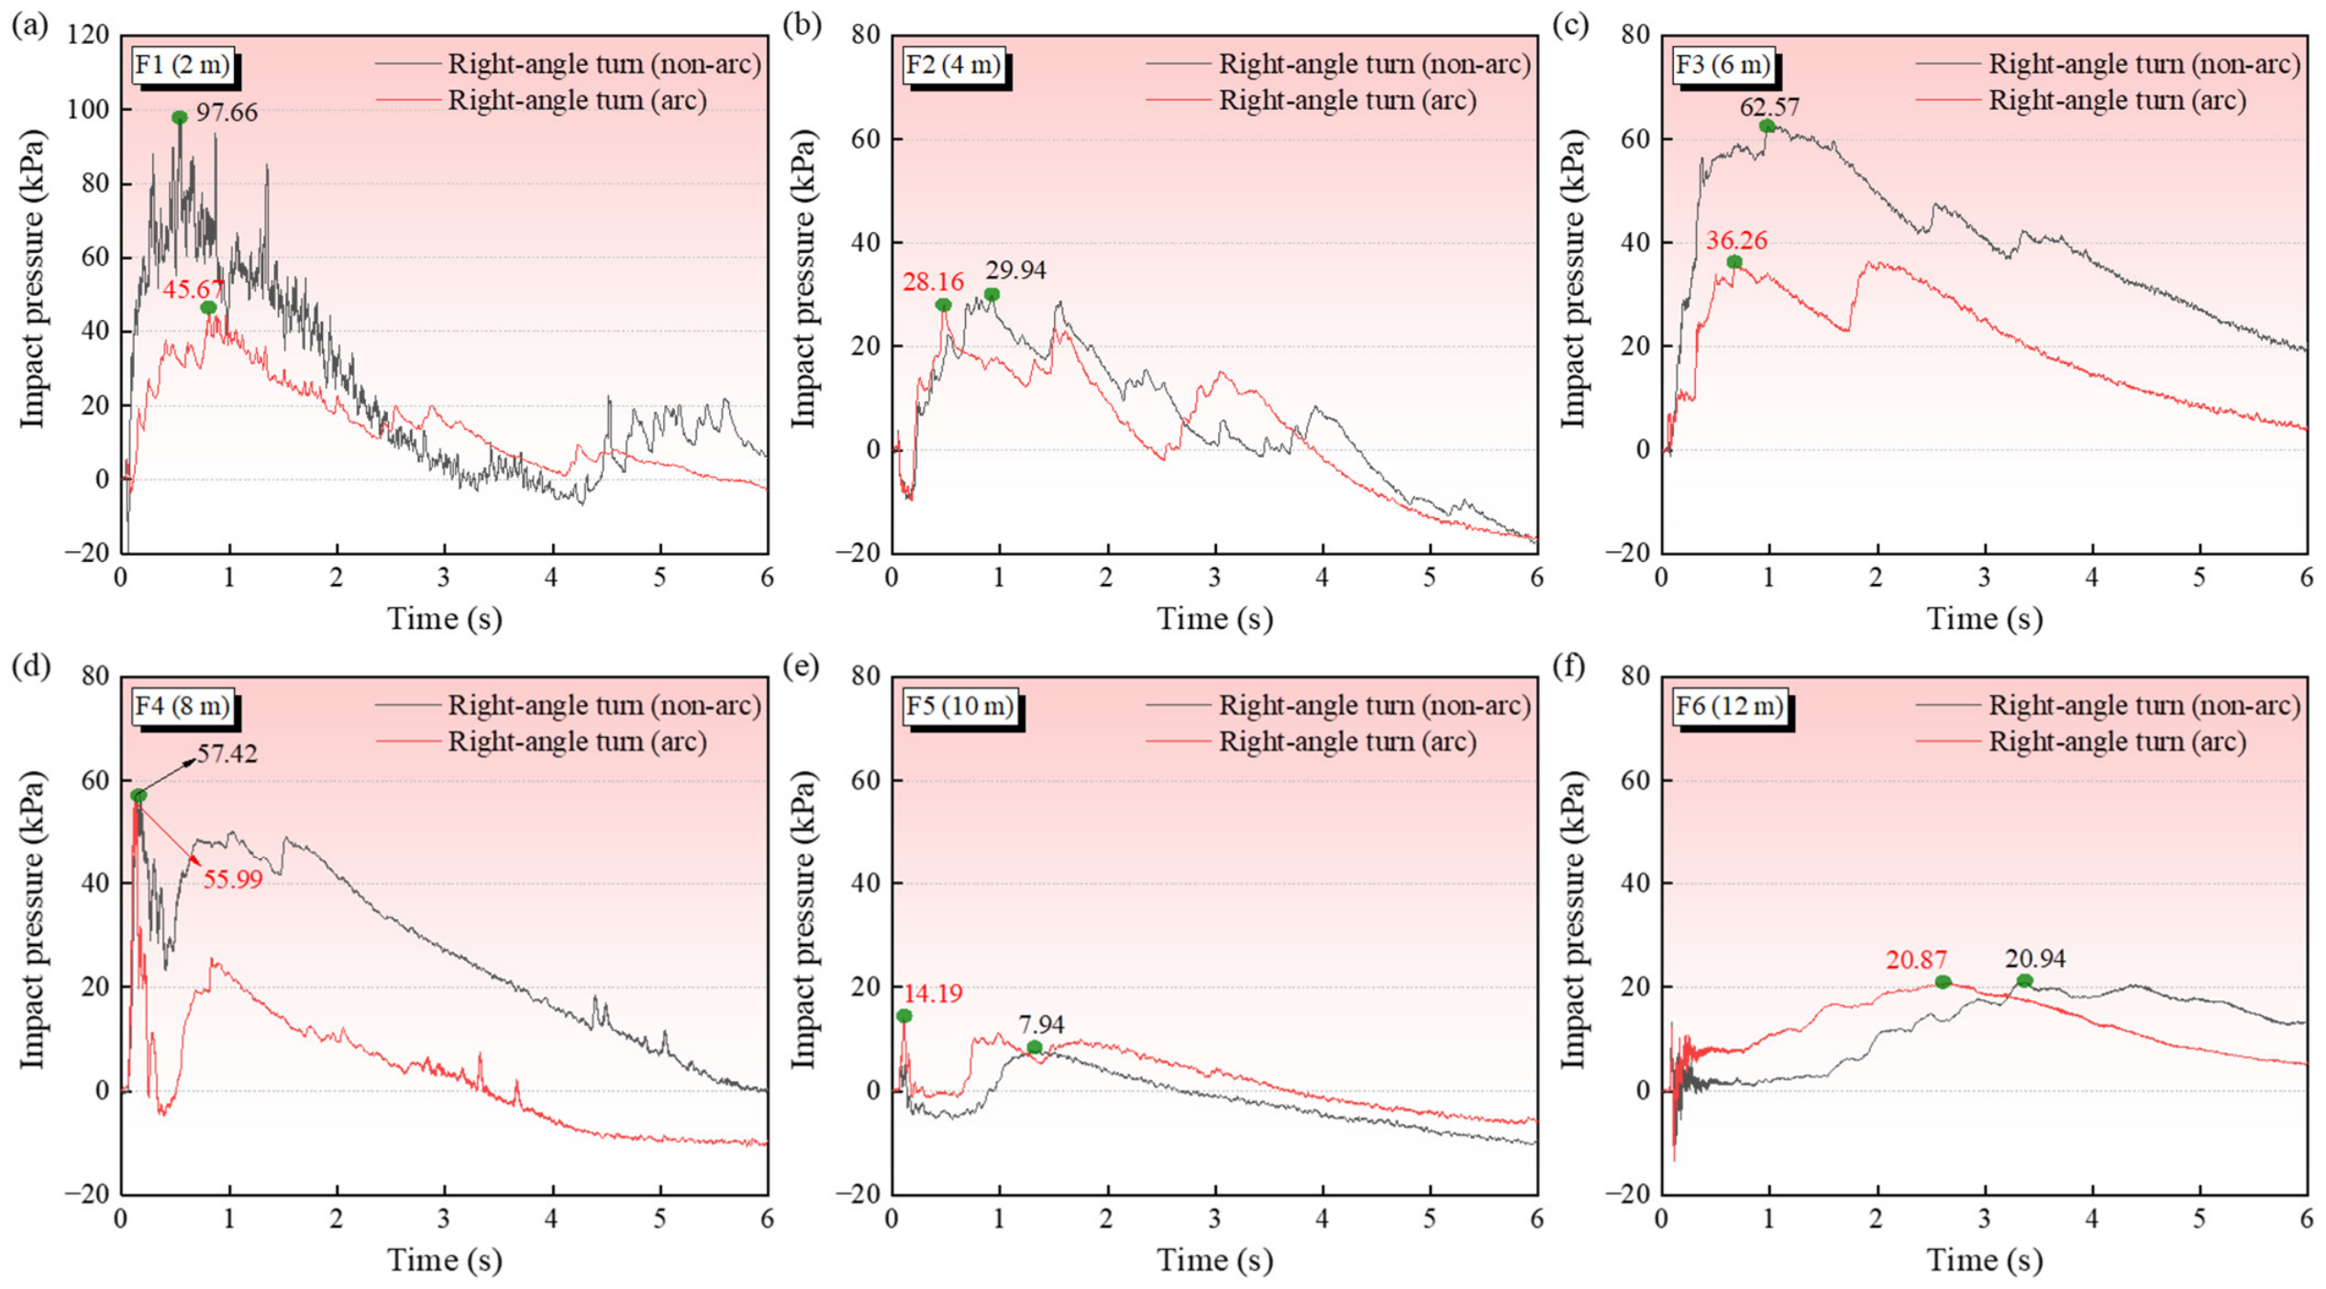
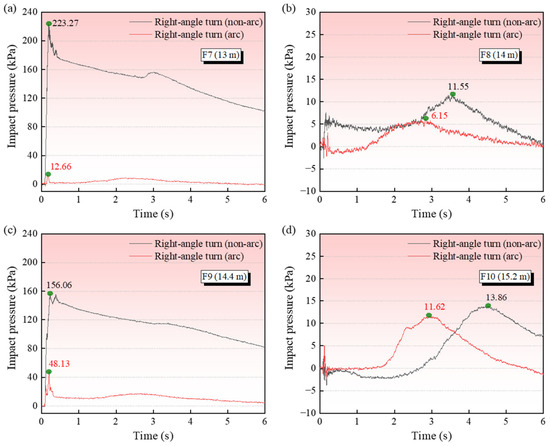
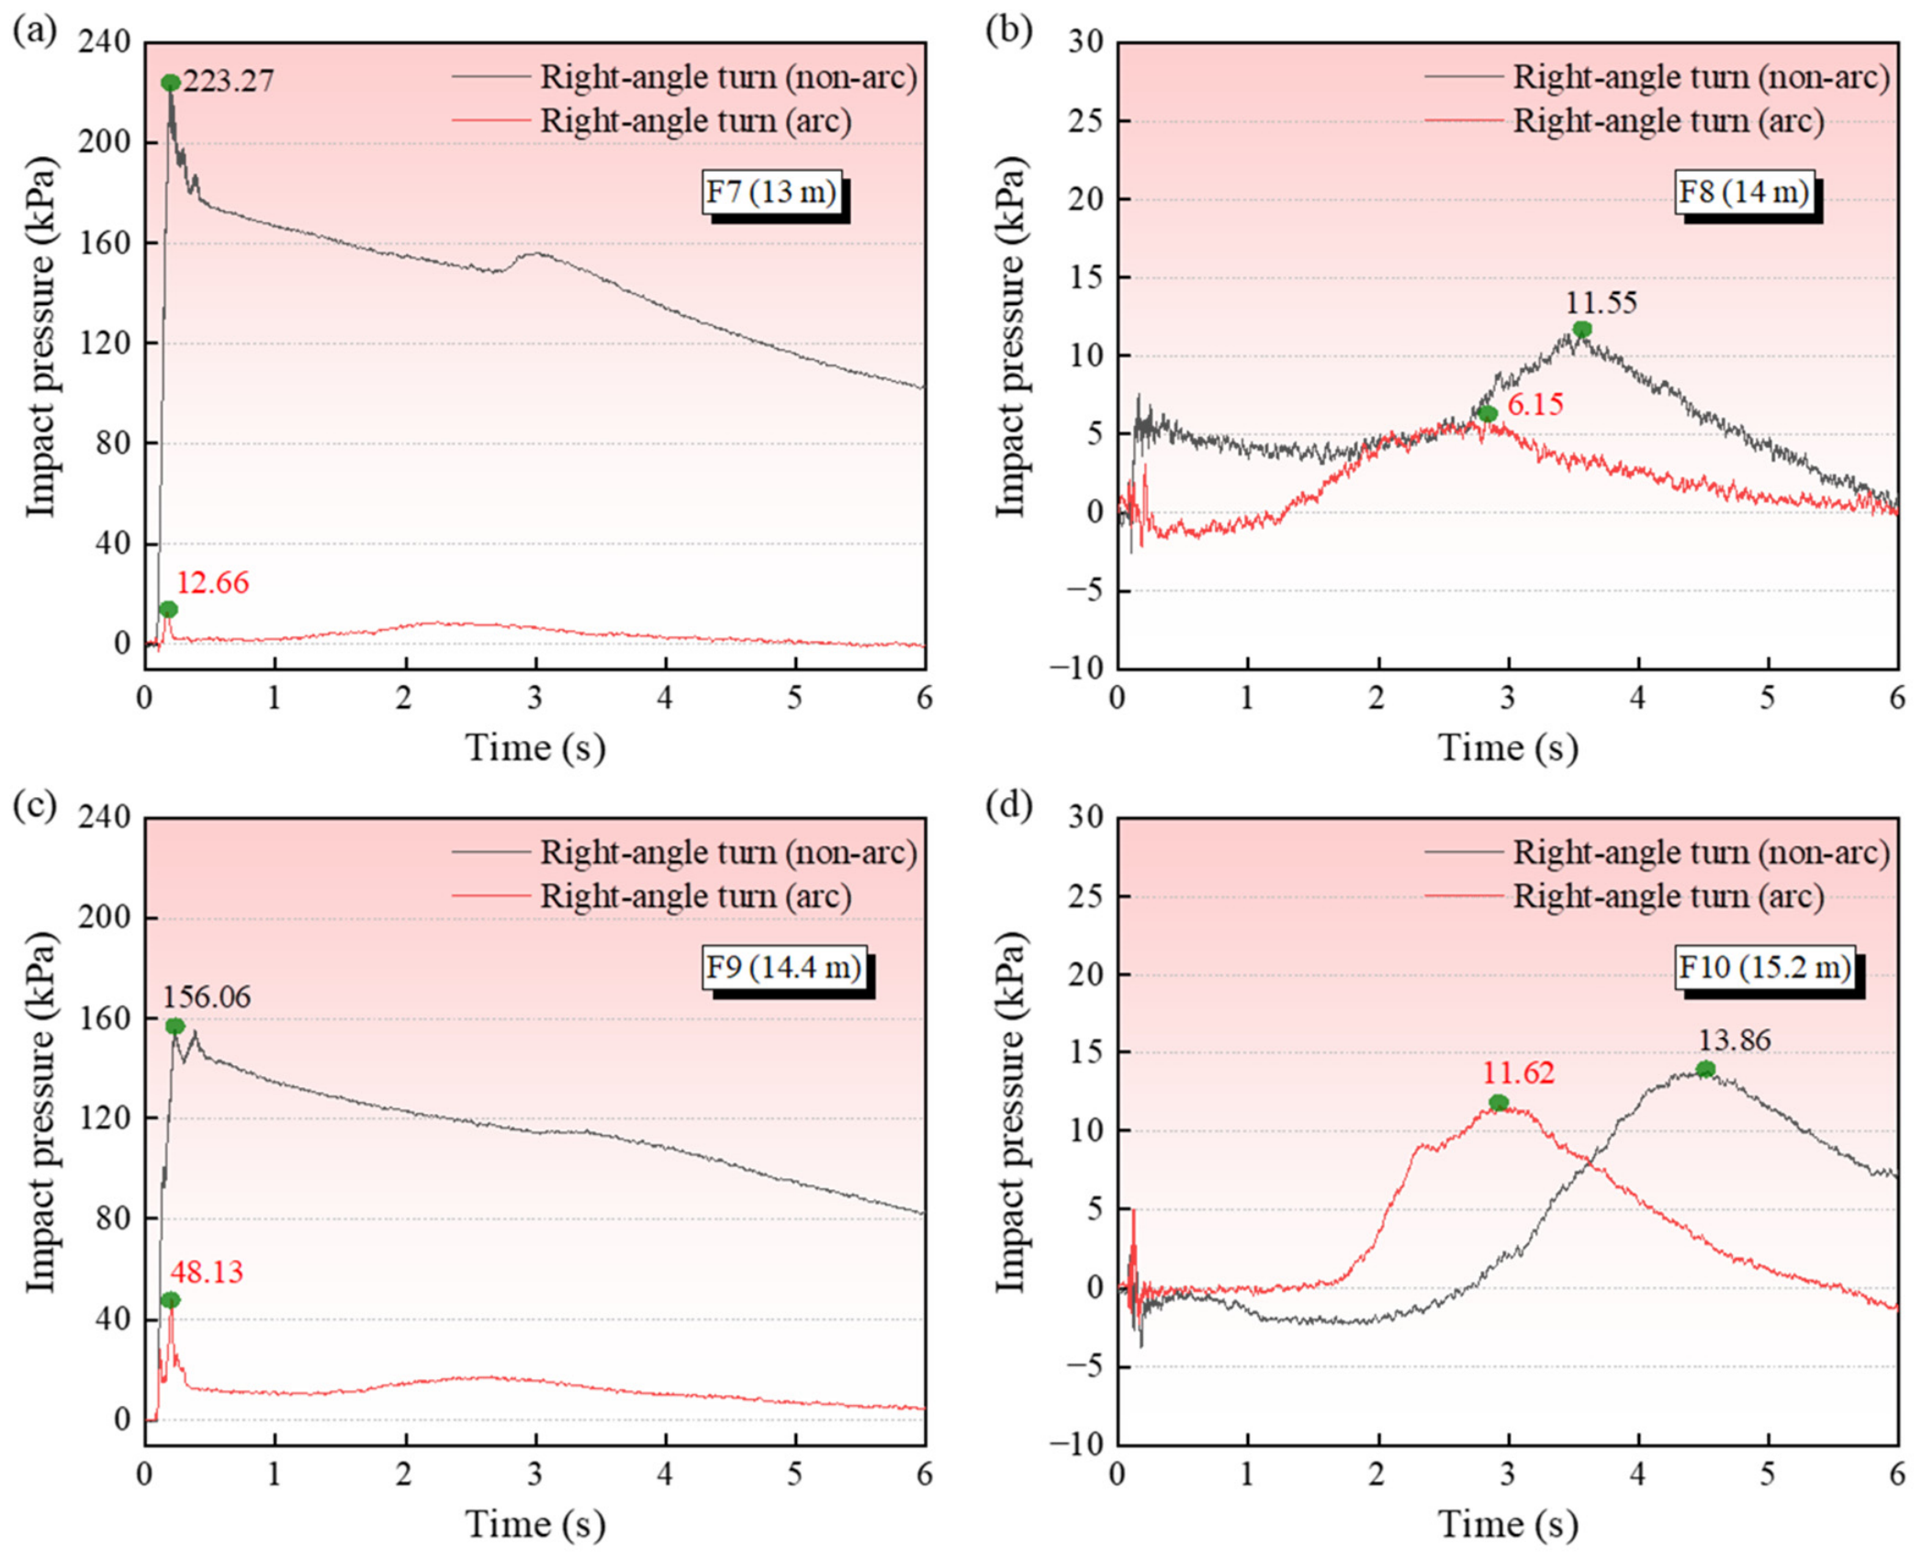
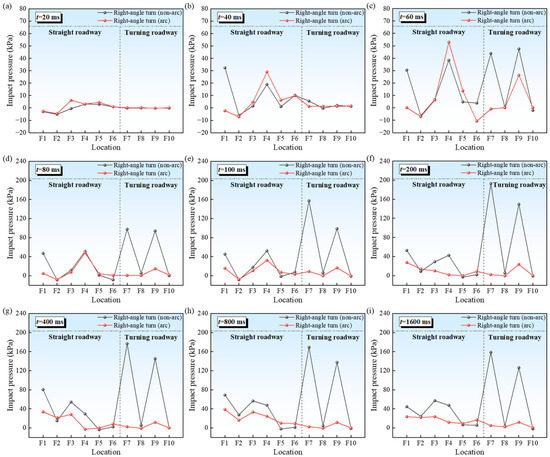
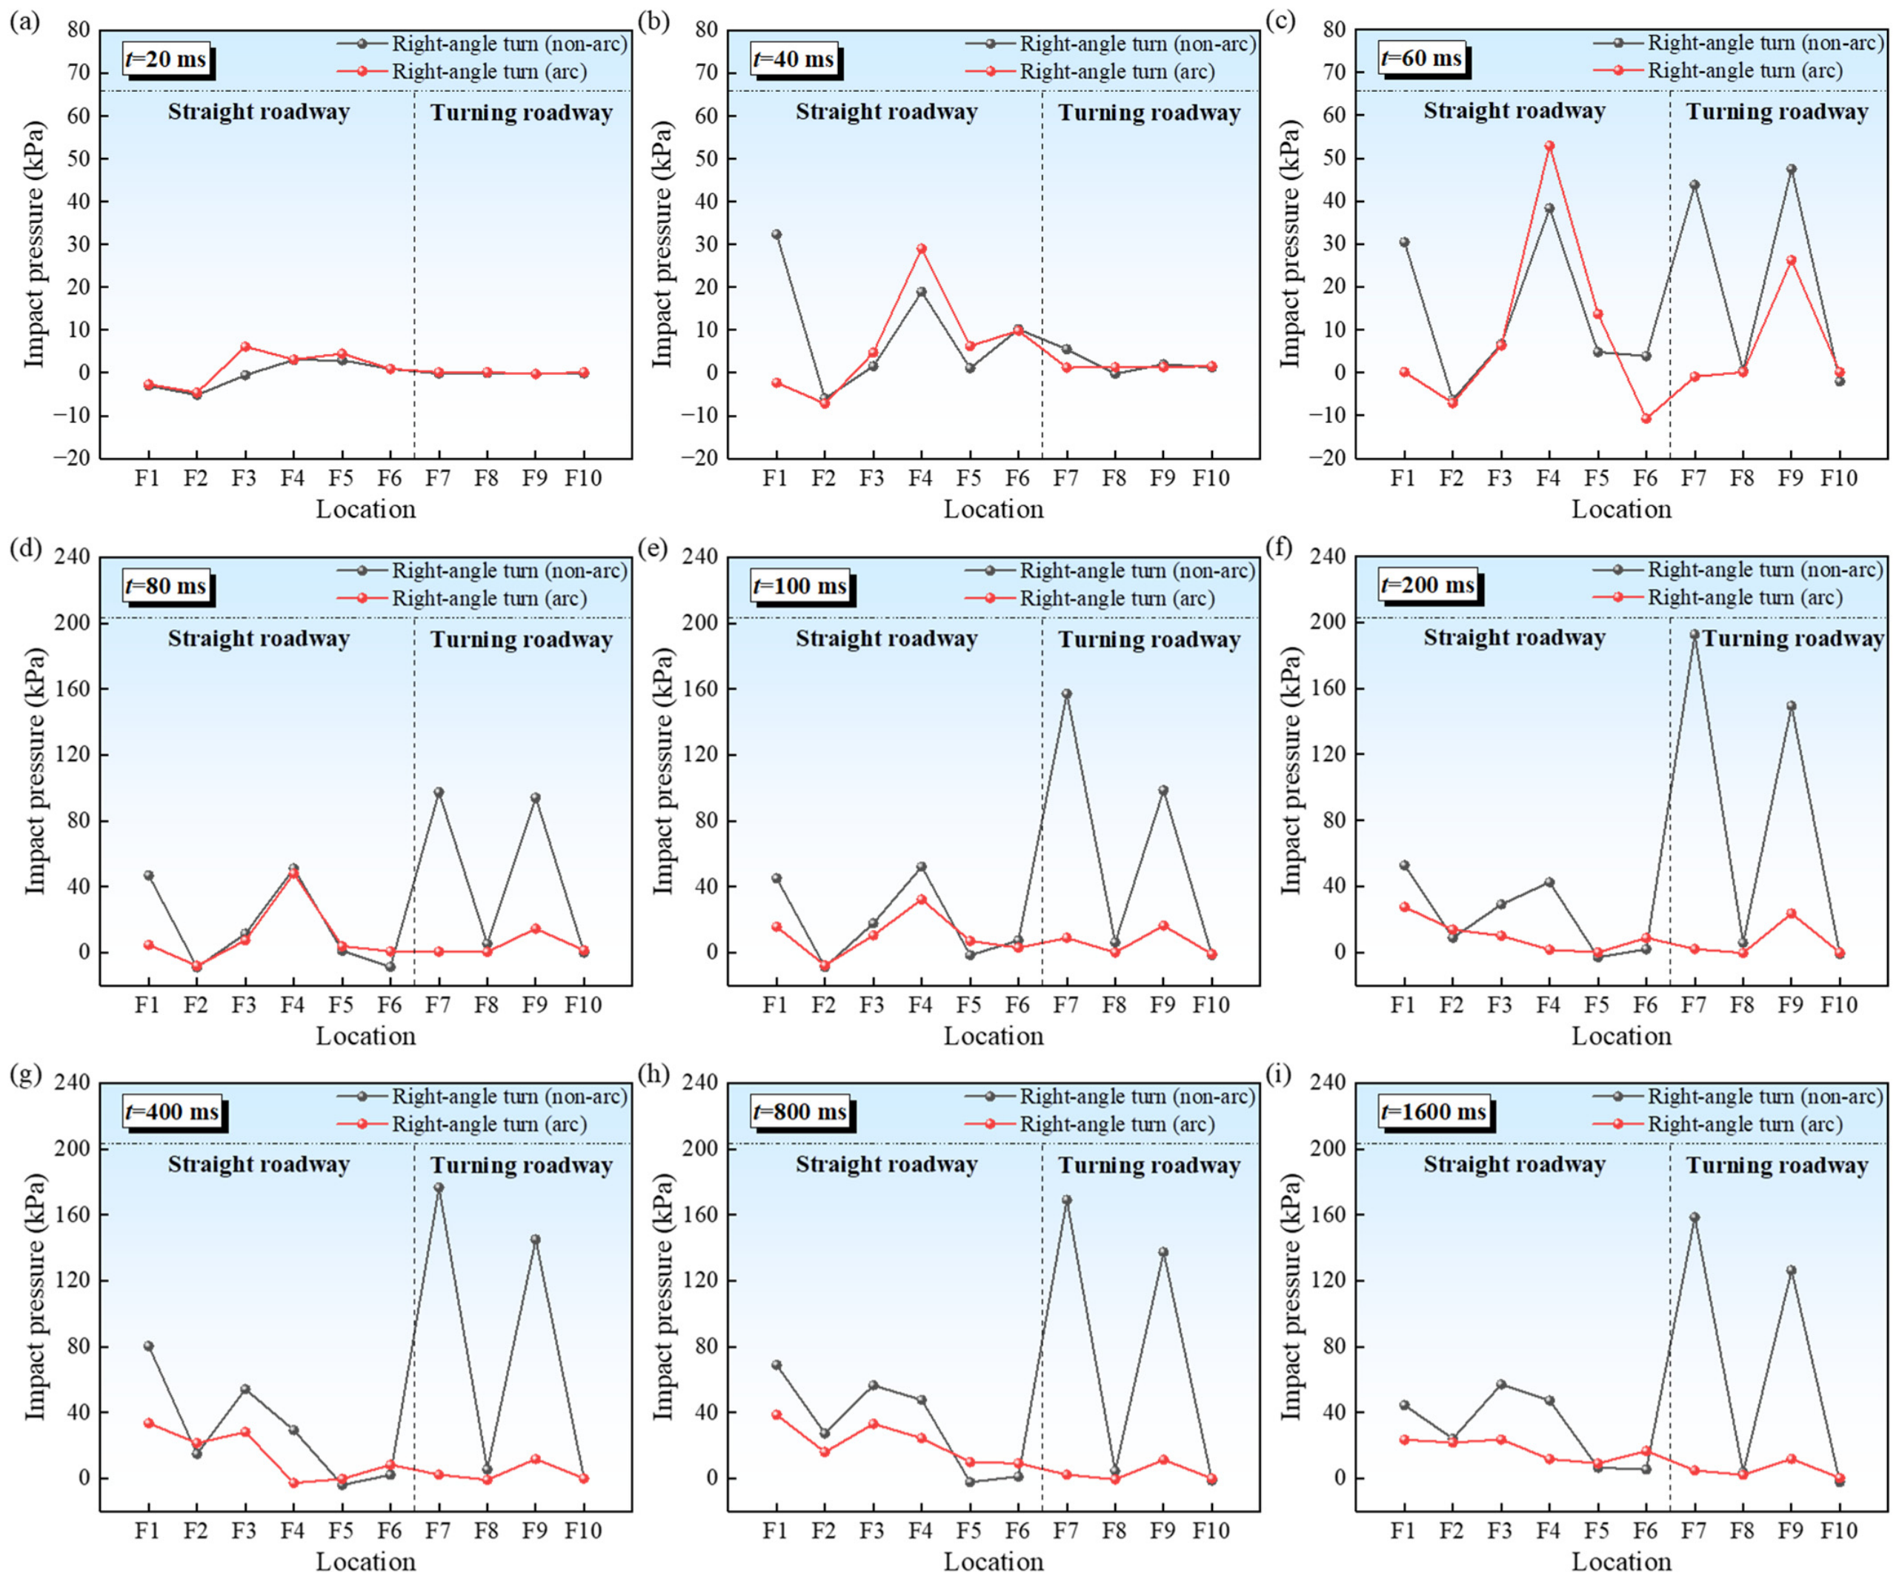
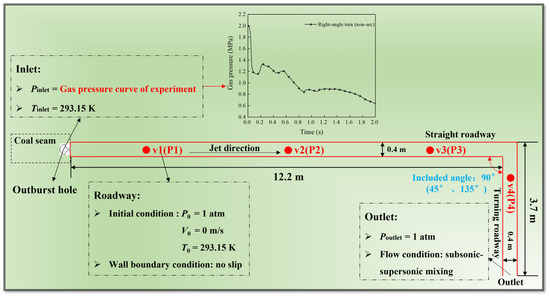
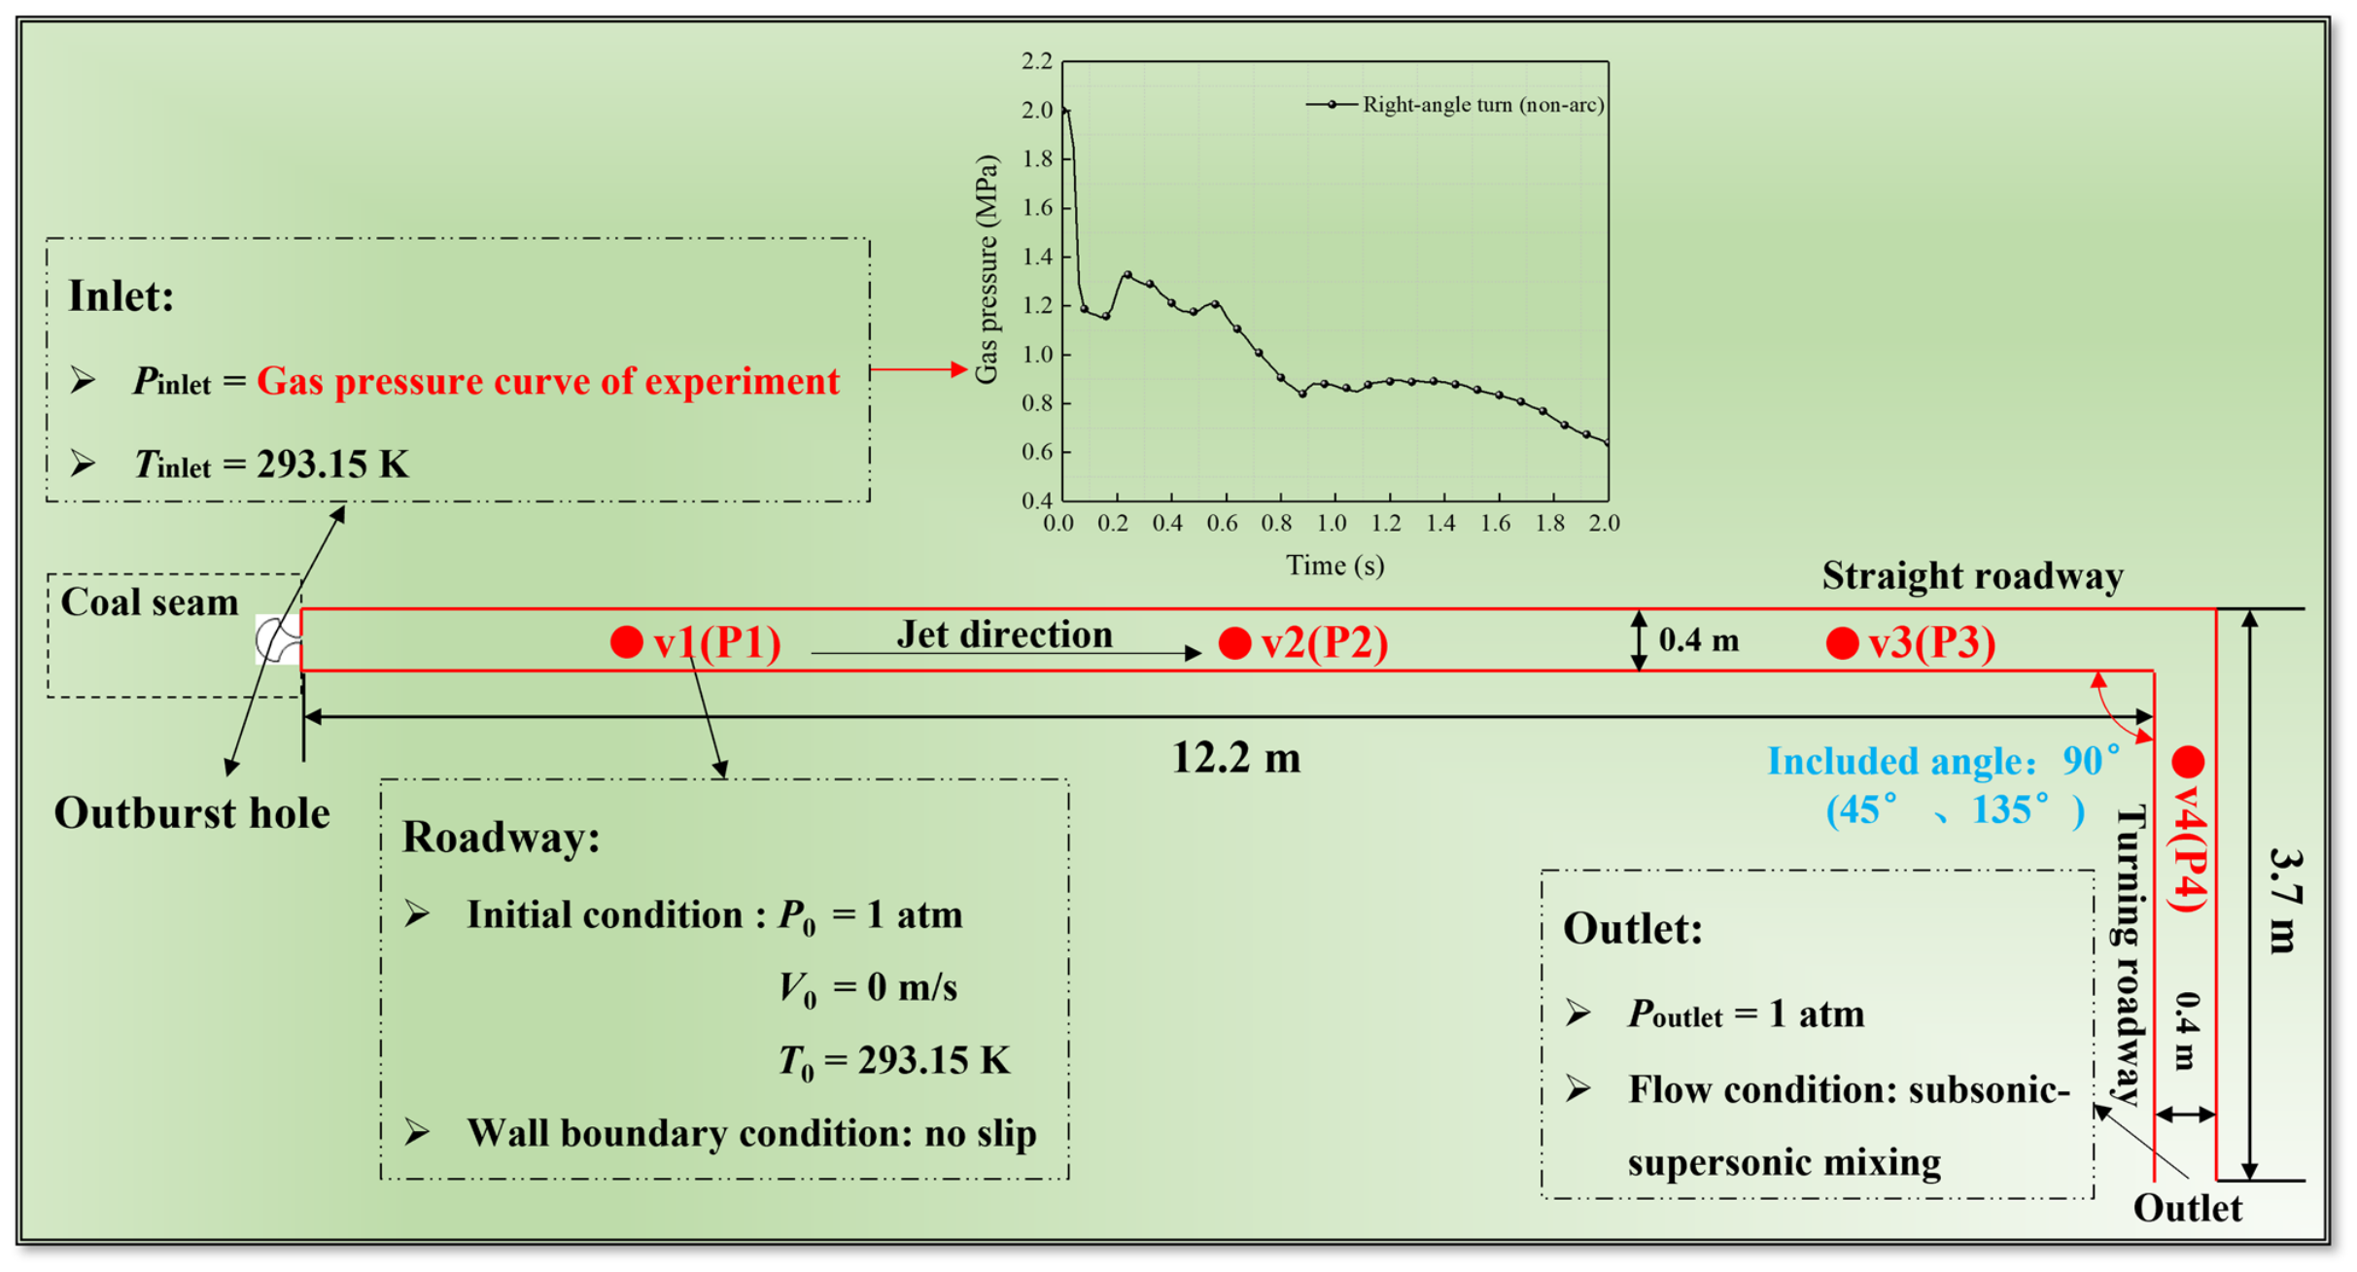
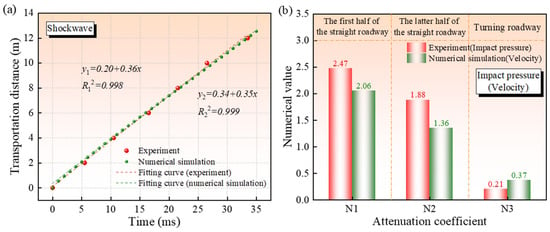
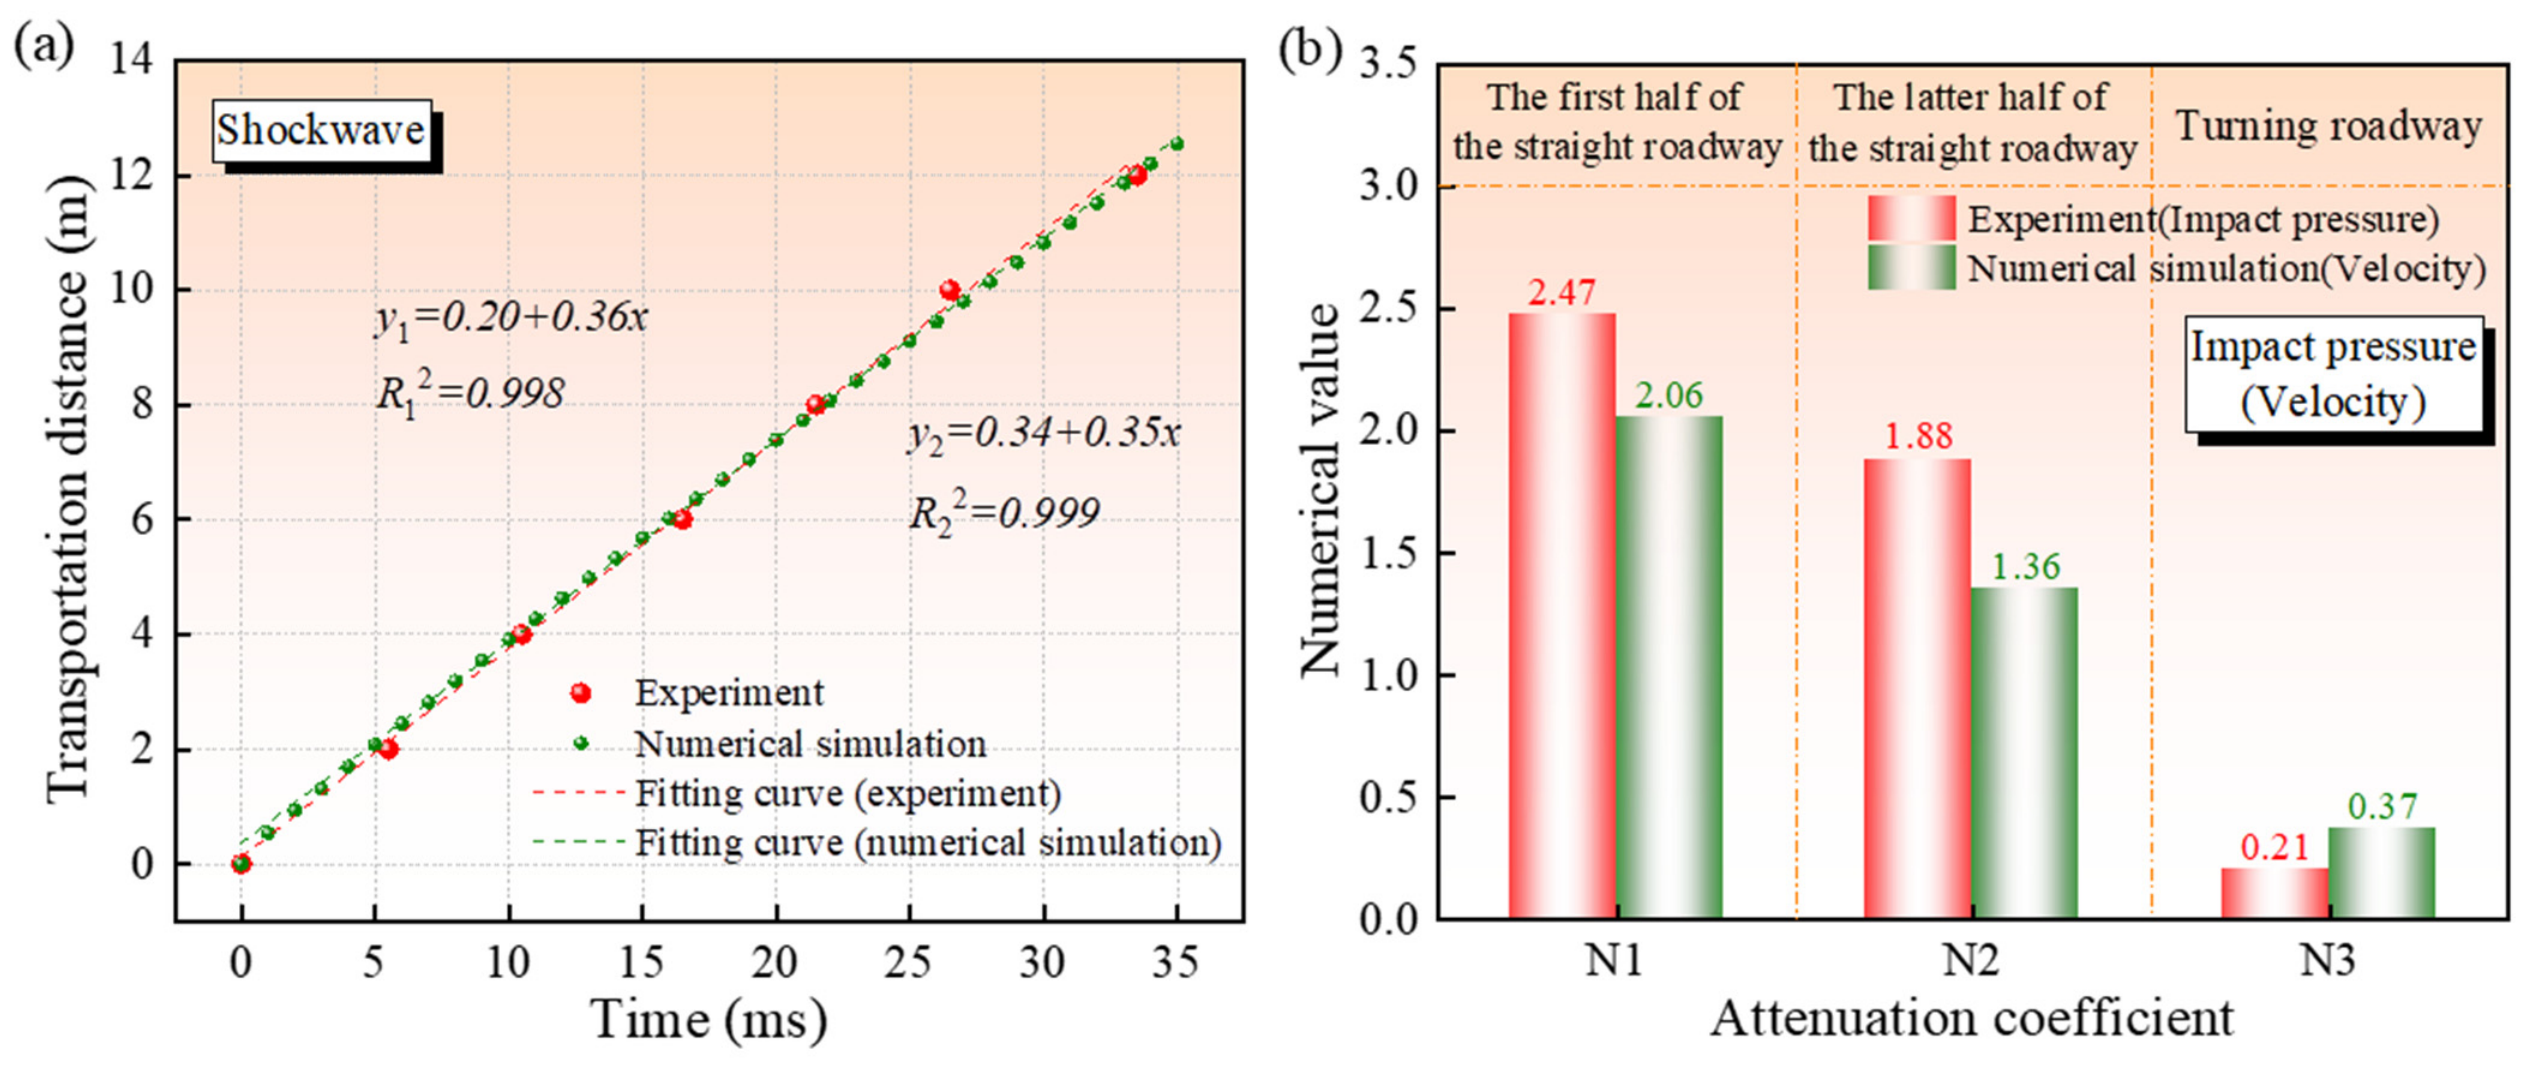
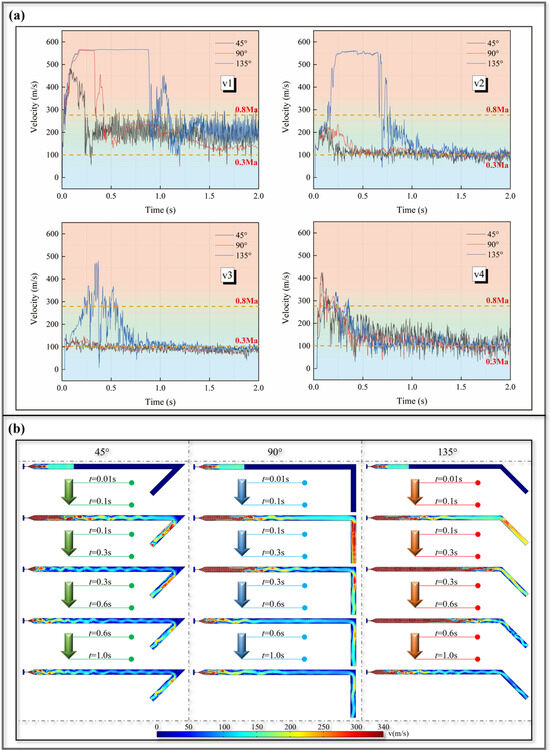
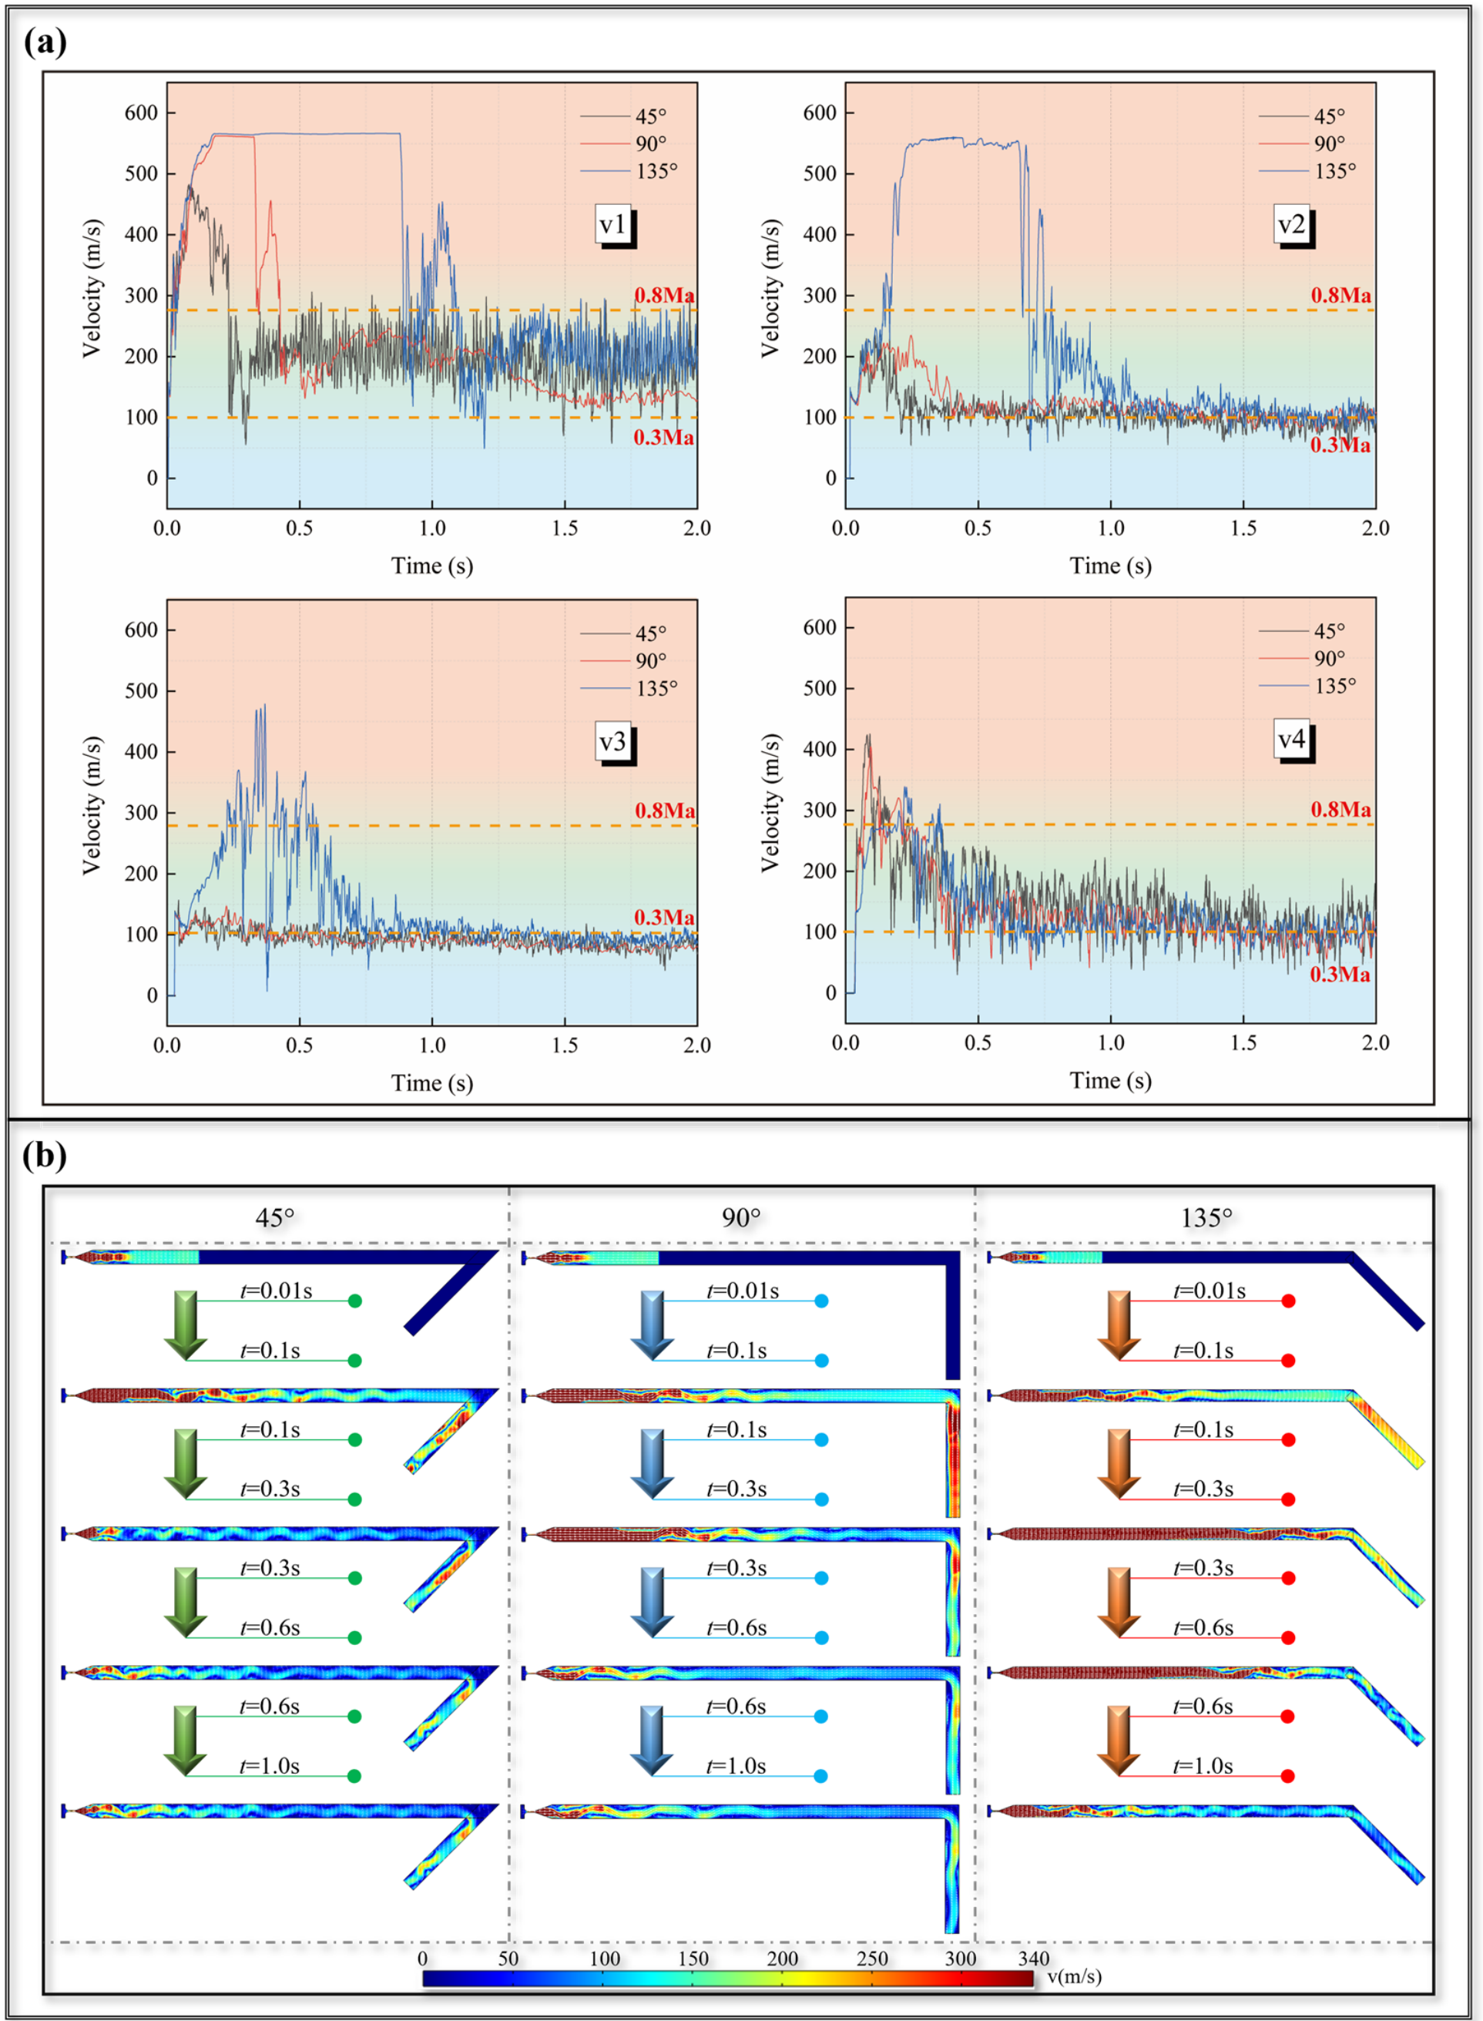
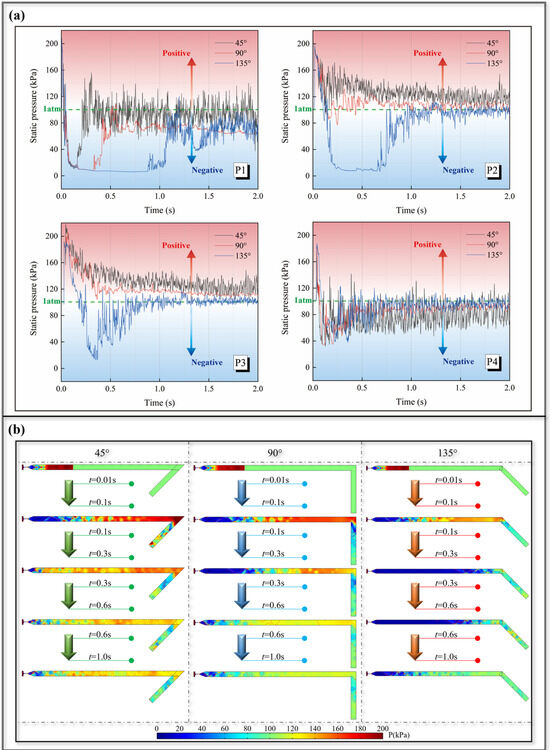
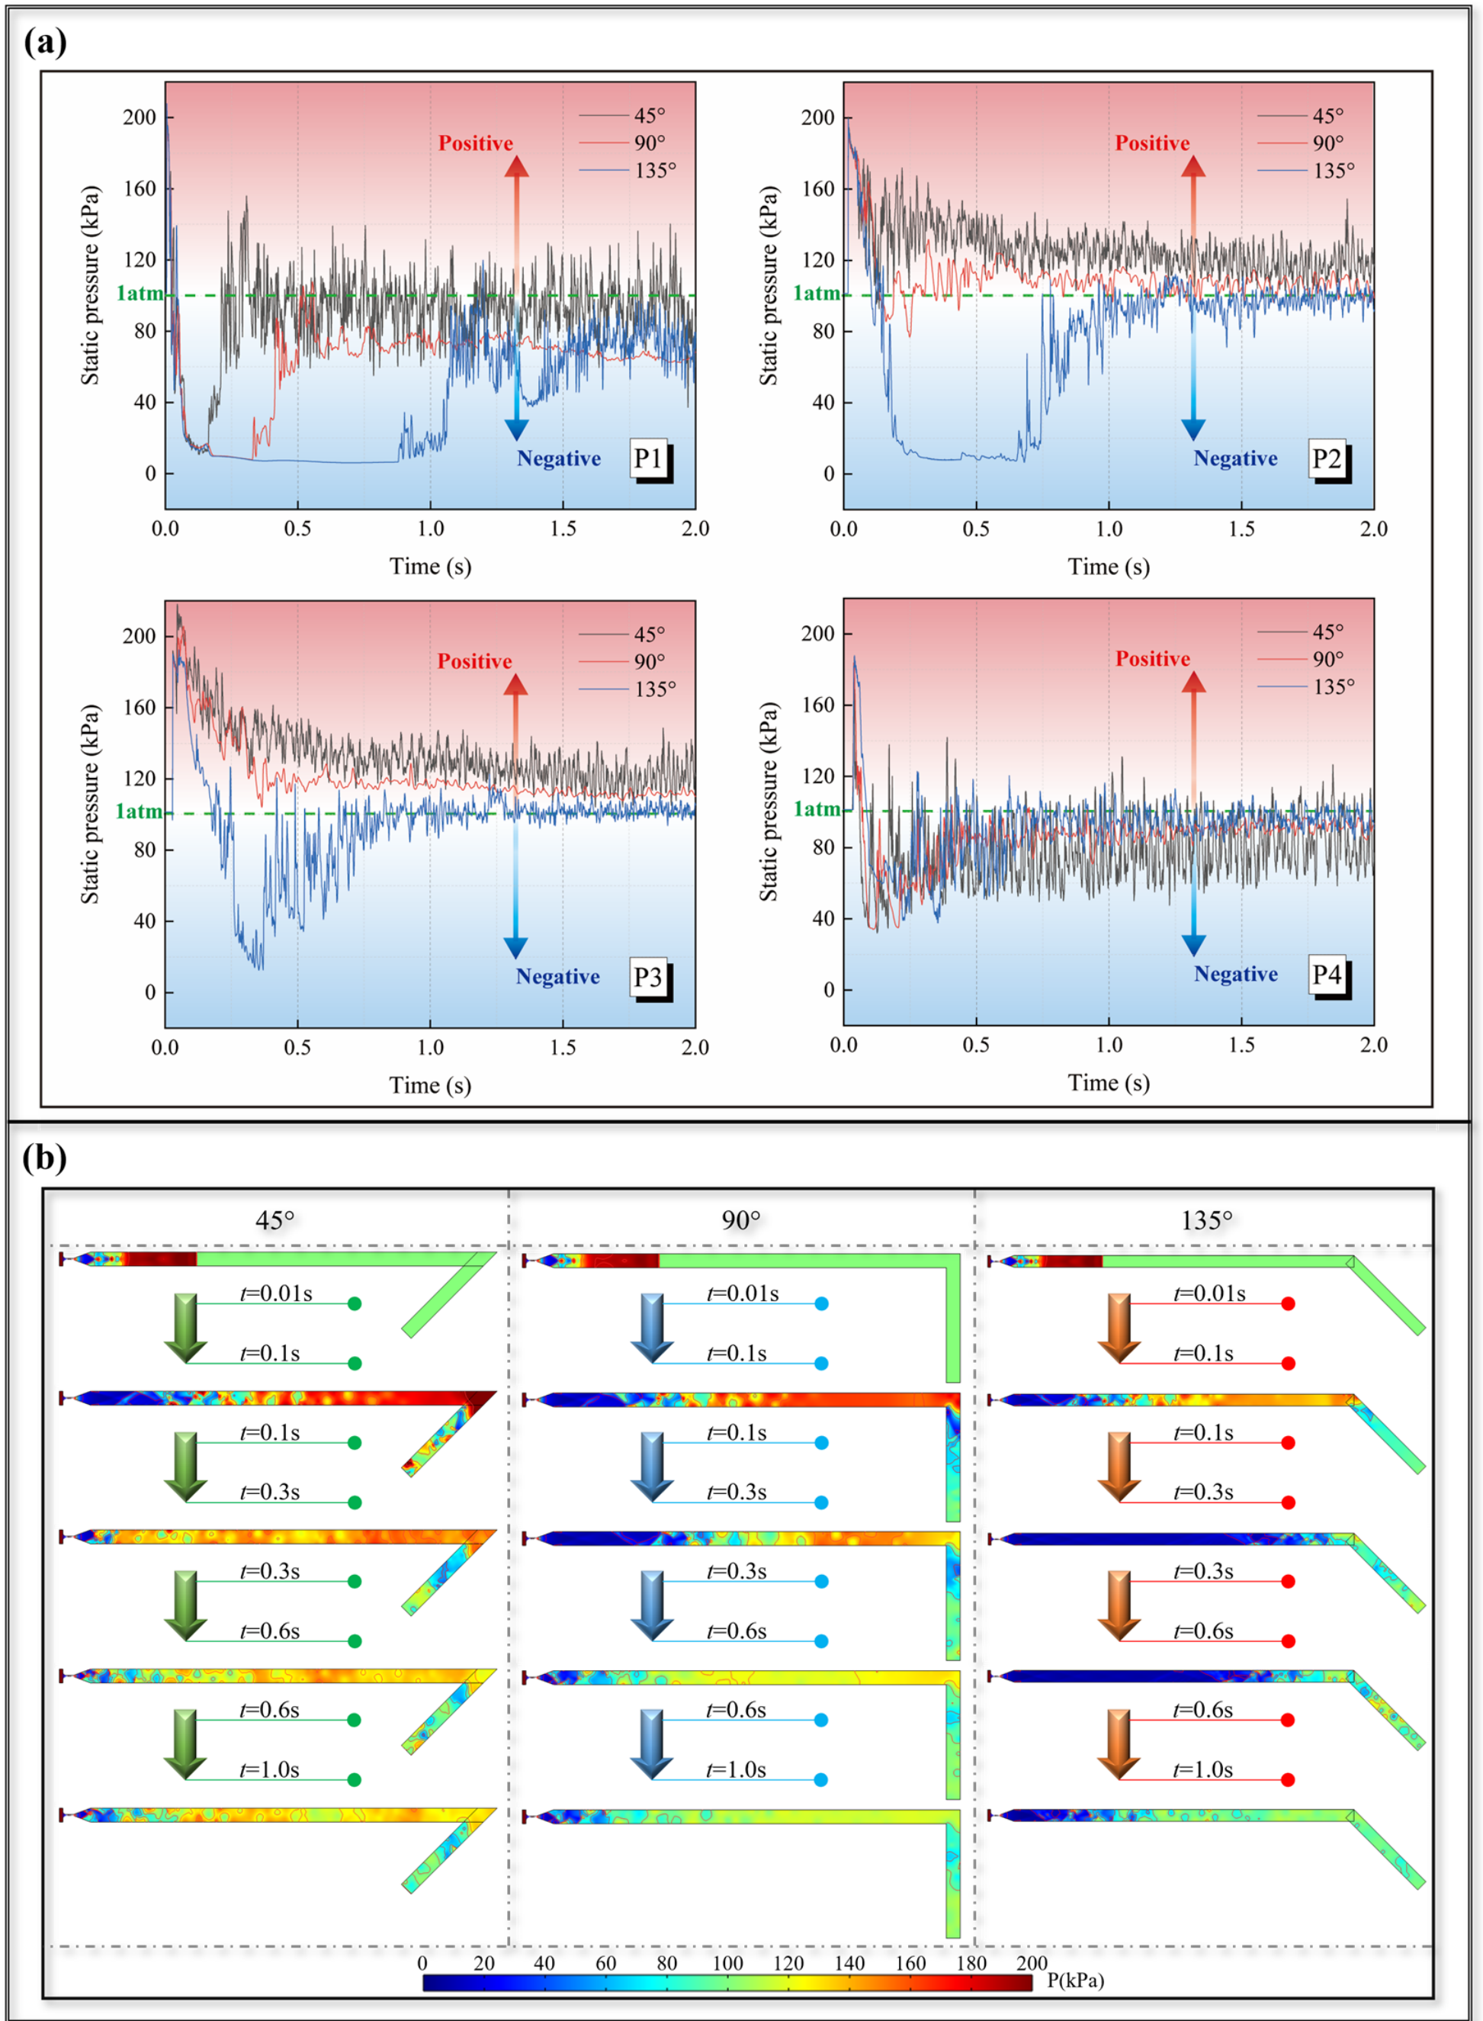

Disclaimer/Publisher’s Note: The statements, opinions and data contained in all publications are solely those of the individual author(s) and contributor(s) and not of MDPI and/or the editor(s). MDPI and/or the editor(s) disclaim responsibility for any injury to people or property resulting from any ideas, methods, instructions or products referred to in the content. |
© 2026 by the authors. Licensee MDPI, Basel, Switzerland. This article is an open access article distributed under the terms and conditions of the Creative Commons Attribution (CC BY) license.