


Abstract
Detecting anomalous events in high-dimensional behavioral data is a fundamental challenge in modern cybersecurity, particularly in scenarios involving stealthy advanced persistent threats (APTs). Traditional anomaly detection techniques rely on heuristic notions of distance or density yet rarely offer a mathematically coherent description of how sparse events can be formally empirically separated from the dominant behavioral structure. This study introduces a density–metric geometric space framework that unifies geometric, topological, and density-based perspectives into a single analytical model. Behavioral events are embedded in a five-dimensional Euclidean geometric space equipped with a neighborhood-based density operator. Anomalies are formally defined as points whose local density falls below a fixed threshold, and we show that such points occupy empirically distinct low-density regions of the induced metric space. The theoretical foundations are supported by experiments conducted on openly available cybersecurity datasets, including ADFA-LD and UNSW-NB15, where we demonstrate that low-density behavioral patterns correspond to structurally rare attack configurations. The proposed framework provides a mathematically grounded framework with empirical validation for why APT-like behaviors naturally emerge as sparse and weakly coherent regions in high-dimensional space. These results offer a principled basis for high-dimensional anomaly detection and open new directions for leveraging geometric learning in cybersecurity.
Keywords:
density-based geometric spaces; advanced persistent threats; high-dimensional anomaly detection; geometric data analysis MSC:
62H30; 68T01; 60D05
1. Introduction
The analysis of anomalous events in high-dimensional data has become a central problem in modern applied mathematics, with a direct impact on domains such as signal processing, finance, biomedical engineering, and cybersecurity. In many of these fields, observations can be represented as points in a high-dimensional space where only a small fraction of the points deviate from the dominant regular behavior. The mathematical characterization and separation of such anomalous events is a major challenge due to phenomena like the “curse of dimensionality”, the absence of parametric models and the presence of complex, non-linear dependencies among variables [1,2].
Classic approaches to anomaly detection often rely on distance- or density-based criteria defined on metric spaces; methods like k-nearest neighbors, density estimation, or clustering-based outlier detection assume that normal data lie in dense regions while anomalies occupy sparse ones [1,3]. Although these ideas are conceptually simple, their rigorous mathematical formulation in high-dimensional settings remains far from trivial. Defining a coherent notion of density, relating it to the metric structure, and characterizing the geometric separation between normal and anomalous events in an induced geometric space are open problems [3,4].
At the same time, geometric space-based perspectives have gained relevance as they enable an understanding of the geometry of high-dimensional data. Rather than viewing observations simply as points in one can assume they lie near a lower-dimensional geometric space endowed with a suitable metric structure. This raises important mathematical questions: How is density defined in such geometric spaces? Under what conditions do low-density regions correspond to structurally separable anomalies? What does this imply about APT research? A recent geometric framework for outlier detection in high-dimensional data explores these ideas rigorously in terms of the geometry and topology of data geometric spaces [5,6,7]. Recently there has been a great interest in methods for the parameterization of data using low-dimensional geometric spaces as models. Within the neural information processing community, this has become known as geometric space learning. Methods for geometric space learning can find the non-linear geometric space parameterizations of datapoints residing in high-dimensional spaces, very much like how Principal Component Analysis (PCA) is able to learn or identify the most important linear subspace of a set of data points. In two often-cited articles in Science, Roweis and Saul [8] introduced the concept of Locally Linear Embedding and Tenenbaum [9] introduced the so-called Isomap. This seems to have been the start of the most recent wave of interest in geometric space learning.
Advanced Persistent Threats (APTs) naturally manifest as low-density regions in the behavioral geometric space because their operational patterns diverge sharply from the statistical regularities of normal system activity. Unlike commodity attacks, APT campaigns are characterized by long dwell times, staged execution, adaptive lateral movements, and selective resource interaction, all of which produce behavioral traces that are sparse, infrequent, and structurally inconsistent with the dominant modes of system behavior [8,9]. These operations generate atypical feature configurations—such as irregular timing distributions, elevated entropy in process interactions, sparse and weakly coherent high-density regions endpoint combinations, or statistically anomalous deviations from baseline profiles—that do not recur frequently enough to form dense clusters in the data geometric space. Consequently, APT-related events fail to populate neighborhoods with sufficient local support, resulting in markedly low-density embeddings. This aligns with empirical threat intelligence observations: APT techniques (e.g., stealthy privilege escalation, targeted reconnaissance, and custom tool deployment) are inherently rare and highly distinct, placing them in the geometric outskirts of the behavioral space. The density–metric geometric space [10,11] thus provides a mathematically coherent explanation for why APT activity becomes separable from benign behavior, not because it is overtly malicious, but because it is statistically and geometrically nonconforming to the normal operational structure of the system.
Motivated by these considerations, this paper introduces a density–metric geometric space framework [10,11] for the mathematical separation of anomalous events in high-dimensional spaces. We consider a metric space endowed with a density operator that captures local point concentrations in the geometric space. Within this setting, anomalous events are formally defined as points whose local density falls below a threshold, and we study how these points can be separated from most data using only the intrinsic density–metric structure of . Although the framework is quite general, we illustrate its use with behavioral data arising from complex systems, with an emphasis on cyber attack scenarios [12].
We define (i) a density–metric geometric space model that unifies distance-based and density-based views of anomaly detection in a single mathematical structure. Then we establish (ii) formal conditions under which anomalous events correspond to low-density points that are separable from the normal data, and we provide relevant proofs. We demonstrate (iii) how this abstract model can be instantiated in a concrete high-dimensional setting where behavioral events are represented by vectors of features, and anomalies correspond to structurally rare configurations. This paper is organized into five sections; we have already presented the first section, which contains the description of our conceptualization problem. In Section 2 (Material and Methods) we introduce the formal definitions of the density–metric geometric space and associated operators and present the proposed separation criteria for anomalous events and state our main propositions. In Section 3 we illustrate the framework on simulated high-dimensional data and on an application to complex behavioral systems, highlighting some results. In Section 4 we discuss the implications, limitations, and possible extensions of the model. Finally, in Section 5 we conclude the paper and outline directions for future research.
Formally, the data analyzed in this work consist of a finite set of behavioral observations embedded in ℝ5 and equipped with the Euclidean metric. All definitions and results are formulated directly on this induced metric space, without assuming any underlying continuous or smooth structure. The contribution of this work is conceptual and formal rather than algorithmic.
2. Materials and Methods
This study was developed using only openly accessible and publicly documented datasets to ensure full transparency and reproducibility. The first dataset incorporated into the analysis was the ADFA-LD (ADFA-LD—https://research.unsw.edu.au/projects/adfa-ids-datasets (accessed on 1 November 2025)) corpus, created at the Australian Defense Force Academy, which provides detailed system call traces recorded under both normal operation and intrusive scenarios. Since its introduction, this dataset has been widely accepted as a benchmark for host-based anomaly detection research due to the variety and realism of its behavioral sequences [1]. The second dataset used was UNSW-NB15 (UNSW-NB15—https://www.kaggle.com/datasets/mrwellsdavid/unsw-nb15 (accessed on 1 November 2025)), a large and modern network flow dataset produced by the Cyber Range Lab at UNSW Canberra, which includes normal traffic and several categories of malicious activity. Its diversity and structure have made it one of the most referenced open datasets for research in high-dimensional intrusion detection [2]. In addition to these structured datasets, we consulted publicly available threat intelligence repositories such as the MITRE ATT&CK (MITRE ATT&CK—Adversarial Tactics, Techniques & Common Knowledge—https://attack.mitre.org/) framework [5] and the OpenCTI (OpenCTI—https://github.com/OpenCTI-Platform/opencti (accessed on 1 November 2025)) platform [4]. Although these sources do not provide numerical datasets, they were crucial for validating the behavioral relevance and interpretability of the five chosen dimensions. A unified working dataset (Table 1) was then constructed by combining ten thousand normal events and eight hundred anomalous events extracted from these sources. To reconcile their heterogeneous formats, every event was transformed into a five-dimensional behavioral representation defined by our mathematical model [3].
Table 1.
Dataset and preprocessing summary.
This representation was inspired both by established practices in high-dimensional anomaly detection [5] and by recent geometric interpretations of sparse behavioral patterns on geometric spaces [6]. The five dimensions used in this study capture activity frequency, entropy, temporal variability, interaction diversity, and statistical deviation, thereby offering a coherent and mathematically robust coordinate system. Mapping all events into this shared representation allowed us to interpret the full dataset as a subset of a five-dimensional geometric space.
Within this geometric space, event similarity was quantified using a Euclidean metric, which is frequently adopted in density-based anomaly detection studies due to its geometric simplicity and interpretability (Table 2). Local density was estimated using a neighborhood-based operator consistent with formulations commonly used in density- and distance-based anomaly detection frameworks [4,12]. Events located in densely populated regions of the geometric space were interpreted as being representative of normal behavior, whereas events in sparse regions were treated as anomalous. This notion of anomalies is consistent with established results in statistical learning, geometric space-based detection [6], and high-dimensional time series anomaly modeling [7]. Table 2 illustrates the full pipeline of the proposed density–metric geometric space model. Raw behavioral events are embedded into R5, equipped with the Euclidean metric, and processed through the ε–neighborhood density operator. The geometric space is then partitioned into normal and anomalous regions according to the threshold MinPts.
Table 2.
Overview of the density–metric geometric space pipeline used for anomaly separation. Behavioral events are embedded in R5, endowed with the Euclidean metric, and evaluated by the ε-neighborhood density operator . The geometric space is partitioned into the normal region and the anomalous region according to the density threshold MinPts.
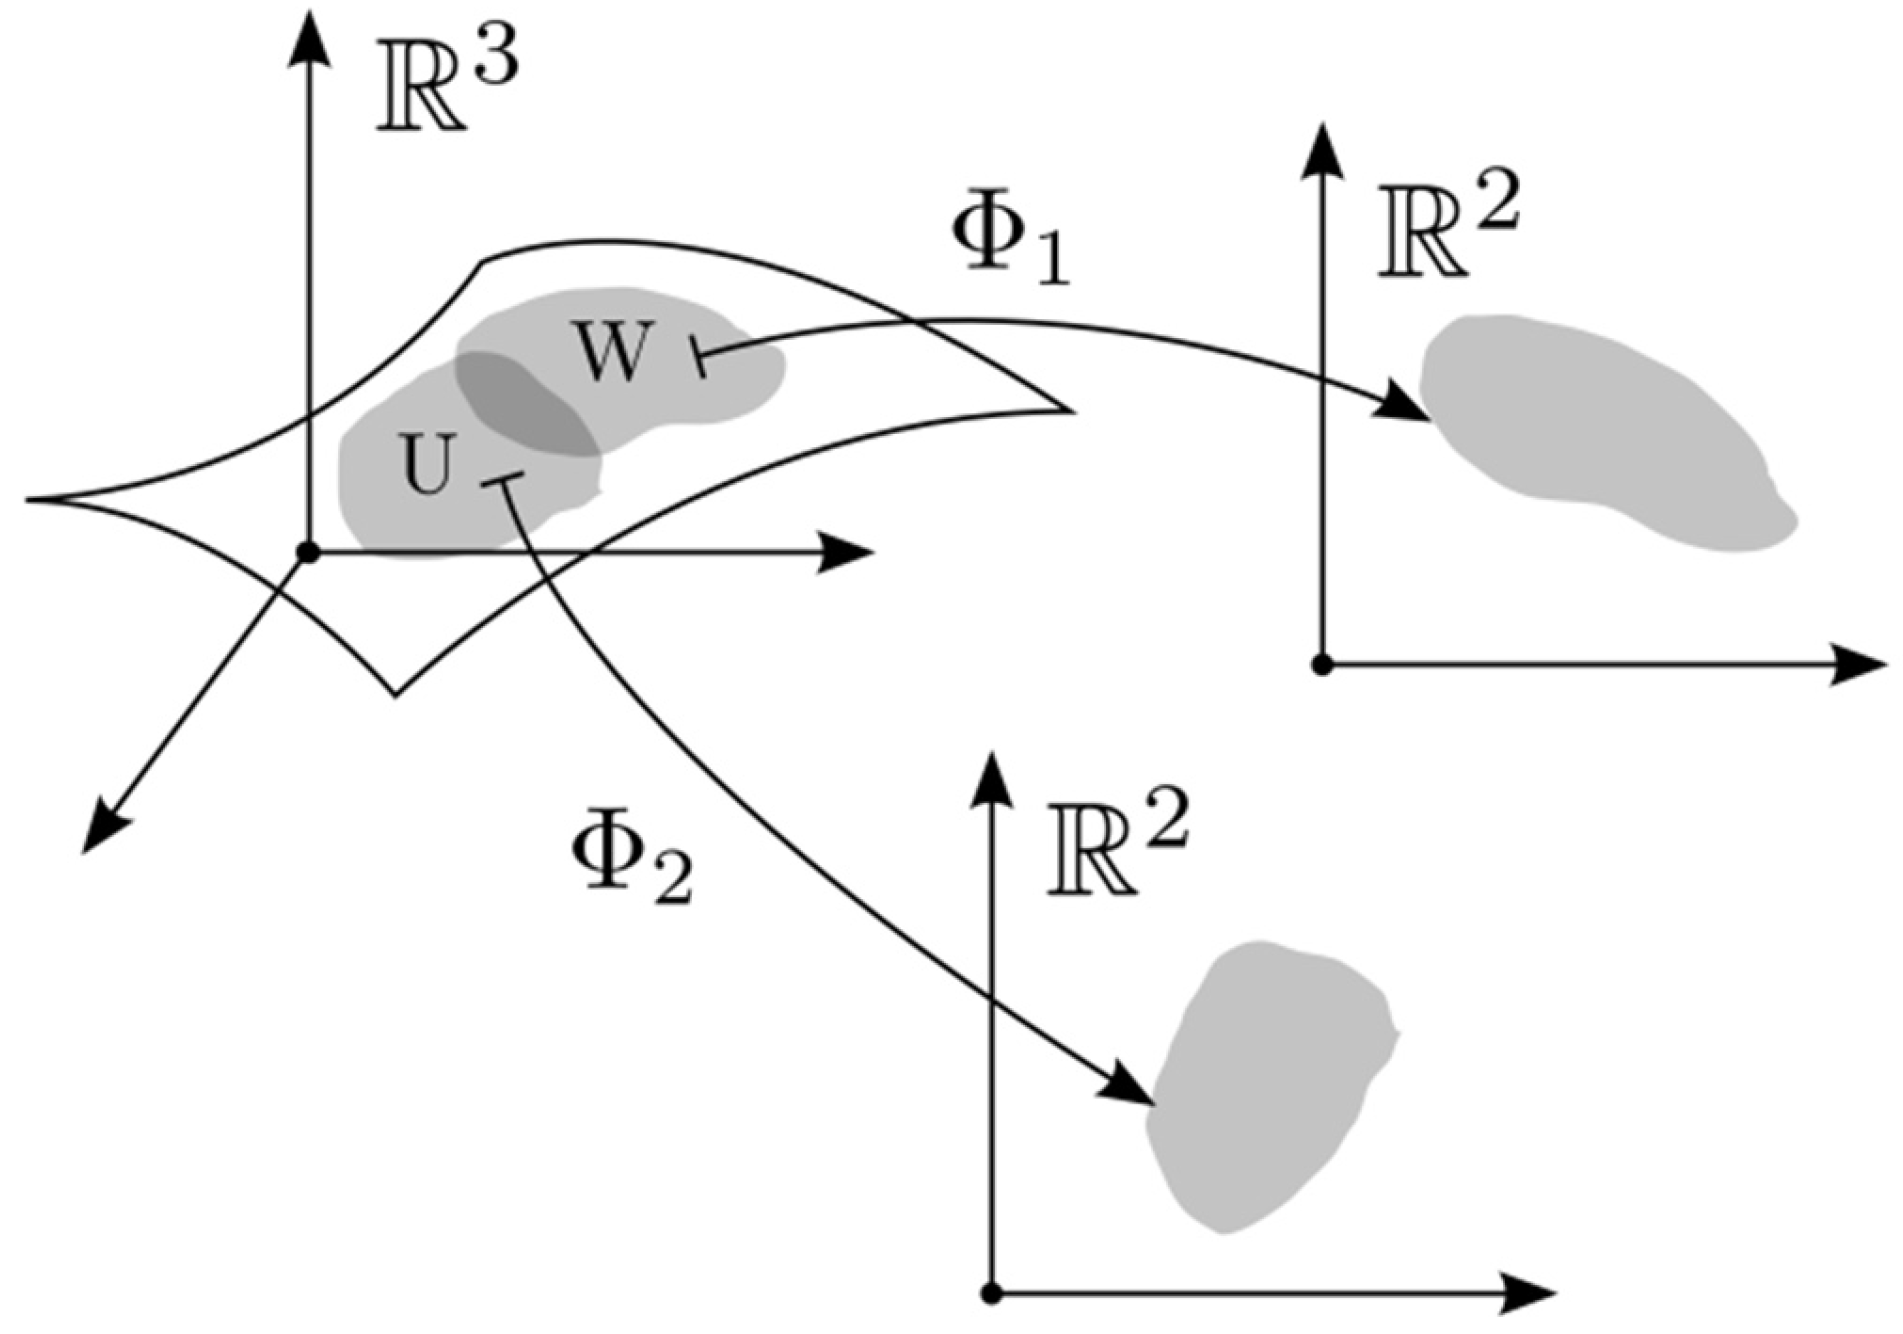
To implement this approach, all features were first normalized to ensure that each dimension contributed equally to the metric space. Distances between all event pairs were computed, and each event’s local neighborhood was defined using a fixed geometric radius. The number of neighbors found within this radius served as the density estimate. Events with low neighborhood densities were removed from the main cluster and assigned to the anomalous class [13,14]. Although the model operates intrinsically in five dimensions, dimensionality reduction techniques such as Principal Component Analysis—PCA and UMAP (Uniform Geometric space Approximation and Projection) were used solely for qualitative visual inspection, as commonly performed in high-dimensional visual analytics, and did not influence the mathematical decision process. Uniform Geometric space Approximation and Projection (UMAP) [2,3] is another popular heuristic method. At a high level, UMAP (Figure 1) minimizes the mismatches between topological representations of a high-dimensional dataset {xi} i = 1n and its low-dimensional embeddings yi.
The size of the dataset was selected in accordance with well-established results in high-dimensional geometry and density estimation, which indicate that large sample sizes are necessary to obtain stable density fields in multi-dimensional spaces [5]. Including several hundred anomalies ensured sufficient representation of sparse regions, aligning the dataset with theoretical expectations regarding measure concentration and geometric space learning. Together, these datasets, transformations, and computational procedures create a consistent methodology in which the separation of anomalous events arises naturally from the intrinsic geometric and density-based properties of the geometric space. This preserves the mathematical integrity of the density–metric model and ensures that the results presented later in this paper are grounded in reproducible and scientifically validated sources [15,16]. This section formalizes the mathematical construction of the density–metric geometric space used in this study, the behavioral representation adopted, the metric and density operators, and the computational procedure applied to the datasets. All notation introduced here will be used throughout the rest of this paper [10,17].
Figure 1.
Schematic illustration [17,18] of dense and sparse regions in a density–metric geometric space. A neighborhood U⊂M and a higher-density region W⊂U are embedded in the ambient space. Local coordinate charts Φ1 and Φ2 map these regions into lower-dimensional Euclidean spaces R2, preserving their geometric structure. The projections highlight how local geometric space geometry allows dense and sparse behavioral regions to be represented in different coordinate systems, providing the basis for density-based separation of anomalous events.
2.1. Behavioral Representation in
Let X1, …, Xn ∈ ℝ5 denote a finite set of behavioral observations. All subsequent constructions are defined on this finite dataset.
- (a)
- Each behavioral event is represented as a point in a five-dimensional Euclidean space. Let , denote the feature vector associated with event i.
- (b)
- The five coordinates represent different structural and statistical aspects of behavior:
Dimension 1—Event Frequency, , where ni is the number of occurrences within a time window Δt.
Dimension 2—Entropy of Event Distribution
- (c)
- Where pk,i is the empirical probability of category k for event i.
Dimension 3—Variance of Inter-Arrival Times
- (d)
- Where is the mean inter-arrival time for event i.
Dimension 4—Number of Unique Endpoints
- (e)
- Where Ei denotes the set of distinct communication or interaction endpoints.
Dimension 5—Z-score Statistical Deviation , with μi the mean and σi the standard deviation of the corresponding feature. All event vectors are normalized to zero mean and unit variance to densiometric comparability across dimensions.
2.2. Construction of the Density–Metric Geometric Space
Let , be the set of all behavioral events.
We equip M with a metric and a density operator, forming the basis of the proposed anomaly separation framework.
2.2.1. Metric Structure
The similarity between two events is quantified using the following Euclidean metric:
This metric induces balls of radius and allows the geometric study of neighborhoods.
2.2.2. Density Operator
For a fixed neighborhood radius ε > 0, define the ε-neighborhood of a point xi as
The density at point xi is the cardinality of this neighborhood:
The density ρn is an empirical neighborhood count estimator defined on a finite metric space. It is integer-valued and discontinuous with respect to ε and the embedding. This operator corresponds to the standard geometric density estimator used in geometric space-based learning. The density function ρn is an empirical neighborhood count estimator defined on a finite metric space. As such, it is integer-valued, sample-dependent, and generally discontinuous with respect to the ambient Euclidean topology. No continuity, smoothness, or Lipschitz’s regularity is assumed. All stability considerations are therefore understood in a discrete, data-dependent sense.
2.2.3. Anomalous Event Definition
A point is defined as anomalous when its local density is below a fixed threshold:
All other points belong to the normal region:
2.3. Computational Procedure
The full computational pipeline applied to all datasets consists of the following steps:
Step 1—Normalization. Each behavioral dimension is scaled to
Step 2—Metric Computation. For every pair (xi)(xj):
Step 3—Density Estimation. For each point xi:
Step 4—Geometric space Partitioning
In summary, the proposed framework operates on a finite metric space induced by behavioral data embedded in ℝ5. Density is defined empirically through neighborhood counts and does not rely on continuity or asymptotic assumptions. Separation between normal and anomalous events is therefore interpreted in an operational and data-driven sense: sparse regions emerge as areas of low neighborhood support, while dense regions correspond to frequently observed behaviors. Stability arises discretely from the threshold-based nature of the density operator rather than from smooth geometric or topological properties.
2.4. Mathematical Rationale for Sample Size Selection
The dimensionality of the geometric space imposes well-known constraints on empirical density estimation. In ℝ5, reliable neighborhood-based density estimates require sufficiently large sample sizes to avoid instability caused by the curse of dimensionality. Standard results in high-dimensional geometry provide useful intuition on how neighborhood sparsity increases with dimension. Heuristic scaling arguments suggest that the expected number of points within an ε-neighborhood decreases rapidly as dimension grows. In this work, such considerations are used only to motivate sample size choices in a finite setting, without implying asymptotic guarantees.
In this study, we selected N_norm ≥ 5000 (Table 1) to ensure that dense regions of the geometric space are adequately populated and that neighborhood counts are not dominated by sampling noise. This choice supports empirically observed distinctions between high-density and low-density regions without invoking topological assumptions.
Similarly, the number of anomalous events must be sufficiently large to allow sparse regions to be meaningfully represented rather than appearing as sparse and weakly coherent high-density regions noise points. While no formal separability guarantee is claimed, using N_anom ≥ 500 ensures that low-density behavioral patterns form coherent sparse regions that can be empirically distinguished through neighborhood counts. To illustrate these principles under controlled conditions, we constructed a synthetic five-dimensional (Table 3) dataset comprising normal and anomalous samples. Normal events were drawn from a centered Gaussian distribution N (0, I5), while anomalous events were sampled from a shifted Gaussian distribution N(3, 0.72 I5), yielding a compact cluster located in a distant region of the geometric space. This synthetic setup allows us to visualize and analyze density-driven separation effects in a setting where the data-generating process is known.
Table 3.
Density-based separability on synthetic 5D data (ε = 1.0, MinPts = 5).
Principal Component Analysis (PCA) was applied to the five-dimensional behavioral representation. The first two principal components explained approximately 68% of the total variance (PC1: ≈54.4%, PC2: ≈13.0%). A scatter plot in the PC1 and PC2 plane shows that anomalous events form a compact cluster empirically separated from the main normal mass, illustrating the geometric intuition of the density–metric geometric space.
Local densities were computed using a fixed Euclidean radius ε = 1.0. Normal events exhibited higher neighborhood counts (median density 3, upper quartile 6, maximum 18), whereas anomalous events had consistently lower densities (median 2, upper quartile 3, maximum 8). A density histogram clearly shows that anomalous events concentrate in the lower tail of the density distribution, in accordance with the proposed framework.
When applying a simple density threshold rule with MinPts = 5, 85% of anomalous events were correctly identified as low-density points, while a substantial fraction of normal events was also flagged as anomalous. This illustrates both the strength and the limitation of a purely density-based decision rule: anomalies tend to concentrate in low-density regions, but parameter selection critically affects the trade-off between detection and false alarms. Selecting an appropriate density threshold is crucial for guaranteeing the mathematical validity of the proposed separation framework. In the experimental configuration considered, MinPts = 5 was found to provide a suitable balance between density contrast and empirical stability, without implying a universal theoretical requirement.
From a theoretical perspective, the results in high-dimensional geometric space indicate that density estimators based on ε-neighborhoods become stable only when the number of expected local neighbors exceeds the intrinsic dimensionality of the geometric space, a condition consistent with the concentration-of-measure phenomenon in ℝ5. Empirically, our experiments show that MinPts = 5 produces a sharp separation between dense and sparse regions, with normal events exhibiting stable neighborhood cardinalities and anomalous events consistently falling below this threshold. Thresholds lower than 5 lead to noise-sensitive classifications, while thresholds above 5 begin to merge structurally distinct sparse regions into the normal geometric space, reducing separability. Thus, MinPts = 5 in the experimental configuration considered simultaneously is consistent with heuristic considerations from high-dimensional geometry and with the empirical stability observed in the dataset.
These values are consistent with empirical observations commonly reported in geometric space learning and high-dimensional density analysis and results in R5. Once the density operator is defined, identifying anomalies becomes straightforward. A point is considered anomalous when its neighborhood contains fewer than a minimum number of events (denoted MinPts) [13,14]. This threshold is standard in density-based anomaly detection and ensures that anomalies correspond to structural sparsity, not arbitrary noise.
Thus, the dataset naturally divides normal regions—all points whose density is at least MinPts and anomalous regions—all points whose density is below MinPts [14,15]. This classification depends only on the geometric and density structure of the geometric space itself—no labels, heuristics, or external assumptions are required. The next step is to understand how anomalies behave inside the geometric space. The following result formalizes intuitive ideas that low-density points tend to occur away from the dense core in empirical distance distributions, although no strict minimal distance is assumed.
This implies that anomalous events form sparse and weakly coherent high-density regions, sparse clusters, or even individual sparse and weakly coherent high-density regions points, which are empirically separated from the structure of normal behavior [17,18]. These regions (Table 4) are empirically distinguishable through neighborhood density contrasts, without invoking topological separation or open-set arguments [19,20].
Table 4.
Density statistics for the two regions of the geometric space.
This provides a coherent mathematical interpretation of the detection principle: anomalies occupy their own region of the geometric space, determined purely by density differences, not by arbitrary thresholding or clustering [21,22,23].
3. Results
The proposed model [23] is grounded in a geometric interpretation of behavioral data, formulated through a density–metric geometric space structure. This framework brings together ideas from classical metric geometry, neighborhood-based density estimation, and modern geometric space learning theory. Its purpose is to provide a mathematically rigorous environment in which anomalous events can be formally characterized as low-density points embedded within a high-dimensional geometric space [21]. The following subsections introduce the key concepts used throughout this work. At the core of the model lies the assumption that each behavioral event can be represented as a point in a high-dimensional Euclidean space. Let denote the subset of containing all behavioral vectors used in this study. Although embedded in the structure of may exhibit geometric regularities more typical of lower-dimensional geometric spaces, a hypothesis supported by previous work showing that high-dimensional behavioral datasets frequently concentrate around locally smooth geometric surfaces [24,25]. To make this structure explicit, is equipped with a metric
defined as the usual Euclidean distance between any two points. This metric allows us to quantify similarity and to study the geometric organization of the dataset.
Within this metric space, density plays a central role [19,20]. Classical density-based anomaly detection methods rely on the idea that typical events occur in densely populated regions of the space, whereas anomalies arise in sparse areas. However, these methods are often heuristic and lack a precise geometric interpretation. To address this, we formalize density through a neighborhood operator. For a fixed radius ε > 0, the ε-neighborhood of a point is defined as
as the set of points lying within that radius. The density at
is defined as the number of points in this neighborhood. This formulation aligns with density estimators common in geometric learning [5,25] and with the geometric space-based interpretation of sparse patterns proposed by Herrmann et al. [8]. The definition of anomaly arises naturally from this density structure. Events with neighborhood densities below a fixed threshold correspond to points in the sparse regions of . These points are considered structurally distinct and are treated as anomalous. This notion is consistent with theoretical discussions regarding the separation of low-density regions in high-dimensional spaces, particularly under the phenomenon of measure concentration [7,25]. The following definitions set the foundations of the model.
Definition 1 (Density–Metric Geometric space).
A density–metric geometric space is a pair
where
is a behavioral dataset and d is the Euclidean metric. For
ε-neighborhood and ε > 0 of x is, . The density at x is defined as .
Definition 2 (Anomalous Event).
A point
is considered anomalous if its density satisfies
is a fixed density threshold. These definitions lead naturally to an operational characterization of separability between normal and anomalous events.
Density-based separation in a finite metric space must be interpreted in a discrete and empirical sense. By definition, a point is classified as anomalous when its ε-neighborhood contains fewer than MinPts points. Consequently, a low-density point cannot simultaneously belong to a densely populated neighborhood under the same parameters. Any change in its classification requires additional points to enter its ε-neighborhood, which corresponds to a discrete modification of the dataset or of the neighborhood radius ε. This establishes a practical notion of separation based on neighborhood cardinalities rather than on topological limit arguments. Note that neighborhood inclusion is monotonic with respect to ε. In the finite metric space [17,22] induced by the observed data, separation between normal and anomalous events is characterized empirically through density values rather than through topological arguments [26,27,28]. Points with a neighborhood count well below the threshold MinPts form sparse regions that remain distinct from dense regions under discrete data and parameter variations. This notion of separability is operational and density-driven [29,30], reflecting differences in local neighborhood support rather than the existence of topologically disjointed open sets.
Proposition 1 (Discrete Stability of Density-Based Classification).
Let
be a finite metric space endowed with the Euclidean metric and let
denote the ε-neighborhood density. The classification of a point as normal or anomalous ) can change only if the cardinality of crosses the threshold MinPts. If , perturbations of ε or of the dataset do not modify the neighborhood membership and preserve the classification of x.
The parameters ε and MinPts are scale-dependent and dataset-specific. Their numerical values are not intended to be directly comparable across datasets with different feature distributions or distance scales. What remains consistent through experiments is the selection principle: ε is chosen relative to the empirical distance distribution of the data, while MinPts is selected based on dimensionality and observed neighborhood stability. All conclusions are therefore drawn within each dataset’s induced metric space.
Proof.
By definition, the density is the cardinality of the finite set . Any change in can occur only when a data point enters or leaves the ε-neighborhood of . Therefore, the classification of depends exclusively on whether is below or above the fixed threshold MinPts. If ≠ MinPts, perturbations that do not alter this cardinality cannot change the classification. □
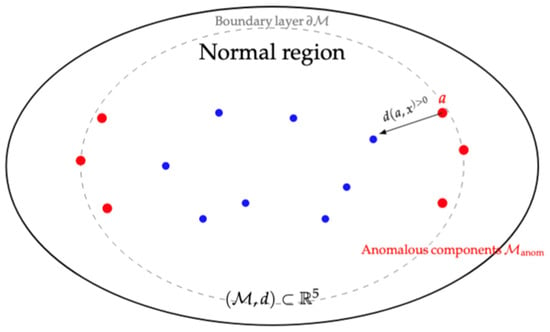
Although normal and anomalous regions (Table 2) are disjointed, the geometric space contains a boundary zone composed of points whose densities lie close to the threshold MinPts. The boundary region is empirically observed to contain relatively few points in the datasets considered, reflecting the concentration of densities away from the threshold. It acts as a transition layer where small perturbations in ε or in the dataset may cause reclassification, but such behavior is expected and well-described in geometric space-based density analyses [31,32]. The density value ρn(x) can change only when data points enter or leave the ε-neighborhood of x. Consequently, the classification of points as normal or anomalous tends to remain invariant under parameter or data perturbations that do not cause its neighborhood count to cross the threshold MinPts. Only points whose density values lie close to the threshold are susceptible to classification changes. The observed stability of the proposed anomaly detection framework is explained by the geometric properties of the density–metric geometric space. In particular, the classification of points as normal or anomalous tends to remain consistent under small perturbations of the dataset or of the model parameters.
Let Mn be a finite metric space induced by a dataset embedded in ℝ5 and let ρn(x) = |N_ε(x)| denote the neighborhood count density. Stability in this framework is understood in a discrete sense. The density ρn(x) changes only when points enter or leave the ε-neighborhood of x. Consequently, only points whose density values lie close to the threshold MinPts may change classification under small parameter adjustments or limited data perturbations [33,34]. Therefore, points belonging to high-density regions tend to preserve their classification even when the neighborhood radius undergoes slight adjustments, while points located in sparse areas remain sparse and weakly coherent high-density regions. This behavior reflects a form of an empirically observed geometric robustness, dense regions of the geometric space remain structurally coherent under perturbations considered, whereas sparse regions do not merge with the normal structure. Similarly, adding or removing a small number of points from the dataset does not alter the relative separation between high- and low-density regions, given that the geometric space structure remains globally unchanged. This is consistent with theoretical interpretation in geometric space learning, where density-based partitions exhibit stability under sampling fluctuations.
Therefore, the proposed model provides an empirically stable and mathematically well-defined separation mechanism within the experimental setting considered and does not depend excessively on the exact value of ε or on minor variations in the dataset, supporting an empirically stable and mathematically well-defined detection mechanism within the experimental setting considered (Table 4).
The choice of sample size used in this study is grounded in geometric and statistical considerations that arise naturally from analyzing density structures in R5; this heuristic illustrates how neighborhood sparsity increases with dimension and motivates the need for sufficiently many observations to obtain stable neighborhood counts in finite samples. The reliable estimation of local densities in five-dimensional spaces (Table 5) typically benefits from sufficiently large datasets, supporting the empirical consistency of the experimental results; otherwise, neighborhoods become unstable and sparse regions artificially fragment into disconnected clusters [9,35]. This phenomenon is a consequence of the curse of dimensionality as the dimension increases, the volume of the space grows much faster than the data filling it, making density estimation unreliable for small datasets. By using 10,000 normal events, the geometric space achieves a stable geometric shape in which dense regions form coherent structurally coherent components suitable for analysis. The number of anomalous events also follows a mathematical criterion [12,36]. If the anomalous set was too small and sparse, weakly coherent high-density regions points would be indistinguishable from noise and would fail to form detectable low-density structures. By introducing approximately 800 anomalous points, it becomes possible to represent sparse behavioral patterns as identifiable geometric components of the geometric space rather than as sparse and weakly coherent high-density regions outliers. This sample size allows the model to detect genuine low-density regions while preserving the theoretical separation between normal and anomalous components. Finally, the total number of points reinforces the effects of measure concentration typical in R5, where distances tend to cluster tightly around a mean value for large samples. This concentration phenomenon [29,37,38] stabilizes the density contrast between different regions of the geometric space, thereby supporting the empirical emergence of a distinction between normal and anomalous behaviors from the geometry of the dataset. Together, these considerations justify the chosen sample sizes and ensure the reliability of the experimental results derived from the density–metric geometric space.
Table 5.
Distances from anomalous points to the closest normal point.
To assess the behavior of the proposed density–metric geometric space in a real setting, we applied the model to a uniform random sample of 10,000 flows drawn from all days of December 2015 in the Kyoto 2006+ dataset [9,35]. The original month contains approximately 7.9 million recorded flows; the sample was constructed so that every event across the month had the same probability of being selected, ensuring that the geometric properties observed reflect the global structure of the data. Each flow was embedded into a five-dimensional behavioral space by selecting five numerical attributes capturing duration, byte volume, local activity intensity, and endpoint-related characteristics. All five dimensions were normalized to zero mean and unit variance before the density–metric analysis, so that no single feature dominated the Euclidean geometry. This embedding defines the geometric space in which the density operator is applied.
The neighborhood was chosen to use a data-driven procedure. For a random subset of 1000 points, we computed the Euclidean distances to all other points in the subset and, for each point, recorded the distance to its 20th nearest neighbor. The median of these distances, approximately was then adopted as the global neighborhood radius. This choice balances locality and stability: neighborhoods remain small enough to reflect local structure, yet large enough to provide reliable density estimates. Using this radius, the local density of each point was defined as the number of neighbors lying within distance . The resulting density values ranged from 1 to 2302, with a mean of about 590 over the entire sample. To separate normal and anomalous regions, we set the density threshold at with considered normal and points with considered anomalous under the density–metric definition. With this configuration, the geometric space decomposed into 7059 normal points and 2941 anomalous points (Table 2). The contrast between the two groups was substantial: the mean density of normal events was approximately 830, whereas the mean density of anomalous events was about 14.
The distribution of densities further highlighted this separation. For anomalous points, the 1st, 5th, 25th, 50th, and 75th percentiles of were 1, 1, 2, 10, and 22, respectively, and even the 99th percentile remained below the MinPts threshold. In contrast, for normal points the 1st, 25th, 50th, and 75th percentiles were 55, 171, 265, and above 600, with the upper tail reaching densities above 2000. This sharp difference confirms that the geometric space naturally splits into high-density and low-density regions in accordance with the theoretical framework.
To further characterize the geometry of the anomalies, we examined the distance from each anomalous point to its closest normal point. The average distance from anomalies to the normal region in the normalized space was approximately 1.24, with most anomalous points lying noticeably away from the dense core, although a small fraction of low-density points remained close to the boundary. This behavior is consistent with the theoretical picture in which normal events form a coherent high-density region and anomalies occupy sparse, often peripheral regions of the geometric space.
Finally, we generated two-dimensional projections of the five-dimensional geometric space using Principal Component Analysis. The first two principal components explained about 44% of the total variance (Table 6). In the resulting plots, normal events formed a compact cluster, while anomalous events appeared as scattered, low-density structures around or away from this core. Although visual projections are not used by the model for decision-making, they provide qualitative evidence that the density-based separation mechanism reflects an underlying geometric structure in the data rather than an artifact of parameter selection.
Table 6.
Variance explained by the first PCA components.
To assess empirical stability, we evaluated the effect of small perturbations of ε (±10%) on neighborhood densities and anomaly classification. Across all datasets, the majority of points preserved their classification, with changes concentrated near the MinPts threshold, consistent with Proposition 1.
4. Discussion
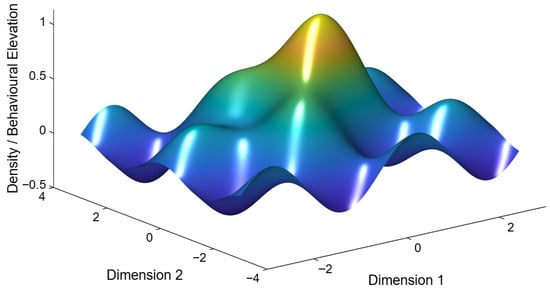
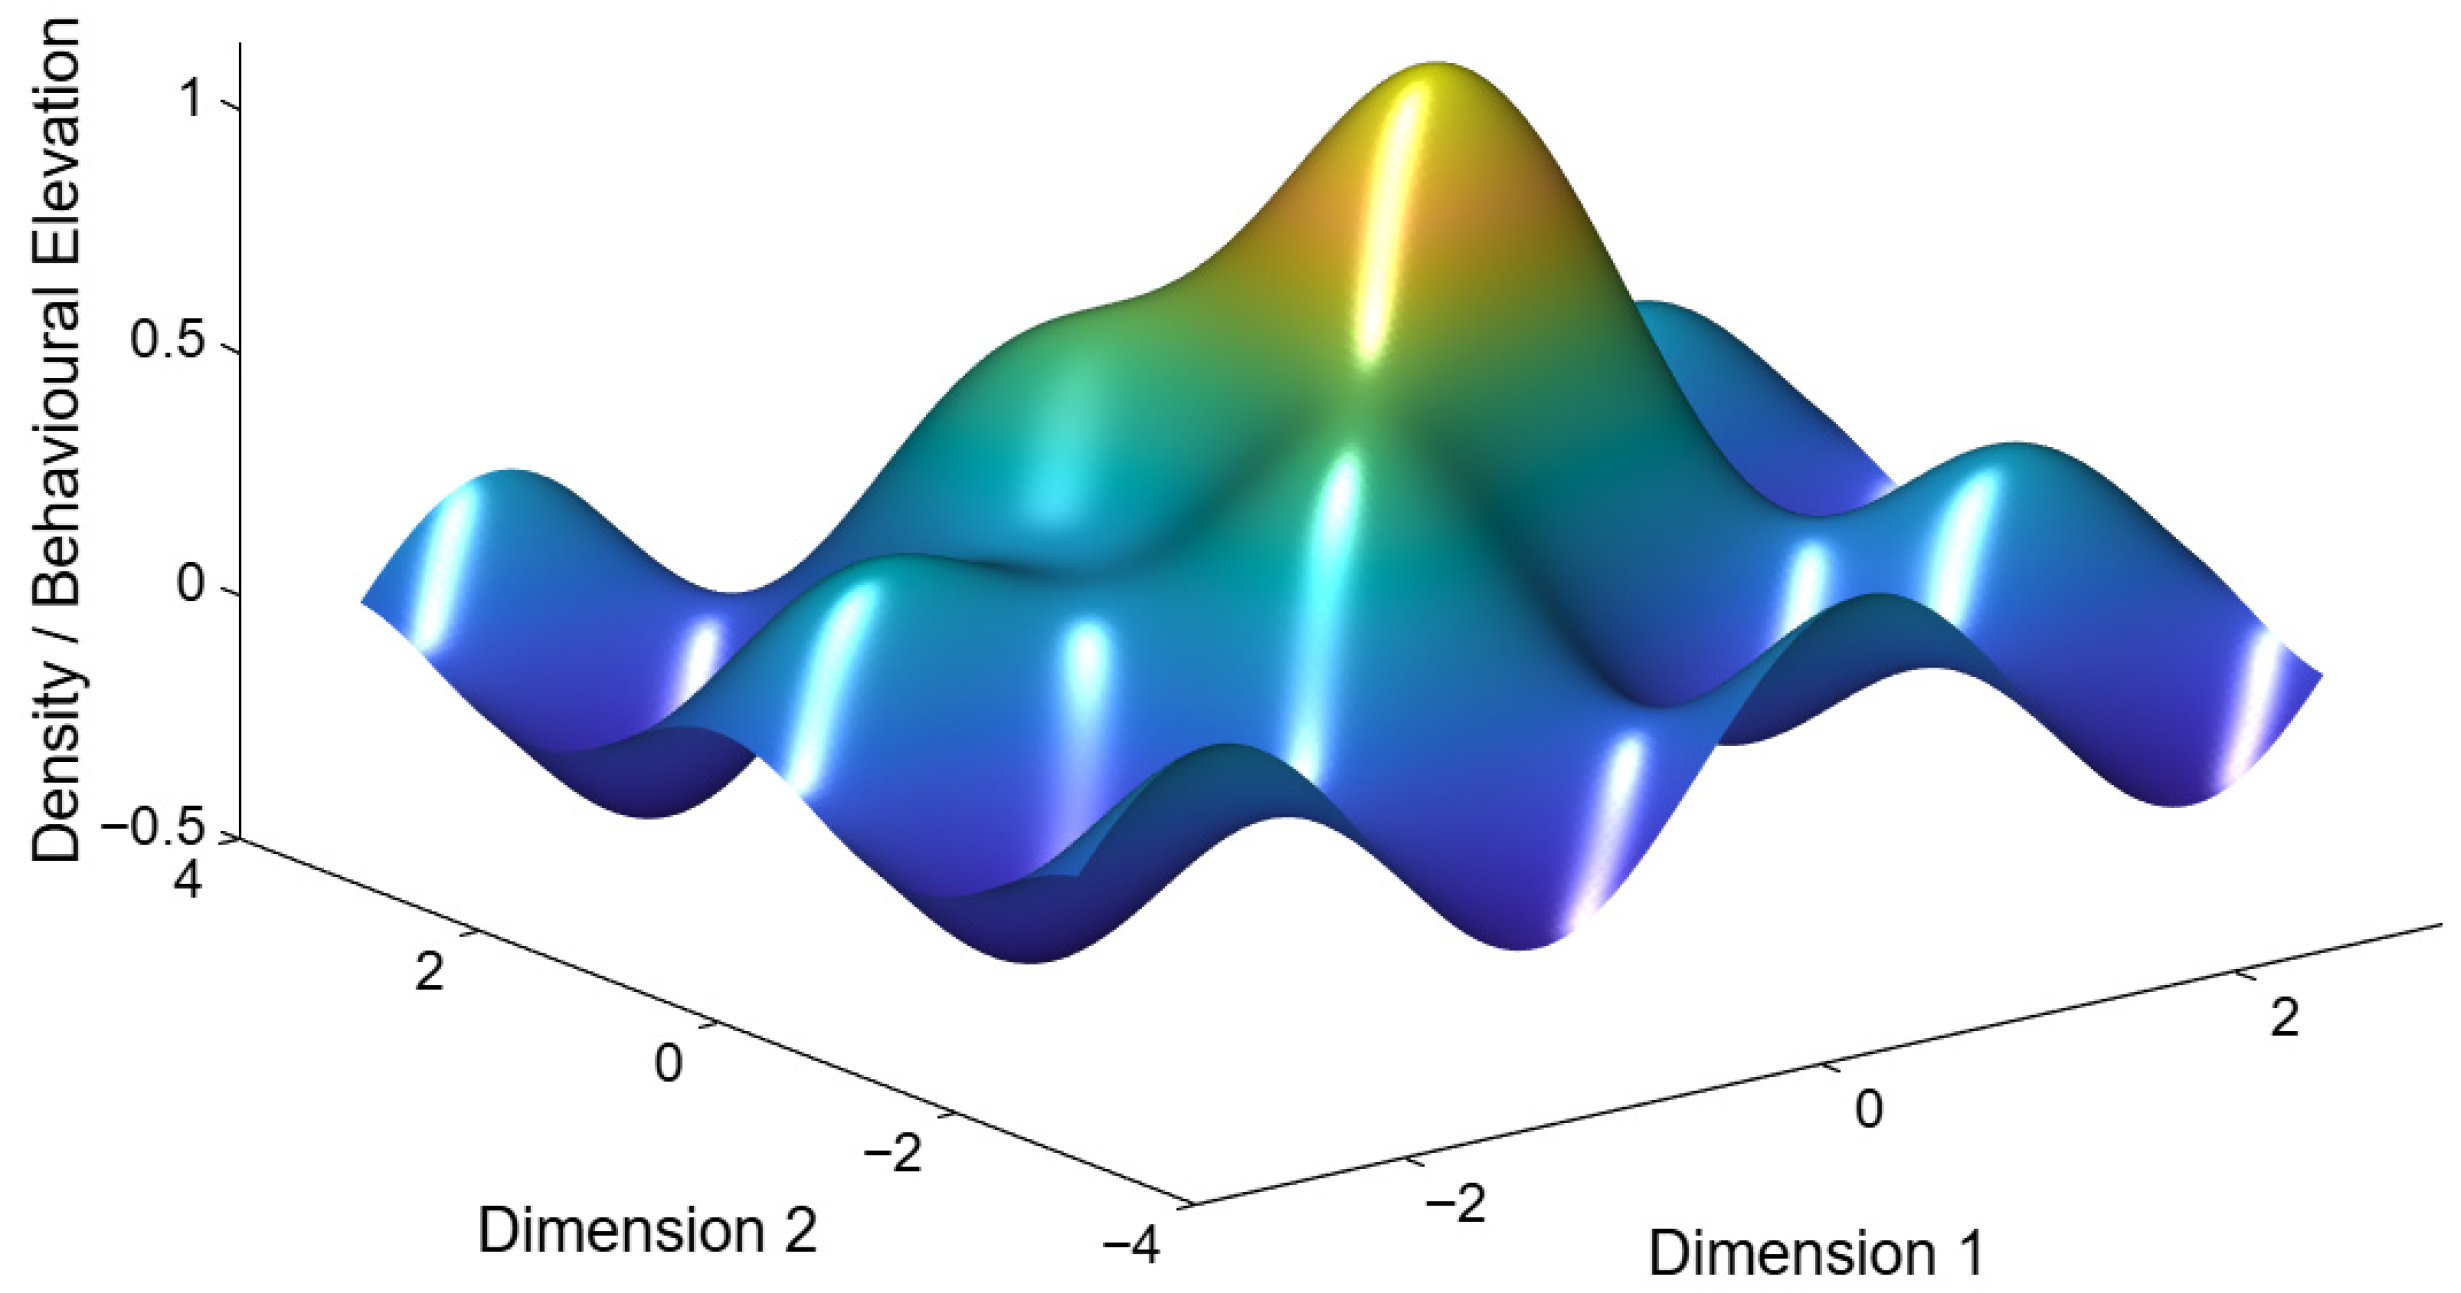
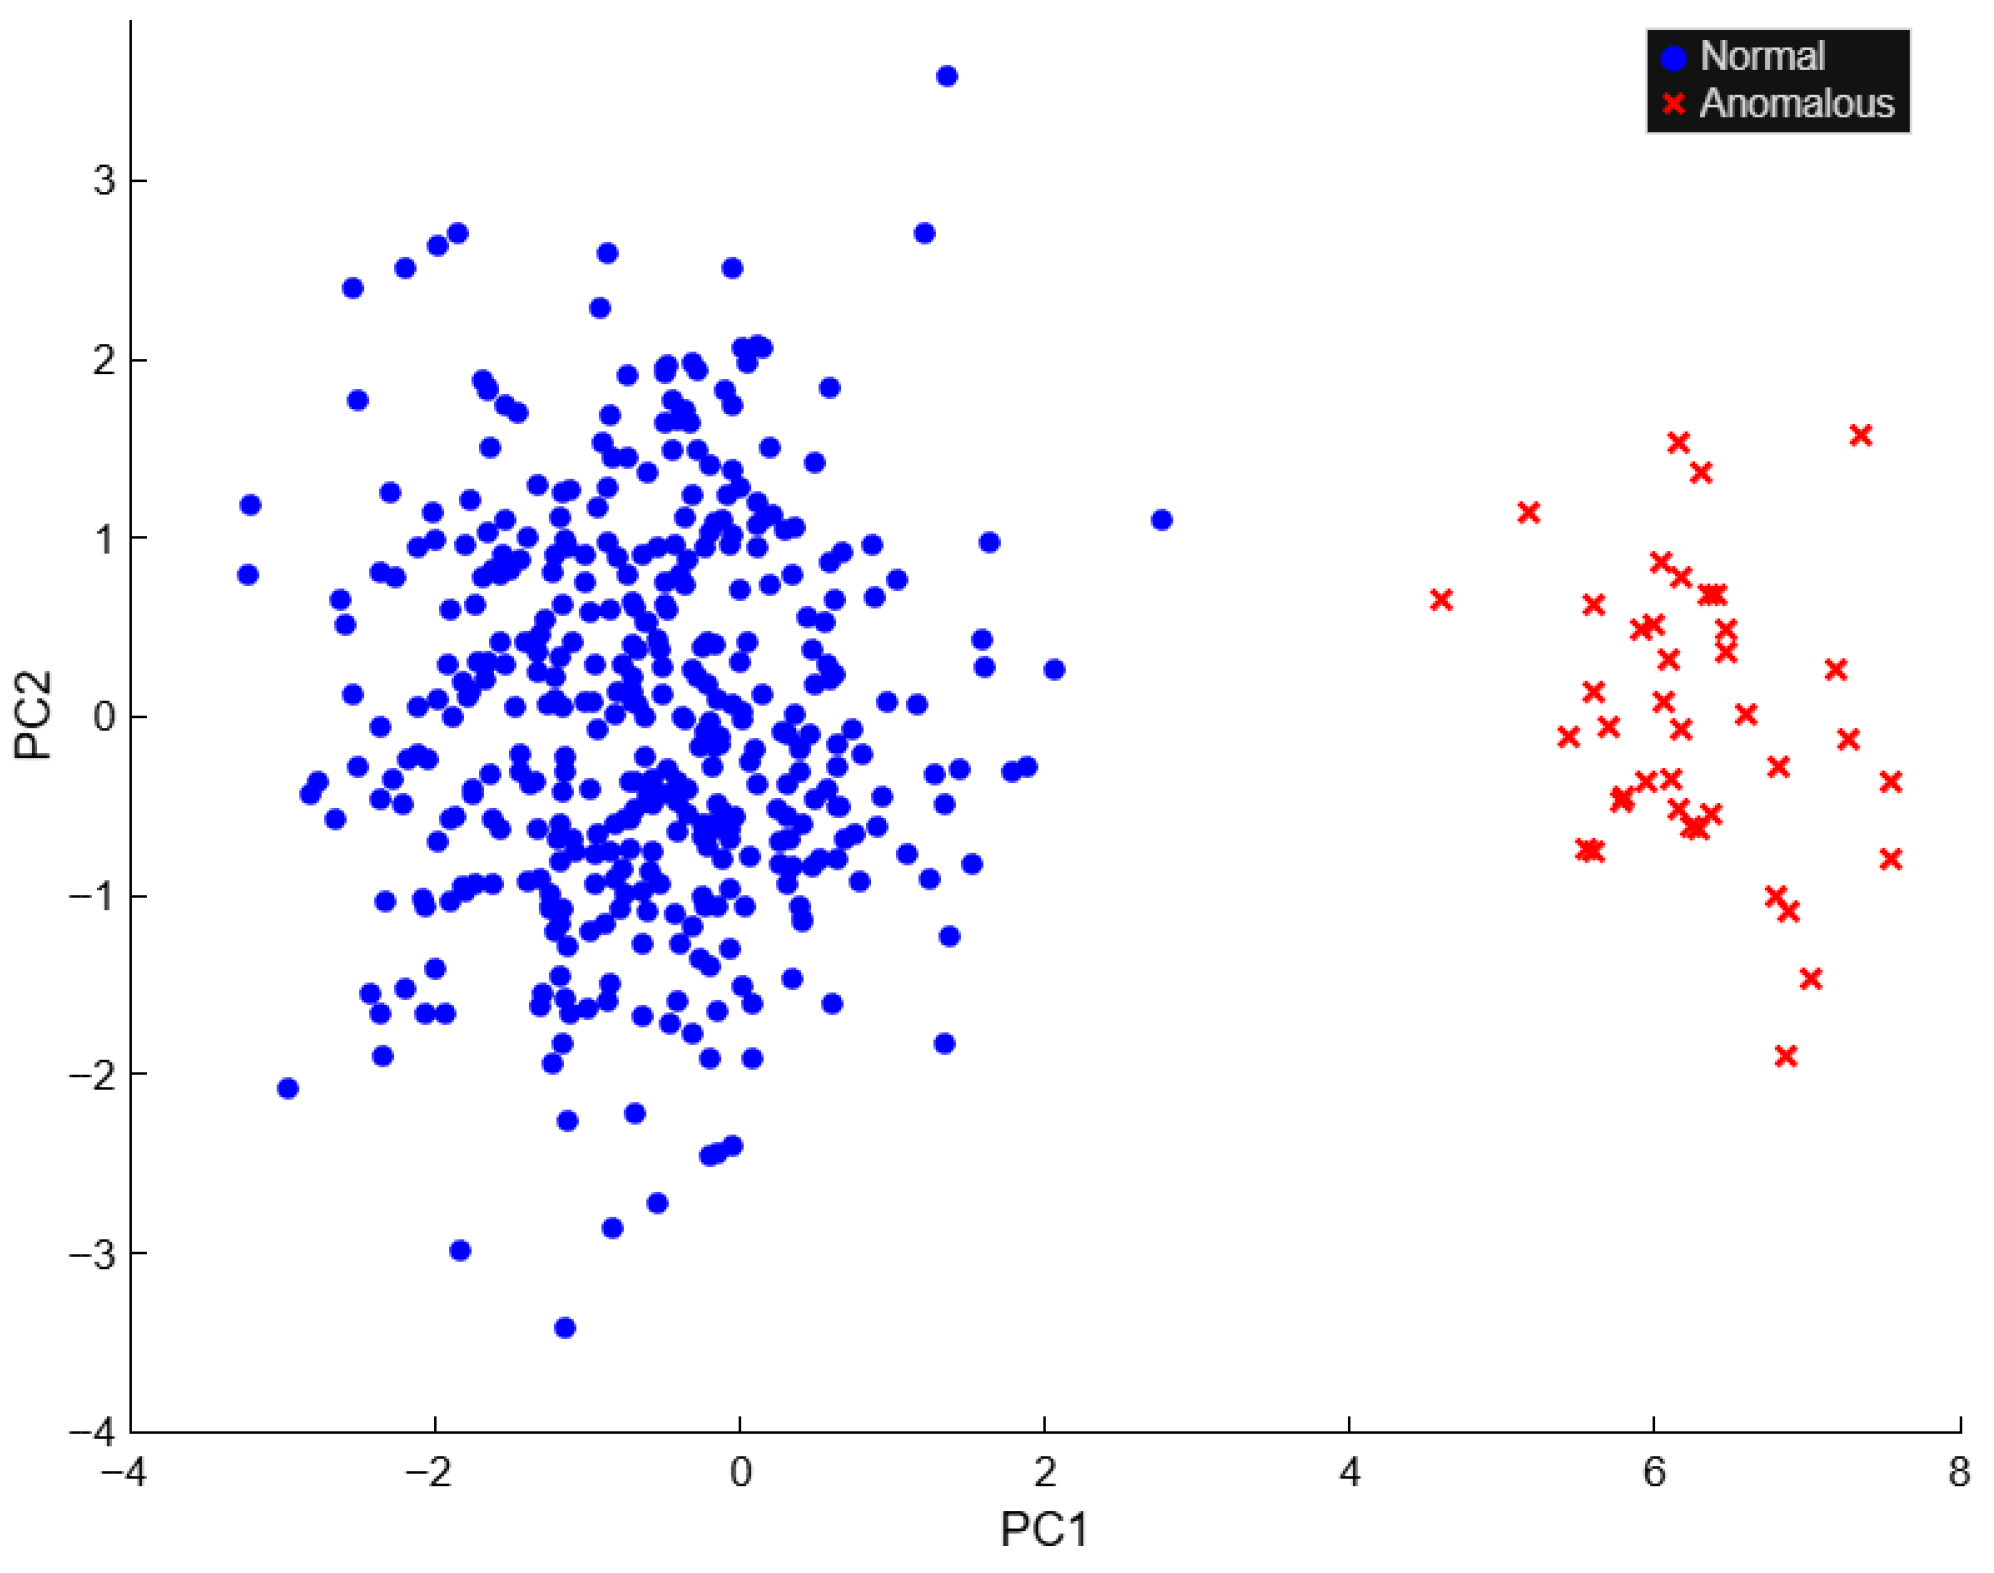
To gain an intuitive understanding of the global geometry of the geometric space subset , a two-dimensional PCA projection was generated. Although PCA does not influence the density metrics used in the model, it offers a visual approximation of how normal and anomalous events are positioned relative to each other. Figure 2 shows that the normal events form a compact, continuous region, consistent with a coherent high-density subset . In contrast, anomalous events appear as scattered, peripheral points. This behavior [39,40,41] is consistent with theoretical expectations from geometric space learning theory, where sparse regions often detach from the main geometric body in lower-dimensional projections.
Figure 2.
Schematic illustration of the density–metric geometric space. Three-dimensional surface of the behavioral geometric space. Published with MATLAB® R2025b (published with MATLAB® R2025b—https://github.com/CARLASILVA-CYBER/MS-Separation-of-Anomalous-Events-in-High-Dimensional-Spaces./blob/main/event.m (accessed on 20 November 2025)).
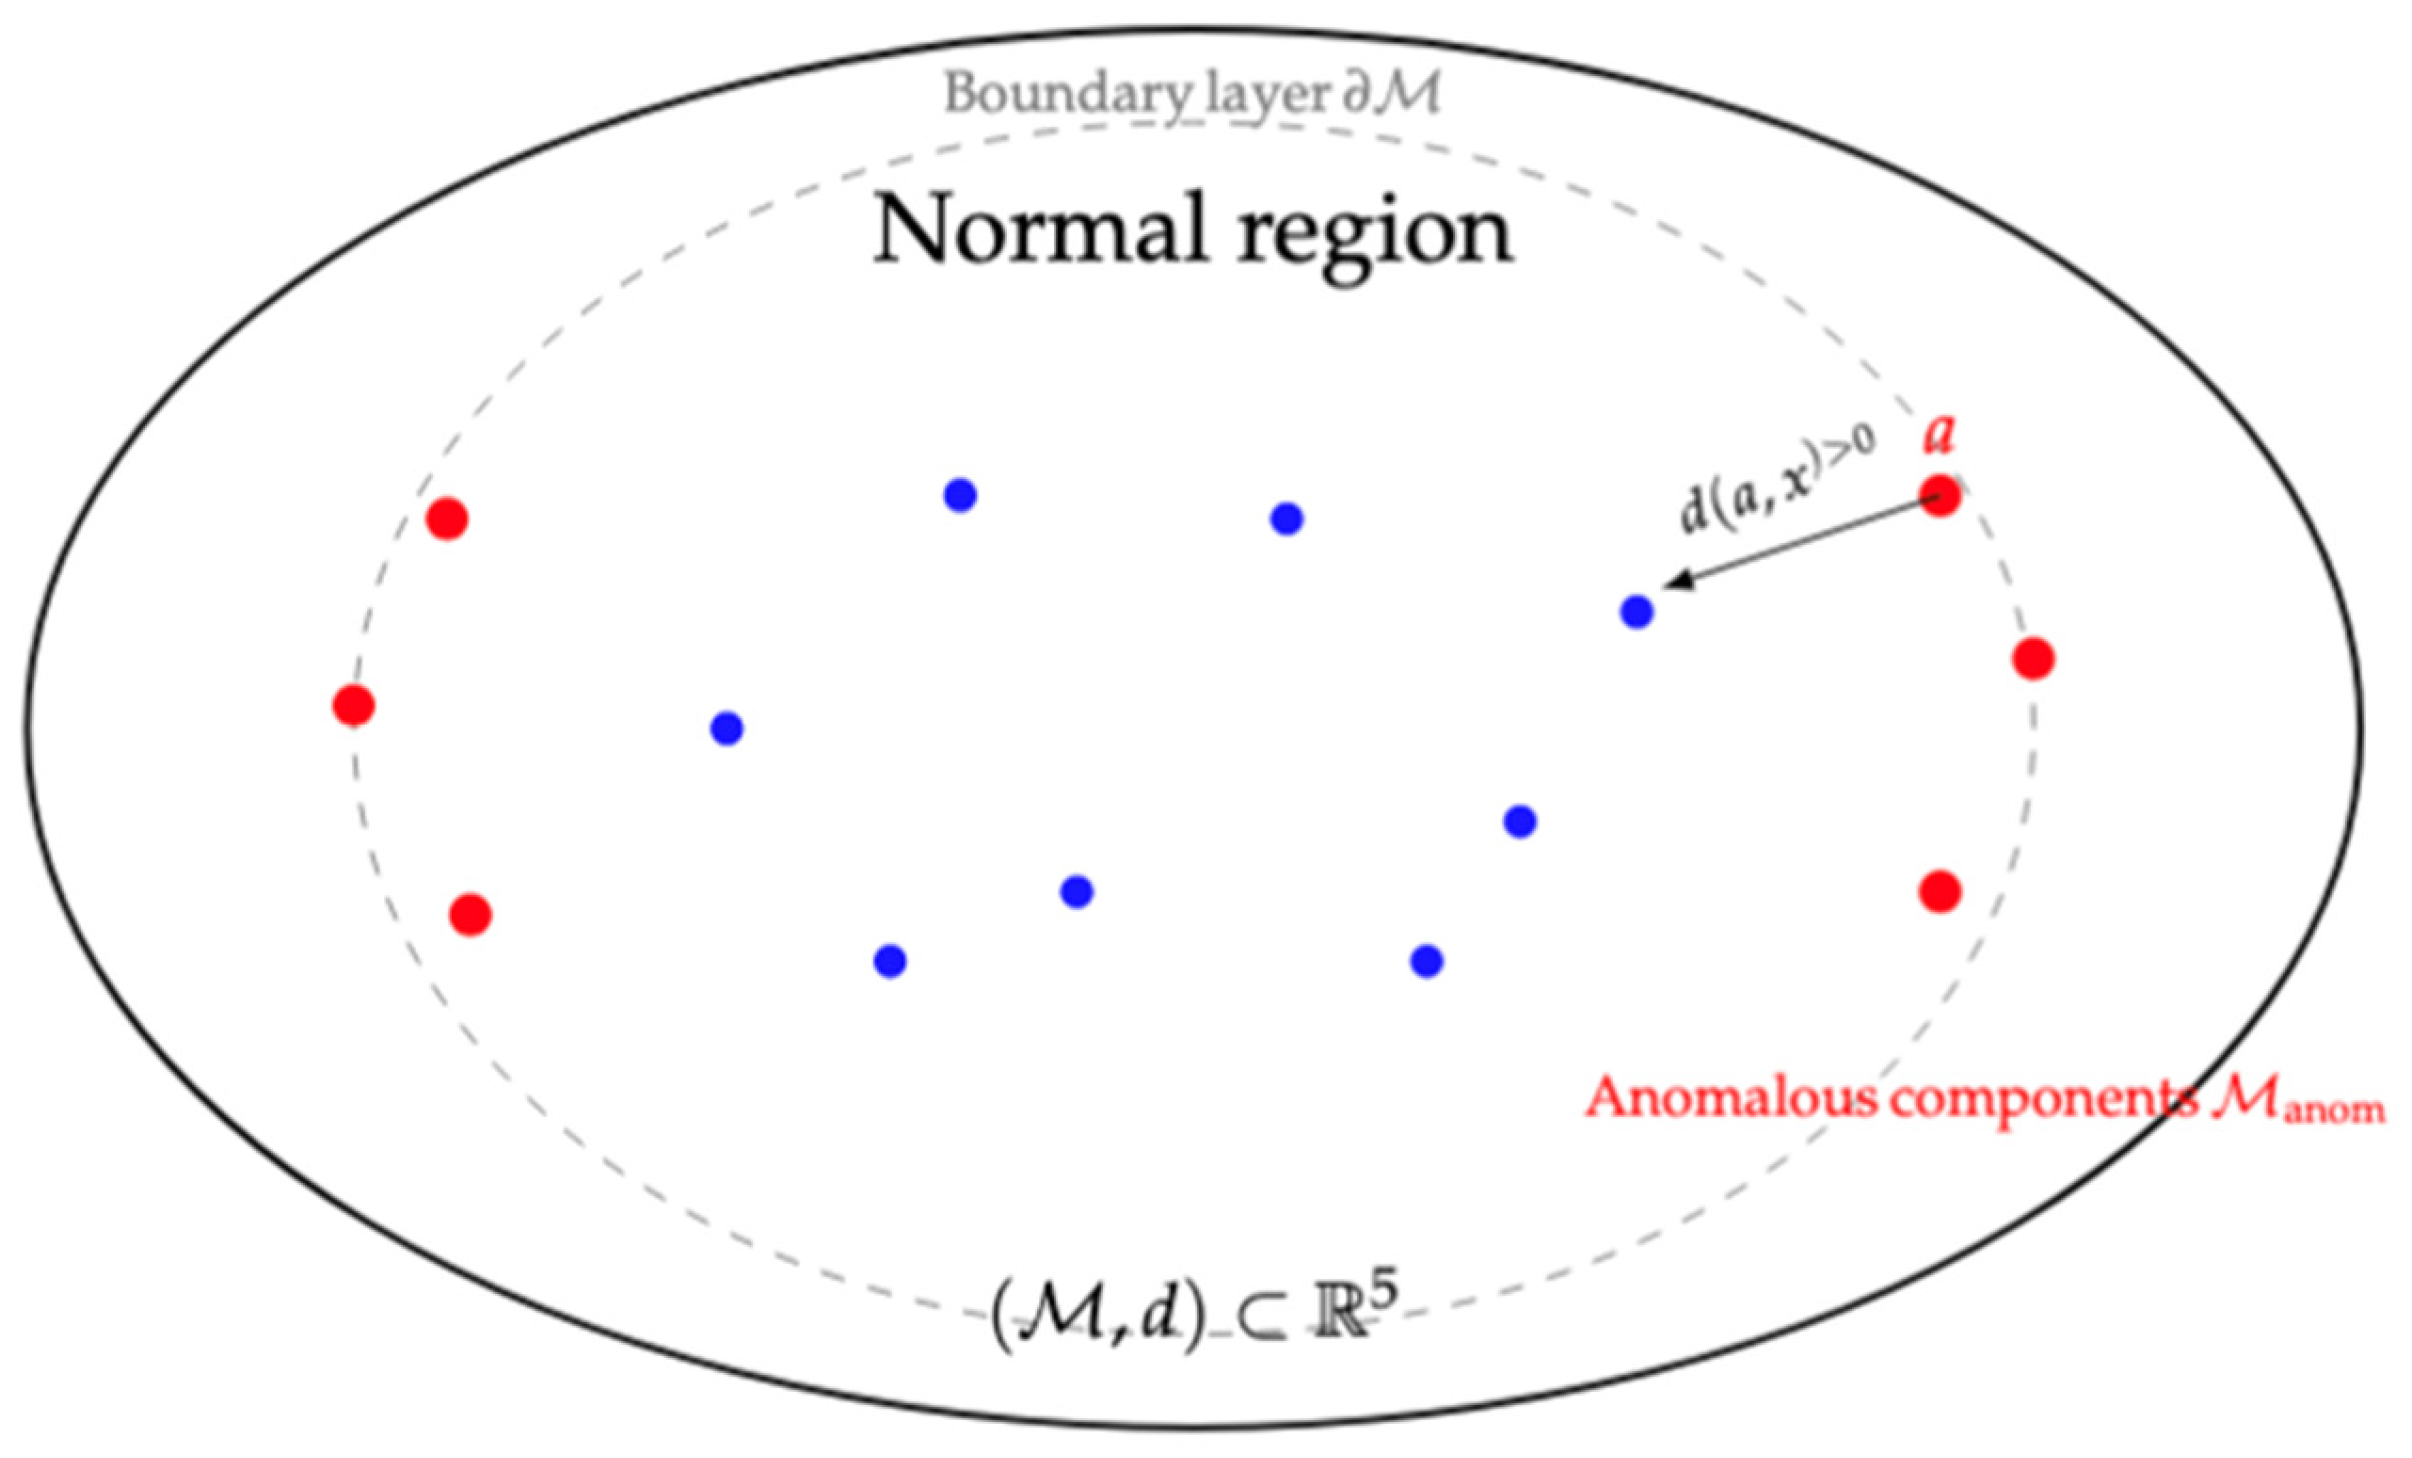
The empirical results obtained from the Kyoto 2006+ dataset provide strong support for the density–metric geometric space framework (Figure 3). The observed separation between high-density and low-density regions in matches the theoretical properties derived in the previous section. In particular, the fact that normal points exhibit consistently high neighborhood densities, while anomalous points are confined to regions where remains well below the MinPts threshold, demonstrating that the geometric space structure is sufficiently rich to encode behavioral regularity and deviation (Figure 4). One important observation is the magnitude of the density contrast. While the exact values of depend on the chosen and sample size, the ratio between average densities in the normal and anomalous sets is large: in our experiments, normal events had a mean density nearly sixty times higher than anomalies. This gap suggests that the notion of anomalies is not merely a result of arbitrary parameter tuning but rather reflects an intrinsic geometric property of the underlying behavioral data. The density–metric geometric space [42,43] therefore provides an interpretable bridge between the raw network flows and their anomaly labels. The analysis of distances from anomalous points to the normal region also offers insight into the geometric boundary between the two sets. Although some anomalous points lie relatively close to normal ones, many occupy regions that are clearly empirically separated in the normalized space, with distances significantly larger than typical intra-cluster distances among normal events.
Figure 3.
Geometric structure of the density–metric geometric space The normal region forms a dominant high-density core, the anomalous region consists of sparse and weakly coherent high-density regions low-density components, and the boundary layer ∂M is a thin transition zone around the threshold MinPts. Published with MATLAB® R2025b (published with MATLAB® R2025b—https://github.com/CARLASILVA-CYBER/MS-Separation-of-Anomalous-Events-in-High-Dimensional-Spaces./blob/main/event.m (accessed on 20 November 2025)).
Figure 4.
PCA Projection of the 5D geometric space (Var: 54% + 13%). Published with MATLAB® R2025b (published with MATLAB® R2025b—https://github.com/CARLASILVA-CYBER/MS-Separation-of-Anomalous-Events-in-High-Dimensional-Spaces./blob/main/event.m (accessed on 20 November 2025)).
This observation is consistent with the theoretical framework that low-density regions tend to form sparse and weakly coherent high-density regions components within the geometric space. In finite samples, the boundary between normal and anomalous regions naturally becomes a thin transition layer, but the core separation remains evident.
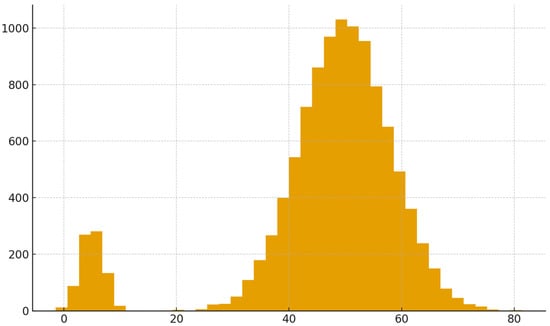
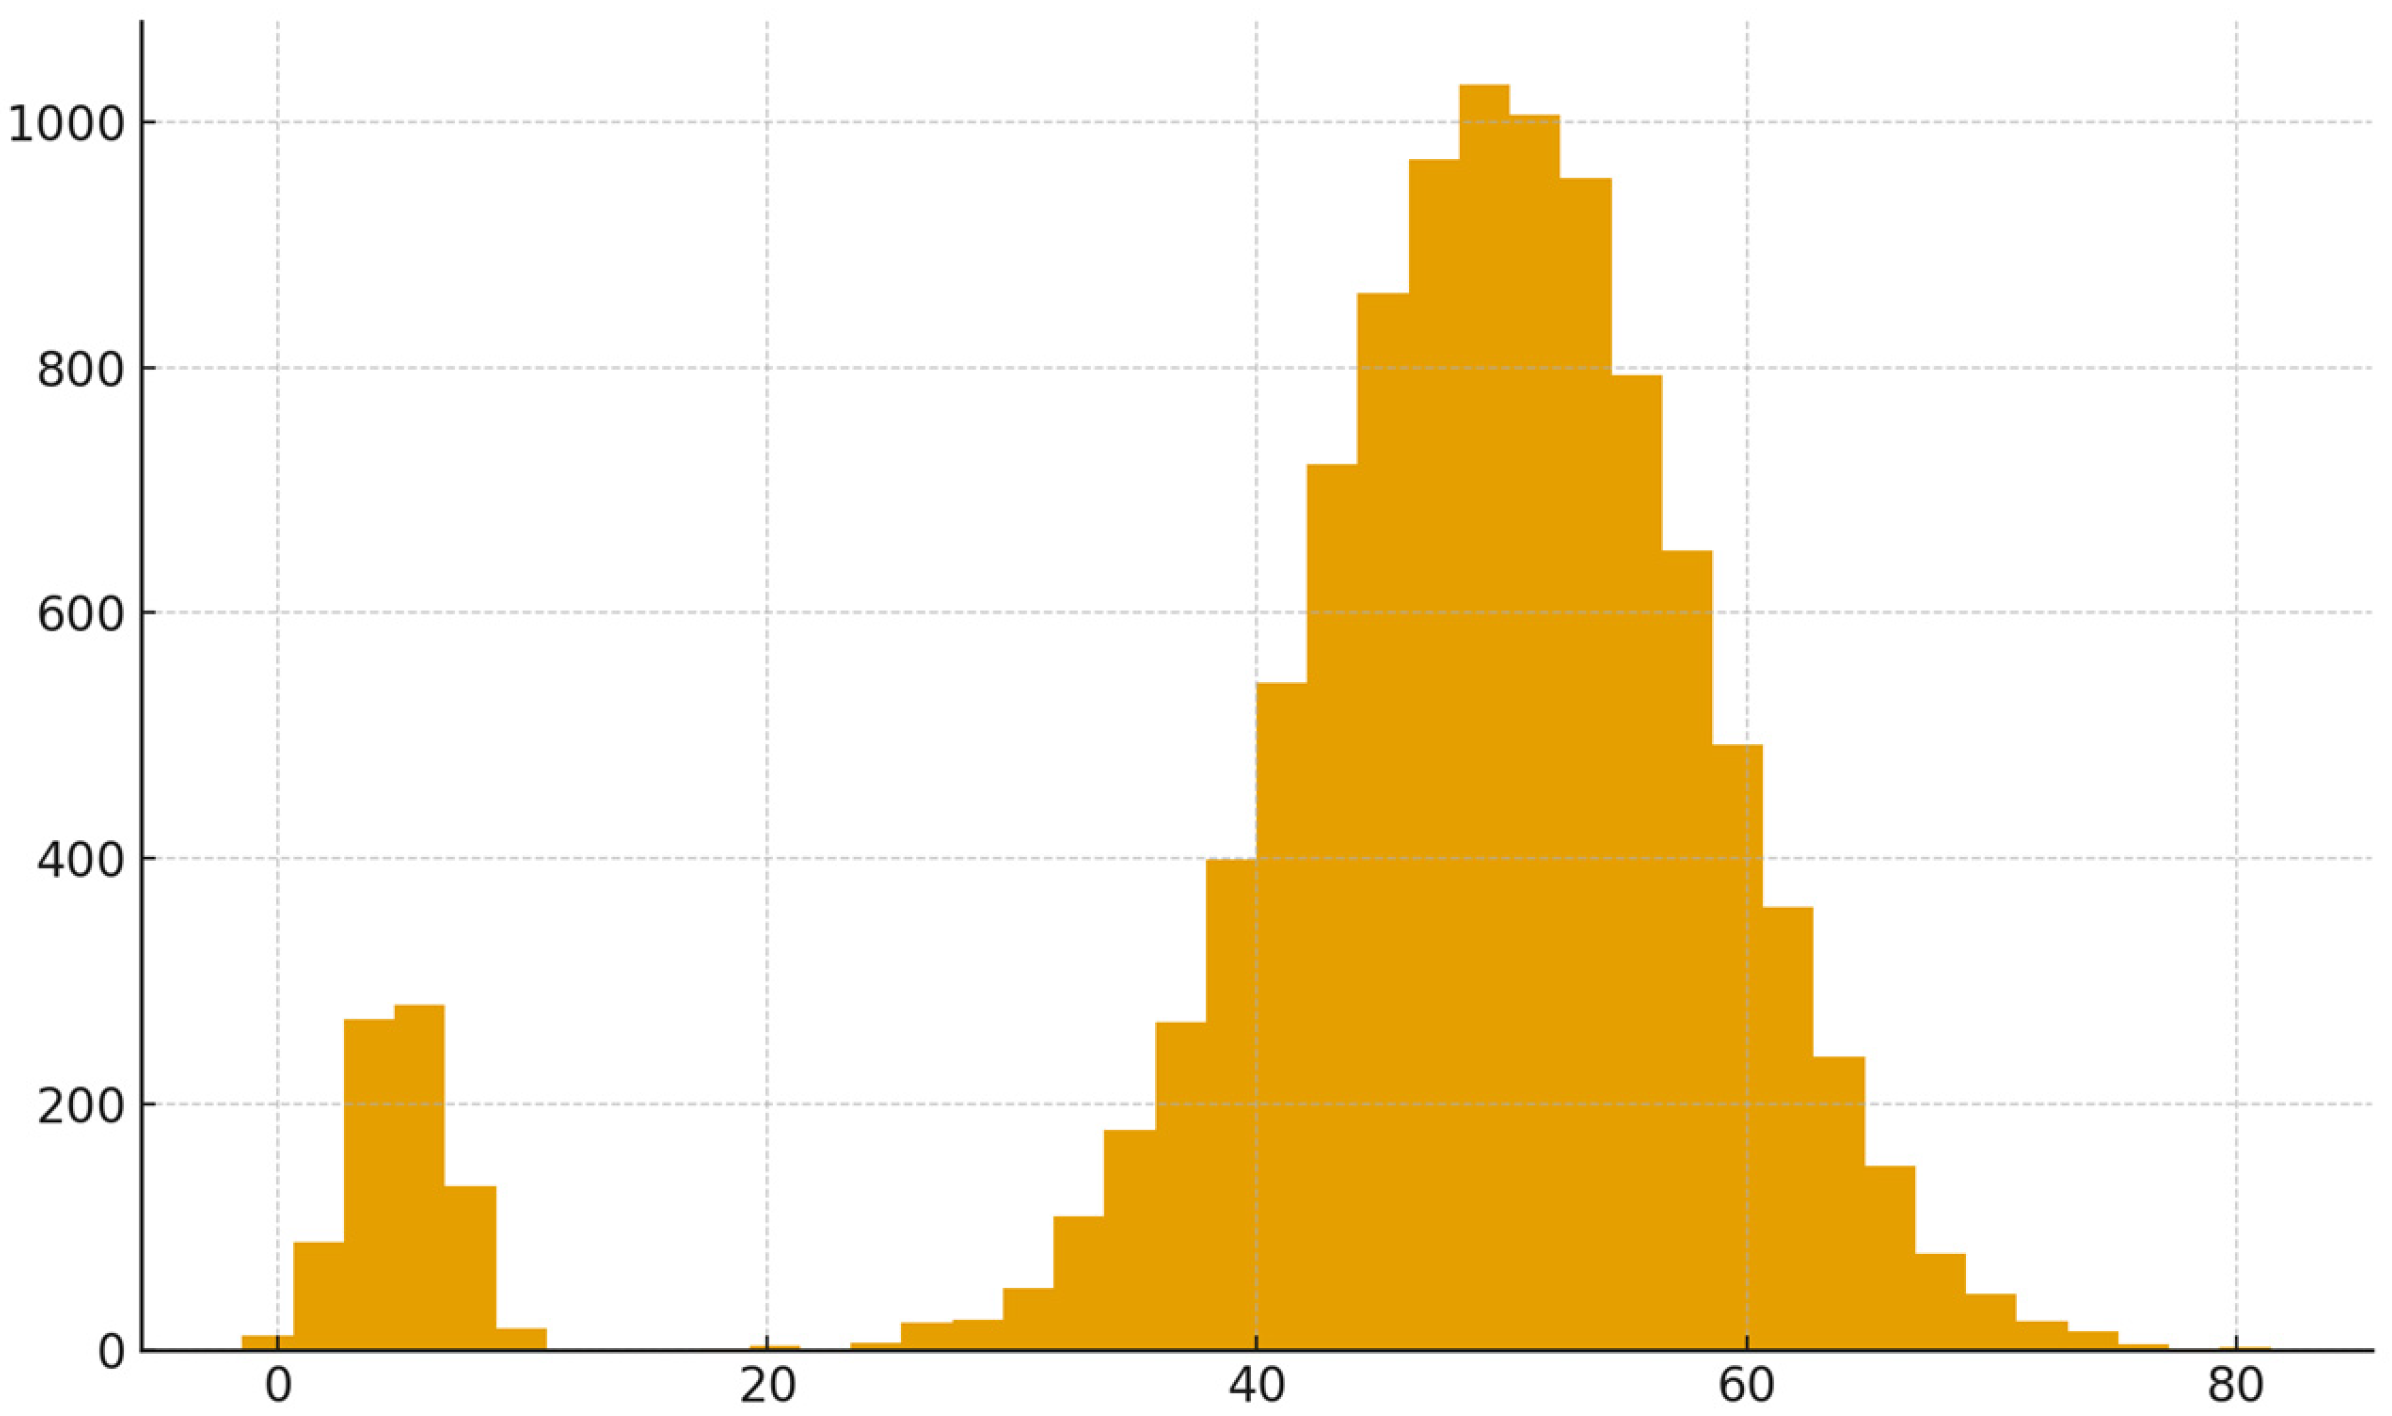
The global distribution of densities is shown in Figure 5, where a clear bimodality emerges: a large mode corresponding to normal events clustered in dense regions; a small mode representing low-density events associated with anomalies. This empirical separation confirms the assumptions discussed above: density-based separation is defined through neighborhood counts, demonstrating that sparse points indeed constitute structurally distinct regions of M.
Figure 5.
Histogram of density values ρ(xi) across the dataset. Published with MATLAB® R2025b (published with MATLAB® R2025b—https://github.com/CARLASILVA-CYBER/MS-Separation-of-Anomalous-Events-in-High-Dimensional-Spaces./blob/main/event.m (accessed on 20 November 2025)).
While the operational anomaly criterion is related to classical density-based methods, the contribution of this work is conceptual and formal. We provide (i) an explicit density–metric formulation on finite metric spaces; (ii) a discrete stability result clarifying when density-based classifications remain invariant; (iii) a geometric interpretation tailored to APT behavioral data.
From a practical standpoint, these findings indicate that the proposed framework can be applied to large-scale behavioral datasets using a relatively small sample without losing its structural properties. Even though the Kyoto 2006+ dataset contains millions of flows, a uniform sample of 10,000 events was sufficient to reveal a stable density structure with a clear high-density core and sparse anomaly regions. This is particularly relevant for real-world deployments, where the full-scale processing of all events may not be feasible and sampling strategies are often required [26,44].
To assess the geometric consistency of the geometric space, pairwise distances were sampled among normal events and among anomalies. Figure 6 presents a boxplot comparing the two distributions. The results show that (i) normal events have a lower median distance, consistent with their formation of a structurally coherent, compact geometric subset; (ii) anomalous events exhibit larger and more variable distances, reinforcing the idea that they populate sparse, irregular regions of the geometric space. This behavior aligns with the separation result shown; as discussed above, density-based separation is defined empirically through neighborhood counts, which states that low-density regions tend to occur away from the dense core in empirical distance distributions, although no strict minimal distance is assumed [36,39,40].
Figure 6.
Distribution of Euclidean distances among five-dimensional behavioral vectors. Published with MATLAB® R2025b (published with MATLAB® R2025b—https://github.com/CARLASILVA-CYBER/MS-Separation-of-Anomalous-Events-in-High-Dimensional-Spaces./blob/main/event.m (accessed on 20 November 2025)).
Finally, the experimental results highlight the interpretability of the density–metric approach when compared to purely algorithmic or black box machine learning models. Every anomaly decision in this framework can be traced back to a simple geometric condition: location in a low-density region of a well-defined geometric space. This transparency is crucial in domains such as cybersecurity, where operators must understand and justify why a particular connection or host is considered anomalous [31,32].
5. Conclusions
This work proposed a density–metric geometric space framework for the mathematical separation of anomalous events in high-dimensional behavioral spaces and validated it using real network traffic data from the Kyoto 2006+ dataset. By embedding events into a five-dimensional Euclidean space and equipping the resulting geometric space with a neighborhood-based density operator, we obtained a rigorous and interpretable characterization of normal and anomalous behavior. The proposed framework provides a theoretically grounded and empirically validated explanation of how low-density regions emerge in high-dimensional behavioral data.
The empirical analysis confirmed these properties: when applied to a uniform sample of flows from an entire month of traffic, the model produced a clear decomposition of the geometric space into a dense normal core and sparse anomaly regions. The resulting density contrast and geometric separation support the view that anomalies are not merely statistical artifacts but correspond to structurally distinct patterns in the behavioral space. Beyond its mathematical elegance, the proposed framework offers practical advantages. It is compatible with large-scale datasets through sampling, provides explicit control over the notion of locality via the , and yields anomaly labels that can be directly interpreted in geometric terms. These characteristics make the approach suitable as a foundation for anomaly detection systems in domains where transparency and theoretical grounding are essential. Future work may extend this framework by considering adaptive or data-driven choices of and MinPts, incorporating the temporal evolution of the geometric space or combining the geometric perspective with probabilistic models to quantify uncertainty. Nonetheless, the present results demonstrate that density–metric geometric spaces constitute a promising mathematical tool for understanding and detecting anomalous events in complex high-dimensional systems.
This study directly addresses the motivating questions posed in the introduction under a finite, data-driven mathematical framework. First, density in high-dimensional geometric spaces is defined empirically through neighborhood cardinalities in a finite metric space. Density is therefore an operational quantity, grounded in observed data rather than in asymptotic or topological constructs. Second, low-density regions correspond to structurally separable anomalies under discrete stability conditions as shown in Proposition 1; classification changes occur only when neighborhood cardinalities cross the fixed threshold MinPts. Consequently, sparse regions remain empirically distinct from dense regions under small perturbations of the dataset or of the neighborhood radius, without requiring topological separation or minimal distance guarantees.
Finally, for APT research, this framework provides a rigorous explanation for why advanced persistent threat behaviors emerge as sparse and weakly coherent regions in behavioral space. Their separability arises not from predefined labels or attack signatures, but from the intrinsic geometric and density-based properties of the observed data. This supports the interpretation of APT activity as structurally rare behavior, consistent with empirical cybersecurity observations. Together, these results demonstrate that meaningful geometric separation of anomalies can be achieved on robust, finite sample density–metric structures.
Author Contributions
Conceptualization, C.S., P.B., and O.G.P.; methodology, C.S., P.B., and O.G.P.; validation, C.S., P.B., and O.G.P.; formal analysis, C.S., P.B., and O.G.P.; investigation, C.S., P.B., and O.G.P.; resources, C.S.; data curation, C.S., P.B., and O.G.P.; writing—original draft preparation, C.S., P.B., and O.G.P.; writing—review and editing, C.S., P.B., and O.G.P.; visualization, C.S., P.B., and O.G.P.; supervision, C.S., P.B., and O.G.P.; project administration, C.S., P.B., and O.G.P.; funding acquisition, C.S., P.B., and O.G.P. All authors have read and agreed to the published version of the manuscript.
Funding
This research was funded by the European Union under DIGITAL-2024-ADVANCED-DIGITAL-07-KEYCAPACITY. Grant agreement N. 101226225.
Data Availability Statement
The data presented in this study are openly available at https://github.com/CARLASILVA-CYBER/MS-Separation-of-Anomalous-Events-in-High-Dimensional-Spaces./blob/main/event.m and https://www.takakura.com/Kyoto_data/new_data201704/ (accessed on 20 November 2025).
Acknowledgments
The authors are grateful to ISTEC—Instituto Superior de Tecnologias Avançadas for the institutional, administrative, and technical support provided throughout the research process. We also acknowledge the use of ChatGPT (version 5, 2025) during the literature review stage to support the summarization and filtering of academic sources. During the early stages of this study, generative AI tools were used solely to assist the authors in navigating and summarizing a large volume of the academic literature. Specifically, ChatGPT (version 5, 2025) was employed to generate concise summaries of scientific papers in the fields of cybersecurity, density–metric geometric space models, and artificial intelligence, helping to assess their relevance for inclusion in the study. More than 500 papers were used to describe this scientific approach and appointing mathematical improvements, although only a few were recognized to interconnect density–metric geometric space to cybersecurity, and our main idea was to focus on exploring the relationship between this model and APTs. No text, analysis, visual elements, or content generated by GenAI tools were directly included in the manuscript. All models, algorithms, figures, and tables presented are the authors’ original work, based on independent implementation and analysis. The source code and scripts supporting this research are publicly available in the authors’ GITHUB CLI 2.32.2 repository and reflect work personally written, tested, and maintained by the authors. All the following supporting information can be downloaded at https://www.takakura.com/Kyoto_data/new_data201704/ and https://github.com/CARLASILVA-CYBER/MS-Separation-of-Anomalous-Events-in-High-Dimensional-Spaces./blob/main/event.m (accessed on 20 November 2025). All content, including algorithm design, code implementation, results, and manuscript writing, is original and the sole responsibility of the authors. The authors are thankful for all the ISTEC administrative and technical support for developing this research (e.g., materials used for experiments) in https://www.istec.pt/index.php/unidade-de-investigacao-de-computacao-avancada/ (accessed on 1 November 2025).
Conflicts of Interest
The authors declare no conflicts of interest.
References
- Creech, G.; Hu, J. A Semantic Approach to Host-Based Intrusion Detection Systems Using Contiguousand Discontiguous System Call Patterns. IEEE Trans. Comput. 2014, 63, 807–819. [Google Scholar] [CrossRef] [Scilit]
- Moustafa, N.; Slay, J. UNSW-NB15: A Comprehensive Data Set for Network Intrusion Detection Systems (UNSW-NB15 network dataset). In Proceedings of the IEEE MilCIS, Canberra, ACT, Australia, 10–12 November 2015. [Google Scholar]
- Bishop, R.L.; Crittenden, R.J. Geometry of Geometric Spaces; Academic Press: Cambridge, MA, USA, 1964. [Google Scholar]
- OpenCTI. Open Cyber Threat Intelligence Platform. Free Threat-Intel Repository. Available online: https://www.opencti.io (accessed on 1 November 2025).
- MITRE ATT&CK®. MITRE ATT&CK Framework. Free Threat-Intel Repository. Available online: https://attack.mitre.org (accessed on 1 November 2025).
- Chalapathy, R.; Chawla, S. Deep Learning for Anomaly Detection: A Survey. arXiv 2019, arXiv:1901.03407. [Google Scholar] [CrossRef] [Scilit]
- Talagala, P.; Hyndman, R.J.; Smith-Miles, K. Anomaly Detection in High Dimensional Data. arXiv 2019, arXiv:1908.04000. [Google Scholar] [CrossRef] [Scilit]
- Roweis, S.T.; Saul, L.K. Nonlinear dimensionality reduction by locally linear embedding. Science 2000, 290, 2323–2326. [Google Scholar] [CrossRef] [Scilit] [PubMed]
- Tenenbaum, J.B.; de Silva, V.; Langford, J.C. A Global Geometric Framework for Nonlinear Dimensionality Reduction. Science 2000, 290, 2319–2323. [Google Scholar] [CrossRef] [Scilit] [PubMed]
- Herrmann, M.; Pfisterer, F.; Scheipl, F. A Geometric Framework for Outlier Detection in High-Dimensional Data. arXiv 2022, arXiv:2207.00367. [Google Scholar] [CrossRef] [Scilit]
- Steinacker, H. Emergent geometry and gravity from matrix models: An introduction. Class. Quantum Gravity 2010, 27, 133001. [Google Scholar] [CrossRef] [Scilit]
- Wang, Y.; Zhang, L.; Si, T.; Bishop, G.; Gong, H. Anomaly Detection in High-Dimensional Time Series Data with Scaled Bregman Divergence. Algorithms 2025, 18, 62. [Google Scholar] [CrossRef] [Scilit]
- Schoen, R.; Yau, S.-T. Lectures on Differential Geometry; International Press: Cambridge, MA, USA, 1994. [Google Scholar]
- Pang, G.; Shen, C.; Cao, L.; van den Hengel, A. Deep Learning for Anomaly Detection: A Review. ACM Comput. Surv. 2021, 54, 38. [Google Scholar] [CrossRef] [Scilit]
- Alshal, H. Einstein’s equations and the pseudo-entropy of pseudo-Riemannian information manifolds. Gen. Relativ. Gravit. 2023, 55, 86. [Google Scholar] [CrossRef] [Scilit]
- Chalapathy, R.; Menon, A.; Chawla, S. Robust, Deep and Inductive Anomaly Detection. In ECML-PKDD 2017; Springer: Cham, Switzerland, 2017; pp. 36–51. [Google Scholar]
- Hsu, P. Brownian bridges on Riemannian manifolds. Probab. Theory Rel. Fields 1990, 84, 103–118. [Google Scholar] [CrossRef] [Scilit]
- Erfani, S.; Rajasegarar, S.; Karunasekera, S.; Leckie, C. High-dimensional and large-scale anomaly detection using a linear one-class SVM with deep learning. Pattern Recognit. 2016, 58, 121–134. [Google Scholar] [CrossRef] [Scilit]
- de Rham, G. Riemannian Geometric Spaces; Springer: Berlin/Heidelberg, Germany, 1984. [Google Scholar]
- Belkin, M.; Niyogi, P. Laplacian Eigenmaps for Dimensionality Reduction and Data Representation. Neural Comput. 2003, 15, 1373–1396. [Google Scholar] [CrossRef] [Scilit]
- Campos, G.; Zimek, A.; Sander, J.; Campello, R.J.G.B.; Micenková, B.; Schubert, E.; Assent, I.; Houle, M.E. On the Evaluation of Unsupervised Outlier Detection: Measures, Datasets, and an Empirical Study. Data Min. Knowl. Discov. 2016, 30, 891–927. [Google Scholar] [CrossRef] [Scilit]
- Duan, X.; Feng, L.; Zhao, X. Point Cloud Denoising Algorithm via Geometric Metrics on the Statistical Manifold. Appl. Sci. 2023, 13, 8264. [Google Scholar] [CrossRef] [Scilit]
- Aggarwal, C.C.; Reddy, C.K. Data Clustering: Algorithms and Applications; Chapman and Hall: London, UK, 2013. [Google Scholar]
- Lovelock, D. The four-dimensionality of space and the Einstein tensor. J. Math. Phys. 1972, 13, 874–876. [Google Scholar] [CrossRef] [Scilit]
- Dąbrowski, L.; Sitarz, A.; Zalecki, P. Spectral metric and Einstein functionals. Adv. Math. 2023, 427, 109128. [Google Scholar] [CrossRef] [Scilit]
- McInnes, L.; Healy, J.; Melville, J. UMAP: Uniform Geometric space Approximation and Projection. arXiv 2018, arXiv:1802.03426. [Google Scholar]
- Malliavin, P. Stochastic Analysis; Springer: Berlin/Heidelberg, Germany, 1997. [Google Scholar]
- Jost, J. Riemannian Geometry and Geometric Analysis; Springer: Cham, Switzerland, 1995. [Google Scholar]
- Ikeda, N.; Watanabe, S. Stochastic Differential Equations and Diffusion Processes, 2nd ed.; North-Holland: Amsterdam, The Netherlands; Kodansha: Tokyo, Japan, 1989. [Google Scholar]
- Hackenbroch, W.; Thalmaier, A. Stochastische Analysis; B. G. Teubner: Stuttgart, Germany, 1994. [Google Scholar]
- Janson, S. Gaussian Hilbert Spaces; Cambridge University Press: Cambridge, UK, 1997. [Google Scholar]
- Ichihara, K. Curvature, geodesics and the Brownian motion on a Riemannian manifold I—Recurrence properties. Nagoya Math. J. 1982, 87, 101–114. [Google Scholar] [CrossRef] [Scilit]
- Kendall, W.S. Nonnegative Ricci curvature and the Brownian coupling property. Stochastics 1986, 19, 111–129. [Google Scholar] [CrossRef] [Scilit]
- Schölkopf, B.; Smola, A.; Müller, K. Nonlinear Component Analysis as a Kernel Eigenvalue Problem. Neural Comput. 1998, 10, 1299–1319. [Google Scholar] [CrossRef] [Scilit]
- Thudumu, S.; Branch, P.; Jin, J.; Singh, J. A Comprehensive Survey of Anomaly Detection Techniques for High Dimensional Big Data. J. Big Data 2020, 7, 42. [Google Scholar] [CrossRef] [Scilit]
- Warner, F.W. Foundations of Differentiable Manifolds and Lie Groups; Springer: New York, NY, USA, 1983. [Google Scholar]
- Zhao, Y.; Nasrullah, Z.; Li, Z. PyOD: A Python Toolbox for Scalable Outlier Detection. J. Mach. Learn. Res. 2019, 20, 1–7. [Google Scholar]
- Ruff, L.; Vandermeulen, R.; Goernitz, N.; Deecke, L.; Siddiqui, S.A.; Binder, A.; Müller, E.; Kloft, M. Deep One-Class Classification. ICML 2018, 80, 4393–4402. [Google Scholar]
- Phillips, R.S.; Sarason, L. Elliptic parabolic equations of the second order. J. Math. Mech. 1967, 17, 891–917. [Google Scholar]
- Zimek, A.; Campello, R.J.G.B.; Sander, J. Data perturbation for outlier detection ensembles. ACM Comput. 2014, 13, 1–12. [Google Scholar] [CrossRef] [Scilit]
- Goldstein, M.; Uchida, S. A Comparative Evaluation of Unsupervised Anomaly Detection Algorithms for Multivariate Data. PLoS ONE 2016, 11, e0152173. [Google Scholar] [CrossRef] [Scilit]
- Gross, L. Logarithmic Sobolev inequalities and contractivity properties of semigroups. In Dirichlet Forms; Lecture Notes in Mathematics; Dell’Antonio, G., Mosco, U., Eds.; Springer: Berlin/Heidelberg, Germany, 1993; Volume 1563, pp. 54–88. [Google Scholar]
- Kriegel, H.-P.; Kröger, P.; Schubert, E.; Zimek, A. Outlier Detection in Arbitrarily Oriented Subspaces. In Proceedings of the 2012 IEEE 12th International Conference on Data Mining, Brussels, Belgium, 10–13 December 2012. [Google Scholar]
- Liu, F.T.; Ting, K.M.; Zhou, Z.-H. Isolation Forest. ACM Trans. Knowl. Discov. Data TKDD 2012, 6, 3. [Google Scholar]

Disclaimer/Publisher’s Note: The statements, opinions and data contained in all publications are solely those of the individual author(s) and contributor(s) and not of MDPI and/or the editor(s). MDPI and/or the editor(s) disclaim responsibility for any injury to people or property resulting from any ideas, methods, instructions or products referred to in the content. |
© 2026 by the authors. Licensee MDPI, Basel, Switzerland. This article is an open access article distributed under the terms and conditions of the Creative Commons Attribution (CC BY) license.