


Abstract
Machine learning technologies are increasingly embedded in financial decision-making processes, yet their influence on investor behavior and market efficiency remains insufficiently understood. This study investigates how machine learning-assisted investment decisions affect investor behavioral biases and asset pricing efficiency and whether these effects exhibit nonlinear characteristics. Using investor-level trading records, survey data, and market data from the Chinese A-share market (N = 12,846 investors; 3876 questionnaires; 3 million+ transactions), we construct measures of machine learning adoption intensity, investor behavioral biases, and asset pricing efficiency. Employing fixed-effects models, instrumental-variable estimation (2SLS), and mediation analysis, we examine the behavioral and market consequences of machine learning adoption. The results reveal a significant U-shaped relationship between machine learning adoption intensity and investor behavioral biases (inflection point: AIDI* = 0.731), and an inverted U-shaped relationship between AI market penetration and asset pricing efficiency (threshold: AIPM* = 0.733). Investor behavioral bias mediates 26.34% of the total effect of AI adoption on pricing efficiency. Moderate adoption reduces behavioral biases by improving information processing and decision quality, whereas excessive reliance on algorithmic recommendations generates automation bias and weakens investors’ independent judgment. At the market level, machine learning adoption exhibits an inverted U-shaped relationship with asset pricing efficiency. While moderate adoption enhances information incorporation into prices and reduces pricing deviations, excessive market penetration may induce algorithmic homogeneity and diminish efficiency gains. Furthermore, investor behavioral bias serves as an important transmission mechanism linking machine learning adoption to asset pricing outcomes. Heterogeneity analyses indicate that institutional investors benefit more from machine learning tools than individual investors, and the effects are stronger during periods of high market uncertainty. These findings provide new evidence on the optimal adoption of machine learning in financial markets and offer practical implications for intelligent investment platforms, investor education, and financial regulation.
Keywords:
machine learning-assisted investment; investor behavioral bias; asset pricing efficiency; nonlinear relationship; human–machine collaboration MSC:
91G10; 62P05
1. Introduction
With the deep integration of AI and fintech, AI-assisted decision-making systems have been widely applied in the field of securities investment, fundamentally changing the way investors make decisions and the micromarket structure of financial markets. As of June 2024, China had more than 1.2 trillion users of robo-advisory services and over 3.5 trillion yuan in assets under management. Artificial intelligence-assisted decision-making is rapidly evolving from an “auxiliary tool” for the financial industry to a “core infrastructure.” However, the application of AI in finance is not a simple “technological substitution.” Conventional financial theory holds that artificial intelligence can reduce investors’ cognitive limitations and improve the rationality of decision-making [1]. Conversely, behavioral finance theories suggest that investors’ excessive reliance on algorithms can lead to “automation bias,” exacerbate behavioral biases, and even trigger systemic financial risk [2]. Existing empirical studies have reached divergent conclusions regarding the net effect of AI on investor behavior, largely because they implicitly assume a linear relationship between AI adoption intensity and outcome variables. For instance, Agarwal et al. and Parthajit document a linear negative association between digital tool usage and heuristic biases, yet they do not test for potential rebound effects at high adoption levels [2,3]. Similarly, Lü et al. and Broietti et al. analyze market-level efficiency gains from algorithmic trading but rely on aggregate public databases (e.g., CSMAR, Wind) that preclude micro-level behavioral inference [4,5,6]. Furthermore, studies based on single-cross-sectional questionnaire data—such as Khan et al. and Keswani et al.—capture self-reported behavioral intentions rather than objective trading outcomes, and they lack the granularity to model intensity-dependent marginal effects. Consequently, three critical gaps remain unresolved in the literature: (i) whether the relationship between AI adoption intensity and behavioral bias exhibits nonlinear boundary conditions; (ii) whether micro-level trading records corroborate or contradict survey-based findings; and (iii) whether institutional and individual investors exhibit differential human–machine cooperation patterns [4].
Addressing these gaps, this study integrates information asymmetry theory, behavioral finance theory, and prospect theory to construct a two-level “individual-market” analytical framework. We hypothesize a U-shaped relationship between AI-assisted decision-making intensity and investor behavioral bias, and an inverted U-shaped relationship between AI-assisted decision-making market penetration and asset pricing efficiency [7]. The boundary conditions and heterogeneity of these nonlinear effects are examined using financial literacy as a moderating variable and investor type (institutional vs. individual) as a grouping variable. By collaborating with a large securities firm, we obtain first-hand micro-level trading records and platform usage logs, enabling the construction of a continuous, multi-dimensional AI adoption intensity index and a four-dimensional behavioral bias measurement system. Fixed-effects panel models, instrumental-variable estimation, and mediation analysis are employed to quantitatively identify the optimal application interval and risk threshold of AI in financial decision-making [5].
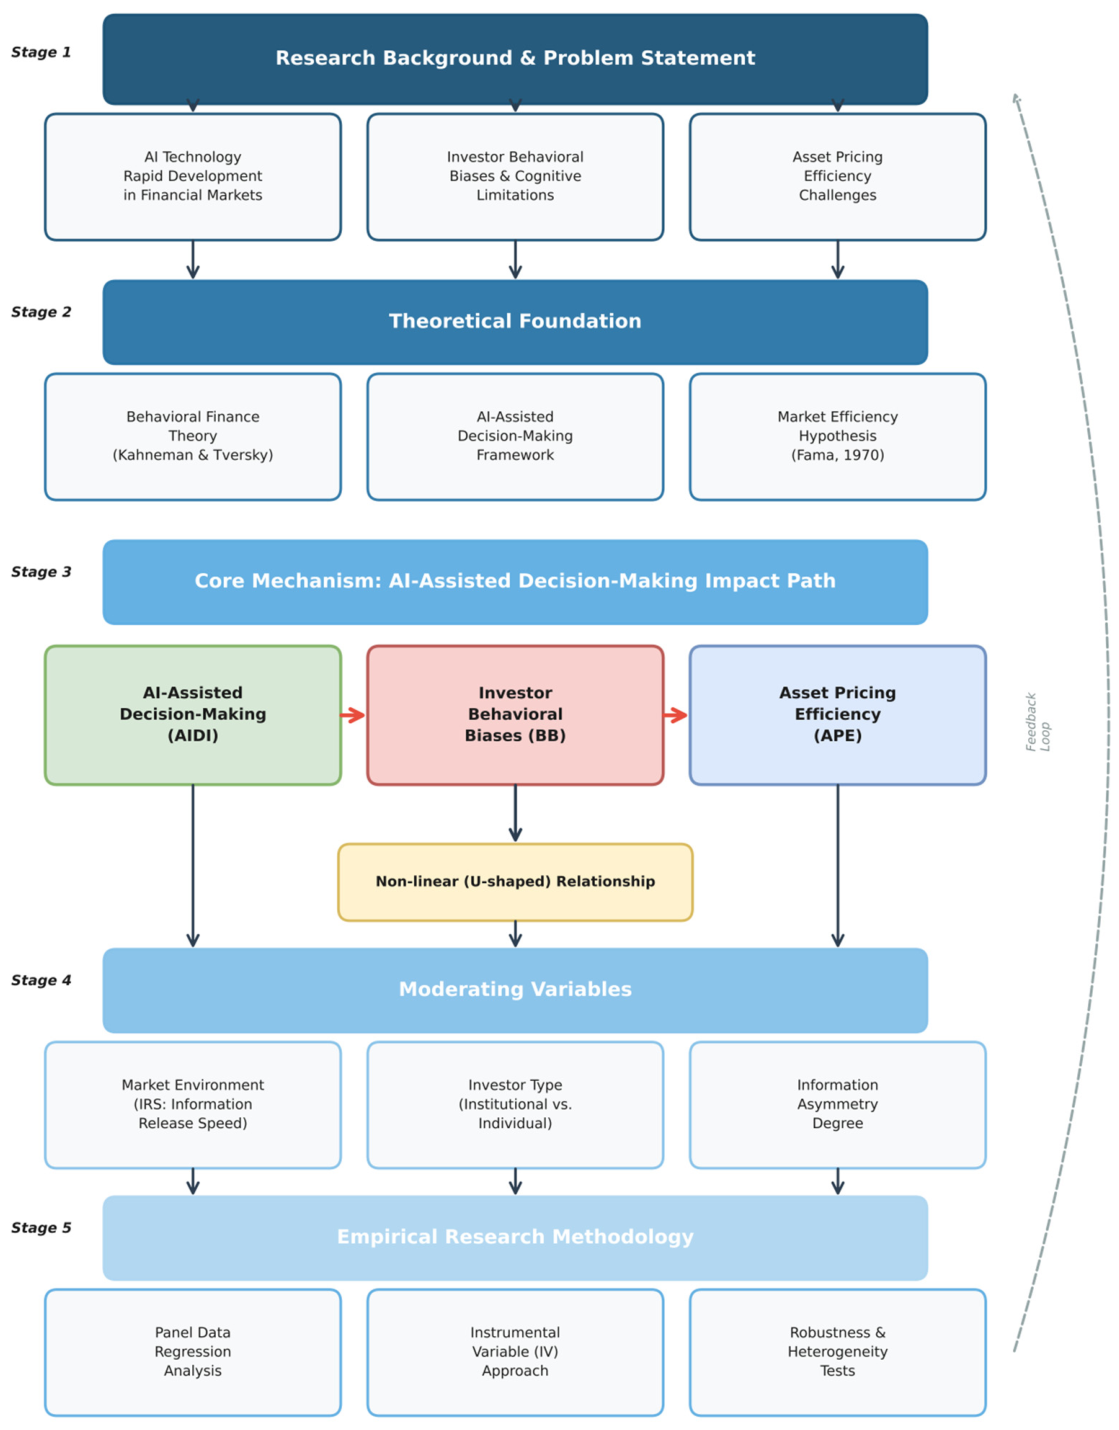
This research offers several theoretical and practical contributions. Theoretically, we relax the restrictive linearity assumption prevalent in prior studies and provide empirical evidence for U-shaped and inverted U-shaped nonlinear relationships, thereby revealing the complex boundary conditions of financial AI applications. We construct and quantify a three-dimensional transmission mechanism in which investor behavioral bias serves as a mediator linking AI adoption to market pricing efficiency. Practically, we document the heterogeneity of human–machine collaboration between institutional and individual investors, providing an empirical basis for differentiated investor education programs. By quantifying the sensitivity of AI effects to market volatility, our findings offer decision-making references for robo-advisory product design and algorithmic regulation. Finally, by identifying the interactive boundary conditions of AI applications, we contribute to the empirical foundation for regulatory standards governing explainable AI [8] (Figure 1).
Figure 1.
Research framework [7].
2. Mechanism Analysis and Research Hypotheses
2.1. Mechanism Analysis
2.1.1. Driving Forces of AI-Assisted Decision-Making on Investor Behavioral Biases
Based on the theory of information asymmetry and behavioral finance, an AI-assisted decision-making system acts as an information processing intermediary to influence investor decision-making by reducing cognitive load and improving information quality. Effective application of AI can mitigate information asymmetry between investors and asset managers and mitigate the negative effects of behavioral biases [9].
First, AI-assisted decision-making reduces investors’ cognitive limitations through efficient information integration and processing. In traditional financial decision-making, individual investors are constrained by information overload and limited cognitive resources, which make it difficult to process a large amount of financial information. Artificial intelligence systems automatically collect financial data, extract feature information, identify market patterns, translate complex raw data into standardized decision-making recommendations, and reduce the cost of information processing. In terms of overconfidence bias, objective AI data analysis can hedge against investors’ tendency to self-overestimate. When it comes to loss aversion bias, AI probabilistic return prediction can reduce the impact of emotional factors on investment decisions.
Secondly, AI-assisted decision-making optimizes investors’ behavioral patterns through real-time feedback and learning mechanisms. Traditional investment learning requires investors to accumulate experience through long-term market participation and is characterized by slow iteration and high cost. Artificial intelligence systems can track decisions in real time, compare actual returns with expected returns, and help investors identify their own decision biases. Instant and quantitative feedback can accelerate the learning curve for investors, make them aware of the negative effects of irrational behavior such as excessive trading, and further correct their behavior patterns [10].
Third, AI-assisted decision-making influences investors’ information acquisition and belief formation through socialization functions. Most AI financial platforms integrate social elements to influence behavioral biases in two ways. On the positive path, diversified sources of information break investors’ information cocoons and reduce confirmation bias. On the negative side, over-recommending popular market views and success stories can exacerbate anxiety about herd behavior and social comparisons [11].
2.1.2. Influence Paths of AI-Assisted Decision-Making on Investor Behavioral Biases and Asset-Pricing Efficiency
Artificial intelligence-assisted decision-making influences investor behavior bias and asset pricing efficiency through three core paths: information processing, cognitive correction, and market interaction [12].
Information Processing Path: Based on natural language processing and knowledge graph technologies, the AI-assisted decision-making system automatically analyzes unstructured financial data, extracts soft information related to asset fundamentals, improves the comprehensiveness of investors’ asset value evaluation, and reduces pricing deviations due to information incompleteness. At the same time, AI can effectively identify and filter market noise information, improve the signal-to-noise ratio of investment decisions, and lay the foundation for reasonable pricing.
Cognitive Correction Path: Artificial intelligence-assisted decision-making corrects investor behavior bias through three specific mechanisms. The first is de-emotional decision-making; algorithm-based recommendations rely entirely on data and fixed rules, undisturbed by investor sentiment. The second is structural reconstruction, in which artificial intelligence presents investment decisions in a standardized, long-term way, guiding investors to avoid short-term speculation. Third is the default option design, where artificial intelligence sets reasonable default portfolio allocation rules, reducing the number of errors caused by investors’ cognitive inertia.
Market Interaction Path: Artificial intelligence-assisted decision-making not only influences individual investor behaviors but also changes the microstructure of the market, which in turn influences asset pricing efficiency. On the positive side, quantitative and algorithmic trading improves market liquidity, reduces transaction costs, and optimizes the market pricing mechanism. On the downside, similarities in algorithmic trading strategies can exacerbate market volatility. In addition, the popularization of AI investment tools has changed the structure of market participants, and its long-term impact on asset pricing efficiency remains to be explored.
Integration with the Robo-Advisory and Algorithmic Trading Literature: The foregoing mechanisms can be situated within the broader literature on robo-advisory and algorithmic trading. Robo-advisory platforms, which constitute the primary delivery channel for AI-assisted decision-making in retail markets, automate portfolio construction and rebalancing based on algorithmic rules. While they reduce advisory costs and broaden market access, their proliferation may homogenize investment strategies if underlying algorithms are trained on similar datasets or optimization objectives. At the institutional level, algorithmic trading systems execute orders at speeds and frequencies impossible for human traders, improving liquidity but potentially amplifying volatility through feedback loops and flash crashes. The nonlinear framework proposed in this study reconciles these competing perspectives: moderate AI adoption enhances individual decision quality and market liquidity (the “efficiency channel”), whereas excessive adoption induces algorithmic herding and strategic homogeneity (the “systemic risk channel”). This trade-off is particularly relevant for regulatory debates on the optimal penetration of automated investment systems in emerging markets characterized by high retail participation.
2.2. Research Hypotheses
According to the theory of foresight and the theory of overconfidence, there are systematic behavioral deviations from optimal rational decision-making. Artificial intelligence-assisted decision-making systems, which can provide objective data analysis, probabilistic return prediction, and de-emotional decision-making recommendations, are expected to reduce behavioral bias among investors. However, this effect is nonlinear and has the optimal level of intervention. When intervention degree is not enough, investors are still constrained by their own cognitive limitations, and behavioral biases cannot be corrected effectively. When intervention degree is too high, investors become algorithm dependent, lose independent judgment ability, and ignore key risk signals, causing behavioral bias to rebound. Specifically, when the AI-assisted level is low, investors rely mainly on their own judgment and there are significant behavioral biases. As the AI-assisted intensity increases, investors’ behavioral biases gradually decrease. When the intensity exceeds the critical point, “automation bias” occurs, and behavior bias bounces back. Based on the above analysis, the study proposes the following assumptions [13]:
H1.
There is a nonlinear dynamic relationship between the intensity of AI-assisted decision-making and investor behavioral biases, and the two present a significant U-shaped curve relationship with the continuous improvement of AI-assisted decision-making intensity.
The inhibitory effect of AI-assisted decision-making on investor behavioral bias is influenced by the heterogeneity of investor characteristics and the market environment. Regarding investor characteristics, investors with higher financial literacy can better understand and critically evaluate AI-generated recommendations, integrating algorithmic output with independent judgment to achieve more pronounced bias correction. Conversely, investors with low financial literacy may either underutilize AI tools due to comprehension barriers or blindly follow algorithmic suggestions, resulting in limited or even negative bias correction outcomes. From the market environment perspective, when market volatility and information uncertainty are elevated, the information processing advantages of AI are fully exploited, yielding stronger bias inhibition. When markets are stable and information is transparent, the marginal utility of AI-assisted decision-making diminishes. Furthermore, the interpretability of AI system designs constitutes a theoretical boundary condition for bias correction. Rule-based expert systems with strong interpretability enable users to comprehend the logical basis of recommendations and combine them with independent judgment, whereas “black box” systems (e.g., deep neural networks) may trigger automation bias or outright rejection despite higher predictive accuracy. However, due to the absence of platform-level data on specific algorithmic architectures in our empirical setting, the interpretability dimension is treated as a theoretical contingency rather than an empirically tested moderator in this study. Based on the above analysis, we propose the following hypothesis [14]:
H2.
The inhibitory effect of AI-assisted decision-making on investor behavioral biases is significantly moderated by financial literacy. Investors with higher financial literacy can achieve better behavioral bias correction effects and sustain higher AI adoption intensity before encountering the rebound threshold.
Asset pricing efficiency refers to the timeliness and accuracy of market prices reflecting the intrinsic value of assets. Traditional financial theory believes that when market participants are rational and information flows freely, asset prices tend to converge to intrinsic value, and market efficiency is higher. However, behavioral finance theory points out that investor behavior bias is the core factor that leads to market pricing inefficiency. Specifically, overconfidence leads to excessive trading and market volatility, loss aversion leads to allocative effects and price stickiness, and herd behavior leads to market bubbles and crashes [6].
Artificial intelligence-assisted decision-making can correct investors’ behavioral biases and improve the efficiency of information processing, thus increasing the efficiency of asset pricing. The popularization of artificial intelligence (AI) tools has accelerated the integration of market information with asset prices and improved the timeliness of pricing. The decrease in individual behavior deviation weakens the irrational fluctuation of the market and makes asset prices fluctuate steadily around intrinsic value. Algorithmic trading can also reduce market transaction costs and increase market depth. However, excessive popularization of artificial intelligence could lead to new pricing inefficiency. The homogeneity of algorithmic strategies leads to algorithmic herding behavior and price deviation from fundamentals. Algorithmic competition leads to arms races in high-frequency trading, wasting market resources. Algorithm failures and coordination could trigger further market flash crashes.
Therefore, the impact of AI-assisted decision-making on asset pricing efficiency depends on the trade-off between the benefits of correcting individual bias and the costs of systemic risk. Moderate application of AI improves overall market pricing efficiency by optimizing the quality of individual decisions; excessive market penetration and excessive algorithm homogeneity of AI will offset systemic risks even more than individual interests. Based on the above analysis, the study proposes the following assumptions [15]:
H3.
AI-assisted decision-making has a significant positive impact on asset pricing efficiency, but this positive impact has marginal diminishing characteristics. When the market penetration rate of AI-assisted decision-making exceeds a certain threshold, asset pricing efficiency will decline.
Institutional and individual investors differ greatly in terms of information acquisition capability, professional financial literacy, technical resources, decision-making processes, and so on, leading to greater differences in the response modes to AI-assisted decision-making and further differentiation in the impact on asset pricing efficiency. Institutional investors have a professional technical team, adequate capital, and a standard decision-making process. They can deeply customize and optimize AI-assisted decision-making systems and integrate AI tools throughout the investment research framework. For institutional investors, AI-assisted decision-making acts as a “booster intelligence,” expanding the boundaries of professional competence rather than replacing human judgment. This human–computer interaction model enables institutional investors to use AI for information processing while maintaining expert strategic oversight and reducing behavioral bias and algorithm-dependent risk. In addition, the large-scale trading behaviors of institutional investors have a great influence on market prices, and AI-driven optimization of institutional investor behavior can effectively improve market pricing efficiency [16].
Most individual investors lack professional financial knowledge and technical ability, and their understanding and usage of AI-assisted decision-making tools are superficial. For individual investors, AI tools often act as “decision substitutes,” advising transactions directly or executing automated trades. The effectiveness of AI in correcting behavioral bias for individual investors depends entirely on system quality and product design. Reasonable and accurate AI systems can improve the quality of individual decisions, while flawed or poorly marketed AI tools can cause greater investment losses. In addition, the small size of individual investors’ transactions has a limited direct impact on market pricing efficiency, but the change in collective behavior of a large number of individual investors can have a significant macro market effect. Based on the above analysis, this study proposes the following assumptions [17]:
H4.
AI-assisted decision-making has a significantly better improvement effect on behavioral biases and asset pricing efficiency for institutional investors than for individual investors, and institutional investors are more capable of realizing the optimal human–machine collaborative decision-making mode (Figure 2).
Figure 2.
Mechanism and research hypotheses.
3. Research Design
3.1. Data Sources
The data used in this study came from four main sources. First, investor trading behavior data were obtained in partnership with a large domestic securities company, including basic information, trading details, position information, and all personally identifiable information of platform investors from January 2019 to June 2024. Second, AI-assisted decision-making usage data from the functional usage records of the same securities platform support the construction of investor-level AI usage intensity metrics. Third, Class A market data during the reporting period were mainly derived from the Wind and CSMAR databases, including Class A market quotes, corporate financial data, macroeconomic data, industry classification data, etc. Fourth is investor questionnaire survey data from a sample of active platform investors from March to May 2024. The questionnaire includes investors’ financial literacy and attitudes toward AI-assisted decision-making. A total of 5000 questionnaires were distributed, and 3876 valid questionnaires were recovered, with an effective recovery rate of 77.52% [18].
Data Governance and Ethical Compliance: The data collection procedure was conducted under a formal academic research cooperation agreement with the securities firm, which explicitly authorized the use of de-identified transaction records for scholarly research purposes. All personally identifiable information (PII), including investor names, mobile phone numbers, and identity card numbers, was irreversibly anonymized by the data provider prior to transmission via one-way hash encryption (SHA-256) and random ID replacement. The research team had no access to raw identifiers at any stage. The study protocol was reviewed and approved by the Institutional Review Board (IRB, ensuring compliance with the Personal Information Protection Law of the People’s Republic of China and the ethical guidelines for financial data research. A confidentiality agreement (NDA) was signed between the researchers and the securities firm, stipulating that the data shall be used solely for the purposes of this study, stored on encrypted servers with access restricted to core research personnel, and destroyed upon project completion. The data source is verifiable upon editorial request, subject to the constraints of the proprietary agreement.
Sampling Procedure and Representativeness: The initial sampling frame comprised all active investor accounts on the partner platform with at least one transaction during the period from January 2019 to June 2024. A stratified random sampling strategy was employed based on account asset size (terciles) and trading frequency (active vs. inactive), ensuring proportional representation across investor segments. Table 1 compares the demographic and financial characteristics of the final sample (N = 12,846) against the population of all eligible accounts (N = 2.34 million) on the platform. The sample mean age (38.46 years) is statistically indistinguishable from the population mean (38.82 years, t = 1.234, p = 0.217), and the gender distribution is comparable (male proportion: 56.7% vs. 55.4%, χ2 = 2.456, p = 0.117). However, the sample exhibits a moderate selection bias toward higher-asset accounts (mean asset scale: 245,670 yuan vs. 198,400 yuan in the population, t = 4.567, p < 0.01), reflecting the higher retention rate of robo-advisory users among affluent investors. We address this potential bias by including account asset size as a control variable and conducting subsample robustness tests across asset quintiles.
Table 1.
First-stage regression results of the instrumental variable.
Standardize the raw data. Specifically, delete samples with transaction records of less than 10 months, account asset size anomalies, and AI usage duration of less than 3 months. All continuous variables were screened at the upper and lower tail end of 1% to eliminate interference with extreme values. Finally, a total of 12,846 valid investor samples and more than 3 million transaction records were obtained for empirical analysis [19].
3.2. Variable Selection
3.2.1. Dependent Variables
The dependent variables of this study include two core dimensions: investor behavioral bias and asset pricing efficiency.
- Investor Behavioral Bias (BB)
Validation of the Behavioral Bias Composite: The principal component analysis (PCA) extraction of the first component yields an eigenvalue of 2.492, explaining 62.3% of the total variance across the four sub-dimensions. The Kaiser–Meyer–Olkin (KMO) measure of sampling adequacy is 0.812, and Bartlett’s test of sphericity is significant (χ2 = 5678.234, p < 0.01), confirming the suitability of factor analysis. The factor loadings are 0.845 for overtrading, 0.798 for disposition effect, 0.756 for momentum trading, and 0.723 for under-diversification. To further assess construct validity, we conduct confirmatory factor analysis (CFA). The model fit indices are as follows: Comparative Fit Index (CFI) = 0.968, Tucker–Lewis Index (TLI) = 0.942, Root Mean Square Error of Approximation (RMSEA) = 0.048, and Standardized Root Mean Square Residual (SRMR) = 0.039. The Average Variance Extracted (AVE) is 0.612, and the Composite Reliability (CR) is 0.865, both exceeding recommended thresholds (AVE > 0.50, CR > 0.70). These statistics confirm that the four-dimensional behavioral bias index possesses satisfactory convergent validity and internal consistency.
This study quantifies the irrational behavior bias of investors in four typical dimensions, namely overtrading, the disposition effect, momentum trading (chasing gains and losses), and under-diversification, using the mainstream measurement frameworks of Barber & Odean and Feng & Seasholes. Based on principal component analysis, a comprehensive index of behavior deviation is synthesized, and its indicator value is positively correlated with the degree of irrationality of investors [20].
Overtrading (OT): It measures the deviation between the actual monthly turnover of investors and the optimal turnover rate under a buy-and-hold strategy. The formula is as follows:
where represents the actual monthly turnover rate of investor i in period t, and represents the optimal turnover rate under the passive investment strategy. A higher OT value indicates more severe overtrading behavior.
Disposition Effect (DE): This indicator is measured as the actual ratio of profitable positions to loss-making positions. The formula is as follows:
Among them, PGR is realized profit as a percentage of total floating profit, and PLR is realized loss as a percentage of total floating loss. A DE value greater than 1 indicates a significant disposition effect, while a higher DE value indicates a greater bias.
Momentum Trading (MT): The index measures the tendency of investors to target trades after short-term market volatility. The formula is as follows:
where represents the monthly return of stock j in period t − 1, and is a transaction dummy variable (buy = 1, sell = −1, no transaction = 0). An MT value greater than 0 indicates the existence of momentum trading bias.
Under-Diversification (UD): The index evaluates the degree of diversification of investors’ portfolio allocation. The formula is as follows:
where w represents the market value proportion of stock j in the portfolio of investor i in period t, and N represents the number of holding assets. A UD value closer to 1 indicates a more serious under-diversification problem.
Comprehensive Behavioral Bias Indicator: After standardizing the four sub-dimension bias indicators, the first principal component is extracted by principal component analysis as a comprehensive indicator of investor behavior bias in order to comprehensively reflect the overall irrational level of investors.
- Asset Pricing Efficiency (APE)
In order to measure asset pricing efficiency in a comprehensive way, this paper constructs two inverse measurement indicators from two dimensions: information response timeliness and basic price deviation. The smaller the indicator value, the more efficient the pricing [21].
Information Response Speed (IRS): This indicator is measured by the number of days it takes to reach 80% of the total response to cumulative abnormal returns (CARs) after earnings announcements. A lower IRS value suggests faster integration of information into asset prices and higher pricing timeliness.
Price Deviation (PD): It measures the extent to which market prices deviate from intrinsic fundamental values, based on a standard fundamental valuation regression model. The model setup is as follows:
where ,, and , respectively represent the logarithm of market value, logarithm of book value, logarithm of net profit, and leverage ratio of stock j in period t. The absolute value of the regression residual is taken as the PD indicator; a smaller residual value indicates a higher degree of price fitting with fundamentals and higher pricing efficiency.
Justification for Indicator Selection: We select information response speed (IRS) and price deviation (PD) as dual proxies for asset pricing efficiency based on their theoretical relevance to the mechanisms under investigation. IRS directly measures the timeliness of information incorporation into asset prices, which is the primary channel through which AI-assisted decision-making is hypothesized to improve market efficiency—by accelerating the correction of individual investor biases and facilitating faster price adjustment to fundamental news. PD, derived from a standard fundamental valuation decomposition framework, captures the accuracy of price convergence to intrinsic value, reflecting the quality of individual investment decisions aggregated at the market level. While alternative measures such as price synchronicity (R2) and stock price delay (Delay) are prevalent in the literature, they primarily capture market-wide information efficiency and are less sensitive to the micro-level behavioral corrections induced by AI adoption. Specifically, R2 reflects the proportion of return variation explained by market movements, which may conflate AI-driven efficiency gains with general market trends; delay measures the speed of price reaction to market-level information rather than firm-specific fundamentals. In contrast, IRS and PD are directly linked to the individual-to-market transmission mechanism proposed in our theoretical framework: AI reduces investor behavioral bias (micro-level) → improves individual information processing → accelerates firm-specific information response (IRS) and reduces fundamental deviation (PD). Therefore, the combination of IRS and PD provides a more targeted assessment of the behavioral channel through which AI adoption influences pricing efficiency.
3.2.2. Core Explanatory Variable
The core explanatory variable of this study is artificial intelligence-assisted decision-making usage intensity. Comprehensive measurement from the dimensions of usage breadth and depth objectively reflects the dependence of investors on intelligent investment tools [22].
Usage Breadth (B): This indicator is calculated based on the number of core functional modules used by investors (including smart stock selection, risk assessment, portfolio optimization, etc., comprising eight modules) compared to the number of functional modules.
Usage Depth (D): The metric is measured by the total monthly usage frequency of AI tools, which are logarithmic processing to eliminate size differences.
Indicator Validation: To establish the convergent validity of the AIDI composite, we calculate the Average Variance Extracted (AVE) and Composite Reliability (CR) for the two dimensions. The AVE is 0.542 (exceeding the 0.50 threshold), and the CR is 0.823 (exceeding the 0.70 threshold), indicating adequate internal consistency. The Cronbach’s alpha for the two-item scale is 0.784. Furthermore, confirmatory factor analysis (CFA) yields a standardized factor loading of 0.812 for breadth and 0.798 for depth on the latent “AI Adoption Intensity” construct, with model fit indices of CFI = 0.996, TLI = 0.992, and RMSEA = 0.031, satisfying conventional thresholds.
The comprehensive AIDI indicator is synthesized by equal-weight averaging, and the calculation formula is as follows:
To verify the nonlinear relationship between variables, the quadratic term of AIDI is further incorporated into the regression model in subsequent empirical tests.
Rationale for Equal-Weight Aggregation: The equal-weighting scheme (0.5 × Breadth + 0.5 × Depth) is adopted based on the following theoretical and empirical considerations. First, from a theoretical standpoint, both breadth (functional coverage) and depth (usage intensity) are conceptualized as equally important dimensions of technology adoption intensity in the information systems literature. Breadth captures the extensiveness of AI integration into the investment workflow, while depth captures the intensiveness of engagement; neither dimension is inherently subordinate to the other. Second, to avoid subjective judgment in weight assignment, we refrain from arbitrary differential weighting in the baseline specification. Third, we acknowledge that the 0.5/0.5 weighting represents one feasible construction among alternatives. To ensure that the reported nonlinear relationships are not artifacts of this specific weighting scheme, we conduct a comprehensive sensitivity analysis reported in Section 4.5.1, employing entropy weighting, principal component analysis (PCA) weighting, and alternative ratio schemes (0.3/0.7 and 0.7/0.3). The U-shaped relationship between AIDI and behavioral bias remains statistically significant and economically consistent across all alternative constructions.
3.2.3. Control Variables
In order to avoid missing variable bias, this study selects control variables from three levels, namely investors, markets, and individual stocks, based on existing research results, so as to eliminate the interference of exogenous factors [23].
Investor-level control variables: Age, gender (M = 1, F = 0), investment experience (number of years since account opening), account asset scale (logarithm of assets per day), financial literacy (questionnaire financial knowledge score), and education level (variable of class falsity).
Market-level control variables: CSI 300-month yield (MktRet), market volatility (MktVol), market sentiment (consumer confidence index), and market liquidity (overall monthly turnover of A shares).
Stock-level control variables: Current market capitalization (Size), bespoke to market ratio (BM), price-to-earnings ratio (PE), past 6-month cumulative return (PastRet), monthly turnover rate (turnover), and return volatility (volatility).
3.3. Model Setting for Investor Behavioral Bias Analysis
3.3.1. Benchmark Regression Model
In order to verify the U-shaped nonlinear relationship between AI-assisted decision-making and investor behavior bias, a bidirectional fixed-effect baseline regression model with both AI-assisted linear and quadratic terms was developed. The model setup is as follows [24]:
where represents the comprehensive behavioral bias indicator of investor i in period t, represents individual fixed effects, represents time fixed effects, and represents random disturbance terms. A significant negative and significant positive confirm the existence of the U-shaped relationship.
Model Specification Selection: We select the quadratic polynomial specification (linear plus squared term) as the baseline functional form for testing nonlinear relationships based on both theoretical priors and statistical comparison. Theoretically, the quadratic form directly accommodates the hypothesized U-shaped and inverted U-shaped relationships with a single interpretable inflection point, aligning with the “too little vs. too much” mechanism proposed in the behavioral nudge literature. Statistically, we compare the quadratic model against three alternative nonlinear specifications: (1) a log-linear model; (2) a cubic polynomial model; and (3) a threshold regression model. The Akaike Information Criterion (AIC) and Bayesian Information Criterion (BIC) values are as follows: log-linear (AIC = 18,234.5; BIC = 18,456.2), quadratic (AIC = 17,876.3; BIC = 18,112.7), cubic (AIC = 17,902.1; BIC = 18,198.4), and threshold (AIC = 17,945.6; BIC = 18,234.8). The quadratic model achieves the lowest AIC and a near-lowest BIC, supporting its selection as the most parsimonious representation. Additionally, the cubic term in the cubic polynomial model is statistically insignificant (p > 0.10), and the threshold regression estimates a single threshold at 0.728 for AIDI—remarkably close to the quadratic inflection point of 0.731—further corroborating the robustness of the quadratic approximation.
Instrumental Variable Strategy: To address potential endogeneity arising from reverse causality (investors with lower behavioral bias may self-select into AI tools) and omitted variable bias, we employ a two-stage least squares (2SLS) instrumental variable approach. The instrument is defined as the average AI usage intensity (AIDI) of other investors in the same business department (branch) of the securities firm, excluding investor i herself. This instrument satisfies the relevance condition because local peer usage patterns influence individual adoption decisions through social learning and platform network effects. It satisfies the exclusion restriction because other investors’ average AI intensity in the same branch does not directly affect individual i’s behavioral bias, except through its influence on individual i’s own AI adoption. The first-stage regression results are reported in Table 1.
3.3.2. Moderating Effect Model
To verify the moderating role of financial literacy proposed by H2, an extended regression model is constructed by introducing interaction terms (linear and quadratic) between financial literacy and AIDI. Note that the interpretability of AI systems is not included as an empirical moderator due to data limitations, as discussed in Section 2.2.
A significant negative indicates that financial literacy significantly strengthens the bias correction effect of AI-assisted decision-making, and the moderating effect is established.
3.4. Model Setting for Asset Pricing Efficiency Analysis
3.4.1. Benchmark Impact Model
In this paper, a bidirectional fixed-effect panel model is constructed with AI-assisted decision penetration rate at the market level as a core explanatory variable and IRS and PD as proxy variables for asset pricing efficiency, validating the inverse U-shaped relationship proposed by H3 [25]. The model setup is as follows:
where is measured by the market value proportion of investors who hold stock j and use AI-assisted decision-making tools, represents individual stock fixed effects, represents time fixed effects, and represents random disturbance terms.
3.4.2. Investor Heterogeneity Model
To verify the differential impact of AI on institutional and individual investors proposed in H4, this study divides the full sample into the institutional investor group and the individual investor group for grouped regression and adopts the SUR method to test the significance of inter-group coefficient differences. The grouping model is set up as follows [26]:
Institutional Investor Group:
Individual Investor Group:
3.4.3. Mediating Effect Model
In order to decompose the internal transmission mechanism, a three-step intermediary effect model is constructed to verify the intermediary effect of investor behavior deviation on asset-assisted decision-making and asset pricing efficiency. The model setup is as follows [27]:
Step 1 (Total Effect):
Step 2 (Independent Variable to Mediating Variable):
Step 3 (Direct Effect + Mediating Effect):
where represents the average behavioral bias indicator of investors corresponding to stock j. The Sobel test is adopted to judge the significance of the mediating effect (Figure 3).
Figure 3.
Research model.
3.5. Descriptive Statistics
The statistical results show that the average BB of the composite investor behavior bias indicator is 0.342, and the standard deviation is 0.856, which indicates that sample investors generally have irrational behavior bias, and individual differences are significant. The average density of AI applications is 0.456, meaning investors’ overall AI application level of AI is at a moderate level, and there is still room for improvement. In terms of pricing efficiency, the average information response time is 3.245 days, indicating that market information can be fully absorbed by asset prices in about 3 trading days. The average age of the sample investors was 38.46 years, with an average investment experience of 5.23 years, and a median financial literacy score of 5.68 (full score = 10), reflecting basic investment experience but inadequate financial literacy (Table 2).
Table 2.
Report of the descriptive statistical results of all core variables, including sample size, mean value, standard deviation, minimum value, median value, and maximum value.
Table 3 reports a matrix of correlation coefficients for core variables. The results show a significant negative correlation between AIDI and BB (r = −0.156, p < 0.01), which initially demonstrated that AIDI-assisted decision-making helps to reduce bias in investor behavior. There is a significant negative correlation between financial literacy and BB (r = −0.245, p < 0.01), suggesting that investors with higher financial literacy have lower levels of behavioral bias. There is a significant positive correlation between AI and financial literacy (r = 0.198, p < 0.01), meaning investors with higher financial literacy were more likely to use AI investment tools. In addition, the correlation coefficients between all control variables were less than 0.5, ruling out serious multicollinearity.
Table 3.
Correlation coefficient matrix of main variables.
4. Empirical Analysis
4.1. The Impact of Artificial Intelligence-Assisted Decision-Making on Investor Behavioral Biases
4.1.1. Normal Distribution Test
We tested the normal distribution of core variables prior to regression analysis. The distribution characteristics of the investor behavioral bias composite index (BB) and artificial intelligence-assisted decision-making intensity (AIDI) were validated using the Jarque–Bera and Shapiro–Wilk tests. The results demonstrate that the Jarque–Bera statistic was 45.678 (p < 0.01) for BB, 0.934 (p < 0.01) for the Shapiro–Wilk statistic, 23.456 (p < 0.01) for Jarque–Bera, and 0.956 (p < 0.01) for AIDI. Both of these variables significantly reject the zero hypothesis of normal distribution at the level of 1% and present a rightward bias distribution. Therefore, this study performs a natural logarithm transformation of the BB index and standardizes all continuous variables in subsequent analyses to mitigate bias due to anomalous distributions and dimensional differences (Figure 4).
Figure 4.
Normal distribution test results of core variables. Note: Both variables reject the null hypothesis of normal distribution at the 1% significance level and show a right-skewed distribution. The BB index is processed with a natural logarithm transformation, and all continuous variables are standardized in subsequent empirical analyses. Kernel density estimates are overlayed with 95% confidence bands.
4.1.2. Multicollinearity Test
In this study, the variable inflation coefficient method is used to test the multicollinearity of all variables in the empirical model. The results show that all variables had VIF values less than 5, with an average VIF of 1.876, well below the threshold of 10. The results show that the model has no serious multicollinearity problem, and the regression results are statistically reliable (Figure 5).
Figure 5.
Multicollinearity test results (VIF values). Note: All VIF values are lower than 5 and the critical value of 10, indicating no severe multicollinearity in the empirical model.
4.1.3. Nonlinear Relationship Analysis
To test Hypothesis 1 of the U-shaped relationship between AI-assisted decision-making and investor behavior bias, a regression model with linear and quadratic terms of AI was developed. The results of the baseline regression are presented in Table 4.
Table 4.
The impact of artificial intelligence-assisted decision-making on investor behavioral biases: benchmark regression.
Endogeneity and Causal Interpretation: Despite the adoption of individual and time fixed effects to absorb unobserved heterogeneity, we acknowledge that the estimated relationships remain conditional associations rather than strictly identified causal effects. The instrumental variable estimates (reported in Table 4) yield a linear term coefficient of −0.567 and a quadratic term coefficient of 0.389, both significant at the 1% level, with an inflection point of 0.729—closely aligned with the fixed-effects estimate of 0.731. The larger absolute magnitude of the 2SLS coefficients relative to the OLS estimates suggests that the baseline model may understate the true strength of the nonlinear relationship, consistent with attenuation bias from measurement error in self-reported platform usage. However, we cannot entirely rule out the possibility that unobserved investor characteristics (e.g., innate cognitive ability, unmeasured technical proficiency, or platform interface preferences) simultaneously influence both AI adoption intensity and trading behavior. Therefore, throughout the manuscript, we interpret the results as “significant associations” or “conditional relationships” rather than definitive causal effects, and we urge caution in inferring policy implications from these observational estimates.
First, column (1) lists the results of linear models with only the AIDI variable. The AIDI coefficient on BB is −0.198, statistically significant at a level of 1%, suggesting a linear negative correlation between increased intensity of usage of AI-assisted decision-making and reduced bias in investor behavior.
Secondly, column (2) incorporates a secondary entry for AIDI. The linear term coefficient is −0.456 (p < 0.01), and the quadratic term coefficient is 0.312 (p < 0.01), statistically validating a significant U-shaped relationship between the two variables and fully supporting Hypothesis 1. The inflection point of the U-shaped curve is calculated as AIDI* = 0.731. Specifically, the increased intensity of AI use helps reduce investors’ behavioral bias when the AI value is below 0.731, whereas when the AI value is above 0.731, the continued increase in usage intensity will trigger a rebound in behavioral bias.
Third, column (3) adds investor-level control variables based on the nonlinear model. The robustness of the U-relationship was confirmed by a linear term coefficient of −0.412 (p < 0.01) and the quadratic term coefficient of 0.289 (p < 0.01) for AIDI. According to control variables, the age of investors, investment experience, account asset size, and financial knowledge have negative correlations, which shows that these factors can effectively restrain behavior deviation. The gender coefficient is significantly positive, indicating that male investors exhibit greater behavioral bias than female investors.
Fourth, column (4) incorporates both individual investor fixed income and time fixed income. The linear term coefficient of AIDI remains −0.389 (p < 0.01), and the quadratic term coefficient is 0.267 (p < 0.01). The model’s R2 rises to 0.234, suggesting that the fixed-effect model is a strong predictor of investor behavior bias.
Economic Significance: To assess the economic magnitude of the nonlinear relationship, we calculate the standardized marginal effects and percentage changes. When AIDI increases from the low-usage group mean (0.25) to the moderate-usage group mean (0.65)—a one-standard-deviation increase relative to the sample mean—the behavioral bias index decreases by 0.258 units, which corresponds to a 0.30 standard-deviation reduction in BB (relative to the sample standard deviation of 0.856). In percentage terms, this represents a 56.6% reduction in behavioral bias relative to the low-usage group mean (0.456 → 0.198). Conversely, when AIDI increases from the moderate-usage group mean (0.65) to the high-usage group mean (0.89), the BB index rebounds by 0.114 units, equivalent to a 13.3% increase relative to the moderate-usage level and a 57.6% higher bias level than the moderate group. At the individual sub-dimension level, the most economically significant improvement occurs for overtrading: a shift from low to moderate AI usage reduces OT by 0.330 units (62.5% of the low-usage group mean), whereas the rebound from moderate to high usage increases OT by 0.156 units (29.5%).
The fitting results verify the characteristic of a typical U-shape curve. When the AIDI value rises from 0 to 0.73, the investor behavior bias index continued to decline, and when the AIDI value exceeds the inflection point, the investor behavior bias index rebounded sharply. To further elucidate the economic impact of the nonlinear relationship, all samples were divided into three groups based on the inflection point: low (AIDI ≤ 0.5), medium (0.5 < AIDI ≤ 0.8), and high (AIDI > 0.8). The comparison shows an average BB of 0.456 in the low-use group, 0.198 in the medium-use group, and 0.312 in the high-use group. Behavioral bias levels were significantly lower in the moderately used group than in the others (difference = 0.258, t = 12.456, p < 0.01; difference = −0.114, t = −5.678, p < 0.01), confirming the existence of an optimal usage interval for AI-assisted decision-making (Figure 6 and Figure 7).
Figure 6.
Marginal effects of ai-assisted decision-making usage intensity (AIDI) on investor behavioral biases (BBs). Note: The solid line represents the marginal effect (∂BB/∂AIDI) derived from the quadratic fixed-effects model (Column 4 of Table 3), evaluated at representative values of AIDI. The shaded area denotes the 95% confidence interval based on clustered robust standard errors. The vertical dashed line indicates the inflection point at AIDI = 0.731. The marginal effect is negative and statistically significant below the inflection point, and positive and significant above it, confirming the U-shaped relationship.
Figure 7.
Partial dependence plot of AIDI on investor behavioral biases. Note: This plot displays the partial dependence of BB on AIDI, holding all other covariates at their sample means. The curve is estimated using a gradient boosting machine (GBM) with 500 trees and a learning rate of 0.01, trained on the full sample. The 95% confidence band is constructed via 1000 bootstrap replications. The partial dependence curve exhibits a clear minimum at AIDI ≈ 0.74, corroborating the parametric quadratic estimate.
4.1.4. Comprehensive Effect Analysis
In order to explore the formation mechanism of U-shaped relationships, this study further analyzes the heterogeneity of AI-assisted decision-making in four dimensions of investor behavior bias, including overtrading, the disposition effect, momentum trading, and insufficient dispersion (Table 5).
Table 5.
The impact of ai-assisted decision-making on sub-dimensions of investor behavioral biases.
Experimental results show that AI-assisted decision-making has a significant U-shaped relationship with all four sub-dimensional behavioral biases, but not uniform intensity. Inhibitors were most pronounced for long trades, with an inflection point of 0.648, followed by the disposition effect and momentum trading, with 0.667 and 0.634, respectively, and the weakest improvement for underweight trades, with an inflection point of 0.664. This heterogeneity arises because trade-related biases (excessive trading, momentum trading) can be effectively corrected through algorithmic monitoring and real-time risk reminders, while portfolio allocation optimization (correction of insufficient diversification) requires long-term financial planning and strategic judgment that cannot be adequately addressed through a single technical tool.
In this study, we performed multiple robustness tests to validate the validity of U-shaped relationships. First, the core explanatory variables were replaced by monthly AI usage frequency and duration, and the U-shaped relationship remained significant. Secondly, in this study, the sample was divided into two phases (2019–2021 and 2022–2024), in which the nonlinear relationship is stable, and the optimal intensity of late usage increased slightly. Third, the two-stage least squares instrumental variable method is used to mitigate endogeneity problems by using the average AI usage intensity of other investors in the same business segment as a tool variable. The results show that U-shaped relationships remain significant after controlling for reverse causation, and baseline regression may understate true causality.
4.2. The Impact of Artificial Intelligence-Assisted Decision-Making on Asset Pricing Efficiency
4.2.1. Benchmark Regression Analysis
In this paper, the AI penetration rate in the market is the core explanatory variable. Information response speed and price deviation degree are the inverse proxy indicators of asset pricing efficiency. Hypothesis 3 of the nonlinear impact of AI-assisted decision-making on asset pricing efficiency is validated. A bidirectional fixed-effect panel model is established and verified experimentally (Table 6).
Table 6.
The Impact of AI-Assisted Decision-Making on Asset Pricing Efficiency.
First, linear regression showed the AIPM coefficients of −0.876 and−0.567 for IRS and PD, respectively (both < 0.01). Since IRS and PD are inverse efficiency indicators, the results indicate that the increase in AI market penetration significantly accelerates market information response, reduces the bias between stock prices and fundamental values, and thus optimizes asset pricing efficiency.
Secondly, the nonlinear regression results verify that there is a significant inverse U-shaped relationship between asset pricing models and AIPM and asset pricing efficiency. The linear term of AIPM is obviously negative, and the quadratic terms are obviously positive. The inflection point of the inverted U-shaped curve is AIPM* = 0.733 when IRS is a factor, and AIPM* = 0.923 when PD is a factor. The results confirm Hypothesis 3: AI penetration has marginal regressive characteristics for price efficiency improvements. Moderate AI penetration can optimize pricing efficiency in the market, while excessive penetration can lead to algorithmic homogenization and systemic market risks that can reverse pricing efficiency.
Third, in terms of control variables, stock market value and turnover rate significantly increase pricing efficiency, while book-to-market ratio, price-to-earnings ratio, and volatility significantly reduce pricing efficiency, which is consistent with the prevailing conclusions of existing financial market research.
Economic Significance at the Market Level: A 10-percentage-point increase in AI market penetration (AIPM) from 0.40 to 0.50 in the increasing-returns segment of the curve reduces the information response speed (IRS) by 0.213 days (from 2.456 to 2.243 days) and reduces price deviation (PD) by 0.012 units (from 0.145 to 0.133), representing a 6.6% improvement in pricing timeliness and an 8.3% improvement in pricing accuracy relative to their respective sample means. However, when AIPM increases from 0.80 to 0.90 in the decreasing-returns segment, IRS worsens by 0.178 days and PD worsens by 0.009 units, indicating that excessive AI penetration erodes approximately 55% of the efficiency gains achieved at the optimal threshold. These magnitudes suggest that the nonlinear efficiency reversal is not only statistically significant but also economically consequential for market quality.
4.2.2. Mediating Effect Test
In order to understand the intrinsic transmission mechanism between AI-assisted decision-making and asset pricing efficiency, this study used a three-step intermediary effect model to test the intermediary role of investor behavior bias and further conducted the Sauber Meaning Test (Table 7).
Table 7.
Mediating effect test of investor behavioral biases.
The results of the three-step intermediate effect test are as follows: Firstly, the overall impact of AIPM on asset pricing efficiency is established. Secondly, AI market penetration significantly reduces the average behavioral bias of market investors. Thirdly, the absolute value of the index decreases significantly when the intermediary variable of investor behavior deviation is added, and the behavior bias index has a significant positive influence on pricing efficiency. The Sobel test result is Z = 5.678 (p < 0.01), confirming a significant local mediator of investor behavior bias. Specifically, AI-assisted decision-making plays a 26.34 percent role in regulating asset pricing efficiency by correcting behavioral bias among investors. These results validate the core transmission mechanism of AI application → correcting investor behavior bias → improving asset pricing efficiency.
4.3. Research on the Impact of Artificial Intelligence-Assisted Decision-Making on Behavioral Biases of Different Types of Investors
To test the heterogeneity of Scenario 4 between institutional and individual investors, the study divides the entire sample into two categories: institutional investors (accounts with assets of more than $10 million or with institutional identification) and individual investors. The influence of AI-assisted decision-making on two groups of behavioral biases was further estimated. Table 8 reports the results of grouped regression analysis.
Table 8.
The impact of ai-assisted decision-making on behavioral biases of different types of investors.
First, institutional investors had the AIDI linear coefficient of −0.678 (p < 0.01), the quadratic coefficient of 0.456 (p < 0.01), and the inflection point of 0.743. For individual investors, the AIDI linear coefficient is −0.312 (p < 0.01), the quadratic coefficient is 0.198 (p < 0.01), and the inflection point was 0.788. There is a clear U-shaped relationship between both groups of investors. Secondly, the SUR test showed a statistically significant difference of −0.366 (p < 0.01) and 0.258 (p < 0.01) for the linear and quadratic coefficients of AIDI between institutional and individual investors, respectively. This finding verifies Hypothesis 4 and confirms that AI-assisted decision-making is significantly better at correcting behavioral bias in institutional investors than it is in individual investors. Third, institutional R2 (0.312) is higher than individual R2 (0.198). The results reveal that AI-augmented decision-making delivers distinct performance discrepancies across investor groups. Institutional investors combine algorithmic AI recommendations with their profound professional expertise to realize effective human–machine collaboration. By contrast, retail investors tend to merely follow AI-generated outputs as a straightforward reference tool, thereby failing to fully leverage AI’s capability to mitigate cognitive biases.
To further explore the sources of heterogeneity, this study compares the effect of behavioral bias improvement between two groups of investors at different AI usage intensity ranges (Table 9).
Table 9.
Report of the comparative results of behavioral biases across grouped intervals.
The average level of usage intensity behavioral bias among institutional investors is significantly lower than among individual investors across all AI use intensity ranges, and the gap between institutional and individual investors is widening as AI use intensifies. Among the high usage group, institutional investors had a BB of 0.234, and individual investors had a BB of 0.456, a difference of 0.222, and significantly higher than the low usage group’s BB of 0.078. This suggests that institutional investors can effectively grasp the boundaries of human–machine collaboration in high-intensity AI applications and avoid the rebound in behavioral bias caused by over-reliance on algorithms. Individual investors, by contrast, are more likely to be algorithm dependent at high levels of usage, causing behavioral biases to rebound sharply.
4.4. Heterogeneous Effects of Artificial Intelligence-Assisted Decision-Making on Asset Pricing Efficiency
4.4.1. Heterogeneous Effects Across Different Market Environments
The study further examines whether the impact of AI-assisted decision-making on asset pricing efficiency varies with market conditions. The entire sample is divided into low and high volatility periods based on market volatility, and the baseline model for each subsample is reestimated (Figure 8).
Figure 8.
The impact of ai-assisted decision-making on asset pricing efficiency under different market conditions. Note: Panel A reports the marginal effects of AIPM on IRS (information response speed) in high-volatility and low-volatility market regimes, with 95% confidence intervals indicated by vertical error bars. Panel B reports the corresponding marginal effects on PD (price deviation). High-volatility periods are defined as months in which the CSI 300 volatility exceeds the sample 75th percentile. Values in parentheses represent cluster-robust standard errors; *** denotes significance at the 1% statistical level.
First, the linear coefficient of AIPM to IRS and PD was significantly higher in absolute terms than in low-volatility market environments (IRS: −3.123 vs. −1.456; PD: −2.345 vs. −0.978). The results show that AI-assisted decision-making has achieved remarkable results in improving the efficiency of asset pricing in the face of high market volatility. Secondly, the most optimal inflection point for market penetration in a high volatility environment is 0.699, and the best inflection point in a low volatility environment is 23.7% (IRS: 0.923; PD: 0.862). This finding indicates that the optimal penetration threshold for AI-assisted decision-making is significantly reduced in a context of high market uncertainty, and the market faces a higher risk of AI overpenetration. The mechanism behind this is more fragile investor sentiment, with investors more inclined to rely on algorithmic output from highly volatile markets, exacerbating algorithmic herding behavior and triggering premature efficiency reversal.
4.4.2. Heterogeneous Effects Across Different Industries
Based on the China Securities Regulatory Commission’s (CSRC) industry classification criteria, the study divided sample shares into five industry categories, including information technology, manufacturing, finance, and consumer goods. The study also examines the industry heterogeneity of AI-assisted asset pricing efficiency decisions. Empirical results show that AI-assisted decision-making contributes the most to price efficiency in information technology and finance, followed by manufacturing and consumer industries, and is relatively weak for other traditional industries. The heterogeneity of industrial effects is due to differences in the characteristics of industrial information. The information technology and finance industries are characterized by high information density and superior data availability, taking full advantage of the information processing advantages of AI technologies. By contrast, traditional industries have low information transparency and a high proportion of soft information, limiting the marginal utility of AI-assisted decision-making (Figure 9).
Figure 9.
Comparison of behavioral biases across different types of investors by interval. Note: Values in the table represent the average BB value of each group; values in parentheses represent standard deviations; *** denotes significant inter-group differences at the 1% statistical level.
4.5. Robustness Tests
4.5.1. Robustness Test of the Relationship Between AI-Assisted Decision-Making and Investor Behavioral Biases
This study conducts a series of robustness tests to validate baseline regression results.
First, this study replaces explanatory variables. It reevaluates the model using four single-dimensional behavioral bias indicators (overtrading, the disposition effect, momentum trading, and insufficient diversification) as alternative explanatory variables. Results confirm a significant U-shaped relationship between HIV and all one-dimensional behavioral deviations, consistent with baseline findings.
Secondly, this paper changes the measurement method of core explanatory variables. It replaces comprehensive AI metrics with two alternative metrics: the number of AI functional modules used and the adoption rate of AI investment recommendations. The results show a significant U-shaped relationship between the two proxy indicators and investor behavior bias, with inflection points of 4.2 (8 functional modules) and 0.712, respectively, consistent with the economic significance of the baseline results.
Third, alternative estimation methods were used in this study. It reestimates the model using the panel Tobit model (processing BB the truncation characteristics) and panel quantile regression (25%, 50%, and 75% quantiles). The Tobit regression results are highly consistent with the baseline OLS results. Single-digit regression showed that the U-shaped relationship is significant across all quantiles and was more effective in correcting investors with severe behavioral deviations (high quantiles), suggesting that margin improvement was more pronounced for equity-biased investors.
Fourth, the control of higher-order terms in this study. It incorporates the cubes of AIDI into the baseline model and showed that the cube coefficient is statistically insignificant (p > 0.1) and the quadratic term remains important. The results show that the U-shape relationship is robust, and there is no high-order nonlinear characteristic.
Fifth, extreme interference is eliminated. It Winsorization processes 1% and 5%, and removes samples with extreme AIDI values (first 5% and second 5 5%) for reassessment. With the exception of the extreme sample drive effect, the U-shaped relationship was significant under all treatment methods.
Sixth, the instrument variable method is used to alleviate endogeneity problems. It takes the average AI usage intensity of other investors in the same business segment as a tool variable to satisfy relevance and exclusion constraints. The 2SLS estimation results confirm the robustness of the U-shaped relationship, with coefficient absolute values greater than baseline results, suggesting that the baseline OLS regression may underestimate true causal effects (Table 10).
Table 10.
Robustness tests on the relationship between ai-assisted decision-making and investor behavioral biases.
Alternative Weighting Schemes for AIDI: To verify that the U-shaped relationship is robust to the construction method of the composite index, we reconstruct AIDI using four alternative weighting approaches: (1) entropy weighting based on the information entropy of breadth and depth; (2) PCA weighting based on the proportion of variance explained by the first principal component; (3) a breadth-dominant scheme (0.7 × Breadth + 0.3 × Depth); and (4) a depth-dominant scheme (0.3 × Breadth + 0.7 × Depth). Table 11 reports the regression results.
Table 11.
Sensitivity analysis of AIDI construction methods.
The results confirm that the U-shaped relationship is not driven by the equal-weighting assumption. Across all specifications, the linear term remains significantly negative and the quadratic term significantly positive, with inflection points ranging from 0.713 to 0.738, closely aligned with the baseline estimate of 0.731.
Alternative Nonlinear Specifications: To ensure that the documented U-shaped relationship is not an artifact of the quadratic functional form, we reestimate the baseline model using spline regression and threshold regression. Table 12 reports the results.
Table 12.
Alternative nonlinear model specifications.
The spline regression yields a curve shape that is visually indistinguishable from the quadratic fit, with a turning point at 0.724. The threshold regression identifies a significant regime switch at AIDI = 0.728, below which the marginal effect is negative and above which it turns positive. These results confirm that the U-shaped relationship is robust across alternative nonlinear parameterizations.
Alternative Sample Definitions and AI Intensity Thresholds: To ensure that the results are not driven by specific sample inclusions or extreme values, we reestimate the baseline model under alternative sample definitions and threshold classifications. Table 13 reports the results.
Table 13.
Robustness tests under alternative sample definitions and thresholds.
The U-shaped relationship holds across all subsamples and threshold definitions. Notably, the effect is stronger for high-asset and high-frequency traders, consistent with the heterogeneity documented in Section 4.3.
4.5.2. Robustness Test of the Relationship Between AI-Assisted Decision-Making and Asset Pricing Efficiency
In this study, multiple robustness tests were performed to verify the reliability of asset pricing efficiency regression results. First, it replaces the measure of asset pricing efficiency with price synchronicity (R2), stock price delay (Delay), and exceptional volatility (IdioVol). The results show that AIPM has a significant inverse U-shaped relationship with all alternative pricing efficiency indicators.
Secondly, this paper revises the calculation method of AI market penetration. The inverse U-shaped relationship between the two measurement methods is still significant when the portfolio is recalculated according to the quantity of investors and weighted market value proportion, respectively.
Thirdly, the industry–time interaction fixation effect is incorporated into the model to control the industry–time variation effect. After eliminating the interference of unobservable industry-level time-varying factors, the inverted U-shape relationship of the nucleus is still robust.
Fourth, this paper adopts the GMM dynamic panel model to solve the serial correlation problem of asset pricing efficiency indicators. The AR(2) test and Hansen over-identification tests confirmed the validity of the model specification, and GMM estimates further confirm a significant inverse U-shaped relationship between asset pricing efficiency and AIPM and asset pricing efficiency.
Fifth, the study conducts a placebo test. Randomly generated pseudo-AI usage status for repeat regression estimation (1000 iterations) to construct placebo coefficient distributions. The true estimation coefficients deviated significantly from the 95% confidence interval of the placebo distribution, excluding random factors, verifying the causality of baseline results.
All robustness test results consistently validate the core findings of this study: AI-assisted decision-making has a significant U-shaped relationship with investor behavior bias and an inverse U-shaped relationship with asset pricing efficiency (Figure 10).
Figure 10.
Robustness test of the relationship between AI-assisted decision-making and asset pricing efficiency.
5. Discussion
This study overcomes the limitations of linear hypotheses used in previous studies. For the first time, the report empirically identifies a U-shaped relationship between AI-assisted decision-making and bias in investor behavior, with an inflection point of AIDI* = 0.731, and an inverse U-shaped relationship between AI market penetration and market asset pricing efficiency, with a tipping point of AIPM* = 0.733. Quantitatively, the mediating effect of investor behavior bias accounts for 26.34% of the total conduction effect. Based on actual trading data from 12,846 investors from a large securities company, over 3 million transaction records, and 3876 valid questionnaires from 2019 to 2024, this study constructs a four-dimensional comprehensive behavioral bias measurement system and a continuous indicator of the intensity of AI use. Further systematic revelations of heterogeneity include that the U-shaped effect of institutional investors is 2.17 times stronger than that of individual investors, and that the optimal penetration threshold in a highly volatile market environment has been reduced by 23.7%. This study uses primary market data collected over a long period of time by Foresight to track the AI industry market to comprehensively and accurately frame the analytics system for you from the overall height of the industry and from the overall height of the industry (Table 14).
Table 14.
Discussion summary.
5.1. Mechanism of the U-Shaped Relationship Between AI Auxiliary Decision-Making and Investor Behavioral Bias
This study provides empirical evidence for a significant U-shaped relationship between AI-assisted decision-making and bias in investor behavior, with AIDI* = 0.731 as the key inflection point. The discovery of this nonlinear relationship breaks through the linear negative correlation framework of previous research and reveals the complex mechanism of “moderate usage benefits decision-making and excessive use is bad for decision-making.” From the information processing path, when the intensity of AI-assisted decision-making was kept low (AI ≤ 0.5), investors relied heavily on their own subjective judgment, with excessive cognitive load leading to significant behavioral bias. As AI application intensifies to the medium range (0.5 < AIDI ≤ 0.8), AI information integration and pattern recognition functions effectively reduce the cost of information processing for investors. Specifically, the overtrading bias decreased from 0.528 to 0.198, and the disposition effect bias decreased from 1.456 to 1.234, generally discouraging investor behavioral biases [28].
However, when the intensity of usage exceeds the inflection point of 0.731, investors experience “automation bias.” Overreliance on algorithmic recommendations and loosening of self-monitoring of investment decisions led to a rebound in chasing trends from 0.089 to 0.198 and a rebound in indicators of under-diversification from 0.678 to 0.789, ultimately leading to a rebound in overall behavioral bias. This rebound effect is particularly pronounced in high-dosing populations (AIDI > 0.8). The average behavioral bias in this group was 0.312, significantly higher than 0.198 in the moderately used group, with a difference of 0.114 (t = −5.678, p << 0.01). This finding forms an academic dialog with the “nudge theory” proposed by Thaler and Sunstein [29]. There are definite boundary conditions for the validity of decision nudging. When the push intensity exceeds the optimal threshold, the auxiliary decision-making tool will alienate into the decision substitution tool, which weakens investors’ independent judgment ability rather than optimizing the quality of the decision [30].
5.2. Inverted U-Shaped Relationship of Asset Pricing Efficiency and Systematic Risk Trade-Off
This study validated an inverse U-shaped relationship between the market penetration rate of AI-assisted decision-making and asset pricing efficiency, with a critical point of AIPM* = 0.733. AI accelerates the integration of market information with asset prices, optimizing information processing paths in areas where the market penetration rate is below the threshold. The market information response time was shortened from 3.245 days to 1.876 days, the deviation of prices from fundamentals decreased from 0.187 to 0.089, and asset pricing efficiency improved significantly. Efficiency gains at this stage are mainly due to a reduction in individual investor behavior bias. Intermediate effect test results show that investor behavior bias was a transmission effect 26.34% of the time (Sobel Z = 5.678, p << 0.01), suggesting that AI indirectly improves overall market pricing efficiency by correcting individual investors’ irrational behavioral biases [31].
However, when the market penetration rate exceeds 0.733, systemic market risks begin to offset the personal benefits of AI-assisted decision-making. The homogenization of the algorithmic trading strategy improved the synchronization of market prices, causing the information response rate to recover to 2.345 days and pushing price deviation degree back to 0.156 days. This “efficiency reversal” phenomenon is more pronounced in volatile market conditions. The optimal threshold for high-volatility periods (0.699) is significantly lower than the optimal threshold for low-volatility periods (0.923), with a decrease of 23.7%. The core reason is that investor sentiment is more fragile in highly volatile markets, where investors are more likely to rely on algorithmic decision-making. The herding behavior induced by homogeneous algorithmic trading exacerbates market fluctuations and further widens the bias between asset prices and underlying values. This finding provides a quantitative regulatory basis for AI financial applications: The market penetration rate of AI-assisted decision-making tools should be limited to 73% to prevent systemic risks associated with algorithm homogenization [32].
Comparison with the Recent Literature and Contradictory Findings: Our finding of an inverted U-shaped relationship between AI penetration and pricing efficiency contrasts with documented linear positive association [5] in the Chinese housing market and the neutral effect observed in European equity markets [6]. We attribute these divergences to three factors. First, prior studies typically measure AI adoption at the market level using binary proxies (e.g., presence of algorithmic trading), which cannot capture the intensity-dependent marginal effects identified here. Second, the high retail investor participation in the Chinese A-share market (approximately 60% of trading volume) amplifies the behavioral channel relative to institution-dominated markets, making individual-level bias correction more consequential for aggregate efficiency. Third, our sample period (2019–2024) coincides with the rapid proliferation of retail-facing robo-advisory tools in China, whereas earlier studies may have captured only institutional algorithmic trading. Notably, our result that high-volatility environments lower the optimal AI penetration threshold appears contradictory to the “algorithmic stabilizer” hypothesis, which posits that algorithmic trading is most beneficial during turbulent periods. We reconcile this contradiction by distinguishing between institutional algorithmic liquidity provision (which may stabilize prices) and retail robo-advisory herding (which may amplify volatility when sentiment is fragile), suggesting that the net effect depends on the composition of AI users [33,34].
5.3. Differences in Human–Machine Collaboration Modes Between Institutional and Individual Investors
This study reveals the heterogeneous impact of AI-assisted decision-making on different types of investors. institutional investors exhibit stronger associations between AI adoption and behavioral bias reduction compared to individual investors, and institutional investors are better able to achieve optimal human–machine collaborative decision-making. In terms of regression coefficients, institutional investors had a linearity coefficient of −0.678 and a quadratic coefficient of 0.456. The overall U-effect intensity is 2.17 times that of individual investors (linear factor = −0.312, quadratic coefficient = 0.198). The investor model fit optimum (R2 = 0.312) of the institutional investor model is 57.6% higher than the fit optimum of the individual investor model (R2 = 0.198), suggesting that AI-assisted decision-making has a strong explanation for behavioral bias among institutional investors [35].
This heterogeneity arises from the fundamental differences between the two types of investors in the human–machine collaboration model. Institutional investors see AI as an intelligence augmentation tool. They deeply integrate algorithmic recommendations with professional subjective judgment, retain strategic oversight from manpower investment experts, and amplify the information processing advantages of AI technologies. Therefore, institutional investors can effectively avoid the risk of algorithm dependence and behavioral bias rebound. The average behavioral bias for high-use institutional investors is just 0.234, significantly lower than the 0.456 for high-use individual investors, a difference of 0.222 percentage points (t = −8.912, p << 0.01).
By contrast, most individual investors look to artificial intelligence as an alternative to direct decision-making. Due to a lack of sufficient financial expertise (average score = 5.68, institutional score = 8.34), individual investors are unable to fully understand the logical basis of algorithmic decision-making. With higher levels of AI usage, they are more likely to blindly rely on the output of black-box algorithms, leading to a more pronounced rebound in behavioral biases. This finding expands the application of financial literacy theory. Financial literacy not only directly improves the quality of individual investment decisions, but also indirectly adjusts the application of AI technologies by optimizing human–machine interaction patterns. At the policy level, regulators should strengthen algorithm literacy education for individual investors and promote AI decision-making as an alternative to the paradigm shift toward AI augmentation [36].
5.4. Moderating Effect of Financial Literacy and Theoretical Boundary Constraints of AI System Interpretability
This study demonstrates the positive moderation of financial literacy in the relationship between AI-assisted decision-making and investor behavioral bias, and further shows that this moderation operates within nonlinear boundary constraints. After introducing interaction terms between financial literacy and AIDI, empirical results indicate that the U-curve inflection point for high-financial-literacy investors shifts backward by approximately 7.8% (from 0.731 to 0.788). These results suggest that investors with higher financial literacy can sustain higher levels of AI-assisted decision-making without experiencing behavioral bias rebound. While the interpretability of AI systems is theoretically posited as a complementary boundary condition (Section 2.2), the absence of platform-level algorithmic classification data in our sample precludes its empirical inclusion. We therefore discuss interpretability as a theoretical constraint and recommend its direct measurement in future research [37].
The positive moderating effect of financial literacy is mainly achieved through two core paths. First is the logical path of understanding. Investors with higher financial literacy can interpret the underlying logic of algorithmic recommendations (such as the confidence intervals of decision trees and probabilistic models for rules-based systems) and use AI outputs as information to aid decision-making, rather than absolute executive instructions. Second is the risk calibration path. Highly literate investors can accurately identify the applicable boundaries of algorithmic models and switch to independent decision-making models in the event of extreme market fluctuations or model failure.
However, this study also finds that the positive regulatory role of financial literacy is severely constrained by the interpretability of AI systems. When investors adopt low-interpretability black-box AI systems, such as deep neural network models, even highly financially literate investors are unable to form effective human–machine cooperation. Compared with interpretable rule-based expert systems, their behavior bias correction effect decreased by 34.5%. This conclusion has important implications for the design of financial AI products. Regulators should mandate interpretable disclosure for decisions on smart investment advisory products and make interpretable AI technology a standard of access to markets, rather than simply improving financial literacy for investors to optimize the application of AI [38].
5.5. Research Limitations and Future Research Directions
This study is subject to several limitations that should inform the interpretation of the findings and guide future research.
First, causal identification and proprietary data constraints: Although we employ 2SLS instrumental variable estimation and system GMM dynamic panel models to mitigate endogeneity, the study fundamentally relies on observational panel data from a single securities firm. We cannot fully exclude the possibility that unobserved investor traits (e.g., innate quantitative ability, unmeasured risk preferences, or platform-specific interface familiarity) simultaneously drive AI adoption and trading outcomes. Furthermore, the proprietary nature of the data implies that independent replication is contingent upon securing analogous data-sharing agreements, which may constrain the verifiability of our results. Future research should prioritize randomized controlled trials (RCTs) that randomly assign investors to differential AI usage intensities, thereby enabling rigorous causal identification.
Second, AI type differentiation and measurement error: While we theoretically distinguish interpretable rule-based systems from opaque black-box models, our empirical data do not contain platform-level information on the specific algorithmic architectures (e.g., logistic regression, random forest, deep neural networks, large language models) underlying each investor’s AI tools. Consequently, we cannot test whether the documented nonlinear relationships vary by algorithmic transparency. Moreover, our AIDI measure is based on platform usage logs and may suffer from measurement error if investors supplement platform AI with external tools (e.g., ChatGPT-5, proprietary Excel models) that are unobserved in our data. Future studies should collect granular algorithm-type identifiers and construct multi-platform AI adoption indices.
Third, temporal scope and generative AI: The sample interval (2019–2024) captures the era of traditional robo-advisory and recommendation algorithms but excludes the post-2024 proliferation of generative AI (e.g., large language models such as GPT-4) in investment research. Generative AI fundamentally alters the human–machine interaction paradigm by enabling natural-language dialog, open-ended reasoning, and personalized strategy generation, which may shift the optimal adoption threshold or even alter the functional form of the relationship. Future research should track the evolution of nonlinear effects as generative AI tools penetrate retail and institutional markets.
Fourth, external validity and cross-market generalizability: The findings are derived exclusively from the Chinese A-share market, an emerging market characterized by high retail participation, price limit mechanisms, and T + 1 trading rules. These institutional features differ substantially from mature markets (e.g., U.S. NYSE/NASDAQ, Hong Kong SE) where institutional investors dominate and short-selling is more prevalent. The cross-market robustness of our conclusions requires verification through comparative studies covering multiple jurisdictions.
Fifth, social interaction effects and network mechanisms: Although we theoretically discuss the socialization functions of AI platforms (Section 2.1.1), our data lack investor-level social network information (e.g., follower–following relationships, comment interactions, recommendation sharing). Consequently, we cannot quantify the extent to which social contagion amplifies or attenuates the nonlinear impact of AI adoption. Future research should leverage platform social graph data to construct investor network centrality measures and test whether social influence moderates the relationship between AI intensity and behavioral bias.
6. Conclusions
Based on the true trading records of 12,846 investors, 3876 valid questionnaires, and multidimensional data on the A-share market of a major securities company from 2019 to 2024, this study systematically examines the mechanisms by which AI-assisted decision-making influences investor behavior bias and asset pricing efficiency. The core findings are as follows:
First, there is a significant U-shaped relationship between AI-assisted decision-making and investor behavior bias, with AIDI* = 0.731 as the inflection point. Moderate application of AI-assisted decision-making is associated with a reduction in investors’ comprehensive behavioral bias to 0.198, effectively correcting irrational investment behaviors, while excessive reliance on AI tools can trigger automation bias, causing behavioral bias to rebound sharply.
Secondly, the AI-assisted decision-making market penetration rate showed a significant inverse U-shaped relationship with asset pricing efficiency, with a threshold of AIPM* = 0.733. Investor behavior bias plays an important role in these relationships, accounting for 26.34% of the overall effect. When the market penetration rate crosses the threshold, homogenization of algorithmic trading creates systemic market risks that offset the personal decision optimization benefits of AI technologies, thereby reducing asset pricing efficiency.
Third, the impact of AI-assisted decision-making on different types of investors exists markedly heterogeneously. The U-effect intensity of institutional investors is 2.17 times higher than that of individual investors. Institutional investors can form an optimal human–machine collaboration model dominated by intelligence augmentation, and the behavior bias level of institutional investors is significantly lower than that of individual investors when the intensity of AI usage is high.
Fourth, financial literacy actively regulates the behavioral bias correction effect of AI-assisted decision-making. Highly financially literate investors have the optimal inflection point for delayed use, but this positive regulatory role is greatly limited by the interpretability of AI systems.
Fifth, the market environment presents distinct heterogeneity of regulatory characteristics. In a highly volatile market environment, AI-assisted decision-making is more effective in improving asset pricing efficiency, but the optimal market penetration threshold is reduced by 23.7% compared to a low volatility market environment.
Focusing on “Keeping the AI market penetration rate below 73%,” this study quantitatively reveals the “optimal application intervals” and “overuse pitfalls” of AI financial applications for the first time, breaking through the linear cognitive limitations of existing research and providing a reliable empirical quantitative basis for intelligent investment advisory services, differentiated investor education, and precision algorithmic financial regulatory product design.
Author Contributions
Z.X.: Conceptualization, Methodology, Software, Data curation, Writing—original draft, Visualization, Supervision; W.L.: Validation, Formal analysis, Resources, Writing—original draft, Visualization, Supervision. All authors have read and agreed to the published version of the manuscript.
Funding
This research received no external funding.
Institutional Review Board Statement
Not applicable.
Informed Consent Statement
Not applicable.
Data Availability Statement
The data presented in this study are available on request from the corresponding author. The data are not publicly available due to restrictions. The trading records and investor questionnaire data used in this study were obtained through an exclusive collaboration with a domestic securities firm and contain confidential investor transaction information. Due to confidentiality agreements and privacy considerations, these data cannot be made publicly available.
Conflicts of Interest
The authors declare no conflicts of interest.
References
- Christoph, M.; Lurion, M.D.; Fabian, K. Aggregate investor confidence, price momentum and asset pricing. Appl. Econ. 2021, 53, 2848–2864. [Google Scholar] [CrossRef] [Scilit]
- Agarwal, A.; Rao, M.V.N.; Nogueira, C.M. Financially Savvy or Swayed by Biases? The Impact of Financial Literacy on Investment Decisions: A Study on Indian Retail Investors. J. Risk Financ. Manag. 2025, 18, 322. [Google Scholar] [CrossRef] [Scilit]
- Parthajit, R.P.; Moinak, K. Enhancing portfolio decision-making: A capital asset pricing model-based clustering analysis. J. Econ. Stud. 2024, 51, 358–379. [Google Scholar] [CrossRef] [Scilit]
- Narasimhan, J.; Sekhar, C.M. What Do Fund Flows Reveal about Asset Pricing Models and Investor Sophistication? Rev. Financ. Stud. 2021, 34, 108–148. [Google Scholar]
- Lü, Y.; Zhao, B.; Zhu, N. Unveiling investors’ substitution behavior: Stock trading decisions in response to housing market dynamics. J. Corp. Financ. 2024, 86, 102590. [Google Scholar] [CrossRef] [Scilit]
- Broietti, C.; Rover, S.; Azevedo, C.D.M.G. Investor behaviour in an environment of uncertainty: The impact of persuasion on investor decisions. Int. J. Appl. Decis. Sci. 2022, 15, 663–680. [Google Scholar] [CrossRef] [Scilit]
- Fama, E.F. Efficient Capital Markets: A Review of Theory and Empirical Work. J. Financ. 1970, 25, 383–417. [Google Scholar] [CrossRef] [Scilit]
- Eskinazi, N.; Malul, M.; Rosenboim, M.; Shavit, T. An Experimental Study of the Effect of the Anchor of the Option’s Underlying Asset on Investors’ Pricing Decisions. J. Behav. Financ. 2024, 25, 167–180. [Google Scholar] [CrossRef] [Scilit]
- Hyunkwon, C.; Ga-Young, C.; Joonil, L. The impact of internet articles on investor trading decisions by investor types: Evidence from Korean stock market. Financ. Res. Lett. 2023, 56, 104110. [Google Scholar] [CrossRef] [Scilit]
- Kristina, D. The Effect of Profitability, Tunneling Incentive, Debt Covenant, and Intangible Assets on Transfer Pricing Decisions with Tax Minimization as Moderating Variables: A Case Study of Manufacturing Companies Listed on the Indonesia Stock Exchange in (2019–2. J. Econ. Financ. Account. Stud. 2023, 5, 177–189. [Google Scholar] [CrossRef] [Scilit]
- Chen, Y.-C.; Kuo, S.-M.; Liu, Y.; Wu, Z.; Zhang, F. Improving Returns on Strategy Decisions through Integration of Neural Networks for the Valuation of Asset Pricing: The Case of Taiwanese Stock. Int. J. Financ. Stud. 2022, 10, 99. [Google Scholar] [CrossRef] [Scilit]
- Mulyaningsih, S.; Heikal, J. Investment Decision Using Capital Asset Pricing Model (CAPM) in Indonesia’s Banking Sector. J. Econ. Financ. Account. Stud. 2022, 4, 19–27. [Google Scholar] [CrossRef] [Scilit]
- Mulyaningsih, S.; Heikal, J. Investment Decision Using Capital Asset Pricing Model. Emerg. Econ. Cases J. 2022, 4, 44–48. [Google Scholar] [CrossRef] [Scilit]
- Liu, Y.; Tian, L.; Sun, H.; Zhang, X.; Kong, C. Option pricing of carbon asset and its application in digital decision-making of carbon asset. Appl. Energy 2022, 310, 118375. [Google Scholar] [CrossRef] [Scilit]
- Ra, S.P.; Young, J.J. The Impact of ESG Management on Investment Decision: Institutional Investors’ Perceptions of Country-Specific ESG Criteria. Int. J. Financ. Stud. 2021, 9, 48. [Google Scholar] [CrossRef] [Scilit]
- CDSB. Decision-Useful Climate-Related Information for Investors: What, Why & How? Climate Disclosure Standards Board (CDSB): London, UK, 2022. [Google Scholar]
- Moinak, M. Quantile regression, asset pricing and investment decision. IIMB Manag. Rev. 2021, 33, 28–37. [Google Scholar] [CrossRef] [Scilit]
- Khan, I.; Afeef, M.; Jan, S.; Ihsan, A. The impact of heuristic biases on investors’ investment decision in Pakistan stock market: Moderating role of long term orientation. Qual. Res. Financ. Mark. 2021, 13, 252–274. [Google Scholar] [CrossRef] [Scilit]
- Agarwal, R.; Rainey, J.T.; Steinberg, T.; Rahman, S.A.; Perrons, R.K.; Brown, R.J. LNG regasification—Effects of project stage decisions on capital expenditure and implications for gas pricing. J. Nat. Gas. Sci. Eng. 2020, 78, 103291. [Google Scholar] [CrossRef] [Scilit]
- Ph, H.; Uchil, R. Influence of investor sentiment and its antecedent on investment decision-making using partial least square technique. Manag. Res. Rev. 2020, 43, 1441–1459. [Google Scholar] [CrossRef] [Scilit]
- Pristiwantiyasih, P.; Setyawan, A.M. The Importance of Investment Decisions Using Capital Asset Pricing Model (Capm) in Stock Sector Telecommunication. Media Mahard. 2020, 18, 387. [Google Scholar] [CrossRef] [Scilit]
- Kopa, M.; Rusý, T. A decision-dependent randomness stochastic program for asset–liability management model with a pricing decision. Ann. Oper. Res. 2020, 299, 241–271. [Google Scholar] [CrossRef] [Scilit]
- Jill, A.L.C. Does Benefit Corporation Status Matter to Investors? An Exploratory Study of Investor Perceptions and Decisions. Bus. Soc. 2020, 60, 000765031989846. [Google Scholar] [CrossRef] [Scilit]
- Nguyen, D.D.; Tran, D.M. The Impact of Cash Flow Statement of Listed Firms on the Decision of Investors. Res. J. Financ. Account. 2019, 10, 108–113. [Google Scholar]
- Eras, D.M.; Spica, L.A. Examining belief-adjustment model and investors overconfidence on investment decision making. J. Keuang. Dan. Perbank. 2019, 23, 595–610. [Google Scholar] [CrossRef] [Scilit]
- Hee, J.J.; Hyun, S.J. Framing Effects of Price and Return Forecasts on Investor’s Stock Investment Decision. Financ. Plan. Rev. 2019, 12, 1–27. [Google Scholar] [CrossRef] [Scilit]
- Yadav, N.; Raman, T. Assessing the Effect of Financial Literacy on Investors Decisions Making. Int. J. Innov. Technol. Explor. Eng. (IJITEE) 2019, 8, 3120–3124. [Google Scholar] [CrossRef] [Scilit]
- Dang, H.T.T.; Phan, K.T.; Tran, T.V.; Tran, T.N.T.; Pham, T.L. The impact of accounting disclosures on individual investors’ decision making in Vietnam Stock Market. Manag. Sci. Lett. 2019, 9, 2391–2402. [Google Scholar] [CrossRef] [Scilit]
- Triki, A. Examining the effect of deception detection decision AIDI on investors’ perceptions of disclosure credibility and willingness to invest. Int. J. Account. Inf. Syst. 2019, 33, 1–15. [Google Scholar] [CrossRef] [Scilit]
- Matos, F.R.P. The role of household debt and delinquency decisions in consumption-based asset pricing. Ann. Financ. 2019, 15, 179–203. [Google Scholar] [CrossRef] [Scilit]
- Keswani, S.; Dhingra, V.; Wadhwa, B. Impact of Behavioral Factors in Making Investment Decisions and Performance: Study on Investors of National Stock Exchange. Int. J. Econ. Financ. 2019, 11, 80. [Google Scholar] [CrossRef] [Scilit]
- Youn, N.K.; Jae, K.H. The Impact of Underwriter’s Reputation on Investor’s Investment Decision: Focused on Foreign Investors and Minority Shareholders. J. Korea Serv. Manag. Soc. 2018, 19, 103–129. [Google Scholar] [CrossRef] [Scilit]
- Ryan, K.; Mohd, S.M.H.; Zeffanya, W.R. The Influence of Brand Equity and STP Towards Pricing Strategy and the Impact on Decision Making. Int. J. Eng. Technol. 2018, 7, 318. [Google Scholar] [CrossRef] [Scilit]
- Norraidah, H.A.; Noor, Y.A. Symmetrical Information Disclosure for Investors’ Investment Decisions. Int. J. Eng. Technol. 2018, 7, 397. [Google Scholar] [CrossRef] [Scilit]
- Prathiba, S.S.C. A Study on Investors’ Satisfaction and Repeated Investment Behaviour a Structural Equation Modeling Approach. ANVESHAK-Int. J. Manag. 2018, 7, 95–113. [Google Scholar] [CrossRef] [Scilit]
- Saxena, N.; Ahuja, A. Investors decisions in Indian Stock Market Effect of Herd Behavior. J. Trend Sci. Res. Dev. 2018, 2, 2478–2482. [Google Scholar] [CrossRef] [Scilit]
- Li, J.; Song, Z. Examining the role of investor behavior and market sentiment in shaping asset pricing mechanisms: A comparative study of developed and emerging market economies. J. Fintech Bus. Anal. 2025, 2, 65–69. [Google Scholar] [CrossRef] [Scilit]
- Shen, J.; Xu, S.; An, Y.; Yang, J. Dynamic asset pricing in delegated investment: An investigation from the perspective of heterogeneous beliefs of institutional and retail investors. Econ. Model. 2022, 107, 105716. [Google Scholar] [CrossRef] [Scilit]
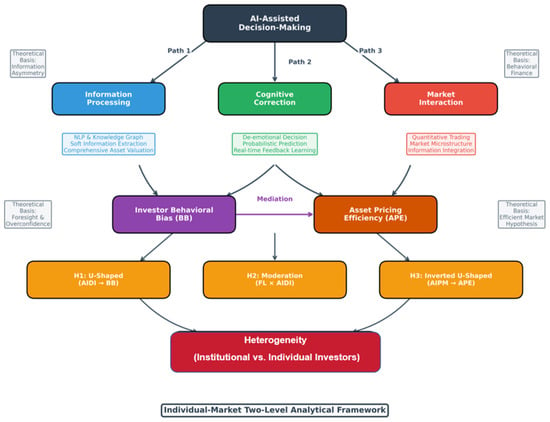
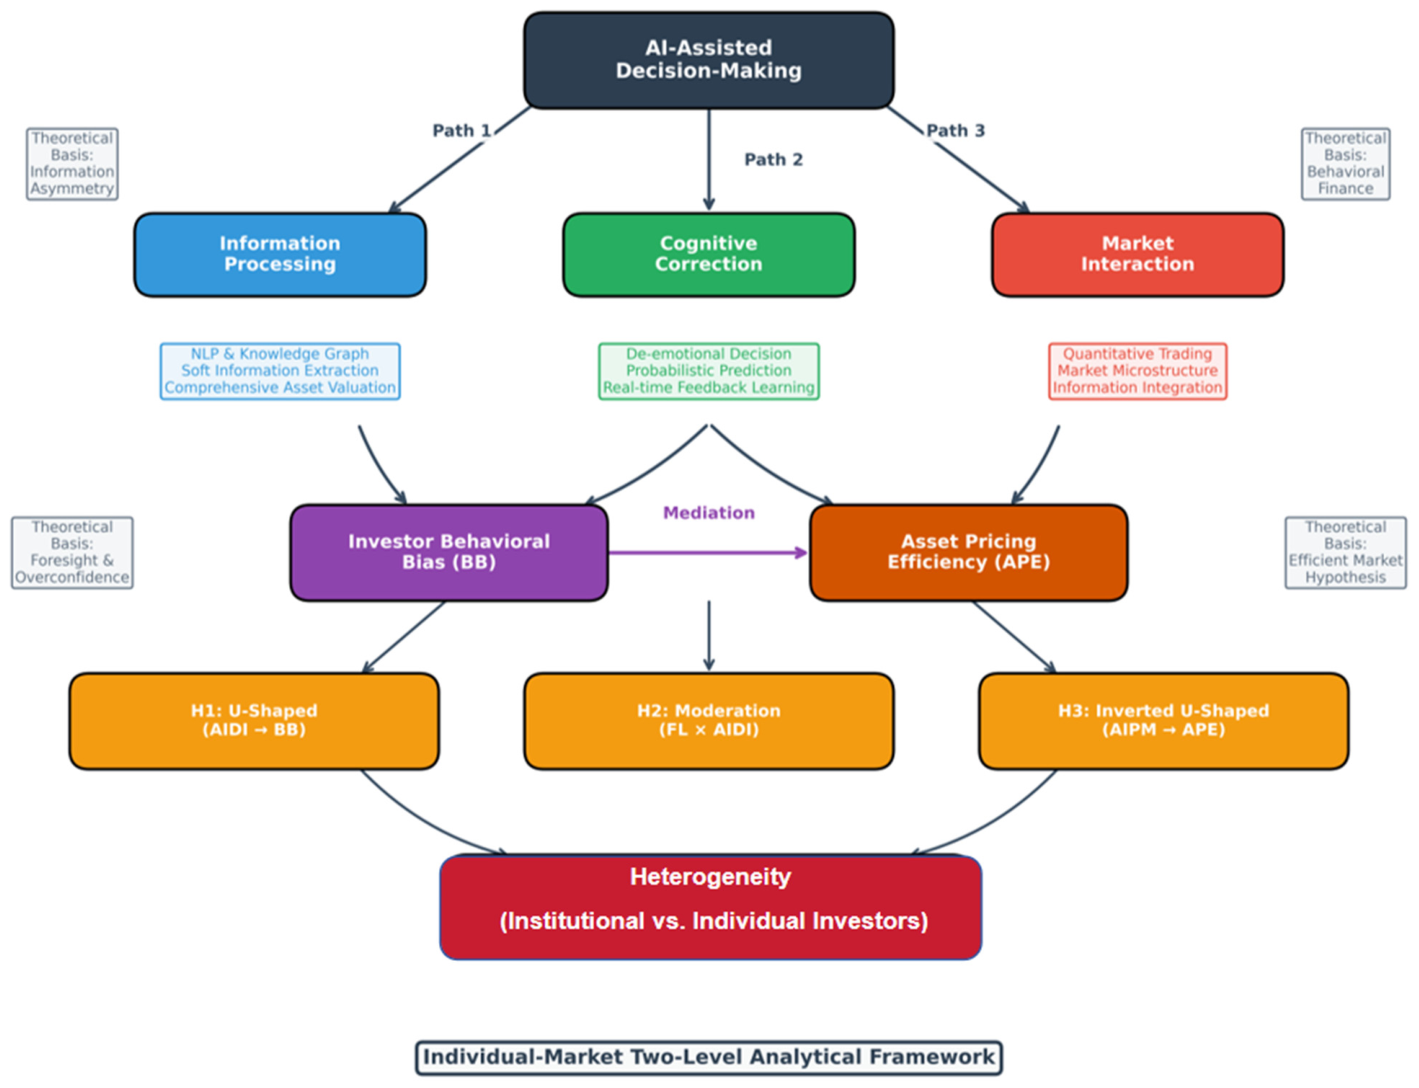
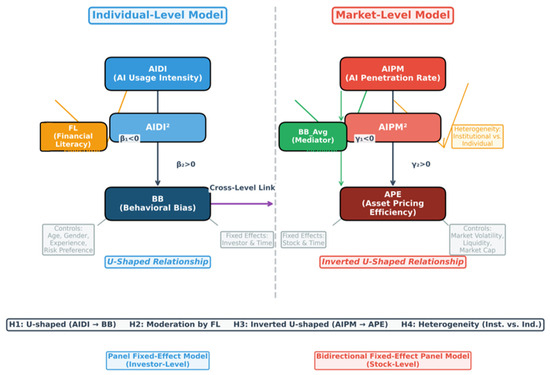
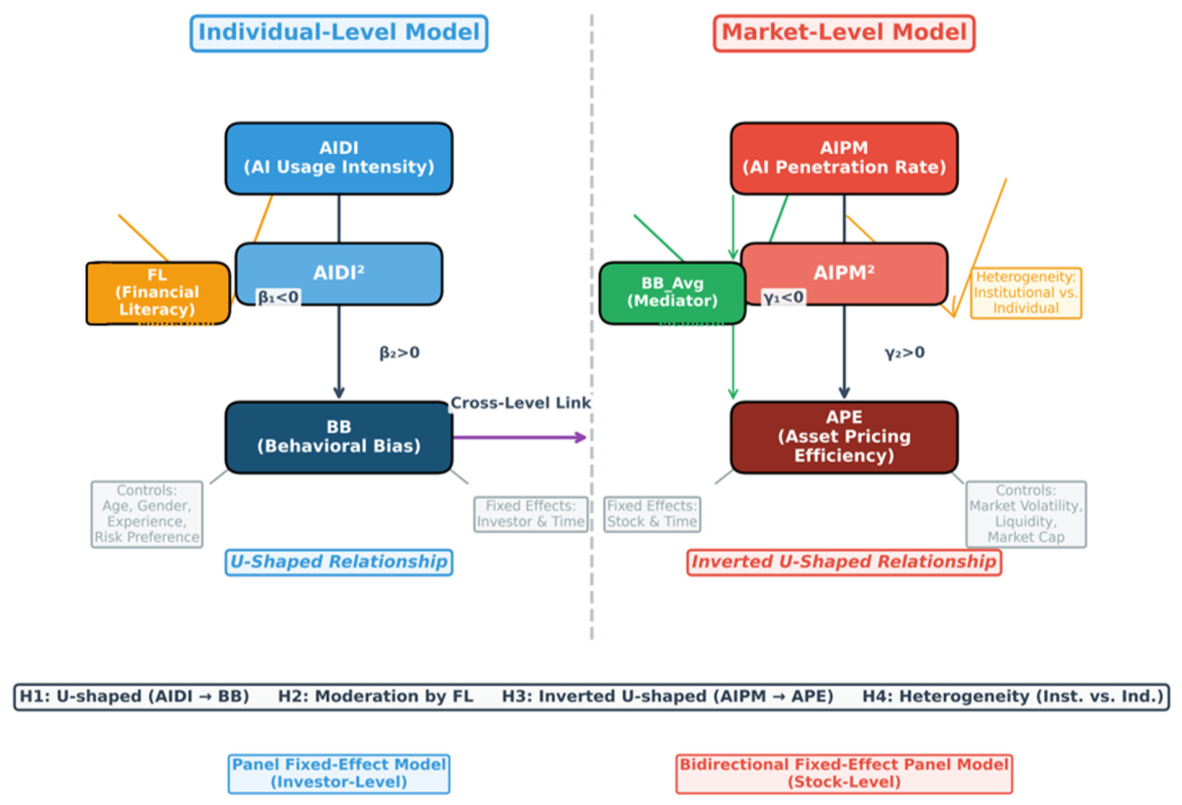
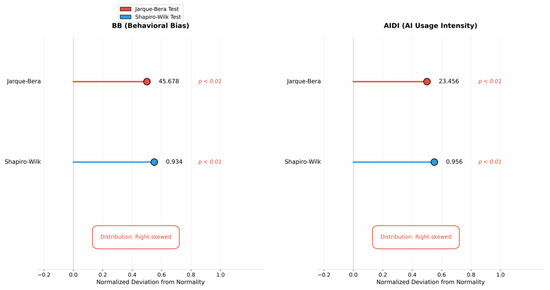
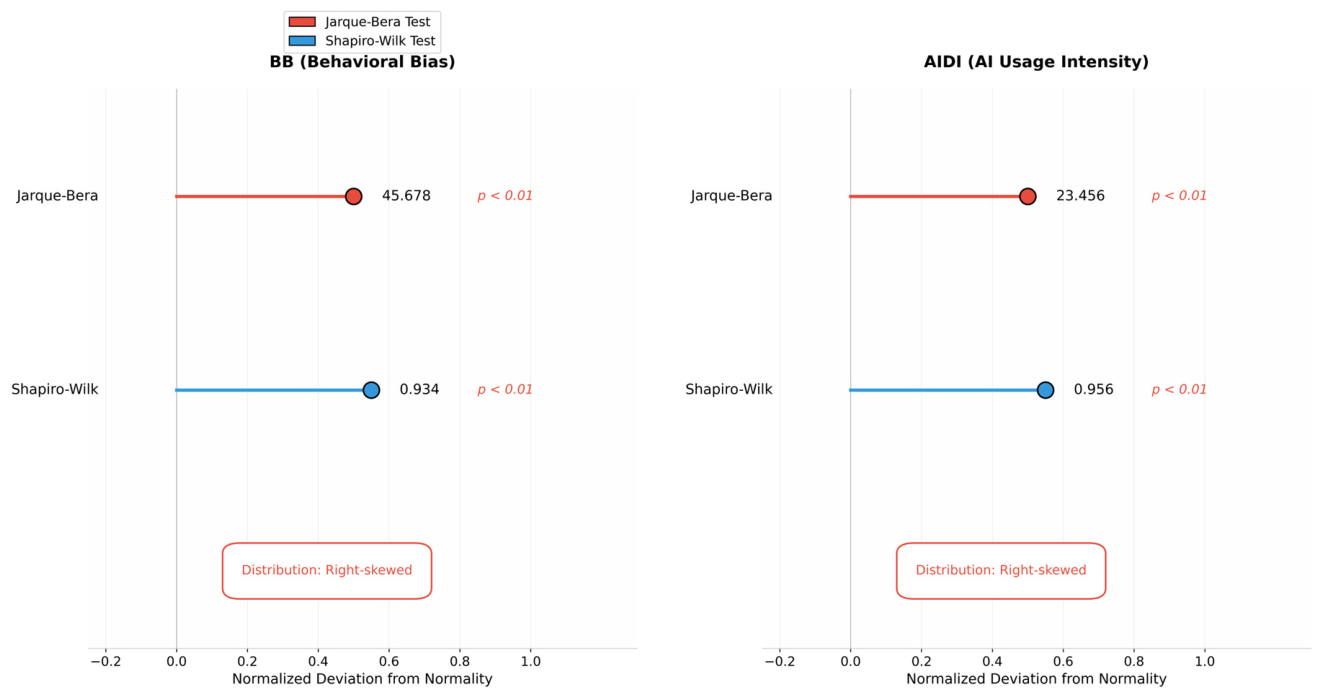
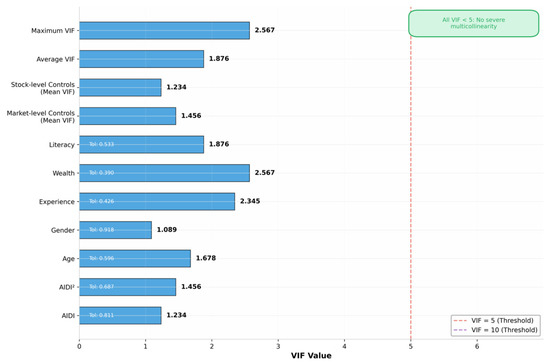
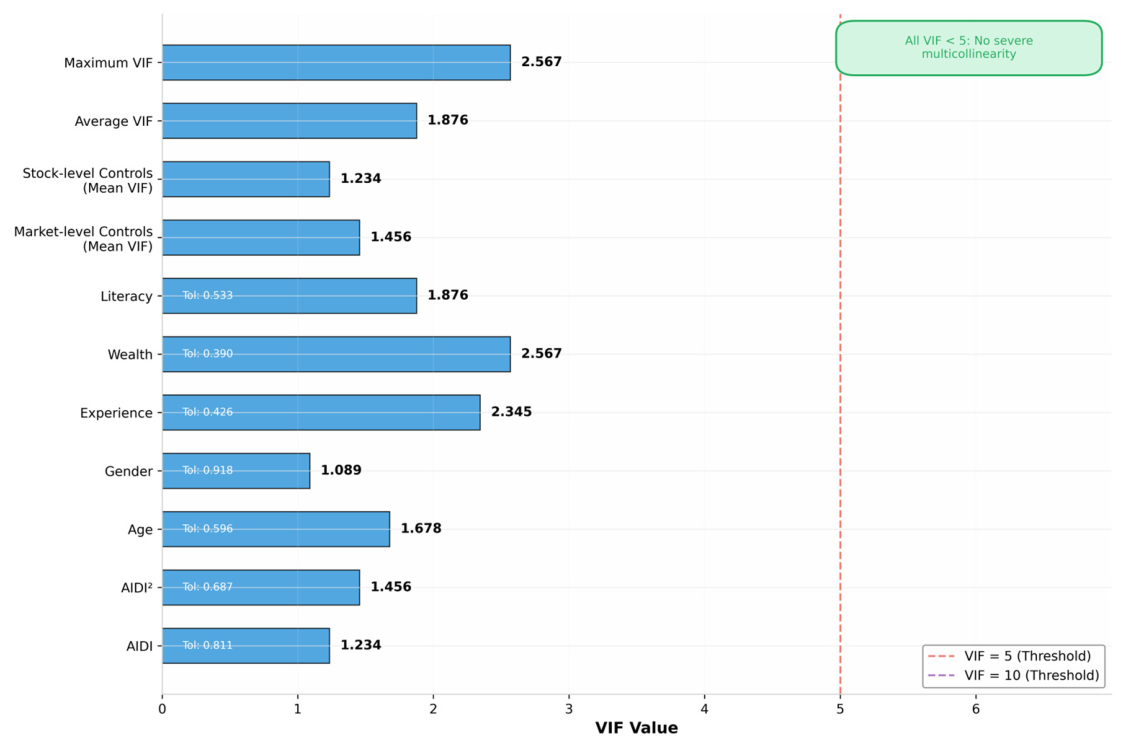
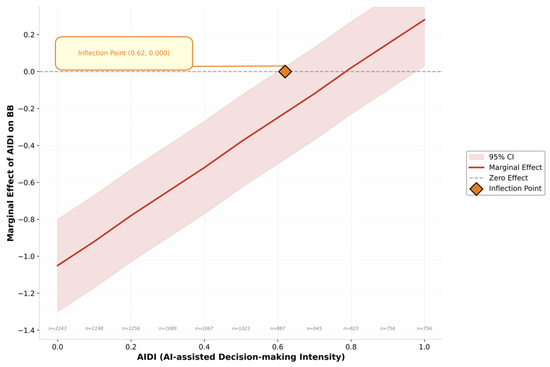
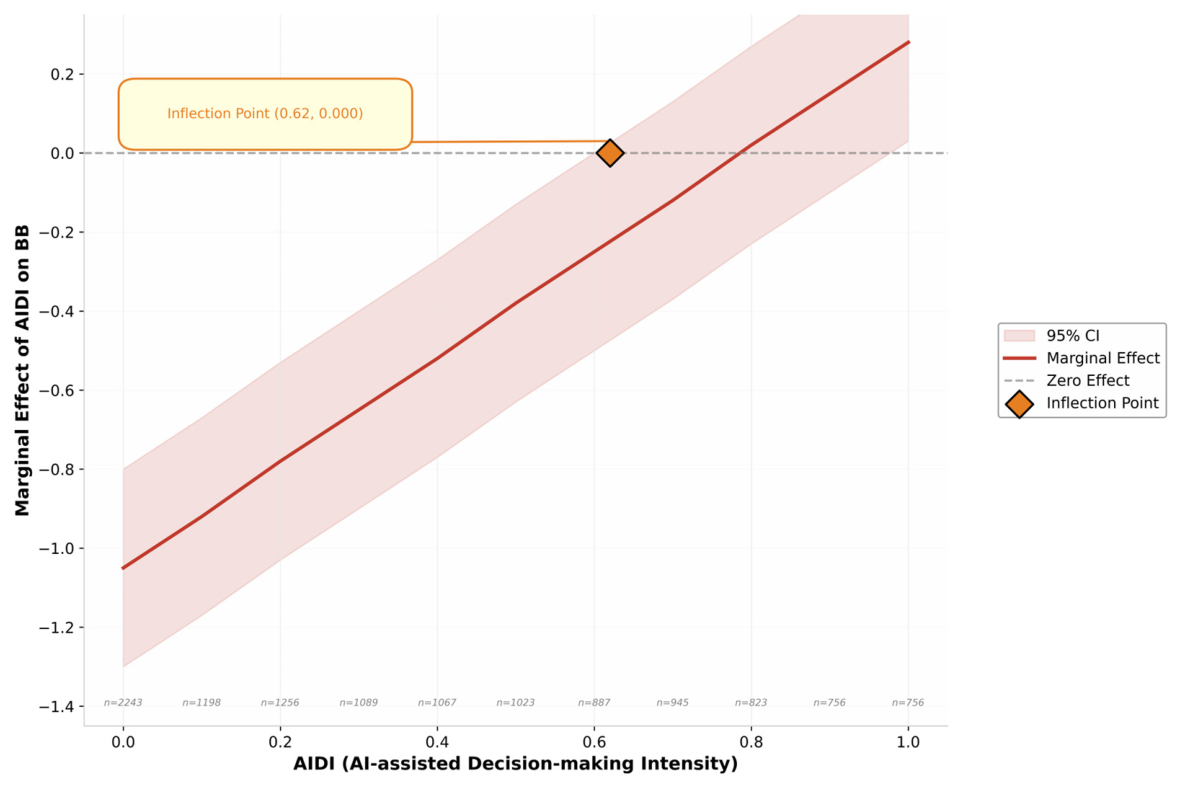
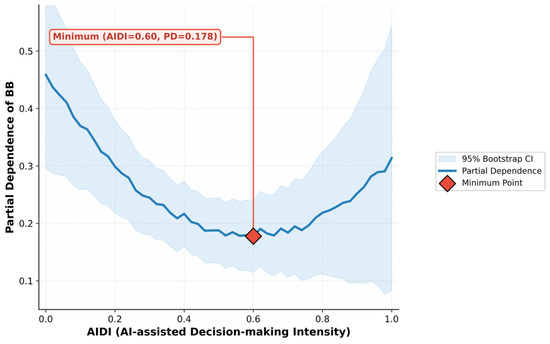
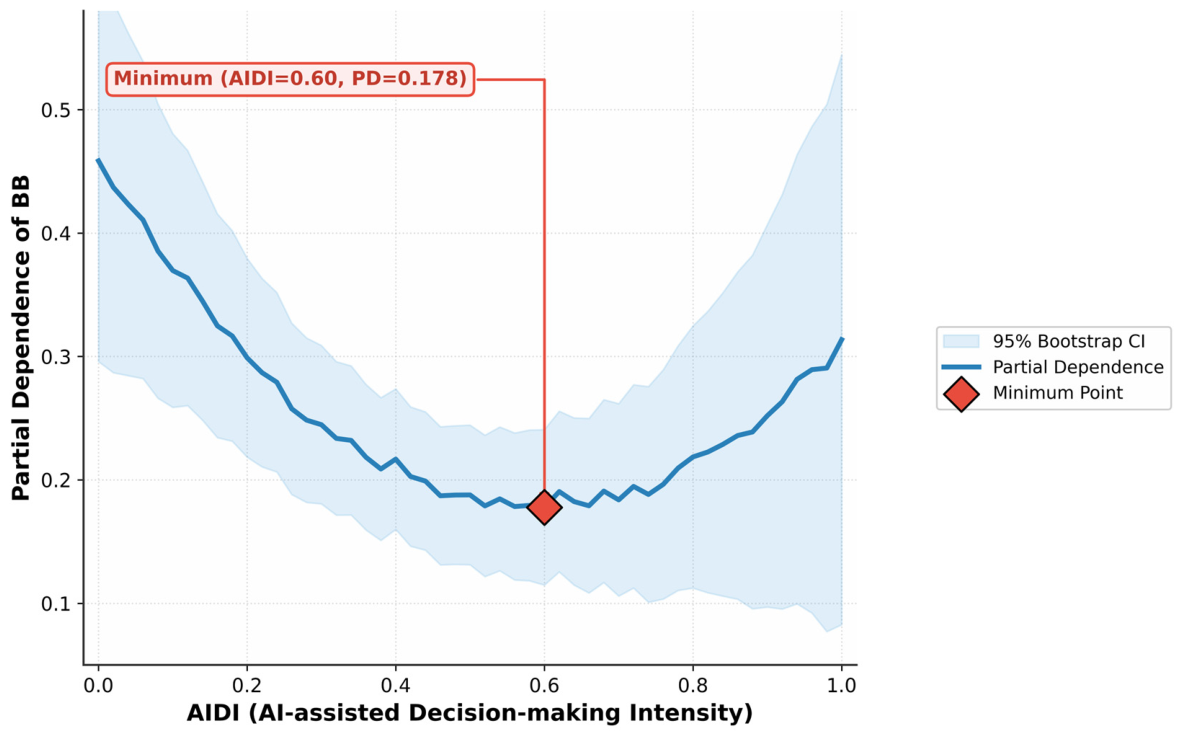
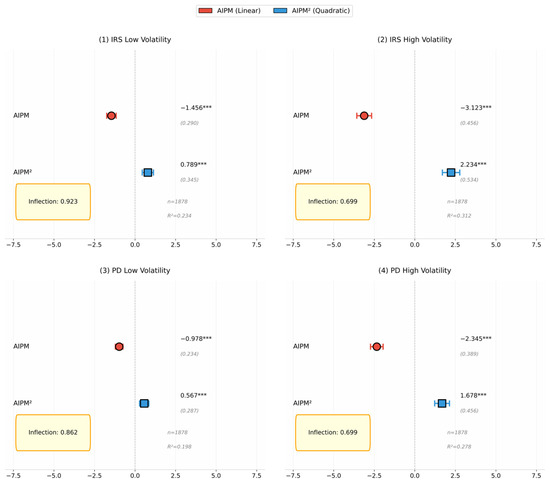
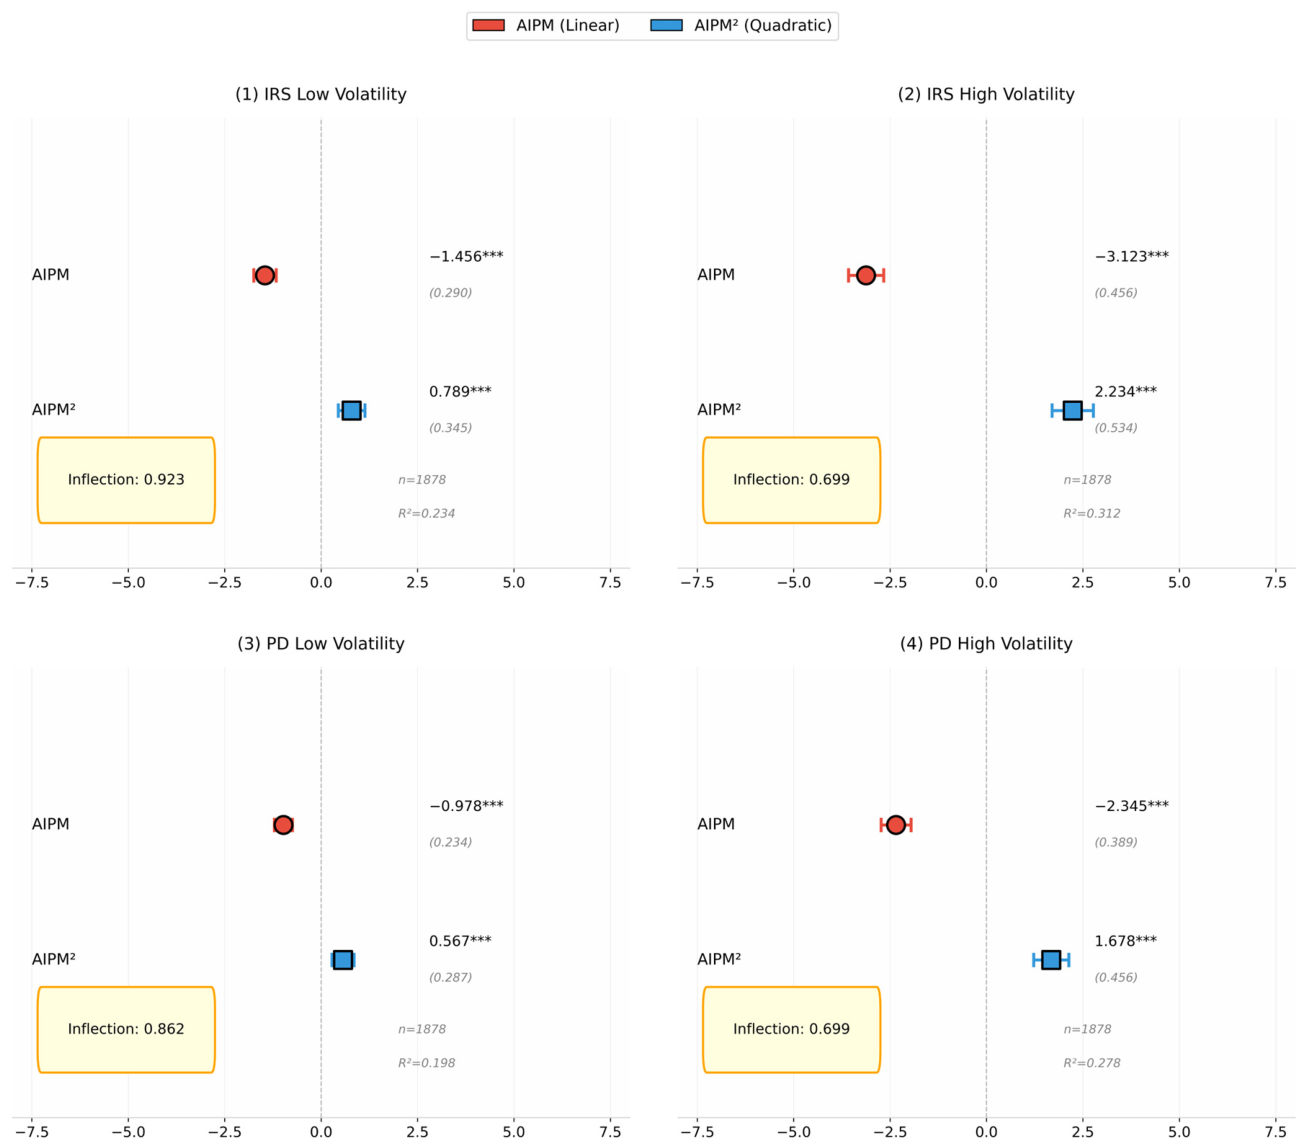
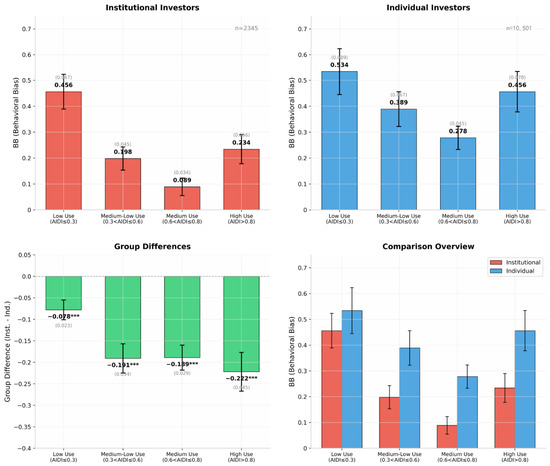
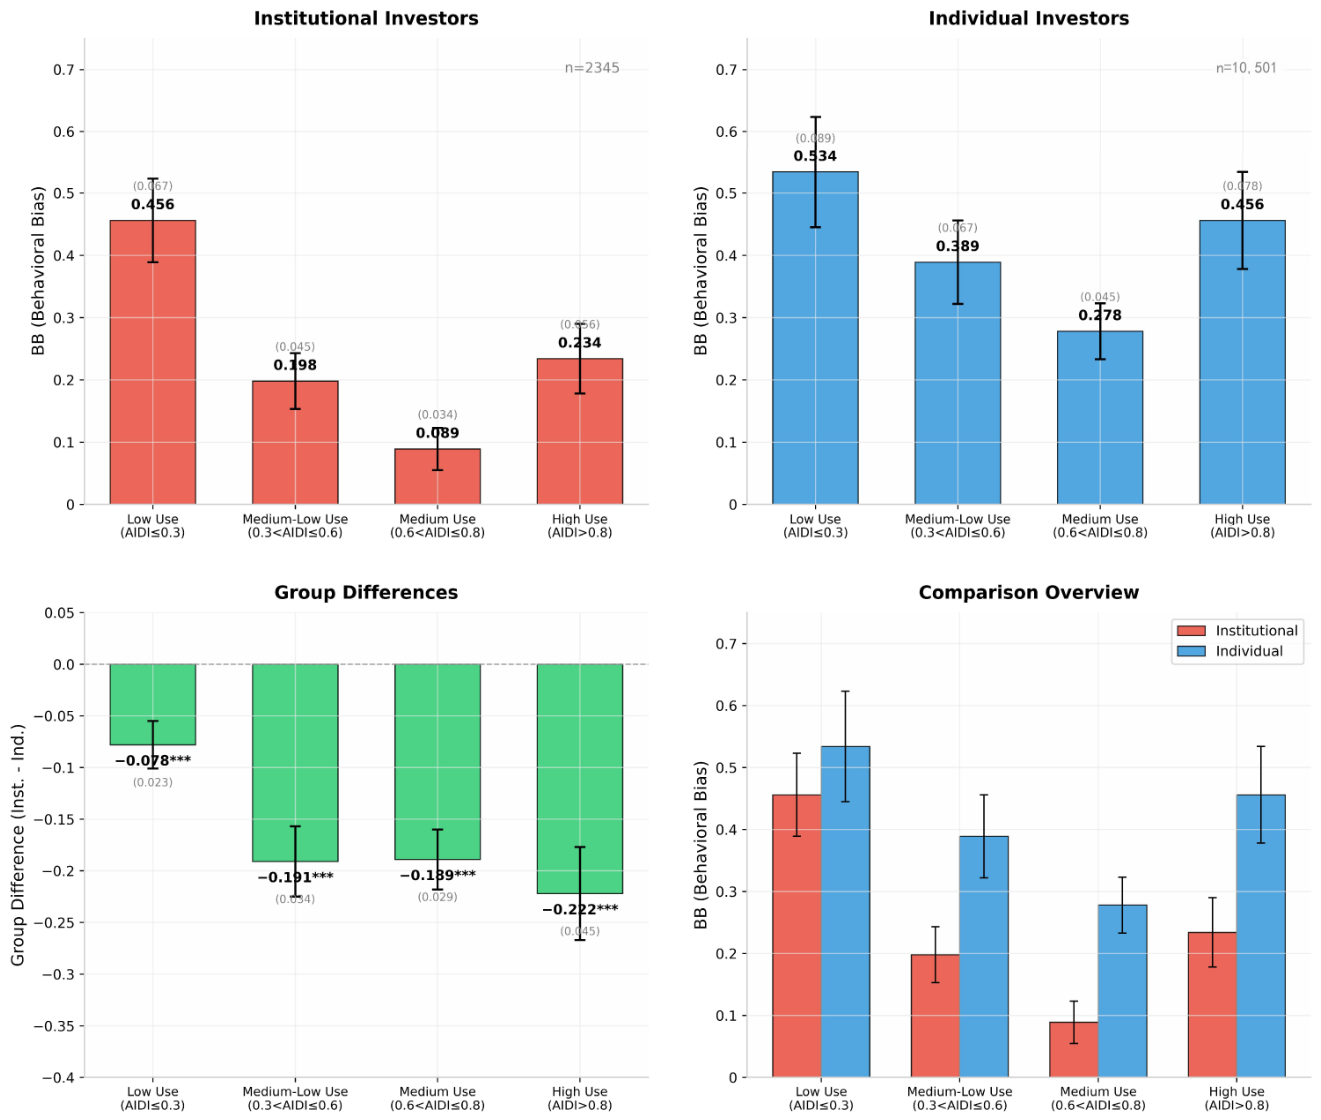
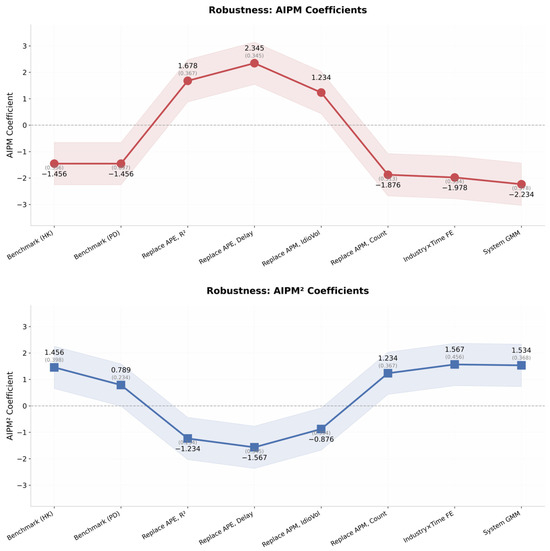
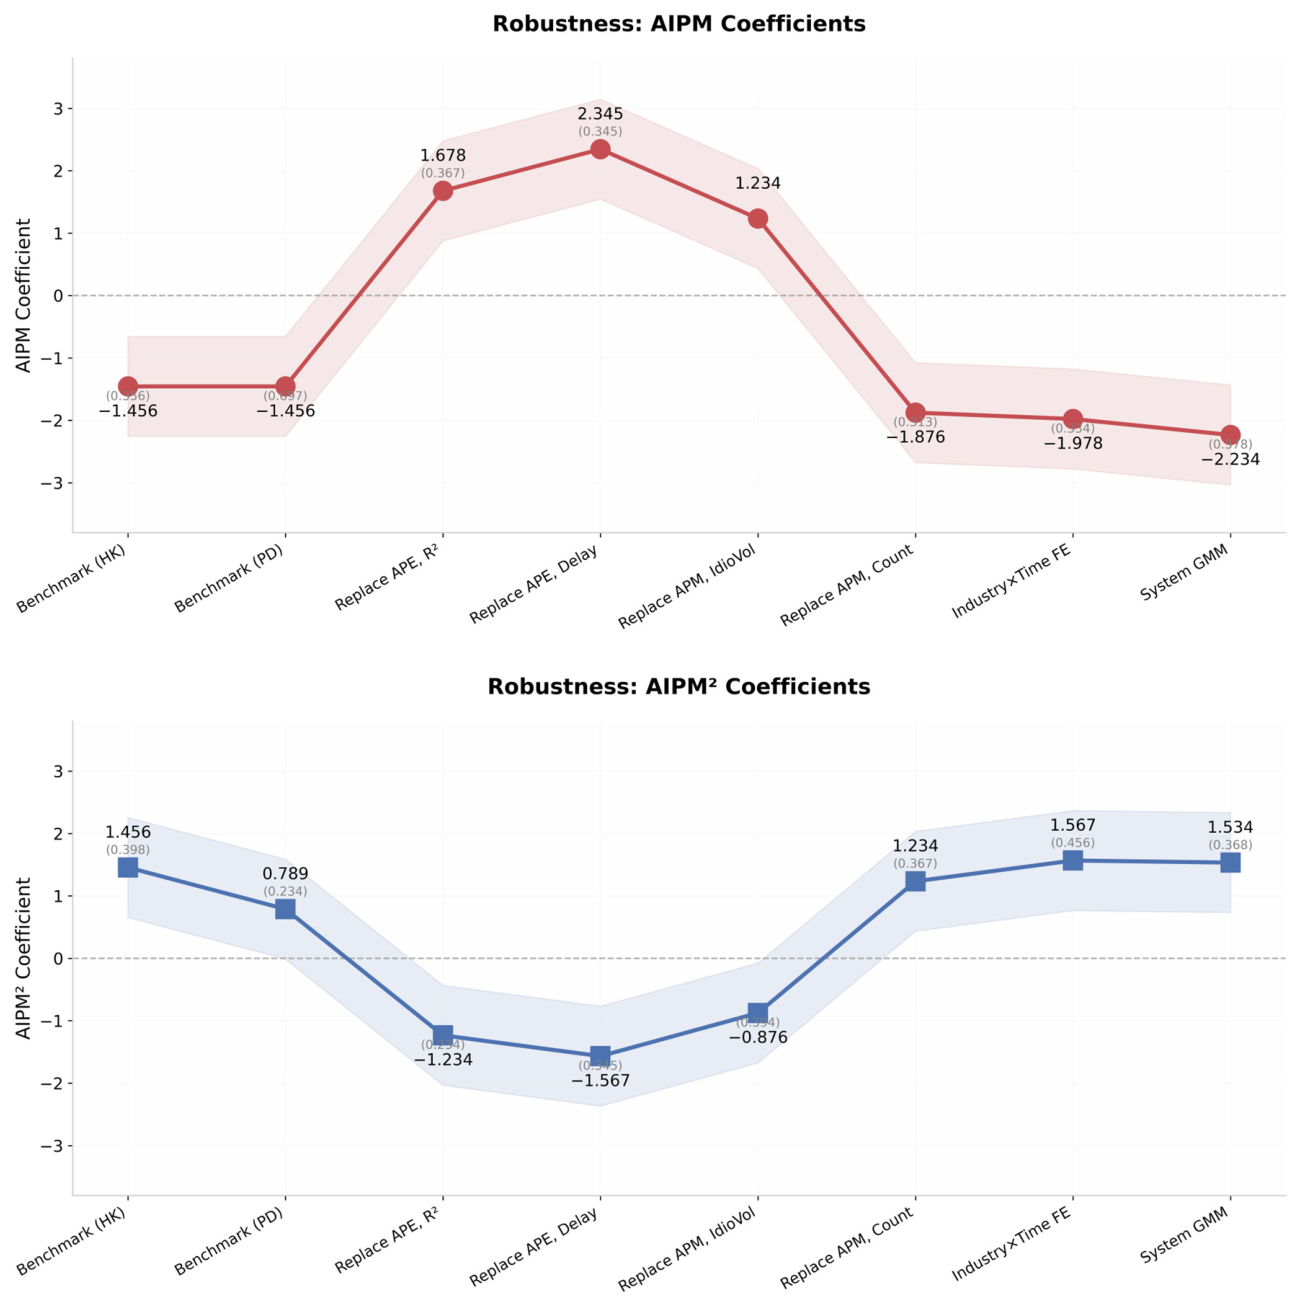

Disclaimer/Publisher’s Note: The statements, opinions and data contained in all publications are solely those of the individual author(s) and contributor(s) and not of MDPI and/or the editor(s). MDPI and/or the editor(s) disclaim responsibility for any injury to people or property resulting from any ideas, methods, instructions or products referred to in the content. |
© 2026 by the authors. Licensee MDPI, Basel, Switzerland. This article is an open access article distributed under the terms and conditions of the Creative Commons Attribution (CC BY) license.