


Abstract
Artificial intelligence (AI) technology has become the core force driving industrial transformation in today’s world. In-depth exploration of the spillover effects between artificial intelligence and new energy, as well as high-carbon-emission industries is of great significance for optimizing the industrial structure, preventing systemic risks in the industrial system, and achieving high-quality development. Based on the DY and BK spillover index model under the TVP-VAR framework, this paper analyzes the spillover effects between artificial intelligence and new energy, as well as high-carbon-emission industries from a time–frequency perspective, and constructs a spillover network to analyze the risk spillover transmission path. Finally, it explores the optimal investment portfolio weights and investment hedging strategies in the financial market. The results show that there is a significant static spillover effect between artificial intelligence and new energy, as well as high-carbon-emission industries. The intensity of this effect follows the pattern of “short-term > medium-term > long-term”. Moreover, new energy and some high-carbon-emission industries (such as the non-ferrous metals industry, the petrochemical industry, and the chemical industry) are the net spillover sources, while artificial intelligence and some high-carbon-emission industries (such as the power industry, the building materials industry, and the aerospace industry) are the net receiving parties. The dynamic spillover effect exhibits significant time-varying characteristics, being significantly impacted by major events such as environmental protection policies, the COVID-19 pandemic, and technological innovations. The chemical industry is the largest spillover outputter in all frequency domains, while the building materials industry is the largest receiver. From the perspective of the spillover network, the artificial intelligence industry, as a key node of the spillover network, plays a crucial role in the transmission of risk spillover. From the perspective of investment practice, the minimum connectedness portfolio (MCoP) performs well in terms of risk hedging effectiveness and return performance and may be the best choice for investors to balance risk and return.
MSC:
91G70
1. Introduction
In the context of the intertwined evolution of the new round of technological revolution and industrial transformation, artificial intelligence (AI), as the core technological driving force of the digital economy era, is reshaping the global energy industry landscape and the transformation path of high-carbon-emission industries [1]. From the perspective of technological empowerment, on the one hand, AI technology can precisely optimize the operational efficiency of the new energy industry and reduce its production costs through real-time monitoring and data analysis of new energy production, consumption, and storage [2]. On the other hand, AI technology can assist high-carbon-emission industries in achieving intelligent control of the production process, refined management of energy consumption, and collaborative optimization of the supply chain, accelerating their low-carbon transformation [3]. However, the exponential expansion of AI infrastructure is triggering a significant energy rebound effect. According to the “White Paper on Green Computing Power Index for the Entire Life Cycle of Data Centers”, by 2030, the total energy consumption of China’s data centers is expected to exceed 400 billion kilowatt-hours. Meanwhile, China’s current power supply structure remains constrained by fossil energy path dependence. In 2024, thermal power generation was 6343.77 billion kilowatt-hours, accounting for 67.36% of the country’s total power generation. This structural contradiction leads to a counterbalancing effect between digital emission reduction dividends and energy consumption increases, weakening AI’s promotional effect on new energy development and increasing carbon reduction difficulties for high-carbon industries. Thus, a complex interaction exists among AI, new energy, and high-carbon-emission industries [4].
To ensure conceptual clarity, this study defines the three core sectors as follows: the artificial intelligence industry refers to the economic activities centered on the research, development, and application of AI technologies (such as machine learning and big data analytics), serving as a general-purpose technology driving digital transformation [1,2]. The new energy industry encompasses sectors dedicated to the development and utilization of clean, renewable energy sources, primarily including photovoltaic, wind power, and energy storage technologies [3]. The high-carbon-emission industries denote traditional industrial sectors characterized by high energy consumption and significant carbon intensity, specifically including the steel, cement, chemical, and thermal power generation industries, which are the primary focus of China’s carbon peaking and neutrality strategies.
With the continuous advancement of industrial financialization, black swan and gray rhino events occur frequently, leading to nonlinear characteristics of risk spillover transmission within the modern industrial system [5]. Asymmetric fluctuations in energy markets triggered by major socioeconomic events could potentially, through factor price revaluation, affect the marginal production costs of high-carbon industries and may further influence structural demand-side conditions. Potentially, capital markets might transmit compound shocks to AI, new energy, and high-carbon industries via price discovery and risk pricing mechanisms, contributing to cross-industry risk spillover with distinct time–frequency characteristics [6]. Therefore, systematically deconstructing the risk spillover mechanism among the three sectors not only reveals the risk equilibrium mechanism in industrial coordinated development but also provides theoretical support for constructing cross-cyclic risk hedging strategies. Particularly under the dual goals of carbon neutrality and digital technological revolution, clarifying the time-varying rules and transmission paths of risk spillover holds important academic value and practical significance for optimizing inter-industry capital allocation, improving macro-prudential policy frameworks, and designing dynamic portfolio strategies.
The existing literature explains spillover effects from two perspectives: the economic fundamental view and the market contagion view. The economic fundamental view emphasizes intrinsic correlation, where cross-industry risk spillover derives from structural coupling among factor, product, and financial markets [7]. The market contagion view focuses on irrational behaviors, rooted in bounded rationality and information cascade effects [8]. Numerous studies have discussed spillover effects in new energy and high-carbon industries. Han et al. [9] employed the TVP-VAR-BK model to investigate frequency-domain risk spillover between China’s carbon market and high-carbon industries. Ouyang et al. [10] verified that risk spillover contagion in the energy sector generally follows a transmission path from petrochemical to coal industries. Liang and Pan [11] explored the structural characteristics of China’s high-carbon industries and used fixed effect models to analyze direct and spillover effects on provincial carbon emissions. Doğan et al. [12] concluded that major external shocks dramatically change volatility spillover patterns from high-carbon to new energy industries, confirming nonlinearity.
Turning to studies involving AI, current research focuses mainly on technological empowerment and carbon reduction practices, largely ignoring cross-industry spillover effects. For the new energy industry, Zhang et al. [13] showed that AI’s asymmetric impact improves prediction accuracy of new energy development. Duan [14] proposed an AI-based demand forecasting method for new energy power. Dai et al. [15] analyzed the new energy photovoltaic market under AI. For high-carbon industries, Pournader et al. [16] noted that AI can predict future carbon emissions to support emission reduction strategies. Su et al. [17] applied large model algorithms to predict carbon emissions in the building materials industry. Liu et al. [18] found an inverted U-shaped relationship between AI and carbon emissions using Chinese city-level panel data. Ouyang et al. [19] reviewed AI and big data applications in transportation carbon emissions. Yu et al. [20] quantified carbon footprints of 79 AI systems and highlighted rising emissions due to surging computing demand. However, none of these studies examine spillover effects among AI, new energy, and high-carbon industries as an interconnected system.
In terms of spillover measurement methods, existing studies primarily adopt GARCH models, Copula functions, CoVaR, and related tools. Jude et al. [21] applied multivariate GARCH to analyze spillovers between Central-Eastern European stock markets and energy markets. Wang et al. [22] used BEKK-GARCH to test volatility spillover between international milk powder and China’s raw milk markets. Wu and Wang [23] combined BEKK-GARCH, DCC-GARCH, and ensemble empirical mode decomposition for Sino-US bean futures markets. Liu et al. [24] integrated VEC and GARCH into a VEC-BEKK-GARCH framework to examine spillovers among RMB exchange rate, energy, and carbon markets. Yuan et al. [25] utilized Copula and mixed-frequency VAR models. Zha et al. [26] combined quantile-on-quantile, time-varying Copula, and CoVaR to study Bitcoin, crude oil, and financial markets. Zhou et al. [27] adopted an extended CoVaR model for systemic risk spillover among Chinese securities companies. Zou et al. [28] constructed a GARCH-Copula-CoVaR model for dry bulk shipping freight rates.
To reduce sample loss and capture time-varying dynamics, Antonakakis and Gabauer [29] proposed the DY spillover index based on TVP-VAR, evaluating cross-variable spillover from the time-domain perspective. Subsequently, scholars extended this to the frequency domain, developing the BK spillover index under TVP-VAR [30]. Liu et al. [31] used TVP-VAR-DY to analyze risk spillover between traditional energy and green financial markets. Li et al. [32] constructed a sanctions index and applied TVP-VAR-DY to study EU sanctions effects on oil and energy stock prices. Han et al. [9] adopted TVP-VAR-BK to examine carbon market and high-carbon industry spillover, combined with nonparametric quantile Granger causality. Fan et al. [33] used DY and BK indices to analyze liquidity spillover among WTI, Brent, and INE crude oil markets. Lei et al. [34] applied TVP-VAR-DY and BK to return spillover along China’s industrial chain. Furthermore, complex network analysis has been widely applied to visualize spillover structures. Liu and Xu [35] combined spillover indices with network analysis for global new energy listed companies. Wei et al. [36] constructed complex networks based on TVP-VAR forecast error variance decomposition. Fu et al. [37] adopted DY indices and network analysis for multi-carbon and green energy markets. Finally, some studies have computed optimal hedge ratios and portfolio weights. Mo et al. [38] compared static and dynamic Copulas with CoVaR to analyze crude oil spillovers and portfolio optimization. Wang et al. [39] used DCC and TVP-VAR models for crude oil, gold, and Chinese power companies, combining portfolio strategy analysis.
Despite the rich body of literature, three noticeable gaps remain. First, existing studies predominantly focus on one-way technological linkages between AI and new energy or AI and high-carbon industries separately, but rarely treat AI, new energy, and high-carbon industries as an integrated tripartite system. The systematic risk spillover nexus among all three sectors has not been theoretically or empirically examined. Consequently, a multi-dimensional analytical framework covering technology spillover, industrial correlation, and risk contagion is lacking. Second, most studies confine themselves to time-domain analysis and fail to capture time–frequency heterogeneity. This limitation makes it difficult to distinguish short-term fluctuations from long-term trends in risk spillover and to identify the interactive impacts of economic cycles and industrial policies at different frequencies. Third, while existing research measures spillover intensity, it rarely monitors dynamic transmission paths or designs targeted portfolio optimization strategies for risk hedging and return balance. Specifically, the application of minimum connectedness portfolios has not been extended to the AI-new energy-high-carbon system.
This paper addresses the above gaps with three marginal contributions. First, in terms of indicator selection and industrial representation. In order to systematically study the spillover effects among artificial intelligence (AI), the new energy industry, and high-carbon-emission industries, this paper selects broadly representative indices, including the AI industry index (e.g., the CSI Artificial Intelligence Theme Index), the new energy industry index (e.g., the CSI New Energy Index), and typical high-carbon-emission industry indices such as steel, cement, and electric power. This multi-dimensional indicator system enables a more comprehensive and accurate characterization of the differential spillover effects of AI technology on the new energy industry and high-carbon-emission industries, filling the gap in the existing literature that mostly focuses on single industries or pairwise interactions. Second, in terms of research methodology and frequency-domain analysis. This paper not only employs the DY spillover index model under the TVP-VAR framework but also further introduces the BK spillover index model to examine the spillover effects among AI, the new energy industry, and high-carbon-emission industries from both time-domain and frequency-domain perspectives. This combined approach overcomes the limitation of traditional static spillover index models that cannot distinguish between short-term and long-term spillovers, allowing a more refined capture of the dynamic evolution of spillover effects across different time horizons. Third, in terms of research content and financial market applications. On the basis of revealing the risk spillover transmission paths (by constructing a spillover network), this paper further explores optimal portfolio weights and hedging strategies in financial markets. This extension moves the analysis from purely industry-level spillover effects to asset allocation and risk management practices, providing quantitative evidence and decision-making references for investors to optimize portfolios and hedge risks under the rapid development of AI and the new energy industry, as well as the transition of high-carbon-emission industries. Overall, the research framework of this paper offers new methodological perspectives and empirical evidence for analyzing the multi-dimensional spillover effects among AI, the new energy industry, and high-carbon-emission industries. The conclusions also have theoretical significance and practical guiding value for promoting industrial synergy, preventing systemic risks, and guiding green financial investments.
The remainder of the paper is structured as follows: Section 2 describes the data and methodology; Section 3 presents empirical results including static and dynamic spillover analyses, frequency-domain decomposition, network topology, and portfolio strategies; Section 4 is the discussion part; and Section 5 concludes with policy implications and limitations.
2. Research Methods and Data
2.1. DY and BK Spillover Index Models Based on the TVP-VAR Framework
The TVP-VAR-DY method combines the time-varying parameter vector autoregression (TVP-VAR) model with the DY spillover index from the time-domain perspective, focusing on the dynamic changes in variables in the time series. First, the TVP-VAR(p) model is constructed:
, and are all dimensional vectors. and are dimensional matrices. To calculate the generalized forecast error variance decomposition (GFEVD), we first convert the TVP-VAR(p) model into the TVP-VMA(∞) form:
can be approximated by over different time horizons, where refers to the time horizon, namely . The generalized forecast error variance decomposition (GFEVD) is applied to quantify the changes in the forecast error variance of a specific variable (e.g., sequence ) caused by shocks from other variables (e.g., sequence ). Specifically, the GFEVD is expressed as:
where and . Based on the generalized forecast error variance decomposition, the directional spillover index, net spillover index and total spillover index are defined as:
From the frequency-domain perspective, the TVP-VAR-BK method combines the time-varying parameter vector autoregression (TVP-VAR) model with the Baruník–Krčál (BK) spillover index. This approach can dynamically capture the spillover effects among variables and decompose such effects into distinct frequency bands. Chatziantoniou et al. [40] constructed the frequency response function based on spectral analysis. Here, represents the spectral density of at frequency , which is defined as the Fourier transform of TVP-VMA [40]:
The combination of spectral density and GFEVD is defined as frequency-domain GFEVD. In this paper, the frequency-domain GFEVD is normalized as follows:
Equation (11) indicates that, for a given frequency , the spectral component of the -th variable can be attributed to the shocks originating from the -th variable. However, the frequency in Equations (10) and (11) is set as a single value, and the measured connectivity is only calculated at one specific frequency. To evaluate connectivity under multi-frequency scenarios, Chatziantoniou et al. [40] defined frequencies within specific intervals, expressed as with and . The connectivity calculation under different frequency bands is presented as follows:
Accordingly, the directional spillover index, net spillover index, and total spillover index are formulated as:
Baruník and Křehlík [41] argued that the connectivity contribution of each frequency band should be weighted by the overall connectivity contribution of the entire system. Taking as the weighting coefficient, Equations (13)–(16) can be revised into the following forms:
The entire TVP-VAR-DY and TVP-VAR-BK analysis was implemented in MATLAB R2023a using custom-coded functions based on the frameworks of Diebold & Yılmaz (2012) [42] and Baruník & Křehlík (2018) [41]. The specific steps for frequency-domain spillover calculation are as follows. Step 1: Estimate the TVP-VAR model using the tvvars package to obtain the time-varying coefficient matrix and variance–covariance matrix. Step 2: Convert the TVP-VAR model into the TVP-VMA(∞) form using the Wold decomposition, approximated by truncating the infinite lag at 100 terms to ensure accuracy. Step 3: Calculate the spectral density matrix for each time period using Equation (9), with the frequency ω ranging from 0 to π at intervals of 0.01. Step 4: Compute the frequency-domain GFEVD using Equations (10) and (11), then normalize the results to ensure the sum of each row equals 1. Step 5: Decompose the spillover effects into the three predefined frequency bands using Equation (12) and calculate the weighted frequency-domain spillover indices (directional, net, and total) using Equations (17)–(20).
2.2. Complex Network Analysis Method
To identify the spillover network structure of the “artificial intelligence–new energy–high-carbon-emission industry” system, this paper constructs a spillover complex network denoted as . Each industry is treated as a network node , and the spillover relationships between industries are defined as network edges .
This study adopts the TVP-VAR-DY and TVP-VAR-BK models to calculate the static spillover index and further establish the network adjacency matrix:
where represents the static spillover index from industry to industry .
Based on the net pairwise spillover index , the out-degree, in-degree and total degree of network nodes are defined as follows:
Taking the variance contribution of each industry as the node weight , this paper constructs a weighted spillover network , so as to accurately describe the overall spillover network structure of the research system.
2.3. Portfolio Model
Portfolio optimization is a core part of investment management, which aims to adjust asset allocation through scientific methods to balance risk and return. Referring to Sun et al. [43], this paper selects three typical portfolio strategies for comparative analysis, namely the minimum variance portfolio (MVP), minimum correlation portfolio (MCP) and minimum connectivity portfolio (MCoP).
The weight of the minimum variance portfolio (MVP) strategy is calculated by Equation (25):
where denotes an portfolio weight vector, is a identity vector, and refers to the time-varying variance-covariance matrix in period . After estimating the time-varying variance–covariance matrix, the dynamic conditional correlation matrix and the conditional variance-covariance matrix based on standardized residuals are further constructed:
The weight of the minimum correlation portfolio (MCP) is defined as:
Following Broadstock et al. [44], the pairwise spillover index is adopted to construct the weight of the minimum connectivity portfolio (MCoP):
where represents the pairwise connectivity matrix, and denotes the identity matrix. To evaluate the performance of alternative portfolio strategies and hedging effectiveness, the relevant portfolio weights are set as follows:
The effectiveness of each portfolio strategy is measured as below:
represents the variance of the hedged portfolio with optimal strategy weights, and is the variance of unhedged assets. The hedging effectiveness (HE) index reflects the risk reduction degree of portfolio hedging. A higher HE value indicates a more effective hedging performance.
2.4. Data, Sectoral Indices, and Log-Return Series
Artificial intelligence (AI) is measured by the CSI Artificial Intelligence Thematic Index (930713). This index selects 50 listed securities from the Shanghai and Shenzhen stock markets. The selected enterprises are engaged in big data, cloud computing, cloud storage, machine learning, machine vision, face recognition, speech and semantic recognition, intelligent chips and other related fields, which can effectively reflect the development prospect of the artificial intelligence industry.
The new energy industry (NEW) is represented by the National Securities New Energy Index (399412). The index covers the new energy and new energy vehicle industries. It selects the top 50 securities with the highest average daily trading turnover, including STAR Market stocks listed for more than one year and other securities listed for over six months. This index comprehensively reflects the overall trend of the new energy industry.
High-carbon-emission industries are represented by eight key high-carbon sectors covered by China’s carbon market. Specifically, this paper adopts eight industry indices: the power industry index (H30199), iron and steel industry index (399440), building materials industry index (L11604), non-ferrous metal industry index (399395), petrochemical industry index (H11057), chemical industry index (CN5090), papermaking industry index (CN6041), and aerospace industry index (CN5082). These indices correspond to eight high-carbon sectors: power (DL), iron and steel (GT), building materials (JC), non-ferrous metals (YS), petrochemicals (SH), chemical industry (HG), papermaking (ZZ), and aerospace (HK).
The sample period ranges from 4 August 2015 to 6 December 2024. All data are daily frequency, with a total of 2258 observations. The original daily price data used in this study are sourced from the CSMAR database (https://www.csmar.com), a commercial, subscription-based financial data platform widely used in academic research, and logarithmic return series are adopted for empirical analysis.
Table 1 reports the results of descriptive statistics and stationarity tests. As shown in Table 1, the skewness coefficients of all variables are non-zero, and the kurtosis values are greater than 4. The Jarque–Bera (JB) statistics are significant at the 1% level, indicating that all sample series present obvious leptokurtic and fat-tailed characteristics. The ADF test results show that all variable series are stationary at the 1% significance level, which meets the stationarity requirement and is suitable for subsequent empirical analysis.
Table 1.
Descriptive statistics and stationarity tests for daily logarithmic returns.
3. Empirical Analysis
3.1. Static Spillover Effect Analysis
3.1.1. Time-Domain Static Spillover
This paper first adopts the DY spillover index model under the TVP-VAR framework to explore the time-domain static spillover effects among artificial intelligence, new energy and high-carbon-emission industries. To address the model selection concerns, the optimal lag order is determined as order 1 based on the AIC criterion, which is consistent with the standard practice in high-frequency financial time series analysis to avoid overfitting while capturing the immediate dependency structure. Furthermore, a forecast horizon of 100 periods is selected because it approximates the infinite horizon in variance decomposition for stationary processes, ensuring that the impulse responses fully decay and capture the total contribution of shocks. The optimal lag order is determined as order 1 according to the AIC criterion, and the forecast error variance decomposition is set at 100 periods. The full-sample time-domain static spillover results are presented in Table 2.
Table 2.
Full-sample time-domain spillover index.
Overall, the total spillover index is 76.79%, indicating a strong information spillover between artificial intelligence and new energy and high-carbon-emission industries. From the perspective of directional spillover, the internal spillover effect among each variable is higher than the influence of the spillover effect from other variables. Among them, the internal spillover effect of the building materials industry (JC) in the high-carbon-emission industry is the highest at 35.37%. The external spillover effects of the chemical industry (HG), petrochemical industry (SH), and new energy industry (NEW) are the strongest, at 106.33, 99.18, and 85.24 respectively. The inflow effects of the chemical industry (HG), petrochemical industry (SH), and non-ferrous metals industry (YS) are the strongest, at 83.42, 82.39, and 80.32 respectively. From the perspective of net spillover, the net spillover values of steel (GT), non-ferrous metals (YS), petrochemical industry (SH), chemical industry (HG), paper industry (ZZ), and new energy industry (NEW) are positive, at 0.70, 4.25, 16.81, 22.90, 0.38, and 5.34 respectively; while the net spillover values of power (DL), building materials (JC), aerospace (HG), and artificial intelligence industry (AI) are negative, at −7.95, −23.57, −12.79, and −6.07 respectively. This indicates that once steel (GT), non-ferrous metals (YS), petrochemical industry (SH), chemical industry (HG), paper industry (ZZ), and new energy industry (NEW) undergo changes, they will affect other industries and may even trigger systemic risks. While power (DL), building materials (JC), aerospace (HG), and artificial intelligence industry (AI) are in the position of net receivers in the system, they are more likely to be disturbed by other industries.
3.1.2. Frequency-Domain Static Spillover
The frequency domain is divided into high frequency, medium frequency and low frequency to measure spillover effects across short-term (1–15 days), medium-term (15–60 days) and long-term (over 60 days) horizons. The selection of these specific frequency bands follows the standard wavelet decomposition practices in financial econometrics, allowing us to isolate the distinct investment behaviors of heterogeneous agents: high-frequency components typically capture the reactions of short-term speculators and noise traders, while low-frequency components reflect the fundamental valuation and long-term strategic positioning of institutional investors. The full-sample frequency-domain static spillover results are shown in Table 3.
Table 3.
Full-sample frequency-domain spillover index.
Overall, the short-term spillover index is 70.87%, which is remarkably higher than the medium-term index of 4.68% and the long-term index of 0.80%. This reveals that the overall time-domain spillover effect is mainly driven by short-term risk transmission. The dominance of short-term spillovers suggests that the market is currently dominated by high-frequency trading activities and reactive sentiment, leading to rapid but often transient volatility clustering. In the short-term time domain and frequency domain, industries such as steel (GT), non-ferrous metals (YS), petrochemicals (SH), chemicals (HG), papermaking (ZZ), and new energy industries (NEW) all act as transmitters of spillover effects, while power (DL), building materials (JC), aerospace (HG), and artificial intelligence industries (AI) are the recipients of spillover effects. In the medium-term and long-term frequency domain spillovers, the roles of spillover effects have changed. Steel (GT) and the papermaking industry (ZZ) have shifted from being spillover effect transmitters to receivers. This change reminds investors that they need to adjust their investment portfolios according to the time scale. In medium-term and long-term investments, the steel (GT) and papermaking industries (ZZ) may need to consider more hedging strategies for external risks.
3.2. Dynamic Spillover Effect Analysis
3.2.1. Dynamic Total Spillover
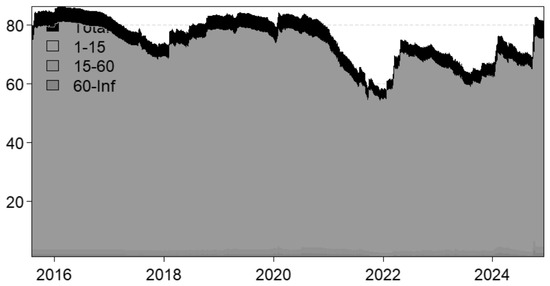
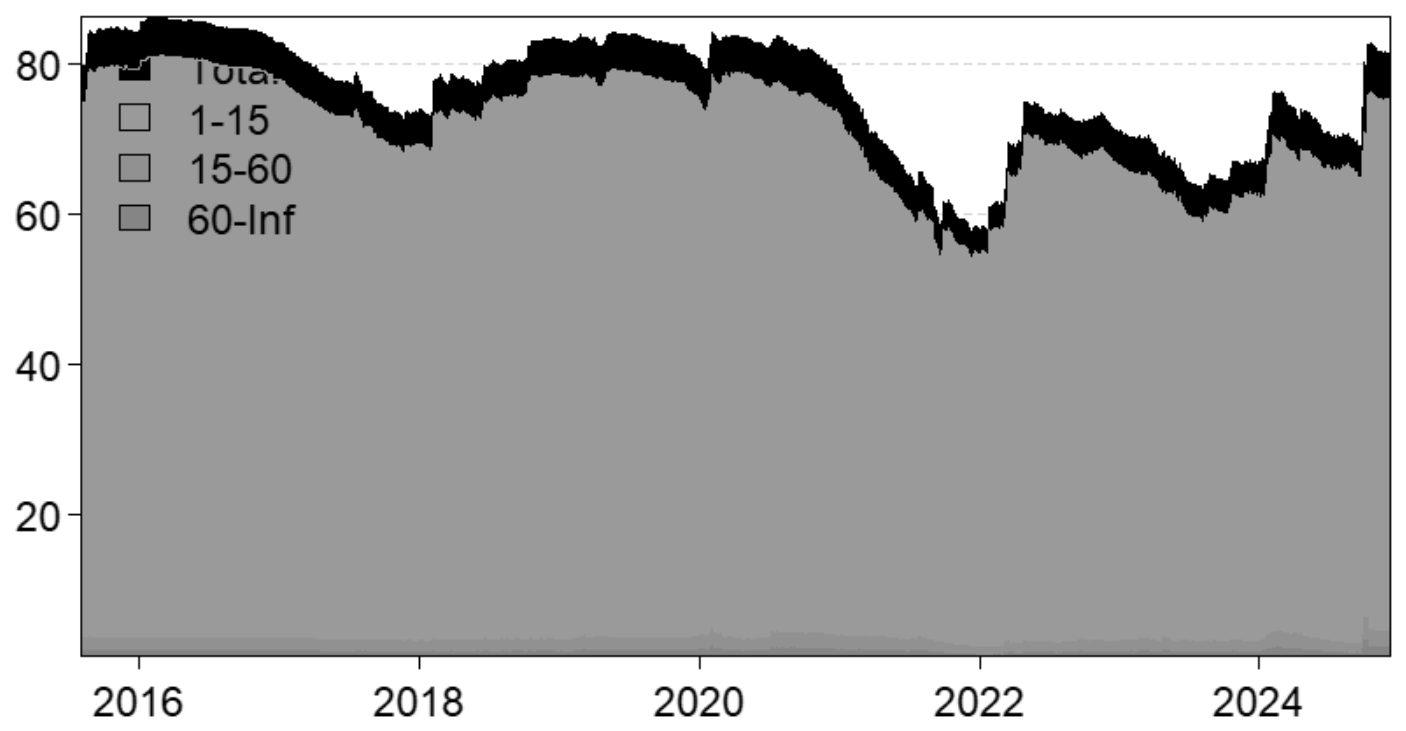
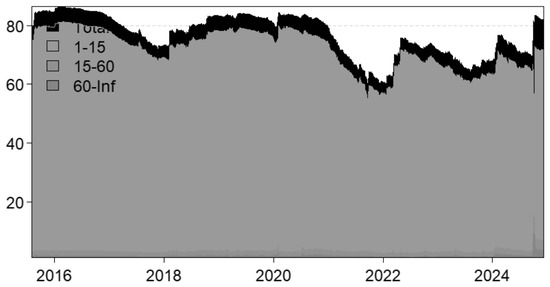
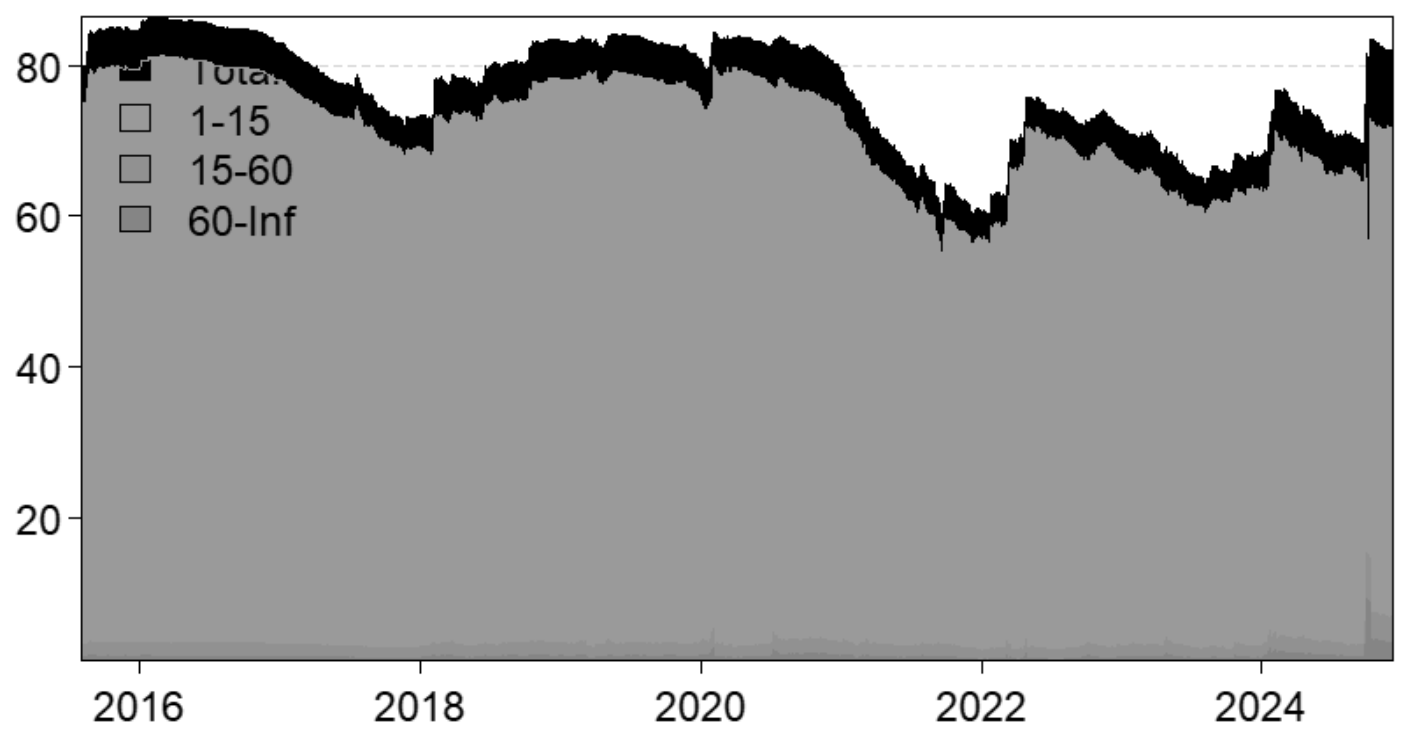
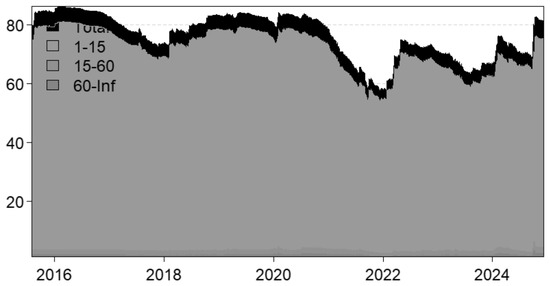
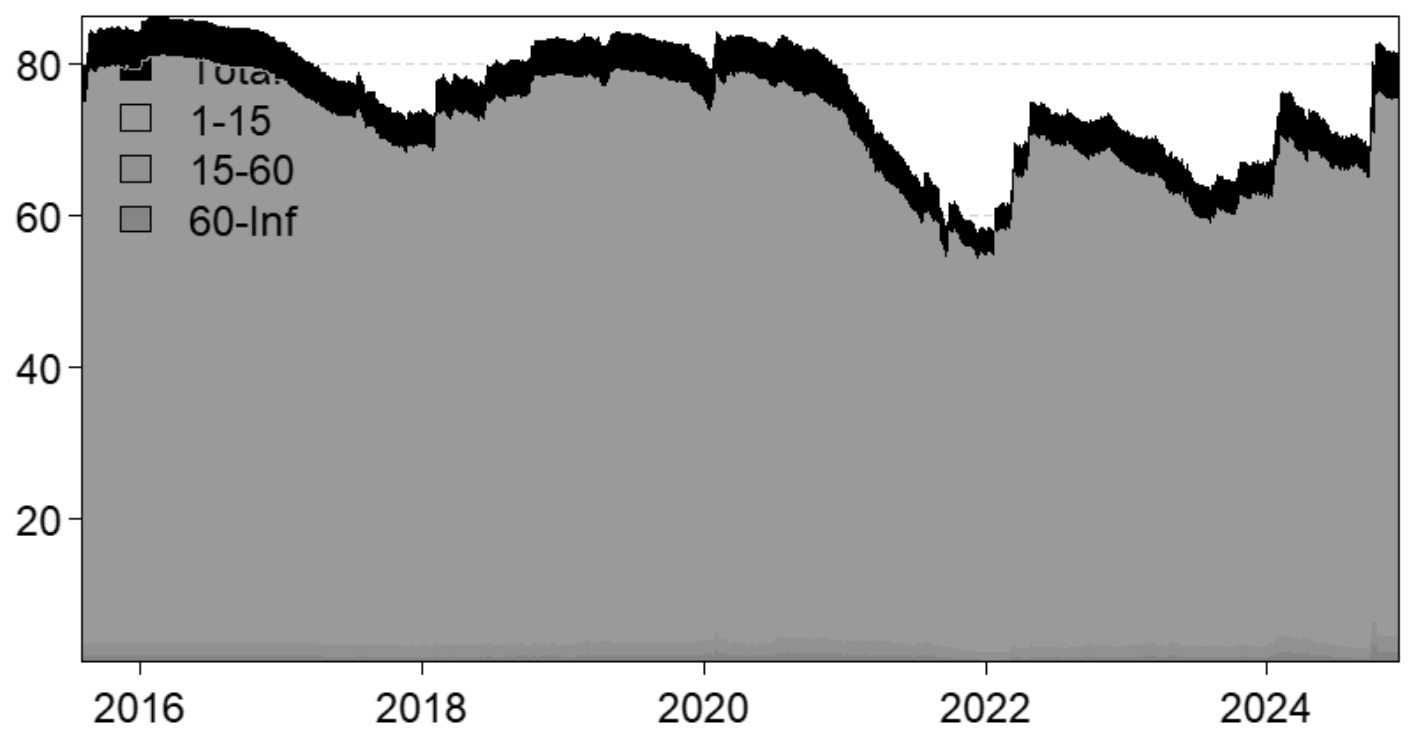
Static spillover analysis can preliminarily identify the transmission direction and intensity of risk spillovers across industries, but it cannot capture the time-varying evolution characteristics of cross-industry spillover linkages. To address this limitation, this paper adopts the rolling window method to investigate the time-varying rules of multi-industry risk spillovers. The rolling window length is set as 20 months based on a trade-off between achieving sufficient degrees of freedom for estimation and maintaining the sensitivity to capture rapid structural breaks. Figure 1 illustrates the empirical results of dynamic spillovers from 4 August 2015 to 6 December 2024 under both time-domain and frequency-domain perspectives.
Figure 1.
Full-sample frequency-domain spillover index.
Overall, the time-domain spillover level is highly synchronized with the short-term frequency-domain spillover level, and both are significantly higher than medium-term and long-term frequency-domain spillovers. The total spillover indices of the time domain and the short-term frequency domain fluctuate between 50% and 90%, presenting obvious time-varying features driven by major socioeconomic events.
From 2015 to early 2018, environmental regulations such as the introduction of environmental protection taxes exerted severe shocks on high-carbon-emission industries. Meanwhile, the industrialization and commercialization of artificial intelligence remained immature, and the new energy industry faced mounting market pressure due to subsidy reduction and intensified competition, leading to a continuous decline in total spillover levels. During 2019–2022, the outbreak of the COVID-19 pandemic exposed the vulnerability of energy supply chains and aggravated financial market turbulence, which kept the total spillover index at a high level for a long period. The peak in spillover intensity around 2020 empirically validates the theory that exogenous shocks amplify financial connectedness by increasing uncertainty and herding behavior among investors. After the effective containment of the pandemic, the total spillover index declined and reached its lowest point in the early stage of 2022. From 2023 to 2024, the total spillover index rebounded moderately. On the one hand, the rapid development of artificial intelligence and the continuous upgrading of large language models accelerated industrial integration and generated strong positive spillover effects. On the other hand, bulk commodity prices dropped sharply in the first half of 2023, causing a more than 10% profit decline in coal, petrochemical and non-ferrous metal sectors. The real estate downturn suppressed market demand, resulting in weak growth and substantial profit losses exceeding 8% and 50% in the building materials and steel industries, respectively. In addition, stricter environmental regulations increased emission constraints and compliance costs for high-carbon industries, further intensifying their risk spillover. The above evidence confirms that the total spillover index among artificial intelligence, new energy and high-carbon industries is highly sensitive to major socioeconomic shocks, and systemic spillover risks will rise sharply amid extreme events.
3.2.2. Directional Spillover
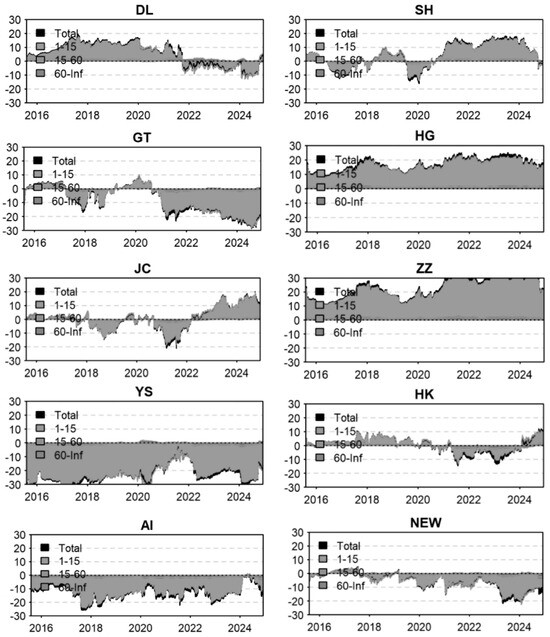
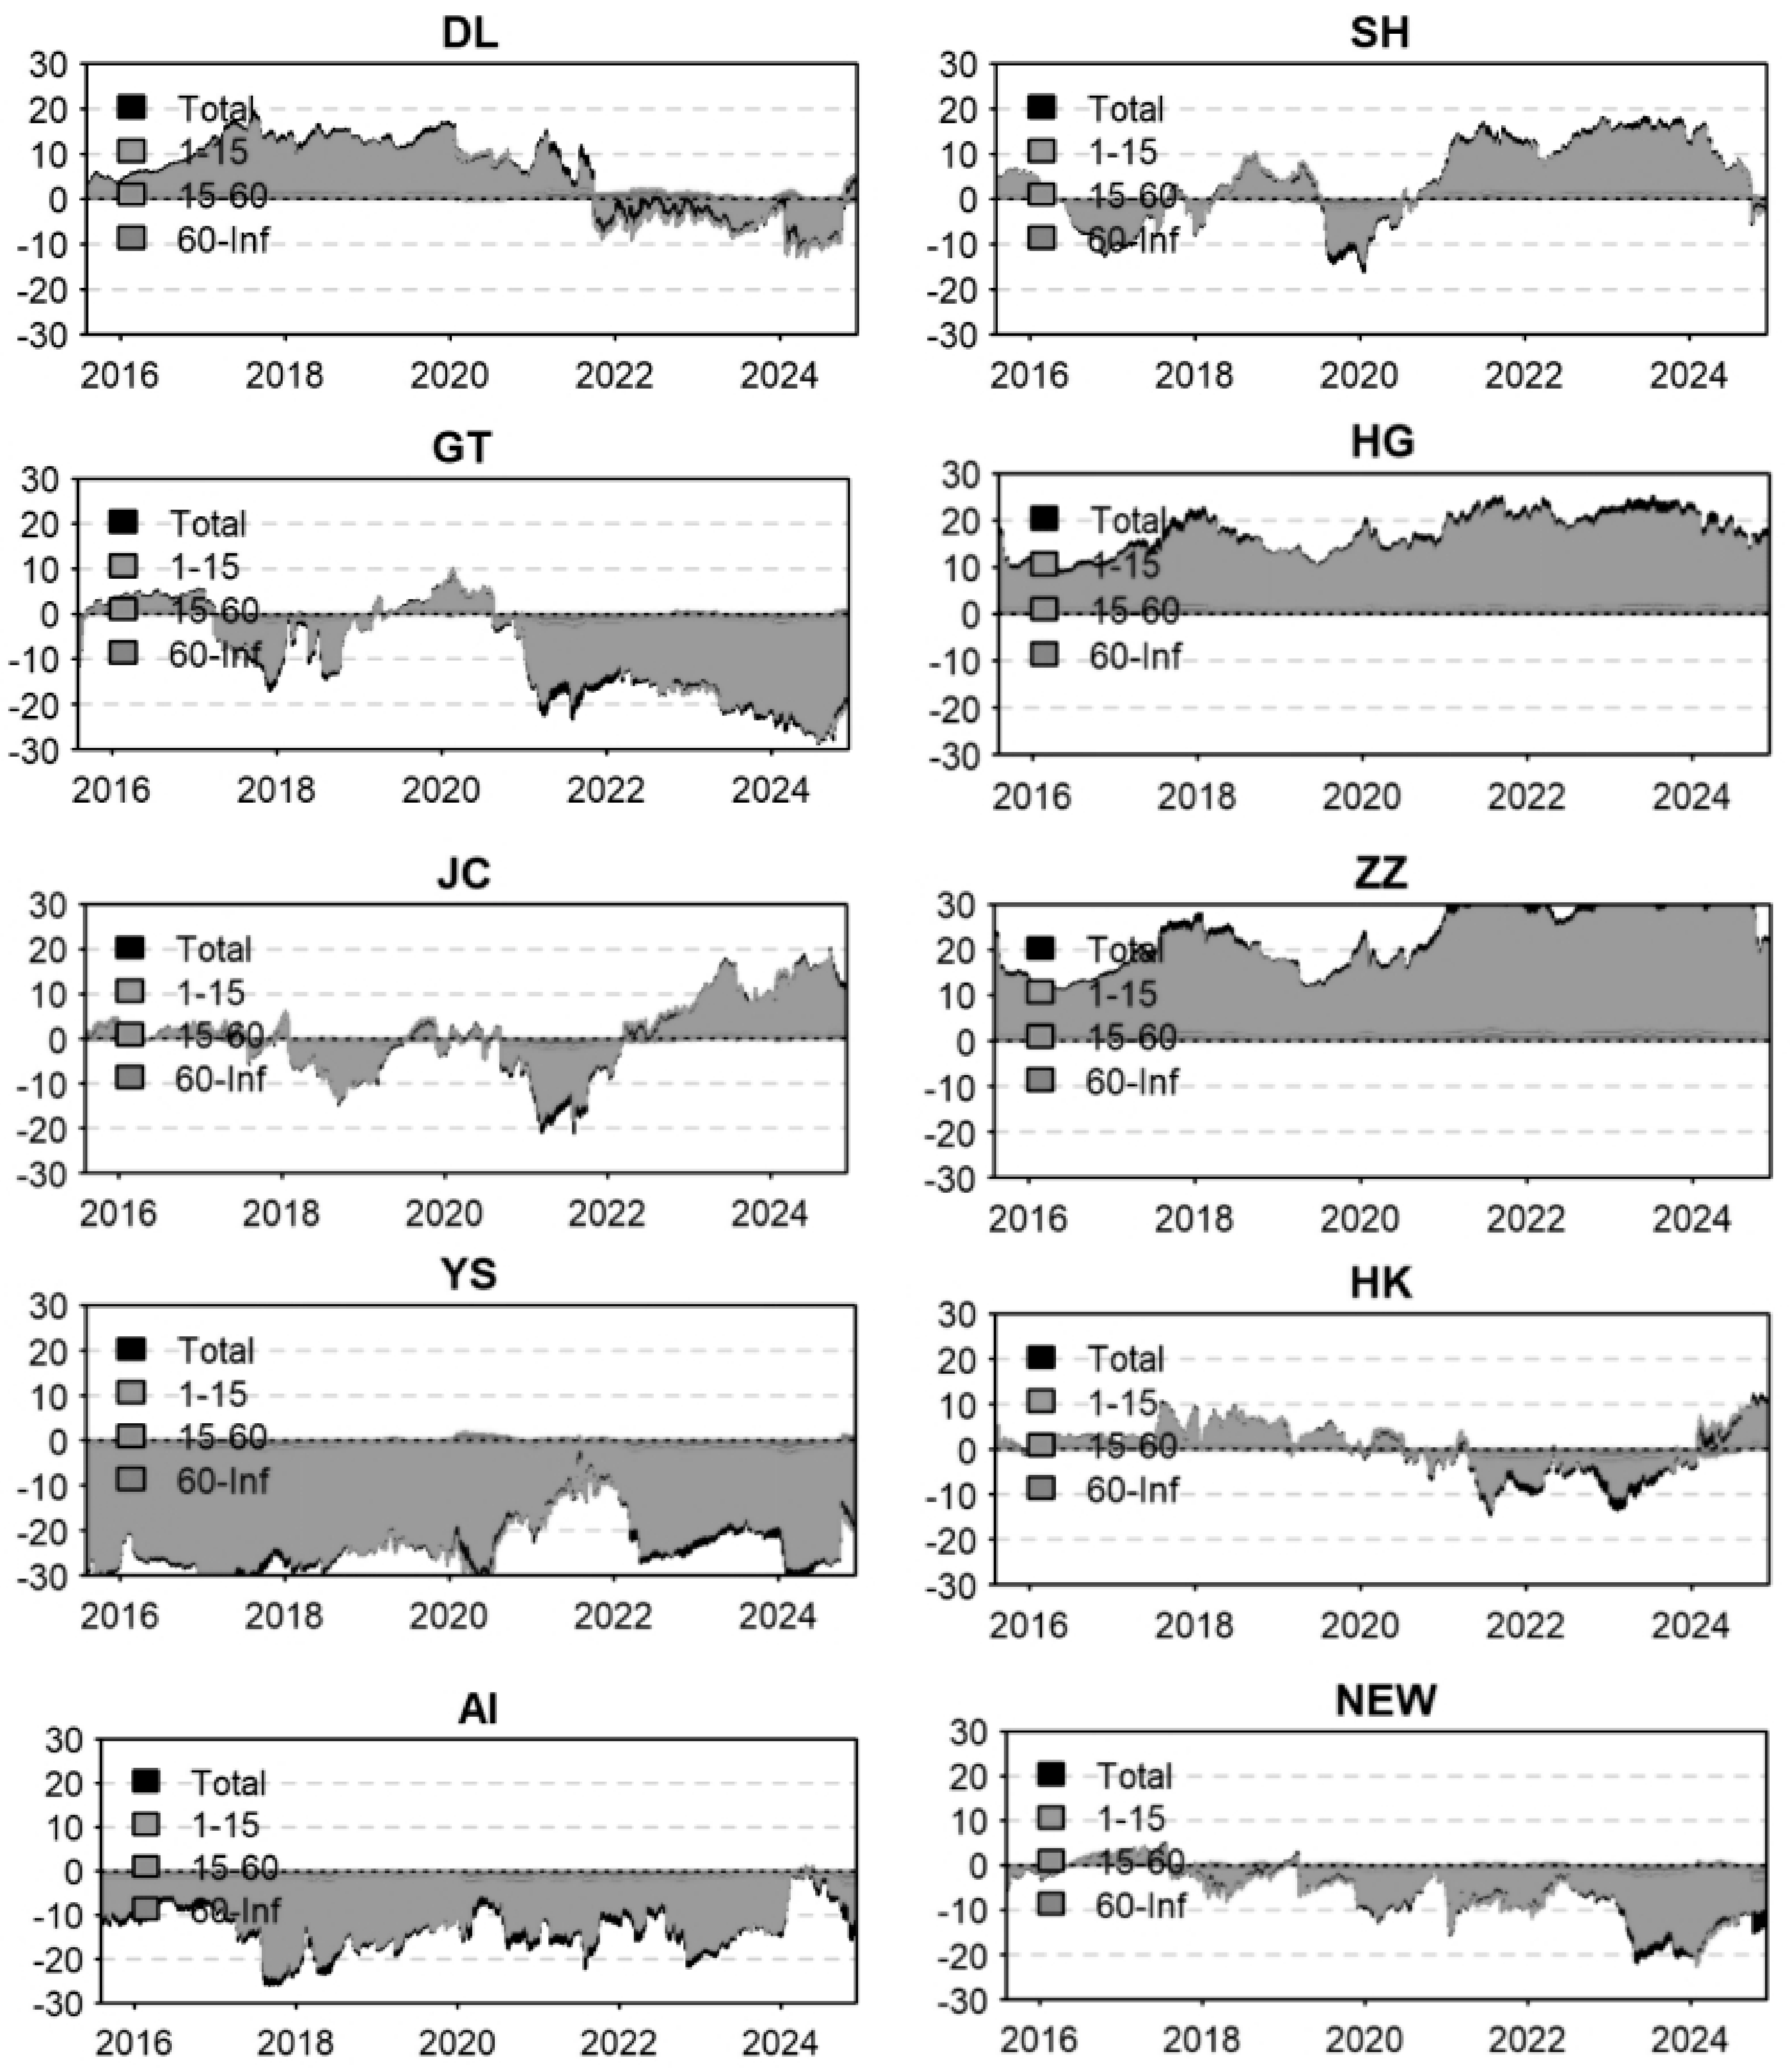
To explore the dynamic role of each individual industry within the cross-sector spillover system, this paper constructs time-varying net spillover trajectories for all sectors based on the time–frequency framework, as shown in Figure 2.
Figure 2.
Net spillover index of individual industries.
A positive net spillover value indicates that one industry’s outward spillover exceeds its incoming spillover, while a negative value means the industry is a net risk recipient. In general, the time-domain and short-term frequency-domain net spillovers of each industry experience dramatic fluctuations. The building materials (JC) and chemical (HG) industries consistently act as major spillover transmitters, whereas the iron and steel (GT) and aerospace (HK) industries serve as stable spillover receivers throughout the sample period.
The intensity of industrial net spillover is highly susceptible to major socioeconomic shocks. For instance, industrial economic activities shrank during the COVID-19 pandemic from 2019 to 2022, which intensified the volatility of net spillover. Notably, the artificial intelligence (AI) sector exhibits a unique pattern: while it generally acts as a net receiver, its net spillover value turns slightly positive during the 2023–2024 AI boom, suggesting that technological breakthroughs can temporarily transform AI from a passive absorber into an active driver of market volatility. In contrast, medium-term and long-term frequency-domain net spillovers remain relatively stable, with slower cross-industry risk transmission.
3.3. Spillover Network Analysis
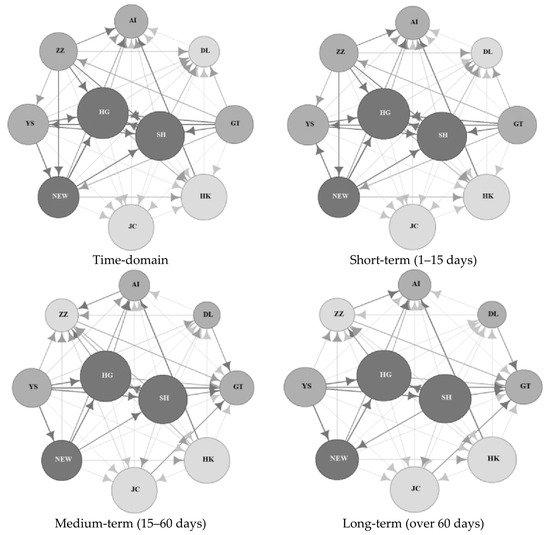
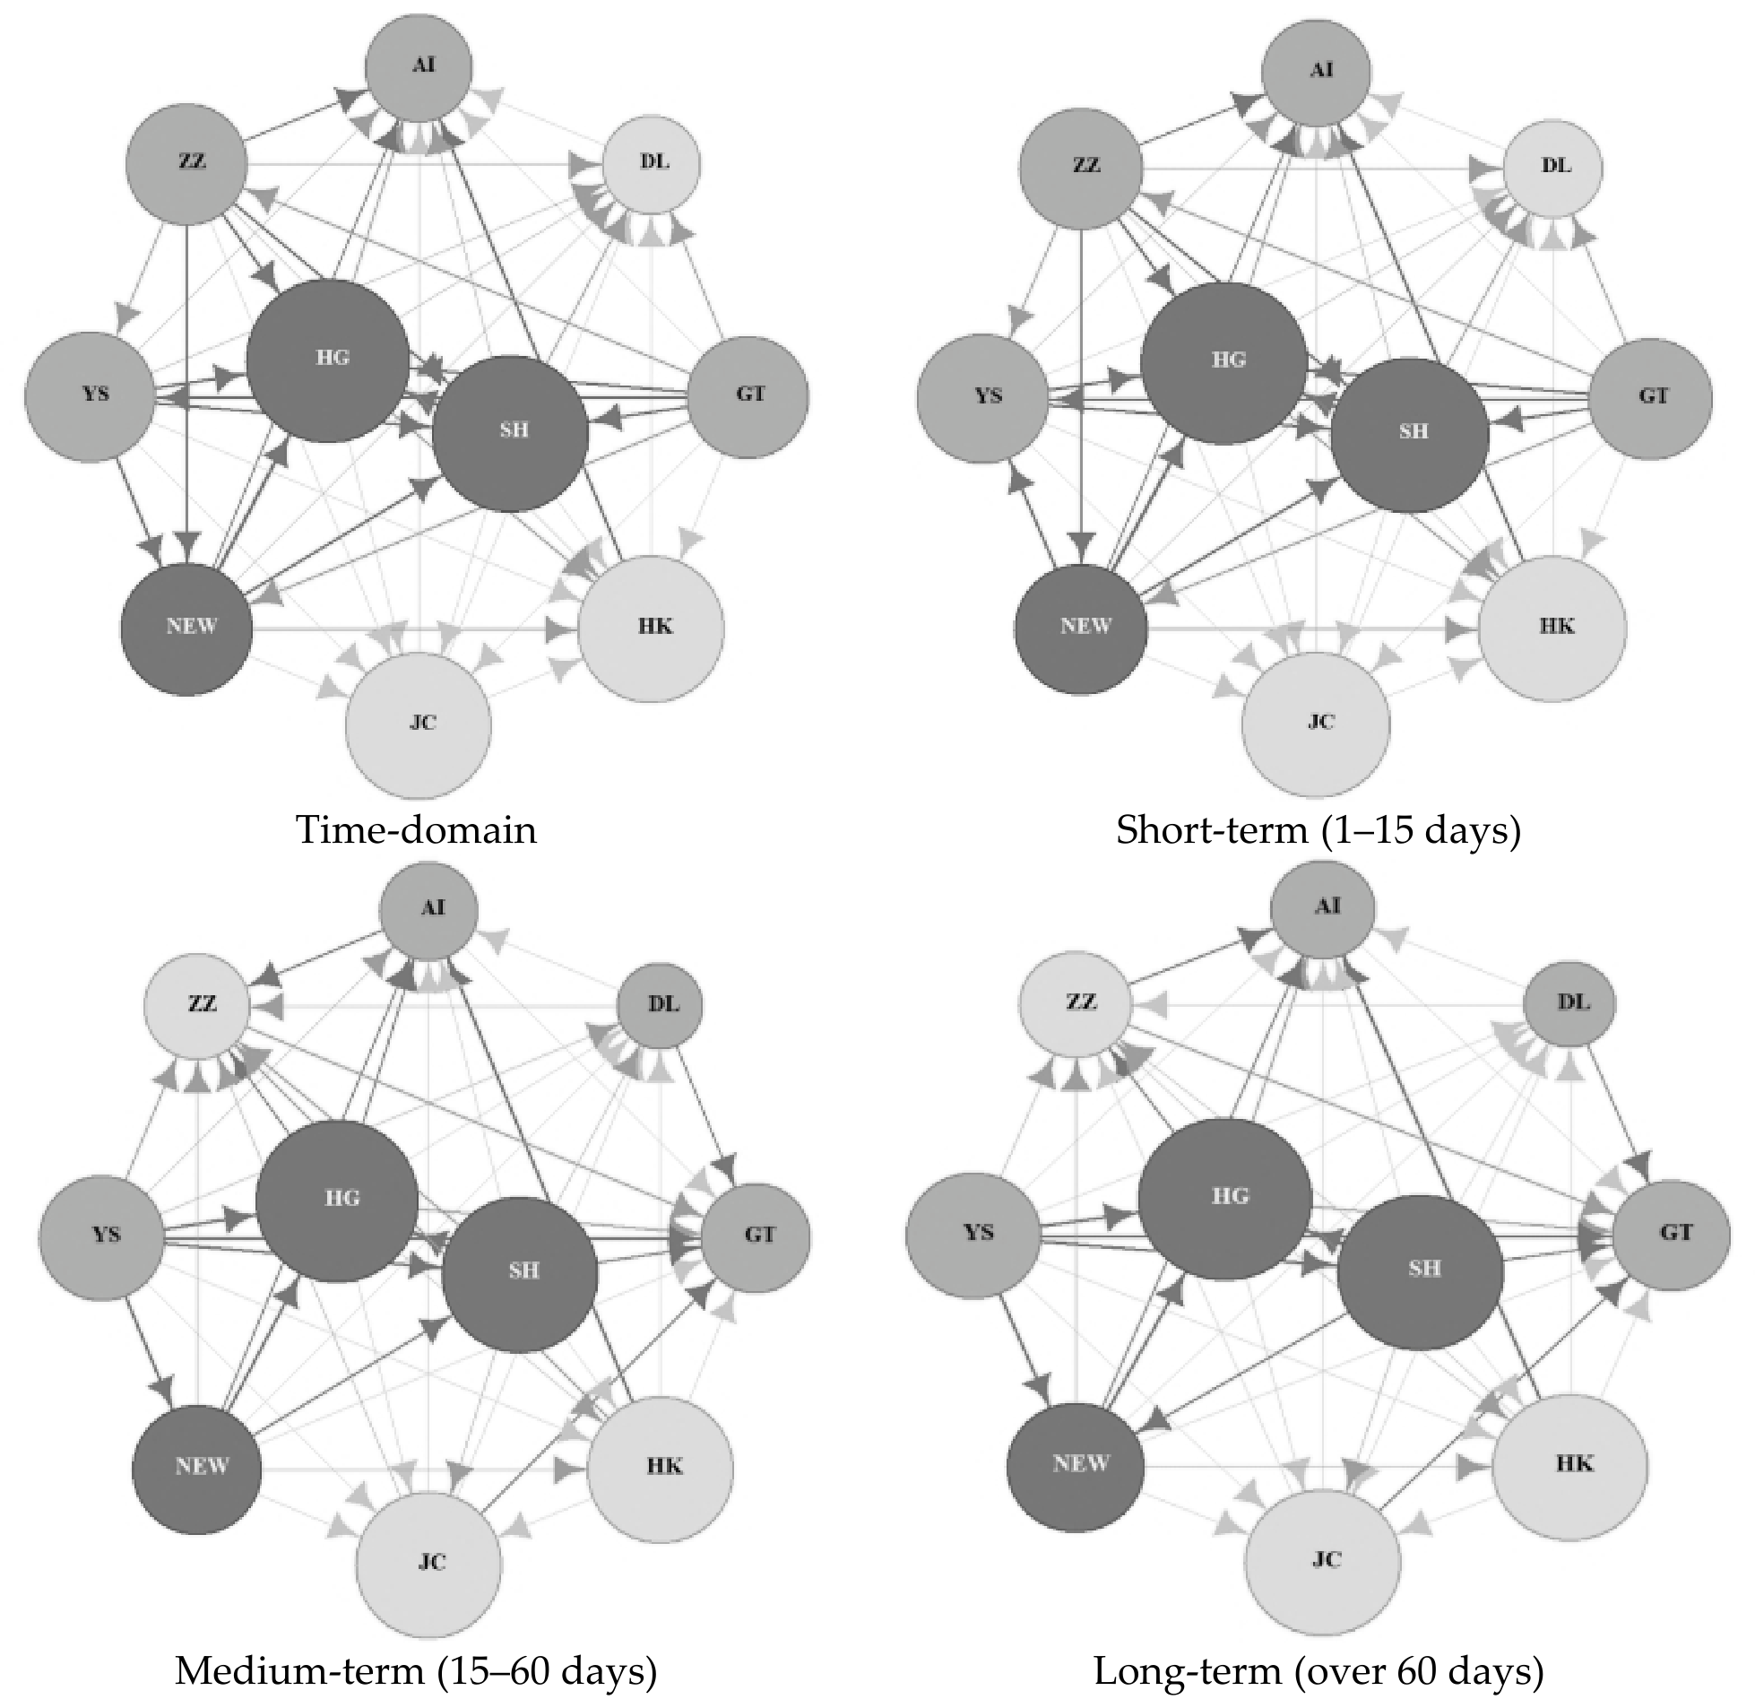
To further explore the dynamic correlation and topological characteristics of cross-industry linkages, this paper constructs a multi-dimensional spillover network based on complex network theory and systematically clarifies the risk transmission mechanism across artificial intelligence, new energy and high-carbon-emission industries. With time–frequency decomposition, the spillover network is divided into time-domain and frequency-domain dimensions.
Figure 3 visually depicts the heterogeneous risk spillover characteristics across different time scales and frequency bands. In the spillover network diagram, node size represents the out-degree of each industry, line thickness reflects spillover intensity, and arrows indicate the direction of risk transmission. The topological structures of time-domain and short-term frequency-domain networks are highly consistent, while medium-term and long-term frequency-domain networks share similar features. Meanwhile, industrial connectivity is stronger in time-domain and short-term frequency-domain scenarios. Regardless of time or frequency dimension, chemical, petrochemical, non-ferrous metal and new energy industries occupy the core position of risk spillover. In the medium- and long-frequency domains, steel and papermaking industries shift from spillover transmitters to risk receivers. Furthermore, the artificial intelligence industry functions as a critical hub node in the overall spillover network. It not only influences new energy and high-carbon industries through technology spillover, but also receives risk spillovers from other sectors. In the long run, the artificial intelligence industry plays a vital role in promoting the low-carbon transformation of high-carbon industries and optimizing the national energy structure. The centrality of the AI node underscores its dual role: it is not merely a passive technology sector but an active mediator that modulates the risk transmission between traditional high-carbon industries and the new energy sector. This structural position makes it a pivotal target for both risk management and policy intervention.
Figure 3.
Time-domain and frequency-domain spillover network.
3.4. Robustness Check
This paper adopts three methods, including changing forecast horizons, adjusting lag orders and rearranging variable sequences, to verify the robustness of the cross-industry risk spillover mechanism. First, this study recalculates time-domain and frequency-domain static spillover indices with a 150-period forecast horizon. The results in Table 4 and Table 5 are highly consistent with the baseline results based on a 100-period forecast, which verifies the robustness against alternative forecast settings. Second, dynamic spillover indices are re-estimated with a lag order of 2 and rearranged variable sequences. The outcomes in Figure 4 and Figure 5 are consistent with the original results, confirming that the empirical conclusions are not affected by lag specification and variable order.
Table 4.
Full-sample time-domain static spillover index.
Table 5.
Full-sample frequency-domain static spillover index.
Figure 4.
Robustness test (alternative lag order).
Figure 5.
Robustness test (rearranged variable order).
3.5. Portfolio Hedging and Optimization Analysis
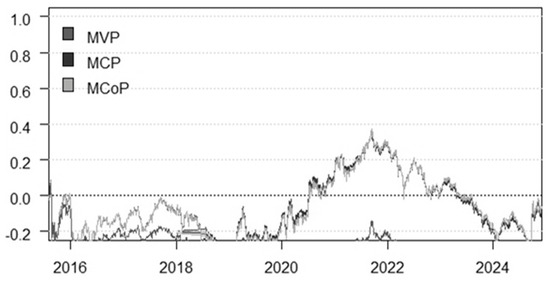
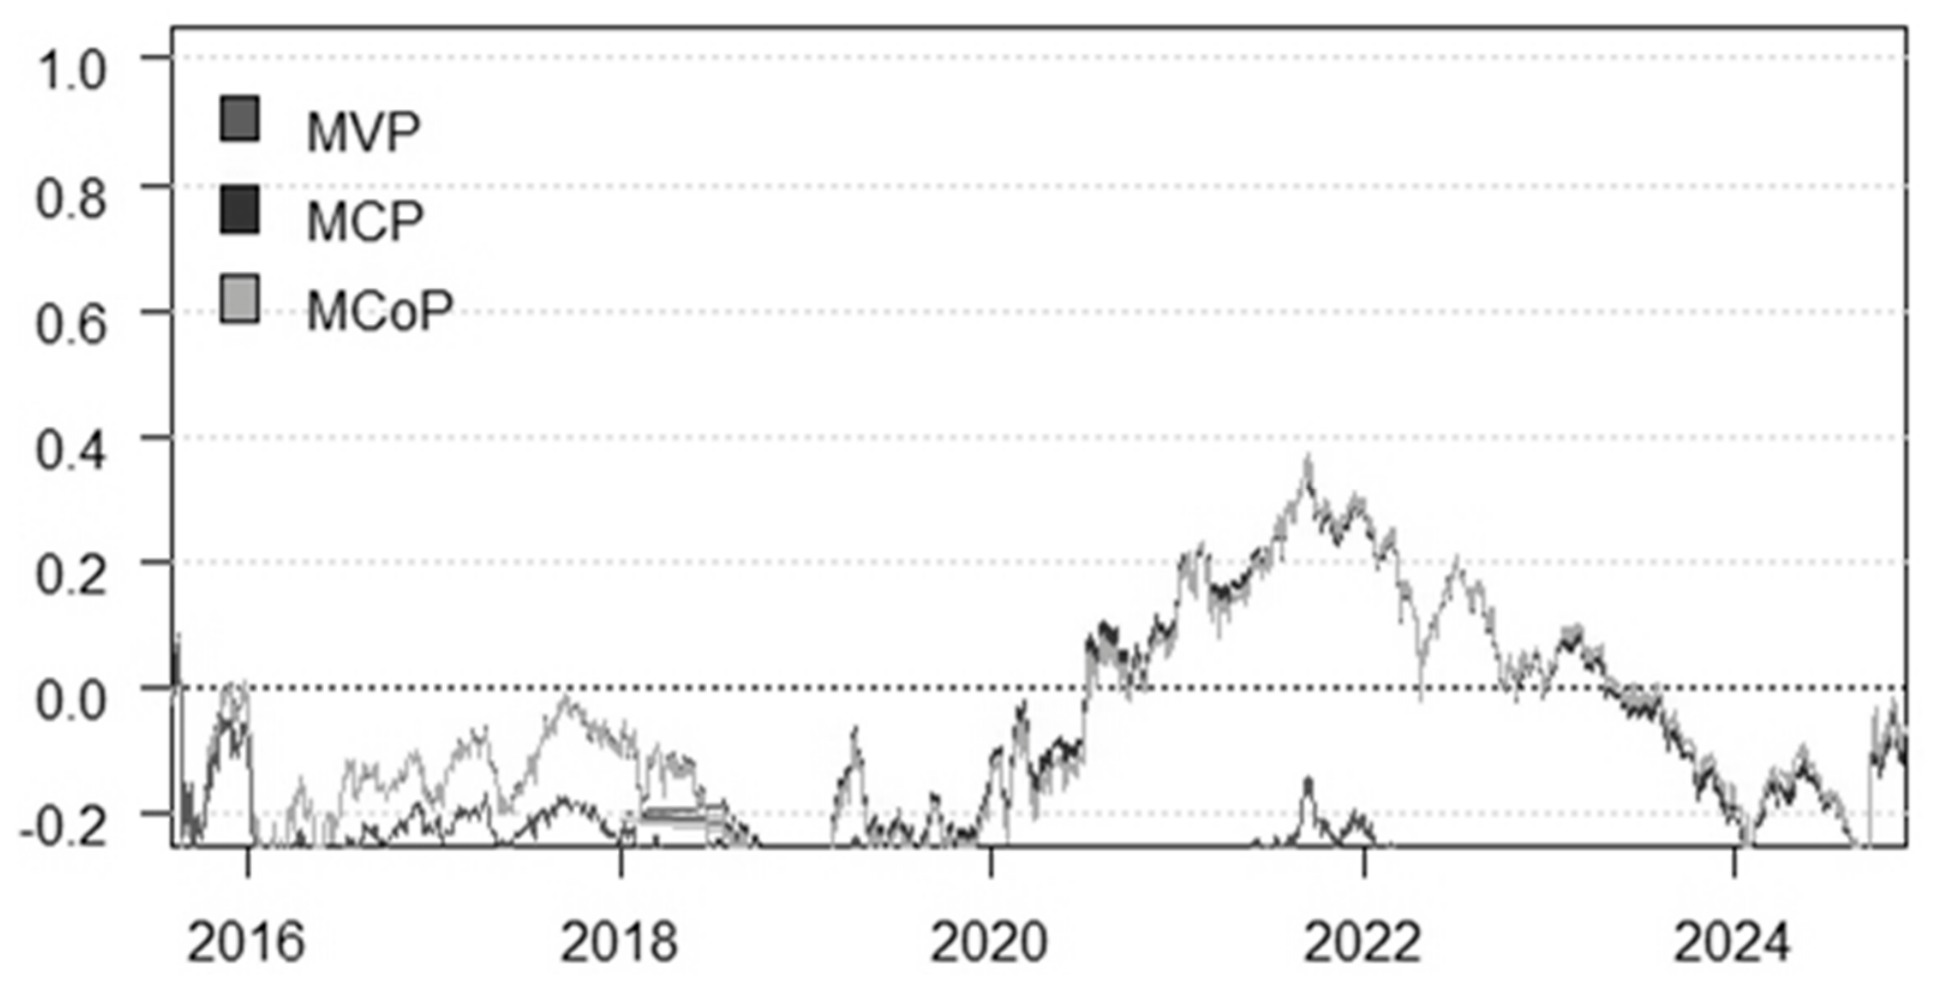
To provide actionable insights for investors, this section evaluates three distinct portfolio strategies: the minimum variance portfolio (MVP), the minimum correlation portfolio (MCP), and the minimum connectivity portfolio (MCoP), as reported in Figure 6. These strategies correspond to different investor risk profiles: the MVP is suitable for risk-averse investors focusing solely on volatility reduction; the MCP is designed for investors who prioritize reducing exposure to systemic risk spillovers (i.e., avoiding assets that are major shock transmitters); and the MCoP is optimal for investors seeking to maximize diversification benefits by considering both variance and spillover connectivity.
Figure 6.
Cumulative returns of different portfolio strategies.
As reported in Table 6, for the MVP strategy, power and petrochemical stocks account for a large portfolio weight exceeding 0.3, while their hedging effectiveness (HE) is lower than 0.3. This indicates that while traditional variance-based optimization allocates heavy weights to these low-volatility but high-spillover assets, it fails to adequately protect against systemic shocks. By comparison, aerospace, artificial intelligence and non-ferrous metal stocks present excellent hedging performance with HE values above 0.6. However, their portfolio weights are less than 0.1, which restricts their risk diversification capacity and weakens the overall hedging effect.
Table 6.
Portfolio hedging results and hedging effectiveness.
In the context of Equation (32), the unhedged portfolio refers to a naive benchmark where an investor holds the risky asset (e.g., a specific industry index) without any offsetting position in the spillover network. The hedged portfolio represents the optimized allocation that minimizes either variance (MVP) or connectedness (MCP/MCoP). The HE metric thus quantifies the percentage reduction in portfolio variance achieved by moving from the naive strategy to the optimized strategy.
Notably, the MCP and MCoP strategies show similar weight distribution patterns. Building materials, artificial intelligence and aerospace stocks occupy considerable portfolio weights (above 0.1) and maintain favorable hedging effectiveness (above 0.4), demonstrating outstanding risk diversification value. This allocation aligns with our network findings: these assets are net receivers (shock absorbers), making them ideal hedges against the systemic volatility transmitted by core transmitter industries like petrochemicals and chemicals. In terms of cumulative portfolio returns, the MCoP strategy outperforms the other two strategies in most sample periods, highlighting its unique advantages in risk management. Combined with the previous finding that building materials, artificial intelligence and aerospace are net spillover receivers, these three assets can be regarded as effective risk diversification tools for investors. Overall, the minimum connectivity portfolio is the optimal choice for investors to achieve a reasonable trade-off between risk and return.
4. Discussion
This section systematically interprets the core empirical findings of this study, clarifies the theoretical consistency and differential insights relative to the existing literature, and elaborates on how the present results confirm, supplement, and extend prior research on industrial risk spillover, AI low-carbon governance, and energy financial portfolio optimization. Unlike result-oriented empirical analysis, this discussion focuses on the theoretical logic behind time–frequency spillover heterogeneity, industrial role differentiation, and portfolio strategy superiority, bridging the research gaps identified in the literature review.
First, this study’s finding of short-term-dominated risk spillover and significant time-varying characteristics across AI, new energy, and high-carbon industries aligns with the mainstream consensus of existing time–frequency spillover research while providing targeted supplementation to industrial heterogeneity research. Prior studies have verified that risk spillovers in energy and carbon markets exhibit obvious short-term volatility and event-driven characteristics, with major socioeconomic shocks such as public health crises and policy adjustments significantly reshaping cross-industry risk transmission patterns [9,35]. Consistent with these studies, this paper confirms that the total spillover linkage of the three-sector system is highly sensitive to exogenous shocks, with spillover intensity surging during the COVID-19 pandemic and AI industrial boom periods, which further validates the nonlinear and time-varying nature of industrial risk connectedness proposed in energy financial research. However, most of the existing literature focuses on pairwise spillovers between carbon markets and high-carbon industries or between new energy and traditional energy sectors [10,12], while neglecting the systematic linkage mechanism incorporating digital technology sectors. Different from the single or dual research framework of previous studies, this paper finds that short-term speculative sentiment and high-frequency market trading are the dominant drivers of systemic risk spillover in the AI-new energy-high-carbon industrial system, whereas long-term fundamental industrial coordination presents stable and weak spillover characteristics. This conclusion complements the frequency-domain heterogeneity theory of industrial risk contagion and explains why cross-industry systemic risks in the digital energy transition era are concentrated in short-term market fluctuations rather than long-term industrial structural evolution.
Second, the differentiated spillover roles of high-carbon industries and the dual network function of the AI industry revise and refine the cognitive bias in existing AI-carbon interaction research. Existing studies on AI and carbon emissions mainly focus on the linear or inverted U-shaped technological empowerment effect of AI on energy conservation and emission reduction [18,19], while rarely discussing the financial risk spillover attributes of the AI industry in the industrial systemic network. In line with the industrial risk transmission law summarized by Ouyang et al. [10], this study confirms that traditional high-carbon industries represented by chemical and petrochemical sectors are the core spillover transmitters in the industrial system, acting as the main source of systemic volatility. Meanwhile, consistent with the findings of Liu et al. [18] on the stage-dependent impact of AI, this paper further expands the research boundary from technological carbon reduction effects to financial risk spillover effects. The results reveal that the AI industry is generally a net receiver of systemic risks and serves as a critical hub node for cross-industry risk transmission, with a temporary shift to a risk transmitter during technological breakthrough cycles. This finding corrects the one-sided understanding in the existing literature that regards AI only as a low-carbon technological empowerment tool. It demonstrates that AI has a dual attribute of “risk absorber in stable periods and risk amplifier in technological boom periods” in the industrial financial system, enriching the multi-dimensional theoretical framework of AI’s impact on energy and high-carbon industrial systems.
Third, the dynamic role reversal of heavy industries across different frequency domains supplements the research on heterogeneous risk responses of high-carbon industries. Previous spillover studies mostly adopt static time-domain analysis and fail to capture the frequency-dependent role changes in industrial subjects [31,32], resulting in one-sided conclusions about industrial risk attributes. This paper finds that steel and papermaking industries act as major short-term risk transmitters driven by market sentiment and speculative shocks, but transform into passive risk receivers in medium- and long-term cycles dominated by economic fundamentals and industrial policies. This heterogeneous time–frequency characteristic explains the inconsistent conclusions in existing single-cycle research on high-carbon industrial spillovers. It also verifies the view of Doğan et al. [12] that external shocks produce asymmetric spillover effects on energy and high-carbon industries, further refining the differential risk transmission mechanism of traditional heavy industries under different investment horizons and economic cycle conditions.
Fourth, the superiority of the minimum connectivity portfolio (MCoP) in risk-return balance extends the applied research of spillover network theory in green financial asset allocation. Existing portfolio optimization studies mostly focus on traditional energy and financial asset portfolios [38,39], and the application of minimum connectedness portfolio strategies is limited to green bond and single energy market scenarios [44], lacking targeted exploration for the AI-new energy-high-carbon industrial system. Consistent with the risk diversification logic of network connectedness theory, this study confirms that compared with traditional MVP and MCP strategies that only focus on volatility or correlation, the MCoP strategy fully incorporates the systemic spillover linkage characteristics of the industrial network. By allocating weights to net risk-receiving industries such as AI and building materials, MCoP effectively hedges cross-industry systemic risks and achieves superior risk-return performance. This conclusion verifies the applicability of the minimum connectedness portfolio framework in multi-industry green financial markets, fills the gap of targeted portfolio strategy design in the digital energy transition system, and provides empirical support for the view that network connectivity indicators are more effective than single volatility indicators in measuring systemic risks and guiding asset allocation [41].
In summary, on the basis of confirming the basic laws of industrial risk spillover and AI low-carbon transformation in the existing literature, this paper expands the research framework from pairwise industrial correlation to tripartite systematic linkage, extends the research perspective from single time-domain analysis to time–frequency heterogeneous analysis, and upgrades the research application from pure mechanism analysis to financial portfolio optimization. The core findings reconcile the inconsistent frequency-domain spillover conclusions in previous studies, revise the one-sided cognition of AI’s industrial attributes, and provide systematic theoretical and empirical supplements for risk prevention and investment decision-making in the process of digital and green industrial transformation.
5. Conclusions
Based on the daily stock return data of the artificial intelligence, new energy, and high-carbon-emission industries from 4 August 2015 to 6 December 2024, this paper constructs the TVP-VAR-DY and TVP-VAR-BK spillover index models to measure the time-varying spillover effects among the three sectors from time-domain and frequency-domain perspectives. On this basis, the complex network method is adopted to establish a risk spillover network and explore its structural characteristics. Finally, three hedging and portfolio strategies are compared and analyzed, aiming to provide reliable references for investors’ asset management. The main research conclusions are summarized as follows.
First, significant static spillover effects exist across artificial intelligence, new energy and high-carbon-emission industries, with obvious differences in magnitude and intensity across diverse frequency domains. The short-term spillover is stronger than the medium-term spillover, while the long-term spillover remains the weakest. Both in the time domain and frequency domain, the new energy industry, together with non-ferrous metal, petrochemical and chemical sectors within high-carbon industries, act as spillover transmitters. By contrast, the artificial intelligence industry, as well as the power, building materials and aerospace industries, serves as a net spillover recipient. This finding regarding the AI industry is particularly noteworthy, as it contrasts with the technology driver narrative often assumed in the literature, positioning AI more as a financial absorber of shocks from energy and carbon-intensive sectors in the short run. The conclusion remains valid after the robustness test by replacing the forecast horizon.
Second, the dynamic spillovers among the three sectors present obvious time-varying characteristics, which are significantly driven by major socioeconomic events, including environmental policy implementation, the COVID-19 pandemic and technological innovation. The chemical industry is the largest spillover exporter across all time and frequency dimensions, and the building materials industry is the most vulnerable spillover receiver. The empirical findings are robust after adjusting the lag order and variable sequence.
Third, the spillover network structure in the time domain is highly consistent with that in the short-term frequency domain, and the medium-term and long-term network characteristics are also similar. Notably, the steel and papermaking industries shift from spillover transmitters to recipients in the medium and long run. Overall, the artificial intelligence industry functions as a core node in the risk spillover network. This centrality, combined with its role as a net receiver, highlights the interconnectedness of the tech and energy sectors, suggesting that financial risks originating in carbon-intensive industries can rapidly migrate to the AI sector. Identifying key nodes and vulnerable links within the network provides a scientific basis for cross-industry risk prevention and control.
Fourth, the portfolio optimization and hedging results indicate that the minimum connectivity portfolio (MCoP) realizes balanced weight allocation among different assets. Considering hedging effectiveness and cumulative returns simultaneously, the MCoP strategy may be the best choice for investors to balance risk and return.
According to the above conclusions, the following suggestions are proposed. It is important to note that since the empirical analysis is based on daily stock market data, the implications are primarily financial and investment-oriented.
For financial regulators and policymakers, the findings suggest that while stock market linkages reflect investor sentiment and financial risk contagion, they may not directly translate to real economic shocks. Therefore, industrial policies should be formulated based on real economic data rather than solely on financial market correlations. However, from a financial stability perspective, regulators should monitor the spillover effects identified in this study as early warning signals. Specifically, the critical linkage role of the artificial intelligence industry in the financial network implies that it is vulnerable to shocks from energy and carbon-intensive sectors. Regulators should establish cross-sector financial risk monitoring mechanisms to prevent the transmission of financial crises, rather than focusing on production-level industrial coordination.
For investors and market participants, the results provide actionable insights for portfolio management. Investors should track market dynamics and major socioeconomic events and fully understand the inherent laws of industrial risk spillovers. Investment decisions should focus on industries with high short-term spillover while taking medium and long-term investment objectives into consideration. Investors are recommended to measure the correlation and volatility spillover between assets rationally, increase the allocation weight of defensive sectors such as artificial intelligence, building materials and aerospace, and adopt the MCoP strategy to disperse risks and mitigate the adverse impacts of market shocks on overall portfolios.
Author Contributions
Conceptualization, R.S. and X.L.; Methodology, R.S.; Software, R.S.; Validation, R.S., X.L. and M.W.; Formal analysis, R.S.; Investigation, M.W.; Resources, S.S.; Data curation, M.W. and S.S.; Writing—original draft, R.S. and X.L.; Writing—review and editing, X.L., M.W. and S.S.; Visualization, R.S.; Supervision, M.W. and S.S.; Project administration, S.S.; Funding acquisition, S.S. All authors have read and agreed to the published version of the manuscript.
Funding
This research was funded by Wonkwang University.
Data Availability Statement
The original contributions presented in this study are included in the article. Further inquiries can be directed to the corresponding author.
Acknowledgments
This paper was supported by Wonkwang University in 2026.
Conflicts of Interest
The authors declare no conflict of interest.
References
- Al Balushi, S.; Khalil, M.K. Building smart economy: How digitalization, artificial intelligence, and innovation are shaping a diversified future. Sustainability 2026, 18, 2911. [Google Scholar] [CrossRef] [Scilit]
- Xu, C.C.; Lin, B.Q. Embracing artificial intelligence: How does intelligent transformation affect the technological innovation of new energy enterprises? IEEE Trans. Eng. Manag. 2025, 72, 703–716. [Google Scholar] [CrossRef] [Scilit]
- Qiao, S.; Guo, Z.X.; Tao, Z.; Ren, Z.Y. Analyzing the network structure of risk transmission among renewable, non-renewable energy and carbon markets. Renew. Energy 2023, 209, 206–217. [Google Scholar] [CrossRef] [Scilit]
- Henderson, P.; Hu, J.; Romoff, J.; Brunskill, E.; Jurafsky, D.; Pineau, J. Towards the systematic reporting of the energy and carbon footprints of machine learning. J. Mach. Learn. Res. 2020, 21, 1–43. [Google Scholar]
- Erdas, M.L.; Caglar, A.E.; Uche, E.; Ahmed, Z. A new frontier in understanding the dynamics of environmental sustainability in the context of finance and low carbon energy investment: Evidence from artificial intelligence and Fourier approach. Energy 2025, 315, 10. [Google Scholar] [CrossRef] [Scilit]
- He, Q.; Xue, Y. Research on the influence of digital finance on the economic efficiency of energy industry in the background of artificial intelligence. Sci. Rep. 2023, 13, 14984. [Google Scholar] [CrossRef] [Scilit] [PubMed]
- Minsky, H. Stabilizing an Unstable Economy; Yale University Press: New Haven, CT, USA, 1986. [Google Scholar]
- Shiller, R.J. Speculative asset prices. Am. Econ. Rev. 2014, 104, 1486–1517. [Google Scholar] [CrossRef] [Scilit]
- Han, J.; Sun, Q.; Jiang, Y. Studying the risk spillover effects of the carbon market and high-carbon-emission industries under economic uncertainty. Front. Environ. Sci. 2024, 12, 1407135. [Google Scholar] [CrossRef] [Scilit]
- Ouyang, R.; Zhuang, C.; Wang, T.; Zhang, X. Network analysis of risk transmission among energy futures: An industrial chain perspective. Energy Econ. 2022, 107, 105798. [Google Scholar] [CrossRef] [Scilit]
- Liang, J.; Pan, L.Y. Effect of scale and structure changes of China’s high-carbon industries on regional carbon emissions. Energies 2023, 16, 6676. [Google Scholar] [CrossRef] [Scilit]
- Dogan, M.; Raikhan, S.; Zhanar, N.; Gulbagda, B. Analysis of dynamic connectedness relationships among clean energy, carbon emission allowance, and BIST indexes. Sustainability 2023, 15, 6025. [Google Scholar] [CrossRef] [Scilit]
- Zhang, H.W.; Fang, B.X.; He, P.W.; Gao, W. The asymmetric impacts of artificial intelligence and oil shocks on clean energy industries by considering COVID-19. Energy 2024, 291, 130197. [Google Scholar] [CrossRef] [Scilit]
- Duan, J. New energy power demand prediction and optimal scheduling based on artificial intelligence in smart grid. Int. J. Low-Carbon Technol. 2024, 19, 1041–1048. [Google Scholar] [CrossRef] [Scilit]
- Dai, L.P.; Shen, J.Y.; Zhang, F.F. Development status and application analysis of new energy photovoltaic power generation energy market based on artificial intelligence. Int. J. Low-Carbon Technol. 2024, 19, 351–358. [Google Scholar] [CrossRef] [Scilit]
- Pournader, M.; Ghaderi, H.; Hassanzadegan, A.; Fahimnia, B. Artificial intelligence applications in supply chain management. Int. J. Prod. Econ. 2021, 241, 108250. [Google Scholar] [CrossRef] [Scilit]
- Su, S.; Zang, Z.; Yuan, J.; Pan, X.; Shan, M. Considering critical building materials for embodied carbon emissions in buildings: A machine learning-based prediction model and tool. Case Stud. Constr. Mater. 2024, 20, e02887. [Google Scholar] [CrossRef] [Scilit]
- Liu, J.; Shen, H.; Chen, J.; Jiang, X.; Siyal, A.W. Artificial intelligence and carbon emissions: Mediating role of energy efficiency, factor market allocation and industrial structure. Energies 2025, 18, 1102. [Google Scholar] [CrossRef] [Scilit]
- Ouyang, S.S.; Zhao, P.J.; Gong, Z.Y. A review of transport carbon emissions: Insights from artificial intelligence and big data. J. Clean. Prod. 2025, 532, 146906. [Google Scholar] [CrossRef] [Scilit]
- Yu, Y.; Wang, J.H.; Liu, Y.; Yu, P.F.; Wang, D.S.; Zheng, P.; Zhang, M. Revisit the environmental impact of artificial intelligence: The overlooked carbon emission source? Front. Environ. Sci. Eng. 2024, 18, 158. [Google Scholar] [CrossRef] [Scilit]
- Jude, O.; Turgeman, A.; Botoc, C.; Milos, L.R. Volatility and spillover effects between central-eastern European stock markets and energy markets: An emphasis on crisis periods. Energies 2023, 16, 6159. [Google Scholar] [CrossRef] [Scilit]
- Wang, Q.Q.; Cheng, R.Z.; Xu, W.F. Assessing volatility spillover effect between international milk powder and China’s raw milk markets in the context of import growth. Cogent Food Agric. 2023, 9, 2253715. [Google Scholar] [CrossRef] [Scilit]
- Wu, B.H.; Wang, T. The spillover effect and dynamic correlation of the China-US bean futures markets based on investor sentiment. Front. Phys. 2022, 10, 871246. [Google Scholar] [CrossRef] [Scilit]
- Liu, W.G.; Gao, J.X.; Zhao, Y.L.; Jin, X.; Liu, D.Z.; Yang, J.J. A study of the spillover effects of the Chinese CNY exchange rate market, energy market, and carbon market using the generalized autoregressive conditional heteroskedasticity (GARCH) model. Int. J. Low-Carbon Technol. 2025, 20, 1616–1626. [Google Scholar] [CrossRef] [Scilit]
- Yuan, J.; Dong, Y.J.; Zhai, W.J.; Cai, Z.W. Economic policy uncertainty: Cross-country linkages and spillover effects on economic development in some belt and road countries. J. Syst. Sci. Complex. 2023, 36, 1169–1188. [Google Scholar] [CrossRef] [Scilit] [PubMed]
- Zha, R.; Yu, L.; Su, Y.; Yin, H. Dependences and risk spillover effects between bitcoin, crude oil and other traditional financial markets during the COVID-19 outbreak. Environ. Sci. Pollut. Res. 2023, 30, 40737–40751. [Google Scholar] [CrossRef] [Scilit] [PubMed]
- Zhou, Z.J.; Zhang, S.K.; Zhang, M.; Zhu, J.M. On spillover effect of systemic risk of listed securities companies in China based on extended CoVaR model. Complexity 2021, 2021, 5574305. [Google Scholar] [CrossRef] [Scilit]
- Zou, Y.Y.; Xu, J.; Chen, Y.H. Volatility, correlation and risk spillover effect between freight rates in BCI and BPI markets: Evidence from static and dynamic GARCH-copula and dynamic CoVaR models. PLoS ONE 2025, 20, e0315167. [Google Scholar] [CrossRef] [Scilit] [PubMed]
- Antonakakis, N.; Chatziantoniou, I.; Gabauer, D. Refined measures of dynamic connectedness based on time-varying parameter vector autoregressions. J. Risk Financ. Manag. 2020, 13, 84. [Google Scholar] [CrossRef] [Scilit]
- Chatziantoniou, I.; Gabauer, D.; Gupta, R. Integration and risk transmission in the market for crude oil: A time-varying parameter frequency connectedness approach. Univ. Pretoria Dep. Econ. Work. Pap. Ser. 2021, 2021, 202147. [Google Scholar]
- Liu, J.; Guo, J.; Man, Y. Ripple effects of climate policy uncertainty: Risk spillovers between traditional energy and green financial markets. Sustainability 2025, 17, 5500. [Google Scholar] [CrossRef] [Scilit]
- Li, M.; Zhang, Z.X.; Wang, X.Y.; Guo, R. Dynamic spillover effects between EU economic sanctions against Russia, oil prices, and share prices of energy companies in third countries: Evidence from China and the USA. Environ. Sci. Pollut. Res. 2024, 31, 19381–19395. [Google Scholar] [CrossRef] [Scilit] [PubMed]
- Fan, G.B.; Xie, Y.H.; Ma, L.X.; Wu, L. The liquidity spillover effects among three major crude oil markets: WTI, brent and INE. Fluct. Noise Lett. 2025, 24, 2550059. [Google Scholar] [CrossRef] [Scilit]
- Lei, L.K.; Wang, Y.; Wu, L.; Mao, Y.F. Spillover effects in stock index returns within Chinese oil industry chain. Front. Phys. 2025, 13, 1599993. [Google Scholar] [CrossRef] [Scilit]
- Liu, C.; Xu, J.H. Risk spillover effects of new global energy listed companies from the time-frequency perspective. Energy 2024, 292, 130502. [Google Scholar] [CrossRef] [Scilit]
- Wei, J.Y.; Hu, R.D.; Chen, F. The path to sustainable stability: Can ESG investing mitigate the spillover effects of risk in China’s financial markets? Sustainability 2024, 16, 10316. [Google Scholar] [CrossRef] [Scilit]
- Fu, G.Y.; Xiao, X.L.; Zhang, Y.P.; Zheng, X.C.; Wang, J.Y.; Yan, X.; Liang, H.J. Dynamic spillover effect among carbon markets and green energy sector: New evidence from complex network perspective. Comput. Econ. 2025, 2025, 1–29. [Google Scholar] [CrossRef] [Scilit]
- Mo, B.; Meng, J.; Wang, G.N. Risk dependence and risk spillovers effect from crude oil on the Chinese stock market and gold market: Implications on portfolio management. Energies 2023, 16, 2141. [Google Scholar] [CrossRef] [Scilit]
- Wang, G.N.; Meng, J.; Mo, B. Dynamic volatility spillover effects and portfolio strategies among crude oil, gold, and Chinese electricity companies. Mathematics 2023, 11, 910. [Google Scholar] [CrossRef] [Scilit]
- Chatziantoniou, I.; Gabauer, D.; de Gracia, F.P. Tail risk connectedness in the refined petroleum market: A first look at the impact of the COVID-19 pandemic. Energy Econ. 2022, 111, 106051. [Google Scholar] [CrossRef] [Scilit]
- Baruník, J.; Křehlík, T. Measuring the frequency dynamics of financial connectedness and systemic risk. J. Financ. Econom. 2018, 16, 271–296. [Google Scholar] [CrossRef] [Scilit]
- Diebold, F.X.; Yilmaz, K. Better to give than to receive: Predictive directional measurement of volatility spillovers. Int. J. Forecast. 2012, 28, 57–66. [Google Scholar] [CrossRef] [Scilit]
- Sun, Y.; Wei, Y.; Wang, Y. Do green economy stocks matter for the carbon and energy markets? Evidence of connectedness effects and hedging strategies. China Financ. Rev. Int. 2024, 14, 666–693. [Google Scholar] [CrossRef] [Scilit]
- Broadstock, D.C.; Chatziantoniou, I.; Gabauer, D. Minimum connectedness portfolios and the market for green bonds: Advocating socially responsible investment (SRI) activity. In Applications in Energy Finance: The Energy Sector, Economic Activity, Financial Markets and the Environment; Springer: Cham, Switzerland, 2022; pp. 217–253. [Google Scholar] [CrossRef] [Scilit]

Disclaimer/Publisher’s Note: The statements, opinions and data contained in all publications are solely those of the individual author(s) and contributor(s) and not of MDPI and/or the editor(s). MDPI and/or the editor(s) disclaim responsibility for any injury to people or property resulting from any ideas, methods, instructions or products referred to in the content. |
© 2026 by the authors. Licensee MDPI, Basel, Switzerland. This article is an open access article distributed under the terms and conditions of the Creative Commons Attribution (CC BY) license.