


Abstract
To trace carbon footprint information, applying blockchain technology has irreplaceable advantages for improving the green trust level of consumers, but it requires a large investment cost. Cooperative coalitions can be formed among manufacturers to reduce the burden of blockchain investment cost. In this paper, the operational strategies of three manufacturers in terms of emission reduction competition are explored under different coalition structures concerning the green trust level of consumers, and the Largest Consistent Set concept is used to analyze the stable structure of the farsighted coalition of manufacturers. The results show that when the green trust is at a particularly high or low level, the structure of a single manufacturer applying blockchain is farsightedly stable; when the green trust level is low, a coalition involving two manufacturers applying blockchain is a farsightedly stable coalition structure; and when the green trust level is high, the structure of all manufacturers applying blockchain is farsightedly stable. Compared with cooperative coalitions, a single manufacturer applying blockchain is more likely to become a farsighted stable structure, and this possibility will increase with the improvement of the green trust level. As the green trust level rises, consumer surplus and social welfare are not always the highest when all manufacturers jointly apply blockchain, and achieving optimal consumer surplus or social welfare does not mean that the coalition is farsighted and stable.
Keywords:
supply chain management; blockchain technology; farsighted coalition; consumer green trust; emission reduction competition MSC:
91A12
1. Introduction
As consumers have become more aware of low-carbon lifestyles, the importance of carbon reduction in shaping their product choices has grown. A survey from Accenture’s China Consumer Insights Report, covering over 10,000 Chinese consumers, revealed that 43% of respondents were willing to pay extra for environmentally friendly products or packaging [1]. To address consumers’ concerns over product carbon footprints, numerous enterprises have rolled out carbon labeling on their commodities. Britain has pioneered carbon labeling practices; retailers and food manufacturers including Tesco and Pepsi label selected food items with quantified carbon footprints to guide consumers toward eco-friendly purchases [2]. Chinese manufacturers such as TCL and Hisense [3] have also launched carbon labeling programs to satisfy shifting market demand. By printing carbon labels or QR codes on product packaging, consumers can retrieve full-lifecycle carbon emission data throughout a product’s lifespan. However, conventional QR-code-based labeling and traceability mechanisms largely rely on voluntary emission information disclosure from suppliers, manufacturers or third-party intermediaries. This model bears inherent drawbacks: relevant emission data is vulnerable to manipulation or falsification, owing to insufficient legal constraints and official regulatory oversight. Consequently, consumers remain skeptical about the credibility of such labeling schemes. Verifying the precision and authenticity of carbon emission data is essential to enhance consumer confidence and incentivize corporate decarbonization efforts.
Powered by core merits, including immutability, openness, transparency and decentralization, blockchain’s distributed ledger technology effectively resolves pain points inherent in conventional traceability solutions. By certifying carbon footprint traceability records as credible, blockchain enhances consumers’ green trust and the authenticity of traced information. Governments worldwide have issued targeted policies to promote blockchain industrialization. For instance, Switzerland enacted the Blockchain Act in September 2020 [4]; in June 2021, China issued official guidance prioritizing blockchain deployment for commodity traceability [5]; in April 2022, NIST published a technical report supporting blockchain-driven traceability across manufacturing supply chains [6]. Such regulatory moves consolidate blockchain’s credibility in industry and accelerate its practical adoption.
Blockchain deployment helps enterprises raise consumers’ green trust in decarbonization data, enhance product competitiveness and enjoy favorable policy support. Nevertheless, high upfront deployment costs translate into substantial fixed costs for blockchain platform construction and operation, leaving many manufacturers uncertain about the economic returns of blockchain adoption. To reduce individual setup costs, firms frequently resort to cooperative alliances. Typical industrial cases are as follows: MSC and CMA CGM joined TradeLens, a blockchain platform co-developed by Maersk and IBM in 2018, to achieve real-time cargo tracking and improve supply chain transparency and operational efficiency. Following Walmart’s successful rollout of the Food Trust platform, multinational food giants such as Nestlé and Unilever have gradually gained access to the system to trace food origins and logistics flows. Luxury conglomerate LVMH launched its proprietary blockchain platform Aura in 2021, with industry peers Richemont and Prada Group subsequently signing up to enable consumers to authenticate genuine products.
These practical cases demonstrate that peer firms generally form blockchain alliances to share costs and enhance information credibility when facing consumer trust concerns. To reveal the underlying mechanisms of coalition formation and farsighted stability driven by consumer green trust and carbon abatement competition, this paper adopts a streamlined modeling approach in game theory and supply chain research. We examine three symmetric manufacturers within the same production tier as research subjects and treat carbon emission reduction as the core competitive dimension. This baseline design helps us eliminate interference from firm heterogeneity and multi-tier supply chain relationships, to focus on analyzing the core mechanism linking green trust, blockchain cost and coalition stability. Complex realistic factors such as heterogeneous enterprises, asymmetric bargaining power and supply chain tiers will be discussed in future research.
Coalition formation reduces standalone blockchain access costs and improves collective competitiveness. Meanwhile, participating firms compete through differentiated carbon abatement investments, which further alter their blockchain adoption intentions and endogenously determine coalition stability. Farsighted manufacturers evaluate how their own strategies reshape rivals’ strategies, and hence pursue long-run alliance-stable choices with optimal payoffs rather than short-sighted profit-maximizing moves. For example, a forward-looking firm will refrain from increasing abatement investment if it anticipates such action might restructure the coalition and erode its future earnings. Existing studies on supply chain alliance stability primarily rely on myopic Nash equilibrium, which only considers firms’ short-term profits. This study extends the classical LCS farsighted coalition theory, broadening its applicable scenarios from general cooperative games to low-carbon manufacturing contexts. This study enriches the methodological system for coalition stability analysis. We are the first to apply to apply the LCS framework to analyze the stability of blockchain-based manufacturer coalitions. Combined with the industrial characteristics of blockchain (tamper-proof data and a rental cooperation mechanism), we use farsighted decision-making logic to evaluate the long-term operational status of alliances, which is a valuable application of coalition theory in the blockchain field. Different from pure theoretical LCS research, we take consumer green trust and blockchain fixed cost as core driving factors, and identify distinct farsightedly stable regions within the LCS analytical framework.
Against this backdrop, this paper investigates whether stable blockchain adoption coalitions can be established among manufacturers to enhance consumers’ green trust. Three core research questions are formulated as follows:
- (1)
- What are manufacturers’ optimal equilibrium decisions under alternative co-opetition configurations?
- (2)
- What constitutes the farsighted stable structure of blockchain-based cooperative coalitions?
- (3)
- How should manufacturers adjust abatement policies to sustain coalition stability?
To answer the above questions, we construct a setting where one manufacturer develops an original blockchain platform and licenses access to the blockchain platform to the other two manufacturers via rental payments to enhance consumer trust in decarbonization. Three distinct coalition equilibria emerge from manufacturers’ endogenous participation decisions: standalone blockchain deployment by a single firm, joint blockchain adoption by two manufacturers, and full-scale blockchain integration across all three manufacturers. We compare equilibrium outcomes under the three configurations and identify farsightedly stable coalition structures. Two primary theoretical contributions are highlighted: (1) Distinct from extant literature focusing on supply chain coalitions for procurement, advertising or pricing cooperation, this paper explores how inter-firm blockchain cooperation influences corporate abatement decisions and profitability, providing actionable decision-making guidance for firms’ blockchain adoption decisions and decarbonization planning. (2) We extend existing research to characterize the farsighted stability of blockchain coalitions, and quantify how heterogeneous levels of consumers’ green trust and blockchain construction cost jointly determine alliance equilibrium. This study enriches the theoretical literature on supply chain co-opetition and blockchain coalition stability.
The structure of this paper is as follows: Section 2 reviews the relevant literature. Section 3 describes the model and presents the research assumptions. Section 4 constructs and solves three coalition structure models. Section 5 compares equilibrium outcomes in terms of carbon emission reduction levels, market demand, and profitability. Section 6 analyzes the stability of coalition structures based on profit comparisons across different coalition structures. Section 7 conducts numerical analyses to validate the theoretical findings and examines the impact of carbon emission reduction sensitivity on manufacturers’ operational strategies. Finally, the paper concludes by summarizing key findings and managerial implications.
2. Literature Review
The research relating to this paper spans three areas: the application of blockchain technology in supply chains, the impact of carbon emission reduction competition among supply chain members, co-opetition strategies and stable structures of supply chain coalitions. Blockchain acts as an infrastructure and information governance tool for low-carbon markets. It improves information transparency, reduces information asymmetry, and enhances consumer green trust, which fundamentally changes the competitive logic of carbon emission reduction among manufacturers. Carbon emission competition, as the core operational behavior of low-carbon manufacturers, directly determines firms’ profits and market positioning. Driven by profit motives, manufacturers choose to cooperate or compete, thus promoting the formation, dissolution and dynamic evolution of various coalitions. Meanwhile, the stability of coalitions in turn restricts manufacturers’ carbon reduction strategies and blockchain adoption decisions. After reviewing the related literature, we summarize the relevant literature and highlight the key research gaps that this paper addresses in this paper.
2.1. Application of Blockchain Technology in Supply Chain
This study is related to the increasing adoption of blockchain technology in supply chains. As an Industry 4.0 infrastructure, blockchain technology has introduced transformative innovations to supply chain operations. Owing to its traceability and transparency features, blockchain technology enables firms and customers to identify counterfeit and standard products [7], as well as green and non-green products [8]. Moreover, blockchain technology leverages traceability and transparency to disclose product quality information, addressing customer distrust [9]. The academic literature provides substantial evidence regarding the potential of blockchain technology to enhance the reliability of data and information. Pattanayak et al. [10] revealed through semi-structured interviews with experts that blockchain can enhance transparency and trust, and emphasized the crucial role of trust in performance. Numerous studies emphasize the significance of blockchain technology in ensuring the traceability of product quality. Exemplary works in this domain include those of [11,12]. Concurrently, other research concentrates on the integration of blockchain technology within the realm of low-carbon supply chains. Furthermore, Yu et al. [13] studied how blockchain technology can enhance the performance of low-carbon e-commerce supply chains and what factors promote the introduction of blockchain technology, while Feng et al. [14] offered insights into the impact of carbon emission policies on the application of blockchain technology within supply chains.
The above-mentioned studies mainly explore the transformative impact of blockchain technology’s traceability on enhancing consumers’ trust and shaping supply chain operational strategies. While some studies share research concerns, our work differs in key ways. Wang et al. [15] developed game-theoretic models to analyze the interplay between supply chain structure and blockchain deployment strategies in competing supply chains, while our research focuses on the interplay between coalition structures and blockchain deployment strategies. Concerning the cost of blockchain, many studies pay attention to the sharing mechanism of manufacture–retailer or manufacturer–platform, while that of the manufacturer–manufacturer relationship is not thoroughly researched. For example, Ci et al. [16] researched different contracts between a manufacturer and a retailer, including a cost-sharing contract, whereas we model a rent mechanism between manufacturers. Previous studies have mainly examined how blockchain technology affects operational strategies. This study, however, takes a different perspective by exploring how coalition structures can influence manufacturers’ decisions to adopt blockchain technology.
2.2. Carbon Emission Reduction
It is imperative to note that carbon emission reduction and its intricate dynamics have received considerable attention. Some scholars have explored the investment effects of green technologies [17]. For instance, Niu et al. [18] discussed the situations of price competition, competition in price and carbon emission reduction efforts, and circular differential competition among enterprises. Some have also focused on the impact of carbon emission reduction policies on firms’ operational strategies [19,20]. Sun et al. [19] found that cap-and-trade policy imposed restrictions on manufacturers’ production and profitability but was beneficial to environmental protection.
In addition, some literature has focused on the application of blockchain technology in carbon emission reduction from perspectives such as policies, adoption subjects, adoption forms, and consumer characteristics. Sarabi et al. [21] proposed an evolutionary game theory model to find the optimal government policies and identify long-term behavior of the closed-loop supply chain. Some studies have further extended to government subsidies, primary and secondary carbon markets [22,23]. Research on blockchain adoption subjects involves governments, manufacturers, retailers, and others. Tian and Bai [24] found that when retailers served as adopters, not only could the profits of all participating parties be maximized, but the highest social welfare could also be achieved. Adoption forms involve in-house operation or outsourcing [25], requiring a trade-off between blockchain costs and benefits. Additionally, regarding consumer characteristics, most studies have considered factors such as consumers’ low-carbon preferences and green trust [26]. Hu et al. [27] found that the probability of eco-conscious consumers purchasing low-carbon products increased as blockchain altered the demand structure in the competition market. Our research is related to the research of Lu et al. [25], but they focused on the manufacturer’s choice between third-party and self-implementation, while our research focused on the coalition structures among manufacturers in the form of self-investment and rental cooperation involving co-opetition.
2.3. Co-Opetition Strategies and Stability Analysis of Supply Chain Coalitions
A rich repository of literature already exists concerning the intricate interplay of co-opetition strategies and the stability analysis of supply chain coalitions. Jing and Chen [28] constructed a bargaining game framework to assess low-cost manufacturer’s choice regarding the collaboration of production capacity with its competitor, and found that the core strategic trade-off lied in balancing the economic gains from capacity sharing against the competitive risks of enabling a stronger rival. Wang et al. [29] studied the cooperation and competition strategy with third-party sellers from the perspective of an etailer in platform operation. Cai et al. [30] examined large firms’ platform openness strategies and small firms’ capacity-sharing decisions in a competitive environment, and analyzed the effect of sharing partner choice, transfer fee and consumer bases to competition. Simultaneously, Zheng et al. [31] discussed the issue of competition and cooperation strategies in the two-stage and multi-agent supply chain under the hybrid carbon trading mechanism. Additionally, Xiao et al. [32] explored the multifaceted terrain of profit-sharing strategies within vertical cooperative coalitions, all in pursuit of the goal of maintaining coalition stability. Some scholars also discussed the co-opetition strategies in the realm of carbon emission reduction. For instance, Ma et al. [33] examined the optimal decisions in the context of a carbon total control and trading policy, where three monopolistic manufacturers cooperated or did not cooperate. In response to the demand for carbon reduction, Liu et al. [34] established three game models: the non-cooperative model, the innovation cost-sharing contract model, and the technology licensing contract model.
While these studies comprehensively address co-opetition strategies and, in some instances, delve into the intricacies of coalition stability, the literature hitherto has been conspicuously devoid of any scholarly discourse concerning the analysis of stable coalition structures by supply chain members in the realm of blockchain adoption. Therefore, from the literature above, we can find that although the literature abounds in co-opetition strategies, it lacks in cooperation stability analysis. Some scholars discussed coalition stability in product assembly systems [35] but not in the realm of carbon reduction emission. Our research fills this gap by probing into the co-opetition strategies of manufacturers and conducting coalition stability analysis from a farsighted perspective. Our research delves into the co-opetition among manufacturers firstly, and analyzes the the coalition stability from far-sighted perspective.
In summary, extant studies have made abundant explorations regarding blockchain adoption in supply chains, carbon abatement competition and supply chain co-opetition alliances, yet noticeable research gaps remain. First, most existing literature on blockchain cooperation focuses on cost-sharing contracts between upstream and downstream supply chain members, while few papers investigate horizontal blockchain co-construction among homogeneous manufacturers via platform rental mechanism. Second, prior carbon emission reduction research mainly concentrates on policy restrictions and abatement investment games of individual enterprises, rarely combining cross-firm co-opetition driven by blockchain traceability and consumers’ green trust. Third, existing analyses on alliance stability generally rely on myopic Nash equilibrium, lacking farsighted stability discussion for blockchain-based coalitions with Largest Consistent Set (LCS), and consumers’ green trust is seldom treated as a core exogenous factor affecting alliance evolution.
Against such research deficiencies, this paper makes following major innovations and contributions: First, from the perspective of novel modeling and research, this paper establishes a horizontal co-opetition game where one manufacturer independently develops the blockchain platform and its competitors access the system by paying rental fees. Three blockchain adoption scenarios (single-firm adoption, two-firm coalition, and full three-firm coalition) are categorized. By incorporating consumers’ green trust into market demand formulation, this paper explores how varied trust levels affect manufacturers’ abatement efforts, market demand and equilibrium profits. It fills the research gap concerning peer manufacturers’ blockchain co-construction through rental contracts and enriches the theoretical research on contractual modes of blockchain deployment in low-carbon manufacturing supply chains. Second, from the perspective of innovative stability research methodology, this paper adopts the LCS concept of farsighted coalition to identify stable alliance boundaries segmented by consumers’ green trust and fixed blockchain construction cost, which is different from conventional myopic Nash equilibrium analysis. It clarifies how fluctuating green trust alters manufacturers’ willingness to form blockchain coalitions and verifies that farsighted stable alliance structure does not equal maximum consumer surplus or social welfare. The findings extend the existing literature on the stability of low-carbon blockchain alliances and deliver actionable theoretical references for manufacturers’ blockchain cooperation decisions and governmental low-carbon industrial regulation.
The literature comparison is shown in Table 1.
Table 1.
Literature comparison.
3. Model Description and Assumptions
This paper examines the competition among three manufacturers selling the same product, focusing on their carbon emission reduction efforts. One manufacturer has invested in the development of a blockchain platform, while the other two can choose either to rent the platform for blockchain application or to forgo blockchain technology, depending on consumers’ trust in low-carbon products. Regarding blockchain cooperation, this paper analyzes the stable coalition structures under three scenarios: a single manufacturer applying blockchain (I), two manufacturers applying blockchain (C), and all manufacturers applying blockchain (G) as illustrated in Figure 1.
Figure 1.
Coalition cooperation structure.
All three manufacturers are symmetric in production cost, carbon abatement capability and market position. Therefore, any of the three firms can act as the platform initiator. We label the first-mover firm as manufacturer 1 for unified modeling and presentation. In this game setting, manufacturer 1 is the leader that decides whether to invest in and launch the blockchain platform, while the other two manufacturers act as followers choosing to rent access or remain independent. Peer competitors voluntarily join rival-operated blockchain platforms mainly for practical benefits: renting existing infrastructure drastically cuts fixed costs for blockchain construction, and avoids high technical investment and operational risks. Meanwhile, blockchain traceability helps improve consumers’ green trust and product competitiveness. The cost-saving advantage outweighs the potential competitive drawbacks, so rational manufacturers choose to adopt this cooperation form. This setting aims to control for the influence of firm-specific heterogeneity, and purely explore how exogenous factors (consumers’ green trust and blockchain fixed costs) affect coalition structures and their farsighted stability. All manufacturers compete through carbon emission reduction efforts, which is the core competitive mode for low-carbon manufacturers applying carbon labeling and blockchain traceability in practice. In this baseline model, we do not incorporate multi-tier supply chain structures, asymmetric bargaining power, regulatory constraints or blockchain interoperability issues, to keep the model tractable and highlight the core research logic.
Manufacturer 1 incurs fixed costs to develop the blockchain platform, while manufacturers 2 and 3 have the option to pay rent t to access the platform and form a blockchain application coalition. The application of blockchain technology involves two key costs: the unit cost of blockchain application , which primarily covers the cost of carbon emission information recording, and the platform rent t, which is required to apply the blockchain infrastructure provided by manufacturer 1.
In the early popularization stage of industrial blockchain platforms, platform operators generally sign long-term fixed-rental contracts with participating firms. The rental fee remains stable within the contract period, and operators seldom adjust rent dynamically after new members join. This real-world business practice supports our fixed-rent assumption.
This study adopts a three-manufacturer framework for several reasons. From the theoretical perspective, a three-player model is the minimal specification that can generate standalone, partial coalition and full grand coalition structures. This framework helps distinguish the strategic differences among platform builders, alliance members and external manufacturers, and extract the core mechanism of coalition evolution without excessive computational complexity.
Carbon abatement is generally subject to diminishing marginal return, and a quadratic form for the abatement cost is commonly adopted, so referring to [39,40], the abatement cost for manufacturer i at a carbon abatement level of can be represented by a quadratic cost function:
Referring to [41,42], the consumer demand for manufacturer i is influenced by the carbon reduction levels of all three manufacturers and can be expressed as
where represents the basic market demand, denotes the sensitivity of demand to changes in carbon emission reductions, and k reflects the level of consumers’ green trust. Specifically, when blockchain technology is applied, k is set to 1 [11,43], where as indicates the absence of blockchain application. shows that higher carbon abatement of a manufacturer improves its product’s low-carbon credibility, raises consumer willingness to buy, and thus increases its own demand; shows that rivals’ higher abatement enhances their competitive advantages and diverts market demand away from the focal firm. For a market with n symmetric homogeneous competitors, the cross-competitive impact of each rival’s strategic variable (carbon abatement in this paper) is uniformly set to [44]. In our model, , so the coefficient is . The economic logic is straightforward: total competitive pressure from all rivals is standardized as . When three identical manufacturers compete, the overall competitive effect is equally distributed among the other two competitors.
Blockchain adopts a decentralized distributed ledger structure. All data related to product production, logistics and carbon emissions are recorded in real time and permanently stored on the chain. All authorized manufacturers and consumers can query full-lifecycle carbon records, which realizes full open disclosure of carbon information and substantially improves market information transparency. Traditional carbon labels and ordinary QR codes are easy to be tampered with by enterprises, which enables manufacturers to hold private information and creates obvious information asymmetry. In contrast, blockchain data is immutable and traceable. Enterprises cannot arbitrarily modify emission data or make false low-carbon publicity. The information gap between supply side and demand side is narrowed, and the information asymmetry problem in the low-carbon market is effectively solved. Driven by transparent and authentic on-chain carbon data, consumers no longer doubt the authenticity of enterprises’ carbon reduction performance. Their overall perception of low-carbon products is enhanced. This positive change in consumer cognition directly raises the level of consumers’ green trust, and further affects their purchasing decisions and preference for products.
For manufacturers deploying blockchain traceability, the tamper-proof distributed ledger records full-lifecycle carbon footprint data permanently. On-chain data cannot be altered, which completely eliminates the possibility of data falsification. For this reason, we normalize the trust level to as the benchmark value. Economically, the green trust coefficient k is embedded in the linear demand function. It governs the marginal effect of carbon reduction efforts on market demand. A higher k means consumers are more willing to recognize low-carbon attributes and convert their preference into actual purchases, and they are also more willing to pay for green products. When k is low, consumers tend to doubt the authenticity of carbon data, so manufacturers’ abatement investment can hardly be rewarded by increased sales. Essentially, blockchain’s inherent technical characteristics are the core driver for the improvement of green trust. Without blockchain, voluntary carbon disclosure lacks effective supervision, greenwashing is prevalent, and consumer trust remains at a low level (). After blockchain adoption, full-process carbon data is irreversibly stored on the chain. The high transparency of blockchain bridges the information gap between producers and consumers, eliminates public concerns about false green marketing, and ultimately raises consumer green trust to the benchmark level . It is necessary to point out that the original consumer trust is , and it changes to () after blockchain application. Without loss of generality, we normalize and set .
Finally, represents the carbon reduction level of manufacturer i. In addition, the marginal profit per unit sold is p. It is a market with homogeneous products, fully transparent prices and perfect competition. When manufacturer increases carbon abatement level, the demand of its product increases. Conversely, the demand decreases as a competitor increases carbon abatement level. The demand also increases when consumers’ green trust rises since blockchain technology can verify the authenticity of emission data.
Given that product profit is fixed, consumer surplus is reflected by market demand. Refer to [45], consumer surplus is
It is commonly used in realm of green supply chain. The total social welfare is composed of manufacturers profits and consumer surplus
The symbols involved in this paper are described in Table 2.
Table 2.
Summary of notations.
4. Carbon Reduction Strategies of Manufacturers Under Different Coalition Structures
4.1. Model I: A Single Manufacturer Applying Blockchain
Under this scenario, manufacturer 1 applies blockchain technology while manufacturers 2 and 3 do not. As a result, the market demand for manufacturer 1 can be expressed as
The market demands of manufacturers 2 and 3 are represented as
where , and .
Manufacturer 1 incurs the investment and construction costs associated with blockchain technology. The cost of applying the blockchain technology platform comprises two components: the fixed costs of building a blockchain platform and the unit cost of the blockchain application, denoted . Therefore, manufacturer 1’s profit can be expressed as follows:
The profit functions of manufacturers 2 and 3 are expressed as follows:
4.2. Model C: Two Manufacturers Applying Blockchain
This section discusses a scenario in which manufacturer 1 and manufacturer 2 apply blockchain technology. In this scenario, manufacturer 1 invests in the construction of a blockchain technology application platform, and manufacturer 2 pays rent to access the blockchain platform, forming a blockchain coalition. Manufacturer 3 does not apply it. The demand functions for manufacturers 1 and 2 are expressed as
where , and . The demand function for manufacturer 3 is expressed as
In this scenario, the cost of blockchain application for manufacturer 2 comprises two components: the rent paid to manufacturer 1 for usage and the unit cost of applying blockchain technology. Manufacturer 1’s revenue comprises two components: the profit derived from product sales and the rent received from manufacturer 2. Therefore, the profit of manufacturer 1 is expressed as
the profit of manufacturer 2 is expressed as
and the profit of manufacturer 3 is expressed as
4.3. Model G: All Manufacturers Applying Blockchain
In this scenario, all three manufacturers apply blockchain technology. Manufacturer 1 invests in constructing a blockchain technology application platform, while manufacturers 2 and 3 rent it for blockchain technology application, forming a blockchain coalition. The market demand for the three manufacturers is expressed as follows:
The revenue of manufacturer 1 includes revenue from product sales and rent paid by manufacturers 2 and 3 for blockchain technology application. The cost of blockchain technology application for manufacturers 2 and 3 comprises the the rent paid for applying the blockchain platform and the unit cost of blockchain application. Therefore, the profit of each manufacturer is expressed as
5. Result Analysis
This section compares the decision-making results from Section 4, discusses the relationships between carbon reduction levels, market demand, and profits of different manufacturers, and analyzes the influence of blockchain applications and coalition structures on manufacturers’ operational strategies. The equilibrium results and the thresholds are presented in Appendix A while the proofs are presented in Appendix B.
Theorem 1.
- (1)
- Under the same coalition structure, the relationship of carbon emission reduction levels of different manufacturers is as follows:
- (i)
- If consumers’ green trust level is very high (), ; otherwise, .
- (ii)
- If consumers’ green trust level is low (), ; if consumers’ green trust level is intermediate (), ; if consumers’ green trust level is high (), .
- (iii)
- .
- (2)
- The relationship of carbon emission reduction levels of the same manufacturer under different coalition structures is as follows:
- (i)
- .
- (ii)
- If consumers’ green trust level is low (), and are the largest simultaneously, and are the smallest simultaneously; otherwise, and are the largest simultaneously, and are the smallest simultaneously.
Theorem 1 (1) demonstrates that in a coalition structure where only a single manufacturer applies blockchain (model I), the carbon emission reduction level of manufacturers 2 and 3 is higher than that of manufacturer 1 when the level of consumers’ green trust is high. As consumers have high green trust toward products, it is inefficient to invest in blockchain, so manufacturers 2 and 3 choose to invest in abatement technology instead to increase profits. The blockchain technology investor, however, bears the cost independently.
Under model C, when consumers’ green trust level is low, the carbon emission reduction level of the blockchain platform builder (manufacturer 1) is higher than that of tenants, while the carbon emission reduction level of the manufacturer that does not apply blockchain technology is the lowest. As consumers’ trust increases, the carbon emission reduction level of manufacturer 3 catches up, and becomes the highest when consumers’ trust is high. As for manufacturer 3, it has the discretion of choosing carbon emission level based on consumers’ green trust without the constraint of rent. When the green trust is high, investing in carbon abatement is more efficient, so manufacturer 3 chooses to maximize its investment in carbon abatement. Meanwhile, the blockchain renter’s abatement level is always lower than that of the blockchain investor. That is because when manufacturer 2 becomes the renter, its rent becomes part of the investment of manufacturer 1 in carbon emission.
Under the structure where all three manufacturers apply blockchain platforms (model G), the carbon emission reduction level of blockchain platform renters (manufacturer 2 and manufacturer 3) is always lower than that of the builder. This occurs because manufacturers share the same green trust from consumers. Manufacturer 1 can invest more in carbon emission reduction using the rent of manufacturers 2 and 3.
Theorem 1 (2) demonstrates that for the blockchain platform builder, irrespective of green trust levels, the manufacturer’s carbon abatement is consistently higher when it applies the blockchain platform independently but decreases as more manufacturers join the blockchain cooperative coalition. This is due to the investment and construction cost of the blockchain, which compels the manufacturer to enhance its carbon emission reduction efforts to attract more consumers and increase profits. Additionally, the impact of carbon emission reduction on demand becomes more pronounced after adoption. When other manufacturers rent the platform, the rental fee partially compensates for the blockchain’s investment and construction cost, weakening manufacturers’ incentives to reduce emissions.
The comparison of carbon abatement levels across different operational modes offers clear managerial and policy guidance. From an environmental perspective, multi-firm coalitions generally deliver higher carbon reduction levels than standalone operation, which helps cut industrial carbon emissions effectively. But the platform builder may benefit from the rent collected from renters and invest less in carbon emission reduction. For policymakers, targeted incentives can encourage firms to form stable alliances to improve overall low-carbon performance and achieve environmental governance goals, but it is necessary to withdraw incentives when consumers have a high green trust level.
Theorem 2.
- (1)
- Under the same coalition structure, the relationship of product demand among different manufacturers is as follows:
- (i)
- If consumers’ green trust level is very high (), ; otherwise, .
- (ii)
- If consumers’ green trust level is low (), ; if consumers’ green trust level is intermediate (), ; if consumers’ green trust level is high (), .
- (iii)
- .
- (2)
- The relationship of product demand of the same manufacturer under different coalition structures is as follows:
- (i)
- If consumers’ green trust level is very high (), ; otherwise, .
- (ii)
- If consumers’ green trust level is low and intermediate (), is the largest, is the smallest; if consumers’ green trust level is high (), is the largest, is the smallest; if consumers’ green trust level is higher (), is the largest, is the smallest.
According to (1) of Theorem 2, under model I, low green trust enables manufacturer 1’s abatement outputs to gain full consumer recognition, so identical abatement generates larger demand and manufacturer 1 achieves higher sales. As green trust rises, consumers equally trust emission data from non-blockchain firms; manufacturer 2 and manufacturer 3 save blockchain spending and boost abatement to surpass manufacturer 1 in demand. Under two-firm coalition C, manufacturer 1 has stronger abatement incentives and tops demand at low trust; manufacturer 3 gradually raises abatement and sales with growing trust, and secures the highest demand at high trust by avoiding blockchain fees. For full coalition G, rental income offsets manufacturer 1’s fixed cost burden, supporting higher abatement and steady demand advantage over fee-paying manufacturer 2 and manufacturer 3.
According to (2) of Theorem 2, for the platform builder, standalone blockchain adoption maximizes demand at low trust thanks to higher marginal demand contribution from abatement; the full-coalition structure G performs better at high trust. For rental manufacturers, blockchain-verified abatement lifts sales under low trust, whereas they reallocate saved blockchain costs to abatement to obtain higher demand when trust is high. Green trust modifies how strongly abatement boosts demand, alters optimal abatement levels and eventually leads to varied demand rankings among different coalitions.
In combination with Theorem 1, it can be concluded that to compensate for the cost of blockchain adoption, manufacturers increase the carbon emission reduction level to attract consumers. When the trust level is low, the application of blockchain enables consumers to perceive a significant increase in the carbon emission reduction level, thereby attracting more consumers. When consumers have a high level of trust, the effect of blockchain is dwarfed by that of carbon abatement.
Theorem 3.
- (1)
- The profit comparisons for a manufacturer investing in a blockchain platform under three different coalition structures are as follows:
- (i)
- If consumers’ green trust level is low (), ;
- (ii)
- If consumers’ green trust level is intermediate (), ;
- (iii)
- If consumers’ green trust level is high (), ;
- (iv)
- If consumers’ green trust level is very high (), .
- (2)
- The profit comparisons for the manufacturer who rents the blockchain platform and the manufacturer who does not apply the blockchain platform under three different coalition structures are:
- (i)
- If consumers’ green trust level is intermediate (), is the largest, is the smallest;
- (ii)
- If consumers’ green trust level is high (), and are the largest simultaneously, is the smallest;
- (iii)
- If consumers’ green trust level is higher (), and are the largest simultaneously, and are the smallest simultaneously;
- (iv)
- If consumers’ green trust level is very high (), is the largest, is the smallest.
According to Theorem 3 (1), the builder earns the highest profit from standalone blockchain adoption when consumers’ green trust is low. Any incoming participant reduces the builder’s earnings, and the full three-firm blockchain coalition brings the builder the lowest profit. Although new entrants generate rental revenue for the platform owner, these rental proceeds reduce the builder’s abatement incentive and further dampen market demand. Given low consumers’ green trust, the resulting profit loss from weakened abatement efforts outweighs rental gains, hence dragging down the builder’s total profitability.
At moderate green trust, the platform builder maximizes profit under the two-firm coalition but gains the least from the full three-firm coalition. As green trust rises further, standalone operation becomes the least profitable option for the builder. Moderate green trust weakens blockchain’s marginal demand-enhancing effect. In this context, rental income from a single tenant can fully offset profit losses stemming from lower abatement efforts. By contrast, recruiting two renters triggers an even sharper drop in the builder’s emission reduction input, and the resultant revenue decline surpasses total rental proceeds.
When green trust is high, the full three-manufacturer coalition becomes the most profitable choice for the platform builder, whereas standalone deployment turns out the least lucrative. Rising green trust diminishes blockchain’s demand-boosting effect, making rental income the dominant profit source for the builder; accordingly, more paying tenants translate into higher platform earnings.
According to Theorem 3 (2), for manufacturers renting blockchain access, under low green trust, the renter within the two-firm coalition earns superior profit, while the outsider without blockchain adoption obtains the lowest return. At moderate green trust, both manufacturers achieve their peak profits by opting out of blockchain entirely. When green trust reaches a high level, the non-blockchain outsider in the two-firm coalition secures the highest profit, and the coalition’s renting manufacturer suffers the lowest profitability due to rental expenses. Low green trust enables blockchain-verified abatement to boost the renter’s demand; as trust rises, blockchain loses its information advantage, and rental fees become an unnecessary cost burden. Consequently, staying outside the blockchain system becomes more profitable for manufacturers. Potential tenants can choose to join blockchain alliances only when consumers’ green trust is low and refrain from signing rental agreements when market green trust is sufficiently high. The platform builder should make admission decisions based on the prevailing level of consumers’ green trust to ensure the long-term operation of the platform. Otherwise, the platform builder suffers significant operational loss.
Based on the above results, the transition process across different coalition structures based on changing consumers’ green trust and blockchain construction costs is elaborated on below.
When both consumers’ green trust and blockchain fixed costs are at low levels, manufacturer 1 gains the greatest profit by operating the blockchain platform alone. Any application for access from other manufacturers would erode its earnings. Therefore, manufacturer 1 will decline external participation, and manufacturers 2 and 3 will choose to remain independent.
As consumers’ green trust rises moderately, blockchain’s demand-enhancing effect gradually strengthens. Rental income from a single partner can offset the profit loss caused by increased abatement costs. At this stage, manufacturer 1 agrees to accept one manufacturer to form a two-firm coalition. The remaining outsider finds joining unprofitable, so the coalition stabilizes as a two-party form.
With a further increase in green trust, the marginal benefit of blockchain adoption for individual firms keeps growing. The total rental fees collected from two participants can fully cover platform construction and operation costs. All three manufacturers reach a consensus on joining the blockchain platform, and the coalition evolves into a grand coalition structure and maintains stability.
When consumers’ green trust reaches a very high level, consumers fully recognize corporate carbon abatement performance without blockchain certification. Blockchain adoption becomes a cost burden rather than a competitive advantage for follower manufacturers. They voluntarily exit the coalition, and the system reverts to the initial standalone structure led by manufacturer 1.
6. Analysis of Farsighted Stable Coaliton Structure
Theorem 3 compares profits between the blockchain platform builder and peer manufacturers across three blockchain-based coalition structures under heterogeneous green trust levels. Cross-group profit disparities are largely shaped by blockchain infrastructure fixed costs. To unpack how blockchain construction expenses and varying levels of consumers’ green trust jointly determine alliance outcomes, we employ the Largest Consistent Set (LCS) developed by [46] to identify farsighted manufacturers’ stable coalition structures.
As a pivotal criterion for farsighted coalition stability, the LCS differs fundamentally from the myopic Nash stability concept in conventional game theory. The LCS framework assumes all agents possess perfect foresight: each firm can anticipate subsequent coalition restructurings triggered by its immediate deviation and evaluate the resulting long-run payoff accordingly before deciding whether or not to defect from the prevailing alliance arrangement. Notably, even when a unilateral deviation generates immediate short-run gains, rational farsighted manufacturers will refrain from exiting existing cooperation if they foresee cascading countermoves that erode their ultimate profitability.
In practical operation, farsighted manufacturers establish a systematic approach to predict coalition evolution. They continuously monitor three core operational indicators: consumers’ dynamic green trust level, the realized fixed costs of blockchain platform operation, and each firm’s carbon abatement input. Drawing on mature blockchain alliance cases in the industry, manufacturers can effectively anticipate rivals’ potential behaviors, including applications to rent the platform, quitting the coalition or adjusting carbon reduction strategies.
For long-term stable cooperation, participants rely on long-term fixed rental contracts as the basic coordination mechanism. All firms abandon short-term opportunistic behaviors and take long-term overall profits as the decision criterion. They communicate and align operational strategies in advance to prevent unilateral deviation that may trigger the collapse of the alliance. This forecasting mode and coordination mechanism is highly consistent with the farsighted decision logic of the LCS framework in this paper.
This paper adopts the Largest Consistent Set (LCS) concept for farsighted stability analysis. We compare LCS with three widely used stability concepts for coalition analysis: Nash stability, pairwise stability and core stability. Nash stability, pairwise stability and core stability are typical myopic stability theories. Their judgments are based solely on instantaneous profits, without considering the chain reaction of strategic changes after a member’s deviation. In contrast, LCS is a farsighted stability framework. Decision-makers can predict the long-term results of all possible deviations and make decisions based on overall long-term benefits. Nash stability only assesses unilateral deviation and cannot analyze joint deviation or the formation of a full three-firm coalition. Pairwise stability is only applicable to bilateral relationships and cannot evaluate a three-firm grand coalition. Core stability permits any subset of members to split from the coalition, but its evaluation standard is still limited to instant profits. The LCS framework covers all deviation paths, including individual exit, bilateral split and full coalition dissolution. It also incorporates subsequent counter-deviations triggered by initial actions, which is more consistent with actual long-term strategic interactions of manufacturers in blockchain rental alliances.
Building on the LCS definition and the cross-coalition profit outcomes derived in Theorem 3, we formally derive Theorem 4.
Theorem 4.
The stable coalition structure under different consumers’ green trust levels
- (1)
- If consumers’ green trust level is low (), when blockchain fixed cost within range (), the farsighted stable is ; otherwise, there would be no stable structure of the coalition.
- (2)
- If consumers’ green trust level is intermediate (), when blockchain fixed cost within range (), the farsighted stable structure is ; otherwise, there would be no stable structure of the coalition.
- (3)
- If consumers’ green trust level is high (), when blockchain fixed cost within range (), the farsighted stable structure is ; otherwise, there would be no stable structure of the coalition.
- (4)
- If consumers’ green trust level is higher (), when blockchain fixed cost within range (), the farsighted stable structure is ; otherwise, there would be no stable structure of the coalition.
The proof of the stable coalition structure and the value range of blockchain investment costs are presented in the Appendix B.
Theorem 4 (1) shows that when consumers’ green trust level is low, the structure is farsightedly stable for manufacturers to operate independently while manufacturer 1 applies blockchain alone. This is because, compared with cooperative coalitions under low green trust and low blockchain construction cost conditions, manufacturer 1 achieves the highest profit through standalone blockchain adoption. The participation of other manufacturers decreases manufacturer 1’s profit. When the fixed cost of building a blockchain platform is high, non-blockchain manufacturers gain higher profits. Therefore, the manufacturer has no incentive to develop a blockchain platform, and no stable coalition structure exists.
Theorem 4 (2) and (3) indicate that blockchain cooperative coalitions achieve farsighted stability under moderate green trust, primarily because cooperative rental income substantially improves overall economic benefits. Manufacturers are willing to form coalitions to alleviate individual cost burdens by sharing blockchain deployment expenses. At a moderately low green trust level, the two-manufacturer blockchain coalition is farsightedly stable. In this context, consumers strongly perceive and trust the carbon credibility of blockchain-adopting manufacturers, yielding higher profits for these manufacturers. If the external manufacturer 3 joins to form a grand three-firm coalition, the existing two coalition members’ profits will decline. As a result, manufacturer 3 is refused access to the coalition. By contrast, when green trust rises to a moderately high level, the full three-manufacturer grand coalition becomes the farsighted stable structure and achieves a win-win outcome.
Theorem 4 (4) demonstrates that the standalone structure regains farsighted-stable status when green trust is sufficiently high. Because consumers intrinsically trust corporate carbon abatement performance, the demand-enhancing effect of blockchain adoption is substantially weakened, making blockchain adoption less profitable than non-adoption for follower manufacturers. Therefore, manufacturers 2 and 3 prefer to opt out of blockchain coalition, and the equilibrium returns to the scenario where only manufacturer 1 independently operates the blockchain platform.
The stable structures under different scenarios are illustrated from Figure 2a. Region I stands for the stable range for the standalone structure. Results show that when consumers’ green trust and blockchain construction costs remain low, standalone operation—with only manufacturer 1 adopting blockchain while its peers stay independent—emerges as a farsightedly stable configuration relative to cooperative coalitions. Region C stands for the stable range for the two-firm coalition. Under moderately low green trust and medium cost levels, the two-manufacturer blockchain coalition achieves farsighted stability, while neither standalone operation nor grand coalition can sustain long-term stability. Region G stands for the stable range for the full three-firm coalition. When green trust rises to a moderately high level, the grand coalition covering all three manufacturers becomes the only stable structure. Cost sharing and blockchain-enabled value creation jointly benefit all participants. The unstable region stands for the area with no feasible stable coalition. When blockchain construction costs are excessively high, no coalition structure can maintain stability, and manufacturers have no incentive to invest in blockchain adoption.
Figure 2.
Comparative analysis of different stable coalition structures. The figure is generated based on the following values: = 5, = 0.02, h = 0.04, p = 0.5. Note: The graph divides the parameter space into four regions corresponding to single-firm structure, two-firm coalition, full three-firm coalition and unstable status respectively. Each region indicates the long-term stable operational mode of manufacturers.
Figure 2b indicates that as consumers low-carbon sensitivity rises, Region I expands and the relevant threshold shifts to higher values. This implies a growing likelihood that the standalone structure where manufacturer 1 exclusively relies on blockchain and the other two manufacturers remain independent achieves farsighted stability. The feasible stable region of standalone structure I expands notably along the entire k axis, and all critical cost thresholds increase. A larger means consumers are more responsive to verified low-carbon products, which amplifies the exclusive competitive edge of the sole blockchain developer. The parameter region yielding no feasible stable coalition shrinks, because heightened consumer sensitivity lifts blockchain investment returns and reduces the chance of terminating platform development owing to prohibitive fixed cost . The valid parameter range for the two-firm C coalition moves toward higher k, whereas the feasible scope of the full coalition G moderately narrows. When consumers exhibit strong sensitivity to abatement outcomes, manufacturers favor a monopolistic standalone blockchain arrangement over grand coalition cooperation. Overall, rising raises the stability probability of the single-firm independent blockchain structure, which aligns with the core theoretical outcomes derived from Theorem 4.
Based on the regional classification above, we further illustrate the farsighted stability mechanism by focusing on Region C, where green trust is moderately low and blockchain costs are at a medium level. The current stable structure consists of manufacturer 1 and manufacturer 2 forming a blockchain coalition, while manufacturer 3 operates independently outside the alliance. From a myopic perspective, manufacturer 3 intends to apply for blockchain access to gain immediate competitive advantages. However, all firms adopt farsighted thinking, fully predicting the complete chain of subsequent reactions and assuming rivals will take the possible actions. If manufacturer 3 successfully joins and forms a full three-firm coalition, profit dilution inevitably occurs. Manufacturer 1 may drastically cut carbon abatement investment to control costs. This will damage the low-carbon credibility of products, reduce green trust, and shrink overall market demand. Meanwhile, manufacturer 2 may launch fierce competition to defend its market share, further depressing industry profits. Following this chain of reactions, manufacturer 3’s final payoff will be far lower than that of staying outside the coalition. Manufacturer 1 also foresees this adverse chain of reactions in advance. It recognizes that admitting a new member may trigger a series of negative changes and erode its long-term revenue. For this reason, manufacturer 1 firmly rejects manufacturer 3’s application. After evaluating the entire deviation path and its outcomes, no participant is willing to break the current state. Consequently, the two-firm coalition in Region C maintains its farsighted stability and will not transition to other structures.
7. Numerical Analysis
In this section, we provide numerical examples to validate Theorems 1–3 and analyze how carbon emission reduction sensitivity coefficient affects manufacturers’ carbon reduction levels, profits, consumer surplus and social welfare. In light of extant literature [15,16,47], the parameters used in our analysis are as follows: the basic market demand is set to 5, the unit cost of implementing the blockchain technology platform is 0.02, the cost coefficient for carbon emission reduction h is 0.04, the fixed investment and construction cost of applying blockchain technology is 1, the unit rent for applying the blockchain platform t is 0.03, and the profit per unit product p is 0.5. All values are normalized dimensionless values, which is a standard practice in relevant research to simplify calculations and highlight core relationships. Meanwhile, these settings fully satisfy the boundary conditions of our theoretical model and conform to actual operational practices of manufacturing enterprises launching blockchain traceability platforms.
7.1. Impact of Consumers’ Green Trust Level
Assume that carbon emission reduction sensitivity coefficient is 0.4 and that consumers’ green trust level k ranges from 0 to 1. The impact of consumers’ green trust on manufacturers’ profits, carbon emission reduction levels, consumer surplus and social welfare are illustrated in the following figures.
As shown in Figure 3, for the blockchain platform builder, low green trust yields the highest profit under the standalone blockchain adoption structure. As green trust increases, profits decline gradually for both standalone and cooperative blockchain deployment modes. When green trust is sufficiently high, standalone blockchain adoption generates the lowest profit for the builder. According to Figure 4, for blockchain-renting manufacturers, the two-firm coalition structure yields the optimal profit for renters. As green trust rises, the earnings of blockchain-adopting manufacturers decrease progressively, while the profits of non-adopting manufacturers grow steadily. Correspondingly, non-adopting manufacturers achieve the highest profitability under relatively high green trust. This is because widespread green trust in corporate carbon abatement weakens consumers’ marginal recognition of blockchain value. The economic benefits brought by blockchain adoption fail to offset the corresponding platform construction or rental costs. Consequently, the profits of blockchain-adopting manufacturers gradually decline, whereas those of non-adopting manufacturers increase. Compared with renting manufacturers, blockchain investors suffer more pronounced profit fluctuations from green trust changes. The platform builder should set rental fees prudently. Even slight rent hikes will lead to the loss of cooperative partners, so raising fees is inadvisable for extra revenue. A moderate rise in platform rent only slightly reduces the profit of the platform builder, but significantly suppresses the willingness of potential members to join the coalition. The coalition scale shrinks rapidly with a rent increase, exhibiting obvious asymmetric sensitivity to rental adjustments.
Figure 3.
Manufacturer 1 profits comparison under different models at different consumers’ green trust levels. The figure is generated based on the following values: = 1, = 5, = 0.02, h = 0.04, p = 0.5.
Figure 4.
Manufacturers 2 and 3 profits comparison under different models at different consumers’ green trust levels. The figure is generated based on the following values: = 1, = 5, = 0.02, h = 0.04, p = 0.5.
Figure 5 shows the evolution of consumer surplus under three coalition structures with varying green trust levels. When green trust is low, the full blockchain adoption coalition structure yield the highest consumer surplus. When green trust is high, standalone blockchain adoption by the platform investor generates the highest consumer surplus. As illustrated in Figure 6, social welfare follows a trend consistent with consumer surplus across the three coalition models under varying green trust levels, although with different critical thresholds.
Figure 5.
Consumer surplus comparison under different models at different consumers’ green trust levels. The figure is generated based on the following values: = 1, = 5, = 0.02, h = 0.04, p = 0.5.
Figure 6.
Social welfare comparison under different models at different consumers’ green trust levels. The figure is generated based on the following values: = 1, = 5, = 0.02, h = 0.04, p = 0.5.
This is because full blockchain adoption provides consumers with transparent and traceable carbon abatement information, effectively eliminating consumer skepticism and enhancing both consumer utility and corporate profits. When consumers hold sufficient green trust, excessive participation increases blockchain rental costs for manufacturing firms. These incremental costs can be partially passed on to consumers. Accordingly, consumer surplus and social welfare are maximized only under the single-firm blockchain investment structure. Regulators can implement carbon subsidies and preferential carbon quotas to encourage manufacturers to jointly deploy blockchain and form large-scale alliances, to boost overall carbon reduction performance. When green trust reaches a high level, the single-firm structure yields the optimal social welfare. In this case, excessive incentives for alliance formation should be avoided, to prevent the intensification of industry competition and a decline in overall decarbonization efficiency.
Combining Theorem 4 with Figure 5 and Figure 6, although the full coalition structure can maximize consumer surplus and social welfare at low green trust, the corresponding coalition structure is not farsightedly stable. This finding demonstrates that the farsighted stability of a coalition structure is not equivalent to the optimality of consumer surplus or social welfare. Environmental departments cannot merely rely on market self-regulation. When stable alliances deviate from the social optimum, targeted carbon tax adjustments can be used to guide manufacturers in adjusting their coalition strategies, thereby balancing corporate profits, consumer interests, and environmental goals.
7.2. Impact of Carbon Emission Reduction Sensitivity Coefficient
Assume that green trust k is 0.2 and that carbon emission reduction sensitivity ranges from 0 to 0.7. Figure 7, Figure 8, Figure 9, Figure 10 and Figure 11 depict the impact of carbon emission reduction sensitivity on manufacturers’ profits, carbon emission reduction levels, consumer surplus and social welfare.
Figure 7.
Manufacturer 1 profits comparison under different models at different carbon emission reduction sensitivity coefficients. The figure is generated based on the following values: = 1, = 5, = 0.02, h = 0.04, p = 0.5.
Figure 8.
Manufacturers 2 and 3 profits comparison under different models at different carbon emission reduction sensitivity coefficients. The figure is generated based on the following values: = 1, = 5, = 0.02, h = 0.04, p = 0.5.
Figure 9.
Carbon emission reduction levels comparison under different models at different carbon emission reduction sensitivity coefficients. The figure is generated based on the following values: = 1, = 5, = 0.02, h = 0.04, p = 0.5.
Figure 10.
Consumer surplus comparison under different models at different carbon emission reduction sensitivity coefficients. The figure is generated based on the following values: = 1, = 5, = 0.02, h = 0.04, p = 0.5.
Figure 11.
Social welfare comparison under different models at different carbon emission reduction sensitivity coefficients. The figure is generated based on the following values: = 1, = 5, = 0.02, h = 0.04, p = 0.5.
As depicted in Figure 7 and Figure 8, as carbon emission reduction sensitivity increases, under both the standalone structure and the two-manufacturer blockchain coalition structure, the profits of blockchain-adopting manufacturers rise, while those of non-adopting manufacturers decline. When the three manufacturers form a full blockchain coalition, the profits of all coalition members decrease as increases. The decision to forgo blockchain adoption confers competitive advantages on manufacturers, enabling them to capture higher market share and greater profits. By contrast, non-adopting manufacturers lose market share and experience profit declines. When all manufacturers adopt blockchain, the demand-enhancing advantage brought by blockchain platforms disappears. As consumer low-carbon concerns intensify, industry competition among manufacturers becomes fiercer, resulting in a widespread decline in corporate profits. Under the I and C structures with partial blockchain non-adopters, rising empowers blockchain-adopting firms to gain market share through the dual advantages of traceability and carbon abatement, thereby boosting their profits while reducing the sales and earnings of external manufacturers. In the full G coalition, blockchain-based product differentiation vanishes; a higher intensifies industry-wide abatement competition and suppresses the profits of all coalition members. So when consumers have relatively high green trust, it is imperative for the blockchain builder to extend the function of blockchain infrastructure to avoid operational losses. At that time, renters may choose to withdraw from the blockchain coalition, so the builder may introduce a withdrawal fee to maintain the coalition. Policy makers can provide guidance for the builder to expand the scope of blockchain operations.
In Figure 9, we observe that with the increase in , the carbon abatement level rises for all manufacturers, while non-adopting manufacturers are least affected. Compared with manufacturers that invest in blockchain construction, blockchain-renting manufacturers experience weaker impacts. Increased motivates all manufacturers to expand emission reduction efforts. Rental-paying firms are constrained by rental costs and exhibit moderate growth in abatement, while non-blockchain enterprises show the weakest expansion in abatement. Policy makers may designate blockchain adopters as exemplary models to promote carbon emission reduction initiatives.
Figure 10 and Figure 11 illustrate that as increases, both consumer surplus and social welfare gradually rise and remain highest under the full blockchain adoption scenario. A higher stimulates consumers’ willingness to purchase low-carbon products. When is low, the government may conduct green-awareness enhancement programs to incentivize manufacturers to invest in low-carbon technology. Through government participation, manufacturers can maintain profit without bearing operational cost burdens. When is high, manufacturers can benefit from consumers’ active purchasing in low-carbon products without government intervention. By tailoring policy interventions to different market conditions, the government can maximize social welfare.
8. Conclusions
8.1. Main Findings
In this study, we examine the influence of green trust on manufacturers’ blockchain adoption strategies. One manufacturer constructs a blockchain platform, while other manufacturers obtain platform access by paying rental fees and cooperating with the platform builder. We investigate the formation of diverse blockchain coalition structures among three manufacturers competing through carbon abatement efforts. Our analysis explores the relationships of manufacturers’ abatement levels, product demand, and profits under different coalition structures. Furthermore, we explore the farsighted stability of these coalition structures and derive the following core conclusions.
Specifically, first, when the green trust level is low or higher, the standalone structure in which only one manufacturer adopts blockchain achieves farsighted stability. The two-manufacturer blockchain coalition becomes farsightedly stable under intermediate green trust. In contrast, the full three-manufacturer blockchain coalition is farsightedly stable when green trust is high. Second, compared with cooperative coalitions, the standalone structure where only manufacturer 1 adopts blockchain is more likely to realize farsighted stability, and the farsighted stability of this structure increases as green trust improves. Third, full blockchain adoption by all manufacturers maximizes consumer surplus and social welfare at a low green trust level. However, under relatively high green trust, the maximum consumer surplus and social welfare are achieved only when the platform investor independently adopts blockchain. Lastly, the optimality of consumer surplus and social welfare is not equivalent to the farsighted stability of coalition structures.
8.2. Managerial Insights
For blockchain platform managers, they should implement differentiated rental pricing based on primary benchmarks firstly. They should lift access rent and restrict coalition scale to exclusive standalone operation under low green trust to capitalize on the unique traceability advantage and avoid admitting extra participants to the alliance. Then, they should gradually cut platform rental fees and allow only one additional manufacturer to form a two-firm coalition at the medium trust level. When consumers’ green trust stays high, they should slash rental charges dramatically and actively promote the full three-firm alliance, shifting their core revenue source from product sales to platform rental income. Secondly, they can reduce one-time fixed setup expenditure via technological iteration, distributed node co-construction and centralized hardware procurement, which increases the critical thresholds for stable coalitions. Lower fixed costs enable the formation of feasible stable coalitions under varied trust scenarios and prevent platform abandonment driven by prohibitive initial investment outlays. Thirdly, managers should dynamically monitor market sensitivity to low-carbon abatement. They should raise platform rent when low-carbon sensitivity is high to capture additional returns stemming from the combined premium of traceability and emission reduction. When sensitivity is low, they should adopt a low-rent strategy to attract more participating manufacturers and reduce per-unit operating costs via scale economies.
For potential blockchain manufacturers, they should optimize blockchain enrollment decisions based on real-time consumer green trust. They can pay a rental fee to join a dual-firm coalition under low green trust, utilizing blockchain-enabled carbon traceability to build product differentiation and increase abatement efforts to occupy the green niche market. They can try to withdraw from blockchain entirely at high green trust, redirecting saved rental capital into emission reduction and green brand promotion to expand market share via inherent low-carbon credibility. They can also choose a industry-wide alliance flexibly at medium trust to share blockchain fixed investment collectively. Manufacturers should tailor abatement input to the specific coalition mode. By boosting abatement spending after joining a blockchain alliance under low green trust, they can maximize the on-chain information advantage, then they can reduce emission reduction investment when green trust surges and blockchain loses marginal value. For manufacturers staying outside the blockchain system, they can scale up their abatement efforts especially under a high green trust environment. They can propose to sign flexible temporary cooperation contracts and pre-negotiate adjustable rental clauses tied to floating green trust to mitigate profit volatility caused by abrupt coalition restructuring triggered by changes in consumers’ green trust.
For policymakers and industrial regulators, they can offer supportive policies for blockchain-enabled low-carbon traceability firstly. They can offer a financial subsidy to pioneering manufacturers developing proprietary blockchain platforms in regions with low green trust to lower investment costs, cultivate public green consumption awareness and help small- and medium-sized manufacturers access the traceability system at low cost. They can reduce targeted blockchain subsidies in high-trust regions and shift policy focus to unified industry low-carbon standards to prevent blind blockchain investment and resource waste. They can also issue official carbon-label regulations to address the vulnerability of easily tampered traditional carbon disclosure and strengthen consumer reliance on on-chain verified carbon data. Secondly, they can boost public green consumption and guide rational industry alliances. They can launch nationwide low-carbon publicity campaigns to raise overall green trust. By introducing preferential industrial policies at medium green trust, they can incentivize dual or full coalition formation for balancing corporate profitability and industrial decarbonization. Thirdly, regulators can adjust regulatory policies based on abatement sensitivity. They can introduce combined abatement subsidies and blockchain incentive when regional low-carbon sensitivity is high to accelerate full supply-chain blockchain adoption for optimal social and environmental benefits. They can prioritize emission-reduction upgrading subsidies instead of mandatory blockchain adoption under a low carbon sensitivity level.
From the perspective of environmental protection, it is necessary to promote phased industrial emission reductions by utilizing differentiated stable coalitions. Regulators can support standalone blockchain adoption of leading manufacturers when green trust is low. Immutable on-chain carbon data pushes flagship enterprises to increase emission cuts and set industrial decarbonization benchmarks. By accelerating a industry-wide blockchain alliance at medium-high green trust, it becomes feasible to achieve full-process carbon tracking and comprehensive emission monitoring across the whole manufacturing sector. They can realize fine-grained carbon regulation with blockchain traceable data. Tamper-proof on-chain carbon footprint data provides accurate fundamental data for environmental authorities to formulate carbon taxation and cap-and-trade policies, facilitating precise industrial carbon accounting and control. Rising green trust drives spontaneous corporate abatement expansion and accelerates regional carbon neutrality roadmap implementation. They should balance corporate commercial interests and optimal environmental outcomes. In scenarios where a farsightedly stable coalition deviates from maximum social welfare and environmental optimum, environmental regulators should deploy targeted abatement subsidy or preferential carbon quota to guide manufacturers to abandon myopic profit-seeking behavior and form a full blockchain alliance for enhanced environmental performance.
8.3. Limitations
This paper establishes a baseline model based on symmetric manufacturers and single-tier production scenarios, while real-world blockchain cooperation is more complex. First, manufacturers are usually heterogeneous in production scale, abatement cost and bargaining power. Second, blockchain collaboration often spans multi-tier supply chains and is restricted by industrial regulations, data-sharing agreements and system interoperability. Third, asymmetric bargaining power among participants will also affect rental pricing and coalition formation rules. In follow-up research, we will conduct further research on heterogeneous firms and multi-tier supply chains, and further discuss the impact of regulatory policies and bargaining power on blockchain coalition stability. It is necessary to note that although blockchain adoption can effectively enhance consumers’ green trust, it cannot reach a state of absolute perfect trust in which the trust coefficient equals one in real-world practice. This paper does not address the impact of product price competition on manufacturers’ abatement strategies and blockchain cooperative coalitions. Future research will explore the effects of price competition on consumer demand. Another limitation is that this paper limits the model to three manufacturers. Although the core evolutionary rules are generalizable, specific equilibrium results and critical thresholds cannot be directly extended to coalitions with more participants. In future research, we will expand the model to an N-firm framework, explore the impact of coalition size on stable structures, and further verify the relevant conclusions.
Author Contributions
Conceptualization, D.X.; methodology, D.X.; software, J.Z. and Y.Z.; validation, Y.Z.; formal analysis, Y.Z.; investigation, X.J.; resources, Y.Z.; data curation, Y.Z.; writing—original draft preparation, X.J.; writing—review and editing, D.X. and H.D.; visualization, Y.Z.; supervision, H.D.; project administration, D.X.; funding acquisition, D.X. All authors have read and agreed to the published version of the manuscript.
Funding
This research was funded by the National Natural Science Foundation of China grant number 71802064, the Ministry of Education of Humanities and Social Sciences project grant number 23YJC630196, 25YJA630035, the Youth Project of Philosophy and Social Sciences Planning of Guangdong Province of China grant number GD23YGL25, Guangzhou Basic and Applied Basic Research Foundation grant number 2024A04J3463, and Guangdong Province Philosophy and Social Science Planning Project grant number GD26YSG20.
Data Availability Statement
The original contributions presented in this study are included in the article. Further inquiries can be directed to the corresponding author.
Conflicts of Interest
The authors declare no conflicts of interest.
Appendix A. Equilibrium Results
Table A1.
Optimal decisions and performances under Model I, C and G.
As social welfare is the combination of manufacturers profits and consumers surplus, we omit it for simplicity. Note: We assume that max min to ensure non-negative carbon emission reduction level and feasible demands.
Table A2.
Notations of thresholds.
Appendix B. Proofs
The Proof of Model I equilibrium.
Substituting into Equations (7) and (8) yields the profit function with respect to e. Since , the function is concave. Setting , we can obtain the carbon reduction levels of manufacturer 1 when applying the blockchain platform and manufacturers 2 and 3 when not applying the blockchain platform. For example, by setting , we can have . Similarly, by setting , we have . Substituting into the demand and profit functions of the three manufacturers, we can obtain the demands and profits of three manufacturers. □
The Proof of Model C equilibrium.
The proof is similar to the proof of Model I, so we omit that. □
The Proof of Model G equilibrium.
The proof is similar to the proof of Model I, so we omit that. □
The Proof of Theorem 1.
- (1)
- , so when , ; otherwise, ., so ., so when , ., so when , .In sum, when , ; when , ; when , ., so .
- (2)
- , so . , so . Combining the results, ., so when , ., so when , .□
The Proof of Theorem 2.
The proof is similar to the proof of Theorem 1, so we omit that. □
The Proof of Theorem 3.
- (1)
- From , we can see the difference is the quadratic form of k with no linear term, so we can have when ; when .
- (2)
- From , we can see the difference is the quadratic form of k with no linear term, so we can have when ; when .
- (3)
- From , we can see the difference is the quadratic form of k, so we can have when ; when .
- (4)
- From , we can see the difference is the quadratic form of k, so we can have when ; when .
- (5)
- From , we can see the difference is the quadratic form of k, so we can have when ; when .
- (6)
- From , we can see the difference is the quadratic form of k, so we can have when ; when .
- (7)
- From , we can see the difference is the quadratic form of k, so we can have when ; when .
- (8)
- From , we can see the difference is the quadratic form of k, so we can have when ; when .
- (9)
- From , we can see the difference is the quadratic form of k, so we can have when ; when .
Summarizing the above leads to Theorem 3. □
The Proof of Theorem 4.
- (1)
- When : if , i.e., when , the farsighted stable structure of coalition is . The result of is deprived because the difference of and is the linear form of .If , i.e., when , the farsighted stable structure of coalition is .If , i.e., when , the farsighted stable structure of coalition is .If , i.e., when , manufacturer 1 will not build the blockchain platform.Summing up, in the case of , when matches the below constriction , the farsighted stable structure of coalition is ; otherwise, manufacturer 1 will not build the blockchain platform.
- (2)
- When : if , i.e., when , the farsighted stable structure of coalition is .If , i.e., when , manufacturer 1 will not build the blockchain platform.
- (3)
- When : if , i.e., when , the farsighted stable structure of coalition is .If , i.e., when , manufacturer 1 will not build the blockchain platform.
- (4)
- When : if , i.e., when , the farsighted stable structure of coalition is .When , i.e., when , the farsighted stable structure of coalition is .If , i.e., when , manufacturer 1 will not build the blockchain platform.
- (5)
- When : if , i.e., when , the farsighted stable structure of coalition is .If , i.e., when , the farsighted stable structure of coalition is .If , i.e., when , the farsighted stable structure of coalition is .If , i.e., when , manufacturer 1 will not build the blockchain platform.
- (6)
- When : if , i.e., when , the farsighted stable structure of coalition is: .If , i.e., when , the farsighted stable structure of coalition is .If , i.e., when , the farsighted stable structure of coalition is .If , i.e., when , manufacturer 1 will not build the blockchain platform.
- (7)
- When : if , i.e., when , the farsighted stable structure of coalition is: .When , i.e., when , the farsighted stable structure of coalition is .If , i.e., when , the farsighted stable structure of coalition is .If , i.e., , the farsighted stable structure of coalition is .When , i.e., when , manufacturer 1 will not build the blockchain platform.
- (8)
- When : if , i.e., when , the farsighted stable structure of coalition is .If , i.e., when , the farsighted stable structure of coalition is .If , i.e., when , the farsighted stable structure of coalition is .If , i.e., when , manufacturer 1 will not build the blockchain platform.
- (9)
- When : if , i.e., when , the farsighted stable structure of coalition is .If , i.e., when , the farsighted stable structure of coalition is .If , , the farsighted stable structure of coalition is .If , i.e., when , manufacturer 1 will not build the blockchain platform.□
References
- Accenture. Accenture Chinese Consumer Insights 2022. 2022. Available online: https://www.accenture.com/cn-en/insights/consulting/2022-china-consumer-insight-overarching (accessed on 14 July 2023).
- TanPaiFang. In-Depth Analysis of the International Carbon Labeling System Measures System How How to Establish. 2012. Available online: http://www.tanpaifang.com/tanbiaoqian/2012/0327/589.html (accessed on 29 May 2025).
- CarbonLabel. Carbon Labeling Empowers the Electrical and Electronics Industry to Lead a Green and Low-Carbon Transition. 2023. Available online: https://baijiahao.baidu.com/s?id=1768638816006404979&wfr=spider&for=pc (accessed on 29 May 2025).
- Silvan, T. Switzerland Strengthens Fintech and Blockchain Sector. 2020. Available online: https://www.pwc.ch/en/insights/fs/amending-act-DLT-blockchain.html (accessed on 29 May 2025).
- CAC. Guiding Opinions on Accelerating the Promotion of Blockchain Technology Application and Industrial Development. 2021. Available online: http://www.cac.gov.cn/2021-06/07/c_1624629407537785.htm?ivk_sa=1024320u&wd=&eqid=f3de63bc00024e2c00000006642cdfd6 (accessed on 29 April 2023).
- NIST. NIST Releases NISTIR 8419 to Help Organizations Improve Traceability in Manufacturing Supply Chains. 2022. Available online: https://csrc.nist.gov/news/2022/nist-releases-nistir-8419 (accessed on 12 April 2024).
- Naoum-Sawaya, J.; Elhedhli, S.; De Carvalho, P. Strategic blockchain adoption to deter deceptive counterfeiters. Eur. J. Oper. Res. 2023, 311, 373–386. [Google Scholar] [CrossRef] [Scilit]
- Wu, J.; Yao, J.; Wang, Y. Platform’s role in green vs. non-green product competition: Blockchain transparency and selling contract selection. Int. J. Prod. Econ. 2025, 288, 109703. [Google Scholar] [CrossRef] [Scilit]
- Ying, H.; Peng, X.; Zhao, X.; Chen, Z. The Effects of Signaling Blockchain-Based Track and Trace on Consumer Purchases: Insights From a Quasi-Natural Experiment. Prod. Oper. Manag. 2025, 34, 3735–3754. [Google Scholar] [CrossRef] [Scilit]
- Pattanayak, S.; Ramkumar, M.; Goswami, M. Blockchain technology and supply chain performance: The role of trust and relational capabilities. Int. J. Prod. Econ. 2024, 271, 109198. [Google Scholar] [CrossRef] [Scilit]
- Xu, X.P.; Chen, J.H.; Liu, S.; Yu, Y.G.; Cheng, T.C.E. Should a manufacturer adopt blockchain when its competitor discloses blockchain-enabled product quality information? Int. J. Prod. Res. 2025, 63, 5217–5237. [Google Scholar] [CrossRef] [Scilit]
- Li, Z.X.; Liu, A.J.; Li, J.X.; Xiong, J.M.; Lu, H. Manufacturer encroachment strategies and decision timing considering the product traceability preferences under e-commerce. Manag. Decis. Econ. 2023, 44, 4041–4067. [Google Scholar] [CrossRef] [Scilit]
- Yu, L.Y.; Yang, M.Z.; Zhang, Z.Y. Introducing blockchain into low-carbon e-commerce supply chains: A differential game analysis in monopoly and oligopoly markets. Int. J. Prod. Res. 2025, 63, 5263–5291. [Google Scholar] [CrossRef] [Scilit]
- Feng, Z.W.; Luo, N.; Shalpegin, T.; Cui, H. The influence of carbon emission reduction instruments on blockchain technology adoption in recycling batteries of the new energy vehicles. Int. J. Prod. Res. 2024, 62, 891–908. [Google Scholar] [CrossRef] [Scilit]
- Wang, T.; Chang, S.; Hu, G.; Shi, V. Supply chain structure and blockchain deployment strategies in competing supply chains. Int. J. Prod. Econ. 2026, 294, 109892. [Google Scholar] [CrossRef] [Scilit]
- Ci, L.; Zhang, L.; Wu, Y.; Wiwatanapataphee, B. Coordination of supply chain contracts on blockchain platforms. Int. J. Prod. Econ. 2026, 293, 109908. [Google Scholar] [CrossRef] [Scilit]
- Luo, P.; Lu, T.; Song, D. Strategic capacity investment and optimal subsidies with carbon emission reduction. Eur. J. Oper. Res. 2026, 333, 917–930. [Google Scholar] [CrossRef] [Scilit]
- Niu, B.Z.; Zhang, N.; Xie, F.F.; Zhang, H.L. Optimisation of carbon emission reduction in a competitive market with varying saturation and eco-conscious consumers. Int. J. Prod. Res. 2024, 62, 6518–6541. [Google Scholar] [CrossRef] [Scilit]
- Sun, H.; Wang, Z.; Yan, K.; Cheng, T.C.E.; Hua, G. How to arrange production and carbon emissions reduction? Thoughts towards remanufacturing authorization, risk aversion and carbon cap-and-trade. Int. J. Prod. Econ. 2025, 288, 109702. [Google Scholar] [CrossRef] [Scilit]
- Lyu, C.; Liu, S. Dual-fairness optimization for supply chain profit and emissions reduction distribution under carbon cap-sharing mechanism. Int. J. Prod. Econ. 2026, 294, 109809. [Google Scholar] [CrossRef] [Scilit]
- Sarabi, M.A.; Taleizadeh, A.A.; Bhattacharya, A. Towards blockchain-enabled circular closed-loop supply chain and impact of consumers’ distrust in price, product greenness sensitivity and carbon tax and subsidy. Eur. J. Oper. Res. 2026, 328, 105–121. [Google Scholar] [CrossRef] [Scilit]
- Liu, Z.; Yang, T.; Hu, B.; Shi, L. The Application of Blockchain Technology in Fresh Food Supply Chains: A Game-Theoretical Analysis Under Carbon Cap-and-Trade Policy and Consumer Dual Preferences. Systems 2025, 13, 737. [Google Scholar] [CrossRef] [Scilit]
- Li, X.; Jiang, B.; Bai, Y. Manufacturers’ decision making on emission reduction based on blockchain technology-analysis under the government’s carbon cap-and-trade policy. J. Clean. Prod. 2025, 499, 145224. [Google Scholar] [CrossRef] [Scilit]
- Tian, Y.; Bai, C. Blockchain Adoption in the Low-Carbon Supply Chain: A Comparative Analysis of Different Adoption Modes. IEEE Trans. Eng. Manag. 2025, 72, 1559–1575. [Google Scholar] [CrossRef] [Scilit]
- Lu, Q.; Liao, C.; Shi, V.; Xu, Z. Implementation mode selection for blockchain technology in green product traceability. Int. J. Prod. Econ. 2024, 276, 109372. [Google Scholar] [CrossRef] [Scilit]
- Lv, Y.; Bi, X. How blockchain technology combats greenwashing: A game in a low-carbon preference market. Comput. Ind. Eng. 2025, 209, 111562. [Google Scholar] [CrossRef] [Scilit]
- Hu, B.Y.; Ren, F.X.; Chen, X.; Meng, C. Blockchain adoption for promoting carbon emission reduction in relation to social comparison and competition. Omega-Int. J. Manag. Sci. 2026, 141, 103487. [Google Scholar] [CrossRef] [Scilit]
- Jing, H.; Chen, X. Competition and capacity sharing strategies in supply chain with scale economies. Int. J. Prod. Econ. 2026, 292, 109834. [Google Scholar] [CrossRef] [Scilit]
- Wang, X.; Xiao, Y.; Dou, Y. Reselling or hosting? Examining platform’s co-opetition strategy with third-party sellers. Int. J. Prod. Econ. 2025, 282, 109520. [Google Scholar] [CrossRef] [Scilit]
- Cai, R.; Li, G.; Cheng, T.C.E. The economics of capacity-sharing platform openness: Competition and cooperation among asymmetric firms. Int. J. Prod. Econ. 2026, 293, 109904. [Google Scholar] [CrossRef] [Scilit]
- Zheng, X.X.; Li, R.; Jia, F.; Liu, Z.Y.; Yang, Y. Coopetition strategies in a two-stage, multi-agent supply chain under hybrid carbon trading mechanisms. Int. J. Prod. Res. 2024, 63, 8155–8177. [Google Scholar] [CrossRef] [Scilit]
- Xiao, D.; Zhou, Y.W.; Zhong, Y.G.; Xie, W. Optimal cooperative advertising and ordering policies for a two-echelon supply chain. Comput. Ind. Eng. 2019, 127, 511–519. [Google Scholar] [CrossRef] [Scilit]
- Ma, J.; Bao, B.; Liu, L.; Wang, X.Y. Dynamic game evolution complexity of new energy and fuel vehicle manufacturers under carbon cap-and-trade policy. Manag. Decis. Econ. 2024, 45, 2566–2590. [Google Scholar] [CrossRef] [Scilit]
- Liu, W.; Han, H.; Hou, P.; Li, H.M. To collaborate or not? Analysis of competitive manufacturers’ green innovation strategy toward sustainability. Manag. Decis. Econ. 2024, 45, 2210–2227. [Google Scholar] [CrossRef] [Scilit]
- Li, C.W.; Cao, B.; Zhou, Y.W.; Cheng, T.C.E. Pricing, coalition stability, and profit allocation in the pull assembly supply chains under competition. OR Spectr. 2023, 45, 977–1011. [Google Scholar] [CrossRef] [Scilit]
- Choi, T.M.; Feng, L.P.; Li, R. Information disclosure structure in supply chains with rental service platforms in the blockchain technology era. Int. J. Prod. Econ. 2020, 221, 107473. [Google Scholar] [CrossRef] [Scilit]
- Hsieh, C.C.; Wu, C.Y.; Lathifah, A. Cross-channel influence of blockchain technology on green supply chains under asymmetric retail platform competition. Int. J. Prod. Econ. 2025, 283, 109584. [Google Scholar] [CrossRef] [Scilit]
- Kuo, C.W.; Chen, C.B.; Chen, C.L.; Yang, Y.Y. Formulating cross-sector horizontal coalition strategies for multi-product assembly systems with a common component. Comput. Ind. Eng. 2021, 159, 107399. [Google Scholar] [CrossRef] [Scilit]
- Bian, J.S.; Zhang, G.Q.; Zhou, G.H. Manufacturer vs consumer subsidy with green technology investment and environmental concern. Eur. J. Oper. Res. 2020, 287, 832–843. [Google Scholar] [CrossRef] [Scilit]
- Zou, T.; Zou, Q.; Hu, L. Joint decision of financing and ordering in an emission-dependent supply chainwith yield uncertainty. Comput. Ind. Eng. 2021, 152, 106994. [Google Scholar] [CrossRef] [Scilit]
- Ji, J.; Zhang, Z.; Yang, L. Carbon emission reduction decisions in theretail-/dual-channel supply chain with consumers’ preference. J. Clean. Prod. 2017, 141, 852–867. [Google Scholar] [CrossRef] [Scilit]
- Huang, W.; Swaminathan, J.M. Introduction of a second channel: Implications for pricing and profits. Eur. J. Oper. Res. 2009, 194, 258–279. [Google Scholar] [CrossRef] [Scilit]
- Zhang, P.; He, Y.; Shi, C. Retailer’s channel structure choice: Online channel, offline channel, or dual channels? Int. J. Prod. Econ. 2017, 191, 37–50. [Google Scholar] [CrossRef] [Scilit]
- Chen, R.R.; Roma, P. Group Buying of Competing Retailers. Prod. Oper. Manag. 2011, 20, 181–197. [Google Scholar] [CrossRef] [Scilit]
- Hong, Z.F.; Guo, X.L. Green product supply chain contracts considering environmental responsibilities. Omega-Int. J. Manag. Sci. 2019, 83, 155–166. [Google Scholar] [CrossRef] [Scilit]
- Chwe, M. Farsighted coalitional stability. J. Econ. Theory 1992, 63, 299–325. [Google Scholar]
- Ji, J.; Li, T.; Yang, L. Pricing and carbon reduction strategies for vertically differentiated firms under Cap-and-Trade regulation. Transp. Res. Part E-Logist. Transp. Rev. 2023, 171, 103064. [Google Scholar] [CrossRef] [Scilit]
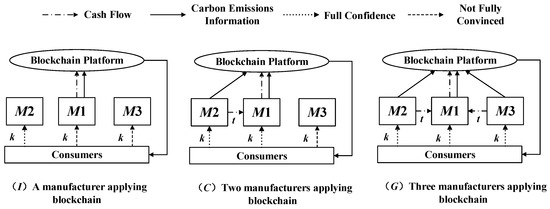
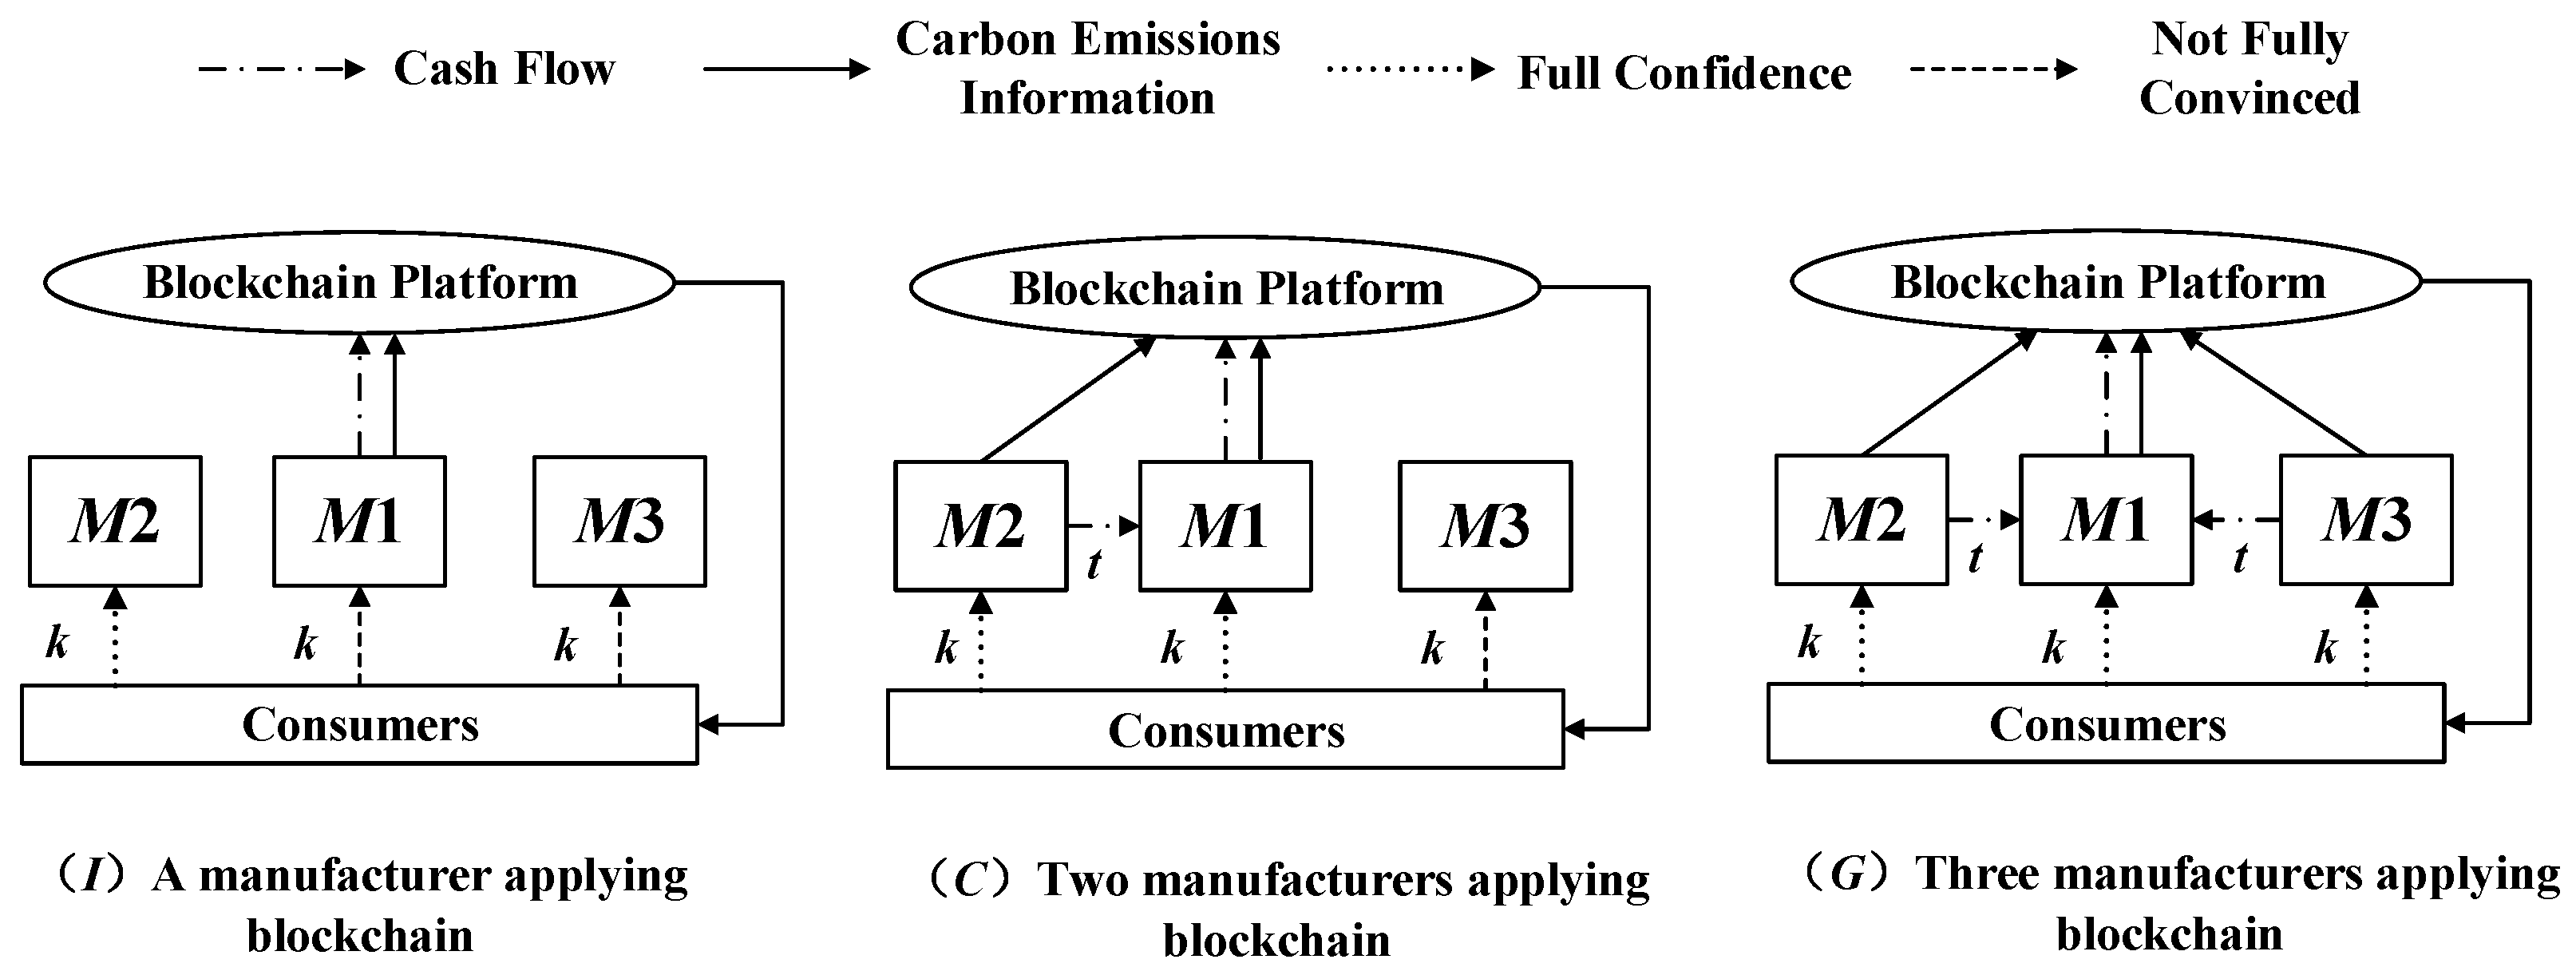
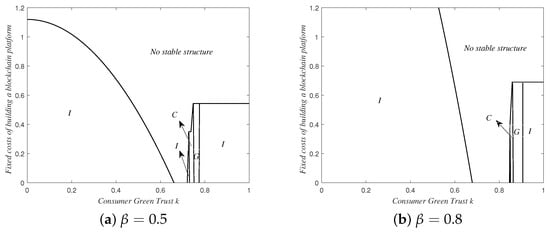
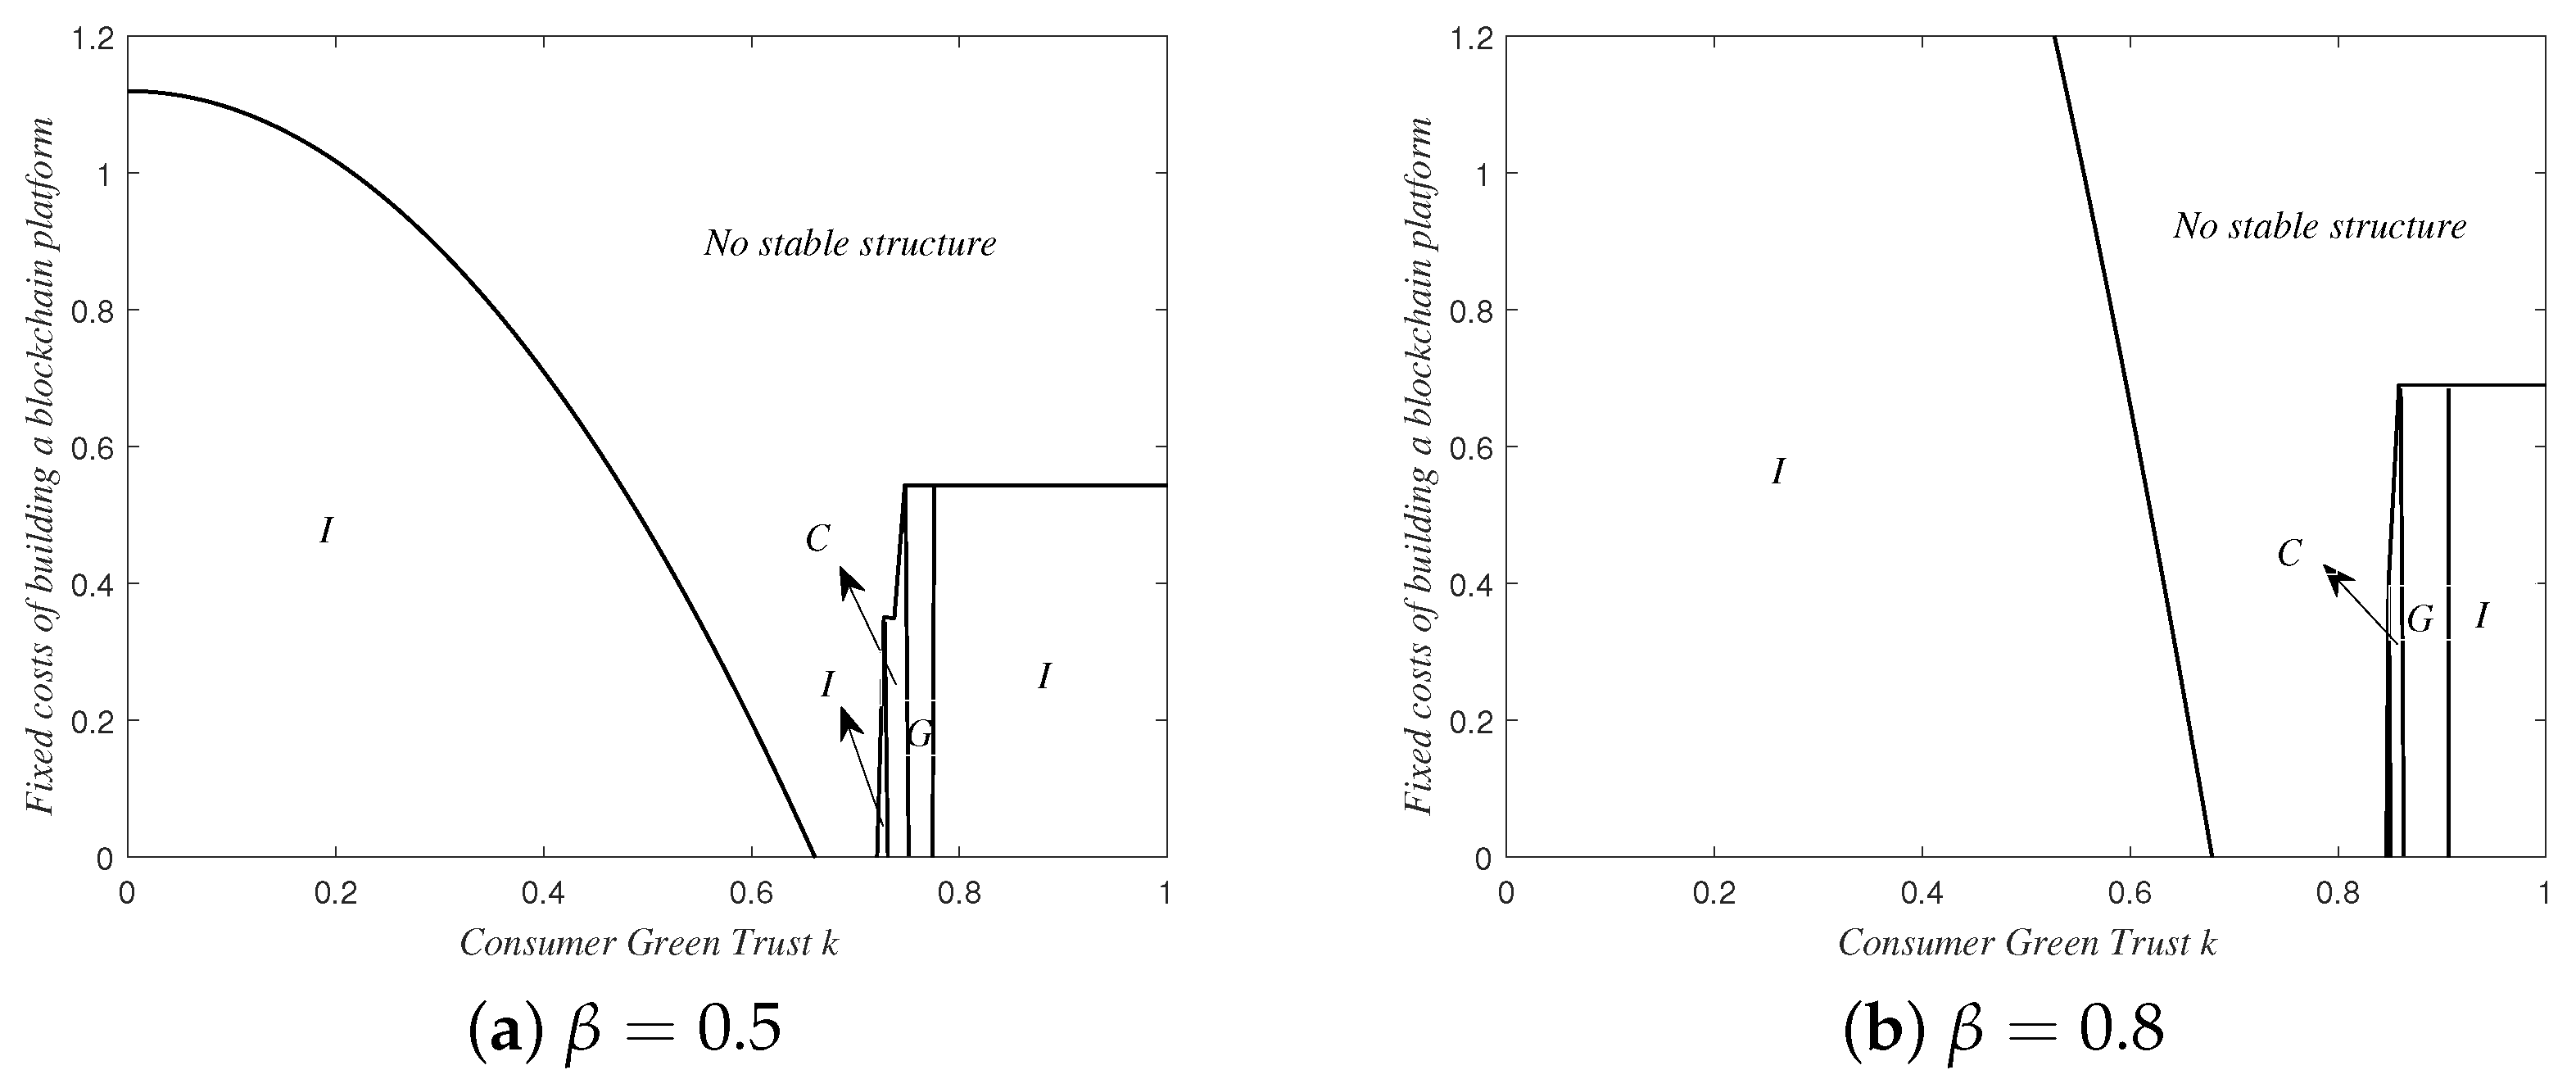
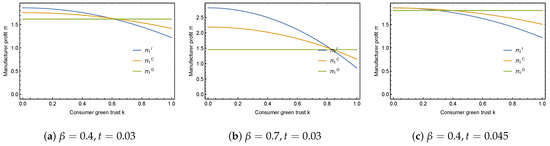
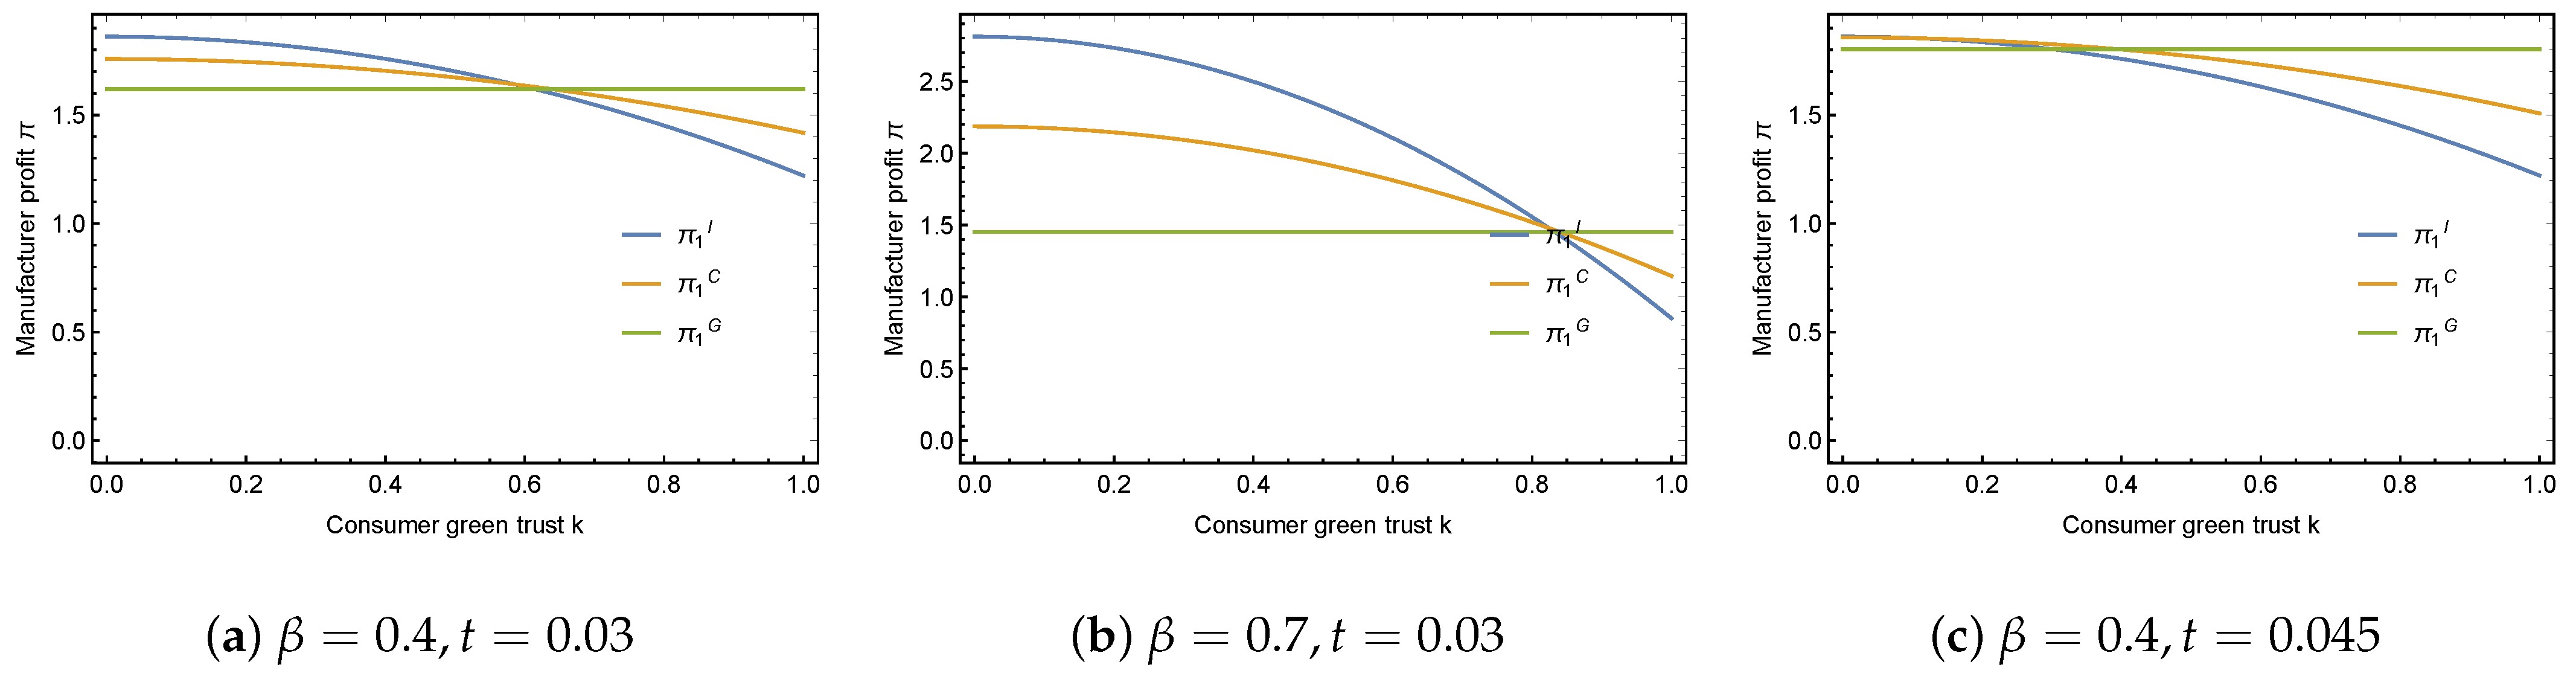
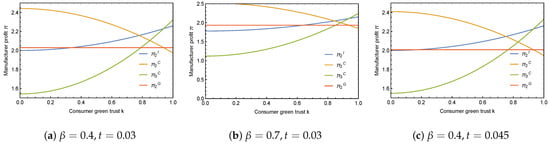
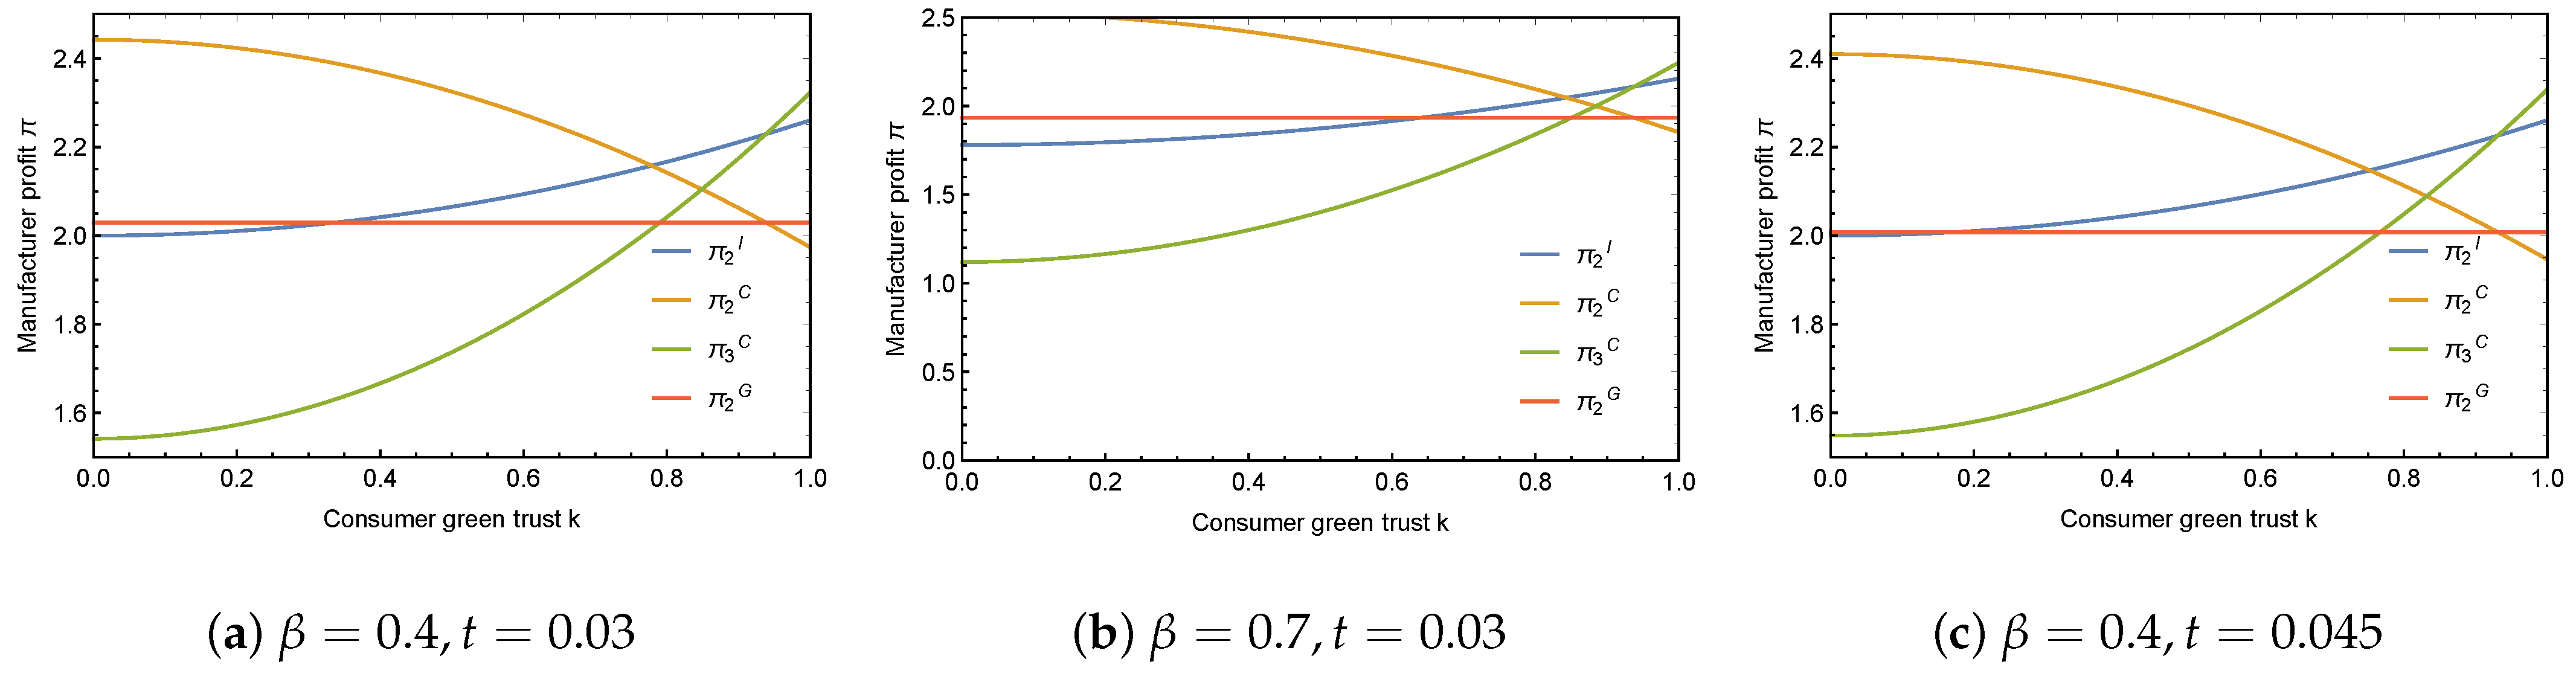
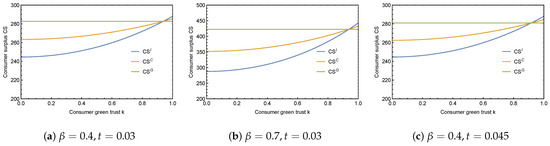
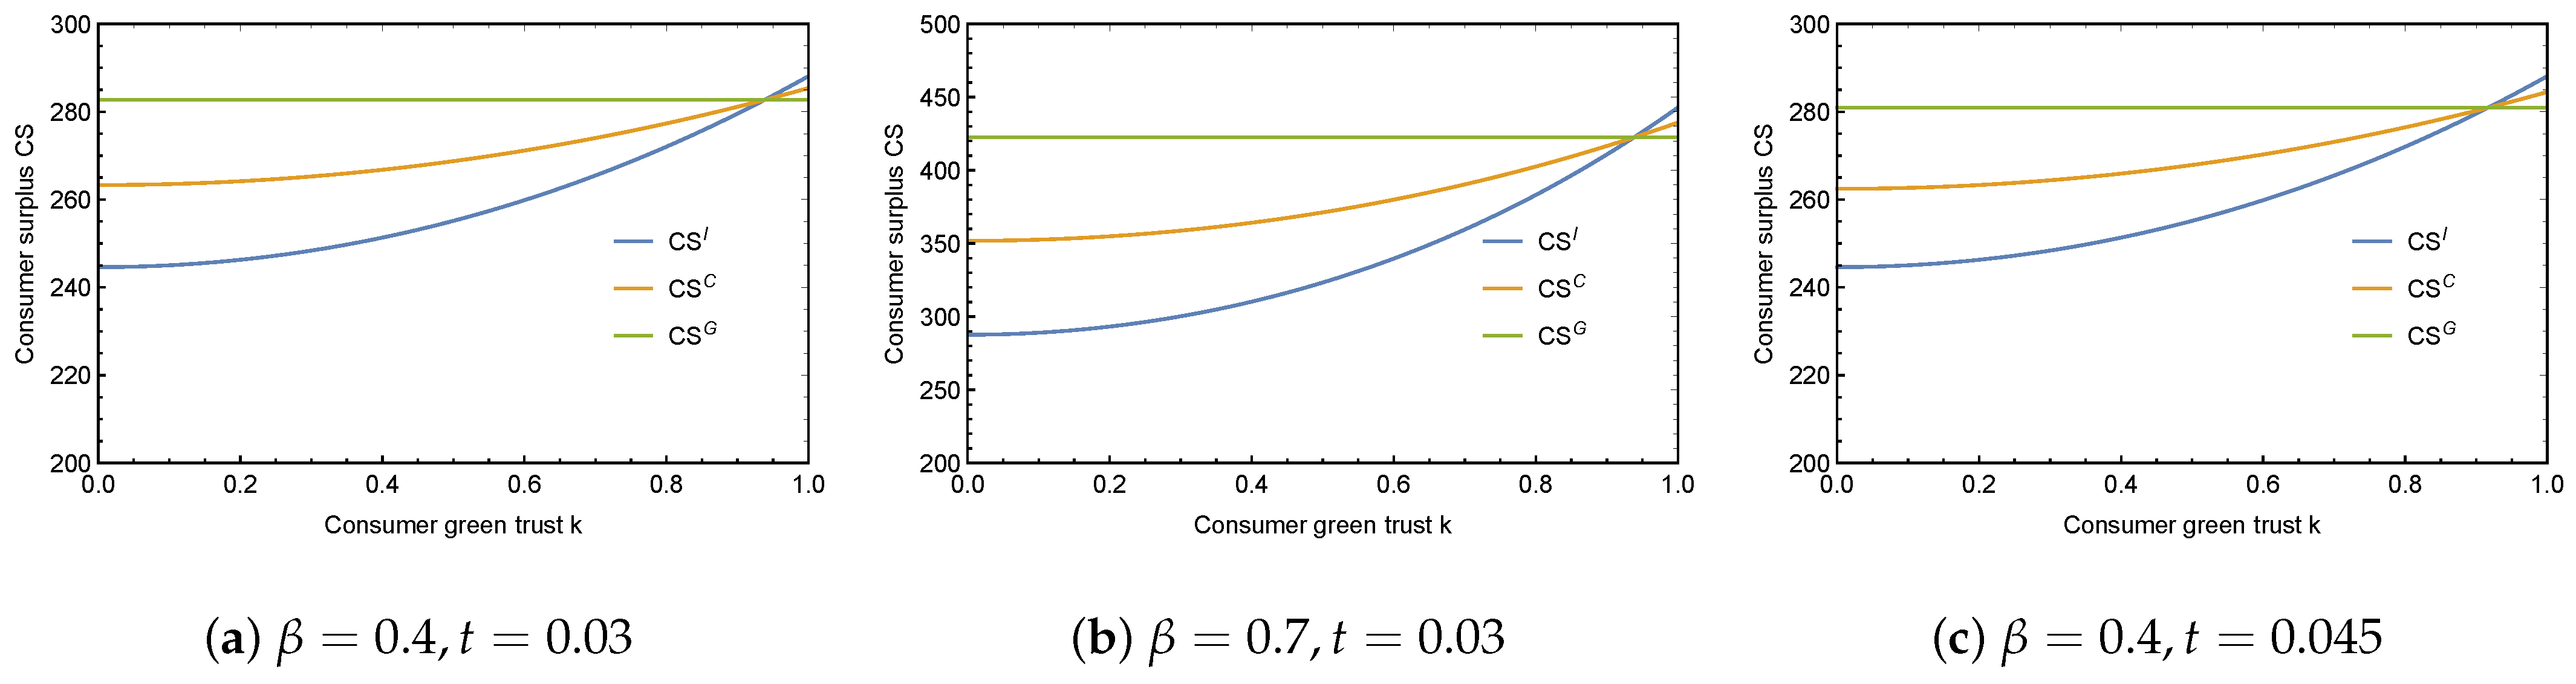
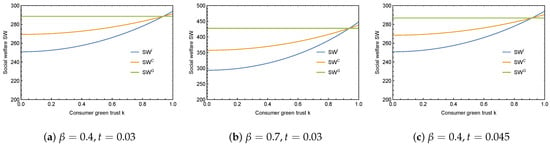
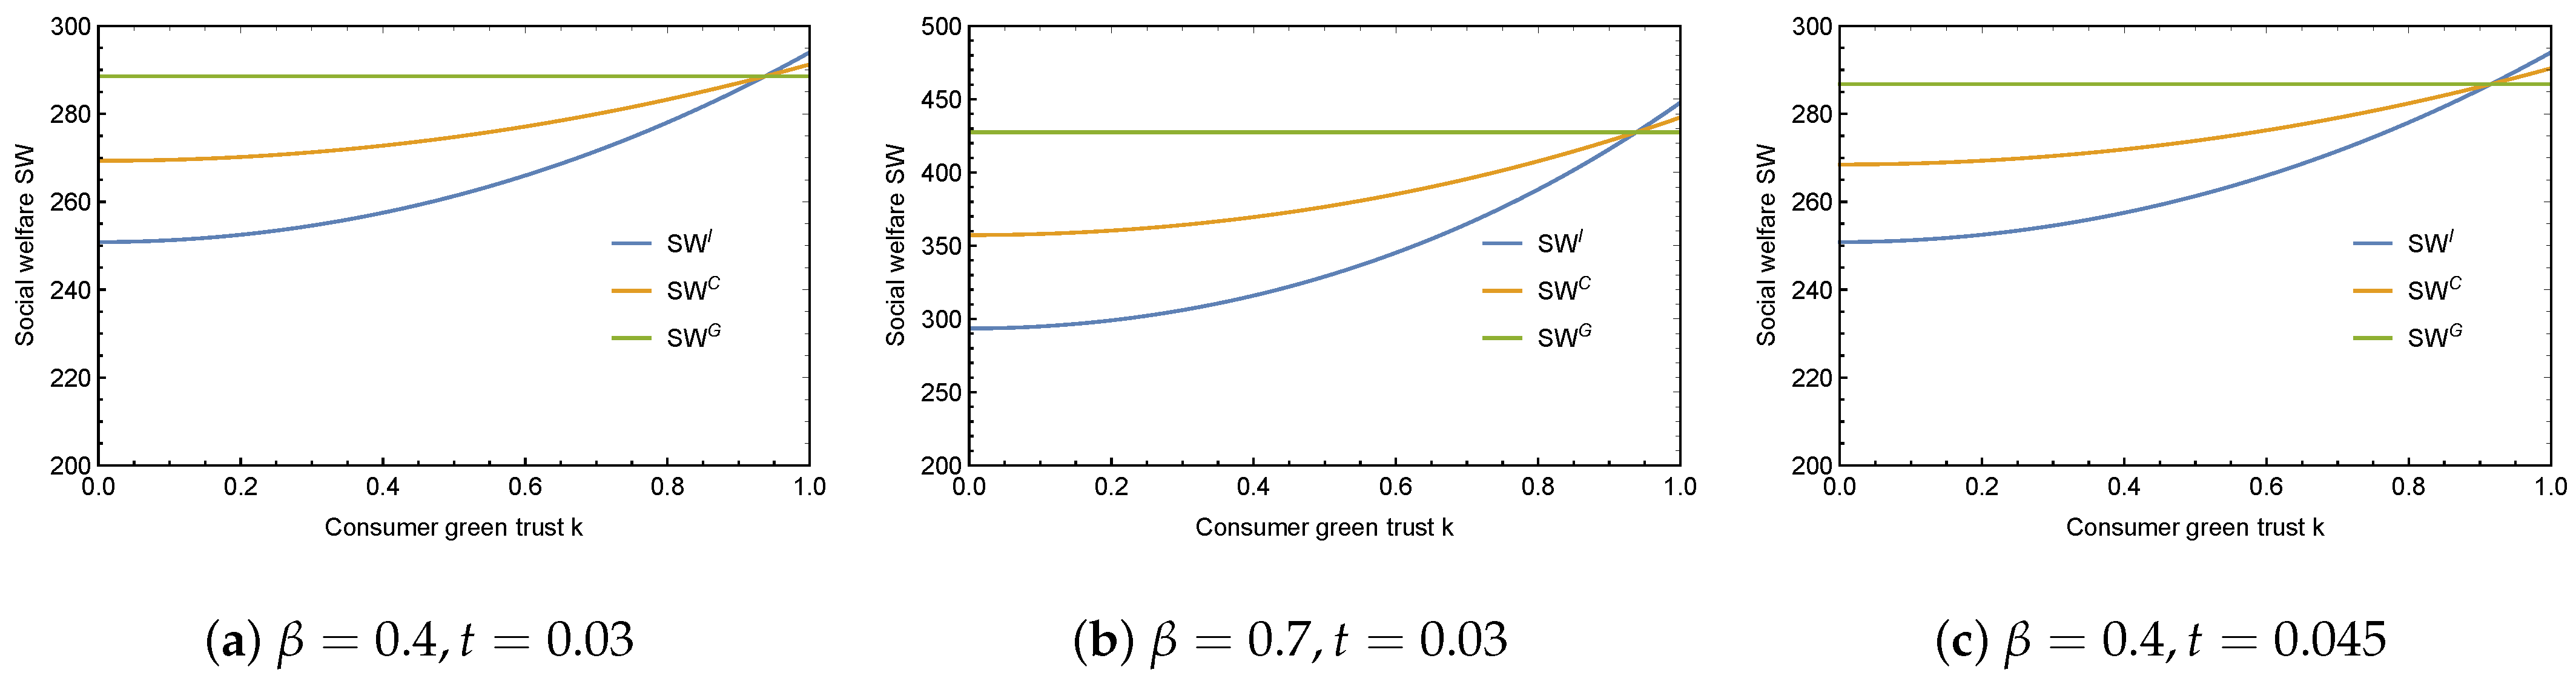
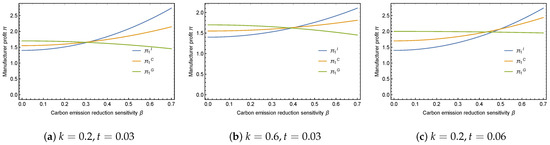
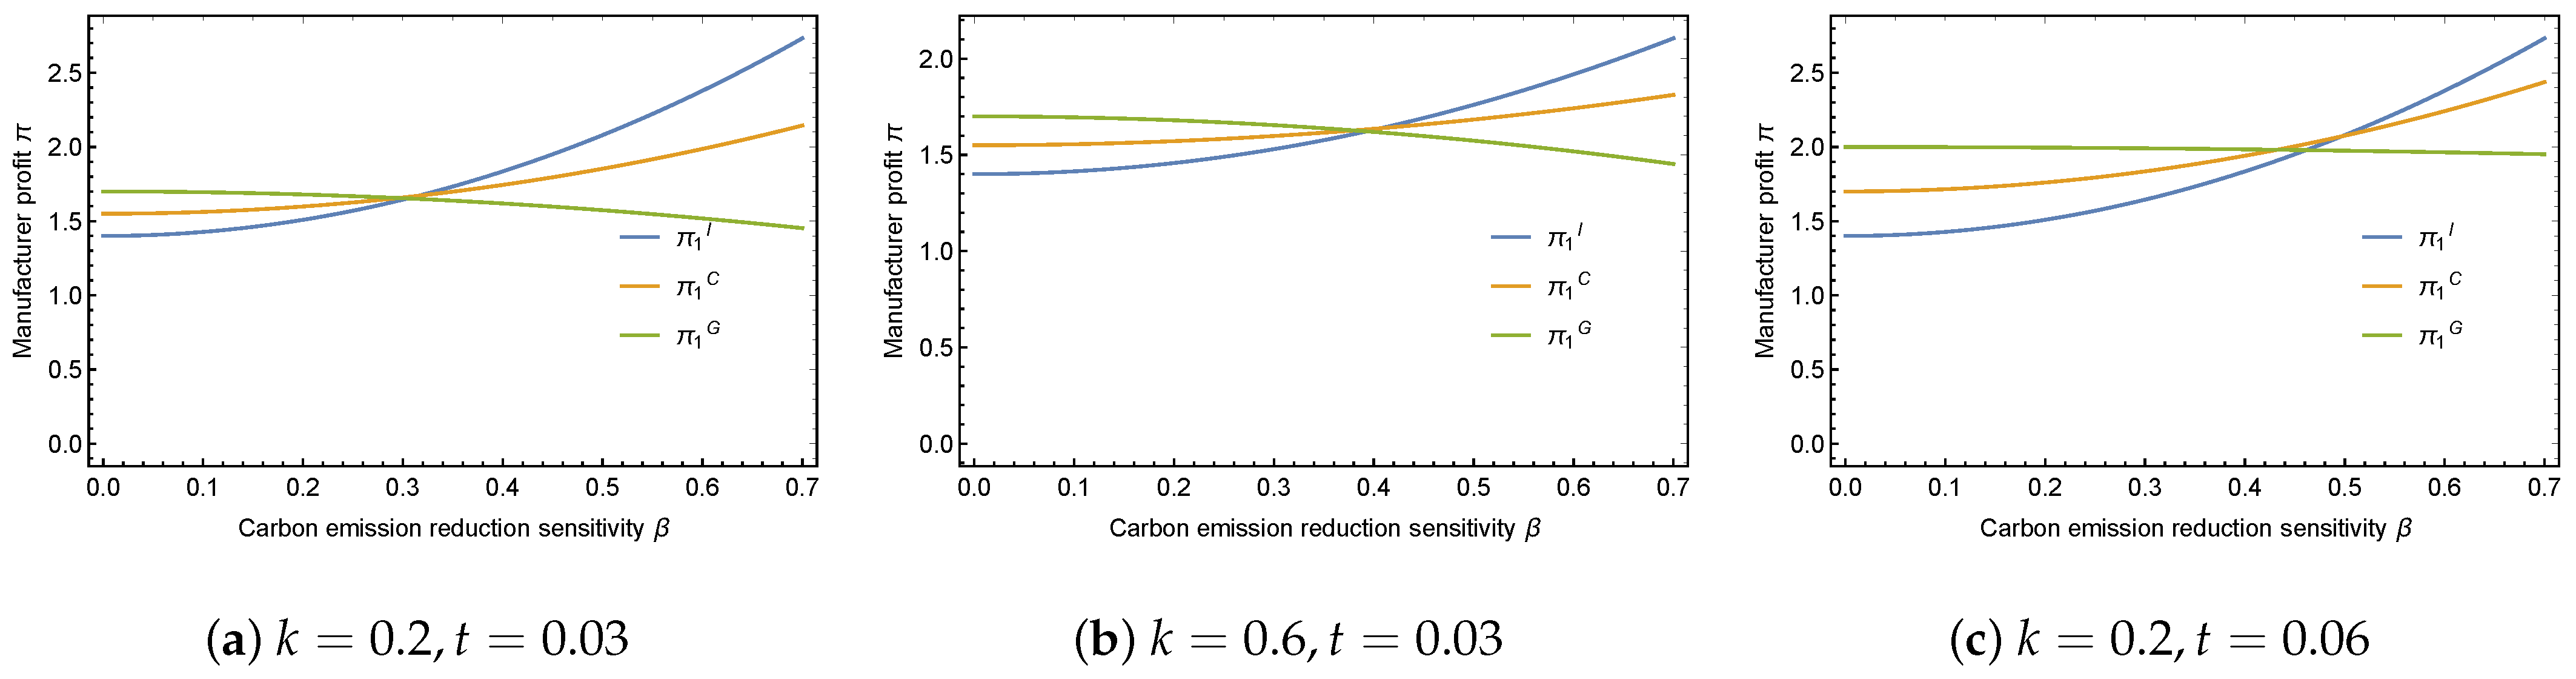
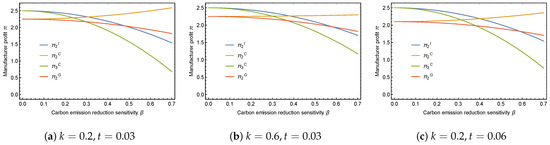
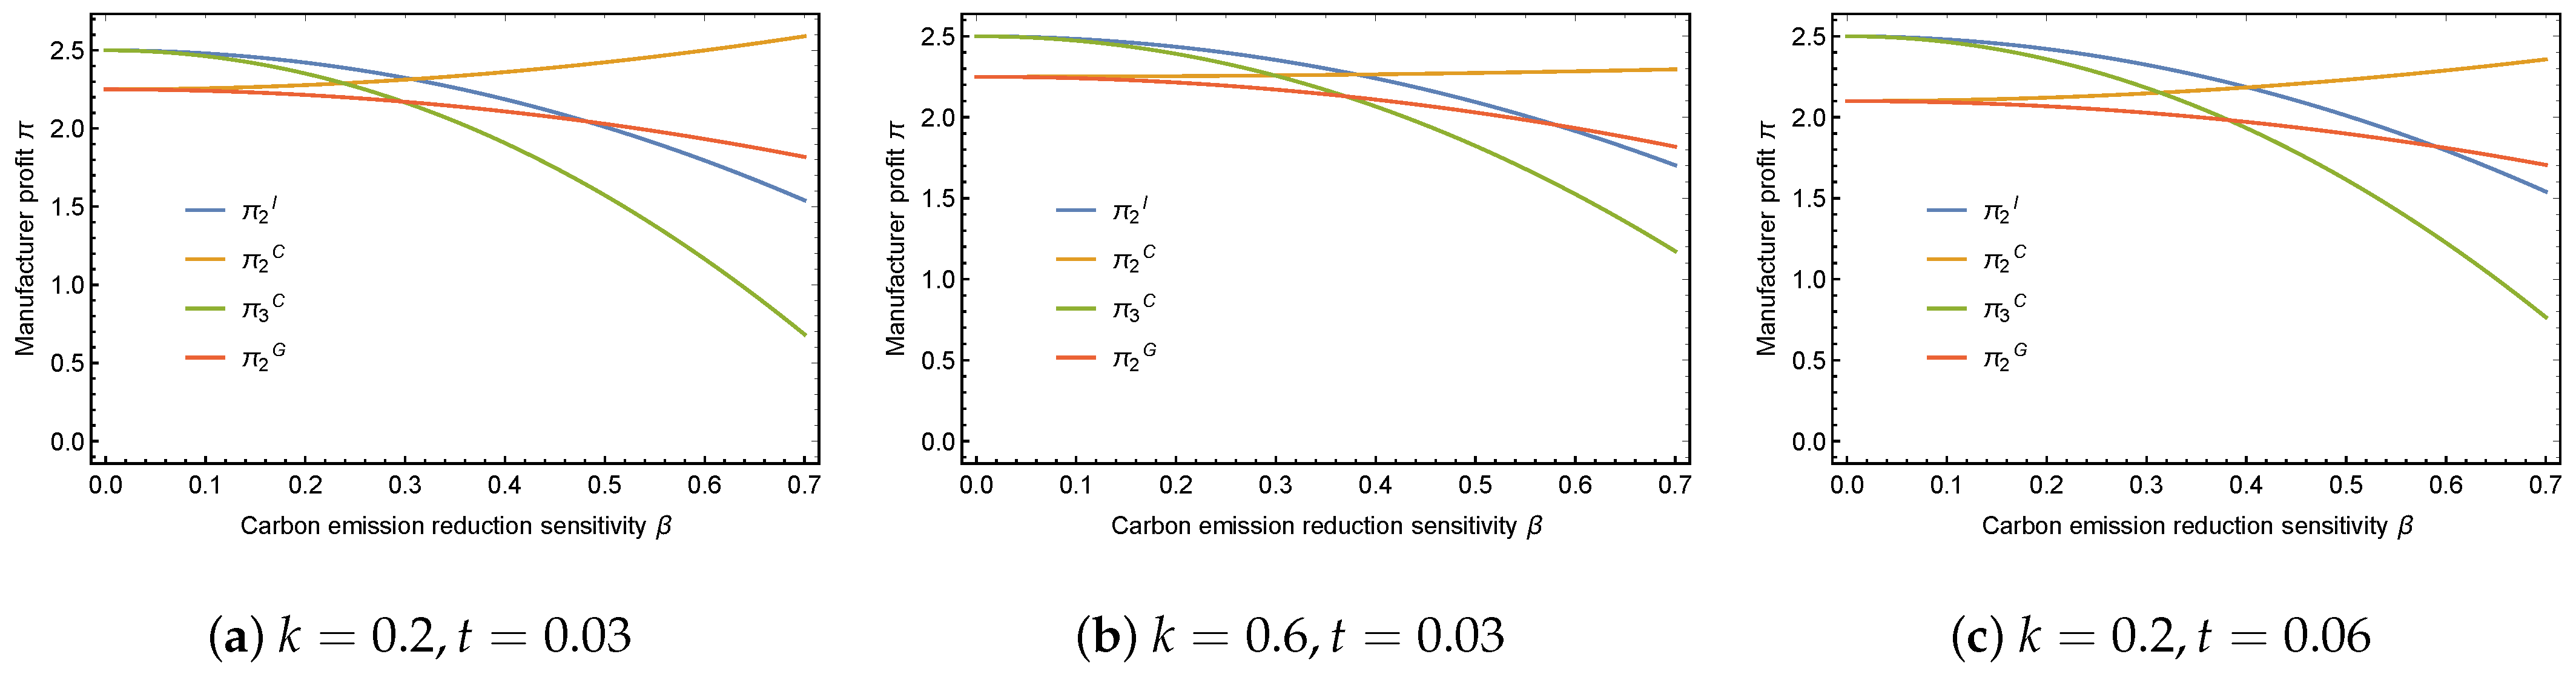
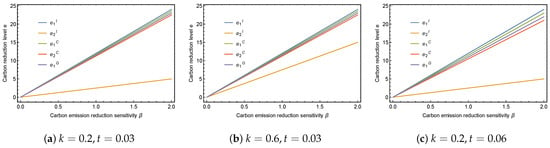
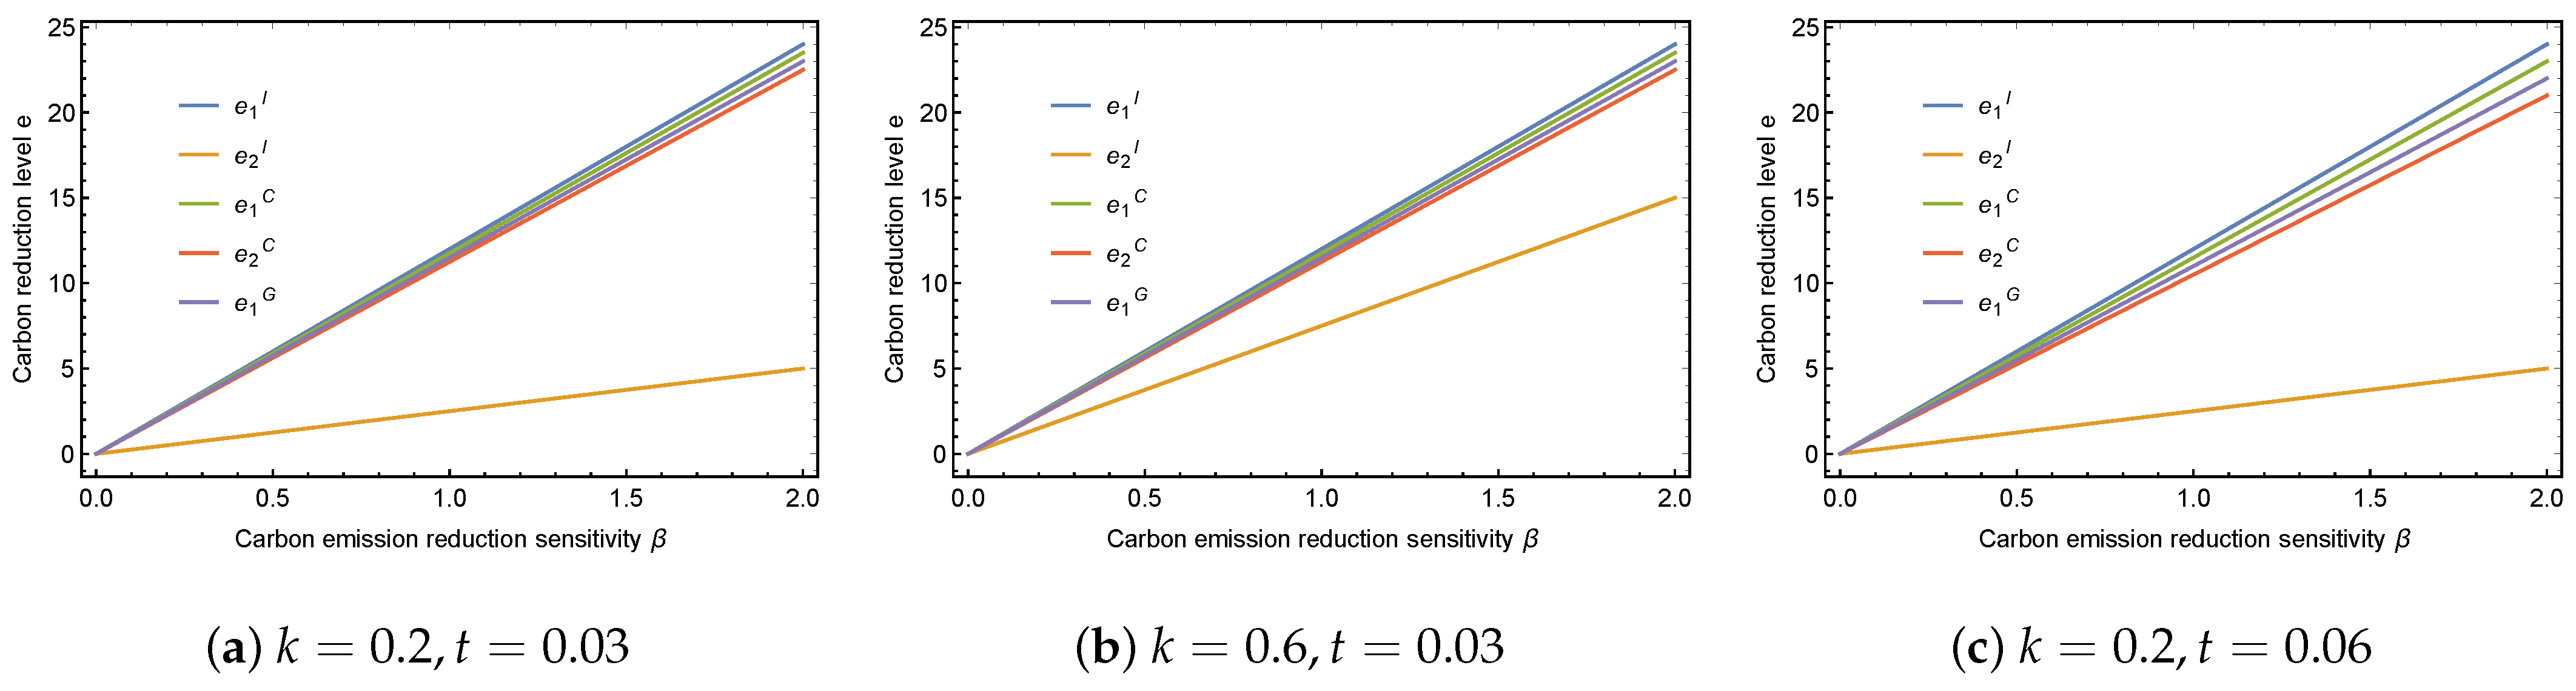
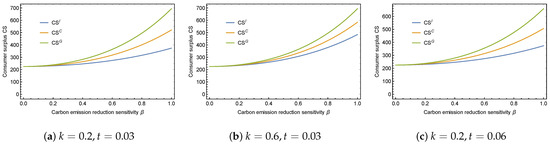
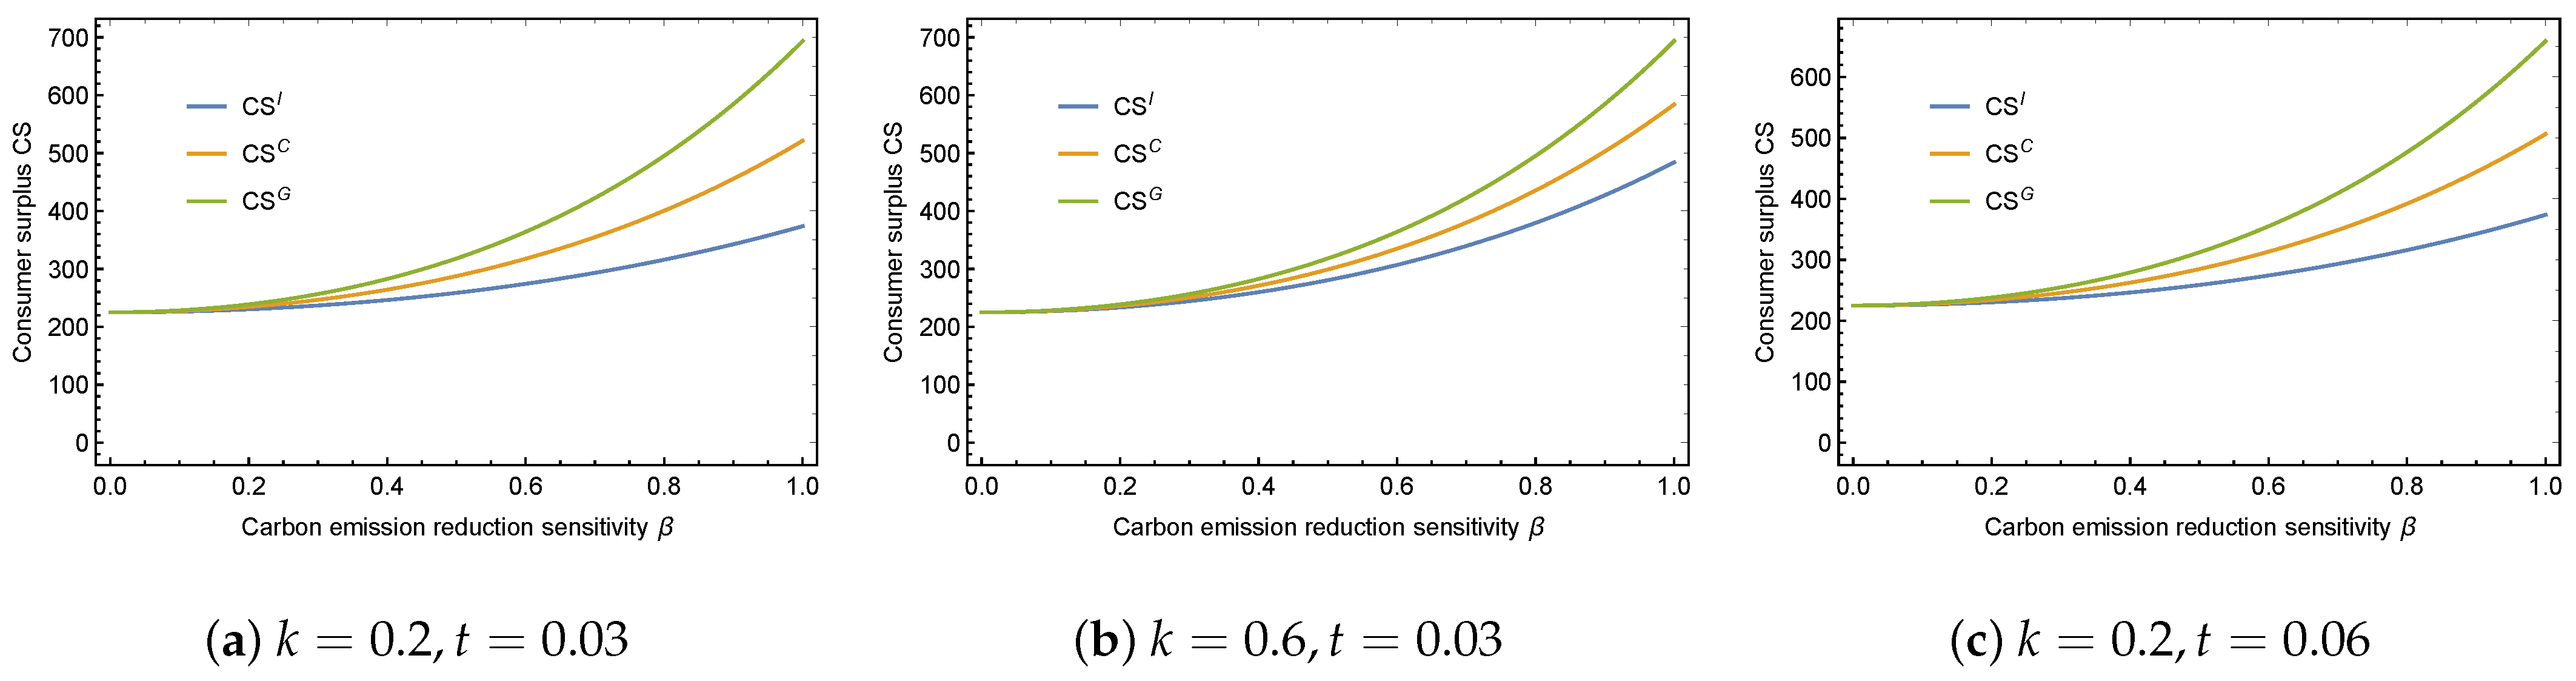
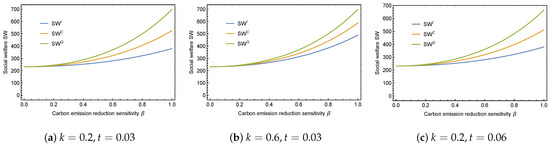
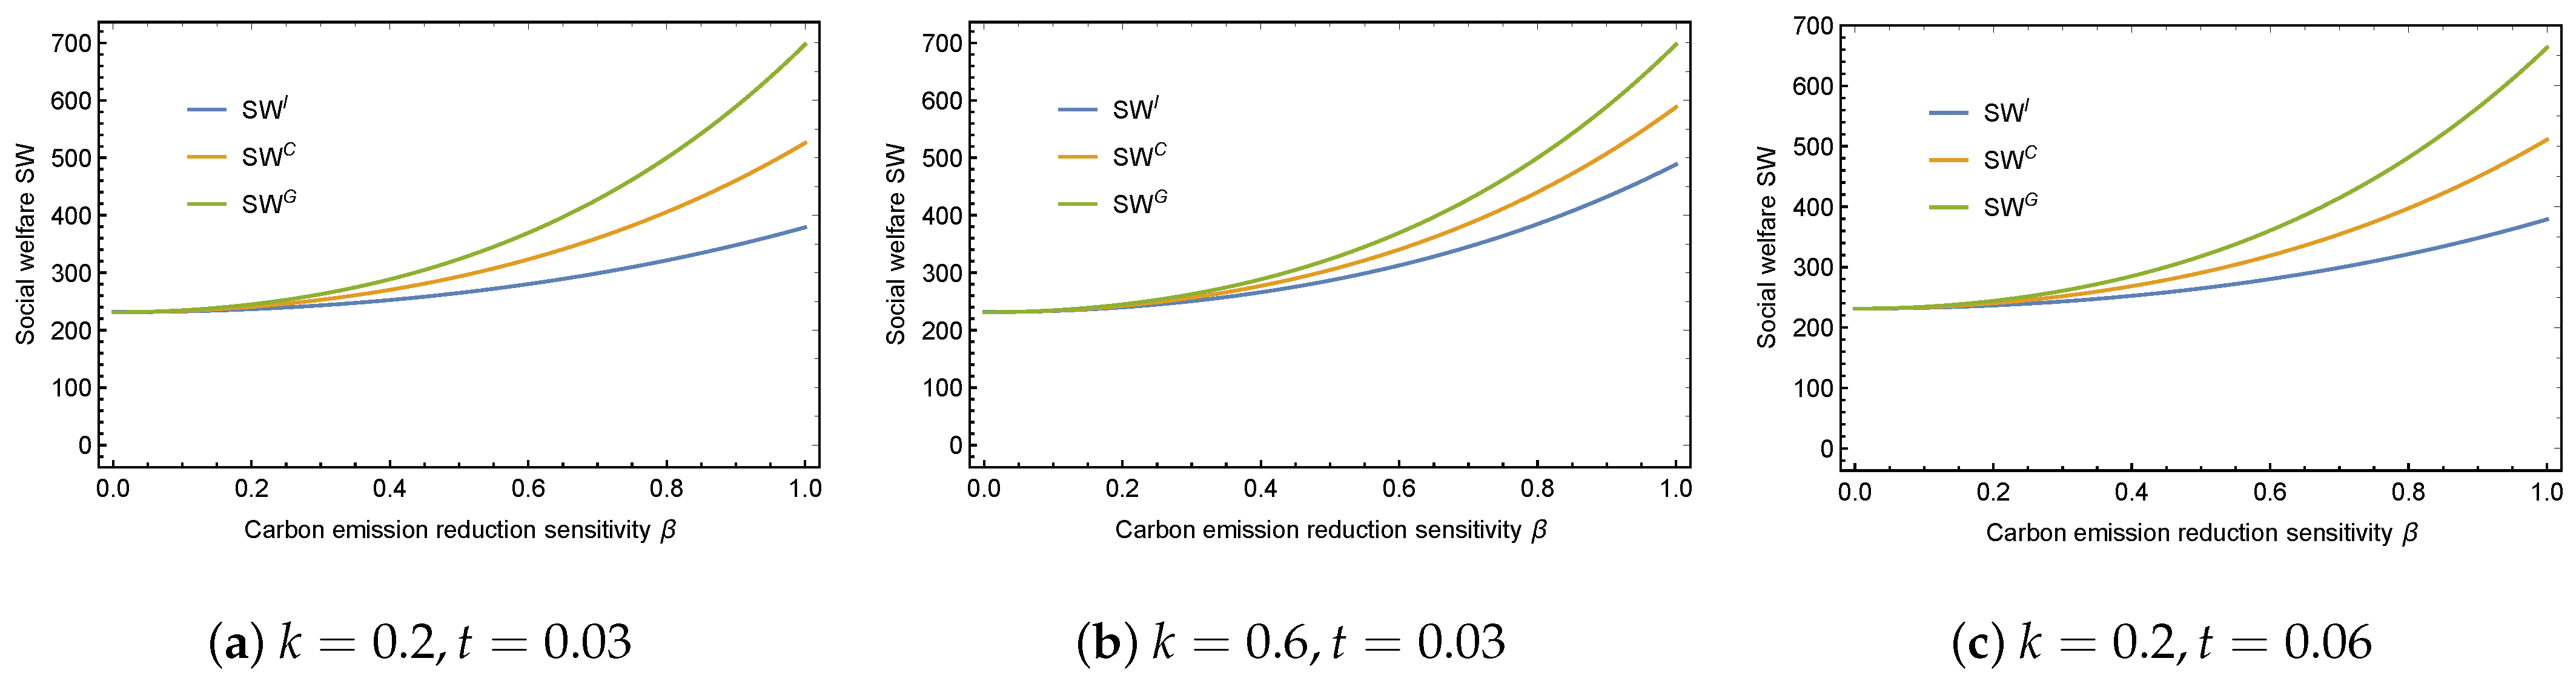

Disclaimer/Publisher’s Note: The statements, opinions and data contained in all publications are solely those of the individual author(s) and contributor(s) and not of MDPI and/or the editor(s). MDPI and/or the editor(s) disclaim responsibility for any injury to people or property resulting from any ideas, methods, instructions or products referred to in the content. |
© 2026 by the authors. Licensee MDPI, Basel, Switzerland. This article is an open access article distributed under the terms and conditions of the Creative Commons Attribution (CC BY) license.