


Abstract
This paper introduces the Improved Runge–Kutta algorithm (IRUN), an enhanced optimization framework that addresses the limitations of the standard RUN method. By integrating success-history adaptation, an external archive, and linear population reduction, IRUN achieves a more effective exploration–exploitation balance, leading to faster and more stable convergence. Evaluations on twenty-three unimodal, multimodal, and composite benchmark functions confirm that IRUN consistently outperforms RUN, achieving markedly lower median errors, narrower interquartile ranges, and more reliable convergence trajectories. In a real-world 136-bus distribution system, IRUN reduces active and reactive power losses by 1.6%, lowers maximum and daily utility energy consumption by 5.9% and 2.5%, and produces smoother, more coordinated charging behavior for distributed BESS units. Voltage-quality indicators—including minimum/maximum voltages and total voltage deviation—demonstrate improved regulation and enhanced system stability, while convergence time is reduced by 16.3%, reinforcing IRUN’s suitability for real-time operational environments. Overall, the combined benchmark and distribution-system results establish IRUN as a robust, accurate, and computationally efficient optimization strategy for next-generation smart distribution networks.
Keywords:
Runge–Kutta Optimizer; renewable energy; photovoltaic systems; battery energy storage systems (BESS); electric-vehicle charging stations (EVCS) MSC:
00A69; 90C30; 90C59
1. Introduction
1.1. Background and Literature Review
The integration of reactive power compensators (RPCs), such as capacitor banks (CBs), static VAR compensators (SVCs), and static synchronous compensators (STATCOMs), along with the increasing penetration of plug-in hybrid electric vehicles (PHEVs) into power distribution systems has received significant attention in modern distribution system planning and operation due to their impact on energy efficiency, voltage regulation, and overall system performance [1,2]. In recent years, research in this area has evolved from conventional reactive power compensation approaches toward advanced optimization and coordinated control strategies for RPCs and electric vehicle (EV) charging infrastructures [3]. Existing studies have shown that proper coordination between RPC operation and EV charging can effectively reduce network power losses, improve voltage profiles, and increase the capability of distribution systems to accommodate renewable energy sources [4]. Reactive power compensators (RPCs) play a crucial role in managing power quality and enhancing the efficiency of electrical distribution systems. This comparison examines three commonly used types of reactive power compensators: (1) capacitors, (2) Static Var Compensators (SVCs), and (3) Distribution Static Compensators (DSTATCOMs) [2]. The system’s lagging reactive power demand is compensated by capacitors to adjust the power factor. They have lower capital expenditures than SVC and DSTATCOM systems, making them cost-effective. Their reliability is also due to their simplicity, including the absence of moving parts and the ease of installation and maintenance. However, the fixed compensation of capacitors limits their adaptability to load conditions. This static nature can cause overvoltage if not handled. Capacitors improve power factor but may not reduce harmonic voltage distortion. DSTATCOMs quickly compensate for reactive power and regulate voltage using power electronics. Unlike SVCs and capacitors, DSTATCOM systems can dynamically provide or absorb reactive power, enabling high-speed operation and accurate control. DSTATCOM is ideal for modern applications with variable load demands due to its reactivity. DSTATCOMs can filter harmonics to improve power quality. However, DSTATCOMs require higher upfront costs and greater technological complexity for maintenance and operation [5,6,7,8].
The increasing penetration of electric vehicle (EV) and plug-in hybrid electric vehicle (PHEV) charging stations in modern distribution systems introduces significant operational challenges due to the stochastic and time-varying nature of charging demand. However, these charging infrastructures also provide new opportunities to support grid operations through auxiliary services and vehicle-to-grid (V2G) technologies. Studies have shown that coordinated charging and discharging strategies can effectively reduce peak demand, improve load profiles, and enhance overall system operation [9,10,11,12]. The growing operational complexity of modern distribution systems has increased the need for efficient optimization techniques to coordinate reactive power resources, voltage control devices, and EV/PHEV charging facilities within a single operating framework. Nevertheless, solving the coordinated optimization problem for EV/PHEV-integrated distribution networks remains challenging due to the coupled effects of continuous and discrete decision variables, the nonlinear characteristics of the network model, and the need to maintain feasible operating conditions while minimizing system losses. This motivates the use of optimization algorithms that can provide a suitable balance between global exploration and local exploitation without relying on restrictive assumptions about the problem structure.
In [13], a Runge–Kutta (RUN) optimization technique was applied to maximize the hosting capacity of radial distribution systems. The proposed approach coordinates the simultaneous allocation of distributed generation units, capacitor banks, and voltage regulators. Tested on the Egyptian Talla system, the findings demonstrate that coordinated compensation yields the best results for integrating renewables without violating grid constraints. In another study [14], the Parallel Elite Genetic Algorithm, a tailored genetic algorithm, is proposed for the coordinated dispatch of electric vehicles and distributed generators. The proposed approach aims to minimize both active power loss and voltage deviations using an elite-preservation policy. The findings show that adjusting crossover and mutation probabilities improves convergence for EV charging demands. In a recent study [3], a Distributed Model Predictive Control (DMPC) method was developed to regulate real-time voltage via V2G technology. The proposed approach coordinates EV chargers to compensate for reactive power. Evaluated on an LVDN test feeder, the findings indicate that the DMPC effectively prevents error accumulation and achieves robust voltage stability. The authors of [15] applied the Differential Evolution algorithm to allocate and schedule EV charging stations alongside wind turbines. The proposed approach aims to bolster distribution network stability by maximizing the Voltage Stability Index under uncertain parameters. When tested on a 51-bus network, the concurrent injection of reactive power significantly mitigates power losses. In [16], a multi-agent deep reinforcement learning strategy was proposed for the real-time voltage control and power dispatch of active distribution networks. The proposed approach coordinates PVs, EVs, and OLTCs to minimize voltage deviation. By leveraging experience augmentation, the method dynamically resolves nonlinear power-flow constraints.
On the other hand, the AGWOPSO algorithm [17] was proposed for the simultaneous placement and sizing of EV charging stations and capacitors. The proposed approach aims to mitigate the adverse effects of EV loads. When tested on 33-bus and 34-bus systems, the findings show that coordinated placement substantially improves the grid’s voltage profile. A different study [4] proposed the Deep Deconvolutional Neural Network to tackle multi-objective reactive power optimization in distribution networks with PVs and EVs. The proposed approach uses historical heuristic optimization data to train a model to produce rapid, real-time Pareto-optimal solutions. The findings highlight the algorithm’s capability to regulate reactive power outputs instantly. In another study [18] where a multi-objective optimization algorithm and a tailored genetic algorithm were applied to the distribution network reconfiguration problem, the proposed approach addresses both power loss minimization and voltage profile enhancement by optimizing tie switches alongside PV/EV reactive power. The method efficiently accommodates stochastic resources. In addition, the authors of [9] adopted the genetic algorithm for the optimal integration of various distributed generations, STATCOMs, and PHEVs. The proposed approach effectively minimizes the system’s total real power loss while enhancing the overall power factor. The study reveals that the coordinated integration significantly outperforms standalone compensator operations. In [19], the Bald Eagle Search Algorithm is proposed to enhance distribution system resilience against faults. The proposed approach strategically manages distributed energy resources to maximize load recovery during network disturbances. Evaluated on multiple test systems, the findings demonstrate a dramatic reduction in Energy Not Supplied.
Recent studies have appeared on EVs and their control in distribution systems. In [20], multi-agent reinforcement learning algorithms were proposed to optimize the active and reactive power schedules of EVs. The proposed approach enables fully distributed, privacy-preserving decision-making without continuous communication with aggregators. The findings show superior reward maximization for grid stability. Another study [21] adopted the Hippopotamus Optimization algorithm to maximize the hosting capacity of radial distribution networks for renewable energy and electric vehicles. The proposed approach combined renewable generation with DSTATCOMs to mitigate voltage instability. The method outperforms conventional metaheuristics in optimal component placement. The piecewise linearization method [22] was utilized to solve the nonlinear optimization problem in distribution network management. The proposed approach linearizes the absolute values of squared voltage variables to simplify the computational burden. The findings highlight the impact of weighting coefficients in balancing energy costs and voltage profiles. In [11], a decentralized optimization algorithm based on ADMM was presented for coordinating active distribution networks with EV aggregators. The proposed approach decouples optimization problems to reduce computational burdens. The findings demonstrate that cooperative scheduling optimally balances energy costs with voltage deviation. In [23], an optimization model using the IPOPT algorithm is proposed to manage a Virtual Power Plant within a smart distribution network. The proposed approach coordinates flexible resources, including EVs and renewables, to manage system uncertainty. The findings indicate that this management enhances technical distribution metrics. A genetic algorithm with a heuristic initialization process [24] was proposed to jointly optimize EV charging schedules and distribution system reconfiguration. The proposed approach aims to minimize energy loss costs and feeder investment costs. The findings indicated that coordinating DSR with EV scheduling significantly defers infrastructural upgrades.
In a different study [25], a Promoted Osprey Optimizer, a tailored Osprey Optimizer, was proposed to address Optimal Reactive Power Dispatch in networks integrated with EVs. The proposed approach utilized opposition-based learning and chaotic maps to balance exploration and exploitation. The findings demonstrated its superior performance in identifying control variables. In [26], a tailored crystal-structure algorithm was proposed for multi-objective energy management in grid-connected microgrids. The proposed approach strategically scheduled distributed resources to simultaneously minimize operating costs and emissions. The findings showed that the proposed algorithm outperforms classical metaheuristics. In [27], an optimization model incorporating Kernel Density Estimation was proposed to assess and mitigate voltage violations in distribution networks. The proposed approach leveraged reactive power compensation from PV/EV inverters alongside OLTCs and SCs. The results confirmed that smart inverter participation significantly reduces the risk of voltage violations. In [28], a PSO-DS algorithm, a tailored Particle Swarm Optimization algorithm, was proposed for the optimal placement of EV charging stations and capacitors. The proposed approach balanced maximal geographic coverage with minimal electrical power loss. The results demonstrated that the hybrid technique ensures robust infrastructural planning. In [29], the MMPA-HBA hybrid optimization framework, a tailored variant of the Marine Predators algorithm, was proposed to maximize the hosting capacity for EVs and renewables. The proposed approach balanced exploration and exploitation to maximize hosting capacity while minimizing costs. The algorithm demonstrated superior convergence for complex resource allocation.
In [30], a multi-objective optimization model was proposed to concurrently minimize energy losses, energy procurement costs, load shedding, and voltage deviations in EV-integrated distribution grids. The proposed approach utilized the Hiking Optimization Algorithm (HOA), which leveraged an adaptive search mechanism based on Tobler’s Hiking Function to avoid local optima. In [31], probabilistic techniques and the NSGA-II algorithm were proposed for the optimal reconfiguration of active distribution networks integrated with PHEVs. The proposed approach develops a stochastic method utilizing Nataf transformations to quantify uncertainties. In [32], the Most Valuable Player Algorithm was proposed to design a priority-based V2G scheduling strategy for electric vehicles. The proposed approach formulated a novel multi-objective function that minimizes load variance and power losses using a newly developed index. The study results validated that MVPA successfully identifies a Pareto-optimal front. In [33], the MOCVBOA algorithm, a tailored butterfly optimization algorithm, was proposed to determine the optimal sizes and locations of PV and BESS units. The proposed approach mitigated the detrimental impacts of PHEVs by simultaneously minimizing power losses and total voltage deviations. The algorithm successfully identified compromised solutions via TOPSIS. In [34], the Bald Eagle Search Algorithm was proposed for the optimal allocation and sizing of DSTATCOMs and Electric Vehicle Charging Stations. The proposed approach mathematically modeled bald eagles’ hunting behavior to maximize net system savings. In [35], an Alternating Direction Method of Multipliers (ADMM)-based approach was proposed to solve the mixed-integer nonlinear Volt/VAR optimization problem in electric distribution systems. The proposed approach decomposed the generic VVO problem into the efficient coordination of discrete load tap-changers and switchable capacitor banks. A summary of the literature details and methods applied is listed in Table 1.
Table 1.
A summary of the literature review.
1.2. Statement of Contributions
In this regard, the Runge–Kutta Optimizer (RUN) [36] has recently gained attention as an effective population-based algorithm inspired by the numerical Runge–Kutta method. Its search mechanism provides a structured way to update candidate solutions and improve convergence behavior in complex nonlinear problems. Building on this advantage, this paper adopts an Improved Runge–Kutta Optimizer (IRUN) to enhance the solution quality and convergence performance for the coordinated operation of reactive power compensators and EVCS in distribution systems. Various researchers applied different optimization algorithms to address the points discussed. This work makes several key contributions to the optimal operation of active distribution networks with high penetrations of distributed and flexible energy resources:
- Introduction of the IRUN optimization framework, an enhanced variant of RUN that improves convergence, robustness, and real-time coordination of PV units, BESS, DSTATCOMs, and EVCSs under dynamic operating conditions.
- Holistic 24 h evaluation on a realistic 136-bus network, comprehensive benchmarking across losses, energy exchange, voltage quality, stability indices, and computational efficiency to rigorously validate performance.
- Demonstration of gains in efficiency, stability, and voltage regulation, significant reductions in active/reactive losses and utility energy dependence, alongside superior voltage profiles, reduced deviations, and improved stability during high-variability periods.
- Enhancement in management of distributed storage with lower computational burden, smoother, strategically aligned BESS SOC trajectories, and faster convergence, supporting real-time or near-real-time operational deployment.
Together, these contributions establish IRUN as a robust, efficient, and practically deployable optimization strategy for next-generation smart distribution networks.
2. RUN Algorithm
2.1. Standard RUN Algorithm
The Runge–Kutta Optimizer (RUN) [36] is a metaphor-free optimization tool designed for diverse global problems. By leveraging the mathematical rigor of the Runge–Kutta method rather than natural analogies, it offers a logical approach to searching feature spaces, utilizing an enhanced solution quality (ESQ) mechanism to ensure high-quality results and faster performance.
The RUN algorithm starts with an initial population of size and limits as follows [36]:
The first RK4 coefficient is calculated from the worst and best positions as:
To enhance the exploration, this coefficient is modified to be [36]:
The position increment is calculated from the step size as [36]:
The three remaining RK4 coefficients are calculated as [36]:
The leading search mechanism () is calculated from:
The solution is updated every iteration, and the positions are randomly calculated as [36]:
Then, the adaptive search factor (SF) is randomly calculated from [36]:
Then, the positions are updated according to:
To avoid local minima, the enhanced solution quality is applied to calculate three new solutions. The first enhanced solution is calculated as:
The second enhanced solution is calculated as [36]:
Finally, the third enhanced solution is estimated as [36]:
In this case, RUN follows three paths to reach a better solution.
2.2. Proposed IRUN Algorithm: Key Modifications
We introduce the first success-history adaptation mechanism for Runge–Kutta-based optimization. Unlike the standard RUN algorithm, which uses a fixed exponential decay for the scale factor , IRUN maintains a memory archive, , of successful scale factors from previous generations. The scale factor for each individual is generated using a Lehmer mean of historical successes, allowing the algorithm to self-tune its step sizes to the problem landscape. Additionally, an external archive stores discarded solutions to enhance the Runge–Kutta difference vectors (), while linear population reduction concentrates computational resources on exploitation phases. In this regard, three modifications are applied to generate the proposed IRUN algorithm based on the original RUN as follows:
- Modification 1: Success-History Memory for Scale Factors
In the first modification, the random generation is replaced with history-guided adaptive generation [37]:
This modification implements self-adaptation: Rather than random SF, the Cauchy perturbation of historical successes allows the algorithm to inherit “good” step sizes while maintaining diversity through the heavy-tailed distribution. In this case, the memory is updated using the Lehmer mean whenever there is an improvement, as [37]:
The significance of this step is that the algorithm learns optimal step magnitudes from evolutionary history, transforming from random exploration to adaptive exploitation. In the meantime, the Lehmer mean (p = 2) rather than the arithmetic mean is adopted because it biases toward larger successful values, accelerating convergence on unimodal valleys, while the Cauchy noise maintains exploration on multimodal landscapes.
- Modification 2: External Archive (Y) for Enhanced RK4 Vectors
Traditional RUN selects xb and xw only from the current population X. IRUN expands the selection pool [38]:
The external archive Y (size NA) is updated with discarded parents [38]:
The significance of this modification is that the archive members provide historical structural information for the Runge–Kutta difference vectors, preventing catastrophic forgetting of favorable trajectories. Moreover, the modification creates an elitist memory by storing discarded parents (not just the current best), and the archive preserves gradient information from the optimization path, which is critical for the RK4 mechanism’s accuracy.
- Modification 3: Linear Population Size Reduction
While the standard RUN algorithm maintains a fixed population size N, the proposed improved IRUN adopts a linear reduction from the initial value to the minimum size with iteration, which is expressed as [39]:
The consequence of this step is that it concentrates the computational budget on exploitation in late iterations, thereby saving time. In addition, linear reduction ensures budget efficiency by focusing late-stage function evaluations on refining the elite subpopulation rather than maintaining diversity that is no longer needed.
When applying the three modifications, the unified position update is calculated as [37,38,39]:
The comparisons between the standard RUN algorithm and the proposed improved version, IRUN, with success history, are listed in Table 2.
Table 2.
Key differences between RUN and IRUN algorithms.
The proposed IRUN algorithm advances beyond the baseline RUN framework by integrating three complementary mechanisms: success-history adaptation, an external archive, and linear population reduction. Success-history adaptation dynamically tunes control parameters based on prior performance, ensuring faster and more stable convergence. The external archive enriches the search space by preserving diverse candidate solutions, thereby improving robustness under time-varying operating conditions. Linear population reduction strategically decreases population size over iterations, balancing exploration and exploitation while reducing computational burden. While adaptive strategies have been reported in the related optimization literature, the unique combination and mathematical formulation of these mechanisms within the RUN structure distinguishes IRUN as a novel contribution. This design enables superior coordination of PV units, BESS, DSTATCOMs, and EVCSs, with demonstrable improvements in efficiency, voltage regulation, and real-time applicability.
2.3. Computational Complexity and Scalability
The computational complexity of the proposed IRUN algorithm is primarily governed by the number of objective function evaluations, which scales linearly with the population size and the maximum number of iterations. Accordingly, the overall complexity can be expressed as , which is consistent with the baseline RUN framework. The additional mechanisms introduced in IRUN—success-history adaptation and linear population reduction—incur only minor overhead, as they involve simple memory updates and arithmetic operations that do not alter the asymptotic complexity. In terms of scalability, IRUN has been evaluated on benchmark functions of varying dimensionality, up to 100 dimensions, and consistently demonstrates superior performance relative to RUN. The algorithm maintains its convergence advantage as the dimensionality increases, confirming that the proposed modifications are effective in large-scale optimization contexts. This scalability, combined with the preserved computational efficiency, highlights IRUN’s suitability for complex, high-dimensional problems, where both solution quality and computational cost are critical considerations. Recent advances have also highlighted the role of nonlinear and chaotic dynamics in energy management. For instance, Bucolo et al. [40] demonstrated that chaos can be actively harnessed to improve energy transport efficiency in networks of electrical oscillators, outperforming random perturbations by providing deterministic yet diverse trajectories for energy flow. This perspective reinforces the importance of adaptive and nonlinear strategies in modern energy systems. In this context, the proposed IRUN algorithm provides a complementary optimization framework, capable of coordinating distributed resources in complex distribution networks and potentially extendable to innovative architectures in which nonlinear dynamics play a central role.
3. Methodology
In this section, the objective functions are outlined for both standard test functions and distribution systems.
3.1. Optimization of Benchmark Test Functions
In general, the minimization problem can be expressed as:
subject to inequality and equality constraints as follows:
To evaluate the performance, robustness, and generalization capability of the proposed IRUN algorithm, a comprehensive set of 23 standard benchmark test functions [41] was employed. These functions are widely used in the evolutionary computation community because they represent a diverse collection of optimization landscapes, enabling a rigorous assessment of both exploration and exploitation behaviors. The benchmark suite includes unimodal, multimodal, separable, and non-separable functions, ensuring that IRUN is tested across a broad spectrum of difficulty levels.
All benchmark functions were evaluated in their standard forms, with dimensionality and search ranges defined according to the established literature. The dimensionality was set to D = 30 for most functions, unless the function definition specifies otherwise. Search boundaries were strictly enforced to ensure fair comparison between the original RUN and the proposed IRUN algorithm. Each benchmark function was optimized independently over multiple runs to account for the stochastic nature of evolutionary algorithms. For each function, the following performance indicators were recorded: best fitness value, mean and worst fitness values, standard deviation across runs, and convergence behavior over iterations.
3.2. Optimization of Distribution Systems
The performance of distribution systems can be maximized if certain special factors are met during continuous operation. These factors may include the voltage profile, system losses, stability, and the ability to provide customers with a suitable voltage input. This task may be further complicated by the addition of plug-in hybrid electric vehicles at certain charging lots. The stochastic behavior of parking lots affects the distribution system’s ability to meet demand at specified quality levels.
In this study, the main objective function is to minimize the system power loss. When losses are reduced, this positively reflects on system performance and is reflected in the performance factors. The power loss of a system is calculated as:
subject to:
- (a)
- Inequality constrained
The inequality constraints include the acceptable limits for the devices incorporated in the analysis. These limits are defined as follows.
The BESS units are allowed to be charged/discharged within the following limits:
At the same time, the SOC of each unit is constrained to:
The DSC units are optimized to lie between their predefined limits as:
The system voltage profile is constrained to:
The charging power of each EV is constrained to:
The generation units of the PV are also constrained to:
- (b)
- Equality constrained
The equality constraints include the system operation specifications and power flow equations. At any time during the day, the power equation must be satisfied. At each bus of the distribution system and time, the power components are:
3.3. EVCS Modeling
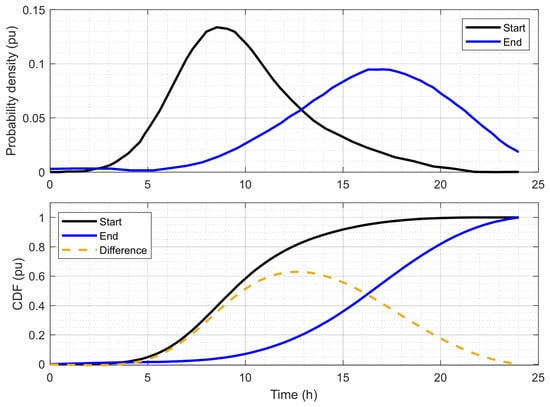
The EV charging at public stations in this study is based on the 2017 NHTS [42,43], where the probabilities of start and end times are shown in Figure 1. The probability density functions of EV charging start and end times at public charging facilities exhibit distinct temporal distributions that reflect typical user behavior. The start-time probability density shows a pronounced peak in the mid-to-late morning, reaching a maximum around 10:00, indicating that most charging sessions begin during the peak of workplace arrival. Conversely, the end-time probability density exhibits a broader distribution, with elevated values from late morning through early evening, peaking between 12:00 and 18:00. The corresponding cumulative distribution functions (CDFs) further elucidate these temporal patterns. The difference between the start and end CDFs, which represents the proportion of actively charging EVs at each hour, shows a characteristic bell-shaped profile with peaks between 12:00 and 15:00, corresponding to the period of maximum charging demand at public charging stations. This temporal alignment suggests that public EV charging infrastructure primarily serves daytime parking patterns, with charging sessions concentrated around typical working hours.
Figure 1.
Charging behavior profiles at public EV stations.
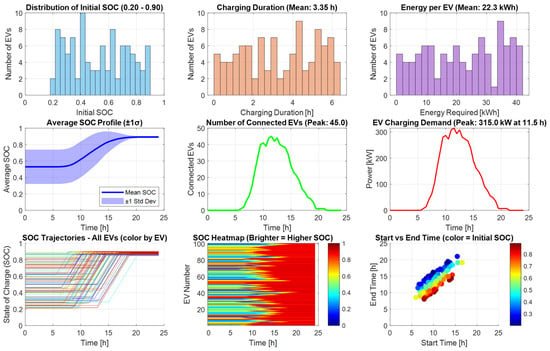
The simulation results for 100 EVs with random initial SOC values uniformly distributed between 0.20 and 0.90 are presented in Figure 2. The analysis captures the stochastic nature of EV charging behavior through a Monte Carlo approach, accounting for variations in charging duration, energy requirements, and the temporal distribution of charging events. The initial SOC distribution, shown in the first subplot, exhibits a near-uniform spread across the specified range, reflecting the randomized input conditions. Correspondingly, the charging-duration histogram shows a mean charging time of approximately 3.35 h, with energy requirements averaging 22.3 kWh per EV, as illustrated in the second and third subplots, respectively. The scatter plot of start versus end times, color-coded by initial SOC, reveals a positive correlation between these temporal parameters, with EVs exhibiting lower initial SOC (depicted in blue) requiring longer charging sessions and consequently later end times.
Figure 2.
EV charging demand characteristics under variable initial SOC conditions.
The SOC trajectories throughout the day are visualized through both individual EV profiles and a comprehensive heatmap, illustrating the progressive charging behavior as EVs reach the target SOC of 90%. The average SOC profile, presented with its standard deviation bands, shows a gradual increase from approximately 0.55 at the start of the day to 0.90 by late afternoon, reflecting the cumulative effect of charging events. The aggregated demand profile indicates a peak power demand of 315.0 kW occurring at 11.5 h, corresponding to a peak of 45 concurrently connected EVs. The power demand exhibits a unimodal distribution with a pronounced morning peak, gradually declining throughout the afternoon as EVs complete their charging cycles. The number of connected EVs follows a similar temporal pattern, confirming the alignment between connection events and the assumed start-time probability distribution for the public charging scenario.
As demonstrated in Table 3, the SOC-dependent charging strategy offers substantial advantages over fixed-duration (8 h) charging across multiple operational metrics. The peak power demand is reduced by 52.6%, from 665.0 kW under fixed-duration charging to 315.0 kW under the SOC-dependent approach, while the peak demand time shifts earlier from 14.5 h to 11.5 h, enabling more effective grid load management. Furthermore, total daily energy consumption decreases by 58.0%, from 5.60 MWh to 2.35 MWh, with a corresponding reduction in average power from 228.4 kW to 96.0 kW. These significant reductions are attributable to SOC-dependent charging, which aligns the actual energy requirement of each EV—based on its initial state of charge—with the necessary charging duration, thereby avoiding the over-provisioning inherent in fixed-duration strategies. Consequently, SOC-dependent charging presents a more efficient and grid-friendly alternative for public EV charging infrastructure.
Table 3.
SOC-dependent versus fixed-duration charging.
Based on the comprehensive statistics presented in Table 4, the SOC-dependent charging simulation reveals several critical insights into EV charging behavior under variable initial SOC conditions. The battery capacity of 60.0 kWh and charging power of 7.0 kW at 95% efficiency represent typical EV parameters, providing a realistic basis for analysis. The average initial SOC of 0.529, spanning 0.20 to 0.90, yields an average energy requirement of 22.25 kWh per EV, corresponding to a charging duration of 3.35 h. The wide variation in charging durations underscores the heterogeneity of EV charging demands. Despite this variability, the total energy delivered across the 100-EV fleet amounts to 2.35 MWh, with a peak power demand of 315.0 kW coinciding with 45 concurrently connected EVs. These statistics demonstrate that SOC-dependent charging effectively accommodates diverse user scenarios while maintaining grid-friendly demand characteristics, with peak power demand remaining substantially lower than under fixed-duration charging assumptions.
Table 4.
SOC-dependent charging statistics.
For clarity, the following assumptions were adopted in the EVCS simulations: (i) battery capacity was fixed at 60 kWh with a rated charging power of 7 kW and 95% efficiency, representing typical EV specifications; (ii) initial SOC values were randomly assigned within the range of 0.20–0.90 to capture heterogeneity in user arrival conditions; (iii) arrival and departure times were generated using probability density functions derived from the 2017 NHTS dataset, ensuring realistic temporal distributions of charging events; (iv) target SOC was set at 90% to reflect practical charging behavior and avoid overcharging; (v) charging demand profiles were modeled through a Monte Carlo approach, incorporating stochastic variation in duration and energy requirements; and (vi) infrastructure constraints assumed sufficient station capacity to accommodate up to 45 concurrently connected EVs, consistent with observed peak demand. These assumptions provide a transparent basis for the reported results and ensure that the simulations reflect realistic EVCS operating conditions while maintaining reproducibility.
4. Simulation Results
All simulations were carried out on a unified hardware and software platform to ensure consistency and eliminate performance variations arising from computational differences. The experiments were executed on a laptop equipped with an Intel Core i7 (8th Generation) processor and 16 GB of RAM, running Windows 11. All algorithmic implementations and numerical evaluations were performed in MATLAB R2022. Using a consistent computational environment ensures that the reported execution times, convergence characteristics, and comparative performance results remain directly comparable across all experiments.
4.1. Simulations of Standard Test Functions
Both RUN and IRUN were executed using the same initial population size, dimensionality, and maximum number of iterations to ensure fairness. For IRUN, the adaptive components—success-history memory, archive mechanism, and population-reduction schedule—were activated throughout the entire optimization process. For RUN, all parameters were kept fixed according to the original formulation. The key parameters are an initial population size of 30 and a maximum of 100 iterations.
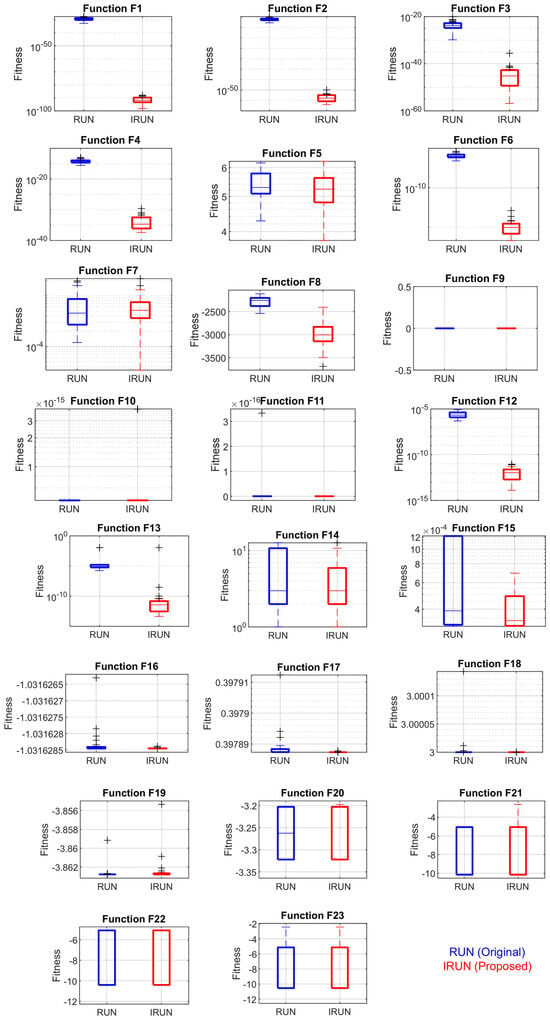
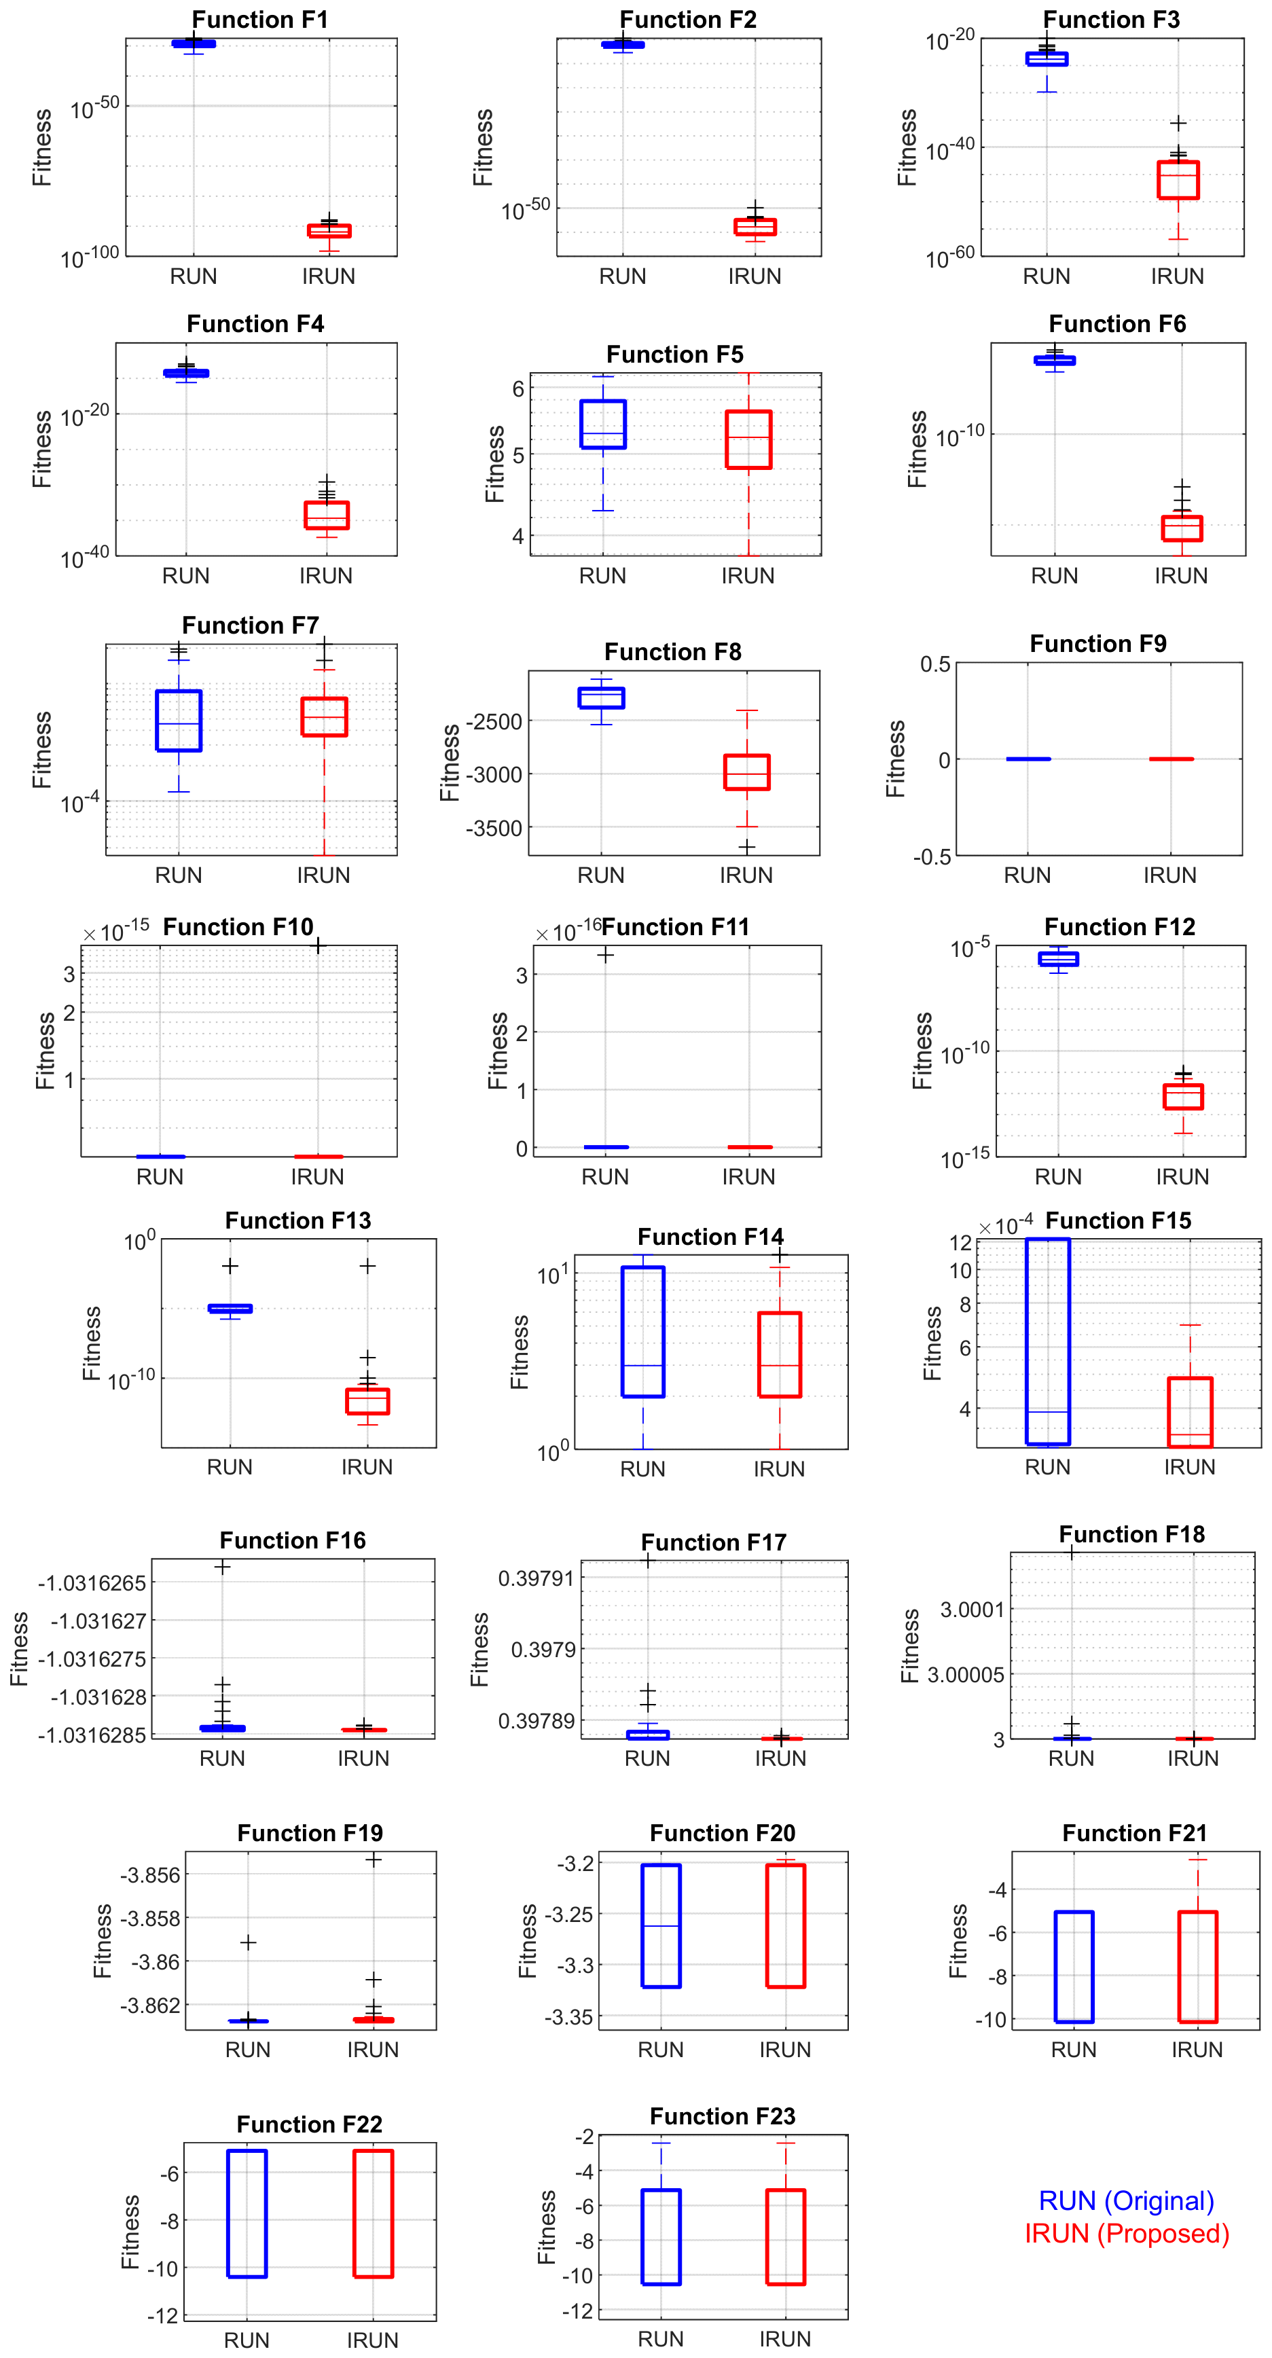
The boxplot results, shown in Figure 3, and descriptive statistics consistently demonstrate that the Improved Runge–Kutta algorithm (IRUN) outperforms the standard RUN across the benchmark functions. For unimodal and simple multimodal functions, IRUN achieves superior convergence precision, as evidenced by considerably lower median values and narrower interquartile ranges, indicating not only better final solutions but also greater consistency across independent runs. The adaptive mechanisms unique to IRUN—namely, success-history memory, an archive mechanism, and a population-reduction schedule—enable the algorithm to exploit the search space more effectively, leading to solutions that are frequently orders of magnitude more accurate than those obtained by RUN.
Figure 3.
Boxplot comparison of RUN (blue) and IRUN (red) on benchmark functions F1–F23.
This performance advantage becomes even more pronounced for complex multimodal and composite functions, where IRUN consistently exhibits tighter distributions, more negative quartiles, and reduced solution variance. The archive mechanism and success-history memory appear to facilitate a more effective balance between exploration and exploitation, allowing IRUN to escape suboptimal local minima and converge more reliably near the global optimum. Across all twenty-three functions, the combination of reduced median error, compressed interquartile ranges, and superior quartile values confirms that the adaptive components integrated into IRUN yield a statistically significant and practically meaningful improvement over the fixed-parameter RUN formulation.
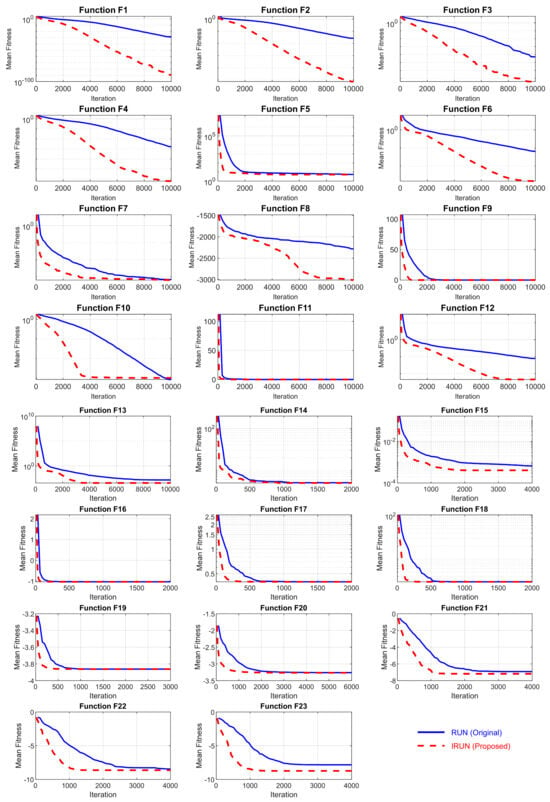
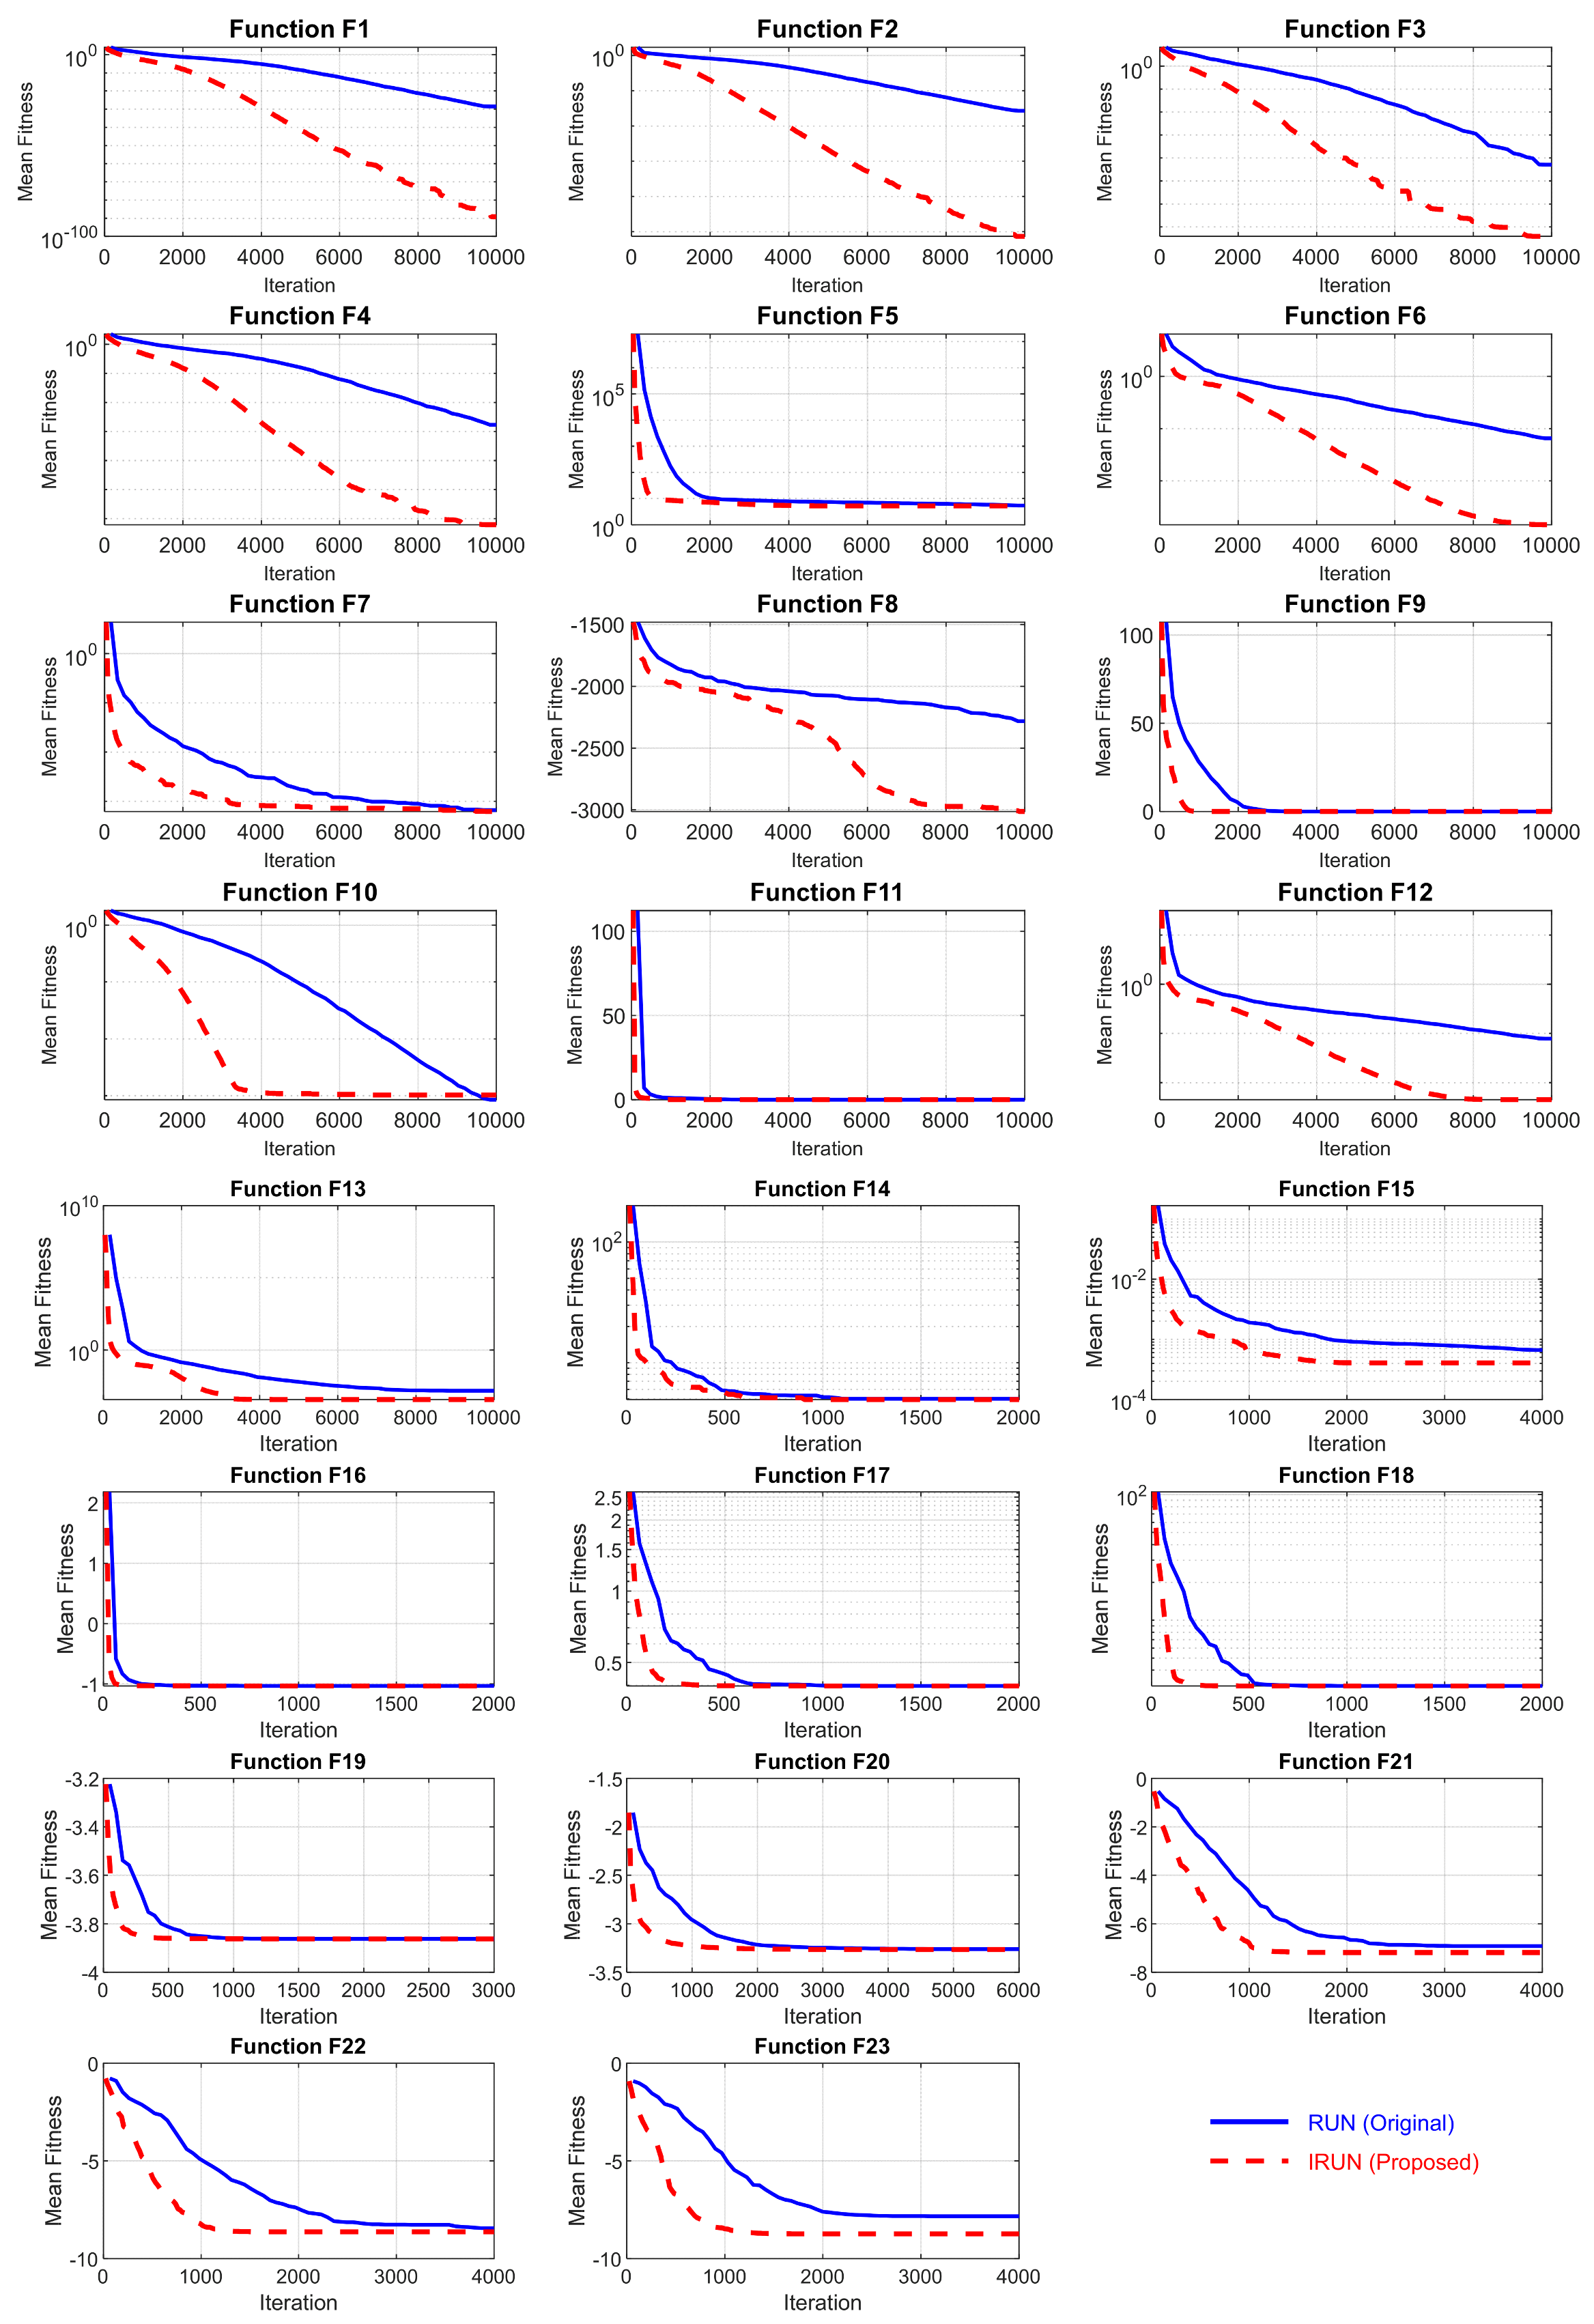
The convergence trajectories in the mean fitness plots (see Figure 4) clearly illustrate the enhanced capability of the Improved Runge–Kutta algorithm (IRUN) compared with the original RUN across the full suite of benchmark functions. For the unimodal and simple multimodal functions F1 through F12, IRUN demonstrates markedly faster and more stable convergence, consistently attaining superior mean fitness values at earlier iteration counts. In contrast, RUN exhibits a tendency to stagnate or converge to suboptimal regions, particularly evident in functions where RUN’s mean fitness remains unchanged across iterations, while IRUN continues to progress toward the global optimum. This behavior underscores the effectiveness of IRUN’s adaptive mechanisms—success-history memory, archive strategy, and population reduction—in maintaining search momentum and preventing premature convergence, even under identical initialization and iteration budgets tailored to each function’s complexity.
Figure 4.
Convergence trajectories of RUN and IRUN on benchmark functions F1–F23.
For the more challenging multimodal and composite functions F13 through F23, the superiority of IRUN becomes even more pronounced. On functions such as F13 and F14, IRUN achieves substantially lower mean fitness values, reflecting its improved ability to navigate complex landscapes with numerous local optima. The trajectories for F19 through F23 further reveal that IRUN consistently reaches near-optimal or optimal regions, whereas RUN often converges to lower optimized values. Notably, on functions where RUN exhibits flat or slowly declining trajectories, IRUN maintains progressive improvement throughout the optimization process, indicating that its adaptive components effectively balance exploration and exploitation. Collectively, the convergence profiles confirm that IRUN not only achieves higher-quality final solutions but also does so with greater efficiency and robustness across diverse problem characteristics, validating the algorithmic enhancements introduced in the improved variant.
The statistical summary in Table 5 provides compelling quantitative evidence of the superiority of the Improved Runge–Kutta (IRUN) algorithm over the standard RUN across the classical benchmark functions. Across the majority of the 23 functions, IRUN achieves substantially lower mean and standard deviation values, indicating both improved solution quality and greater consistency. For unimodal functions such as F1 through F4, IRUN attains mean values several orders of magnitude smaller than those of RUN, with similarly reduced standard deviations, reflecting the effectiveness of its adaptive mechanisms in promoting precise convergence. On multimodal functions like F8, IRUN achieves a considerably more negative mean and best value, demonstrating enhanced capability to escape local optima and approach the global optimum. Even on functions where both algorithms perform comparably, such as F9, F16, F17, and F18, IRUN either matches or exceeds RUN’s performance with notably smaller standard deviations, underscoring its robustness. The aggregated statistical metrics further reinforce this conclusion. The Friedman test yields a p-value of 0.000124, confirming a statistically significant difference between the two algorithms, with IRUN achieving a superior average rank of 1.1087 compared to RUN’s 1.8913. The win/loss/tie record is decisive, with IRUN winning 20 functions, losing only 2, and tying 1. Collectively, these results demonstrate that the adaptive components integrated into IRUN—success-history memory, archive mechanism, and population-reduction schedule—consistently yield statistically significant improvements in both convergence accuracy and algorithmic stability across diverse problem landscapes.
Table 5.
Statistical comparisons of benchmark functions F1–F23.
The sensitivity analysis presented in Table 6 provides a comprehensive evaluation of the robustness of RUN and IRUN under variations in the three principal algorithmic parameters: number of iterations, population size, and maximum number of function evaluations (NFE). Across all tested scenarios, IRUN consistently achieves lower average mean values and superior best solutions compared to RUN, thereby confirming its enhanced convergence capability and solution quality. Although RUN occasionally exhibits slightly lower variability, as reflected in its average standard deviation, this stability is accompanied by inferior mean and best performance. The results demonstrate that IRUN’s improvements are not confined to a specific parameter configuration but persist across different computational budgets and search settings. This robustness highlights the effectiveness of the success-history adaptation and population reduction mechanisms in IRUN, which enable the algorithm to maintain superior optimization outcomes even when the evaluation budget or population size is altered. Consequently, the sensitivity analysis substantiates that IRUN offers a more efficient and reliable optimization framework than RUN, with advantages that remain evident under diverse parameter variations.
Table 6.
Sensitivity analysis.
4.2. Simulation of Distribution Systems Under Full-Load
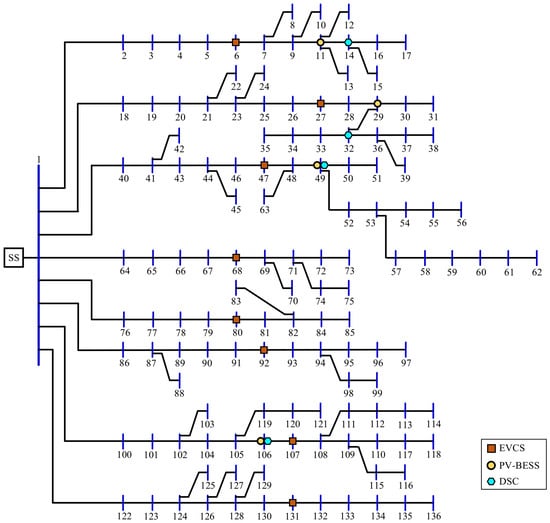
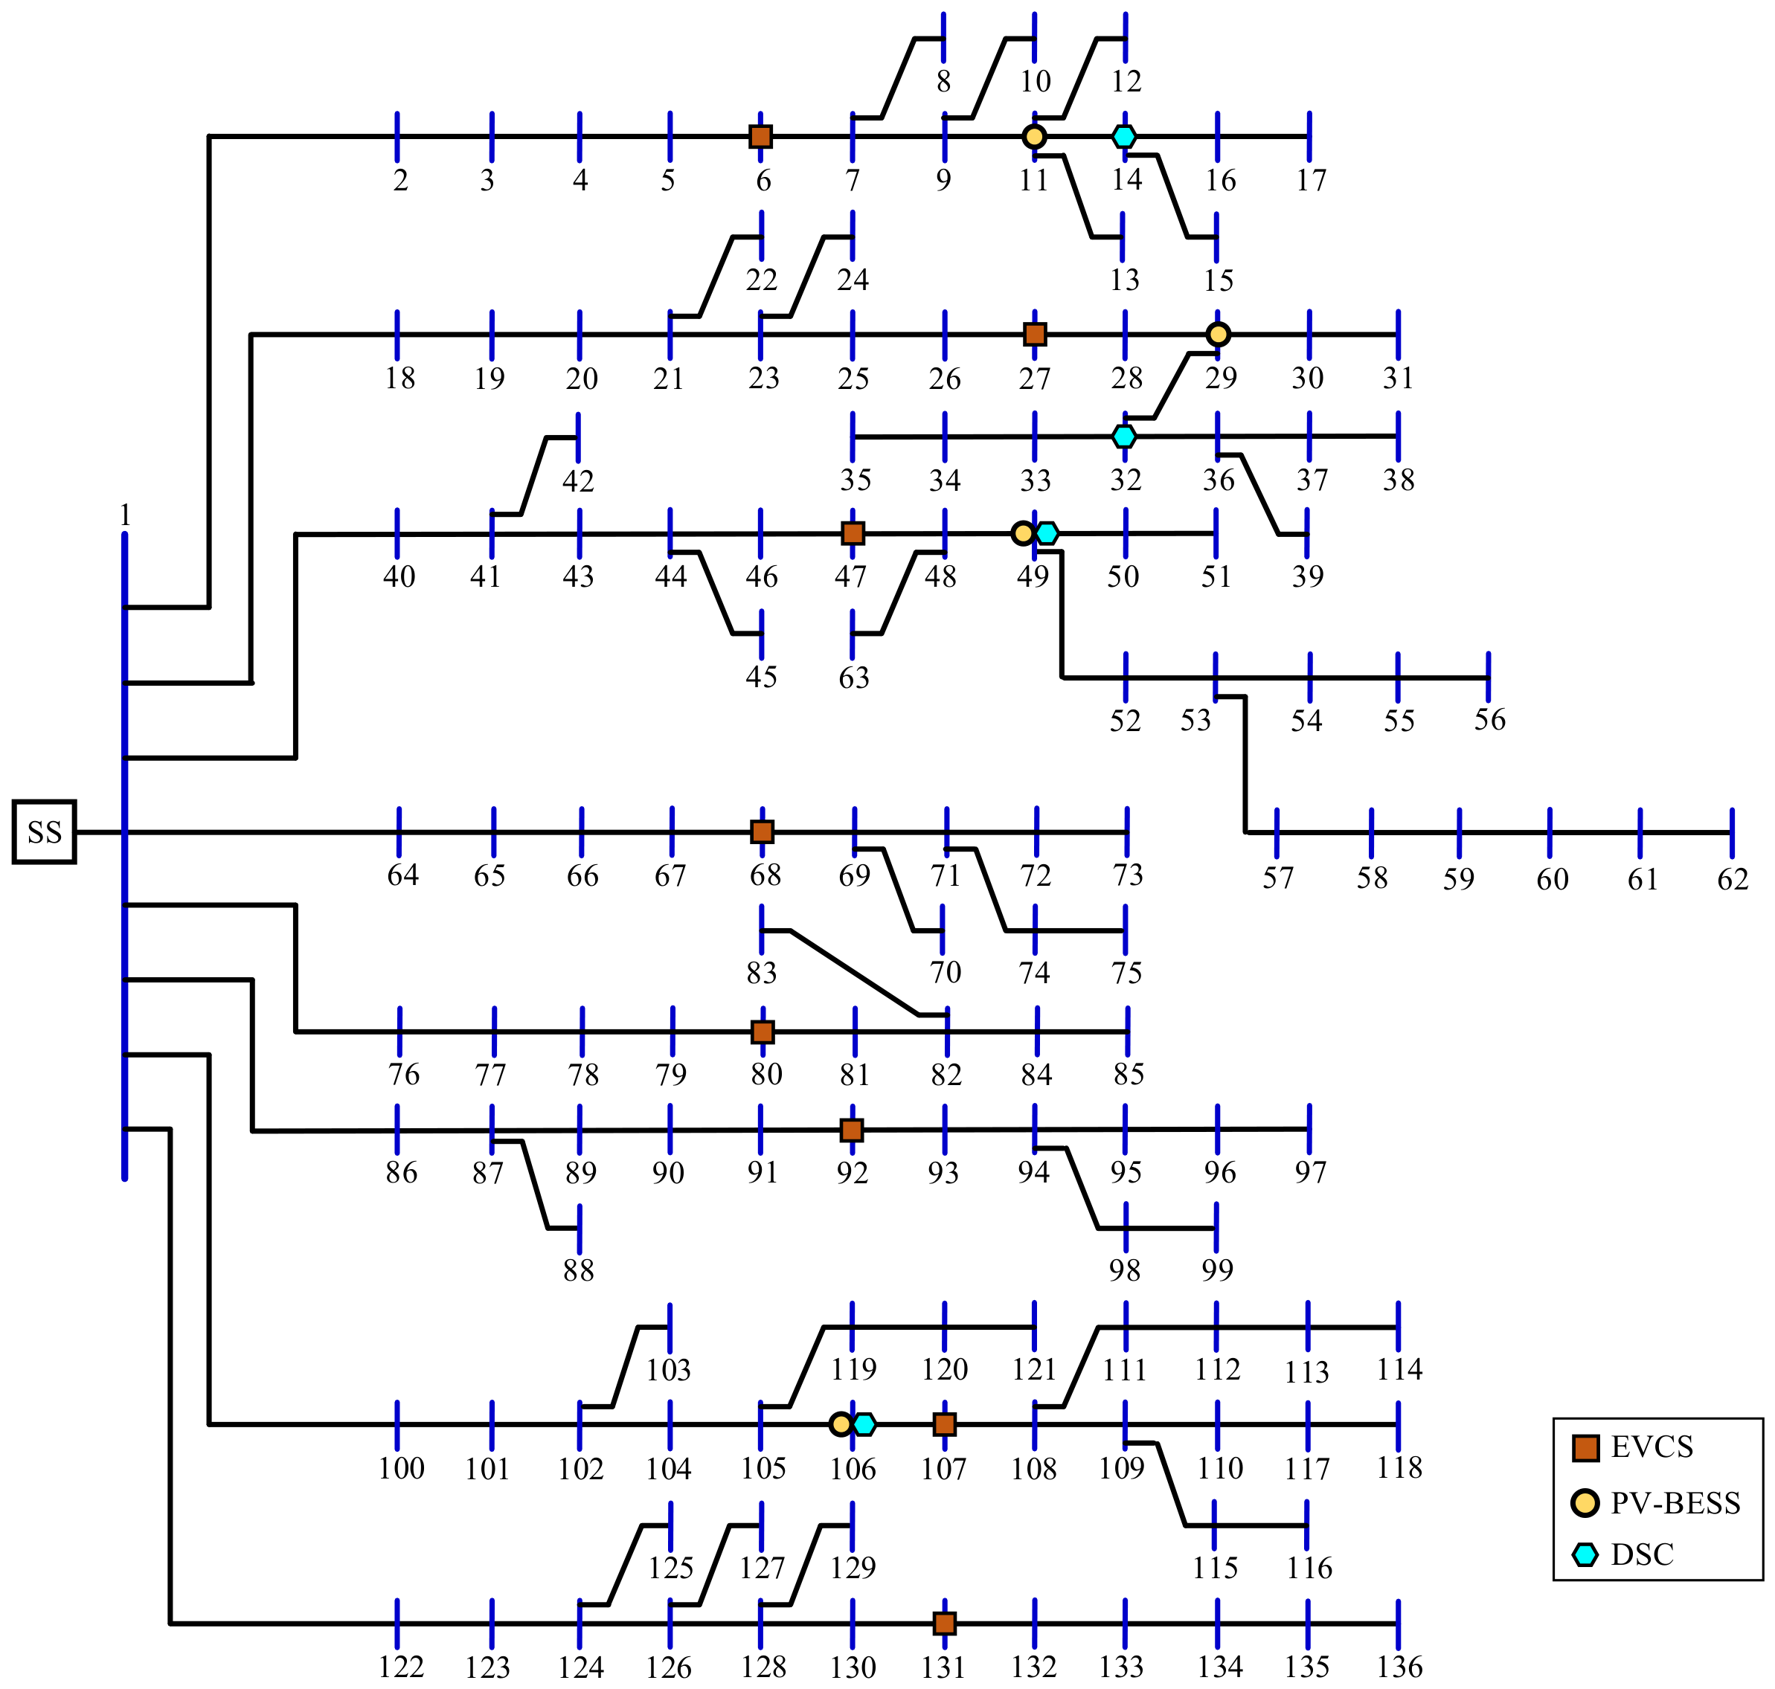
The performance of the proposed IRUN algorithm is rigorously evaluated on a benchmark 136-bus distribution system [5], shown in Figure 5, which compares its effectiveness against the original RUN algorithm across key metrics, including total power loss minimization, voltage profile improvement, computational efficiency, and convergence behavior under varying load conditions and levels of renewable energy penetration. The simulation includes the single full-load optimization case and the 24 h operation, incorporating renewable energy sources and EV fleets. The 136-bus system is simulated under a full-load optimization case study, incorporating four distributed generators (DGs) placed at optimal locations and sized using both the original RUN and the proposed IRUN algorithms. To account for the stochastic nature of metaheuristic optimization methods, each algorithm is executed 30 times to minimize system power losses, and the results are analyzed statistically. The statistical evaluation encompasses key metrics such as the mean, minimum, maximum, median, and range of power loss values. Additionally, the optimal DG sizes and locations are identified from the best-performing run of each algorithm.
Figure 5.
The 136-bus distribution system layout with EVCS, PV-BESS, and DSC buses.
Based on the results presented in Table 6, the proposed IRUN algorithm outperforms the original RUN algorithm across all statistical metrics evaluated under full-load conditions. The mean power loss achieved by IRUN is 143.8846 kW, which is notably lower than the 145.5247 kW obtained by the original RUN, indicating a consistent improvement in solution quality. Furthermore, the standard deviation of IRUN is substantially reduced to 0.2904, compared with 1.9992 for RUN, indicating significantly greater stability and robustness in the optimization outcomes across the 30 independent runs. The consistency of the IRUN algorithm is further evidenced by the reduced range between the minimum and maximum power loss values. While RUN exhibits a wide range of 6.1482 kW, IRUN achieves a considerably narrower range of 1.2604 kW, underscoring its ability to converge toward near-optimal solutions with minimal variability. Notably, the minimum power loss values for both algorithms are nearly identical, at approximately 143.6089 kW and 143.6086 kW for RUN and IRUN, respectively, suggesting that both algorithms identify comparable optimal solutions. However, the superior performance of IRUN is most evident in the maximum and median values, where IRUN records 144.8693 kW and 143.8488 kW, respectively, compared to RUN’s 149.7568 kW and 144.7846 kW. These results indicate that IRUN exhibits enhanced reliability by consistently avoiding poor-quality solutions.
Regarding the optimal placement and sizing of the five distributed generators, both algorithms converge to identical optimal bus locations. This consistency in site selection reinforces the validity of these locations as critical points for loss minimization within the 136-bus distribution system. The corresponding optimal DG sizes obtained by both algorithms are also closely aligned, with IRUN yielding marginally adjusted values that collectively contribute to the overall reduction in total power loss. The statistical comparison confirms that the proposed IRUN algorithm outperforms the original RUN in terms of solution accuracy, convergence stability, and consistency across multiple runs. The notable improvements in standard deviation, range, and maximum loss values highlight the algorithm’s enhanced exploration–exploitation balance, making it a more reliable and effective tool for optimal DG placement and sizing in large-scale distribution systems under full-load conditions.
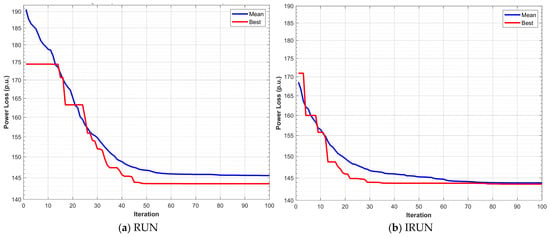
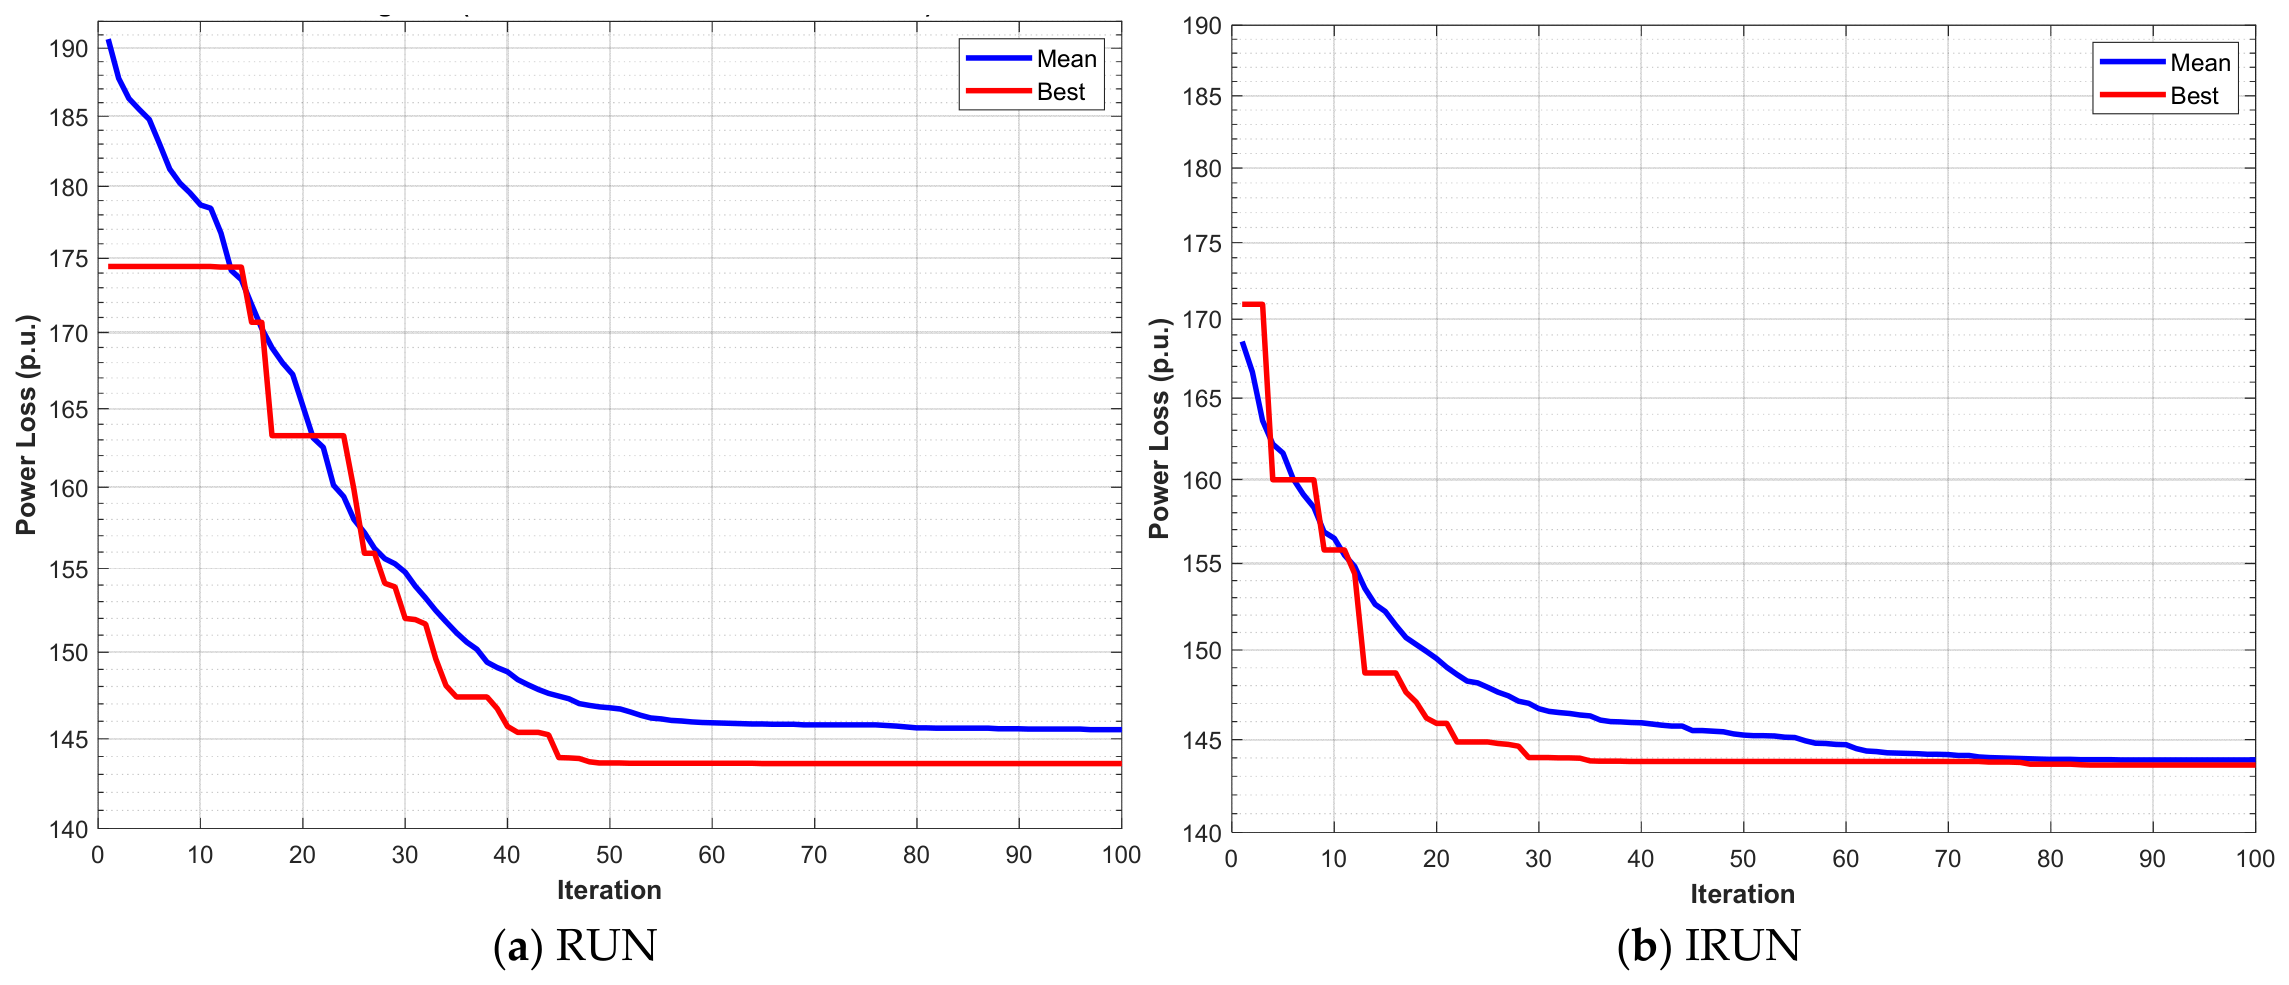
Based on the convergence characteristics illustrated in Figure 6, a comparative analysis of the original RUN and the proposed IRUN algorithms reveals distinct behavioral patterns in their mean and best power loss trajectories throughout the optimization process. The IRUN algorithm demonstrates superior convergence behavior compared to the original RUN across both the mean and best power loss metrics. From the initial iteration, IRUN exhibits a steeper decline in mean power loss and rapidly drops by iteration 30, whereas RUN starts at a higher mean value and shows a more gradual reduction. This indicates that IRUN possesses enhanced initial exploration capabilities, enabling it to quickly identify promising regions within the search space. The best power loss curves further reinforce this observation, with IRUN achieving a lower best value than RUN’s, indicating a notable improvement in solution quality. Regarding stability characteristics, IRUN exhibits tighter coupling between its mean and best convergence curves throughout the optimization process. The narrow gap between the mean and best curves for IRUN suggests that the algorithm maintains consistent performance across multiple runs, with most solutions converging toward near-optimal values with minimal deviation. In contrast, RUN exhibits greater divergence between its mean and best curves, particularly in the early and last iterations, indicating greater variability in solution quality and a tendency to produce a broader spread of outcomes. This observation aligns with the statistical results presented in Table 7, where IRUN exhibits substantially lower standard deviation and range.
Figure 6.
Mean and best convergence profiles of RUN and IRUN algorithms with integrating DGs.
Table 7.
Statistical comparisons of power loss at full-load condition with DGs.
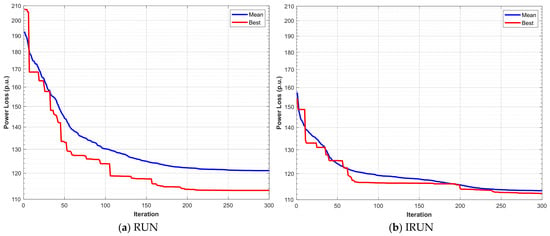
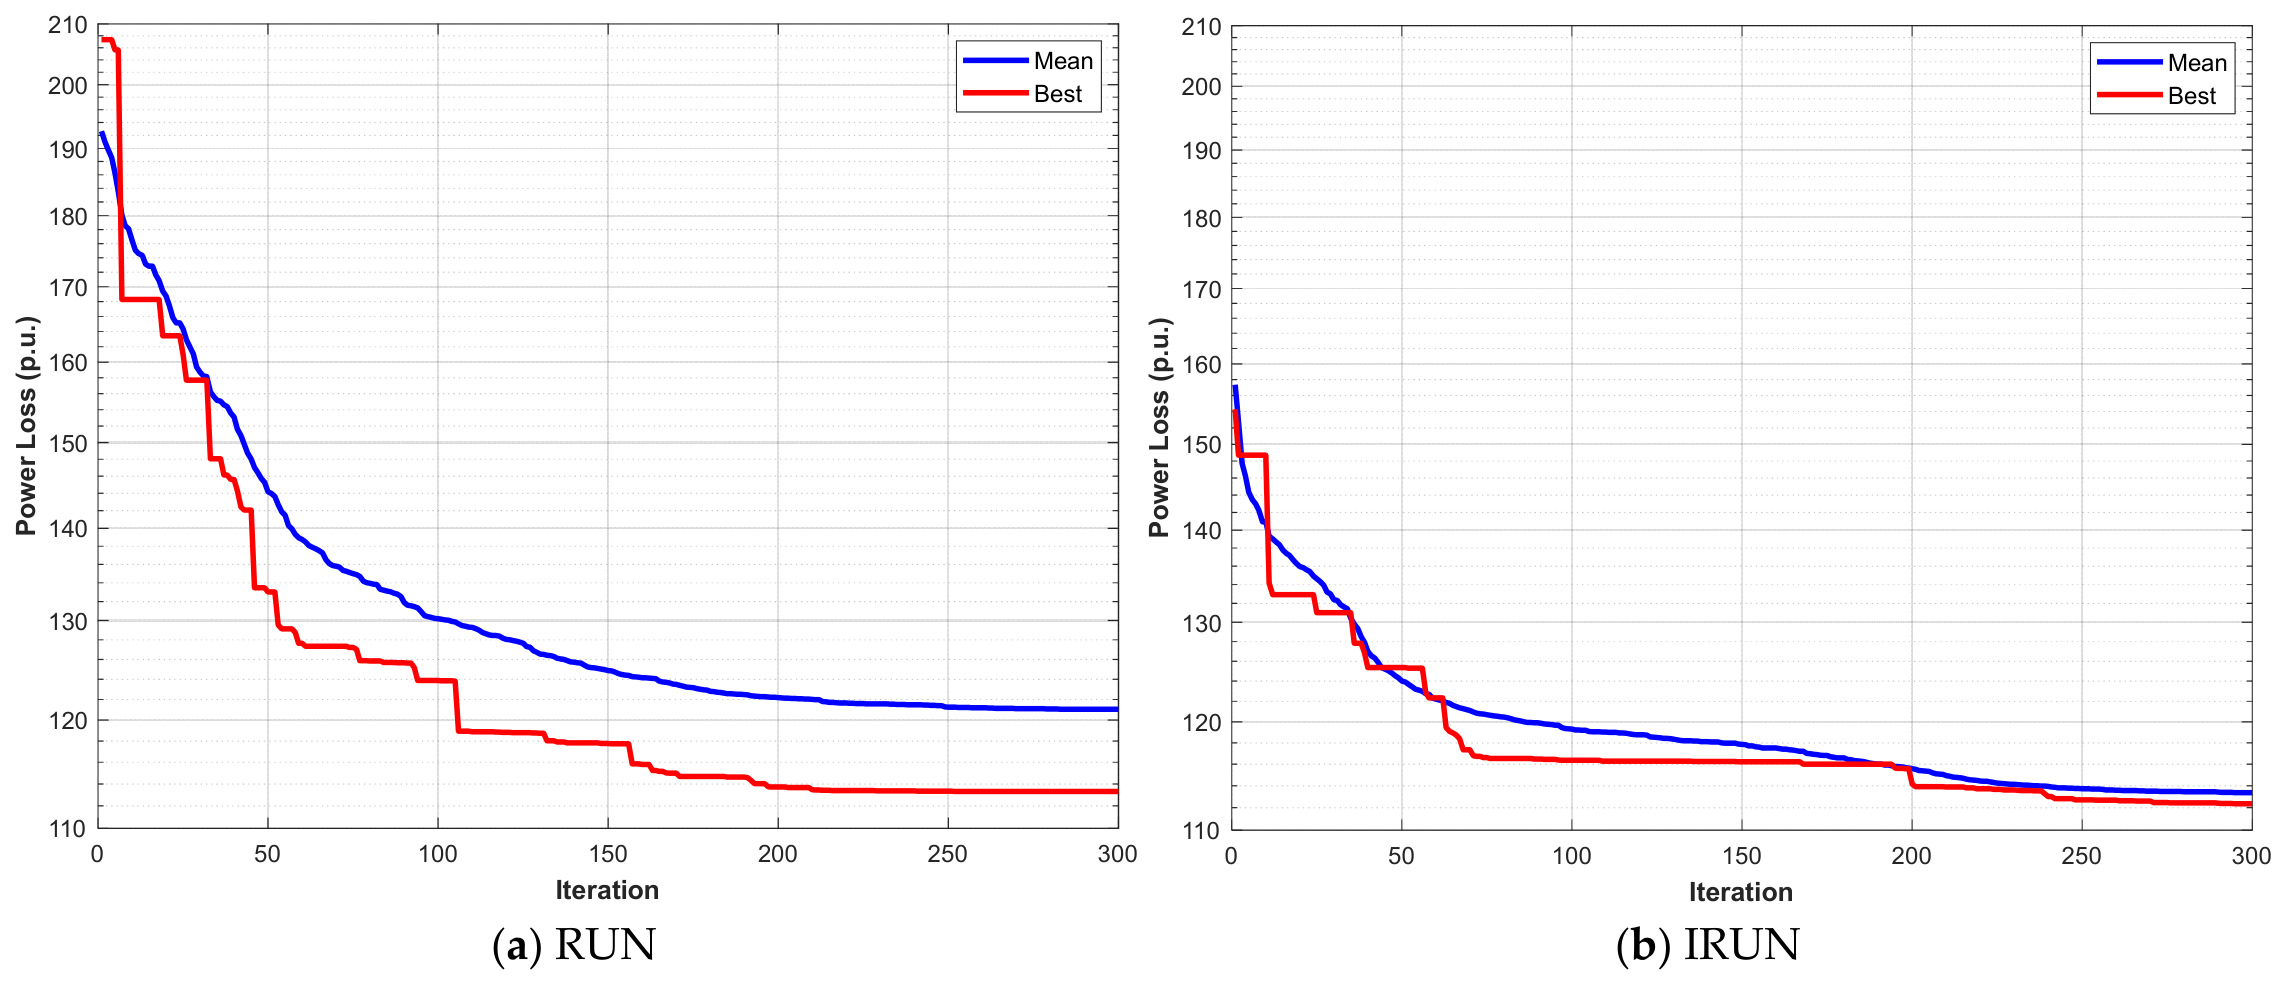
In a similar study, the two algorithms optimize four DGs and four DSCs under full-load conditions. The comparison presented in Table 8 demonstrates the superior performance of the proposed IRUN algorithm over the original RUN algorithm. It is clear that IRUN achieves a lower mean power loss of 113.3621 kW compared to RUN’s 121.0376 kW, representing a 6.34% improvement. The standard deviation is also substantially reduced by 82.30%, from 6.8124 to 1.2058, indicating markedly enhanced stability and consistency across multiple runs. The maximum power loss is reduced by 11.63%, from 133.1076 kW to 117.6208 kW, and the range narrows from 19.7884 kW to 5.2525 kW, reflecting a 73.46% improvement. The convergence characteristics illustrated in Figure 7 further corroborate IRUN’s superiority, as the algorithm exhibits faster convergence speed and achieves lower mean and best power loss values throughout the optimization process. Collectively, these results affirm that IRUN possesses superior solution quality, robustness, and convergence capability compared to RUN for the optimal placement and sizing of DG and DSC in distribution systems.
Table 8.
Statistical comparisons of power loss at full-load condition with DGs and DSCs.
Figure 7.
Mean and best convergence profiles of RUN and IRUN algorithms with integrating DGs and DSCs.
4.3. Continuous Optimization over 24 h Horizon
The EV demand is integrated into the 136-bus distribution system, which includes a PV source and a battery energy storage system (BESS). The BESS system consumes excess energy when available and provides energy where needed. It is worth noting that in this study, the EVs operate only in G2V mode. It is assumed that the city council and the utility selected the best eight locations for the EVCSs on buses 6, 27, 47, 68, 80, 92, 107, and 131, with only one station per main feeder in the 136-bus system.
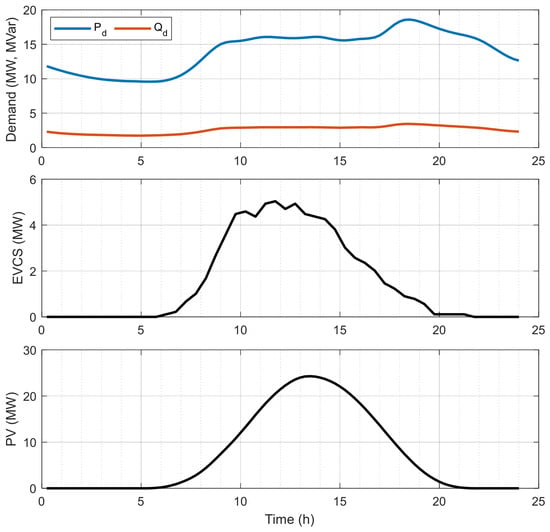
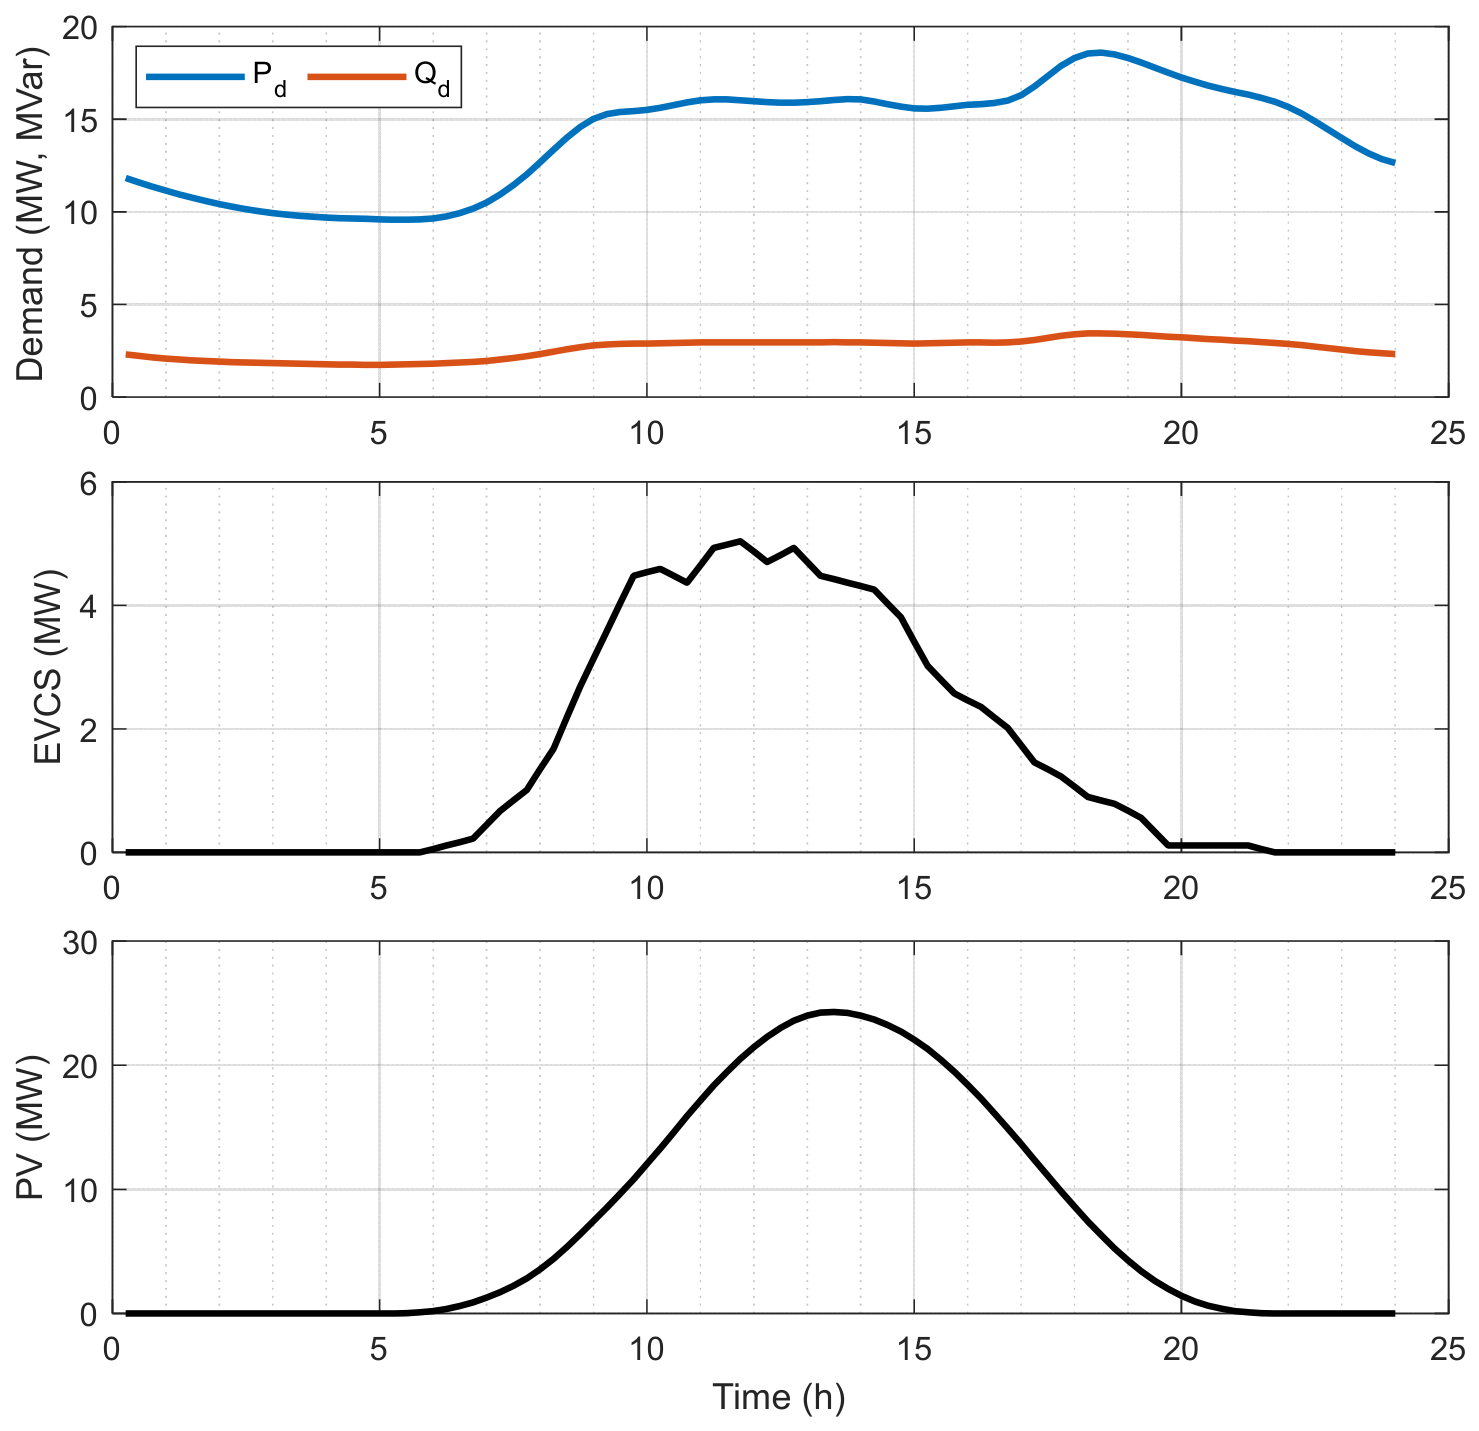
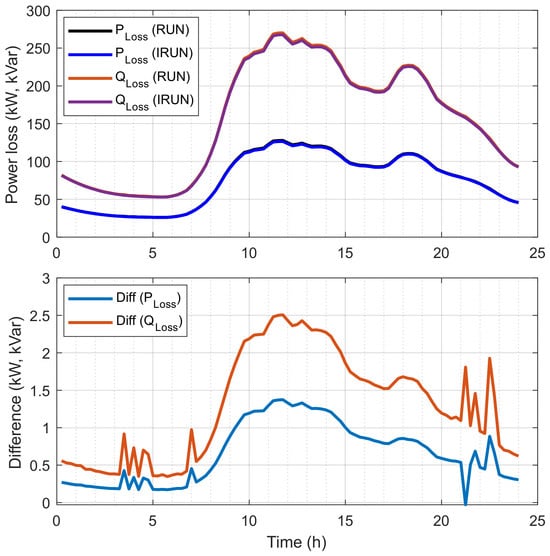
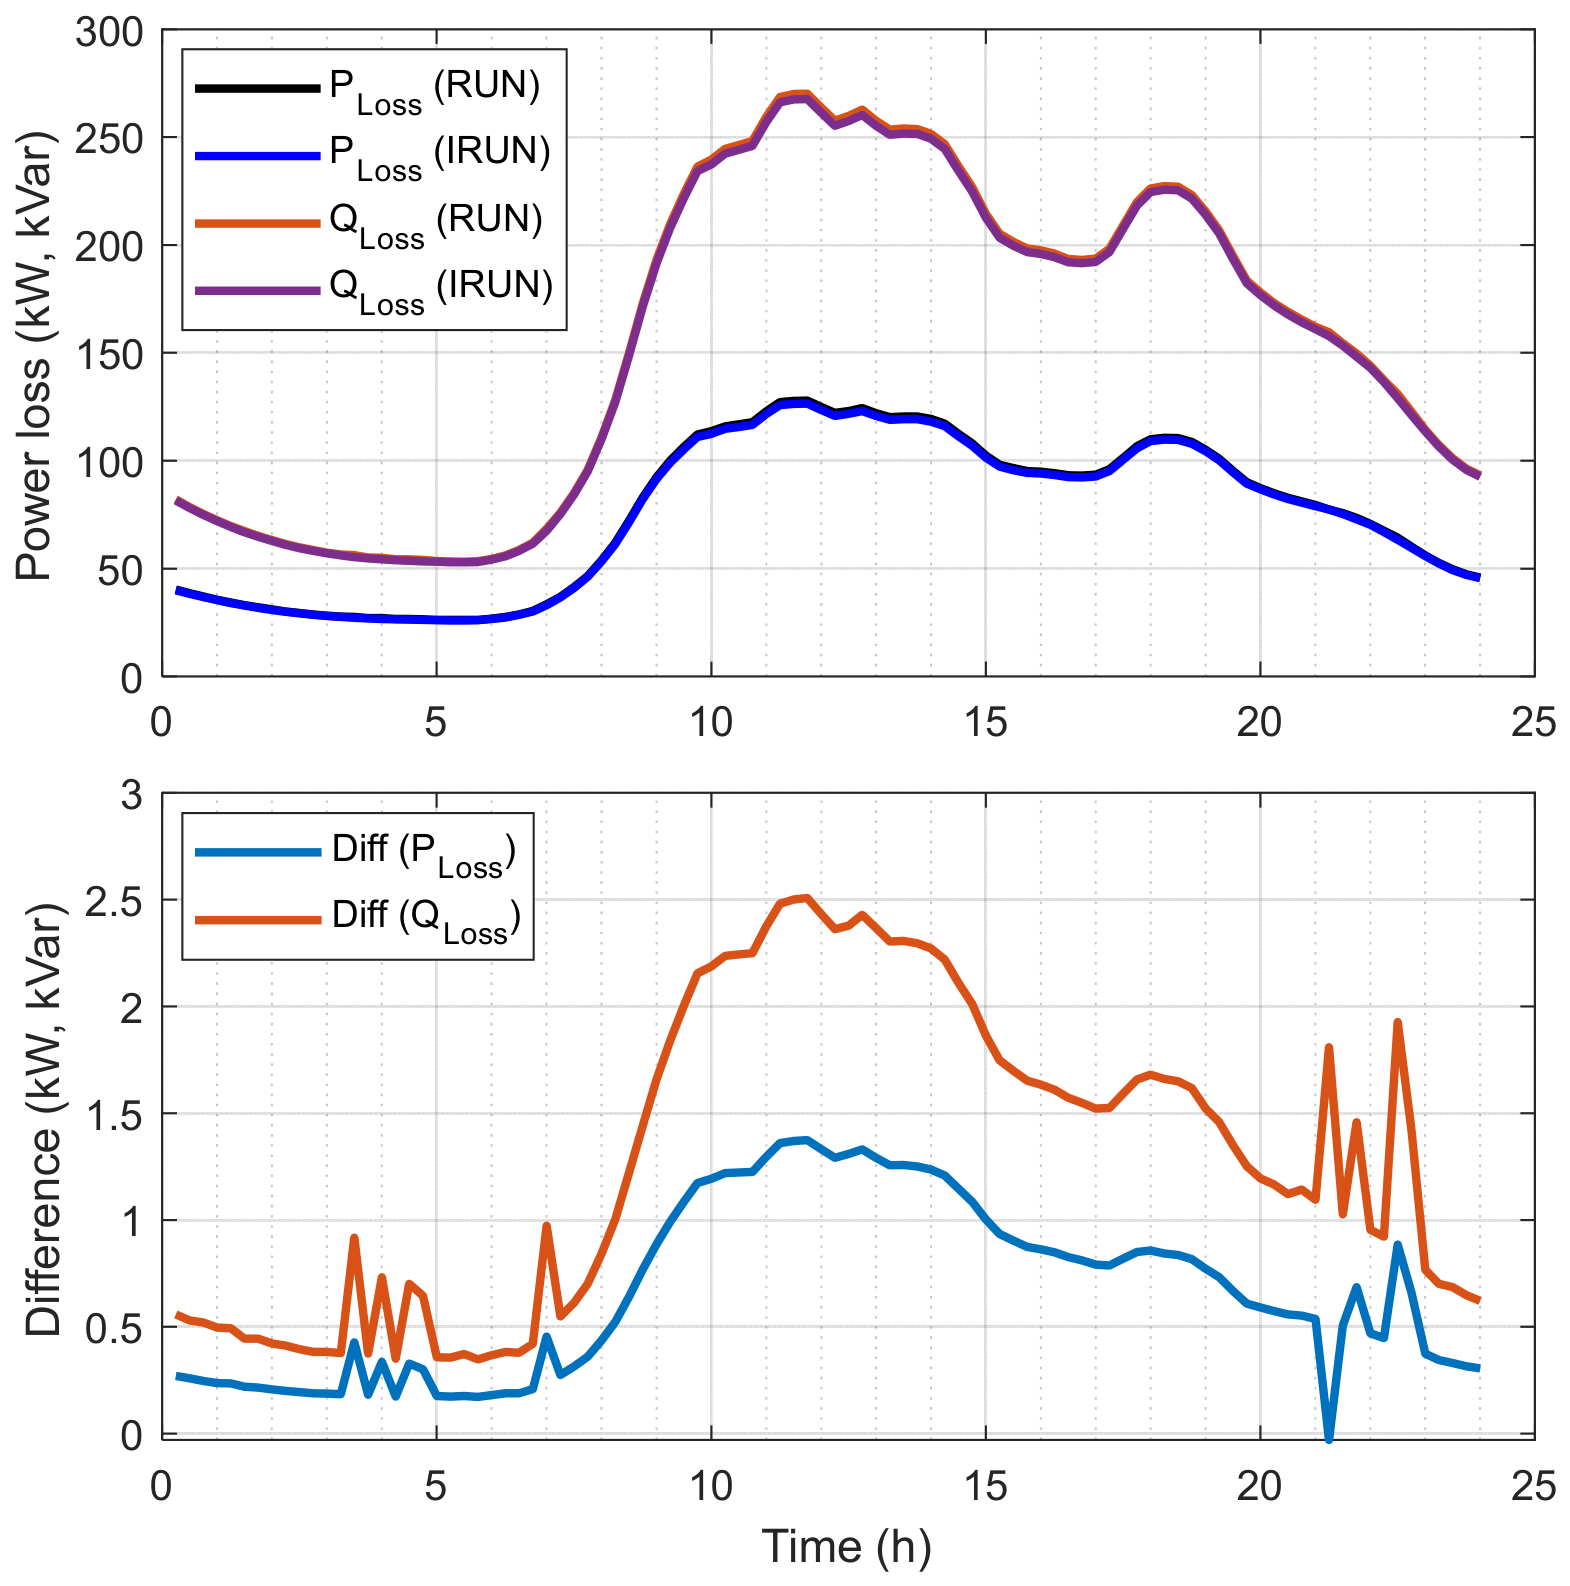
To connect EVCSs, PV generation units, DSTATCOM (DSC) devices, and BESS, a 24 h simulation is required to study the system’s behavior over a complete cycle. The 136-bus system is simulated using these devices, with demand shown in Figure 8, distributed demand from the EVCSs, and associated PV power generation. The distribution system is simulated and optimized twice with the original RUN and the improved IRUN algorithms. Active and reactive power losses of the 136-bus distribution system optimized using the RUN and IRUN algorithms over a 24 h horizon are shown in Figure 9. The upper panel compares the active and reactive power losses obtained from the baseline RUN algorithm and the enhanced IRUN algorithm. Across the daily operating cycle, IRUN consistently achieves lower and , reflecting its improved capability to coordinate distributed energy resources and mitigate network losses. The lower panel illustrates the corresponding loss differences, defined as (). Positive values indicate periods when IRUN outperforms RUN by reducing losses. The sustained positive margins across most hours underscore the effectiveness of the improved optimization strategy in enhancing system efficiency.
Figure 8.
The system demand, EVCS demand, and PV power over a 24 h horizon.
Figure 9.
Active and reactive power losses of the 136-bus distribution system optimized using the RUN and IRUN algorithms over a 24 h horizon.
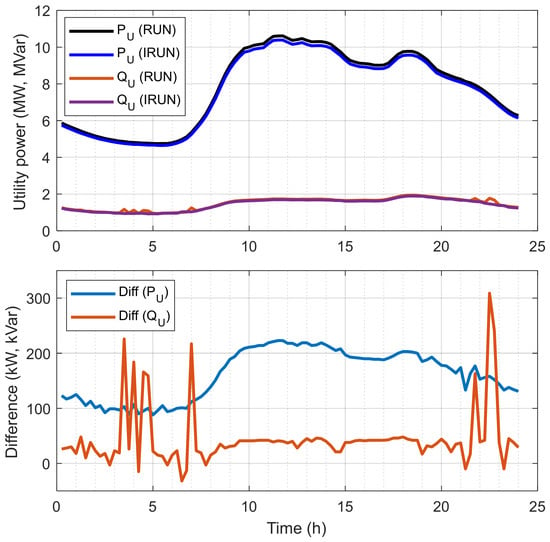
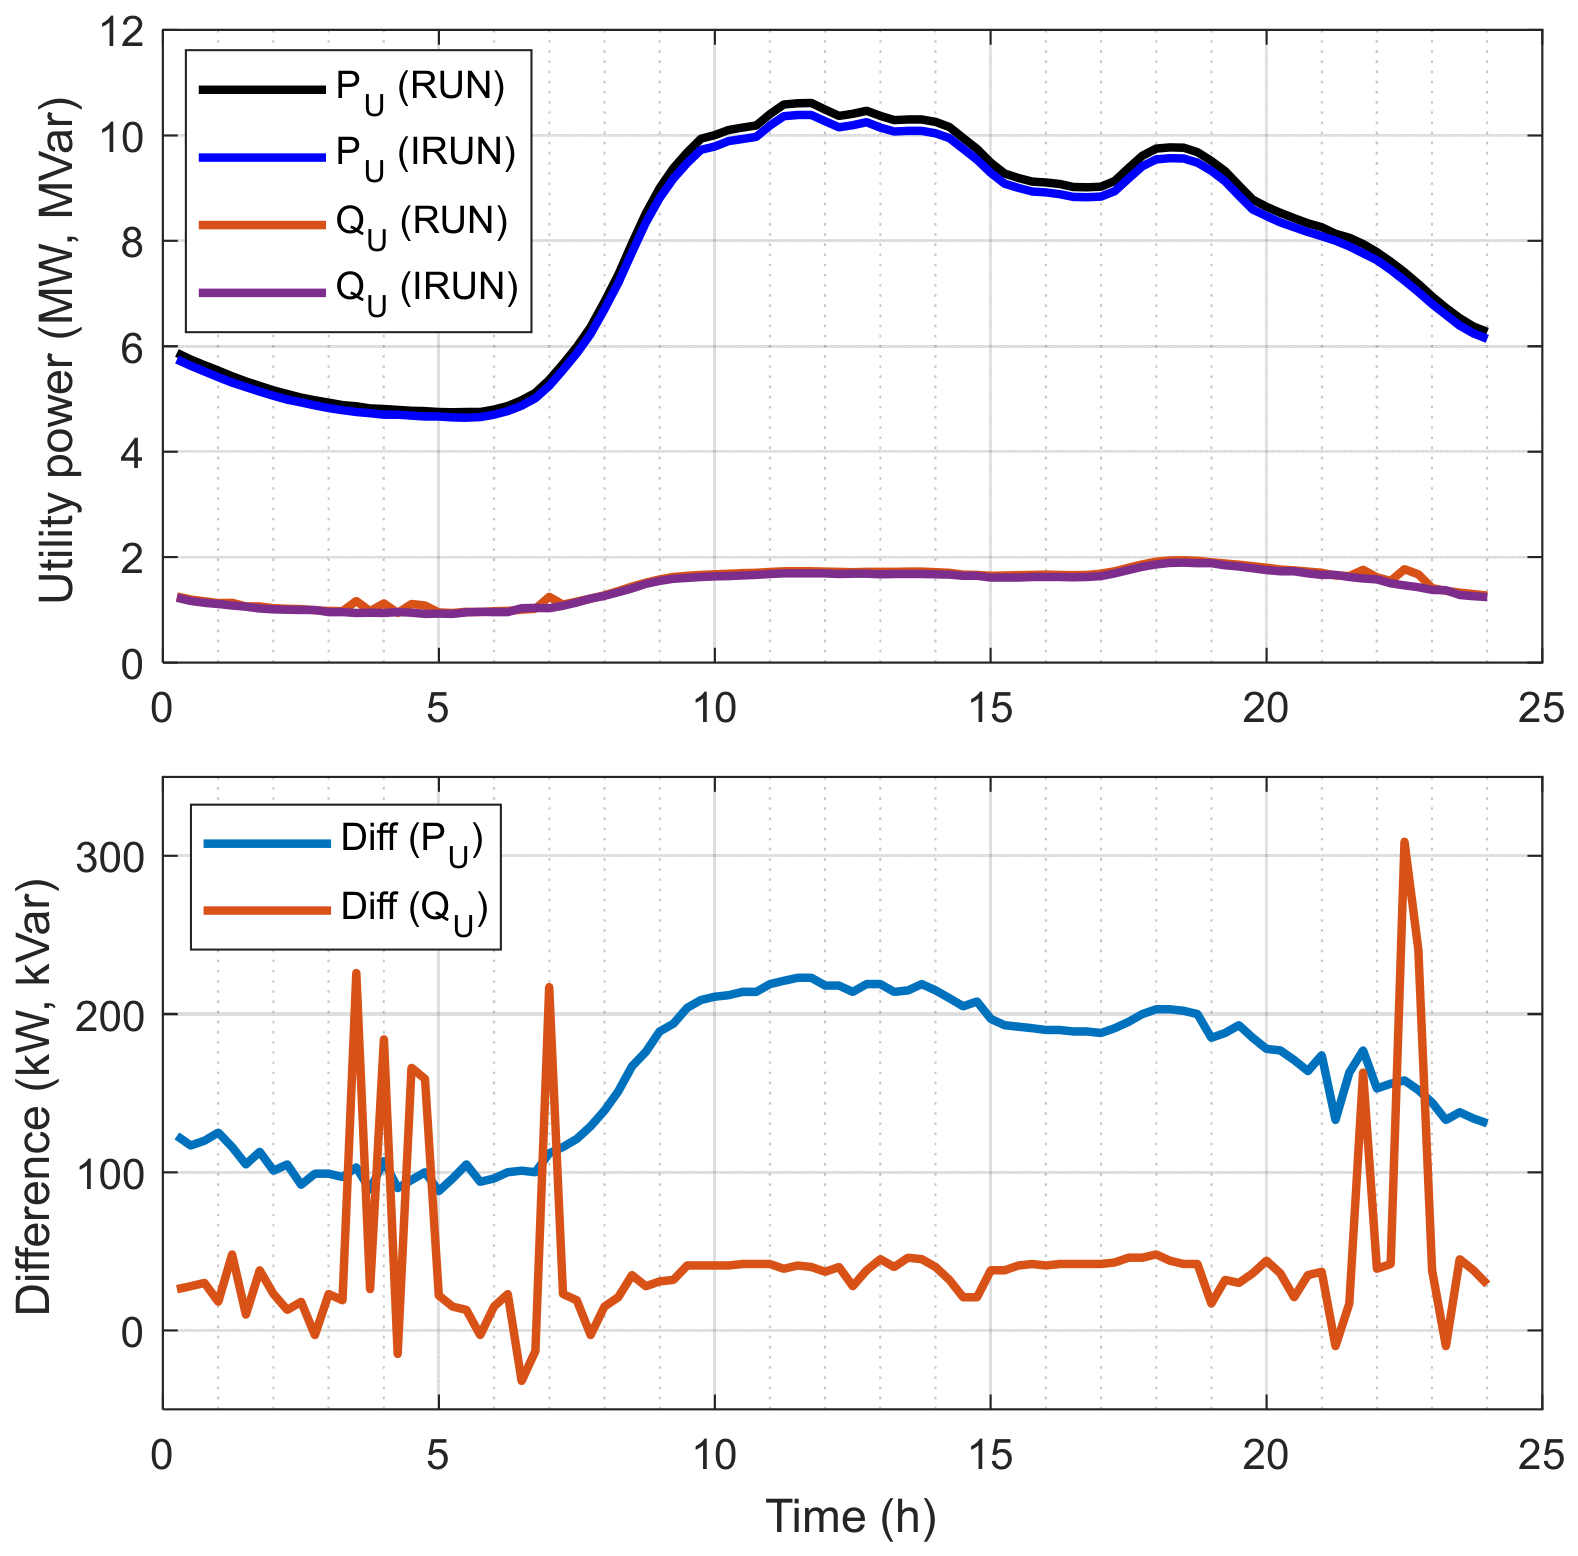
Figure 10 reports the utility-side power exchange of the 136-bus distribution system when optimized using the baseline RUN algorithm and the improved IRUN algorithm. The upper panel shows the temporal evolution of the active () and reactive () utility powers. Across the daily cycle, the IRUN algorithm yields consistently lower utility demand than RUN, particularly in the active-power component, indicating more effective coordination of PV units, BESS, DSTATCOMs, and EVCSs, thereby reducing reliance on upstream supply. The lower panel presents the corresponding differences between the two algorithms. As before, positive values reflect intervals where IRUN reduces the required utility power relative to RUN. The fluctuations in both active- and reactive-power differences highlight the dynamic nature of resource interactions over the 24 h horizon, while the predominance of positive values demonstrates the improved algorithm’s capability to lessen upstream power draw and enhance system-level efficiency.
Figure 10.
Input utility active and reactive powers under the RUN and IRUN algorithms over a 24 h operating horizon.
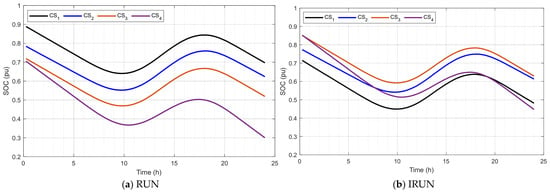
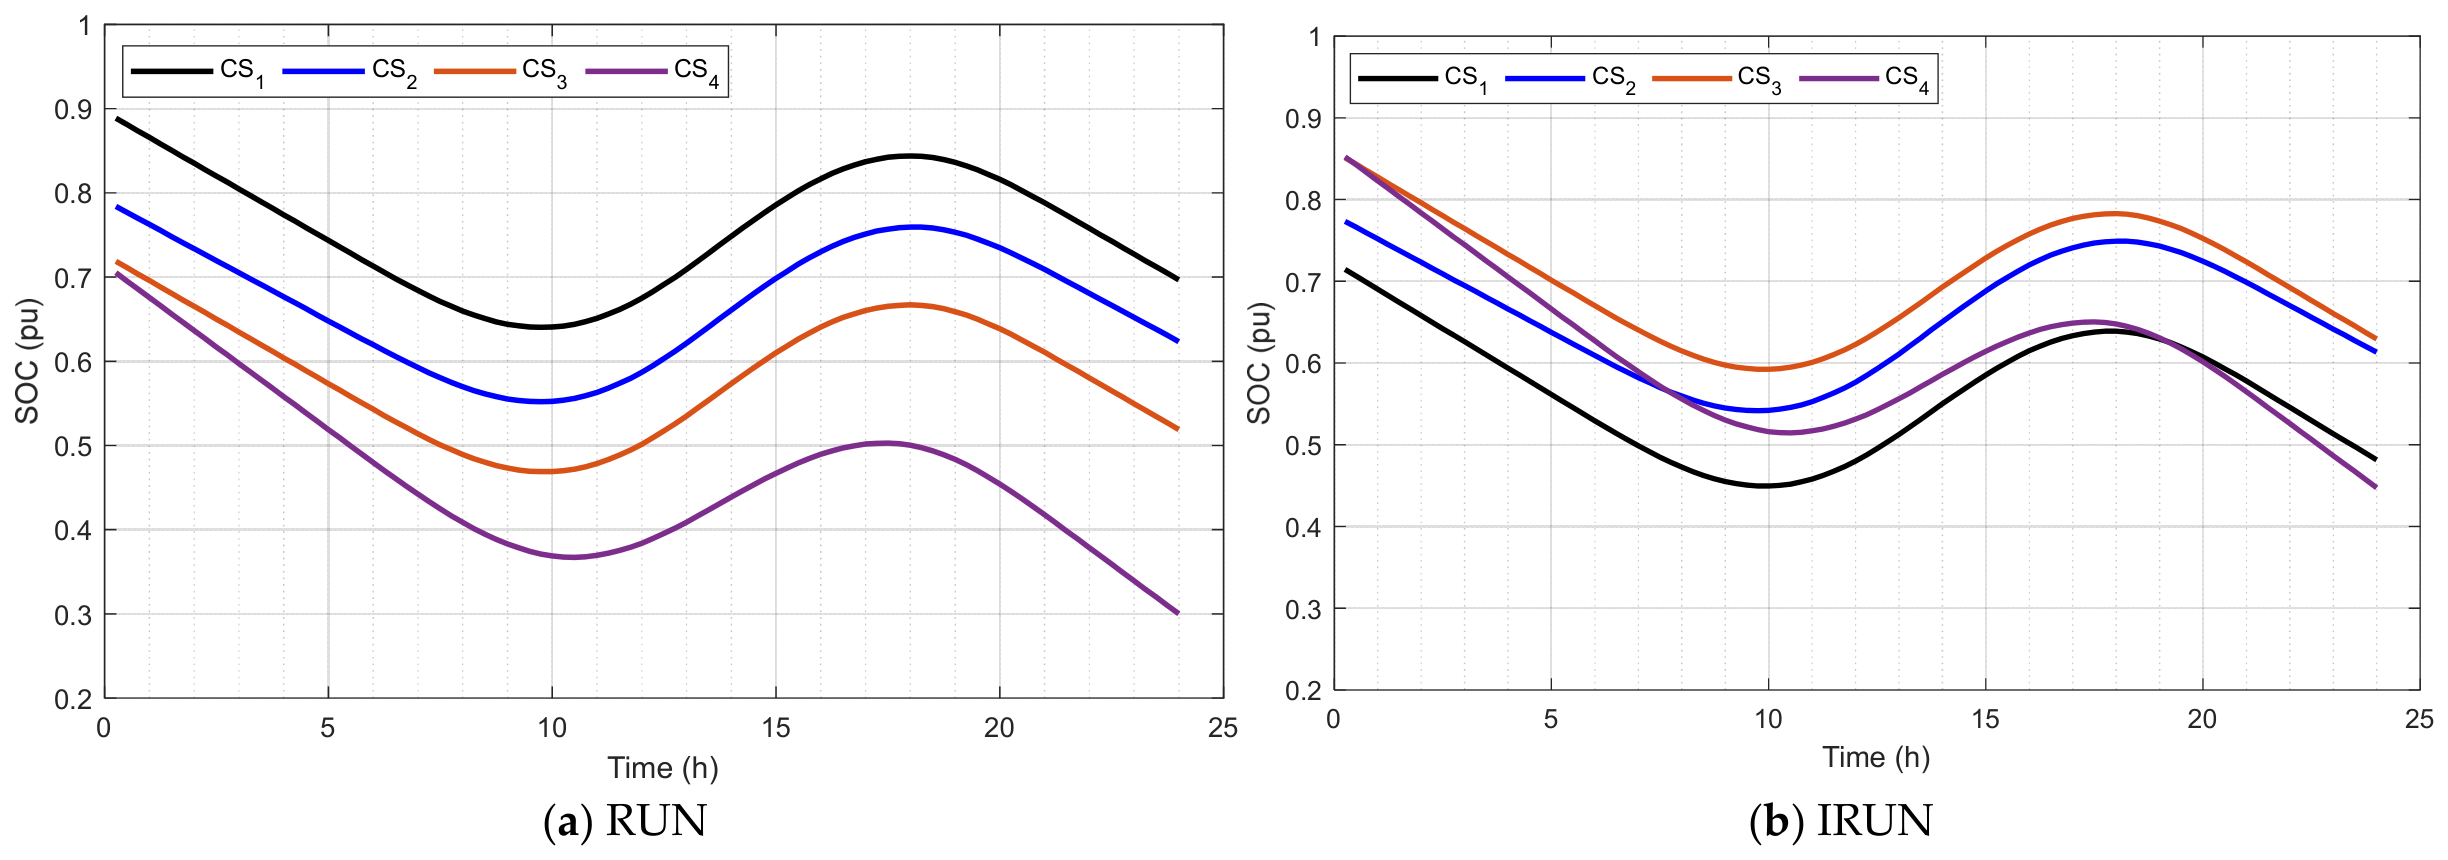
The corresponding SOC profiles of four BESS charging stations () over a 24 h period under the RUN (top panel) and IRUN (bottom panel) optimization strategies are shown in Figure 11. Under RUN, the SOC trajectories exhibit sharper fluctuations and deeper cycling, indicating less coordinated storage scheduling. In contrast, the IRUN algorithm produces smoother and more strategically aligned SOC patterns across all stations, reflecting improved charging/discharging coordination in response to PV availability, EVCS demand, and system-level loss-minimization objectives. The comparison between the two panels demonstrates that IRUN enhances storage utilization efficiency, reduces unnecessary cycling, and better supports overall network performance.
Figure 11.
State-of-charge (SOC) trajectories of the four charging-station battery units under the RUN and IRUN algorithms.
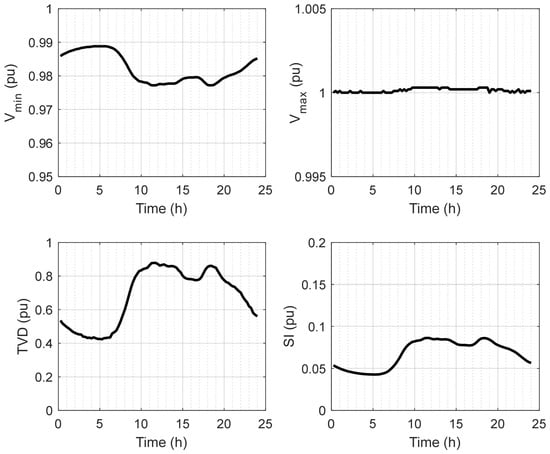
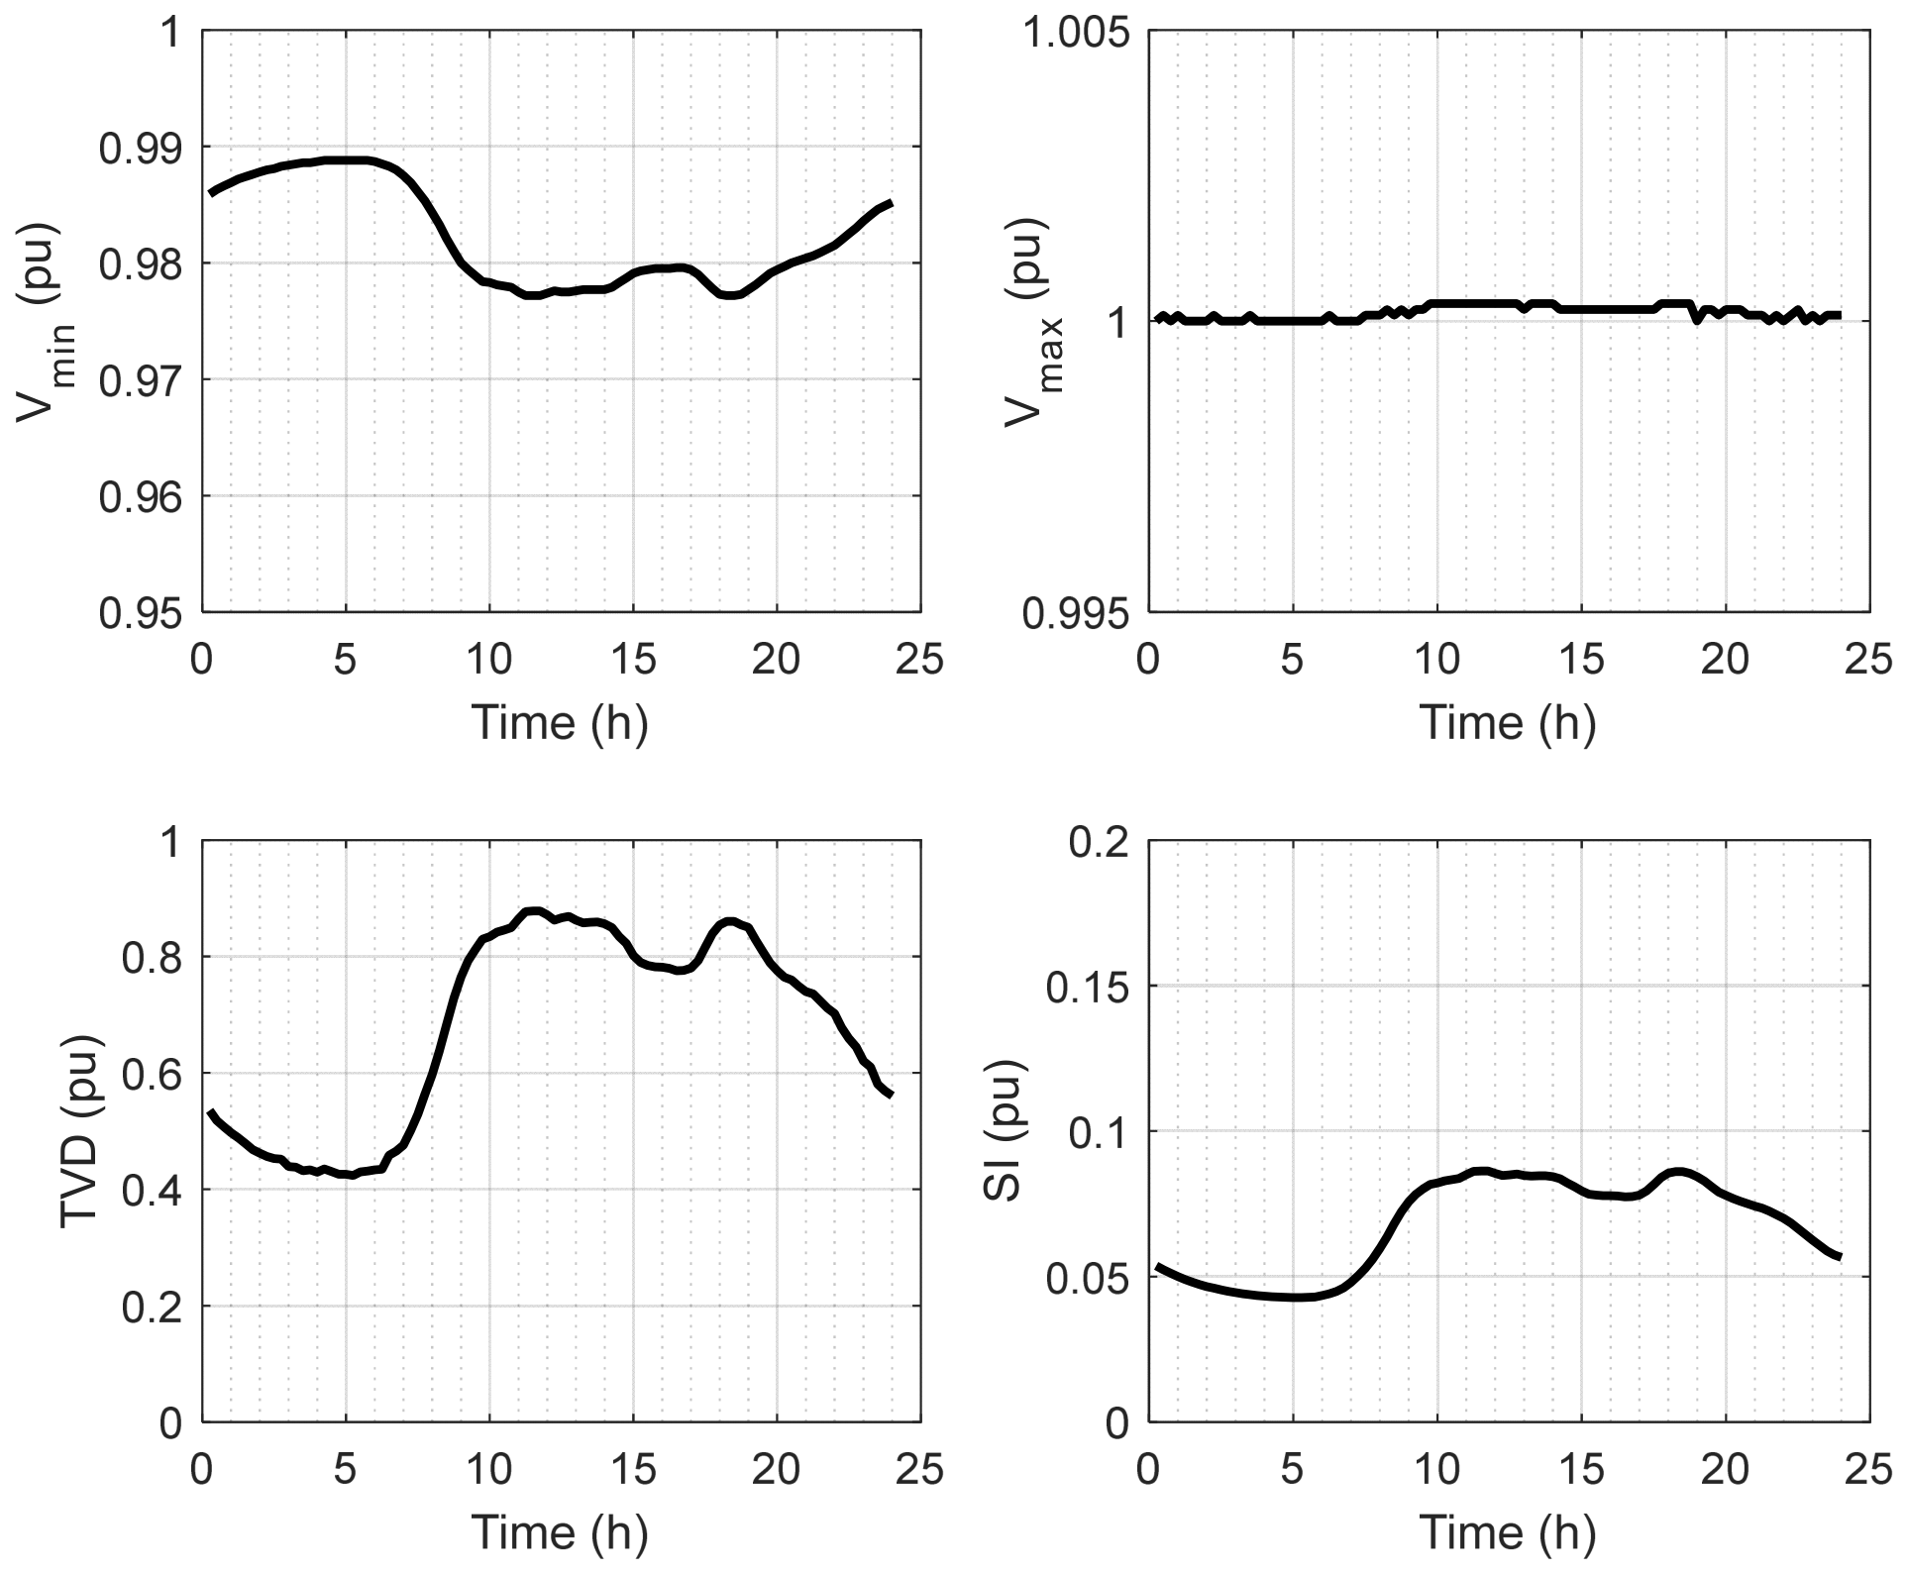
The system-level voltage characteristics when the network is operated using the improved IRUN optimization algorithm are presented in Figure 12. The minimum-voltage trajectory remains within acceptable regulatory limits throughout the day, with a modest dip during mid-day hours corresponding to peak loading and reduced PV support. The maximum-voltage profile remains tightly regulated around the nominal value, demonstrating the algorithm’s ability to prevent over-voltage conditions even under high PV generation periods. The total voltage deviation (TVD) exhibits a characteristic rise during the mid-day interval, reflecting increased system stress, followed by a gradual decline as loading conditions ease. Despite these variations, the TVD remains within a controlled range, indicating effective voltage-profile shaping by the IRUN strategy. The stability index (SI) follows a similar pattern, increasing during the system’s most stressed hours and subsequently decreasing toward the end of the horizon. The SI values remain well within the secure operating region, confirming that no voltage-collapse risk is encountered. Collectively, these metrics demonstrate that the IRUN algorithm maintains robust voltage quality and system stability throughout the full 24 h cycle, even amid dynamic interactions among load, PV generation, storage operations, and EV charging demand.
Figure 12.
Voltage-performance parameters of the 136-bus system under the IRUN algorithm over a 24 h horizon.
A complete evaluation of the system-level results demonstrates that the IRUN algorithm consistently outperforms the baseline RUN method across all major operational, energy, and voltage-quality metrics. The improvements achieved by IRUN stem from its enhanced coordination of distributed energy resources—including PV units, BESS, DSTATCOMs, and EVCSs—leading to more efficient power flows, reduced losses, and improved voltage stability throughout the 24 h horizon, as listed in Table 9. From an energy-exchange perspective, IRUN reduces both the maximum utility active and reactive power demands, lowering the system’s reliance on upstream supply. The daily utility energy drawn from the grid decreases from 186.60 MWh to 182.03 MWh for active energy and from 35.30 MVarh to 34.09 MVarh for reactive energy, indicating more effective utilization of local generation and storage flexibility.
Table 9.
System performance with RUN and IRUN algorithms.
These reductions translate into tangible operational benefits, particularly during peak-load and high-PV-variability periods. Loss-related metrics further highlight the superiority of IRUN. Total active and reactive energy losses are reduced, and the maximum, minimum, and average power loss values all show measurable improvements. Although the absolute reductions appear modest, they reflect systematic improvements in network efficiency and in the dispatch of controllable assets. The time-series loss profiles corroborate these findings, showing consistently lower losses under IRUN across the full daily cycle. Voltage-quality indicators also favor the IRUN algorithm. While both methods maintain minimum and maximum voltages within acceptable limits, IRUN achieves a lower average total voltage deviation (0.6784 pu compared to 0.6937 pu), demonstrating improved voltage-profile shaping.
The stability index (SI) remains identical on average across both algorithms, but the temporal SI behavior under IRUN exhibits smoother, more stable patterns, confirming enhanced resilience during periods of system stress. Finally, the computational efficiency of IRUN is evident in the reduced elapsed time, which decreases from 14.64 min to 12.25 min. This improvement underscores the algorithm’s enhanced convergence characteristics and suitability for real-time or near-real-time operational environments. The combined results clearly demonstrate that IRUN provides a more efficient, stable, and operationally robust solution than RUN. Its improvements in energy consumption, loss minimization, voltage quality, and computational performance collectively validate the effectiveness of the enhanced optimization strategy for modern distribution networks with high penetrations of distributed energy resources.
5. Conclusions
This paper presented the Improved Runge–Kutta algorithm (IRUN), an enhanced optimization framework designed to strengthen both benchmark-level performance (classical benchmark functions) and real-world distribution systems, such as the 136-bus system. Across twenty-three unimodal, multimodal, and composite benchmark functions, IRUN consistently outperformed the standard RUN algorithm, achieving substantially lower median errors, tighter interquartile ranges, and faster, more stable convergence trajectories. The success-history memory, archive mechanism, and population-reduction schedule enabled IRUN to maintain search momentum, avoid premature stagnation, and converge more reliably toward global optima, particularly on complex multimodal landscapes where RUN frequently stagnated. The distribution-system simulations further validated IRUN’s practical effectiveness. Under full-load conditions and a detailed 24 h horizon, IRUN reduced active and reactive power losses, lowered maximum and daily utility energy consumption, and produced smoother, more coordinated charging behavior for distributed BESS units. Voltage-quality and stability indicators confirmed improved voltage regulation and enhanced system robustness, especially under high loading and renewable variability. These operational gains were accompanied by faster convergence and reduced computational time, reinforcing IRUN’s suitability for real-time grid-operation environments. Overall, the combined benchmark and distribution-system results demonstrate that IRUN offers a more accurate, stable, and computationally efficient solution than RUN. Its ability to coordinate diverse distributed energy resources, maintain high-quality performance, and deliver superior optimization outcomes positions IRUN as a strong candidate for deployment in next-generation smart distribution networks.
Future research will extend IRUN to stochastic and uncertainty-aware operational environments, including renewable forecasting errors and probabilistic load variations. Additionally, integrating IRUN with real-time control architectures and hardware-in-the-loop platforms will further validate its suitability for smart-grid applications.
Author Contributions
Conceptualization, A.E. and A.A.; Methodology, A.E. and A.A.; Software, A.E.; Validation, A.E. and A.A.; Formal analysis, A.E. and A.A.; Investigation, A.A.; Writing—original draft, A.E.; Writing—review & editing, A.E. and A.A. All authors have read and agreed to the published version of the manuscript.
Funding
This research received no external funding.
Data Availability Statement
The original contributions presented in this study are included in the article. Further inquiries can be directed to the corresponding author.
Acknowledgments
The Researchers would like to thank the Deanship of Graduate Studies and Scientific Research at Qassim University (www.qu.edu.sa) for financial support (QU-APC-2026).
Conflicts of Interest
The authors declare no conflicts of interest.
Nomenclature
| Maximum number of iterations | ESQ | Enhanced solution quality | |
| Success-history memory value at memory index | RK | Runge–Kutta | |
| Lower limit of the problem | RUN | Runge–Kutta Optimizer | |
| Maximum archive size | Position increment (step size) | ||
| Initial population size | Problem dimensions | ||
| Scale factor from success-history memory | Number of populations | ||
| Scale factor of successful agent | Population size at iteration | ||
| Maximum population size | Set of successful agents in the current iteration | ||
| Upper limit of the problem | A scale factor | ||
| Archive entry at iteration | Search mechanism | ||
| Previous archive entry | RK search mechanism output | ||
| Coefficients of RK4 method | Step size | ||
| Weight for successful agent | RUN control parameters | ||
| Average of all solutions | A decreasing exponential factor | ||
| A new solution 3 | Fitness function | ||
| A scale factor of k’s coefficients | Current iteration | ||
| Better solution selected from the population or archive | Current memory index | ||
| Worse solution selected from the population or archive | An integer number of [−1, 0, 1] | ||
| Best agent position | Index of a successful agent in set | ||
| Best solution | Current archive count | ||
| Crossover solution | A scale-decreasing factor | ||
| Best position at each iteration | A random number | ||
| Elite mean solution | A random number in [0–1] | ||
| Initial position populations | A random number in [0–1] | ||
| The nth agent position | A random mutation factor | ||
| Next iteration position of agents | A random number in [0–1] | ||
| New candidate solution for agent | A random number in [0–1] | ||
| New candidate solution for agent | A random position | ||
| A new solution 1 | A random position | ||
| A new solution 2 | A random number in [0–1] | ||
| Parent solution of agent | A random number in [0–1] | ||
| Three random solutions | A random number in [0–1] | ||
| Worst agent position | A random number in [0–2] | ||
| Fitness improvement for agent | A random number in [0–1] | ||
| Sum of all fitness improvements | Normally distributed random number | ||
| Power loss at time | Branch resistance | ||
| Branch current at time | Number of buses in the system | ||
| Objective function | Maximum BESS power | ||
| BESS power at time | Minimum state-of-charge | ||
| Minimum state-of-charge | state-of-charge at time | ||
| Minimum DSC reactive power | Maximum DSC reactive power | ||
| DSC reactive power at time | Minimum allowable voltage | ||
| Maximum allowable voltage | Bus voltage at time | ||
| Minimum power of EV | Maximum power of EV | ||
| EV power at time | Minimum power of PV | ||
| Maximum power of PV | PV power at time | ||
| Active power of a generator at time | Active (demand) loads at time | ||
| Reactive power of a generator at time | Reactive (demand) loads at time |
References
- Sayed, K.; Elsayed, M.M.; Mohamed, A.; Eid, A. Key performance indicators for resiliency assessment in power systems with renewable energy and electric vehicles integration. Renew. Sustain. Energy Rev. 2026, 225, 116135. [Google Scholar] [CrossRef] [Scilit]
- Eid, A. Optimal Planning of Electric Vehicle Charging Stations with DSTATCOM and PV Supports Using Metaheuristic Optimization. Modelling 2025, 6, 156. [Google Scholar] [CrossRef] [Scilit]
- Hu, J.; Ye, C.; Ding, Y.; Tang, J.; Liu, S. A Distributed MPC to Exploit Reactive Power V2G for Real-Time Voltage Regulation in Distribution Networks. IEEE Trans. Smart Grid 2022, 13, 576–588. [Google Scholar] [CrossRef] [Scilit]
- Wu, R.; Liu, S. Deep Learning Based Muti-Objective Reactive Power Optimization of Distribution Network with PV and EVs. Sensors 2022, 22, 4321. [Google Scholar] [CrossRef] [Scilit] [PubMed]
- Eid, A. Cost-based analysis and optimization of distributed generations and shunt capacitors incorporated into distribution systems with nonlinear demand modeling. Expert Syst. Appl. 2022, 198, 116844. [Google Scholar] [CrossRef] [Scilit]
- Eid, A. Power Quality Enhancement of Balanced/Unbalanced Distribution Systems Using Metaheuristic Optimizations. In Modernization of Electric Power Systems: Energy Efficiency and Power Quality; Zobaa, A.F., Aleem, S.H.A., Eds.; Springer: Cham, Switzerland, 2023; Chapter 9; pp. 235–268. [Google Scholar] [CrossRef] [Scilit]
- Eid, A.; Kamel, S.; Abdel-Mawgoud, H. Shunt Reactive Compensations for Distribution Network Optimization. In Advanced Control & Optimization Paradigms for Energy System Operation and Management, 1st ed.; Pal, K., Tripathi, S.M., Pandey, S., Eds.; River Publishers: New York, NY, USA, 2023; Chapter 5; pp. 109–135. [Google Scholar] [CrossRef] [Scilit]
- Eid, A.; Kamel, S.; Zawbaa, H.M.; Dardeer, M. Improvement of active distribution systems with high penetration capacities of shunt reactive compensators and distributed generators using Bald Eagle Search. Ain Shams Eng. J. 2022, 13, 101792. [Google Scholar] [CrossRef] [Scilit]
- Singh, J.; Tiwari, R. Electric vehicles reactive power management and reconfiguration of distribution system to minimise losses. IET Gener. Transm. Distrib. 2020, 14, 6285–6293. [Google Scholar] [CrossRef] [Scilit]
- Saxena, N.K. Reactive Power Optimization Using Firefly Algorithm for Dispersed Electric Vehicles Charging Stations in Radial Distribution System. Electrica 2025, 25, 0131. [Google Scholar] [CrossRef] [Scilit]
- Xu, G.; Zhang, B.; Yang, L.; Wang, Y. Active and reactive power collaborative optimization for active distribution networks considering bi-directional v2g behavior. Sustainability 2021, 13, 6489. [Google Scholar] [CrossRef] [Scilit]
- Aghajan-Eshkevari, S.; Azad, S.; Nazari-Heris, M.; Ameli, M.T.; Asadi, S. Charging and Discharging of Electric Vehicles in Power Systems: An Updated and Detailed Review of Methods, Control Structures, Objectives, and Optimization Methodologies. Sustainability 2022, 14, 2137. [Google Scholar] [CrossRef] [Scilit]
- Mahmoud, A.M.; Aleem, S.H.E.A.; Abdelaziz, A.Y.; Ezzat, M. Towards Maximizing Hosting Capacity by Optimal Planning of Active and Reactive Power Compensators and Voltage Regulators: Case Study. Sustainability 2022, 14, 13299. [Google Scholar] [CrossRef] [Scilit]
- Huang, Z.; Fang, B.; Deng, J. Multi-objective optimization strategy for distribution network considering V2G-enabled electric vehicles in building integrated energy system. Prot. Control Mod. Power Syst. 2020, 5, 7. [Google Scholar] [CrossRef] [Scilit]
- Gholami, K.; Karimi, S.; Rastgou, A.; Nazari, A.; Moghaddam, V. Voltage stability improvement of distribution networks using reactive power capability of electric vehicle charging stations. Comput. Electr. Eng. 2024, 116, 109160. [Google Scholar] [CrossRef] [Scilit]
- Hu, D.; Ye, Z.; Gao, Y.; Ye, Z.; Peng, Y.; Yu, N. Multi-Agent Deep Reinforcement Learning for Voltage Control with Coordinated Active and Reactive Power Optimization. IEEE Trans. Smart Grid 2022, 13, 4873–4886. [Google Scholar] [CrossRef] [Scilit]
- Bilal, M.; Rizwan, M. Integration of electric vehicle charging stations and capacitors in distribution systems with vehicle-to-grid facility. Energy Sources Part A Recovery Util. Environ. Eff. 2025, 47, 7700–7729. [Google Scholar] [CrossRef] [Scilit]
- Wu, R.; Liu, S. Multi-Objective Optimization for Distribution Network Reconfiguration With Reactive Power Optimization of New Energy and EVs. IEEE Access 2023, 11, 10664–10674. [Google Scholar] [CrossRef] [Scilit]
- Yuvaraj, T.; Devabalaji, K.R.; Suresh, T.D.; Prabaharan, N.; Ueda, S.; Senjyu, T. Enhancing Indian Practical Distribution System Resilience Through Microgrid Formation and Integration of Distributed Energy Resources Considering Battery Electric Vehicle. IEEE Access 2023, 11, 133521–133539. [Google Scholar] [CrossRef] [Scilit]
- Wang, Y.; Qiu, D.; Strbac, G.; Gao, Z. Coordinated Electric Vehicle Active and Reactive Power Control for Active Distribution Networks. IEEE Trans. Ind. Inform. 2023, 19, 1611–1622. [Google Scholar] [CrossRef] [Scilit]
- Abdelaziz, M.A.; Ali, A.A.; Swief, R.A.; Elazab, R. Optimizing energy-efficient grid performance: Integrating electric vehicles, DSTATCOM, and renewable sources using the Hippopotamus Optimization Algorithm. Sci. Rep. 2024, 14, 28974. [Google Scholar] [CrossRef] [Scilit] [PubMed]
- Pirouzi, S.; Latify, M.A.; Yousefi, G.R. Conjugate active and reactive power management in a smart distribution network through electric vehicles: A mixed integer-linear programming model. Sustain. Energy Grids Netw. 2020, 22, 100344. [Google Scholar] [CrossRef] [Scilit]
- Akbari, E.; Naghibi, A.F.; Veisi, M.; Shahparnia, A.; Pirouzi, S. Multi-objective economic operation of smart distribution network with renewable-flexible virtual power plants considering voltage security index. Sci. Rep. 2024, 14, 19136. [Google Scholar] [CrossRef] [Scilit] [PubMed]
- Singh, J.; Tiwari, R. Cost Benefit Analysis for V2G Implementation of Electric Vehicles in Distribution System. IEEE Trans. Ind. Appl. 2020, 56, 5963–5973. [Google Scholar] [CrossRef] [Scilit]
- Liu, Z.; Jian, X.; Sadiq, T.; Shaikh, Z.A.; Alfarraj, O.; Alblehai, F.; Tolba, A. Promoted Osprey Optimizer: A solution for ORPD problem with electric vehicle penetration. Sci. Rep. 2024, 14, 28052. [Google Scholar] [CrossRef] [Scilit] [PubMed]
- Rajagopalan, A.; Nagarajan, K.; Bajaj, M.; Uthayakumar, S.; Prokop, L.; Blazek, V. Multi-objective energy management in a renewable and EV-integrated microgrid using an iterative map-based self-adaptive crystal structure algorithm. Sci. Rep. 2024, 14, 15652. [Google Scholar] [CrossRef] [Scilit] [PubMed]
- Hu, J.; Yin, W.; Ye, C.; Bao, W.; Wu, J.; Ding, Y. Assessment for Voltage Violations considering Reactive Power Compensation Provided by Smart Inverters in Distribution Network. Front. Energy Res. 2021, 9, 713510. [Google Scholar] [CrossRef] [Scilit]
- Muthukannan, S.; Karthikaikannan, D. Multiobjective Planning Strategy for the Placement of Electric-Vehicle Charging Stations Using Hybrid Optimization Algorithm. IEEE Access 2022, 10, 48088–48101. [Google Scholar] [CrossRef] [Scilit]
- Al-Dhaifallah, M.; Refaat, M.M.; Alaas, Z.; Aleem, S.H.E.A.; Ali, Z.M. Enhancing hosting capacity for electric vehicles in modern power networks using improved hybrid optimization approaches with environmental sustainability considerations. Sci. Rep. 2024, 14, 25607. [Google Scholar] [CrossRef] [Scilit] [PubMed]
- Moghaddam, M.S.; Azadikhouy, M.; Salehi, N.; Hosseina, M. A multi-objective optimization framework for EV-integrated distribution grids using the hiking optimization algorithm. Sci. Rep. 2025, 15, 13324. [Google Scholar] [CrossRef] [Scilit] [PubMed]
- Andervazh, M.R.; Javadi, S.; Aliabadi, M.H. Active distribution network operation management with large penetration of hybrid electric vehicles and sustainable distributed energy generation. Sustain. Cities Soc. 2020, 62, 102313. [Google Scholar] [CrossRef] [Scilit]
- Singh, P.P.; Das, S.; Wen, F.; Palu, I.; Singh, A.K.; Thakur, P. Multi-objective planning of electric vehicles charging in distribution system considering priority-based vehicle-to-grid scheduling. Swarm Evol. Comput. 2023, 77, 101234. [Google Scholar] [CrossRef] [Scilit]
- Thunuguntla, V.K.; Maineni, V.; Injeti, S.K.; Kumar, P.P.; Nuvvula, R.S.S.; Dhanamjayulu, C.; Rahaman, M.; Khan, B. A TOPSIS based multi-objective optimal deployment of solar PV and BESS units in power distribution system electric vehicles load demand. Sci. Rep. 2024, 14, 29688. [Google Scholar] [CrossRef] [Scilit] [PubMed]
- Yuvaraj, T.; Devabalaji, K.R.; Thanikanti, S.B.; Pamshetti, V.B.; Nwulu, N.I. Integration of Electric Vehicle Charging Stations and DSTATCOM in Practical Indian Distribution Systems Using Bald Eagle Search Algorithm. IEEE Access 2023, 11, 55149–55168. [Google Scholar] [CrossRef] [Scilit]
- Alburidy, A.; Fan, L. An alternating direction method of multipliers-based approach to solve mixed-integer nonlinear volt/var optimization problems in distribution systems. Int. Trans. Electr. Energy Syst. 2021, 31, e12795. [Google Scholar] [CrossRef] [Scilit]
- Ahmadianfar, I.; Heidari, A.A.; Gandomi, A.H.; Chu, X.; Chen, H. RUN beyond the metaphor: An efficient optimization algorithm based on Runge Kutta method. Expert Syst. Appl. 2021, 181, 115079. [Google Scholar] [CrossRef] [Scilit]
- Ekinci, S.; Rizk-Allah, R.M.; Izci, D.; Çelik, E. Multi-strategy improved runge kutta optimizer and its promise to estimate the model parameters of solar photovoltaic modules. Heliyon 2024, 10, e39301. [Google Scholar] [CrossRef] [Scilit] [PubMed]
- Ren, X.-Y.; Cai, X.; Wei, B.; Ma, W. Collaborative optimization operation strategy of integrated energy system considering integrated demand response: A Stackelberg game and improved Runge Kutta optimizer. Energy 2026, 344, 139977. [Google Scholar] [CrossRef] [Scilit]
- Selim, A.; Kamel, S.; Houssein, E.H.; Jurado, F.; Hashim, F.A. A modified Runge–Kutta optimization for optimal photovoltaic and battery storage allocation under uncertainty and load variation. Soft Comput. 2024, 28, 10369–10389. [Google Scholar] [CrossRef] [Scilit]
- Bucolo, M.; Buscarino, A.; Famoso, C.; Fortuna, L. Chaos Addresses Energy in Networks of Electrical Oscillators. IEEE Access 2021, 9, 153258–153265. [Google Scholar] [CrossRef] [Scilit]
- Zhong, C.; Li, G.; Meng, Z. Beluga whale optimization: A novel nature-inspired metaheuristic algorithm. Knowl.-Based Syst. 2022, 251, 109215. [Google Scholar] [CrossRef] [Scilit]
- Zhang, L.; He, Z. Spatiotemporal distribution model of charging demand for electric vehicle charging stations based on markov chain. J. Phys. Conf. Ser. 2020, 1601, 022045. [Google Scholar] [CrossRef] [Scilit]
- Farhadi, P.; Moghaddas-Tafreshi, S.-M.; Shahirinia, A. Probabilistic multivariate modeling of electric vehicles charging start time in fast charging stations. Energy Syst. 2026. [Google Scholar] [CrossRef] [Scilit]

Disclaimer/Publisher’s Note: The statements, opinions and data contained in all publications are solely those of the individual author(s) and contributor(s) and not of MDPI and/or the editor(s). MDPI and/or the editor(s) disclaim responsibility for any injury to people or property resulting from any ideas, methods, instructions or products referred to in the content. |
© 2026 by the authors. Licensee MDPI, Basel, Switzerland. This article is an open access article distributed under the terms and conditions of the Creative Commons Attribution (CC BY) license.