


Abstract
Enterprise financial risk prediction is a fundamental task in financial risk management, yet its performance is often hindered by severe class imbalance, cross-enterprise heterogeneity, and the limited availability of labeled risky samples. These challenges are particularly pronounced in few-shot settings, where conventional machine learning and deep classification models tend to suffer from unstable representation learning, feature collapse, and weak decision boundaries. To address this issue, this study proposes a hierarchical metric learning framework for few-shot enterprise financial risk prediction on imbalanced tabular data. The framework integrates a state-space feature embedding network, an Adaptive Spectral Decomposition and Multi-Scale State Embedding module, and a Hierarchical Metric Manifold Alignment mechanism to enhance risk-sensitive representation learning, preserve geometric consistency across embedding levels, and improve prototype-based discrimination in the metric space. Experiments are conducted on three public datasets, namely American Bankruptcy, Corporate Financial Risk Assessment, and Enterprise Financial Network, under a unified 2-way 20-shot setting. The proposed method consistently achieves the best overall performance across Precision, Recall, Accuracy, F1-score, and AUC, with AUC values of 0.9526, 0.9687, and 0.9716 on the three datasets, respectively. Ablation studies and visual analyses further show that the proposed framework improves intra-class compactness, inter-class separability, and classification robustness under highly imbalanced conditions. These findings indicate that the proposed method provides an effective and robust machine learning solution for enterprise financial risk prediction and early warning in data-scarce financial scenarios.
Keywords:
enterprise financial risk early warning; structured metric learning; few shot classification; prototype space discrimination; risk sensitive representation MSC:
68T07
1. Introduction
With the acceleration of financial digitalization and the increasing uncertainty in the global economy, enterprise financial risk prediction has become an important problem in financial econometrics, risk management, and prudential regulation [1,2,3]. In practical scenarios such as bankruptcy early warning, credit risk assessment, and corporate financial distress identification, the underlying data are often characterized by high dimensionality, heterogeneous feature structures, and severe class imbalance, which makes reliable risk discrimination particularly challenging. Traditional approaches based on statistical regression or expert-designed linear discriminant analysis usually rely on relatively shallow assumptions about feature interactions and therefore often fail to adequately capture the complex nonlinear dependencies and structural constraints embedded in enterprise financial data, leading to limited generalization ability and insufficient robustness [4,5].
Recent advances in machine learning have substantially improved the modeling of tabular financial data. Deep architectures designed for structured data have enhanced feature interaction learning through attention mechanisms and contextual embeddings, showing promising performance in credit scoring and bankruptcy prediction tasks. At the same time, graph-based and self-attention-based financial risk prediction models have demonstrated strong capability in representing enterprise relationships, structural dependencies, and multidimensional financial indicators [6,7,8,9]. Nevertheless, when risky samples are scarce and labeled observations are limited, existing deep classifiers still tend to suffer from overfitting, unstable representation learning, and feature collapse, while their decision boundaries are often insufficiently robust for highly imbalanced financial risk identification scenarios [3,5].
These limitations are especially evident in few-shot enterprise risk prediction, where the model must learn discriminative risk representations from a very small number of positive samples while maintaining stable separation between risky and non-risky firms. Under such conditions, a reliable method should not only enhance the compactness of risky samples in the latent space, but also preserve geometric consistency and boundary stability across heterogeneous enterprise domains. This requirement makes metric learning particularly attractive, since prototype-based discrimination can directly improve intra-class compactness and inter-class separability under limited supervision.
To address the above challenges, this study proposes a hierarchical metric learning framework for few-shot enterprise financial risk prediction. The proposed framework integrates three key components, namely a state-space feature embedding module, an Adaptive Spectral Decomposition for Multi-Scale State Embedding module, and a Hierarchical Metric Manifold Alignment via Task-Coupled Embedding Flows module. Within this unified design, the state-space feature embedding module is used to construct structured latent representations for static enterprise financial features, the ASD-MSE module strengthens fine-grained discriminability through dual-branch spectral–structural interaction and multi-scale enhancement, and the HMMA-TF module improves cross-level geometric consistency and stable prototype-based discrimination through hierarchical manifold alignment and task-coupled embedding flows.
The framework draws inspiration from few-shot learning and metric learning paradigms [10,11,12], and further incorporates supervised contrastive clustering constraints [13,14,15] to enhance intra-class compactness and inter-class separability within a unified embedding space. By combining structured embedding, multi-scale representation enhancement, and hierarchical metric alignment, the proposed method is designed to improve the robustness, discriminability, and generalization capability of enterprise financial risk prediction under data-scarce and highly imbalanced conditions.
The main contributions of this work are summarized as follows:
- A unified hierarchical metric learning framework is proposed for few-shot enterprise financial risk prediction, enabling robust prototype-based discrimination on imbalanced and heterogeneous enterprise financial data.
- The designed ASD-MSE and HMMA-TF modules jointly enhance local–global structural representation and preserve geometric consistency within the metric space, thereby improving the stability of risk-sensitive feature learning and decision boundary construction.
- A comprehensive experimental framework is established based on the public American Bankruptcy, Corporate Financial Risk Assessment, and Enterprise Financial Network datasets, systematically evaluating model performance and interpretability under 2-way 20-shot settings.
- Compared with mainstream models such as LTR-Net, AT-FinGPT, TemFRC, ExHybridNet, and TH-GNN, the proposed framework achieves significant improvements in Accuracy, F1-score, and AUC, while demonstrating clearer inter-class separability and more stable decision boundaries in confusion matrix, ROC, and t-SNE visualizations.
2. Related Work
2.1. State-Space and Sequence Modeling in Few-Shot Financial Risk Prediction
In the field of few-shot financial risk prediction, representation learning frameworks based on state-space and sequence modeling have gradually become a mainstream direction. Sun et al. proposed a Transformer-based model for banking stability assessment, which employs deep attention structures to enhance the representation and discrimination capability of complex risk patterns [16]. Jiang et al. developed the MetaTrans-FSTSF framework by introducing meta-learning mechanisms into Transformer architectures to improve generalization under low-sample conditions [17]. She et al. proposed a few-shot forecasting approach based on consistency regularization, which enhances model stability and generalization performance through feature-level constraints [18]. Wu et al. designed a meta-learning-based multi-classification network for numerical features, enabling effective discrimination modeling under few-shot settings [19]. Lai et al. introduced the IFTrans model, which integrates Transformer embeddings with fraud detection, achieving high-accuracy recognition in data-scarce environments [20]. Jin and Lin proposed a multimodal risk prediction framework that fuses textual and financial features, demonstrating strong structural fusion capability in systemic risk identification [21]. Shen and Wu constructed a hybrid model based on TCN and DilateFormer for corporate credit risk analysis [22]. Schwab and Kriebel further examined the adversarial robustness of Transformer models in credit scoring tasks [23]. Collectively, these studies indicate that deep embedding structures and state-space modeling can maintain high separability and stability in financial scenarios with limited data availability.
However, unlike traditional time-series financial tasks, the data used in this study consist of static corporate financial and structural features, including leverage ratios, profitability indicators, debt structure, and liquidity factors, without explicit temporal dependencies. Therefore, this work extends the concept of state-space modeling to a structured embedding and feature-interaction framework. Yang et al. demonstrated that federated transfer learning with frozen parameters can enhance generalization in SME credit risk prediction [24]. Pourkhoshgoftar et al. employed graph inductive learning to improve risk modeling under imbalanced sample distributions [25]. Petrosino et al. combined GARCH and Transformer architectures to construct a hybrid volatility prediction model, achieving structured cross-asset risk capture [26]. Wang et al. utilized a bidirectional Transformer architecture for premium risk prediction and achieved superior performance [27]. These studies collectively demonstrate that, despite the heterogeneity of financial data, the principles of structured embedding and state-space modeling remain effective for maintaining discriminative capability and generalization stability in non-temporal feature systems, thereby providing a solid theoretical and methodological foundation for few-shot enterprise risk prediction.
2.2. Few-Shot Metric Learning for Risk Discrimination
The application of metric learning in financial risk identification has gradually become an important research direction under few-shot conditions. Kwon et al. proposed a multitask Siamese network-based credit scoring model that enhances feature transfer and stability across tasks through a shared embedding space [28]. Gao et al. designed the CATE model, which improves credit scoring separability and robustness by integrating contrastive augmentation with tree-structured embeddings [29]. Liu et al. developed a boundary-enhanced prototypical network that achieves stable high-dimensional feature aggregation and inter-class margin optimization in few-shot fraud detection [30]. Billion-Polak and Khoshgoftaar systematically evaluated the applicability of low-sample learning in imbalanced classification scenarios, providing a benchmark analysis for few-shot risk identification [31]. Fedele et al. investigated the interpretability of Siamese networks, revealing the explainable mechanisms of feature similarity modeling in metric learning [32]. Dong et al. proposed a meta-learning network based on triplet contrastive learning, which improves model generalization in few-shot classification tasks through embedding constraints [33]. Li et al. further introduced a dual-layer knowledge distillation mechanism to realize few-shot metric transfer in graph anomaly detection tasks [34]. Collectively, these studies demonstrate that metric learning frameworks can effectively construct stable feature spaces under data-scarce conditions, providing highly generalizable embeddings for tasks such as enterprise risk identification.
In the structured feature environment of enterprise risk discrimination, metric learning frameworks offer novel solutions for handling static attributes such as financial ratios, capital structure, and solvency indicators. Jiang et al. employed an attention-guided anomaly detection network to cluster credit card fraud samples, validating the feasibility of unsupervised metric embeddings in anomaly discrimination [35]. El Khair Ghoujdam et al. compared traditional logistic regression with multiple deep learning methods in credit risk analysis, pointing out that nonlinear metric embeddings can more effectively capture complex feature interactions [36]. Building upon these prior studies, this work introduces few-shot metric learning mechanisms into enterprise risk discrimination. By constructing a prototype-based embedding space, it achieves risk identification and stability optimization under limited supervision, thereby providing theoretical support and methodological innovation for enterprise risk prediction with complex financial structures.
3. Method
3.1. Problem Definition
Let the dataset be denoted as , where represents the static feature vector of the i-th enterprise, and is the risk label, where 1 indicates a risky enterprise and 0 denotes a non-risky one. The training process follows an episodic organization under few-shot settings. Each task is independently sampled from the distribution and consists of a support set and a query set:
where denotes the number of labeled samples for class c, satisfying , and .
To capture the structural properties of static enterprise features, we denote the feature index set as and introduce a disjoint partition of feature subsets , satisfying and .
Let the embedding function produce discriminative representations. To reflect structural decomposition, we define group-wise embeddings and their aggregation as
where denotes the mapping of the k-th subspace, is a deterministic aggregation operator, and or a fixed constant dimension.
Under the metric learning paradigm, the prototype vector of class c is defined as
while the embedding of a query sample is given by . Let denote a metric function satisfying non-negativity, identity, and symmetry. The classification rule for risk prediction is then defined as
3.2. State-Space Feature Embedding Architecture
For static enterprise tabular data, the input variables do not form a chronological sequence, but they still contain complex dependency patterns in the feature space. Therefore, this study constructs a state-space feature embedding architecture to model feature-state propagation and gated information interaction among tabular representations. In this formulation, the layer index denotes the depth of representation refinement rather than temporal order, and the hidden state represents the latent feature state generated during embedding transformation. In the proposed implementation, the input order is not defined as a temporal or semantic sequence, but follows the fixed feature schema obtained after data preprocessing. The same feature arrangement is consistently used in the training, validation, and test partitions, ensuring that each input dimension corresponds to the same financial attribute throughout the entire experimental process. Therefore, the state-space feature embedding module operates on a fixed tabular representation rather than on an arbitrary feature permutation.
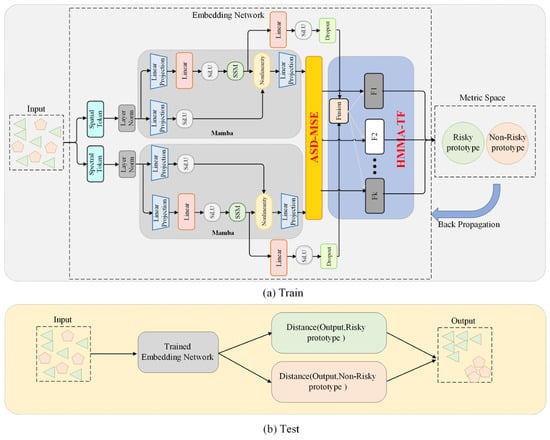
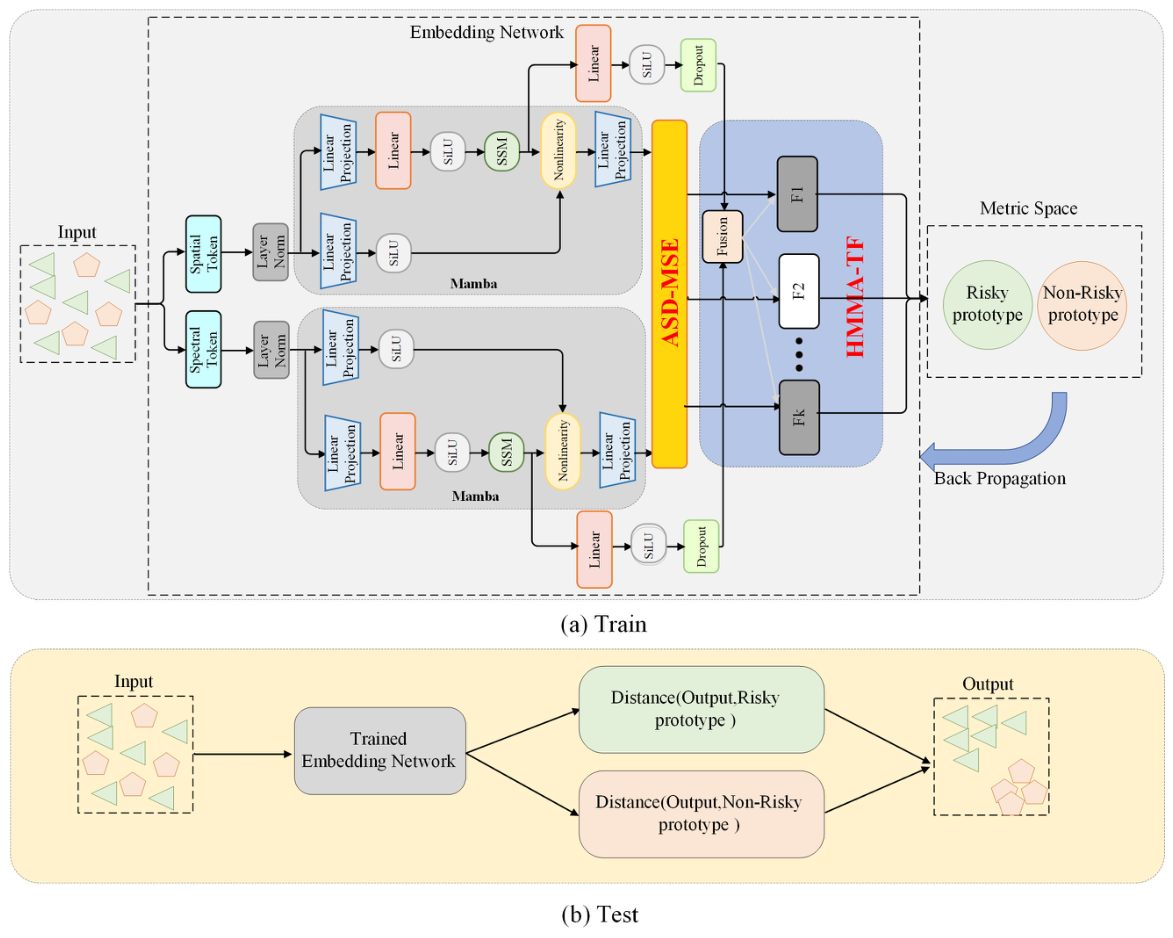
As illustrated in Figure 1, the proposed embedding architecture aims to maintain feature stability and discriminability under few-shot enterprise risk prediction. The core idea lies in realizing global association modeling and local difference perception of static features through intra-layer state mapping and feature flow control mechanisms. Rather than treating tabular indicators as time steps, the model regards them as static feature representations and performs depth-wise state propagation within the embedding space. The state-space feature embedding model is grounded in dynamic transformations of latent representations, where discriminative mappings are constructed through learnable state projections and nonlinear response functions. Given an input feature , the feature-state update at the l-th embedding layer is formulated as
where and control the propagation of the previous latent state and the mapping strength of the current input feature, respectively, and denotes the feature-state representation after the l-th transformation. After linear projection and normalization, cross-layer feature fusion is obtained as
where is a learnable residual modulation coefficient that balances the retention and update of cross-layer information, ensuring embedding stability under limited samples.
Figure 1.
The framework consists of a state-space feature embedding network and a metric learning module. During training, ASD-MSE and HMMA-TF are introduced to achieve multi-scale feature-state modeling and cross-task manifold alignment. During testing, the trained embedding network computes metric distances between query samples and class prototypes for risk discrimination.
In the global representation stage, the state-space feature embedding architecture models inter-feature dependencies through an adaptive gating mechanism. Let denote the gating parameter, the operation can be described as
where denotes the Sigmoid function and L is the total number of embedding layers. This mechanism dynamically regulates feature flow in the nonlinear transformation space, allowing correlations among high-dimensional enterprise indicators to be represented in a continuous latent state manner. Consequently, the embedding maintains global consistency and discriminability under few-shot conditions. Overall, the state-space feature embedding model provides a structured representation framework for static tabular features, offering a stable foundation for subsequent metric-space construction and risk classification.
3.3. Adaptive Spectral Decomposition for Multi-Scale State Embedding
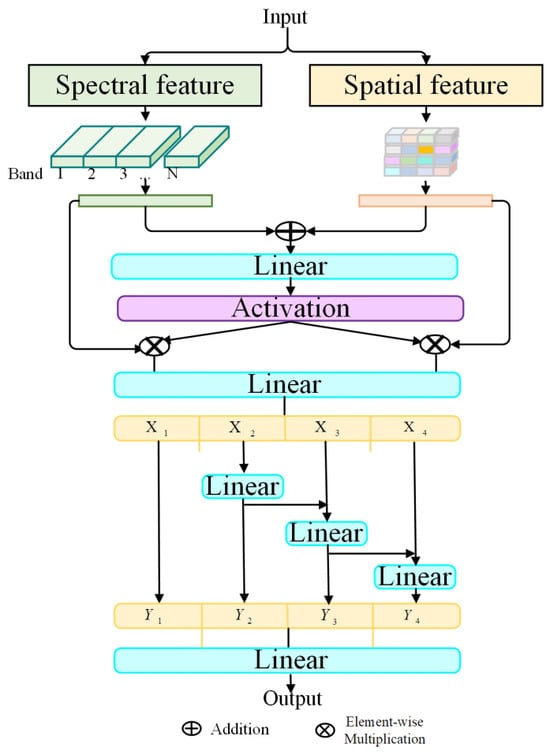
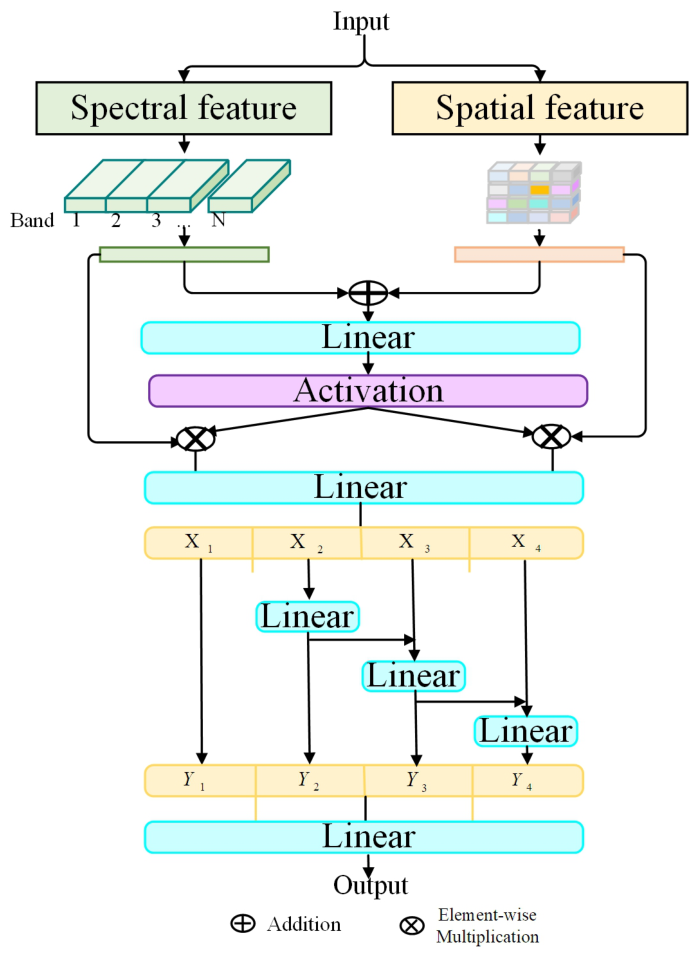
To address the degradation of embedding representations caused by high-dimensional correlations and structural heterogeneity in static enterprise features, this study proposes the Adaptive Spectral Decomposition for Multi-Scale State Embedding module (ASD-MSE), as illustrated in Figure 2.
Figure 2.
The module performs multi-layer embedding modeling through dual-branch interaction between correlation-spectrum features and residual structural features, and fuses information from different hierarchical levels via multi-scale linear mappings and adaptive gating mechanisms to enhance the discriminative capacity of static feature representations.
ASD-MSE first constructs a correlation-spectrum subspace from the feature covariance structure of the training data, and then decomposes each input representation into a dominant correlation component and a residual structural component. The two components are further modeled through dual-branch interaction, multi-scale embedding, and adaptive gating, so that both global correlation patterns and local structural variations can be preserved in the latent space.
The module is designed to exploit statistical correlations and hierarchical structural information among enterprise indicators through a dual-branch feature interaction and multi-scale embedding mechanism, thereby enhancing the discriminability and robustness of static representations. Let denote the standardized feature matrix of the training partition. The empirical feature-correlation matrix is computed as
where describes the correlation structure among feature dimensions. The spectral basis is obtained by eigenvalue decomposition:
where is the eigenvector matrix and is the diagonal eigenvalue matrix. The eigenvectors corresponding to the largest r eigenvalues are selected to form , which represents the dominant correlation-spectrum subspace. For an input feature , the spectral and structural components are defined as
where denotes the projection of onto the dominant correlation-spectrum subspace, and denotes the residual component that preserves complementary structural variations. The two components are respectively mapped as
and subsequently fused through a linear interaction process:
where denotes the Sigmoid activation function, is the hyperbolic tangent function, and ⊙ represents element-wise multiplication. This dual-channel fusion mechanism enables the model to capture nonlinear dependencies between features while maintaining global structural stability.
In the multi-scale feature enhancement stage, ASD-MSE adopts a multi-branch linear transformation mechanism to extract structural mappings across different scales. Let the scale set be , the embedding at the k-th scale is defined as
where denotes a nonlinear activation function. The multi-scale outputs are aggregated with learnable weights to obtain the global feature representation:
where are learnable scale weights that control the contribution of each scale during structural representation learning.
To further enhance inter-dimensional feature interaction, ASD-MSE introduces channel correlation modeling in the embedding stage. Let the set of input channel vectors be ; each channel output is updated through linear relations:
where denotes a learnable channel interaction matrix. The aggregated channel features are concatenated to form the overall output:
and the updated embedding representation is obtained via normalization and a linear projection:
Within the information flow control layer, ASD-MSE incorporates an adaptive gating mechanism to dynamically regulate the strength of feature fusion. The input and output gates are defined as
and the fused output is computed as
By introducing correlation-spectrum decomposition, residual structural modeling, multi-scale feature fusion, and adaptive gating regulation, the ASD-MSE module effectively enhances the representational capacity and structural robustness of static enterprise features under few-shot risk discrimination scenarios.
3.4. Hierarchical Metric Manifold Alignment via Task-Coupled Embedding Flows
To improve the stability of metric-space discrimination under episodic few-shot learning, this study proposes the Hierarchical Metric Manifold Alignment via Task-Coupled Embedding Flows (HMMA-TF) module. The module performs hierarchical embedding refinement within each sampled task and introduces task-level coupling only during episodic training. Specifically, each task is sampled from the corresponding training partition and consists of an independent support set and query set. During validation and testing, each episode is processed independently with fixed model parameters, and the class prototypes are computed only from the support samples of the current episode.
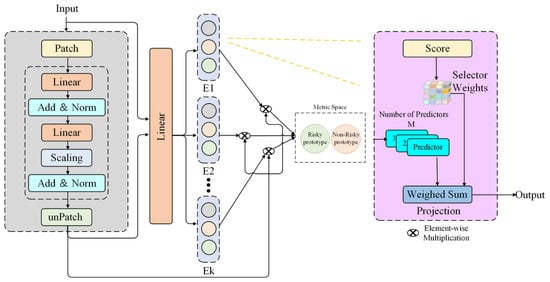
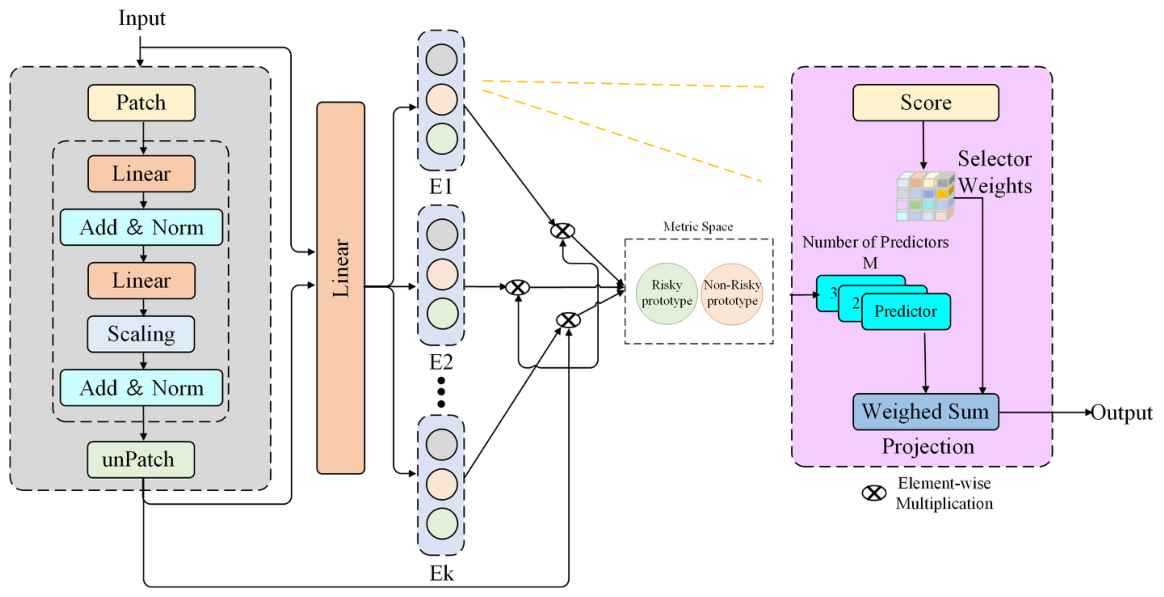
As illustrated in Figure 3, HMMA-TF is designed to reduce the instability of risk discrimination boundaries caused by task-level distribution variations and overlapping class manifolds in static enterprise feature spaces. Given the input feature , the embedding representation at the l-th layer is obtained via linear transformation and normalization:
where and are learnable parameters. The multi-level embeddings form a hierarchical representation structure that captures feature interactions at different embedding depths.
Figure 3.
The module performs hierarchical embedding refinement through task-level descriptors, support-set prototype construction, and layer-wise prediction aggregation, thereby improving metric-space consistency for few-shot risk discrimination.
During episodic training, a mini-batch of tasks is denoted as , where each task contains a support set and a query set sampled from the same training partition. For the l-th embedding layer, the support-based task descriptor of task is defined as
where summarizes the support-set embedding distribution of the current task. The task-coupling weight between task and task at layer l is computed by a learnable attention function:
where and are learnable parameters, and denotes vector concatenation. The task-coupled descriptor for task is then obtained as
which provides a task-level reference for aligning hierarchical embeddings during training.
For a sample from task , the aligned hierarchical embedding at layer l is reconstructed as
where and are learnable parameters. To preserve global structural coherence across different embedding levels, HMMA-TF introduces a hierarchical weighted aggregation mechanism:
where denotes the learnable layer-wise fusion weight.
To further integrate layer-wise prediction information, each embedding layer is associated with a predictor , and the weighted prediction output is computed as
where represents the learnable prediction weight of the l-th layer. The final embedding representation is obtained by combining the aggregated feature representation and the weighted prediction output:
where denotes the activation function.
To construct stable risk classification boundaries in the metric space, class prototypes are computed from the support set of the current task. Let denote the support subset belonging to class c in task . The prototype of class c is defined as
where r and n denote the risky and non-risky classes, respectively. For a query sample , the predicted label is determined by the nearest prototype:
During validation and testing, each episode is evaluated independently. The task descriptor, aligned embedding, class prototypes, and query predictions are all computed within the current episode, and no task-coupling information from other validation or test episodes is used. Thus, HMMA-TF maintains the episodic few-shot evaluation protocol while improving hierarchical representation consistency and prototype-based discrimination.
3.5. Training Objective
To achieve collaborative optimization between the ASD-MSE and HMMA-TF modules in few-shot risk discrimination tasks, the training objective is designed to maintain both structural consistency in the embedding space and discriminative separability in the metric space. The model incorporates adaptive feature flow constraints during the embedding stage and manifold distribution constraints during the alignment stage, thereby ensuring a stable feature embedding structure under limited sample conditions. Let the embedding network output be and the class prototypes be . The embedding consistency constraint is formalized as
where C denotes the number of classes, the number of samples in class c, and the class prototype vector. This constraint encourages intra-class compactness in the embedding space, mitigating prototype drift and reducing uncertainty.
During the manifold alignment stage, a task-coupling regularization term is introduced to control geometric deviations between task-specific embedding flows. Let the task set be and the mean embedding of task t be , then the cross-task alignment constraint is defined as
which suppresses distributional shifts among tasks, ensuring representational consistency across different enterprise sets.
By combining the embedding consistency and manifold alignment constraints, the overall optimization objective is expressed as
where denotes the prototype-based metric loss that enhances inter-class separability, and , , and are balancing coefficients. By jointly minimizing this composite objective, the model achieves unified optimization of spectral-domain enhanced embeddings and cross-task manifold alignment, thereby attaining robust and transferable risk representations under few-shot conditions.
4. Dataset Introduction
To evaluate the effectiveness of the proposed few-shot metric learning framework for enterprise risk discrimination under heterogeneous class distributions, three public datasets are employed, namely American Bankruptcy, Enterprise Financial Network, and Corporate Financial Risk Assessment. The corresponding binary label columns are status_label, tgt_bankrupt, and Financial_Risk_Label, respectively, where the risky class is defined as the positive class with label 1 and the normal class is defined as the negative class with label 0. For the semantic annotations in status_label, failed is mapped to 1 and alive is mapped to 0 to ensure consistency of label semantics across datasets. As reported in Table 1, the three datasets exhibit substantially different class distributions, with the positive class accounting for 6.63%, 14.24%, and 40.00%, respectively, thus covering extremely imbalanced, moderately imbalanced, and relatively balanced enterprise risk discrimination scenarios. To ensure a clear and independent experimental protocol, each dataset is first divided into mutually exclusive training, validation, and test subsets according to a stratified ratio of 7:2:1, where category proportions are preserved during splitting to alleviate the influence of class imbalance and to avoid distribution distortion across subsets. For the American Bankruptcy dataset, the split is further conducted at the company level according to the company name field, so that all firm-year records belonging to the same company are assigned to the same partition, thereby preventing the same enterprise from appearing simultaneously in the training, validation, and test subsets. On this basis, few-shot episodic tasks are constructed separately within the training, validation, and test partitions, so that episodic optimization and evaluation are always conducted on isolated data subsets rather than on the original mixed sample pool. This design maintains the standard few-shot learning paradigm while preserving the underlying imbalance characteristics at the dataset level, thereby avoiding the disconnection between episodic evaluation and the original class distribution and enabling a more reliable assessment of prototype estimation stability, discriminative robustness, and cross-domain generalization ability under different enterprise risk settings.
Table 1.
Statistics of the three public datasets used for enterprise risk discrimination.
5. Experimental Results and Analysis
5.1. Evaluation Metric
To comprehensively evaluate the performance of the proposed few-shot metric learning framework in enterprise risk discrimination, five widely used classification metrics are adopted: Precision, Recall, Accuracy, F1-Score, and AUC. These indicators jointly reflect the model’s discriminative capability and generalization stability from multiple perspectives. Among them, Precision and Recall focus on the accuracy and coverage of risk detection, Accuracy measures the overall correctness of classification, F1-Score balances Precision and Recall, and AUC assesses the model’s discriminative power across varying decision thresholds.
- Precision.
Precision measures the proportion of correctly identified risk samples among all samples predicted as risky, reflecting the reliability of the model’s positive predictions. A higher Precision indicates a lower false-alarm rate in risk detection. The metric is defined as:
where and denote the numbers of true positives and false positives, respectively.
- Recall.
Recall quantifies the model’s ability to identify all true risk samples, that is, the proportion of actual risky samples correctly predicted as risky. A higher Recall indicates stronger sensitivity to potential risks. It is defined as:
where represents the number of false negatives.
- Accuracy.
Accuracy reflects the overall proportion of correctly classified samples among all predictions, serving as a general indicator of classification performance. It is defined as:
where denotes the number of true negatives. A higher Accuracy suggests stronger overall consistency in model prediction across both risk and non-risk classes.
- F1-Score.
F1-Score is the harmonic mean of Precision and Recall, balancing the trade-off between the two metrics. It is particularly useful for imbalanced datasets where high Recall or Precision alone is insufficient. The formula is:
A higher F1-Score indicates that the model achieves both accurate and comprehensive risk detection.
- AUC.
AUC (Area Under Curve) measures the area under the Receiver Operating Characteristic (ROC) curve, which plots the True Positive Rate (TPR) against the False Positive Rate (FPR) under varying thresholds. It evaluates the model’s overall discriminative capability, defined as:
An AUC value closer to 1 indicates that the model maintains robust discrimination between risky and non-risky samples across different decision thresholds.
In summary, these five metrics collectively assess the proposed model’s classification precision, detection sensitivity, and stability, providing a comprehensive evaluation of its performance in multi-domain and few-shot enterprise risk discrimination tasks.
5.2. Experimental Setup
All experiments are conducted under a unified configuration for both training and evaluation. The entire framework is implemented using PyTorch 2.1.2 and follows a 2-way 20-shot episodic training strategy. Before episodic task construction, each original dataset is first divided into mutually exclusive training, validation, and test partitions using stratified sampling, so that the original class-distribution characteristics of each dataset are preserved at the partition level. On this basis, episodic tasks are constructed only within the corresponding partition, which prevents samples from different partitions from being mixed during training, validation, and testing. Each episode consists of two categories, namely risky and normal enterprises, where support samples are randomly selected for each class to construct class prototypes under limited supervision. The query set contains samples per class in each controlled episode and is used to evaluate class-wise risk discrimination ability under the same few-shot metric-learning protocol. During the training, validation, and testing phases, 200, 20, and 100 episodes are respectively sampled to ensure representative episodic coverage. Each experiment is repeated under five different random seeds, and the mean and standard deviation of the evaluation metrics are reported to guarantee statistical reliability.
It should be emphasized that the balanced episodic query design is adopted as a controlled few-shot metric learning evaluation protocol rather than as a direct simulation of the natural deployment prior. The purpose of this setting is to examine whether the model can learn stable prototypes, preserve inter-class separability, and distinguish risky from non-risky enterprises when only a small number of labeled samples are available. Since the original datasets are highly imbalanced, directly using the natural class prior in each few-shot episode may cause the evaluation to be dominated by the majority non-risky class and may weaken the assessment of minority-risk discrimination. Therefore, the original imbalance is preserved at the dataset and partition levels, while the episodic evaluation focuses on class-wise discriminability and prototype stability under scarce supervision.
The experiments are executed on an NVIDIA RTX 3090 GPU. All compared methods, including conventional machine learning baselines, deep learning baselines, and the proposed framework, are trained and evaluated under the same data partitions, episodic task construction, support/query sampling strategy, random-seed settings, and evaluation metrics. For the baseline models, hyperparameters are selected based on the validation episodes under the same experimental protocol, and no additional training samples or separate evaluation conditions are introduced. For conventional baselines such as XGBoost, LightGBM, SVM, and KNN, the episodic protocol is implemented in the same manner as the proposed few-shot setting. In each episode, the baseline model is trained only on the support set of the current task and then evaluated on the corresponding query set. This process is repeated independently for all sampled episodes, and the final performance is obtained by averaging the results across testing episodes and random seeds. The model is optimized using the AdamW optimizer with a learning rate of and a weight decay of . A Cosine Decay learning rate scheduler with a 20-episode warm-up phase is adopted to facilitate stable convergence. The temperature parameter in the metric function is learnable and initialized to 0.1. Evaluation metrics include Precision, Recall, Accuracy, F1-Score, and AUC, which collectively assess the discriminative and generalization performance of the proposed few-shot metric learning framework (Table 2).
Table 2.
Experimental configuration and main parameter settings under the controlled few-shot episodic protocol.
5.3. Comparison of Experimental Results with Other Models
To provide a rigorous comparison under a unified evaluation protocol, the proposed framework was examined together with representative conventional machine learning methods, sequence-based deep models, and recent structured prediction architectures on three publicly available enterprise risk datasets under the same few-shot setting. The American Bankruptcy dataset was further used as a challenging benchmark for introduction because its severe class imbalance places higher demands on risk-sensitive representation learning and metric-space discrimination, and the corresponding comparative results are summarized in Table 3.
Table 3.
Performance comparison of different methods on the American Bankruptcy dataset under the -shot setting. All results are reported as mean ± standard deviation over five random seeds.
The results in Table 3 show that the proposed method achieves the best overall performance on the American Bankruptcy dataset under the few shot setting, indicating that the framework can learn more discriminative risk representations in enterprise risk identification scenarios characterized by limited samples and highly imbalanced class distributions. Compared with traditional machine learning methods that mainly rely on static feature partitioning, deep embedding models that mainly focus on local feature pattern modeling, and some structured methods that only exploit single relational information, the advantage of the proposed method lies in its unified modeling of risk sensitive representation learning and metric space discrimination. This enables the model not only to capture the fine grained differences among enterprise risk samples more effectively, but also to enhance the compactness of high risk classes and the separability of class boundaries under few shot conditions. Meanwhile, by providing more stable feature organization and semantic constraints for complex risk signals, the framework further alleviates the representation drift and decision bias that commonly arise in few shot scenarios. As a result, it demonstrates stronger overall identification capability across multiple metrics, including Precision, Recall, Accuracy, F1 Score, and AUC. These findings indicate that the proposed method has better adaptability in sensitive identification of high risk enterprises, characterization of positive and negative sample boundaries, and robust discrimination under imbalanced conditions, thereby validating the effectiveness and practical value of the proposed design in enterprise risk early warning tasks.
To further verify the risk discrimination capability of the proposed framework in scenarios involving multidimensional financial indicator modeling, this paper conducted experiments on two additional datasets, and the experimental results are shown in Table 4 and Table 5.
Table 4.
Performance comparison of different methods on the Corporate Financial Risk Assessment dataset under the -shot setting. All results are reported as mean ± standard deviation over five random seeds.
Table 5.
Performance comparison of different methods on the Enterprise Financial Network Dataset under the -shot setting. All results are reported as mean ± standard deviation over five random seeds.
Further observations from Table 4 and Table 5 show that the proposed method consistently maintains prominent performance advantages on both types of enterprise risk datasets, which not only demonstrates its effectiveness in improving risk identification accuracy under few-shot conditions, but also indicates its stronger modeling capability in handling coupled relationships across static feature dimensions and embedding levels. For data scenarios dominated by multidimensional financial indicators, the proposed method can more thoroughly explore the latent associations among solvency, profitability, and operational status through risk-sensitive representation learning, thereby enhancing its ability to characterize complex risk patterns. In data scenarios that additionally contain enterprise relational structure information, the metric-space discriminative mechanism further improves the model’s ability to distinguish similarities and differences among samples, enabling high-risk samples to form more compact semantic clusters while making the boundaries of low-risk samples clearer. Owing to this collaborative enhancement in feature organization capacity and discriminative constraint capability, the proposed framework achieves higher stability and consistency across multiple evaluation metrics, including Precision, Recall, Accuracy, F1-Score, and AUC, thereby further verifying the effectiveness of the proposed design in complex enterprise financial risk identification tasks.
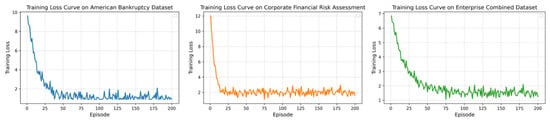
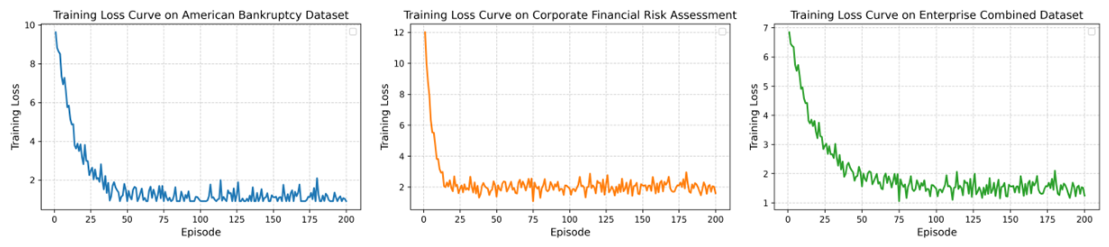
To intuitively illustrate the training convergence process of the proposed model across different datasets, Figure 4 presents the corresponding training loss curves.
Figure 4.
Training loss curves of the proposed method across different datasets, demonstrating its stable convergence behavior under various scenarios.
As shown in Figure 4, the training loss across all datasets exhibits a rapid decline followed by a stable convergence trend, indicating that the proposed metric learning framework possesses favorable convergence properties. During the early training phase, the loss decreases sharply, reflecting the model’s strong adaptability to the underlying static feature distributions. Subsequently, the training process enters a stable phase, suggesting that the network has established consistent risk representations within the embedding space. The overall curves are smooth without significant oscillations, confirming the stability and effectiveness of the multi-scale structural constraints and manifold alignment mechanisms during optimization.
5.4. Ablation Experiment Results
To further evaluate the practical role of each functional module in the overall framework, systematic ablation analysis was conducted by progressively removing and combining the two core modules, ASD-MSE and HMMA-TF. Table 6 summarizes the performance under different module configurations, with the aim of revealing the independent contributions and collaborative effects of each component in feature representation and risk discrimination.
Table 6.
Comprehensive ablation study results across three datasets (K = 20-shot). All results are reported as mean ± standard deviation over five random seeds.
As shown in Table 6, the introduction of both core modules brings stable performance gains, although their effects are not identical. ASD-MSE mainly focuses on enhancing risk-sensitive feature representation under few-shot conditions, enabling the model to extract more discriminative key information from complex static financial indicators and enterprise relational signals. As a result, its improvements in Precision, Recall, and F1-Score are more evident on some datasets. In contrast, HMMA-TF is more reflected in optimizing the process of hierarchical embedding interaction and feature fusion, which helps alleviate the fragmentation of heterogeneous static feature representations and thereby improves overall classification stability and the completeness of risk identification. These results indicate that the two modules improve the limitations of the baseline model from the perspectives of risk representation enhancement and hierarchical embedding modeling, respectively, thus endowing the overall framework with stronger feature organization and discrimination capabilities in enterprise financial risk identification tasks.
Further analysis shows that when ASD-MSE and HMMA-TF are jointly integrated into a unified framework, the model achieves the best performance across all metrics on the three datasets, indicating that their relationship is not a simple additive effect but rather a strong collaborative gain. The reason is that ASD-MSE provides a clearer and more risk-discriminative representation foundation, creating better input conditions for subsequent multi-level embedding interaction modeling, while HMMA-TF further amplifies this discriminative advantage through hierarchical aggregation and feature fusion of embeddings at different levels, making the internal structure of high-risk samples more compact and the class boundaries clearer. For this reason, the complete model is able to simultaneously balance identification accuracy, recall capability, and overall robustness across different data scenarios, which fully demonstrates that the two proposed modules possess clear independent value and significant joint optimization effects in enterprise financial risk early warning tasks.
5.5. Confusion Matrix Experiment Results
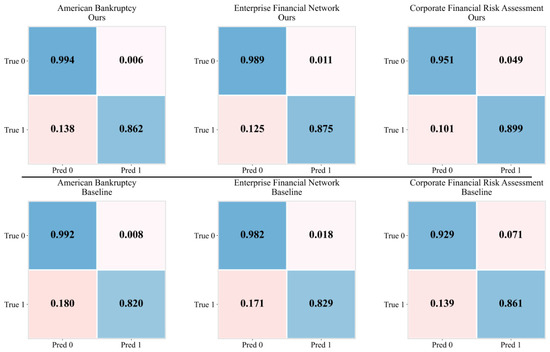
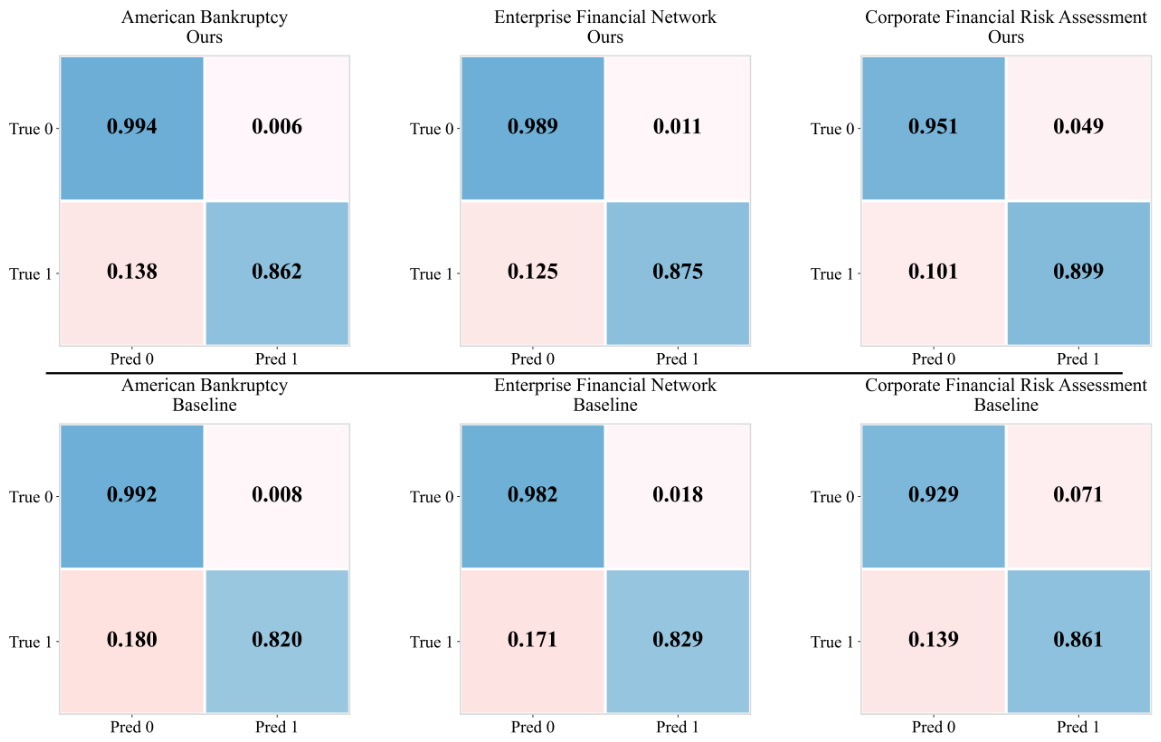
To more intuitively demonstrate the risk identification capability of the model on different datasets, the normalized confusion matrices of the Baseline and the complete model on three public datasets are further presented. This visualization reflects the model’s discriminative performance on risky samples and normal samples from the two perspectives of predicted class distribution and misclassification structure, thereby more clearly revealing the practical performance of the proposed method in classification boundary optimization and risk identification stability. The corresponding results are shown in Figure 5.
Figure 5.
Normalized confusion matrices of Ours and Baseline on three public datasets. The first row presents the results of Ours, and the second row presents the results of Baseline.
It can be observed from the figure that the proposed method demonstrates superior risk identification capability across all three datasets, especially showing stronger stability and accuracy in the discrimination of positive samples. Compared with the baseline model, the proposed framework is able to more effectively reduce the misclassification of high risk samples as normal samples while maintaining the recognition ability for negative samples, which indicates that the designed ASD-MSE and HMMA-TF modules can jointly enhance the model’s ability to extract critical static risk-related feature patterns and construct discriminative metric-space decision boundaries. Further analysis shows that the complete model maintains relatively balanced classification performance under different data distributions, suggesting that it not only improves overall identification accuracy, but also enhances sensitivity to risk categories and decision robustness, thereby making it more suitable for practical identification tasks in enterprise financial risk early warning scenarios.
5.6. ROC Curve Experimental Results
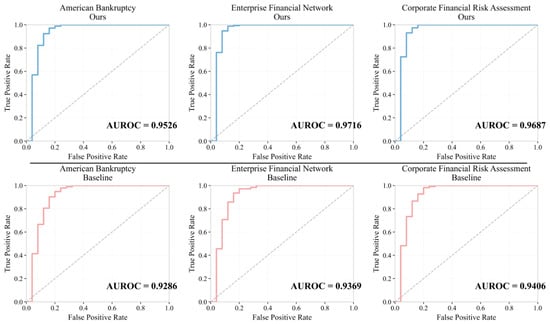
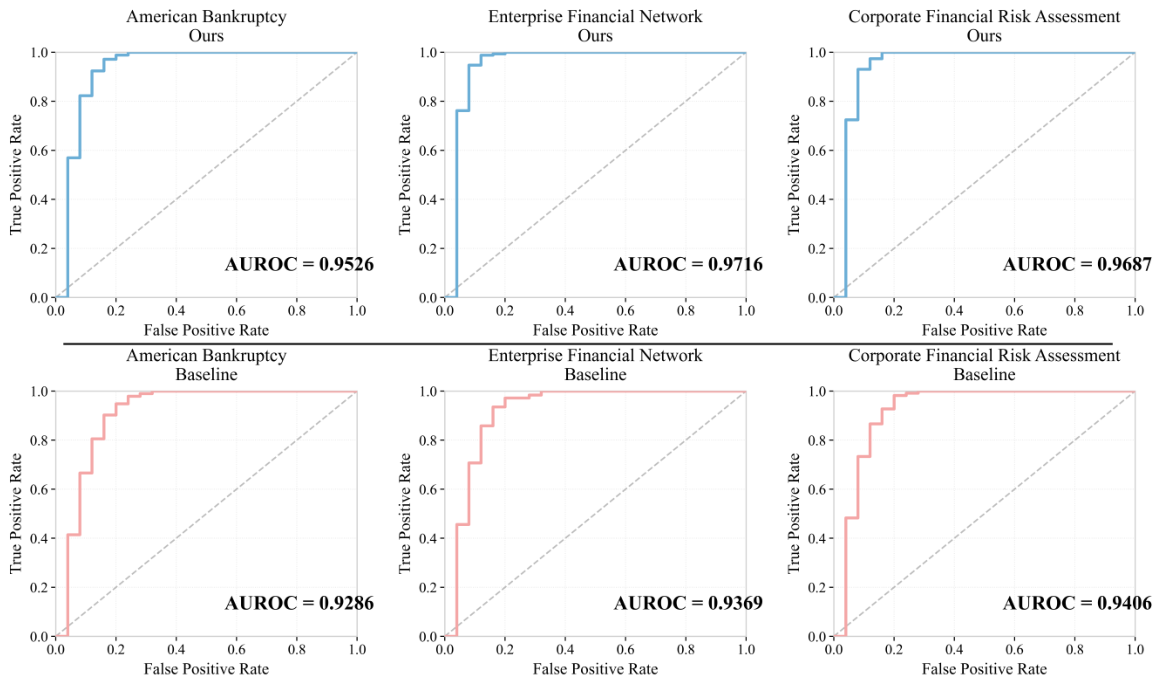
To more intuitively examine the classification behavior of the proposed method in enterprise financial risk identification tasks, ROC curves under different datasets are further presented. This part is intended to supplement the demonstration of the model’s ability to distinguish risky samples from normal samples from the perspective of threshold variation. The corresponding results are shown in Figure 6.
Figure 6.
ROC curves of Ours and Baseline on three public datasets. The first row shows the results of Ours, while the second row presents the results of Baseline.
It can be observed from the figure that the ROC curves of the proposed method on all three datasets are generally closer to the upper left region, indicating that it can maintain stronger risk identification ability and class discrimination ability under different decision thresholds. Compared with the baseline model, the proposed framework is able to achieve a higher true positive recognition rate while controlling the false alarm level, which suggests that the ASD-MSE module enhances the model’s sensitive representation ability for critical static risk-related feature patterns, while the HMMA-TF module further improves the embedding fusion effect under hierarchical feature interaction, thereby enabling the complete model to form a more stable and more discriminative metric-space decision boundary in enterprise financial risk identification tasks. Overall, these results further verify that the proposed method has strong classification reliability and risk early warning capability across different data scenarios.
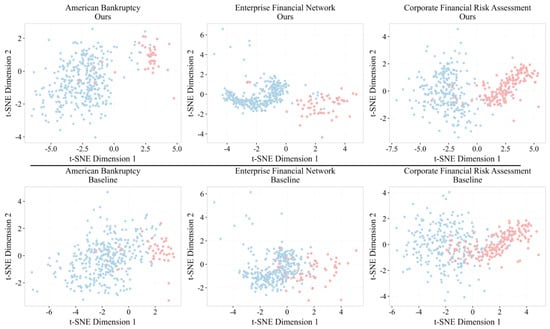
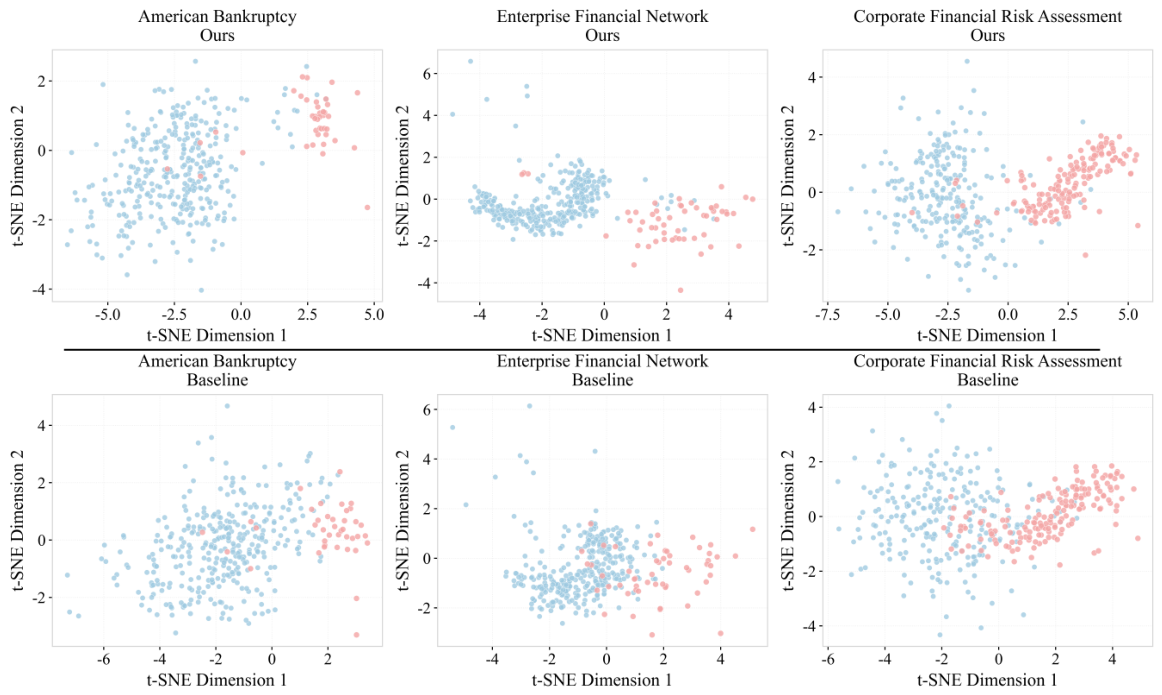
5.7. t-SNE Experimental Results
To further observe the representation distribution characteristics of the proposed method in high dimensional feature space, the sample embedding results under different datasets are visualized. This part aims to characterize the aggregation patterns and boundary structures of risky samples and normal samples in low dimensional space from the perspective of feature projection. The corresponding results are shown in Figure 7.
Figure 7.
t-SNE visualizations of Ours and Baseline on three public datasets. The first row presents the feature distribution of Ours, while the second row shows the feature distribution of Baseline. The red dots represent positive samples, while the blue dots represent negative samples.
It can be observed from the figure that the feature distributions produced by the proposed method on all three datasets exhibit clearer class aggregation structures and more stable boundary separation patterns. Compared with the baseline model, the proposed framework enables risky samples and normal samples to form more compact and more discriminative distribution patterns in the low dimensional projection space, while still retaining a small number of overlapping samples and outliers, which indicates that the model improves overall discriminative capability without departing from the complex data characteristics of real financial risk identification tasks. Further analysis shows that the ASD-MSE module enhances the model’s sensitive representation ability for critical static risk-related feature patterns, making the internal consistency of samples from the same class stronger in the embedding space, while the HMMA-TF module optimizes the structural organization of different classes through hierarchical embedding interaction and fusion, thereby enabling the complete model to form a clearer metric-space risk representation. These results indicate that the proposed method not only improves the separability of enterprise financial risk samples, but also enhances the stability and discriminative reliability of feature representations.
5.8. Sample Pair Similarity Distance Spectrum Visualization Experiment
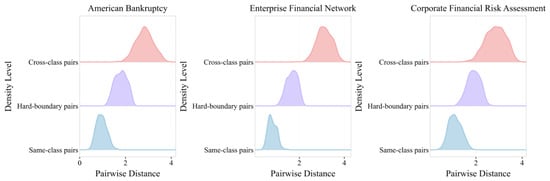
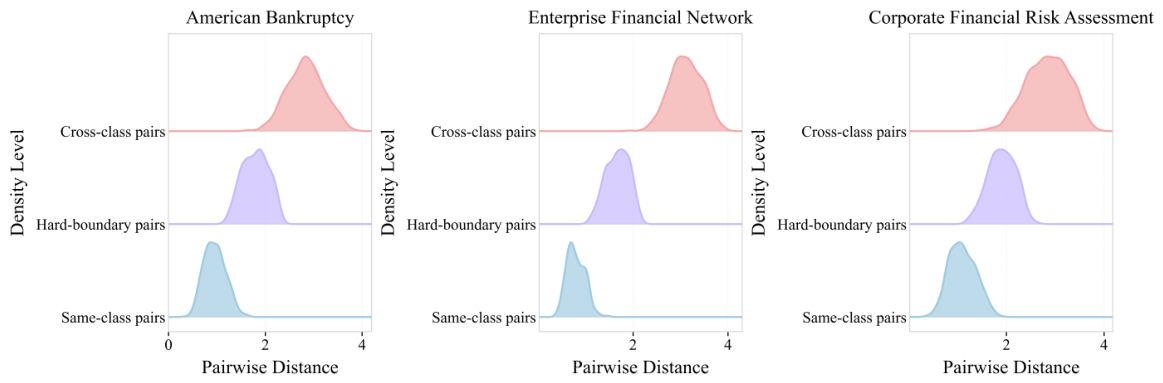
In the similarity distance spectrum analysis of sample pairs, the sample pairs are divided into three categories, namely same class sample pairs, different class sample pairs, and hard boundary sample pairs. Among them, same class sample pairs consist of two samples with identical labels and are used to characterize intra class compactness. Different class sample pairs consist of two samples with different labels and are used to characterize inter class separation. Hard boundary sample pairs consist of samples located near the classification boundary and associated with a high risk of confusion, which can be obtained by selecting samples whose prediction confidence is close to the decision threshold, or by choosing different class sample pairs with small distances in the metric embedding space. Based on the distance distributions of these three types of sample pairs, the model can be further analyzed from the perspective of the geometric structure of the static feature embedding space in terms of its comprehensive ability for intra class aggregation, inter class separation, and boundary region discrimination. The corresponding results are shown in Figure 8.
Figure 8.
Pairwise distance spectra of Ours on three public datasets. The distributions of same-class pairs, hard-boundary pairs, and cross-class pairs are visualized to illustrate the geometric structure of the learned feature space.
It can be observed from the figure that the proposed method forms relatively clear hierarchical distance distributions across all three datasets, in which same class sample pairs are mainly concentrated in regions with smaller distances, indicating that the model is able to map samples of the same class into a more compact feature space. Different class sample pairs are generally distributed over larger distance intervals, suggesting that risky samples and normal samples can maintain better class separation. Hard boundary sample pairs are located between the two, which is consistent with the characteristic of boundary region samples being prone to confusion in real financial risk identification tasks. Further analysis shows that although the distribution patterns of the three types of sample pairs are not exactly the same across different datasets, they all exhibit an ordered structure ranging from same class compactness to different class separation. This indicates that the metric constraints constructed by ASD-MSE can effectively optimize the geometric organization of feature space, enabling the model to enhance inter class separability while maintaining intra class consistency, thereby providing a more stable and more discriminative representation foundation for subsequent risk discrimination.
5.9. Hyperparameter Sensitivity Experimental Results
To evaluate the model’s response to changes in key training parameters, this paper further examines several core hyperparameters independently. This section aims to analyze the impact of different settings on the model’s optimization behavior from the perspectives of training process stability and parameter fit.
5.9.1. Learning Rate Hyperparameter Sensitivity Experimental Results
First, this paper presents the experimental results of the hyperparameter sensitivity of the learning rate, as shown in Table 7.
Table 7.
Learning rate sensitivity results on three public datasets under the -shot setting.
As shown in Table 7, the learning rate setting directly affects the overall performance of the model on the three datasets. Although an excessively small learning rate can maintain a relatively stable parameter update process, it limits the model’s ability to fully explore critical risk features and class boundary information, making it difficult for feature representation ability and discriminative capability to reach a more optimal state. When the learning rate is gradually adjusted to a more appropriate range, the model can more effectively coordinate the risk sensitive metric constraints introduced by ASD-MSE with the advantages of multi level feature interaction provided by HMMA-TF, thereby enabling all evaluation metrics to improve simultaneously. However, when the learning rate continues to increase, the performance shows a certain decline, indicating that an excessively large update step weakens the stable organization ability of the feature space and has an adverse effect on the fine boundary modeling between risky samples and normal samples. Overall, an appropriate learning rate can more fully release the structural modeling capability and discriminative advantages of the proposed method in few shot enterprise financial risk identification tasks, which further indicates that the framework has a relatively clear adaptive range for parameter update scale during training.
5.9.2. Experimental Results of Optimizer Hyperparameter Sensitivity
To further investigate the influence of different parameter update mechanisms on the model training process, a dedicated analysis of the optimizer settings was conducted. This part is mainly intended to observe the regulatory effects of different optimization strategies on the model convergence behavior and feature learning process under the same task conditions. The corresponding results are shown in Table 8.
Table 8.
Optimizer sensitivity results on three public datasets under the -shot setting.
As shown in Table 8, different optimizers have a relatively significant influence on the model training process and final discriminative performance. Compared with SGD and RMSprop, Adam and AdamW are more capable of balancing the stability of parameter updates and the adequacy of feature learning, allowing the risk sensitive metric constraints introduced by ASD-MSE and the multi level feature interaction mechanism constructed by HMMA-TF to achieve more effective collaborative optimization, thereby demonstrating stronger overall identification capability across all three datasets. Among them, AdamW achieves the best overall results, indicating that in the current task, a reasonable adaptive update strategy and weight regulation method are more beneficial for maintaining intra class compactness and inter class separability in feature space, while further enhancing the model’s ability to characterize complex enterprise financial risk patterns. This also indicates that the proposed method depends not only on the structural design itself, but also on the cooperation of an appropriate optimization mechanism in order to more fully exploit its advantages in few shot enterprise financial risk identification tasks.
5.10. Statistical Analysis Results
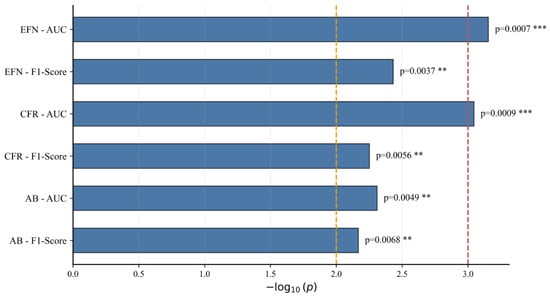
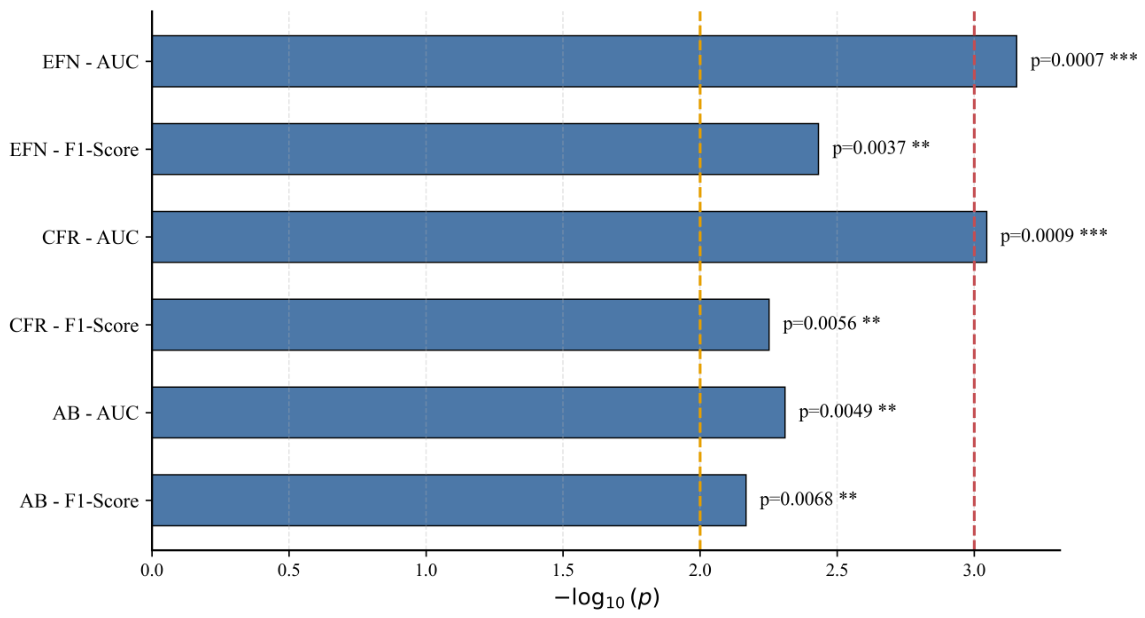
To further verify whether the performance improvement of the proposed method over the baseline model is statistically reliable, this study conducts a paired statistical analysis on the repeated experimental results of Baseline and Ours under the same dataset, evaluation metrics, and random seed settings. Specifically, the results of the corresponding evaluation metrics obtained by the two methods under different random seeds are constructed as paired samples, and a two-tailed paired t-test is adopted to calculate the significance level p value, so as to evaluate whether the performance difference between the two methods is caused by random fluctuations. In the statistical notation, indicates that the difference reaches a significant level and is denoted as **, while indicates that the difference reaches a highly significant level and is denoted as ***, and the experimental results are shown in Figure 9.
Figure 9.
The Paired statistical significance analysis between the proposed method and the baseline model across different datasets and key evaluation metrics. The horizontal axis represents , where larger values indicate stronger statistical significance. The yellow dashed line denotes the significance threshold of (), while the red dashed line denotes the highly significant threshold of (). The asterisks indicate the significance level, where ** represents and *** represents .
As shown in Figure 9, the proposed method exhibits statistically significant differences in terms of F1-Score and AUC on all three datasets, indicating that its performance improvement over the baseline model is not merely caused by random seeds or experimental fluctuations. Overall, the significance results across different datasets are relatively consistent, demonstrating that the proposed method has a stable discriminative advantage in the few-shot enterprise risk identification task. In particular, stronger significance levels are observed on the AUC metric across multiple datasets, further indicating that the proposed method has good statistical reliability in distinguishing risk samples from non-risk samples.
6. Conclusions
This study addresses three core challenges in enterprise risk identification: severe class imbalance, strong cross-enterprise and cross-industry heterogeneity, and complex coupling among high-dimensional structural attributes. To tackle these issues, a unified structured metric learning framework is proposed. The framework consists of a state-space feature embedding network, an Adaptive Spectral Decomposition and Multi-Scale State Embedding module, and a Hierarchical Metric Manifold Alignment via Task-Coupled Embedding Flows module, thereby achieving robust risk discrimination within the prototype metric space. Experimental results demonstrate that the proposed method significantly outperforms traditional machine learning models, deep embedding models, and structured graph neural network models on the American Bankruptcy, Corporate Financial Risk Assessment, and Enterprise Financial Network benchmark datasets. It achieves leading performance across multiple metrics, including Precision, Recall, Accuracy, F1, and AUC. The confusion matrices exhibit clear diagonal dominance, and the t-SNE visualization results show distinct inter-class separation and strong intra-class compactness, fully validating the model’s discriminative consistency and generalization robustness under low-sample and heterogeneous data distribution conditions.
Future research will focus on three main directions. First, integrating cross-modal knowledge and graph-structural priors to achieve joint alignment in the spectral, structural, and relational domains within the prototype metric framework. Second, improving data utilization efficiency through self-supervised, semi-supervised, and limited active annotation strategies to alleviate representation drift caused by extreme imbalance and domain shifts. Third, combining prototype neighborhood and counterfactual analysis for enhanced interpretability, while incorporating adaptive risk threshold calibration and fairness evaluation to improve the model’s deployability and interpretability in real-world financial risk control scenarios. Through these extensions, the proposed structured metric learning framework is expected to exhibit broader applicability and practical value in large-scale, highly heterogeneous enterprise risk prediction tasks.
Author Contributions
Methodology, D.M., X.T. and P.N.; Software, P.N.; Investigation, D.M., Z.R., X.T. and P.N.; Resources, D.M., Z.R., X.T. and P.N.; Data curation, Z.R., X.T. and P.N.; Writing—original draft, D.M. and P.N.; Writing—review & editing, D.M., Z.R., X.T. and P.N.; Visualization, D.M.; Supervision, D.M. All authors have read and agreed to the published version of the manuscript.
Funding
This research received no external funding.
Data Availability Statement
American Bankruptcy Dataset. Available on GitHub at https://github.com/sowide/bankruptcy_dataset (accessed on 14 June 2026). The dataset covers U.S. public companies from 1999 to 2018 (NYSE/NASDAQ), with accounting data for 8262 firms and 78,682 firm-year observations; bankruptcy labels follow SEC Chapter 7/11 definitions (labeling the fiscal year preceding the filing as “1”), and the repository is released under the CC BY 4.0 license. Corporate Financial Risk Assessment Dataset. Hosted on Kaggle at https://www.kaggle.com/datasets/zoya77/corporate-financial-risk-assessment-dataset (accessed on 14 June 2026). The dataset describes 5000 company-level records combining corporate metrics with macroeconomic indicators and sector coverage. When a specific open-data license is not displayed on the dataset page, access and reuse are governed for registered users by Kaggle’s Terms of Service for Public User Submissions. Enterprise Financial Network Dataset. Available on Kaggle at https://www.kaggle.com/datasets/ziya07/enterprise-financial-network-dataset (accessed on 14 June 2026). The dataset indicates inclusion of financial, legal, credit, and relational attributes with bankruptcy labels; in the absence of an explicit license listing on the page, access follows Kaggle’s Terms of Service for Public User Submissions.
Conflicts of Interest
The authors declare no conflicts of interest.
References
- Bhatore, S.; Mohan, L.; Reddy, Y.R. Machine learning techniques for credit risk evaluation: A systematic literature review. J. Bank. Financ. Technol. 2020, 4, 111–138. [Google Scholar] [CrossRef] [Scilit]
- El Madou, K.; Marso, S.; El Kharrim, M.; El Merouani, M. Evolutions in machine learning technology for financial distress prediction: A comprehensive review and comparative analysis. Expert Syst. 2024, 41, e13485. [Google Scholar]
- da Silva Mattos, E.; Shasha, D. Bankruptcy prediction with low-quality financial information. Expert Syst. Appl. 2024, 237, 121418. [Google Scholar]
- Chang, A.H.; Yang, L.K.; Tsaih, R.H.; Lin, S.K. Machine learning and artificial neural networks to construct P2P lending credit-scoring model: A case using Lending Club data. Quant. Financ. Econ. 2022, 6, 303–325. [Google Scholar]
- Sanchez-Medina, A.J.; Blázquez-Santana, F.; Cerviño-Cortínez, D.L.; Pellejero, M. Ensemble Methods for Bankruptcy Resolution Prediction: A New Approach. Comput. Econ. 2025, 66, 3891–3926. [Google Scholar] [CrossRef] [Scilit]
- Arik, S.Ö.; Pfister, T. Tabnet: Attentive interpretable tabular learning. In Proceedings of the AAAI Conference on Artificial Intelligence; AAAI Press: Palo Alto, CA, USA, 2021; Volume 35, pp. 6679–6687. [Google Scholar]
- Voskou, A.; Christoforou, C.; Chatzis, S. Transformers with stochastic competition for tabular data modelling. arXiv 2024, arXiv:2407.13238. [Google Scholar]
- Gorishniy, Y.; Rubachev, I.; Khrulkov, V.; Babenko, A. Revisiting deep learning models for tabular data. Adv. Neural Inf. Process. Syst. 2021, 34, 18932–18943. [Google Scholar]
- Zandi, S.; Korangi, K.; Óskarsdóttir, M.; Mues, C.; Bravo, C. Attention-based dynamic multilayer graph neural networks for loan default prediction. Eur. J. Oper. Res. 2025, 321, 586–599. [Google Scholar]
- Snell, J.; Swersky, K.; Zemel, R. Prototypical networks for few-shot learning. Adv. Neural Inf. Process. Syst. 2017, 30, 1–11. [Google Scholar]
- Vinyals, O.; Blundell, C.; Lillicrap, T.; Kavukcuoglu, K.; Wierstra, D. Matching networks for one shot learning. Adv. Neural Inf. Process. Syst. 2016, 29, 1–9. [Google Scholar]
- Sung, F.; Yang, Y.; Zhang, L.; Xiang, T.; Torr, P.H.; Hospedales, T.M. Learning to compare: Relation network for few-shot learning. In Proceedings of the IEEE Conference on Computer Vision and Pattern Recognition; IEEE: Piscataway, NJ, USA, 2018; pp. 1199–1208. [Google Scholar]
- Khosla, P.; Teterwak, P.; Wang, C.; Sarna, A.; Tian, Y.; Isola, P.; Maschinot, A.; Liu, C.; Krishnan, D. Supervised contrastive learning. Adv. Neural Inf. Process. Syst. 2020, 33, 18661–18673. [Google Scholar]
- Deng, J.; Guo, J.; Xue, N.; Zafeiriou, S. Arcface: Additive angular margin loss for deep face recognition. In Proceedings of the IEEE/CVF Conference on Computer Vision and Pattern Recognition; IEEE: Piscataway, NJ, USA, 2019; pp. 4690–4699. [Google Scholar]
- Schroff, F.; Kalenichenko, D.; Philbin, J. Facenet: A unified embedding for face recognition and clustering. In Proceedings of the IEEE Conference on Computer Vision and Pattern Recognition; IEEE: Piscataway, NJ, USA, 2015; pp. 815–823. [Google Scholar]
- Sun, W.; Xu, Z.; Zhang, W.; Ma, K.; Wu, Y.; Sun, M. Advanced Risk Prediction and Stability Assessment of Banks Using Time Series Transformer Models. In Proceedings of the 2024 5th International Conference on Big Data Economy and Information Management; Association for Computing Machinery: New York, NY, USA, 2024; pp. 657–661. [Google Scholar]
- Jiang, J.; Chen, C.; Lackinger, A.; Li, H.; Li, W.; Pei, Q.; Dustdar, S. Metatrans-fstsf: A transformer-based meta-learning framework for few-shot time series forecasting in flood prediction. Remote Sens. 2024, 17, 77. [Google Scholar]
- She, Y.; Hong, Y.; Shen, S.; Yang, B.; Zhang, L.; Wang, J. Consistency regularization for few shot multivariate time series forecasting. Sci. Rep. 2025, 15, 14195. [Google Scholar] [CrossRef] [Scilit] [PubMed]
- Wu, L. A meta-learning network method for few-shot multi-class classification problems with numerical data. Complex Intell. Syst. 2024, 10, 2639–2652. [Google Scholar]
- Lai, S.; Wu, J.; Ye, C.; Wu, Z.; Ma, Z.; Zhou, H. IFTrans: A few-shot classification method for consumer fraud detection in social sensing. Knowl.-Based Syst. 2025, 319, 113608. [Google Scholar] [CrossRef] [Scilit]
- Jin, X.; Lin, S.L. An early prediction model on systemic risk under global risk: Using FinBERT and temporal fusion transformer to multimodal data fusion framework. N. Am. J. Econ. Financ. 2025, 76, 102361. [Google Scholar] [CrossRef] [Scilit]
- Shen, C.; Wu, J. Research on credit risk of listed companies: A hybrid model based on TCN and DilateFormer. Sci. Rep. 2025, 15, 2599. [Google Scholar] [CrossRef] [Scilit] [PubMed]
- Schwab, B.; Kriebel, J. Mitigating adversarial attacks on transformer models in credit scoring. Eur. J. Oper. Res. 2025, 328, 309–323. [Google Scholar] [CrossRef] [Scilit]
- Yang, X.; Xia, Z.; Song, J.; Liu, Y. Credit risk prediction for small and micro enterprises based on federated transfer learning frozen network parameters. J. Netw. Comput. Appl. 2024, 232, 104009. [Google Scholar] [CrossRef] [Scilit]
- Pourkhoshgoftar, S.; Shahbahrami, A.; Esmi, N. Graph-Based Inductive Learning for Credit Risk Prediction with Imbalance Mitigation. Comput. Econ. 2025, 1–29. [Google Scholar] [CrossRef] [Scilit]
- Petrosino, L.; Bacco, L.; Salvati, G.; Merone, M.; Papi, M. A GARCH-temporal fusion transformer model for the volatility prediction of exchange traded funds. Neural Comput. Appl. 2025, 37, 21435–21458. [Google Scholar] [CrossRef] [Scilit]
- Wang, Y. Time-Series Premium Risk Prediction via Bidirectional Transformer. Trans. Comput. Sci. Methods 2025, 5, 1–12. [Google Scholar]
- Kwon, S.; Jang, J.; Kim, C.O. Credit scoring using multi-task Siamese neural network for improving prediction performance and stability. Expert Syst. Appl. 2025, 259, 125327. [Google Scholar] [CrossRef] [Scilit]
- Gao, Y.; Xiao, H.; Zhan, C.; Liang, L.; Cai, W.; Hu, X. CATE: Contrastive augmentation and tree-enhanced embedding for credit scoring. Inf. Sci. 2023, 651, 119447. [Google Scholar] [CrossRef] [Scilit]
- Liu, B.; Wu, L.; Mu, S. Research on Small-Sample Credit Card Fraud Identification Based on Temporal Attention-Boundary-Enhanced Prototype Network. Mathematics 2024, 12, 3894. [Google Scholar]
- Billion-Polak, P.; Khoshgoftaar, T.M. Evaluating techniques from low-shot learning on traditional imbalanced classification tasks. J. Big Data 2025, 12, 110. [Google Scholar] [CrossRef] [Scilit]
- Fedele, A.; Guidotti, R.; Pedreschi, D. Explaining Siamese networks in few-shot learning. Mach. Learn. 2024, 113, 7723–7760. [Google Scholar] [CrossRef] [Scilit]
- Dong, K.; Jiang, B.; Li, H.; Zhu, Z.; Liu, P. Meta-learning triplet contrast network for few-shot text classification. Knowl.-Based Syst. 2024, 303, 112440. [Google Scholar]
- Li, X.; Cheng, D.; Zhang, L.; Zhang, C.; Feng, Z. Few-Shot Graph Anomaly Detection via Dual-Level Knowledge Distillation. Entropy 2025, 27, 28. [Google Scholar] [PubMed]
- Jiang, S.; Dong, R.; Wang, J.; Xia, M. Credit card fraud detection based on unsupervised attentional anomaly detection network. Systems 2023, 11, 305. [Google Scholar] [CrossRef] [Scilit]
- El Khair Ghoujdam, M.; Chaabita, R.; Elkhalfi, O.; Zehraoui, K.; Elalaoui, H.; Idamia, S. Consumer credit risk analysis through artificial intelligence: A comparative study between the classical approach of logistic regression and advanced machine learning techniques. Cogent Econ. Financ. 2024, 12, 2414926. [Google Scholar] [CrossRef] [Scilit]
- Pellegrino, M.; Lombardo, G.; Adosoglou, G.; Cagnoni, S.; Pardalos, P.M.; Poggi, A. A multi-head lstm architecture for bankruptcy prediction with time series accounting data. Future Internet 2024, 16, 79. [Google Scholar] [CrossRef] [Scilit]
- Li, J.; Wang, C. A deep learning approach of financial distress recognition combining text. Electron. Res. Arch. 2023, 31, 4683–4707. [Google Scholar] [CrossRef] [Scilit]
- Dong, P. Performance Evaluation and Interpretation of Non-life Insurance Company Bankruptcy Prediction Model Using LightGBM Algorithm and SHAP Method. Financ. Eng. Risk Manag. 2024, 7, 105–110. [Google Scholar]
- Ben Jabeur, S.; Stef, N.; Carmona, P. Bankruptcy prediction using the XGBoost algorithm and variable importance feature engineering. Comput. Econ. 2023, 61, 715–741. [Google Scholar]
- Letkovskỳ, S.; Jenčová, S.; Vašaničová, P. Is artificial intelligence really more accurate in predicting bankruptcy? Int. J. Financ. Stud. 2024, 12, 8. [Google Scholar] [CrossRef] [Scilit]
- Mittal, S.; Tyagi, S. Performance evaluation of machine learning algorithms for credit card fraud detection. In Proceedings of the 2019 9th International Conference on Cloud Computing, Data Science & Engineering (Confluence); IEEE: Piscataway, NJ, USA, 2019; pp. 320–324. [Google Scholar]
- Zhang, J.; Xie, H.; Zhang, X.; Liu, K. Enhancing risk assessment in transformers with loss-at-risk functions. In Proceedings of the 2024 IEEE International Conference on Knowledge Graph (ICKG); IEEE: Piscataway, NJ, USA, 2024; pp. 477–484. [Google Scholar]
- Bi, W.; Xu, B.; Sun, X.; Wang, Z.; Shen, H.; Cheng, X. Company-as-tribe: Company financial risk assessment on tribe-style graph with hierarchical graph neural networks. In Proceedings of the 28th ACM SIGKDD Conference on Knowledge Discovery and Data Mining; Association for Computing Machinery: New York, NY, USA, 2022; pp. 2712–2720. [Google Scholar]
- Amarnadh, V.; Moparthi, N.R. Range control-based class imbalance and optimized granular elastic net regression feature selection for credit risk assessment. Knowl. Inf. Syst. 2024, 66, 5281–5310. [Google Scholar] [CrossRef] [Scilit]
- Auer, R.; Haslhofer, B.; Kitzler, S.; Saggese, P.; Victor, F. The technology of decentralized finance (DeFi). Digit. Financ. 2024, 6, 55–95. [Google Scholar]
- Liu, S. LTR-Net: A deep learning-based approach for financial data prediction and risk evaluation in enterprises. PLoS ONE 2025, 20, e0328013. [Google Scholar] [PubMed]
- Liu, Y.; Bu, N.; Li, Z.; Zhang, Y.; Zhao, Z. AT-FinGPT: Financial risk prediction via an audio-text large language model. Financ. Res. Lett. 2025, 77, 106967. [Google Scholar]
- Wang, M.; Huang, W.; Xie, W.; Hou, J.; Gao, X.; Fu, X. TemFRC: Enterprise financial risk prediction with temporal folding and risk contrast. Inf. Process. Manag. 2026, 63, 104780. [Google Scholar] [CrossRef] [Scilit]
- Luo, Y. ExHybridNet: An Explainable Hybrid Machine Learning Model for Corporate Financial Risk Prediction. In Proceedings of the 2025 International Conference on Generative Artificial Intelligence for Business; Association for Computing Machinery: New York, NY, USA, 2025; pp. 172–178. [Google Scholar]

Disclaimer/Publisher’s Note: The statements, opinions and data contained in all publications are solely those of the individual author(s) and contributor(s) and not of MDPI and/or the editor(s). MDPI and/or the editor(s) disclaim responsibility for any injury to people or property resulting from any ideas, methods, instructions or products referred to in the content. |
© 2026 by the authors. Licensee MDPI, Basel, Switzerland. This article is an open access article distributed under the terms and conditions of the Creative Commons Attribution (CC BY) license.