


Abstract
In this paper, an approach is proposed for assessing the performance of experts in the group from two perspectives: (1) individual consistencies and (2) deviations from the group decision. The quality of performance of the experts is based on combining the standard and rough analytic hierarchy process (AHP) with the technique for order of preference by similarity to the ideal solution (TOPSIS). The statistical method CRITIC is used to derive weights for the TOPSIS method before the experts are assessed based on demonstrated consistency and deviations from the group. Common performance indicators, such as consistency ratio, Euclidean distance, compatibility, and Spearman’s correlation coefficient, are proposed for re-grouping experts before making the final decisions. A genetic algorithm enables the efficient solving of this complex clustering problem. Implementing the described approach and method can be useful in comparable assessment frameworks. A critical aspect is conducting a thorough pre-assessment of the competence of potential decision makers, often referred to as experts who may not consistently exhibit apparent expertise. The competence of decision makers (which does not have to be associated with compatibility) is evidenced by selected consistency parameters, and in a way, a pre-assessment of their competence follows Plato’s ‘government of the wise’ principle. In the presented study, the compatibility of individuals in the group with the collective position (group decision) is measured by parameters related to their compatibility with the group solution and statistical deviation while ranking decision elements. The proposed multi-model-based approach stands out for its resilience in conducting thorough pre-assessment of the quality (competence) of potential decision makers, often regarded as experts who might not consistently display evident expertise. The wetland study area in Serbia is used as an example application, where seven measures for reducing the risk of drought were evaluated by twelve experts coming from different sectors and with different backgrounds and expertise.
MSC:
90B50
1. Introduction
Group decision making (GDM) is a widely researched topic with a plethora of items in the literature on decision-making processes in groups of various sizes. The analytic hierarchy process (AHP) [1] is a commonly used multi-criteria method to support GDM processes in practice. On a contextual side, the group decision can be questionable if it does not include all relevant items and/or if the methodology for deriving the decision is inadequate. If the procedure did not include all relevant participants, the decision can be criticized by another group(s).
This paper focuses on developing a method for assessing the quality of experts who act as decision makers. One of the major challenges is determining how many experts should be involved in making group decisions and which instruments to use to evaluate their consistency while judging decision elements. The other important issue is to measure the deviations of individual decisions from the group decision, once the latter is derived by some method of aggregation, consensual or non-consensual. Consistency and compatibility measures may help to determine the optimal size of the group of experts and make the process of decision making efficient. Worth mentioning is that conducting a thorough analysis of consistency and compatibility measures represented by specific indicators is partly contingent on the specific problem and contributes to efficiently clustering decision makers. The clustering process, based on selected distance measures as parts of the fitness function in the genetic algorithm, can only indicate the optimal number and size of clusters, subsequently guiding further research in group decision-making processes. The literature review did not uncover research findings regarding the identification of the ideal group size. Any methodological approach to grouping may face skepticism and criticism. For instance, assigning weights to decision makers within aggregation schemes could pose challenges for several reasons, rendering it an inadvisable element of grouping methodology.
The proposed method to rank experts based on their consistency and compatibility with the group decision is based on the combined use of the analytic hierarchy process (AHP) [1] and the technique for order of preference by similarity to the ideal solution (TOPSIS) [2]. To derive the group decision, first, the AHP has to be used in its standard, crisp, version to obtain individual priority vectors by experts and then to geometrically aggregate these vectors into the group vector. Computations of consistency and deviation parameters based on crisp AHP results enable the assessment and ranking of the experts by their quality of decision-making performance using the TOPSIS method. The approach involves creating a decision matrix that contains specific performance indicators used as the criteria for evaluating experts. The CRITIC method [3] is proposed to determine objective weights for these performance indicators resulting from the crisp AHP application. Subsequently, the TOPSIS method enables the identification of possible subgroups of experts, determining outliers, and deriving optimal solutions. Finally, the use of a genetic algorithm may allow for mapping experts in clusters according to demonstrated performance.
It is important to note that, after the group members have established their priority vectors using the AHP, the organizer of the decision-making process has several options for determining the outcome—the group priority vector. One approach is to use the priority vectors derived by each individual and aggregate them to create a group priority vector. Another approach is to perform an adjacency assessment of the individual vectors, grouping members based on the distances among their vectors, and deriving sub-group priority vectors. This approach may result in a different group vector than if all individuals belong to a single group. Additionally, this assessment can identify members who significantly deviate from the group decision, leading to their exclusion from the process or assigning low weight to their individual decisions. Managing the process with outliers in the group is a complex issue that requires careful consideration of both subjective and objective factors.
Moreover, group decision making poses significant challenges due to the diverse backgrounds, attitudes, communication skills, and adaptability of its members. The behavior of decision makers throughout the process is crucial, as it can be prolonged and repetitive, requiring constant adjustments to judgments based on new information. During this process, decision makers must demonstrate their ability to assess causality, importance, preferences, and goals while considering the available data and any limitations or constraints.
Measuring the quality of decision-making performance within a group is a delicate task, involving subjective characteristics such as cognition, reasoning, inference, and deduction. Aggregating these aspects into a reliable judgment outcome can be difficult, leading to errors and complications in an already complex decision-making process.
Given the aforementioned challenges, the use of the rough numbers theory [4,5] and the application of a rough version of the AHP are proposed to address individual judgments directly. This involves creating and manipulating a sequence of judgments for each instance of comparing two decision elements by importance, using rough rules instead of the traditional aggregation methods like geometric or additive averages.
By utilizing both crisp and rough AHP vectors, valuable insights are gained into the objective evaluation of the experts’ performance. This combined approach proves to be a useful tool for assessing their decision-making capabilities. It allows them to consider not only the precise well-defined aspects of their judgments (standard AHP) but also the inherent uncertainty and imprecision in their assessments (rough AHP).
By incorporating rough numbers theory, accounting for the vagueness and ambiguity that often exist in decision-making scenarios is acknowledged. This empowers handling individual judgments more realistically and flexibly, considering the nuances and complexities that can arise during the decision-making process.
The use of rough AHP in handling individual judgments directly, rather than relying solely on traditional aggregation techniques, enables a more nuanced and adaptive analysis. This approach ensures that each decision element’s importance is properly assessed with consideration of the available data, leading to a comprehensive evaluation of the experts’ performance.
In summary, the integration of crisp and rough AHP offers a comprehensive framework for evaluating decision-making performance. By acknowledging uncertainty and employing a more flexible analysis, this complementary approach provides a richer understanding of experts’ abilities, making it a valuable tool in the assessment process.
This study presents a novel approach for restructuring decision-making groups by clustering experts using a combination of genetic algorithm and minimum distance rule based on their consistency and agreement with the group. The proposed method utilizes performance indicators that assess individual consistency and agreement with the group decision, enabling the identification of sub-groups of experts and potential outliers that may be excluded from future decision-making processes. For an illustration of how GDM challenges can be addressed in practice, an example method application is presented for a group of twelve decision makers from diverse sectors, educational backgrounds, and professional expertise who participated in evaluating measures on how to reduce drought risks in managing wetland in floodplains along the Danube River in Serbia.
2. Related Work on Group Decision-Making
2.1. Approaches and Methods
According to [6,7], multi-factor decision-making frameworks can be classified as group decision making, negotiated decision making, and systemic decision making. In recent decades other multi-factor settings also received the attention of researchers and professionals in business, industry, academia, etc. For instance, consensual decision making enables the integration of opinions from involved experts, enabling, thus, a better understanding of decision-related problems and a more efficient collection of individual viewpoints in the search for agreed solutions by consensus.
The literature sources offer a comprehensive understanding of existing approaches, methods, and methodologies across all the aforementioned group decision-making settings. It is noteworthy to mention several published research results in this context. Du and Shan [8] discuss the issue of possible large differences in the knowledge and educational background of participants in large groups when an accurate evaluation of the criteria set is unlikely to be expected. An evaluating system is proposed to assess input criteria and detect the critical set of so-called output criteria based on a probability assignment function as an information extraction method aimed at capturing and accurately reflecting the authenticity of experts’ judgments. The authors claim that the method can effectively help in the real-time updating of ideas and the screening of best ideas in an intelligence recommendation framework. Aggregation or consensus models for combining individual ideas into group ideas and measures on how to validate such models’ quality are discussed to only a limited extent.
Interesting research is presented in [9] related to assessing the team roles of participants in the group. An AI approach is developed to enable the creation of efficient and consistent teammates by considering their roles in the group. Exploratory and confirmatory factor analysis is involved to assess the effects of changes in team composition when deriving joint decisions. Based on expert interviews and pre-defined four team roles, it was shown that the consistent team roles are identified as coordinator, creator, perfectionist, and doer. This study is interesting because it relates to our research in part on grouping experts based on their consistency and deviation (from the group) performance indicators.
Dayeh and Morrison [10] claim the importance of properly using the hidden-profile paradigm, which is commonly understood as a research design in which team members have information that should be shared to arrive at an accurate final (group) decision. Namely, the authors rely on various research and conclusions that group members usually fail to exploit their information in group settings. Their study explored different situations in an attempt to determine how each team member’s perception of competence, relative to other team members, influences information sharing and decision accuracy in hidden profiles. In conclusion, it is indicated that individuals (within a group) who perceive themselves as less competent are willing to share more information than others. Also, regarding decision accuracy, the conclusion is that it is better in a cooperative environment.
Escobar and Moreno-Jimenez [6] presented a novel approach for the aggregation of individual decisions in the group, named aggregation of individual preference structures (AIPS). An approach is strictly oriented to the AHP method, incorporates ideas from the social choice theory method and the Borda count and, in a way, is a continuation of well-known aggregations in AHP-group decision making known as AIP and AIJ. The AIPS method captures the uncertainties inherent in human beings; the interdependencies between the alternatives and the preferences are associated by each decision maker to these interdependencies. The approach is proposed to be situated in the initial phases of the decision-making process and as a tool to support the negotiation process within the decision-making group.
Zorluoğlu and Kabak [11] structured a specific project portfolio-selection problem as a hierarchical group decision-making problem and applied it to the automotive sector. An idea behind the proposed information-technology-business-oriented approach is to involve, as much as possible, information from a large number of employees in the organization and, in a way, suppress the influence or dominance of one decision maker, whoever he or she is. Also, the aim is to reduce biases and the irrelevant evaluation of decision elements, including ‘noise’ information while judging decision elements (in this case, criteria). A weighted cumulative belief degree approach is proposed for aggregating the evaluations and the final criteria weights determined by participants in the group decision-making process. This concept is, in a way, similar to the one known in consensus-reaching methodologies (e.g., [12,13,14]).
2.2. Analytic Hierarchy Process
In the standard version of AHP, at a given level of the hierarchy, each individual creates square matrix A by comparing decision elements. The pair-wise comparison principle is applied by using Saaty’s scale with nine levels of preferences or 17 levels of comparison (when both parts of the scale are taken into account, linear 1–9 and nonlinear 1/9–1/2), Table 1.
Table 1.
Saaty’s scale.
When a group consists of M individuals, each member of the group creates a pairwise comparison matrix of type (1). From each matrix, a weight vector w needs to be extracted using one of the existing methods. Weights provide cardinal information about the significance of compared elements, and based on them, the ranks of elements are determined as ordinal information. There are matrix-based and optimization-based methods commonly used to calculate the weight vector w from the matrix (1), collectively referred to as AHP prioritization methods. The most used are the eigenvector method, additive normalization method, weighted least squares method, logarithmic least squares method, logarithmic goal programming, fuzzy preference programming method, and cosine maximization method [15]. Ongoing scientific discussions exist regarding which method is superior, and various studies have compared the methods mentioned to determine their effectiveness.
The consensus is that no method can be given a priori preference. In this particular paper, the eigenvector method was employed as a key component of the standard AHP method. The prioritization of elements employed in a matrix (1) by the eigenvector method produces the weight vector = (, …, ) after the linear system (2) is solved. In relation (2), λ represents the principal eigenvalue of the matrix, and e is the unit vector = (1, 1, …, 1) of dimension n.
If an individual is completely consistent, meaning the transitive rule holds for every i, j, and k from the set of values (1, 2, …, n), then λ = n. Otherwise, λ > n. The maximum eigenvalue (λmax) for an inconsistent matrix can be estimated by successive squaring matrix A. When squaring is performed, the elements are summed by rows, and the sums are normalized to be equal in sum. Thus, approximations of the desired vector are obtained, and the procedure is terminated when the difference between two successive vectors is less than a defined value.
In group applications of crisp AHP, the most commonly used aggregation procedure is the AIP, the aggregation of individual priorities. Another option for aggregation is to apply procedure AIJ, the aggregation of individual judgments at each entry of matrix A, and then, continue with prioritization, for instance, by the eigenvector method. More details on AIP and AIJ can be found in [16].
To check the consistency of pairwise comparisons and the quality of the results obtained by the standard, crisp, version of AHP, the consistency ratio (CR) and Euclidean distance (ED) are commonly used as measures of judgment quality demonstrated by an individual.
The consistency ratio (CR) is calculated during the standard AHP procedure. First, the consistency index (CI) is calculated by relation (3)
where is the maximum eigenvalue of the matrix A. Then, using this index and the random index (RI), which depends on the order of the matrix, the consistency ratio is obtained by relation (4).
The value of RI for various matrix orders is determined statistically using samples of 500 and 1000 randomly generated comparison matrices [1]. Researchers have shown that, for small deviations from consistency ratios wi/wj, the eigenvector method provides a satisfactory approximation of the priority vector w. The tolerance value for the consistency degree is 0.10. If CR is less than 0.10, the decision-making process presents acceptable inconsistency. In some cases, this statement holds even if CR is greater than 0.10. However, adjustments may need to be made to the evaluations until a small enough value of CR is achieved.
The Euclidean distance (ED), also referred to as the total deviation, represents the distance measured between all elements in a comparison matrix (1) and the related ratios of the weights of the derived priority vector, as given in relation (5).
This consistency measure is a universal error measure and is, therefore, invariant to the prioritization method (including the eigenvector method) used for deriving vector w.
2.3. Rough Analytic Hierarchy Process
Rough AHP is the result of applying the theory of rough sets to the original AHP, similar to how it was done with the application of fuzzy theory to AHP. The theory of rough sets was presented in the early 1980s [4], and numerous authors have contributed to its further development and elaboration through applications (e.g., [17,18]). Like fuzzy theory, the rough set theory deals with uncertainties that exist in a real environment. The idea is to establish approximate boundaries for given sets of numbers. There are no parameters that indirectly treat vagueness, and the given data structure speaks for itself [18].
In the rough version of AHP, the formation of the group comparison matrix is done by first creating a sequence of ratings on each position of matrix A obtained from M members of the group: aijg = {aij1, aij2, …, aijM}. Then, all elements of the sequence are translated into rough numbers RN(aijm) = [aijmL, aijmU] (m = 1,…, M) using the method defined in [19,20]. The superscript notations L and U indicate the lower and upper bounds of the rough number RN.
The rough sequence at the given position (i,j) in the matrix is given as:
RN(aijg) ={[aij1L, aij1U], [aij2L, aij2U], …, [aijML, aijMU]}.
By conversion, the sequence is transformed into its average rough number:
where:
RN(aijg(ave)) = [aijg(ave)L, aijg(ave)U]
RN(aijg(ave)L) = (1/M) ∙ (aij1L+ aij2L … + aijML)
RN(aijg(ave)U) = (1/M) ∙ (aij1U+ aij2U … + aijMU).
The rough group weights are calculated using rough numbers (8) and (9) according to relation (10).
Averaging the values for the lower (L) and upper (U) bounds of the rough group weights gives:
The final normalization of values calculated using relation (11) yields the weights (12) that can be compared with the weights from the crisp version of the AHP method.
The basic mathematical operators on two rough numbers RN(a) = and RN(b) = are as follows:
Addition (+): RN(a) + RN(b) =
Subtraction (−): RN(a) RN(b) =
Multiplication (∙): RN(a) ∙ RN(b) =
Division (/): RN(a)/RN(b) = (assuming bL and bU are non-zero).
Scalar multiplication is also used, m∙RN(a) = , where m is a scalar and a is a rough number. More complex operators are performed using the above-mentioned rules based on the theory and principles of rough numbers.
Notice that rough weights (12), obtained by the rough version of AHP, assume that individual judgments at each position of the joint matrix (1) created the sequences from which the corresponding lower and upper limits are computed. This way, the data (judgments) ‘spoke by themselves’ instead of any aggregation, such as, for instance, by the AIJ procedure [16]. It is worth mentioning that rough AHP does not handle issues of consistency or deviations of individuals’ judgments.
2.4. TOPSIS—Technique for Order Preference by Similarity to Ideal Solution
The TOPSIS method was originally developed by Hwang and Yoon [2] and further improved by Yoon [21] and Hwang et al. [22]. The method is based on the concept that the chosen alternative should have the shortest geometric distance from the ideal solution and the longest geometric distance from the anti-ideal solution. In other words, the method treats the distances between alternatives and non-existent, so-called ‘ideal’ alternatives. It first determines the ‘ideal’ and ‘anti-ideal’ alternatives and calculates the Euclidean distances of actual alternatives from these ‘ideal points’. The best alternative is the one with the smallest distance from the ideal point, and the method guarantees that its distance from the anti-ideal point is the maximum.
The multi-criteria analysis with TOPSIS is characterized by a decision matrix, commonly called a rating matrix R. The rows of the matrix correspond to the alternatives, while the columns represent the criteria. Each element of the matrix represents the rating of a particular alternative concerning a particular criterion. For m criteria (C1, C2,…, Cm) and n alternatives (A1, A2,…, An), the matrix R has the form (13). The values (w1, w2,…, wm) written above the columns represent the weights of the criteria defined by the decision maker or determined in some other way; the sum of these weights is one.
TOPSIS calculates a score for each alternative by comparing it to both the ideal and anti-ideal solutions, represented by the best and worst values (rijb, rijw) for each criterion in the matrix (13). The method evaluates the distance between each alternative and these two solutions using a chosen distance metric, often the Euclidean distance (rarely the Manhattan distance). The relative closeness of each alternative to the ideal and anti-ideal solution is determined by the ratio of the distance to the anti-ideal solution to the sum of distances to both the ideal and anti-ideal solutions. A higher relative closeness indicates a better performance relative to the other alternatives.
The method provides a systematic and effective way to handle complex decision-making scenarios with multiple criteria, allowing decision makers and/or stakeholders to make informed choices and enhance their decision-making processes [23].
According to the review [24], the TOPSIS method is a simple process to implement, use, and program. The algorithm has six basic steps, and the number of steps remains the same regardless of the number of decision elements, such as attributes. A disadvantage of the method is that it uses Euclidean distance, which does not consider the correlation of attributes; moreover, it is difficult to weigh and maintain the consistency of judgment. Many applications of this method are recorded in the literature related to environmental modeling and management, water resources management, engineering, business, and marketing (e.g., [25,26]).
2.5. CRITIC—Method for Objective Weighting Criteria
In decision-making problems, evaluating criteria before evaluating alternatives can be difficult due to subjective, incompetent, or inconsistent human judgment. Additionally, criteria can be quantitative (price and profit), qualitative (appearance and impression), or ‘gray’ (average value and availability) in nature, which further complicates the decision-making process. As proposed for the first time in the work of Doyle [27], the decision-maker can be eliminated to a certain extent, allowing the “alternatives to decide for themselves” on the importance of criteria. The idea is to directly analyze the decision matrix and, by exploiting information on the performance of all alternatives relative to all criteria, to derive the weights of criteria.
To address these issues, the CRITIC (criteria importance through inter-criteria correlation) method was proposed in [3]. This method uses inter-criteria correlation analysis to determine the importance of criteria and involves calculating the correlation between each pair of criteria to derive weights for each criterion. Once the criteria weights are determined, alternatives can be ranked based on their performance concerning the criteria.
The method is particularly useful in decision-making problems where there are multiple criteria, and their relative importance is unclear or subjective. The method’s objective nature is based on the statistical processing of information contained in the decision matrix. The method tends to “smooth” the overall statistics of the ratings, even when they differ significantly from each other.
The paper by Androulakis and Chatzidimitriou [28] provides a detailed description of the CRITIC method and includes examples of its application in various decision-making problems. Examples of the application of the method are also given in [29,30].
2.6. Clustering Individuals within a Group by Using Genetic Algorithm
The values of performance indicators related to consistency and deviations of individuals in the group are easy to imagine as coordinates of individuals in a multi-dimensional space. If the problem is to create a given number of clusters of individuals, certain criteria for doing that are required. Such criterion can be the shortest distance of points (individuals) from the central point of the given cluster, and an appropriately structured genetic algorithm can perform clustering for a given number of points.
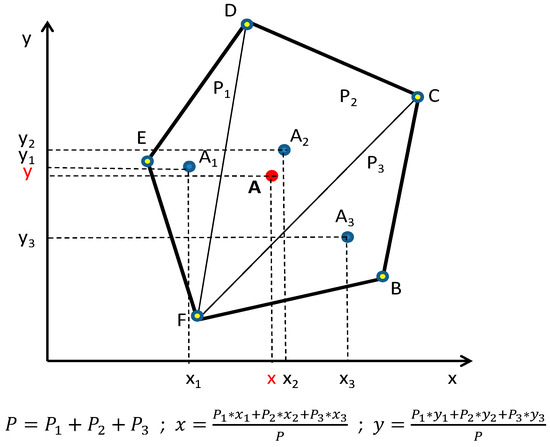
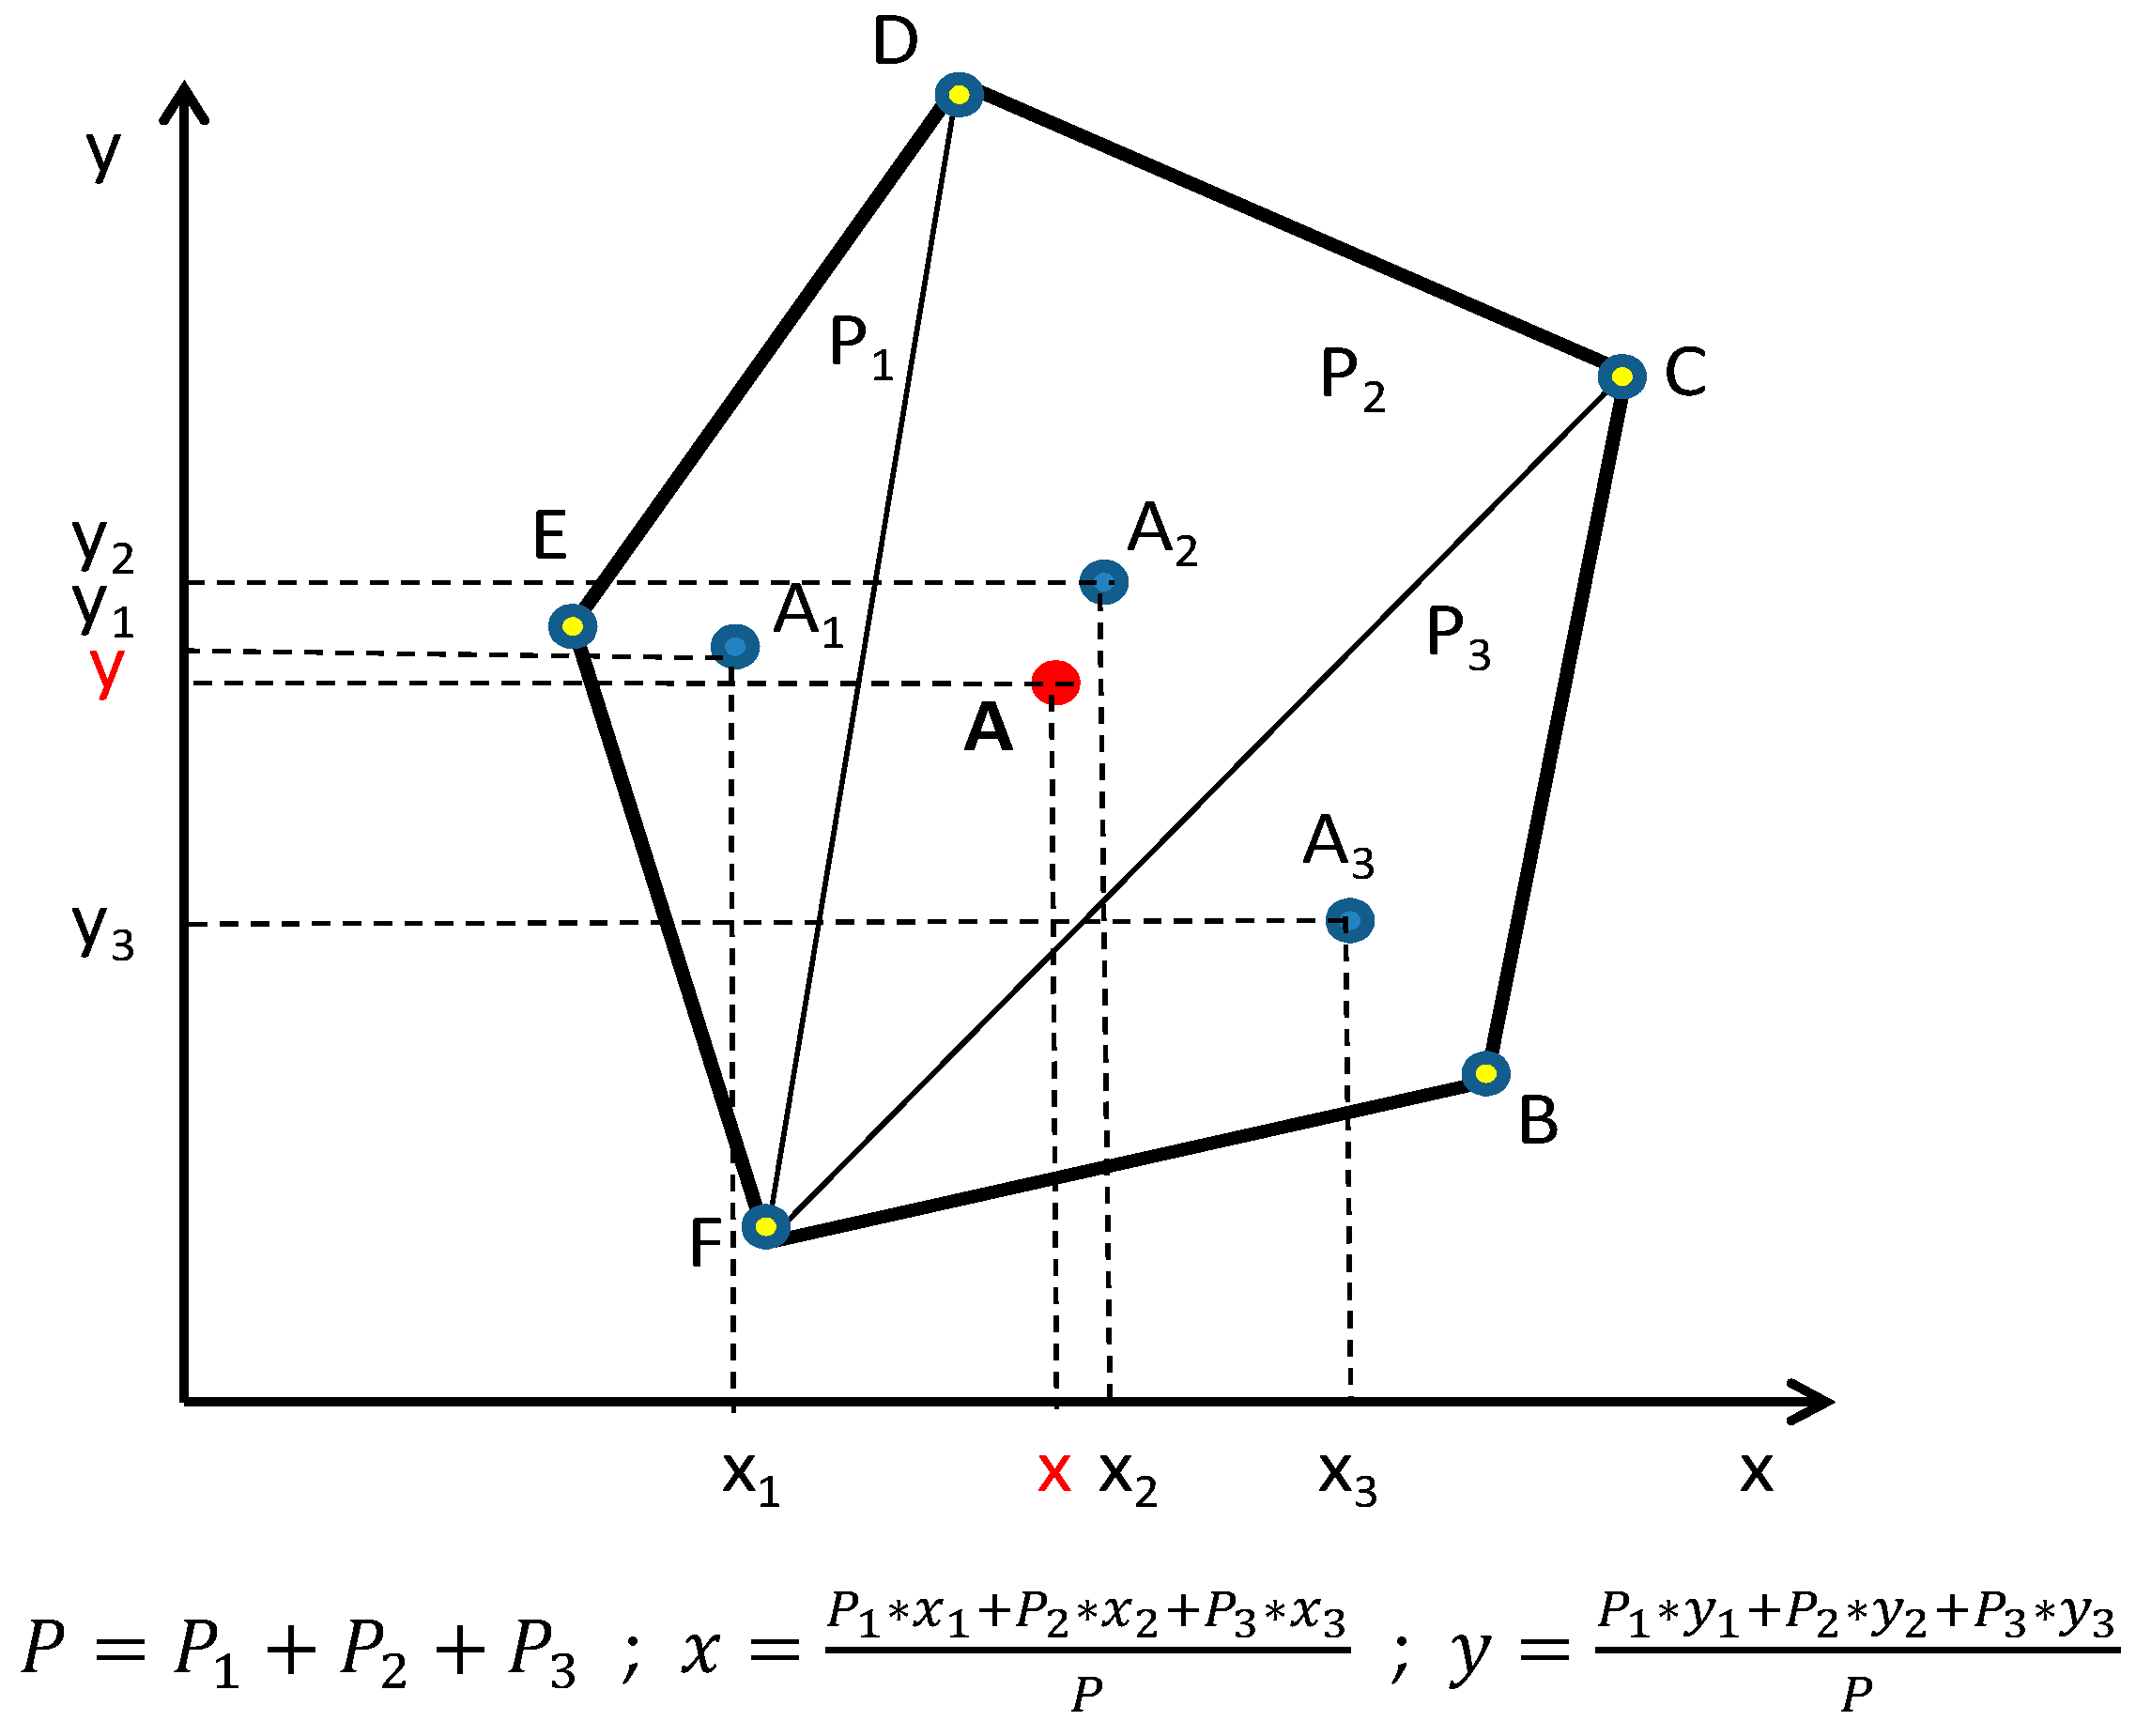
Figure 1 illustrates the basic computations required to determine the ‘fitness’ of a given cluster with five points in 2D (x-y) space. With known coordinates of points B, C, D, E, and F in a cluster, the sum of distances of these points from central point A is the fitness of this cluster. Once the coordinates of central point A in each generated cluster are determined, all distances of points in all clusters are easy to calculate, and their sums are cluster-related (local) fitness. The genetic algorithm through an iterative generation process searches for the best positioning of points (individuals) in a given number of clusters. The best solution is the one with the lowest value of the sum of local distances of the points positioned in all clusters.
Figure 1.
Elements for computing local fitness of a cluster with 5 points in two-dimensional space (required in the genetic algorithm).
There are other possible ways for clustering points in two-dimensional space, such as the use of the L2 (Euclidean) metric, L1 (Manhattan) metric, or Tchebysheff distances. The L2 metrics work well for evenly distributed points, while L1 metrics might be better suited for points clustered near axes. The Tchebycheff distance might be used within the fitness function in genetic algorithms if solutions should be evaluated in a more spatially oriented way, especially in multi-dimensional spaces. This distance calculation is also known as the ‘maximum metric’ because it measures the distance between two points as the maximum difference over any of their axis values.
The triangles used in our genetic algorithm are suitable for problems where the fitness is assessed based on geometric relationship or similarity. When proportional triangles are used as illustrated in Figure 1, the coordinates of the central points in the triangles are multiplied by the corresponding areas of triangles (P1, P2, and P3), and by dividing their sum by the total area P, the coordinates of cluster center A are obtained. When there are more points in the cluster, the number of triangles increases, but the concept of proportional triangles created for a given set of points is the same.
In the presented study, two common consistency indicators are used, CR for the eigenvector prioritization method in AHP and ED for total Euclidean distance—universal L2 metrics. The other two indicators (CO and SC) are related to the compatibility of individuals with the group. Normally, the number and type of indicators can be different and problem related.
To illustrate the concept, these four indicators are selected as sufficient to facilitate analysis of experts’ behavior and cluster them in a predetermined number of clusters based on, separately, their consistency and their compatibility. Corresponding two-dimensional diagrams, (CR-ED) and (CO-SC), enable positioning each member of the group as a point in a related scatter diagram. For the 12-member group in our study, considering two or three clusters in either diagram appeared to be a reasonable approach. However, drawing a definitive general conclusion from this methodological step is inherently contentious, as its appropriateness depends significantly on the nuances of the particular decision-making scenario.
3. Related Work on Metrics and Distances in GDM
3.1. Metrics
Srdjevic et al. [31] defined a framework based on the group AHP for identifying the most desirable technologies for constructed wetland segmentation. A method is defined for aggregating the evaluations provided by the members of the group into the new metrics by calculating different consistency and statistical compatibility measures. The three two-dimensional metrics and the one three-dimensional metric are created to determine the distances of the members from the reference points corresponding to full consistency and statistical compatibility. The mapping of members is performed into the consistency/compatibility scatter plots to enable visualizing the outlier(s); that is, the members who have different opinions about which technologies to apply in wetland segmentation than all the members on average. The scatter plots are intended to guide the decision-making process towards grouping participants into subgroups, thus heading towards consensus in both the subgroups and global groups.
An interesting discussion on various aspects of consistency and its matching in group decision-making environments is given in [32]. Authors analyze probabilities of correcting individual opinions within a group and levels of adaptation which enables combining opinions optimally and establishing their confidence according to a common metric. It is shown that matching individuals’ communicated confidence can be more effective when group members have similar levels of expertise. It is also shown that matching is more robust when group members do not have insight into mutual relative levels of expertise. One of the conclusions of this research is that confidence matching can cause miscommunication among group members about recognition of who is more likely to be correct and that herding behavior can be a reason why groups sometimes fail to make good decisions.
Generating solutions to multiple criteria group decision-making problems that are satisfactory to the decision-makers can be achieved in many different ways. Globally speaking, this can be done by consensus or by aggregation methods, in some cases by voting. Fu et al. [33] proposed a new method to examine how much the group is satisfied after alternatives are assessed and ranked based on differences between the decision-makers and the group. The problem of selecting engineering project-management software is used to demonstrate how to analyze group satisfaction and group consensus based on differences in alternatives’ grades versus group (alternatives) grades using Spearman’s rank correlation coefficient.
3.2. Distances
In GDM applications of the AHP method, of particular importance are distances of individual priority vectors from the group vector and possible violations of the rules (such as transition) and consistencies of judgments while deriving such vectors. For further reference, note that the result of individual AHP applications is the priority vector of alternatives versus goal, derived after the synthesis of local priority vectors computed for criteria versus goal and then alternatives versus criteria. The number of elements in each priority vector is equal to the number of alternatives n. In a group context, there are m priority vectors wi (i = 1, 2, …, m) for m individuals, which can be aggregated in one—the group vector wG. There are different schemes for the aggregation of individual vectors in group contexts, including those where weights are associated with vectors depending on the ‘importance’ of involved individuals. More on this can be found in [16].
Distances of individual priority vectors from the group vector can be measured in many different ways, for instance by using distance functions such as Manhattan, Euclidean, Cosine, Jaccard, Dice, RMD (root-mean-square deviation), etc. More on distances can be found in [1,34,35,36,37].
Our research shows that the application of one of the mentioned distance functions in group decision-making problems does not produce significant differences in the measurement of individuals’ agreement with the group consensus. A similar hypothesis has been proven in [35] for the five first-mentioned distance functions above. Notice that, in this paper, the first two functions are used in a different context than in the referenced studies. Manhattan distance is used as a group measure; that is, to measure the compatibility of each individually derived priority vector from the group vector. The Euclidean distance is used as an individual measure only; that is, for measuring total deviations of individual judgments at all hierarchy levels with derived local priority vectors.
It is worth mentioning that, along with AHP, generalized L2 Euclidean distance (ED is the most often used for assessing the quality of the estimates of priority vectors. The ED is the total distance between all judgment elements in the comparison matrix at a given level of the hierarchy and related ratios of the weights contained in the vector w derived from this matrix by some prioritization method. The ED is a universal error measure, and it does not depend on the prioritization method used to derive vector w. More on this measure will be given in the next section.
4. The Proposed Method
The AHP-based approach serves as the fundamental method for solving individual decision-making problems. As the context shifts towards group decision making, individuals are evaluated on the quality of their decision-making performance, and their consistency is measured using multiple performance indicators. Compatibility indicators represent how closely an individual’s decision aligns with the group’s decision. To determine the group’s consensus, individual outcomes can be aggregated through methods such as additive or geometric aggregation. The TOPSIS method can be used to evaluate and rank each member’s consistency and compatibility within the newly established multi-criteria framework. The CRITIC method can be applied as an objective instrument to determine the weights of the performance indicators necessary for the TOPSIS method. Regarding group settings, in addition to standard AHP, based on using crisp numbers as equivalents to formal linguistic judgments, the rough version of AHP can be added to the analyses to enable a comparison of the aggregation schemes used in the standard and rough AHP versions. Choosing to include this addition, the rough version of AHP, is not mandatory; indeed, the standard AHP can be substituted with its rough version. Additionally, considering alternative variants of AHP, such as hesitant AHP, fuzzy AHP, or employing stochastic approaches and Bayesian analysis, is methodologically feasible. The original and rough versions of AHP used in our study are not only applicable but also sufficiently simple and beneficial for gaining deeper insights into the decision-making process. To summarize, for group decision-making settings where diverse judgments commonly occur, the methodology proposed below complements the evaluation of experts’ performance quality based on only crisp values, with the rough theory that, instead of aggregating priorities of decision elements derived by standard AHP, uses sequences of original judgments in a special way to derive group priorities according to rough theory.An approach to the following problem is proposed. At an early stage of the decision-making process, it is important to assess and evaluate the quality of involved experts in making decisions by a formal evaluation of their consistencies and agreement with the rest of the group. A methodology is proposed based on a combination of crisp and rough AHP, TOPSIS, and CRITIC methods. All the methods mentioned are thoroughly established and scientifically validated. In the context of group decision-making scenarios, their implementation is straightforward. In the final stage of the proposed methodology, clustering individuals based on demonstrated consistencies and similarities with the group is suggested to be achieved through the utilization of a genetic algorithm, known for its efficiency as a stochastic search engine. Alternatively, other heuristics could be considered, such as simulated annealing or evolutionary strategy, for instance.
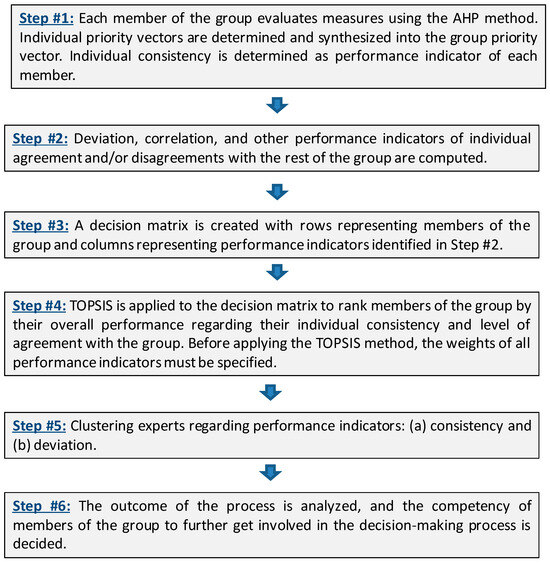
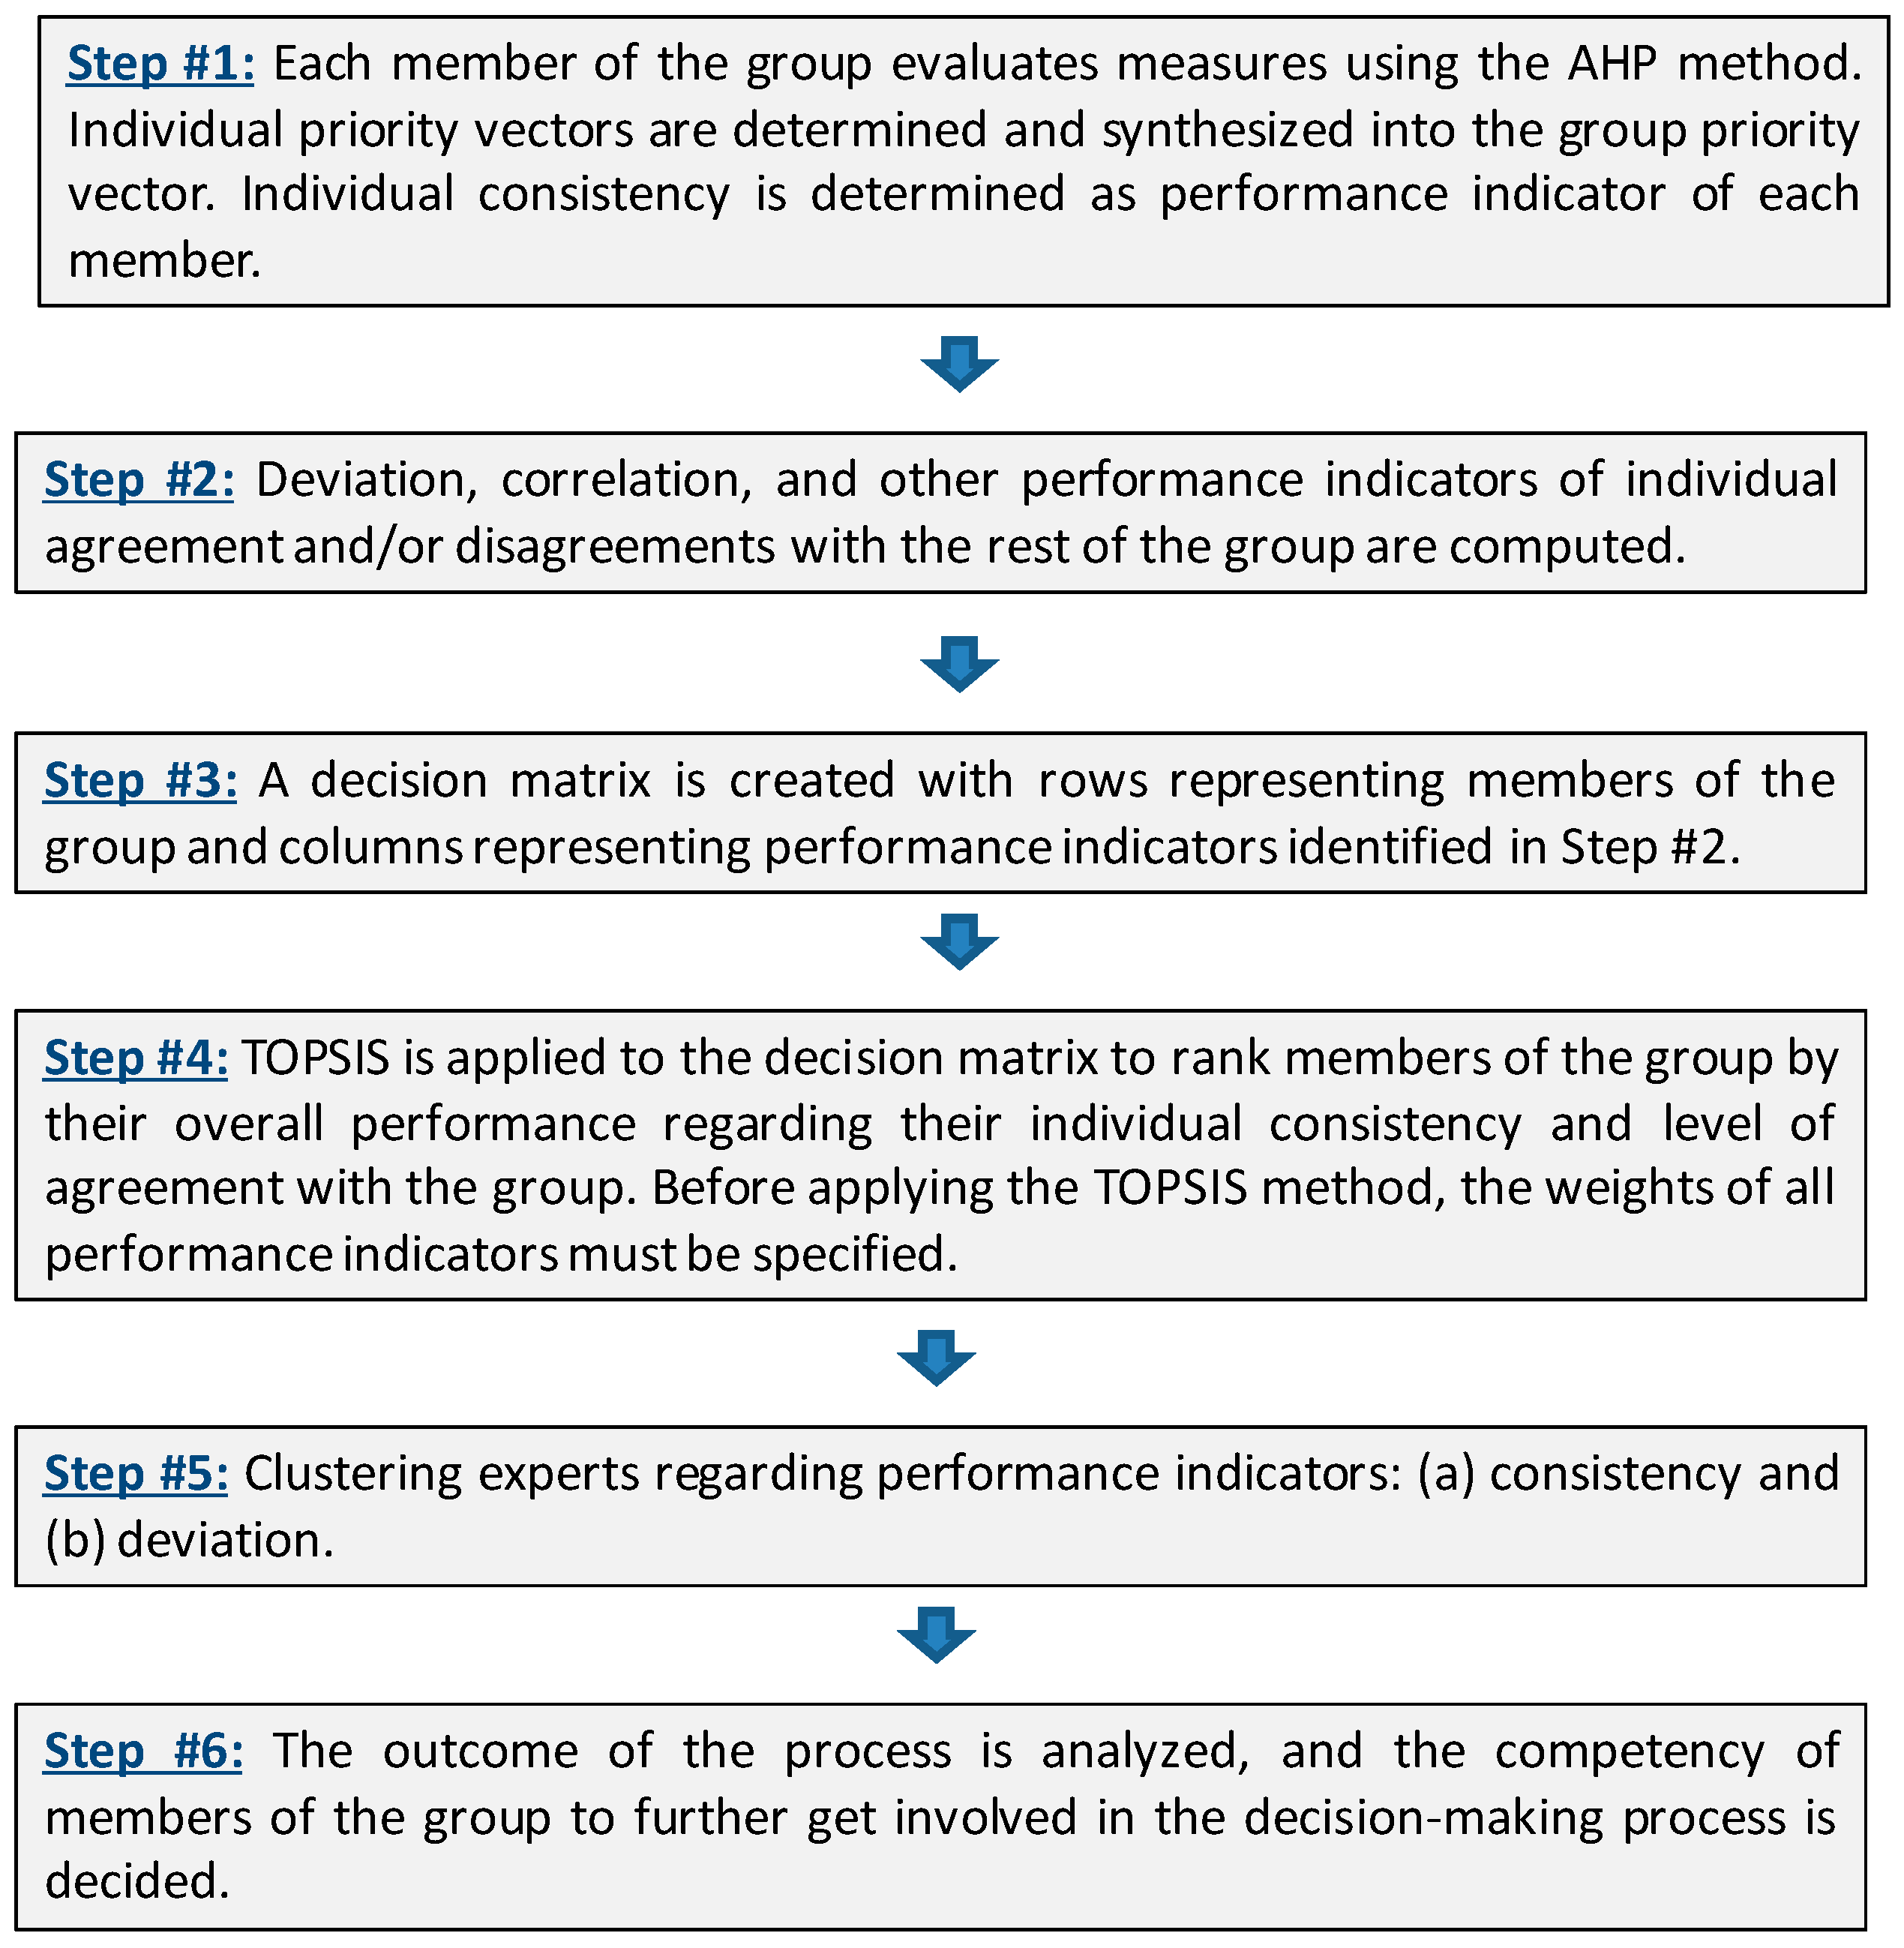
The proposed method is organized in six steps, as shown in Figure 2, and represents an extended procedure published in [38]).
Figure 2.
Research method based on multi-model (AHP-TOPSIS-CRITIC) application.
Step #1: In this initial step, each member of the group solves the given decision-making problem using the AHP method, creating a hierarchy with the goal on the top and at the level below decision elements to be evaluated concerning a goal, such as sub-goals, criteria, or alternatives. The AHP-based prioritization is used to obtain individual priority vectors of decision elements concerning the goal. During this process, the consistency of the members is measured, and individual indicators of their consistency are recorded.
If a one-level hierarchy is created with a goal at the top and selected decision elements (sub-goals, criteria, or alternatives) at a level below, the term “AHP-based” refers to an incomplete AHP, as there is no synthesis involved. In this case, only prioritization of the decision elements versus the goal takes place, and for each member of the group, consistency can be measured based on the derived weights and original judgments in his/her comparison matrix. The consistency ratio (CR) and total Euclidean distance (ED) are commonly used for this purpose. CR is established exclusively for the AHP and eigenvalue prioritization method, while the ED is the universal error measure calculated as the total distance between all judgments aij in the comparison matrix A and the related ratios of weights (wi/wj) contained in the vector of weights derived during prioritization. The ED consistency measure can be used with any prioritization method to assess consistency, as reported by many researchers, e.g., [39,40,41,42].
Step #2: In this step, individual priority vectors are synthesized into the group priority vector by the AIP method (an acronym for aggregation of individual priorities) [16]. Then, deviation, correlation, and other indicators of individual agreement and/or disagreements with the rest of the group are computed. These indicators are recorded as group-related information on the performance quality of individuals. In addition, a rough version of AHP manages sequences of judgments in each position in the joint comparison matrix, and determines the priority vector for the group that can be directly compared with the AIP vector obtained by Equation (14)
where M represents the number of members in the group, represents the priority of the i-th alternative for the j-th member, αj represents the weight of the j-th member, and wiG represents the aggregated group weight. The weights αj should be additively normalized before being used in Equation (14), and the final additive normalization of priorities wiG is required.
The group vector wG () can be used as the reference vector for the members of the group to compute deviations of their vectors from the group vector. The term ‘conformity’ or ‘compatibility’ (CO) is commonly used to express individual deviations and is synonymous with the Manhattan distance. It is illustrated by Equation (15)
where the superscript G represents the reference priority vector obtained by aggregation. CO indicates the overall similarity between the individual priority vector and the reference group vector. This performance indicator only applies after all computations in AHP are concluded, which is different from using consistency indicators CR and ED.
Different statistical measures can also be used to measure individual agreements or disagreements with the rest of the group. One of the more used measures is Spearman’s rank correlation coefficient (SC) calculated by using Equation (16).
This measure enables comparing the ranks of the corresponding elements of the individual priority vectors and the reference vector for the group (Di stands for individual vector). SC values range from −1 to 1, where a value of −1 indicates an ideal negative correlation, +1 shows an ideal positive correlation, and a value of 0 indicates no correlation.
In practice, SC is a reliable statistical measure, even for small groups. It is a relative measure and not absolute, indicating that two vectors can vary widely in rank preference while remaining relatively close in absolute preference. With larger groups, potential misguidance is typically minimized. In the proposed multi-model framework, SC is elaborated as an ordinal information measure that can be combined with cardinal information (CO). The combination of CO and SC facilitates efficient clustering, allowing the exploration of both cardinal and ordinal information simultaneously.
After the completion of prioritization in AHP for all members in a group, it is possible to calculate SC as analogous to the compatibility indicator CO.
Step #3: In this step, a decision matrix is created with rows representing members of the group and columns representing the performance indicators identified in steps #1 and #2. The matrix entries in each row correspond to given member scores regarding the performance indicators of consistency and deviation. The decision matrix is flexible in size, accommodating any number of columns for performance indicators (criteria) and rows for members (alternatives). Employing cross-referencing and visualization techniques aids in the matrix’s preparation, fostering insights and comprehension of its elements’ impacts.
The entries of the matrix are performance indicators of members as represented by Expression (17). To complete the decision matrix, weights w1, w2, w3, and w4 must be assigned to the ‘criteria’ (CR, ED, CO, and SC), with the sum of the weights totaling one.
Step #4: In this step, the TOPSIS method is utilized to assess the decision matrix, ranking group members based on their overall performance concerning consistency and alignment with the group. Before employing the TOPSIS method, it is imperative to define the weights related to the matrix (17) for all performance indicators. The CRITIC method is recommended for this task, which is particularly beneficial for larger groups.
It is worth noting that before applying multi-criteria methods, the analyst may subjectively assign weights to performance indicators or opt for an objective method. One alternative to the statistical method CRITIC is the application of the entropy principle to determine objective weights for indicators. As per Shannon and Weaver [43], entropy serves as a gauge of information uncertainty, indicating the “strength” of decision elements (such as criteria) in communicating a message to the decision maker. The crux lies in addressing uncertainty within the information framework of the decision matrix, known as Shannon entropy. The concept of entropy has been used in various areas of multi-criteria optimization with good results, e.g., [15,23,29,44]. In an example provided in the subsequent section, the entropy method could not be applied due to a negative Spearman correlation coefficient identified for one member within a group, rendering logarithmic operations impossible within the entropy method. Given the potential recurrence of such cases in other scenarios, the CRITIC method is employed to ascertain the objective weights of performance indicators.
Step #5: During this stage, a sensitivity analysis can be conducted by assigning varying weights to performance indicators to cluster or regroup individuals based on their consistency and deviation from the group solution. The iterative application of TOPSIS, depending on the weighting scheme for performance indicators, facilitates the assessment of group members’ performance quality, with a focus on demonstrated consistency in judging the initial decision-making problem or compatibility and statistical agreement with the rest of the group. In the provided example, different preference schemes are used to weight groups of performance parameters (consistency, CR and ED; deviation, CO and SC) and to explore opportunities for sub-grouping members. Sensitivity analysis aids in enhancing the quality of the decision-making process by identifying and mitigating potential pitfalls, such as avoiding subpar performances from influencing further decision-making. It serves to validate the performance quality of each group member, thereby improving the overall decision-making process.
Step #6: In this last step, the outcome of the process is analyzed, and the competency of members of the group to further get involved in the decision-making process is decided. If necessary, some previous steps may be repeated by sub-grouping members, eliminating odd members, etc.
This step requires additional consideration of the results of steps #4 and #5 because they may directly determine further steps in group assessments of decision elements. The group can be restructured, with new members involved and/or odd members excluded. If decided upon, new decision elements can be added and/or old elements excluded, for instance, if the initial evaluation process indicated sharp differences between superior and inferior decision elements. However, any change in the structuring decision process must respect restrictions related to the duration of the entire process. Important issues to consider include the number and eligibility of members in the (restructured) group and the number of decision elements to be assessed. The described procedure outlined in steps #1-#6 can be easily generalized by incorporating or replacing performance indicators before the final assessment of the quality of the group members. Different combinations of multi-criteria methods can be employed to obtain individual and group solutions and perform the final evaluation based on demonstrated consistencies and deviations. The results can be visualized using scatter diagrams, such as CR-ED and CO-SC, and a genetic algorithm can be applied to identify decision-maker clusters and the consequences of sub-grouping individuals rather than treating all members as part of a single group.
According to Srdjevic et al. [38], when using AHP for individual assessments, it is important to note that the consistency parameter CR should only be utilized if the prioritization of decision elements is carried out using the additive normalization (AN) or eigenvector (EV) method, as noted by Saaty [1], Srđević [42] and Kou and Lin [39].If the LLS prioritization method is being used, parameter CR should be replaced by GCI, as suggested in [45,46,47,48]. Similarly, the FPP method proposed in [37] requires the use of the parameter μ, while the CMM method recommended in [27] uses the CCI cosine consistency index.
5. An Example
5.1. The Problem
To ensure the proper protection, restoration, and management of a given wetland in Serbia, seven measures (M1–M7) that can reduce and mitigate drought risks in a given area are assessed and evaluated by 12 invited experts (E1–E12) from different socio-economic, environmental, agricultural and forestry sectors.
5.2. Standard AHP Application (Step #1)
Following the procedure described in the previous section, as a part of step #1, the experts individually evaluated by importance measures and created pairwise comparison matrices by seeding only upper triangles with values from Saaty’s scale {1/9, 1/8, …, 1/2, 1, 2, …, 9} [1].
The application of AHP enabled computing the weights of measures for each expert by the eigenvector method. Individual vectors of the weights are shown in Table 2. Then, individual vectors are geometrically averaged, assuming equal importance for all the experts; the AIP aggregation produced the group vector of weights in the row (Group-AIP) in Table 2.
Table 2.
Weights and ranks of measures obtained by standard and rough AHP from 12 experts.
5.3. Rough AHP Application (Step #2)
As a part of step #2, a rough version of AHP is applied to obtain the group vector shown in the last row of Table 2 (Group-ROUGH). The comparison of group vectors derived in crisp and rough context shows that measures are, in both cases, equally ranked. However, the computed weights of the top-ranked measure (M1) are significantly different for two AHP contexts (0.316 for crisp vs. 0.250 for rough AHP).
The application of rough numbers shows also that the weights of the top-ranked measures are reduced compared to the corresponding weights when crisp numbers are used. An opposite effect occurs at the lower-ranked measures. Such distribution of rough weights is especially notable for a larger number of elements in the sequences, as shown by Srdjevic [49]. In this example, 12 judgments of experts in each entry of joint matrix (1) are sufficiently large samples/sequences, which leads to a conclusion that rough numbers theory is useful to additionally evaluate ‘crisp’ results as an outcome of commonly used procedures and evaluation scenarios. Because the ‘rough’ results sometimes correspond to ‘fuzzy’ results, and handle cardinal information rather than only ordinal, this may be very important when decisions should be made about investments into activities related to the measures under consideration.
5.4. Performance indicators, CRITIC and TOPSIS (Steps #3 and #4)
Table 3 presents the performance indicators of consistency (CR, ED) obtained with the AHP and statistical agreement with the group decision (CO, SC) for the experts. Expert 11 is the most consistent, with a CR of 0.02, while expert 9 is the least consistent, with a CR of 0.39. Five experts (3, 4, 5, 11, and 12) fall below the tolerant limit of CR = 0.10, and another five are within the range of CR = 0.10–0.20. The remaining two experts (8 and 9) are above CR = 0.20. Expert 9 can be considered an outlier regarding this performance indicator. When considering the ED indicator, expert 11 performs the best, with an ED of 4.24, followed by experts 4 and 10. The worst performances regarding this indicator are obtained for experts 8 and 9, similar to the case of the CR indicator.
Table 3.
Consistency (CR, ED) and agreement with the group (CO, SC) performance indicators.
Based on the values of all the used performance indicators shown in Table 3, the CRITIC method produced the following weights of indicators: w1 = 0.261; w2 = 0.231; w3 = 0.289; and w4 = 0.219, corresponding to CR, ED, CO, and SC, respectively. The highest importance is given to the compatibility indicator (0.289) and the lowest to ED (0.231). It is interesting to note that there is an approximate equilibrium between the consistency and deviation parameters; that is, w1 + w2 (for CR + ED) = 0.492 vs. w3 + w4 (for CO + SC) = 0.508.
With the computed weights of performance indicators, the TOPSIS method finally ranked the experts, as shown in Table 4.
Table 4.
Ranking experts by the TOPSIS multi-criteria method (weights of performance indicators by the CRITIC method).
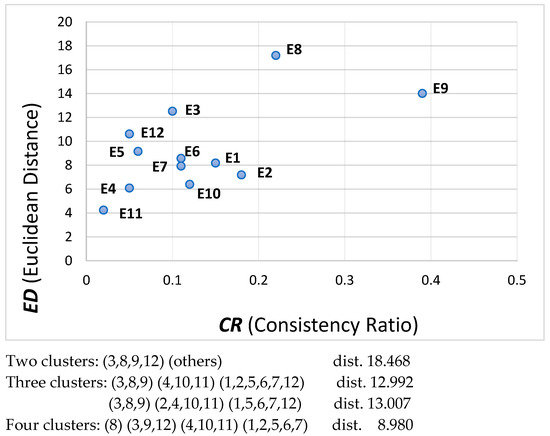
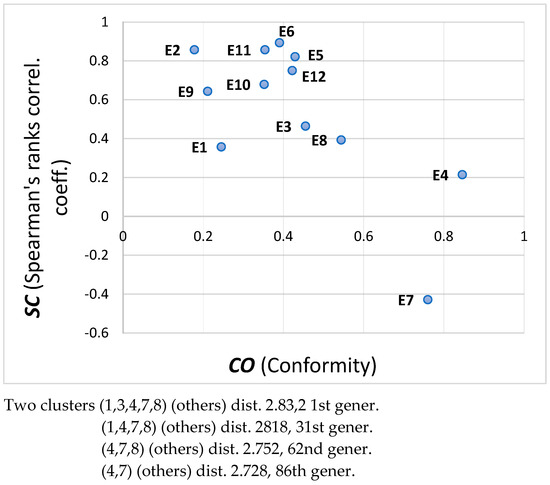
According to the findings, expert 11 was ranked as the top expert, followed by experts 5, 12, 10, and 6 in the first five positions. Experts 7, 8, and 9 were ranked at the bottom of the list. These results are consistent with the clustering results observed in Figure 3 and Figure 4 in the next section.
Figure 3.
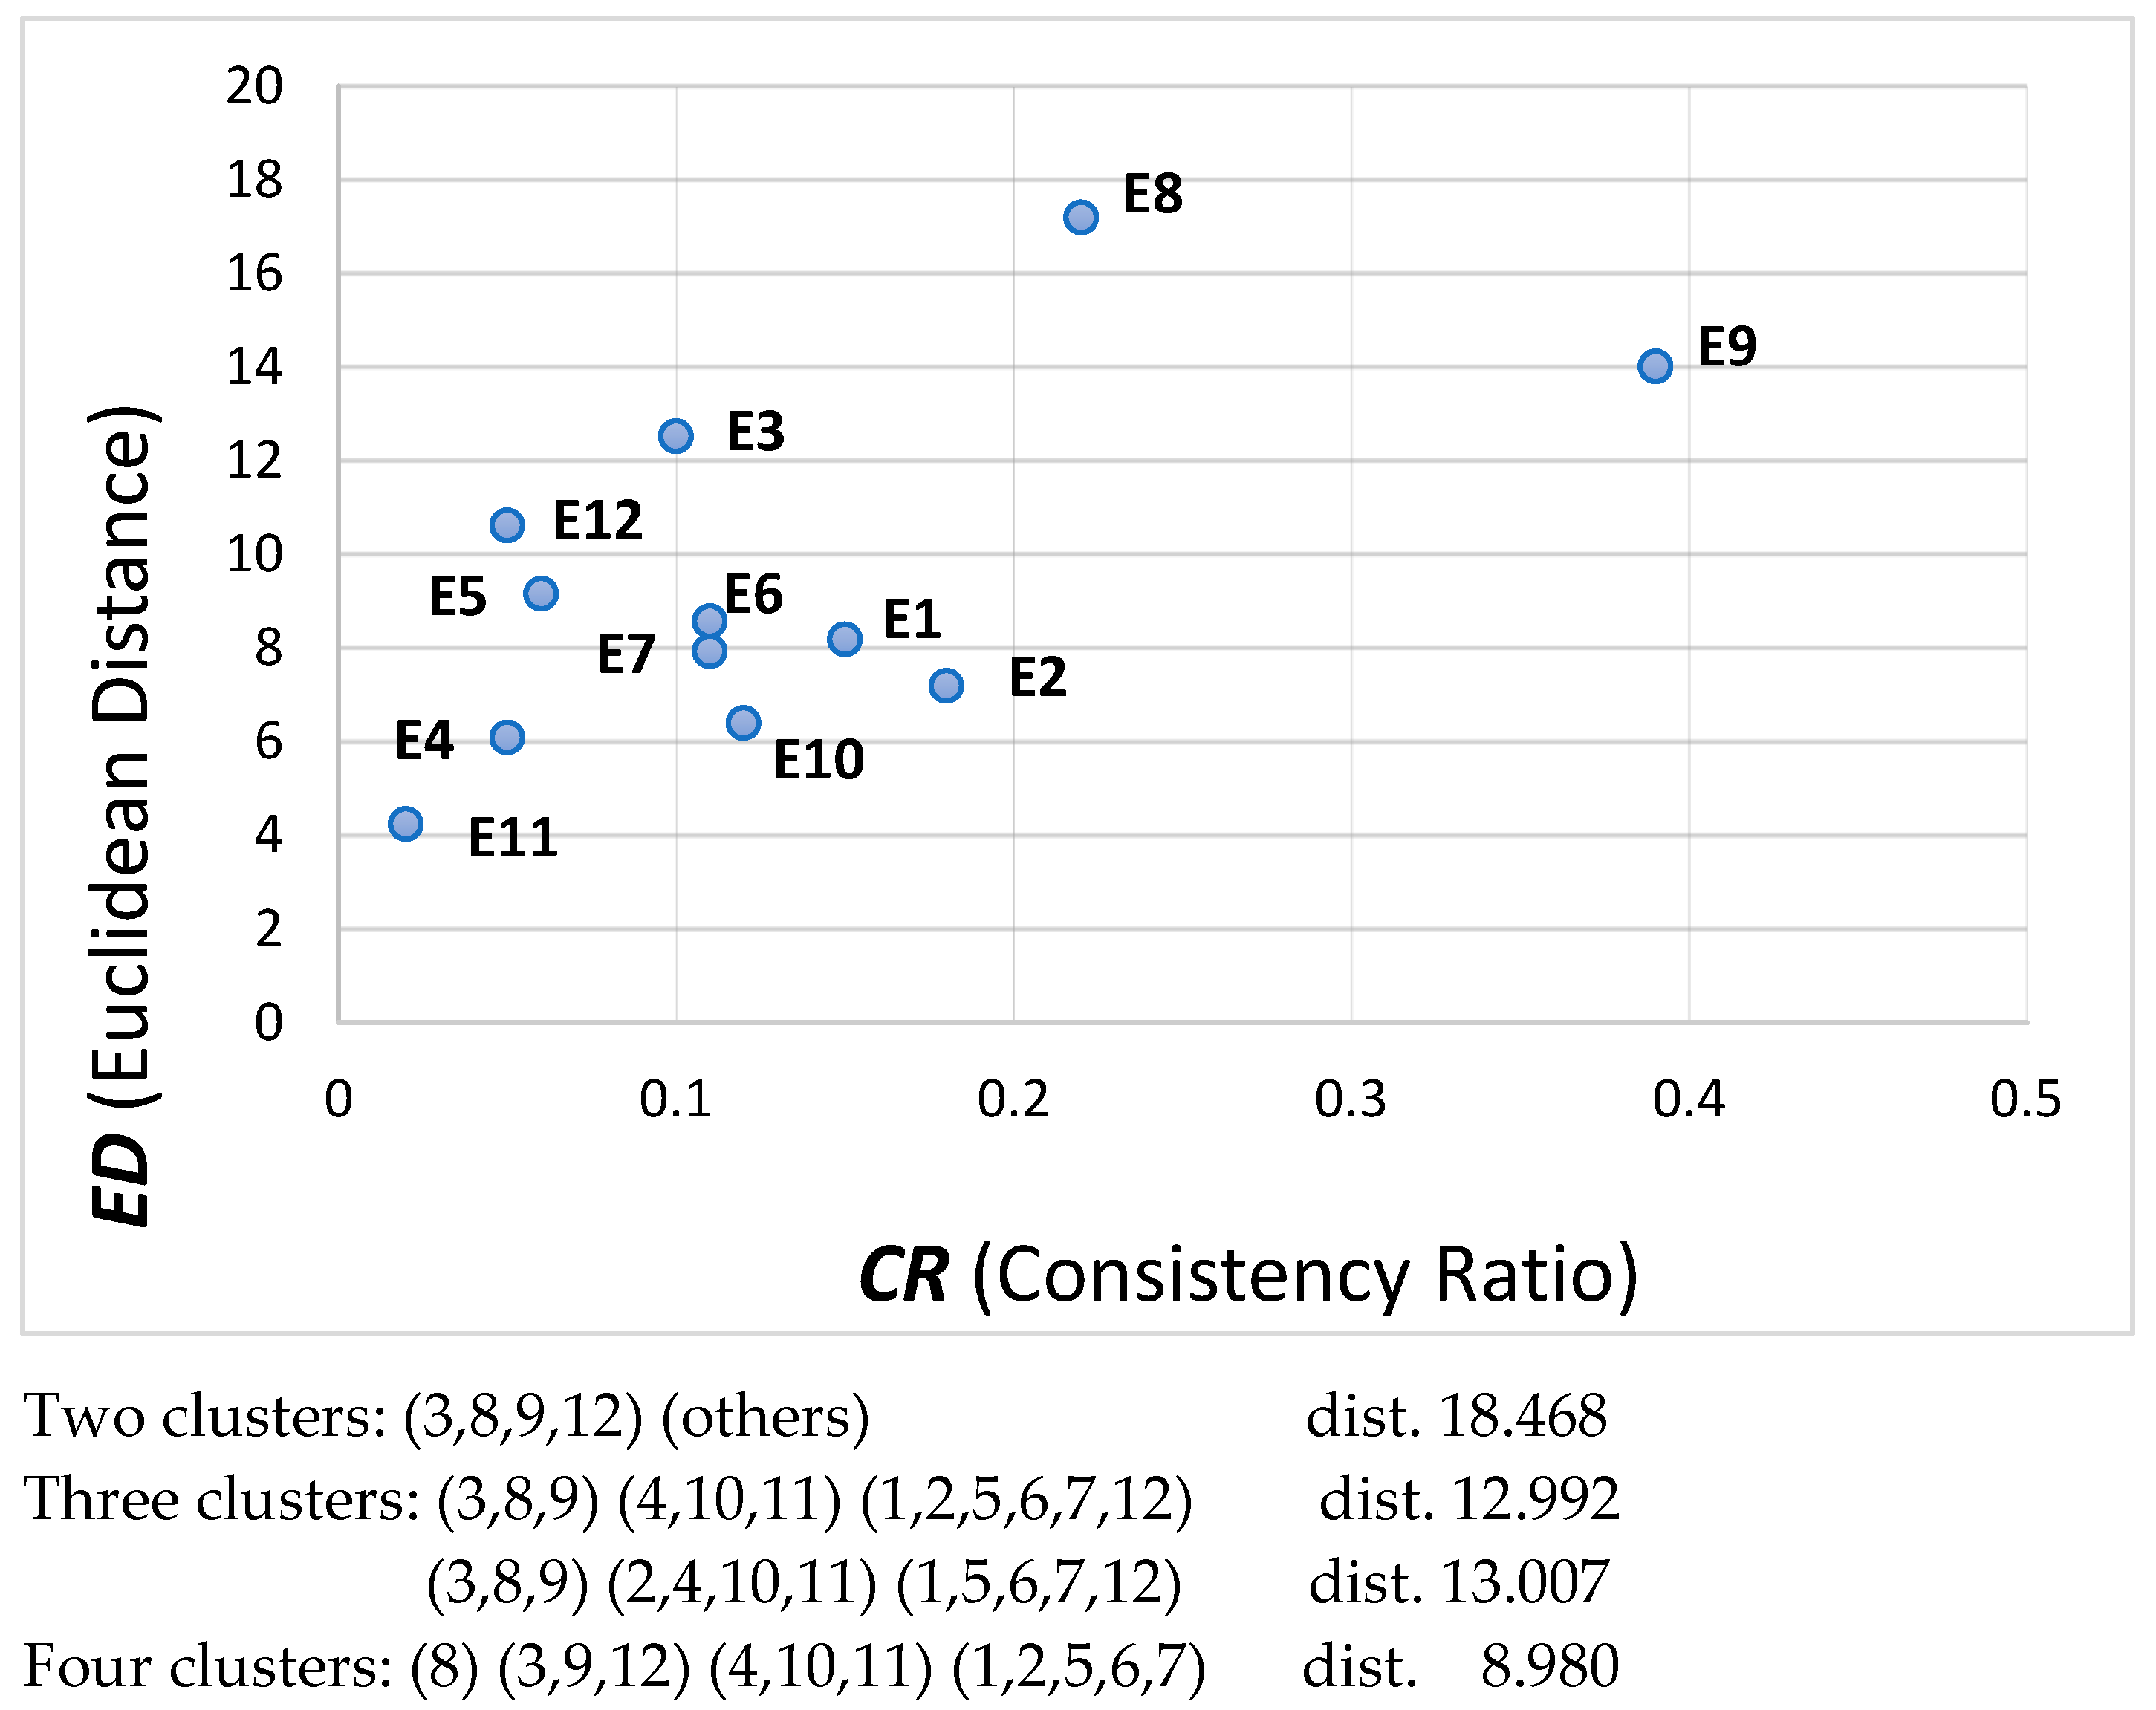
Clusters of experts considering demonstrated consistency.
Figure 4.
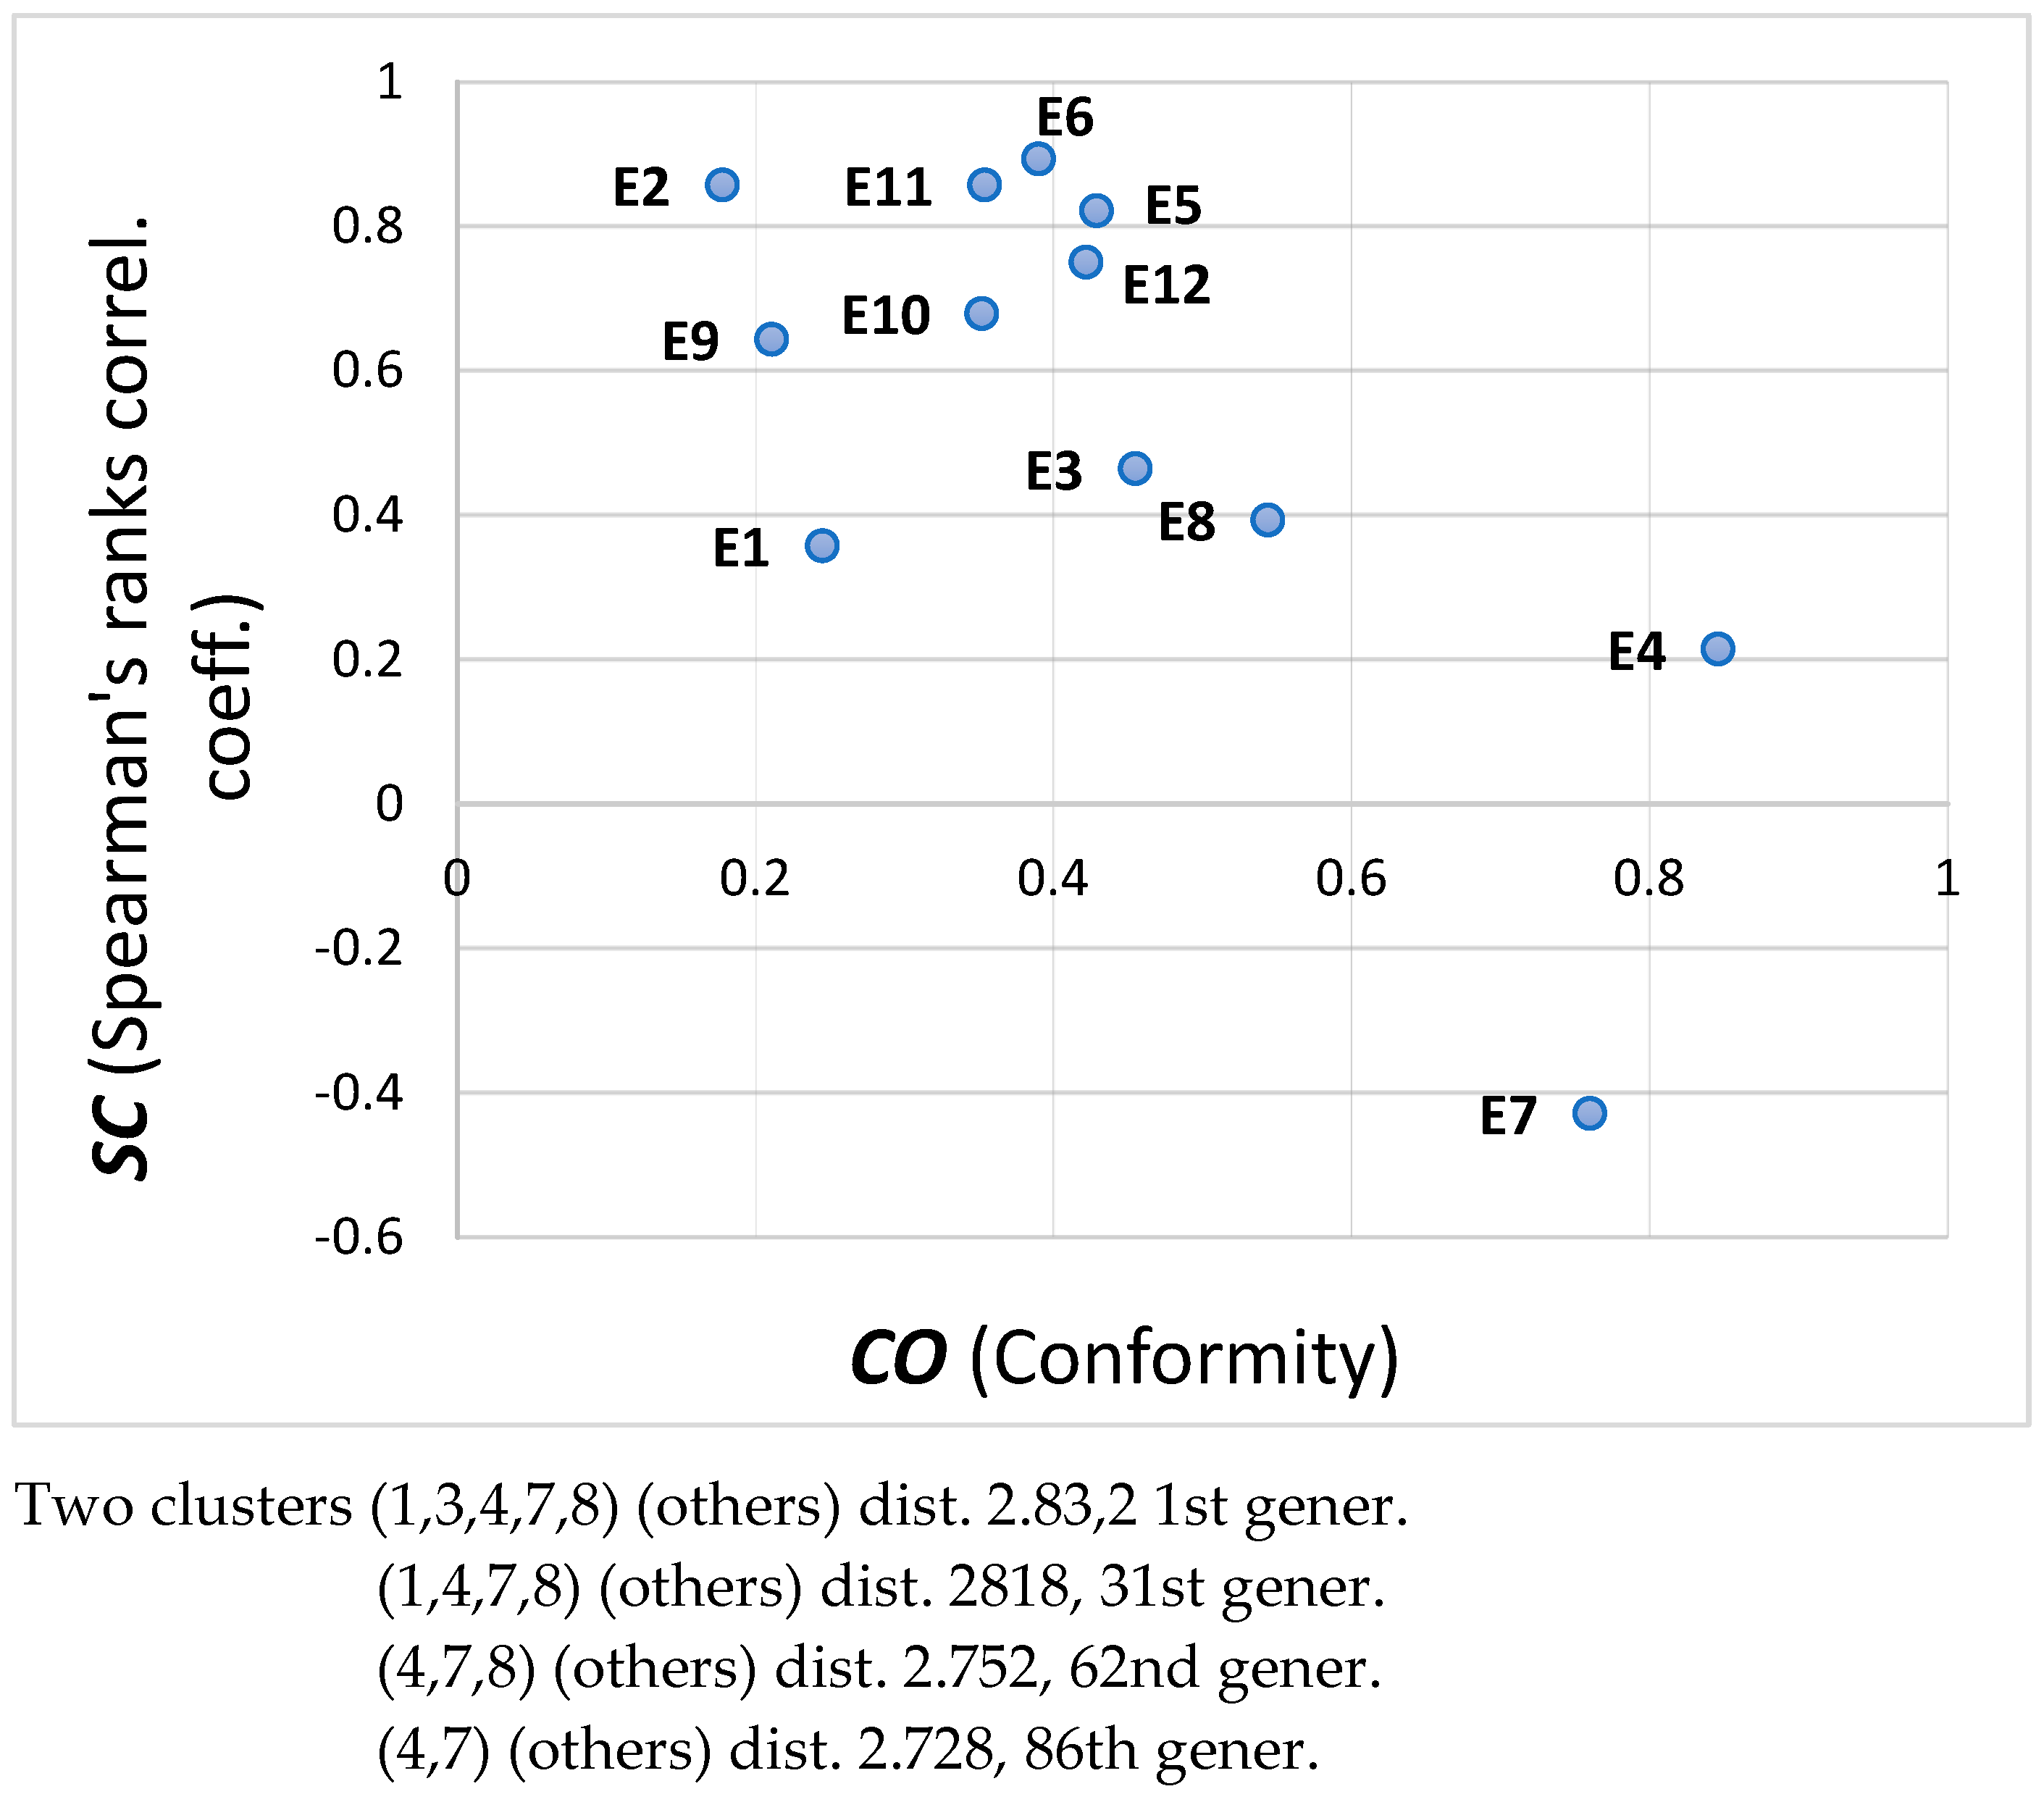
Clusters of experts by the demonstrated similarity of an individual with a group solution.
5.5. Sensitivity Analysis (Steps #5 and #6)
Step #5 and step #6 are undertaken by an assessment of the experts’ performance indicators in Table 3 using the preferential Borda count method from the social choice theory corpus of election models, and two generated scatter diagrams for visualizing subgroups of experts according to their performance indicators.
- Borda count assessment of the experts;
As a part of the sensitivity analysis process, the use of the Borda count enabled us to determine the overall ranking of the experts while taking all indicators into account but without applying weights to indicators, Table 5. The results show that expert 11 has the best performance across all indicators, displaying the highest consistency for indicators CR and ED, and tying with expert 2 for similarity to group weights indicator SC. Expert 11 also ranks fifth in the compatibility indicator CO. Overall, expert 11 is ranked first. Expert 2 is ranked second overall, followed by expert 6 in third place. In contrast, expert 8 is ranked last on the Borda list and is positioned no higher than ninth place.
Table 5.
The overall Borda count ranking of group members based on the individual rankings for each criterion. (Grey highlight is for the first ranked expert).
The ranking results presented in Table 4 and Table 5 can be compared and may help in making a certain decision about the competency of experts in this example application of a multi-model procedure. Along with the clustering presented in the next two sub-sections, conclusions about the experts’ competencies in future decision-making processes can be even enhanced.
- Clustering experts based on consistency indicators;
A scatter diagram CR-ED, which is presented in Figure 3, was created to analyze the demonstrated consistency performance of experts. The genetic algorithm clustered experts into two, three, and four subgroups based on a central-point-minimum-distance approach. This approach groups points in a manner that minimizes the distance between the points within a given cluster, while also minimizing the sum of all distances across all clusters. Notably, when clustering into three subgroups, two solutions were found to be very similar, with the placement of expert 2 determining the outcome. The optimal solution was found when expert 2 was not in the same cluster as experts 4, 10, and 11, while slightly less optimal solutions were found when expert 2 was in the same cluster as them (as depicted in Figure 3 with total distances of 12.992 and 13.007, respectively).
Several groupings of experts are obtained by application of the genetic algorithm if the number of clusters is pre-specified. In the lower part of Figure 3 for two, three, and four clusters there are associated ‘distances of experts’ from the central point in a specific cluster. Depending on a more detailed analysis of consistencies demonstrated by involved decision-makers, the decision could be made to re-group individuals into several sub-groups and perform further actions in selecting decision-makers for the final stage of the decision-making process. How much this process can be sensitive can be shown if, for example, one compares cases when there are three clusters, namely, there are two similar solutions if expert 2 is moved from one to another cluster. Simply observe small distances of 12.992 and 13.007 and move of expert 2 into different clusters.
- Clustering experts based on deviation indicators;
With the information contained in Table 3 for indicators CO and SC, a scatter diagram is created and shown in Figure 4. In its lower part for a pre-specified number of clusters (two in this case), in different generations, the genetic algorithm created several interesting groupings of experts as sub-optimal solutions. The associated sums of distances of grouped experts from their central points are presented for several interesting clusters. The best solution found is the last listed clusters (4,7) and (others) found in the 86th generation of the genetic algorithm run. This solution is easy to visualize from Figure 4.
6. Conclusions
In this paper, the combined use of two group methods is proposed for the preliminary assessment of the quality of experts before being involved in the final stage of the decision-making process. The developed methodology is applied to the analysis of the importance of measures to reduce drought risks in a given wetland in Serbia, as these measures are identified by stakeholders coming from different sectors. The methodology enables the treatment of specific indicators of the quality of decision-making performance associated with each expert and presents (visually) their clustering into possible sub-groups for further improvements of the decision-making process.
The approach combines well-established multi-criteria methods, including the (1) analytic hierarchy process (AHP) and (2) the technique for order preference by similarity to the ideal solution (TOPSIS). For determining objective weights of proposed consistency and group-agreement indicators, when evaluating and ranking the decision-makers by TOPSIS, the CRITIC method is recommended as a trustworthy statistical method. In addition, a rough version of the AHP method is recommended to perform sensitivity analysis and compare the aggregation of individual priorities of analyzed decision elements in standard AHP (known as AIP aggregation), with aggregation of individual judgments through so-called sequences at each entry of the joint pairwise comparison matrix. This aspect of the presented approach represents a novelty in terms of robustness when it comes to modeling and utilizing the outcomes of the group decision-making process.
The proposed methodology evaluates decision elements strictly by importance. Regarding the role of experts involved in decision-making processes, the classical agreement-based (consensus) model applicable to small groups is not applied; rather, the experts are managed as ‘independent units’ acting on distance and request by interviewers (here authors of the paper). In the presented example application, the final (group) decision is made after individually submitted comparison matrices are collected, the AHP prioritization of decision elements (measures for drought risk reduction and mitigation) is performed, and the individual vectors are aggregated. The AHP (standard and rough)-TOPSIS-CRITIC-based model is recommended for similar assessment frameworks, especially when there is a need for a detailed pre-assessment of quality (competence) of the potential decision makers, commonly considered as experts who may not always demonstrate obvious expertise.
Overall, the study highlights the importance of using a multi-criteria approach to assess and visualize the importance of consistency and agreement (with the group) of the involved decision-makers and aims to achieve the final justified solutions in planning and management in different sectors of human activities. The methodology could be efficient in settings where diverse judgments commonly occur and rough theory with logic that ‘data govern decision process’ has a place. Decision-makers can benefit from a data-driven and inclusive approach that takes into account their diverse perspectives, leading to more robust and informed decisions. This way, the decision-making process is transparent, evidence-based, and capable of handling complex situations where diverse judgments are likely to arise.
Author Contributions
Conceptualization, B.S. and Z.S.; Methodology, B.S. and Z.S.; Software, B.S.; Validation, Z.S.; Formal analysis, Z.S.; Writing—original draft, B.S. and Z.S.; Writing—review & editing, B.S. and Z.S. All authors have read and agreed to the published version of the manuscript.
Funding
Ministry of Science, Technological Development and Innovation of Serbia, Grant No. 451-03-47/2024-01/200117.
Data Availability Statement
The data presented in this study are available on request from the corresponding author.
Conflicts of Interest
The authors declare no conflicts of interest.
References
- Saaty, T.L. Analytic Hierarchy Process; McGraw-Hill: New York, NY, USA, 1980. [Google Scholar]
- Hwang, C.L.; Yoon, K. Methods for multiple attribute decision making. Mult. Attrib. Decis. Mak. 1981, 186, 58–191. [Google Scholar]
- Diakoulaki, D.; Mavrotas, G.; Papayannakis, L. Determining objective weights in multiple criteria problems: The CRITIC method. Comput. Oper. Res. 1995, 22, 763–770. [Google Scholar] [CrossRef] [Scilit]
- Pawlak, Z. Rough sets. Comput. Inf. Sci. 1982, 11, 341–356. [Google Scholar] [CrossRef] [Scilit]
- Pawlak, Z. Rough Sets: Theoretical Aspects of Reasoning about Data; Kluwer Academic Publishers: Dordrecht, The Netherlands; Boston, MA, USA, 1991. [Google Scholar]
- Escobar, M.T.; Moreno-Jimenez, J.M. Aggregation of Individual preference structures in AHP-group decision making. Group Dec. Neg. 2007, 16, 287–301. [Google Scholar] [CrossRef] [Scilit]
- Moreno-Jimenez, J.M. Los metodos estadısticos y el nuevo metodo cientıfico. In Informacion Economica y Tecnicas de Analisis en el Siglo; Casasand, J.M., Pulido, A., Eds.; INE: Madrid, Spain, 2003; Volume XXI, pp. 331–348. [Google Scholar]
- Du, Y.W.; Shan, Y.K. Dynamic intelligent recommendation method based on the analytical ER rule for evaluating product ideas in large-scale group decision-making. Group Dec. Neg. 2020, 30, 1373–1393. [Google Scholar] [CrossRef] [Scilit]
- Siemon, D. Elaborating team roles for artificial intelligence-based teammates in human-AI collaboration. Group Dec. Neg. 2022, 31, 871–912. [Google Scholar] [CrossRef] [Scilit]
- Dayeh, V.; Morrison, B.W. The effect of perceived competence and competitive environment on team decision-making in the hidden-profile paradigm. Group Dec. Neg. 2020, 29, 1181–1205. [Google Scholar] [CrossRef] [Scilit]
- Zorluoğlu, O.S.; Kabak, O. Weighted cumulative belief degree approach for project portfolio selection. Group Dec. Neg. 2020, 29, 679–722. [Google Scholar] [CrossRef] [Scilit]
- Dong, Y.; Zhang, G.; Hong, W.C.; Xu, Y. Consensus models for AHP group decision making under row geometric mean prioritization method. Decis. Support Syst. 2010, 49, 281–289. [Google Scholar] [CrossRef] [Scilit]
- Regan, H.M.; Colyvan, M.; Markovchick-Nicholls, L. A formal model for consensus and negotiation in environmental management. Environ. Man. 2006, 80, 167–176. [Google Scholar] [CrossRef] [Scilit]
- Xu, J.; Wu, Z.; Zhang, Y. A consensus-based method for multi-criteria group decision making under uncertain linguistic setting. Group Dec. Neg. 2012, 23, 127–148. [Google Scholar] [CrossRef] [Scilit]
- Srđević, B.; Srđević, Z. Prioritisation in the analytic hierarchy process for real and generated comparison matrices. Exp. Syst. Appl. 2023, 225, 120015. [Google Scholar] [CrossRef] [Scilit]
- Forman, E.; Peniwati, K. Aggregating individual judgments and priorities with the analytic hierarchy process. Eur. J. Oper. Res. 1998, 108, 165–169. [Google Scholar] [CrossRef] [Scilit]
- Düntsch, I.; Gediga, G. The rough set engine GROBIAN. In Proceedings of the 15th IMACS World Congress, Berlin, Germany, 26–30 August 1997; Volume 4, pp. 613–618. [Google Scholar]
- Fazlollahtabar, H.; Vasiljević, M.; Stević, Ž.; Vesković, S. Evaluation of supplier criteria in the automotive industry using rough AHP. In Proceedings of the 1st International Conference on Management, Engineering and Environment ICMNEE, Belgrade, Serbia, 28–29 September 2017; pp. 186–197. [Google Scholar]
- Zhai, L.Y.; Khoo, L.P.; Zhong, Z.W. A rough set-based QFD approach to the management of imprecise design information in product development. Adv. Eng. Inf. 2009, 23, 222–228. [Google Scholar] [CrossRef] [Scilit]
- Zhai, L.Y.; Khoo, L.P.; Zhong, Z.W. A rough set enhanced fuzzy approach to quality function deployment. Adv. Manuf. Technol. 2008, 37, 613–624. [Google Scholar] [CrossRef] [Scilit]
- Yoon, K. A reconciliation among discrete compromise situations. J. Oper. Res. Soc. 1987, 38, 277–286. [Google Scholar] [CrossRef] [Scilit]
- Hwang, C.L.; Lai, Y.J.; Liu, T.Y. A new approach for multiple objective decision making. Comput. Oper. Res. 1993, 20, 889–899. [Google Scholar] [CrossRef] [Scilit]
- Huang, I.B.; Keisler, J.; Linkov, I. Multi-criteria decision analysis in environmental science: Ten years of applications and trends. Sci. Total Environ. 2011, 409, 3578–3594. [Google Scholar] [CrossRef] [Scilit] [PubMed]
- Velasquez, M.; Hester, P.T. An analysis of multi-criteria decision-making methods. J. Oper. Res. 2013, 10, 56–66. [Google Scholar]
- Shih, H.S.; Shyur, H.J.; Lee, E.S. An extension of TOPSIS for group decision making. Math Comput. Mod. 2007, 45, 801–813. [Google Scholar] [CrossRef] [Scilit]
- Yue, Z. A method for group decision-making based on determining weights of decision makers using TOPSIS. Appl. Math. Model. 2011, 35, 1926–1936. [Google Scholar] [CrossRef] [Scilit]
- Doyle, J.R. Multiattribute choice for the lazy decision maker: Let the alternative decide. Organ. Behav. Hum. Decis. Process. 1995, 62, 87–100. [Google Scholar] [CrossRef] [Scilit]
- Androulakis, I.P.; Chatzidimitriou, K.C. Multi-criteria decision analysis using the CRITIC method. Econ. Ann. 2010, LV, 115–142. [Google Scholar]
- Deng, H.; Yeh, C.H.; Willis, R.J. Inter-company comparison using modified TOPSIS with objective weights. Comput. Oper. Res. 2000, 27, 963–973. [Google Scholar] [CrossRef] [Scilit]
- Srdjevic, B.; Medeiros, Y.D.P.; Faria, A.S.; Schaer, M. Objective evaluation of performance criteria for a reservoir system. Vodoprivreda 2003, 35, 163–176. (In Serbian) [Google Scholar]
- Srđević, Z.; Srđević, B.; Suvočarev, K.; Galamboš, L. Hybrid constructed wetland selection as a group decision-making problem. Water Resour. Manag. 2020, 34, 295–310. [Google Scholar] [CrossRef] [Scilit]
- Bang, D.; Aitchison, L.; Moran, R.; Herce Castanon, S.; Rafiee, B.; Mahmoodi, A.; Lau, J.Y.; Latham, P.E.; Bahrami, B.; Summerfield, C.; et al. Confidence matching in group decision-making. Nat. Hum. Behav. 2017, 1, 0117. [Google Scholar] [CrossRef] [Scilit]
- Fu, C.; Chang, W.; Yang, S. Multiple criteria group decision making based on group satisfaction. Inf. Sci. 2020, 518, 309–329. [Google Scholar] [CrossRef] [Scilit]
- Cha, S.H. Comprehensive survey on distance/similarity measures between probability density functions. Math. Models Methods Appl. Sci. 2007, 4, 300–307. [Google Scholar]
- Chiclana, F.; Tapia Garcia, J.M.; Moral, M.J.; del Herrera-Viedma, E. A statistical comparative study of different similarity measures of consensus in group decision making. Inf. Sci. 2013, 221, 110–123. [Google Scholar] [CrossRef] [Scilit]
- Deza, M.M.; Deza, E. Encyclopedia of Distances; Springer: Berlin/Heidelberg, Germany, 2009. [Google Scholar]
- Mikhailov, L. A fuzzy programming method for deriving priorities in the analytic hierarchy process. J. Oper. Res. Soc. 2000, 51, 341–349. [Google Scholar] [CrossRef] [Scilit]
- Srđević, B.; Srđević, Z. Enhancing decision-making in water resources management: An innovative assessment of expert consistency and competence. Eng. Sci. Techol. 2024, 8, 12–30. [Google Scholar]
- Kou, G.; Lin, C. A cosine maximization method for the priority vector derivation in AHP. Eur. J. Oper. Res. 2014, 235, 225–232. [Google Scholar] [CrossRef] [Scilit]
- Mikhailov, L.; Singh, M.G. Comparison analysis of methods for deriving priorities in the analytic hierarchy process. In Proceedings of the 1999 IEEE International Conference on Systems, Man and Cybernetics, Tokyo, Japan, 12–15 October 1999; pp. 1037–1042. [Google Scholar]
- Mikhailov, L.; Singh, M.G. Fuzzy assessment of priorities with application to the competitive bidding. J. Dec. Syst. 1999, 8, 11–25. [Google Scholar] [CrossRef] [Scilit]
- Srdjevic, B. Combining different prioritization methods in the analytic hierarchy process synthesis. Comput. Oper. Res. 2005, 32, 1897–1919. [Google Scholar] [CrossRef] [Scilit]
- Shannon, C.E.; Weaver, W. The Mathematical Theory of Communication; The University of Illinois Press: Urbana, IL, USA, 1947. [Google Scholar]
- Cheng, C.H. Evaluating naval tactic missile systems by fuzzy AHP based on the grade value of membership function. Eur. J. Oper. Res. 1996, 96, 343–350. [Google Scholar] [CrossRef] [Scilit]
- Aguaron, J.; Moreno-Jimenez, J.M. The geometric consistency index: Approximated threshold. Eur. J. Oper. Res. 2003, 147, 137–145. [Google Scholar] [CrossRef] [Scilit]
- Aguaron, J.; Escobar, M.T.; Moreno-Jiménez, J.M.; Turón, A. AHP-Group Decision Making Based on Consistency. Mathematics 2019, 7, 242. [Google Scholar] [CrossRef] [Scilit]
- Crawford, G.; Williams, C. A note on the analysis of subjective judgment matrices. Math. Psych. 1985, 29, 387–405. [Google Scholar] [CrossRef] [Scilit]
- Moreno-Jimenez, J.M.; Aguaron, J.; Escobar, M.T. The core of consistency in AHP-group decision making. Group Dec. Neg. 2008, 17, 249–265. [Google Scholar] [CrossRef] [Scilit]
- Srđević, B. Rough or standard AHP method in group evaluations of criteria sets in water resources related decision-making processes? Vodoprivreda 2022, 54, 149–160. (In Serbian) [Google Scholar]

Disclaimer/Publisher’s Note: The statements, opinions and data contained in all publications are solely those of the individual author(s) and contributor(s) and not of MDPI and/or the editor(s). MDPI and/or the editor(s) disclaim responsibility for any injury to people or property resulting from any ideas, methods, instructions or products referred to in the content. |
© 2024 by the authors. Licensee MDPI, Basel, Switzerland. This article is an open access article distributed under the terms and conditions of the Creative Commons Attribution (CC BY) license (https://creativecommons.org/licenses/by/4.0/).