


Abstract
This study used archival data from 30,453 students enrolled in 289 adult education programs in the state of Georgia, United States during the 2018–2019 school year. We explored how student-, teacher-, and classroom-level factors predict student attendance and academic performance (reading, language, and math) over time. Results indicated several student-level factors predict attendance and educational performance, including age, gender, race/ethnicity, previous educational attainment, low-income status, special needs status, reported barriers to education, and dual enrollment. Depending on the academic subject, age, race, previous education, special needs, and dual enrollment predicted academic growth over time. Teacher-level factors such as teacher experience predicted educational performance; classroom factors such as whether the course was an Integrated Education and Training (IET) class predicted attendance, and distance classes predicted attendance and performance. Certification predicted growth over time for language, and employment status and designation as a distance class predicted growth over time for math. These findings will help state officials improve the delivery of services to further enhance and improve student outcomes.
1. Introduction
Approximately one in four adults in the United States struggle with basic reading skills, and one in three adults in the United States struggle with basic numeracy skills (National Center for Education Statistics [NCES], 2019, 2024). Adult education programs offer classes (e.g., Adult Basic Education [ABE], Adult Secondary Education [ASE], English as a Second Language [ESL]) to help adults improve reading, writing, math, science, and social studies skills with the culminating goal of obtaining a high school equivalency degree. Some programs also offer Integrated Education and Training (IET), which combines ABE with workforce preparation, such as specialized certifications (e.g., Certified Nursing Assistant). Broadly, adult education programs serve only a fraction of eligible adults and are plagued by insufficient funding and resources, high teacher turnover rates, high student attrition rates, variable and insufficient progress in terms of student gains, and a scarcity of rigorous empirical research to better understand how to improve program accountability and quality to effectively meet the needs of students (e.g., Bennett, 2007; Lesgold & Welch-Ross, 2012). It is estimated that 100–150 h of instruction and practice are necessary for adult learners to accrue a one-year educational gain (Comings et al., 1999); however, it is also estimated that 58% of adult learners enroll in adult education programs for significantly fewer hours. Similarly, in shorter duration intervention studies (8–30 weeks, often with monetary incentives to participate), researchers report attrition rates of 38–54% and minimal to no literacy gains (e.g., Alamprese et al., 2011; Greenberg et al., 2011).
These sparse and grim findings indicate the need for a large-scale, multi-site study to investigate several factors that may influence student retention rates and student educational gains at differing levels of the adult education system (i.e., student-, teacher-, and classroom-level factors). A consideration of factors at these levels would allow us to capture the complexity and heterogeneity of key stakeholders (teachers and students). This project represents a partnership between the Georgia Office of Adult Education, which governs adult education in the state, and Georgia State University. Understanding the student-, teacher-, and classroom-level factors that may support or detract from retention rates and student educational gains is of high importance to adult education state officials, as nearly 1 million adults over the age of 18 across Georgia’s 159 counties have less than a high school education (United States Census Bureau, 2023). This project uses archival data captured by the Georgia Office of Adult Education across nearly 300 adult education programs, and the results provide practical and significant data to help state officials improve the delivery of services to further enhance and improve student outcomes.
2. Background on Student-, Teacher-, and Classroom-Level Factors
2.1. Student-Level Factors
Most adult education students participate voluntarily in programs and need to overcome a variety of barriers to attend classes and persist in meeting their educational goals (Comings, 2009; Comings & Soricone, 2007). Most of the previous research on retention and learner gains has focused on dispositional and demographic factors (e.g., Comings et al., 1999; Dirkx & Jha, 1994; Fitzgerald & Young, 1997; Greenberg et al., 2013; Mellard et al., 2013; Quigley, 1992; Scarborough et al., 2013). This research base has indicated that learners represent a heterogeneous group in terms of a variety of factors, such as age, race/ethnicity, previous schooling background, English language status, learning disability status, and motivational reasons for pursuing and persisting in adult education (Lesgold & Welch-Ross, 2012). Some common enrollment reasons include career advancement or job training, personal fulfillment, pursuit of a college degree, proficiency in English, encouragement from family, and an improved quality of life (e.g., Malicky & Norman, 1994; Tighe et al., 2013). Additionally, some learners in adult education programs are dual enrolled, meaning they take college courses before completing a high school degree (Ison, 2022). Alamprese (2026) explains this can be particularly advantageous for adult learners and describes the positive effects of Accelerating Opportunity, an Integrated Education and Training (IET) initiative that emphasizes strategies such as dual enrollment to help adults with low basic skills earn more credentials, obtain well-paying jobs, and sustain careers. Crucially, more research is needed to better understand the underlying factors that contribute to student retention and learner gains to better address individual needs and goals.
In a study of retention, Comings et al. (1999) interviewed 150 adult education students and identified that older learners (age 30 and older), learners with children (in particular grown children), learners with clearly defined goals, and second language learners were more likely to persist in adult education programs. Similarly, prior exposure to adult education programs, engagement in self-study, and citing specific goals were positively related to persistence. In addition, previous experience with schooling (students who rated their past experiences as neutral/negative as opposed to positive) impacted persistence but only for second language learners. Other factors, including employment status, gender, and race, did not impact persistence.
More recently, researchers have attempted to identify profiles of student retention based on large-scale reading interventions. Greenberg et al. (2013) grouped 395 learners into persisters (n = 198; minimum of 60 h of instruction), midpoint attendees (n = 66; less than 60 h and did not complete the intervention), and nonpersisters (n = 131; at least 30 h but did not continue until the midpoint). Similar to Comings et al. (1999), this study found that second language learners and age (older learners) predicted retention in the intervention. In addition, the study reported that across groups, previous educational history, avoidance of reading, economic hardship, and the reading skills of blending, rapid letter naming, and comprehension also predicted retention. Moreover, the study indicated slight nuances in profiles among the three persister groups. Of note, completers of the intervention tended to be second language learning females with lower foundational reading skills. Likewise, Sabatini et al. (2011) and Mellard et al. (2013) documented an inverse relation between reading abilities and retention, such that lower skills led to a greater likelihood of persistence. Mellard et al. (2013) also found that greater life satisfaction and students who reported receiving more help and having fewer obstacles tended to persist more and make educational gains. In addition, Mellard et al. (2013) noted differences by instructional program, with ABE students attending more classes but possessing more reading, writing, math, and computer skill limitations than ASE students. These studies present a complex portrait of student-level factors that vary in terms of demographic and dispositional variables as well as by student reading levels, instructional programs, and hours of attendance. Much more research is needed to better understand the influence of student-level factors on retention and learner gains to ensure delivery of higher quality and more effective instruction.
2.2. Teacher-Level Factors
Teacher-level factors play a central role in fostering student achievement and accountability (e.g., Bingman & Smith, 2007; Smith & Gillespie, 2007; Tighe et al., 2013) as well as providing a nurturing and collaborative environment for students enrolled in adult literacy settings (Tighe et al., 2013). Teachers can establish a strong rapport with students; however, class variables, such as timing of class offerings and class modality, as well as sporadic student attendance rates, make it challenging to connect with students as well as to effectively teach and plan lessons (Balmuth, 1988). Similarly, the lack of professional development opportunities and certifications hinders the ability of teachers to effectively perform their jobs (Smith & Gillespie, 2007; Smith et al., 2001). There are multiple individual factors related to teachers’ experience and training that may impact student retention and learner gains. Each of these factors has received scant research attention; however, we outline below the existing body of research regarding teachers in adult education.
Part-time staff (estimates of 40%) and volunteers (estimates of 43%) comprise most workers in adult education programs nationally, with many of the volunteers citing a high school diploma as their highest level of completed education (Lesgold & Welch-Ross, 2012). It is also reported that full-time staff average only 22.6 h per week (Smith et al., 2001) and that the majority of teachers are not compensated beyond time spent directly in the classroom (e.g., for lesson planning, attendance at workshops/trainings, outside meetings with students). In fact, poor teacher compensation is cited as one of the highest concerns and barriers to teachers persisting in the field of adult education (Lesgold & Welch-Ross, 2012; Smith et al., 2001).
Few studies have considered the impact of a teacher’s full- or part-time status on students’ academic gains or outcomes. Results from Fitzgerald and Young (1997) suggest a positive predictive relationship between full-time employment and student reading achievement outcomes within ABE and ESL classrooms (but not within ASE classrooms). In another investigation of factors influencing adult learners’ academic gains and postsecondary education enrollment, Yin et al. (2022) found that, on average, students whose teachers held a bachelor’s or graduate degree demonstrated greater performance gains than students whose teachers had a high school degree or less education. Yin et al.’s results also indicated that the odds of transitioning to postsecondary education were higher for students whose teachers were full-time (compared to part-time). However, neither teacher experience nor their part-time status were related to improved student performance (Yin et al., 2022).
Teaching in adult education requires dedication despite a lack of proper compensation for the workload required to be effective, and as a result, there are high levels of teacher attrition (Dolnick & Ward, 2025; Smith et al., 2001). In a statewide survey of current and former adult education teachers, 0% of respondents with 0–5 years of experience reported expecting to stay in the field long-term (Dolnick & Ward, 2025). Although not specific to the field of adult education, a review of research examining the impact of K-12 public school teacher experience on student gains found a positive relationship (Podolsky et al., 2019). Specifically, of the 30 studies included in their review, 28 indicated a positive relationship between teacher experiences and student performance, in which brand new teachers were considered to be the least effective (when compared to more experienced teachers). However, Yin et al.’s study of adult educators suggested no relationship between a teacher’s years of experience in adult education and students’ academic gains, and additional research is needed to understand how teacher experience may relate to student performance and engagement.
Contrary to K-12 education, there is limited available coursework and certifications in adult education. One survey of adult education teachers found that 57% reported they had not completed a single course in adult learning or education (Smith et al., 2001). As of 2007, only 22 states required teacher certification (and not necessarily specific to adult education) and only nine states offered pre-service training specific to adult education (Bingman & Smith, 2007). Although certifications and courses have become more readily available within the last decade (Smith, 2017), it is not clear that educators are taking advantage of these courses or that programs are requiring certifications specific to adult education despite calls from researchers to make expansions and support teacher certification and training (Pickard, 2024). Results from a more recent study (Yin et al., 2022) suggest that students of teachers who specialize in ABE or ASE had greater learner gains and higher odds of transitioning to postsecondary education than students of teachers who specialize in ESL. However, no studies have looked at how teacher-level factors may impact student attendance, and more research is needed to understand the impact of teacher certification on student outcomes.
2.3. Classroom-Level Factors
In addition to student- and teacher-specific characteristics, there are adult education class-level factors, such as whether a class is offered at a distance (as opposed to in person) or whether it is an Integrated Education and Training (IET) class, which may influence attendance and student gains as well. However, little research has addressed the impact of class type in terms of attendance and performance within adult education settings. Using a sample of college students enrolled in a communication course in either a hybrid or an online-only format, Kim and NguyenVoges (2024) found no difference in perceived course effectiveness, classroom engagement, learning readiness, or the quality of course materials. Alternatively, Gardner and Stotts (2022) emphasized the value of distance classes (i.e., asynchronous remote courses in which students complete work that instructors can track online) within ABE, noting that many students wished to continue enrolling in remote courses even after the pandemic-related shutdowns ended. In addition to adding another distance course to meet student demand, these practitioners reported that a greater proportion of students enrolled in distance classes (62% and 50%) achieved performance gains than students attending traditional face-to-face classes (32% and 31% in the 2020–2021 and 2021–2022 school years, respectively).
As adult education is often centered on the needs of the learner and preparing them for life outside of the classroom, IET classes, which combine basic literacy and numeracy instruction with occupational skill training, are widely considered an efficient pathway to develop adults’ foundational skills while also preparing them for employment (Alamprese & Hoogland, 2025). Investigating the effectiveness of IET programming in comparison to co-enrollment in adult education programming and workforce training, Konruff’s (2025) results suggest exposure to IET programs is linked to improved student outcomes, including completing college credits, having a grade point average (GPA) of at least 2.0, persisting to the second year, and completing a credential. Altogether, the results on teacher- and classroom-level factors suggest the need for increased attention to class type, improved working conditions, increased compensation rates, and investment in more full-time staff to reduce teacher turnover rates and increase teacher knowledge and effectiveness. Bolstering and understanding these factors may subsequently influence student retention and learner gains.
2.4. Current Study
This study explores how student-, teacher-, and classroom-level factors predict student attendance and student reading, language, and math performance across two timepoints for those enrolled in several Georgia adult education programs in the 2018–2019 school year. We collaboratively decided which student-, teacher-, and classroom-level factors would be of most importance to state officials, and this was also informed by the past but sparse empirical research base conducted on adult education programs (e.g., Yin et al., 2022). We addressed two research questions:
- Which student-, teacher-, and classroom-level factors emerge as most predictive of student attendance in adult education sites across the state?
- Which student-, teacher-, and classroom-level factors emerge as most predictive of Reading, Language, and Math performance? Are there differences in growth trajectories by student-, teacher-, and classroom-level factors?
3. Method
3.1. Participants
Participants included 30,453 adult students enrolled in 2584 classes with 688 teachers across 289 Georgia adult education programs during the 2018–2019 school year. Participants were limited to Adult Basic Education (ABE Levels 1–4) and Adult Secondary Education (ASE Levels 1–2) classes in reading, language, and math. Thus, we excluded students enrolled strictly in English as a Second Language (ESL) classes and programs that served only incarcerated adults in the state. In addition, students needed to have a minimum of 0.25 attendance hours to be included in the study. The sample was 42.3% male and had a mean age of 28.64 (SD = 11.97). The racial composition of the sample was as follows: 47.3% Black/African American, 34.9% White, and 6.9% Other (including multiracial). Additionally, 10.8% of the sample identified as Hispanic. See Table 1 for additional sample descriptives.
Table 1.
Demographic Characteristics of the Sample.
3.2. Included Variables from the State Database
We acquired state-level extant data for Fiscal Year 2019 from the Georgia Adult Office of Education to conduct this study. Students completed intake forms upon enrollment in their program, which provided most of the data for the student-level predictors included in this study. In addition to information gathered during intake, all adult education centers in the state also documented information about their students’ current enrollment (i.e., special needs, dual enrollment). Similarly, the programs in our state document various teacher and classroom variables, and we used these in our analyses.
All student-, teacher-, and classroom-level factors were determined in conjunction with the needs of the state as well as whether the available variables had enough variability to be included. Our outcome variables included student attendance and student performance on the Test of Adult Basic Education (TABE) Reading, Language, and Math subtests. See Table 1 for descriptive statistics on all study variables. See Table 2 for descriptives of all outcomes (attendance and performance at each timepoint).
Table 2.
Descriptives for all Outcome Measures.
3.3. Student-Level Variables
We used student demographics (i.e., age, gender, race, previous educational attainment) in our analyses. Student age was reported in years. Student gender was coded as Male (0) or Female (1). Students initially reported their race as American Indian or Alaska Native (0.7%), Asian (2.7%), Black/African American (47.3%), Native Hawaiian or Other Pacific Islander (0.25%), White (34.9%), or Two or More (3.27%). Students reported being Hispanic (10.8%) in a separate item. For this study, we used four categories to maximize the sample size within each subgroup: Black, White, Hispanic, or Other. The category with the largest sample size (Black) was used as the reference group in all analyses. Regarding previous educational attainment, we included two variables. One focused on the level of previous attainment and included the following categories: No Schooling, 8th and below, 9th, 10th, 11th, or 12th. The education category with the largest sample size (10th) was used as the reference group in all analyses because it represented a common educational attainment level among participants prior to high school completion. The other educational attainment item was binary and indicated whether a student had a high school diploma or equivalent degree (1) or if they did not (0).
Other student-level variables focused on different subgroups of students. We coded all students who reported receiving federal funds designated for low-income families (i.e., Temporary Assistance for Needy Families or Supplemental Nutrition Assistance Program) as low income (1). Students who did not report receiving these funds were coded as not low income (0). Additionally, student records indicated which students were currently receiving some kind of academic/testing accommodation, and we used this information to create a special needs variable. For some of our sample, this information was not available, and thus the categories for this variable include Yes, No, and Unknown; all analyses use the No response category as the reference group as it has the largest sample size. Additionally, students reported other personal information such as being a dislocated worker (3.1%), an ex-offender (4.6%), a farm worker (0.5%), homeless (1.3%), and having a physical disability (0.4%) or learning disability (0.7%). Due to low frequencies of endorsement for each of these subgroups individually, we combined these variables into a single variable to represent possible barriers and coded students who reported Yes to any of the noted variables as having a barrier (1); those who reported No for all variables were coded as not having a barrier (0).
Students could also be enrolled in the state’s dual achievement program, in which eligible students (i.e., students aged 16–21 who are withdrawn from their high school program and have earned credit for 6 of 9 required high school courses) complete a high school diploma and college coursework simultaneously. In addition to obtaining an accredited high school diploma, dual enrolled students also complete a technical diploma, an associate degree, or two technical college certificates before graduation. We used students’ records of enrollment in the state’s dual achievement program to code students as dual enrolled (1) or not dual enrolled (0).
3.4. Teacher-Level Variables
To represent teacher characteristics, we included three variables from the state database: employment designation, experience, and certification type. For teacher employment designation, we coded teachers according to whether they were employed as Part-time (0) or Full-time (1) workers. To measure years of experience, we used a variable containing categories representing the number of years the teacher has been teaching: Less than 1 year, 1–3 years, 4–10 years, or 11+ years. The original variable contained additional categories differentiating more experienced teachers (i.e., 11–15 years, 16–20 years, and 21+ years), and to maximize the size of subgroups for this variable, we collapsed these categories into one (i.e., 11+ years). We used the experience category 4–10 years as the reference group for this variable in all analyses because it was the most frequently endorsed response option. The state database also included information on teacher certification (i.e., no certification, adult education certification, K-12 certification, special education certification, Teaching English as a Second or Other Language [TESOL] certification). Due to few teachers in our sample having adult education, special education, or TESOL certification, we grouped these into a single category, and our certification variable is coded as None, K-12, or Other. Again, the certification category with the largest sample size (None) was the reference group for this variable in all analyses.
3.5. Classroom-Level Variables
To represent class type, we included two class-level variables. First, we referred to classes in which students spend most of their time learning at a distance (i.e., 51% or more of students’ hours are earned at a distance) as distance classes (coded as 1); other classes (coded as 0) operated primarily in person. It is typical for distance classes to include face-to-face sessions for intake, assessment, orientation, and help sessions, while other activities are completed through a variety of distance education materials (e.g., recordings, mobile applications, online technology). The second class variable we included was whether the class was designated as an Integrated Education and Training (IET) class. Such clases help adults who need essential workplace skills attain competencies and credentials that are needed for high-demand careers. The Workforce Innovation and Opportunity Act (WIOA) requires IET services to be concurrent, so that literacy activities occur simultaneously with workforce training and activities.
3.6. Outcome Variables
Attendance was measured as the number of hours a student attended the class. For students who were enrolled in a distance class, the number of hours spent on distance education activities was used as proxy contact hours and counted as attendance. For students enrolled in a face-to-face class, hours spent in the classroom during scheduled instruction counted as attendance. Attendance hours demonstrated substantial positive skew (skewness = 12.88, kurtosis = 447.88). Therefore, attendance was log-transformed using prior to analysis, which substantially reduced skewness (post-transformation skewness = 0.40, kurtosis = −0.55).
Performance on the Test of Adult Basic Education (TABE) in Reading, Language, and Math across two timepoints was modeled in the analyses. The TABE 11/12 is a standardized assessment aligned with College and Career Readiness standards and WIOA regulations that is used to determine learner outcomes. At the time of data collection, all sites in our state utilized either the 9/10 (a prior, now outdated version of the TABE) or 11/12 version of the TABE to assess student performance. Per our state office regulations, students completed the pre-test within the first 12 h of instruction. Post-testing occurred after a minimum of 40 h for ABE students, and for ASE students, post-testing occurred after at least 30 h of instruction. The Reading subtest measures reading abilities related to real-life, work-related, and academic contexts. The Language subtest assesses language skills within frequently encountered real-life and work-related contexts. The Math subtest is comprised of mathematics computation and applied mathematics sections, which together measure skills ranging from simple foundational material to more complex high school-level topics (TABE, n.d.).
3.7. Analytic Approach
We estimated multilevel linear mixed-effects models using the lme4 package (version 2.0.1; Bates et al., 2015) in R (version 4.6.1; R Core Team, 2026) with full maximum likelihood estimation (REML = FALSE) on complete-case datasets to permit nested model comparisons. Separate models were estimated for attendance and TABE Reading, Language, and Math outcomes. Age was grand-mean centered prior to analysis to facilitate interpretation of interaction effects and coefficient comparisons. Outcome variables remained in their original metric (log-transformed attendance and TABE scale scores). Binary and categorical predictors were coded using the following reference groups: male (gender), Black (race/ethnicity), 10th grade (education), no HS (high school) diploma/equivalency, not low income, no special needs, no barriers, in-person class, non-IET class, not dual enrolled, part-time teacher, 4–10 years of teaching experience, and the omitted teacher certification category.
For attendance, which was measured once per student, we estimated cross-sectional multi-level models with random intercepts for teachers and sites. The final attendance model was specified as:
where represents log attendance for student taught by teacher at site , represents the teacher-level random intercept, represents the site-level random intercept, and represents residual error.
For TABE Reading, Language, and Math outcomes, we estimated repeated measures multi-level growth models with timepoints nested within students and students clustered within teachers nested within sites. Final models included random intercepts for students and teachers within sites. The final growth model was specified as:
where represents the TABE Reading, Language, or Math score at time for student taught by teacher within site , represents the student-level random intercept, represents the teacher-within-site random intercept, and represents residual error.
For categorical predictors with more than two categories, the terms in the equations represent sets of dummy-coded indicators relative to the reference category. Models were built sequentially by adding fixed-effect blocks corresponding to time, student-level predictors, teacher/class-level predictors, Time × student interactions, and Time × teacher/class interactions. Candidate fixed and random effects were evaluated sequentially, and effects that did not meaningfully improve model fit or explain meaningful variance were excluded from final model specifications. Nested models were compared using likelihood-ratio tests (Δχ2, Δdf, p), supplemented by Akaike Information Criterion (AIC) and Bayesian Information Criterion (BIC), with lower values indicating better fit. Variance components and intraclass correlation coefficients (ICCs) were examined to quantify variance attributable to students, teachers, sites, and residual error. Fixed effects are reported as unstandardized coefficients with standard errors, t-tests, p-values, and 95% Wald confidence intervals.
Significant interactions with time were probed using manual simple slopes analyses derived from fixed effect estimates and model variance-covariance matrices. For continuous moderators, conditional time slopes were estimated at the mean and at ±1 SD of the moderator distribution. For categorical moderators, estimated time slopes were computed separately for each category, followed by pairwise comparisons of slope differences. Predicted values and 95% confidence intervals for significant interactions were visualized using the ggeffects package (version 2.3.2; Lüdecke, 2018). Benjamini–Hochberg false discovery rate (FDR) corrections were applied to simple slopes and pairwise comparisons within outcome domains.
4. Results
Basic descriptives by student-, teacher-, and classroom-level factors are reported in Table 1. Basic means and standard deviations for attendance and TABE Reading, Language, and Math at each timepoint are reported in Table 2. Correlations among all study variables are reported in the Supplementary File (Table S1a,b).
4.1. Research Question 1: Predicting Attendance in Adult Education
To address RQ1, we first evaluated the random-effects structure by fitting a sequential set of null models (no fixed-effects) that differed only by their random intercepts (teachers/classrooms followed by sites, see Table S2). Model fit indices and significant chi-square difference tests revealed that the model with random intercepts for teachers/classrooms and sites provided the overall best fit (−2LL = 87,223.20, AIC = 87,202.60, BIC = 87,235.90; Δχ2(1) = 87,194.60, p < 0.001). The ICC attributed to teachers/classrooms was 0.232 and 0.107 to sites (see Table S2 for all model fit indices).
Next, we considered a series of additive models with random teacher/classroom and site intercepts that differed in the number of fixed effects (adding student-level fixed effects followed by teacher- and classroom-level fixed effects). The model that included student-, teacher-, and classroom-level fixed effects provided the best global fit (−2LL = 80,697.60, AIC = 80,753.60, BIC = 80,984.60). This was also supported by a significant chi-square difference test compared to the student-level fixed effects model only (Δχ2(8) = 181.23, p < 0.001; see Table 3). Variance partitioning from the final model indicated that 21.5% of the remaining variance in attendance was at the teacher- and classroom-level and 10.8% at the site-level (see Table S3).
Table 3.
Sequential Model Comparisons for Attendance Model.
Table 4 presents the student-, teacher-, and classroom-level fixed effects estimates. There were several significant student-level predictors of attendance. Age was significant, suggesting that as age increases, attendance increases (b = 0.01, p < 0.001). Race/ethnicity was significant, such that adults who identified as White had significantly greater attendance than those who identified as Black (b = 0.03, p = 0.043). Prior educational attainment was significant, such that adults who completed 8th grade and below or 12th grade had higher attendance than adults who completed 10th grade (bs = 0.05, 0.06, ps = 0.01, 0.02, respectively). Adults who attended 11th grade had significantly lower attendance than adults who completed 10th grade (b = −0.04, p = 0.021). Adults who reported being low income had significantly lower attendance than those who did not (b = −0.06, p < 0.001). Adults who reported having special needs had significantly higher attendance than those who did not (b = 0.16, p < 0.001); however, adults with an unknown special needs status had significantly lower attendance than those reporting no special needs (b = −0.05, p = 0.010). Adults who reported barriers had significantly lower attendance than those who did not report barriers (b = −0.07, p < 0.001). Finally, dual enrolled students had significantly higher attendance than non-dual enrolled (b = 0.29, p < 0.001; see Table 4).
Table 4.
Fixed Effects for Attendance.
There were also two significant teacher-level fixed-effects. Distance education classes had significantly higher attendance rates than non-distance (in-person) classes (b = 0.36, p < 0.001). IET classes also had significantly higher attendance rates than non-IET classes (b = 1.07, p < 0.001).
4.2. Research Question 2: Predicting TABE Performance Growth over Time
To address RQ2, we first evaluated the random-effects structure for each TABE performance outcome by fitting a sequential set of null models (no fixed-effects) that differed only by their random intercepts (students followed by teachers/classrooms [nested within sites] followed by site). For all performance outcomes, the null model with student and teacher/classroom random intercepts was the overall best fit and were retained for further model building (Reading: −2LL = 188,184.30, AIC = 188,194.30, BIC = 188,233.20; Δχ2(1) = 1456.50, p < 0.001; Language: −2LL = 194,670.70, AIC = 194,680.70, BIC = 194,719.70; Δχ2(1) = 953.12, p < 0.001; Math: −2LL = 210,999.20, AIC = 211,009.20, BIC = 211,048.70; Δχ2(1) = 1446.57, p < 0.001). The ICC attributed to students ranged from 0.590–0.700 and attributed to teachers/classrooms ranged from 0.439–0.508 across performance outcomes (see Table S4 for all model fit indices).
Next, we considered a series of additive models with random student and teacher/classroom intercepts that differed in the number of fixed effects (adding time, followed by student-level fixed effects, followed by teacher- and classroom-level fixed effects, followed by time student-level interactions, followed by time teacher- and classroom-level interactions). For the Reading outcome, the model that included time, student-level, teacher- and classroom-level, and time student-level interactions provided the best global fit (−2LL = 169,124.70, AIC = 169,214.70, BIC = 169,559.90). This was also supported by a significant chi-square difference test compared to the time, student-level, and teacher- and classroom-level fixed effects model only (Δχ2(16) = 69.14, p < 0.001; see Table 5). Variance partitioning from the final model indicated that 43.7% of the remaining variance in reading performance was at the student-level and 14.5% was at the teacher- and classroom-level (see Table S5). For the Language and Math outcomes, the models that included all additive effects provided the best global fits (Language: −2LL = 177,685.80, AIC = 177,791.80, BIC = 178,200.60; Math: −2LL = 196,235.20, AIC = 196,341.20, BIC = 196,756.70. These were also supported by significant chi-square difference tests compared to the time; student-, teacher-, and classroom-level fixed effects; and time student-level interactions models (Language: Δχ2(8) = 16.24, p = 0.039; Math: Δχ2(8) = 17.88, p = 0.022; see Table 5). Variance partitioning from the final Language model indicated that 43.5% of the remaining variance in language performance was at the student-level and 11.9% at the teacher-and classroom-level. For Math, 51.6% of the remaining variance was at the student-level and 15.4% at the teacher- and classroom-level (see Table S5).
Table 5.
Sequential Model Comparisons for Growth Models Across Outcomes.
4.3. Reading Performance Outcome
Table 6 presents the time, student-, teacher-, and classroom-level fixed main effects estimates and the time student-, teacher-, and classroom-level interaction effects. Time was a significant predictor of reading performance, which suggests significant growth in reading skills over time (b = 9.64, p < 0.001). There were several significant student-level predictors of reading performance. Age was significant, suggesting that as age increases, reading performance decreased (b = −0.67, p < 0.001). Females had a significantly greater reading performance than males (b = 7.46, p < 0.001). Adults who identified as White or Hispanic had significantly greater reading performance compared to adults who identified as Black (bs = 20.76, 7.60, ps < 0.001, respectively). Adults who had no previous schooling, completed 8th grade and below, 9th grade, and 12th grade had significantly lower reading performance relative to adults who completed 10th grade (bs = −24.34, −10.33, −4.31, −12.66, ps = <0.001, <0.001, 0.020, <0.001, respectively). Adults who completed a HS diploma/equivalency had significantly lower reading performance relative to adults who had not previously completed a HS diploma/equivalency (b = −6.19, p = 0.016). Adults who reported having special needs and adults with unknown special needs had significantly lower reading performance compared to those who did not have special needs (bs = −21.03, −6.26, ps < 0.001, 0.001, respectively). Finally, dual enrolled students had a significantly greater reading performance than non-dual enrolled students (b = 16.26, p < 0.001; see Table 6).
Table 6.
Fixed Effects for Reading Growth Models.
There were also some significant teacher- and classroom-level fixed main effects. Distance education classes had significantly greater reading performance than non-distance (in-person) classes (b = 10.50, p = 0.001). Teachers with <1 year, 1–3 years, and 11+ years had students with significantly lower reading performance relative to teachers with 4–10 years of experience (bs = −8.88, −7.95, −7.69, ps = 0.016, 0.008, 0.008, respectively; see Table 6).
Finally, there were two significant time student-level interactive effects. First, time age was significant (b = −0.18, p < 0.001; Table 6). This interaction suggests that younger adults had greater reading growth trajectories (predicted 11.88-point growth) than older adults (predicted 7.50-point growth; see Figure 1, Panel 1). Second, time race/ethnicity was significant for the White subgroup (b = 6.98, p < 0.001). Specifically, White adults had greater reading growth trajectories (predicted 17.03-point growth) than Black adults (predicted 9.88-point growth; see Figure 2, Panel 1, and Table S6 for all simple slope estimates and significance values).
Figure 1.
Predicted Pre–Post Growth by Age Across Reading, Language, and Math. Note. Values represent model estimated scores from multi-level growth models at pre-test and post-test. Age was probed at −1 SD (younger) and +1 SD (older). Shaded bands represent 95% confidence intervals. Differences in growth by age were statistically significant but small in magnitude.
Figure 2.
Predicted Pre–Post Growth by Race/Ethnicity Across Reading, Language, and Math.
4.4. Language Performance Outcome
Table 7 presents the time, student-, teacher-, and classroom-level fixed main effects estimates and the time student-, teacher-, and classroom-level interaction effects. Time was a significant predictor of language performance, which suggests significant growth in language skills over time (b = 26.40, p < 0.001). There were several significant student-level predictors of language performance. Age was significant, suggesting that as age increases, language performance decreased (b = −0.41, p < 0.001). Females had a significantly greater language performance than males (b = 14.38, p < 0.001). Adults who identified as White had a significantly greater language performance compared to adults who identified as Black (b = 15.50, p < 0.001). Adults who had no previous schooling, completed 8th grade and below, 9th grade, and 12th grade had lower language performance relative to adults who completed 10th grade (bs = −28.15, −10.94, −6.35, −11.07, ps = <0.001, respectively). Adults who reported having special needs and adults with unknown special needs had significantly lower language performance compared to those who did not have special needs (bs = −21.13, −9.32, ps < 0.001, respectively). Adults who reported barriers had a significantly greater language performance than those who reported no barriers (b = 7.34, p = 0.001). Finally, dual enrolled students had a significantly greater language performance than non-dual enrolled students (b = 23.31, p < 0.001; see Table 7).
Table 7.
Fixed Effects for Language Growth Models.
There were also two significant teacher- and classroom-level fixed main effects. Distance education classes had significantly greater language performance than non-distance (in-person) classes (b = 14.22, p < 0.001). Teachers with <1 year of experience had students with a significantly lower language performance relative to teachers with 4–10 years of experience (b = −9.68, p = 0.009; see Table 7).
There were three significant time student-level interactive effects. First, time age was significant (b = −0.32, p < 0.001; Table 7). Similar to the reading outcome, this interaction suggests that younger adults had greater language growth trajectories (predicted 30.36-point growth) than older adults (predicted 21.92-point growth; see Figure 1, Panel 2). Second, time race/ethnicity was significant for the White subgroup (b = 3.99, p = 0.006). Specifically, White adults had a greater language growth trajectory (predicted 30.39-point growth) relative to Black adults (predicted 26.40; see Figure 2, Panel 2). Third, there was a significant time education interaction for the No schooling (b = 11.06, p = 0.045) group. Adults who reported no schooling had a greater language trajectory (predicted 37.46-point growth) relative to adults who completed 10th grade (predicted 26.40-point growth; see Figure 3, Panel 1, and see Table S6 for all simple slope estimates and significance values).
Figure 3.
Predicted Pre–Post Growth in Language and Math by Educational Attainment. Note. Lines represent model estimated math scores at pre-test and post-test from the final multi-level growth model. Shaded bands indicate 95% confidence intervals. Growth differences reflect significant time moderator interactions. Educational attainment was dummy coded with 10th grade as the reference group. In the language model, a significant interaction was observed for participants with no schooling (Time No schooling, p = 0.045), indicating greater gains relative to the reference group. In the math model, significant interactions were observed for participants with no schooling (Time No schooling, p = 0.011) and those with 8th grade education or below (Time 8th and below, p = 0.008), indicating smaller gains relative to the reference group. All other Time Education interactions were not statistically significant.
Finally, there was a significant time teacher-level interactive effect. Time teacher certification specific to K-12 was significant (b = −3.32, p = 0.018). Teachers with K-12 certification have students with a lower language growth trajectory (predicted 23.07-point growth) compared to teachers with no certification (predicted 26.40-point growth; see Figure 4, Panel 1 and Table S6).
Figure 4.
Pre–Post Gains in Math and Language by Instructional and Teacher Characteristics. Note. Lines represent model predicted scores at pre- and post-test. All groups showed gains over time. Differences by instructional modality and teacher characteristics were generally modest, with slightly higher predicted scores for distance learning and full-time teachers. Language gains were slightly smaller for students taught by K–12 certified teachers.
4.5. Math Performance Outcome
Table 8 presents the time, student-, teacher-, and classroom-level fixed main effects estimates and the time student-, teacher-, and classroom-level interaction effects. Time was a significant predictor of math performance, which suggests significant growth in math skills over time (b = 23.94, p < 0.001). There were several significant student-level predictors of math performance. Age was significant, suggesting that as age increases, math performance decreased (b = −0.30, p < 0.001). Adults who identified as White, Hispanic, or Other had significantly greater math performance compared to adults who identified as Black (bs = 15.93, 10.07, 12.92, ps < 0.001). Adults who had no previous schooling, completed 8th grade and below, 9th grade, and 12th grade had significantly lower math performance relative to adults who completed 10th grade (bs = −12.90, −11.96, −4.61, −7.46, ps = 0.009, <0.001, 0.003, <0.001, respectively). Adults who completed 11th grade had a significantly greater math performance than adults who completed 10th grade (b = 3.55, p = 0.019). Adults who reported being low income had a significantly lower math performance than those who were not low income (b = −3.71, p = 0.001). Adults who reported having special needs and adults with unknown special needs had significantly lower math performance compared to those who did not have special needs (bs = −18.34, −8.08, ps < 0.001, respectively). Finally, dual enrolled students had a significantly greater math performance than non-dual enrolled students (b = 21.47, p < 0.001; see Table 8).
Table 8.
Fixed Effects for Math Growth Models.
There were also two significant teacher- and classroom-level fixed main effects. Distance education classes had significantly greater math performance than non-distance (in-person) classes (b = 15.25, p < 0.001). Teachers with <1 year of experience had students with significantly lower math performance relative to teachers with 4–10 years of experience (b = −7.98, p = 0.024; see Table 8).
There were also several significant time student-level interactive effects. First, time age was significant (b = −0.39, p < 0.001; Table 8). Similar to the reading and language outcomes, this interaction suggests that younger adults had greater math growth trajectories (predicted 28.85-point growth) than older adults (predicted 19.02-point growth; see Figure 1, Panel 3). Second, time race/ethnicity was significant for the White subgroup (b = 5.53, p < 0.001). Specifically, White adults had a greater math growth trajectory (predicted 29.47-point growth) relative to Black adults (predicted 23.94-point growth; see Figure 2, Panel 3). Third, there was a significant time education interaction for the No schooling (b = −10.80, p = 0.011) and the 8th grade and below (b = −3.99, p = 0.008) groups. Adults who reported no schooling and 8th grade and below had lower math growth trajectories (predicted 13.14 and 19.95-point growth, respectively) relative to adults who reported 10th grade level educational attainment (see Figure 3, Panel 2). Fourth, there was a significant time special needs interaction (b = −6.54, p < 0.001) for adults who reported special needs. Specifically, adults who reported special needs had a lower math growth trajectory (predicted 17.40-point growth) relative to adults without special needs (predicted 23.94-point growth; see Figure 5, Panel 1). Finally, there was a significant time dual enrollment interaction (b = 14.20, p < 0.001). Specifically, adults who were dual enrolled had a greater math trajectory (predicted 38.14-point growth) than adults who were not dual enrolled (predicted 23.94-point growth; see Figure 5, Panel 2 and Table S6 for all simple slope estimates and significance values).
Figure 5.
Pre–Post Gains in Math by Special Needs Status and Dual Enrollment. Note. Lines represent model predicted math scores at pre- and post-test. All groups showed gains over time. Students without special needs and those who were dual enrolled had higher predicted scores at both time points.
There were two significant time teacher- and classroom-level interactive effects. Time distance education was significant (b = −5.39, p = 0.027). Distance education classes had a lower math growth trajectory (predicted 18.55-point growth) than non-distance (in-person) classes (predicted 23.94-point growth; see Figure 4, Panel 2). Time teacher status was also significant (b = 2.16, p = 0.023). Full-time teachers have students with a higher math growth trajectory (predicted 26.10-point growth) relative to part-time teachers (predicted 23.94-point growth; see Figure 4, Panel 3; see Table S6 for all simple slope estimates and significance values).
5. Discussion
The purpose of this study was to explore student-, teacher-, and classroom-level factors that influence student attendance and TABE performance over time. Our results indicated a variety of student-level factors, including age, gender, race, previous educational attainment, income status, special needs status, barriers, and dual enrollment, are related to attendance and performance. Furthermore, teacher characteristics (employment designation, years of experience, certification type) and classroom factors (distance education, IET) had significant influence on attendance and/or performance over time. Patterns of findings and implications for adult education are discussed.
5.1. Student-Level Findings
Similar to the work of Comings et al. (1999), in which older adults were categorized as persisting in adult education, and that of Nanda et al. (2025) in which older adults had greater attendance but were less likely to make gains, our findings indicated older students attended more hours yet had lower performance and made gains at a lower rate than younger students. Our findings also indicated gender was not a statistically significant predictor of attendance or math gains, but females had greater reading and language performance, which is consistent with previous findings (Scheiber et al., 2015). Regarding race and ethnicity, our results were similar to those of Yin et al. (2022), whose findings indicated White students outperformed all other racial groups. Our results indicate White students attended more hours, and our interaction results indicate that White students had greater gains than Black students in reading, language, and math.
Previous research addressing the relationship between previous educational attainment and measures of performance and attendance is limited, but adult education learner motivation indicates that higher previous educational attainment is associated with greater motivation (e.g., Martinez et al., 2024; Yamashita et al., 2022), which is typically associated with greater levels of participation and performance. However, results from our study indicate that the relationship between previous educational attainment and measures of attendance and performance is more nuanced, and further research is necessary. For instance, our results regarding performance in each subject of the TABE indicate students who had no previous schooling, who had completed 8th grade or less, completed 9th grade, or completed 12th grade had lower scores on the reading and math domain of the TABE than students who completed 10th grade; however, for language, the results were flipped and this same group of students had higher scores than the comparison group of students who completed 10th grade. Interactions between time and previous educational attainment further indicate that students who have had no previous schooling exhibited greater gains on the language test than those who completed 10th grade, but on the math test, students who had no previous schooling and those who completed 8th grade or less had lower gains than their peers who completed 10th grade.
Other student variables included in our models focused on different subgroups of adult learners that may be disadvantaged. Our results suggest that students who are low income and those who identified as having at least one barrier (i.e., dislocated worker, an ex-offender, a farm worker, homeless, or who reported having a physical disability or learning disability) had lower attendance hours than students who were not low income or did not have a barrier. This finding is consistent with previous research (e.g., Comings et al., 1999; Mellard et al., 2013), suggesting a need to provide additional support and wraparound services that facilitate learner success. In alignment with the Matthew effect (Stanovich, 1986) commonly found in reading, students who have special needs attended more hours yet had lower reading, language, and math performance than their peers without special needs. Additionally, math gains were lower for students with special needs compared to those without.
Our results also suggest that dual enrollment is linked to positive student attendance and performance outcomes. For instance, dual enrolled students exhibited greater gains in math than their non-dual enrolled peers. Thus, dual enrollment not only provides an opportunity for credential acquisition while building foundational skills (Alamprese, 2026), but it also may beneficially impact student attendance and performance.
5.2. Teacher-Level Findings
Our results also reveal an interesting pattern regarding teacher experience that may have implications for teacher retention and professional development. Students with teachers with less than one year of experience consistently had lower performance than those whose teachers had 4–10 years of experience. For the reading outcome, students of teachers with 1–3 years of experience and those with more than 11 years of experience also had lower performance than students of teachers with 4–10 years of experience. Considering the issue of teacher retention in adult education and many of the early career teachers’ intentions to leave the field (Dolnick & Ward, 2025), it is crucial to retain teachers, as those with at least 4 years of experience had students perform better on all TABE domains than teachers with fewer years of experience. Notably, our findings regarding teacher experience differ from those of Yin et al. (2022), who reported no relationship between teachers’ years of adult education experience and students’ academic achievement. Our results also suggest that having teacher certifications may not be as impactful as experience. Our only finding regarding certification indicated that students of teachers with K-12 certification had lower language gains than students of teachers with no certification.
Additionally, Yin et al.’s (2022) study indicated no difference between full- and part-time employment status in terms of academic achievement, but students with teachers who were full-time had higher odds of transitioning to postsecondary education in their study. In our results, teacher employment status was found to be related to math performance such that students of full-time teachers had greater math gains than students of part-time teachers, suggesting a benefit to having full-time teachers for math content.
5.3. Classroom-Level Findings
Our results suggest offering flexible courses via distance education is advantageous in terms of student retention and educational gains. Similar to Gardner and Stotts (2022), our findings indicated that distance education was associated with greater attendance and greater reading, language, and math performance. Results from Konruff (2025) suggest several positive outcomes associated with IET attendance, and while our results did not reveal differences in student performance between IET classes and non-IET classes, it is still possible there are other benefits that our study did not measure (e.g., later college credit completion, college persistence, credential acquisition).
5.4. Implications
Considering the range of factors impacting student attendance and performance at the student-level, it is important for states delivering services to understand who may be most at risk for poor attendance and slower academic progression in order for policymakers and practitioners to provide better learner supports. One-size-fits-all delivery may not be the most effective, and instead, learners need tailored supports for different subgroups (Spitzig & Renner, 2025). Providing targeted supports is particularly important because prolonged instructional gaps can compound existing reading difficulties (Stanovich, 1986). Moreover, learning disabilities among adult learners are historically undiagnosed (Patterson, 2008), and it is important to provide accommodations to all students who need them to help ensure their academic progression.
Proactive retention efforts such as frequent student-teacher interactions (Tighe et al., 2013) or texting students (Alamprese et al., 2022) may also improve student outcomes. Additionally, programs that are connected to positive outcomes, such as dual enrollment, should be promoted and accessible for students who are interested (Alamprese, 2026). One possible explanation is that students perceive dual enrollment as providing clearer pathways to postsecondary education and employment than programs that only focus on foundational reading and writing skills. To achieve this, more partnerships between postsecondary institutions such as community colleges and adult education programs should be formally established, and more opportunities for students to be dual enrolled should be made available.
As for teachers, retention is essential, as those with 4–10 years of experience had students with the best performance. Combined with other findings from our study and other studies (e.g., Dolnick & Ward, 2025), more full-time positions and better financial compensation are crucial for teacher retention. Our findings further suggest implications for teachers and the classroom vary by content area, with math having the most teacher factors related to performance and growth. Thus, it may be important to have full-time math teachers as they may have more time to devote to course preparation or more knowledge of math content than their part-time peers. In addition, the interaction involving instructional modality and math performance over time indicated greater growth for students in an in-person class as opposed to those in a distance class. One possible explanation is that direct interaction and scaffolding available during in-person classes may better support continued skill development in math. More broadly, our findings suggest distance education is associated with improved attendance and overall performance. Distance education may help to reduce barriers related to transportation, childcare, and financial instability by increasing flexibility for learners. As discussed by Gardner and Stotts (2022), programs can increase adult learners’ acceptance of remote learning by expanding access to distance courses through technology-lending libraries, hiring instructors to offer additional remote class options, and streamlining administrative processes so remote students can complete and receive required paperwork remotely. Finally, because all states maintain adult education databases (U.S. Department of Education, Office of Career, Technical, and Adult Education, 2024), it would be beneficial for researchers to create similar partnerships with state agencies to conduct state-specific studies that can inform state policy decisions and guide improvements for adult education programs.
5.5. Limitations and Future Directions
There are a few limitations that need to be considered alongside our findings. First, our findings are correlational in nature and only across two timepoints. Additionally, as the present study utilized data from a single state, results should be interpreted with caution. Future studies should continue to explore the impact of various student, teacher, and classroom factors with data from other states and with more timepoints for greater generalizability. One aspect of this study that limits its discussion with similar work (e.g., Yin et al., 2022) is the differences between state data collection procedures and the variables that are collected as a result. Not all variables that are assessed at the student-, teacher-, and classroom-level in one study are available in another study conducted in a different state, with different policies regarding the information collected.
Second, the state programs administered both TABE Forms 9/10 and 11/12 because data collection spanned the statewide transition to TABE 11/12, an updated assessment developed to align with College and Career Readiness (CCR) Standards (Data Recognition Corporation [DRC], 2017). One limitation is that the archival database used in the current study did not identify the specific TABE version administered at each testing occasion, precluding a direct evaluation of potential version effects or formal psychometric comparability across versions. However, current statewide assessment policy suggests that the influence of version switching on the longitudinal findings may have been limited. For example, current Georgia Office of Adult Education policy governing the transition from TABE 11/12 to TABE 13/14 specifies that continuing learners who were previously assessed on TABE 11/12 continue to be assessed using TABE 11/12, whereas new learners begin on TABE 13/14 (Technical College System of Georgia, Office of Adult Education [TCSG], 2025). This policy reflects an approach to assessment transitions that preserves longitudinal assessment histories for continuing learners while implementing updated assessments for new entrants. Although the specific procedures used during Georgia’s earlier transition from TABE 9/10 to TABE 11/12 were unavailable, the current policy suggests that maintaining continuity in longitudinal learner records is an established principle of statewide assessment transitions. Nevertheless, because the specific assessment version administered at each testing occasion was unavailable in the archival dataset, potential version effects cannot be ruled out when interpreting the findings.
Third, despite having such a large sample, some of the variable categories had low representation that may impact the generalizability of the findings. For instance, we did not have a large enough sample of teachers who completed specialized certifications other than K-12, and thus we are unable to determine if students who have teachers with an adult, TESOL, or special education certificate differ from each other. Future studies could consider other analytical approaches to appropriately compare groups despite differences in group size (e.g., random subsampling from a larger group to match smaller group size and compare) or should consider using a sample with greater representation in various types of teacher certifications. Similarly, some variables had imbalanced sample sizes among categories, in particular the IET, distance class, and dual enrollment variables, which may limit generalizability of the findings. Additionally, our barriers variable was self-report and comprised several low-incidence characteristics (i.e., dislocated worker, ex-offender, farm worker, homeless, physical disability, or learning disability), which is not an exhaustive list of obstacles adult learners may face.
Finally, self-selection bias may also impact our findings. As is typical for educational research using real student data, students were not randomly assigned to any type of enrollment and could choose to enroll in a distance class, an IET class, or be part of the dual enrollment program at their own discretion. This selection bias may result in differences in attendance or performance based on innate student qualities rather than due to the enrollment itself. For example, students may enroll in a particular distance class because they feel more comfortable with the subject matter and may perform better in that subject than other students who chose to enroll in a face-to-face class for the subject matter. Additionally, students who are eligible and interested in IET courses or dual enrollment may register for such programs; these students who are motivated to study for multiple credentials simultaneously may be more innately inclined to attend more hours or may perform higher on measures of academic achievement due to factors not considered in this study. Furthermore, eligibility requirements for IET and dual enrollment limit students’ ability to enroll, and it is unknown whether students who are outside of the eligibility requirements would have similar results or not. Further research is needed to continue to explore the relationship between class type and student outcomes.
6. Conclusions
Our study is one of the first to investigate the relationship of student, teacher, and classroom factors with attendance and performance measures over time. Overall, attendance and performance in adult education are shaped by a complex interaction of student-, teacher-, and classroom-level factors. Improving attendance and performance outcomes will require coordinated supports across all levels as opposed to focusing solely on weaknesses in students’ skill levels. Differences in terms of demographic variables such as age, gender, race, previous education, income level, barriers experienced, and special education status point to the need for dedicated support services that can provide individualized counseling, supplemental instruction, and/or additional resources to help all students thrive. Overall, students, on average, exhibited reading, language, and math gains, suggesting adult education generally has a positive impact on academic achievement. Our results also suggest teacher experience matters, and that teacher retention is beneficial for improved student outcomes. Likewise, flexible and applied program options (i.e., distance education, IET classes, dual enrollment) are linked to positive student outcomes and should be implemented and available for students within adult education programs.
Supplementary Materials
The following supporting information can be downloaded at: https://www.mdpi.com/article/10.3390/educsci16081262/s1, Table S1a: Correlations among Study Variables (Part 1); Table S1b: Correlations among Study Variables (Part 2); Table S2: Random Effects Model Comparisons for Attendance Models; Table S3: Variance Partitioning for Attendance Model; Table S4: Random Effects Model Comparisons for Growth Models; Table S5: Variance Partitioning for Growth Models; Table S6: Estimated Pre–Post Growth Slopes by Moderator from Final Growth Models.
Author Contributions
Conceptualization, E.L.T. and D.G.; Methodology, E.L.T., G.K., and R.C.H.; Formal analysis, E.L.T. and G.K.; Data curation, G.K. and R.C.H.; Writing—original draft, C.L.J., E.L.T., and G.K.; Writing—review & editing, C.L.J., E.L.T., G.K., D.G., and R.C.H.; Visualization, G.K.; Supervision, E.L.T., G.K., and D.G.; Project administration, D.G.; Funding acquisition, E.L.T., D.G., and R.C.H. All authors have read and agreed to the published version of the manuscript.
Funding
The research reported here is supported by the Institute of Education Sciences, U.S. Department of Education, through Grant R305H180061 awarded to Georgia State University. The opinions expressed are those of the authors and do not represent views of the Institute or the U.S. Department of Education.
Institutional Review Board Statement
Ethical review and approval were waived since this study used extant deidentified data and was determined as exempt not human subjects by the Georgia State University Institutional Review Board (#H18640).
Informed Consent Statement
Informed consent was waived since this study used extant deidentified data and was determined as exempt not human subjects by the Georgia State University Institutional Review Board (#H18640).
Data Availability Statement
This study was based on extant data from the Georgia Office of Adult Education (GOAE) through a partnership with Georgia State University. There is no public repository in which others could access or use this data as the data is confidential.
Conflicts of Interest
The authors declare no conflicts of interest.
References
- Alamprese, J. A. (2026). College and career readiness approaches in adult foundational education: Directions for research and practice. Adult Literacy Education: The International Journal of Literacy, Language, and Numeracy, 8(1), 32–35. [Google Scholar] [CrossRef] [Scilit]
- Alamprese, J. A., Cheng, I.-F., & Silverman, A. (2022). Nurturing and nudging adult learners through text messaging: Final report for the Technology-Based Coaching in Adult Education (TBCAE) project. Abt Associates. [Google Scholar]
- Alamprese, J. A., & Hoogland, K. (2025). Promoting literacy and numeracy in adult learning and education. New Directions for Adult and Continuing Education, 2025(185), 33–38. [Google Scholar] [CrossRef] [Scilit]
- Alamprese, J. A., MacArthur, C. A., Price, C., & Knight, D. (2011). Effects of a structured decoding curriculum on adult literacy learners’ reading development. Journal of Research on Educational Effectiveness, 4(2), 154–172. [Google Scholar] [CrossRef] [Scilit] [PubMed]
- Balmuth, M. (1988). Recruitment and retention in adult basic education: What does research say? Journal of Reading, 31(7), 620–623. [Google Scholar]
- Bates, D., Mächler, M., Bolker, B., & Walker, S. (2015). Fitting linear mixed-effects models using lme4. Journal of Statistical Software, 67(1), 1–48. [Google Scholar] [CrossRef] [Scilit]
- Bennett, P. (2007). Foreword: Impact of research on an adult education practitioner. In J. Comings, B. Garner, & C. Smith (Eds.), Review of adult learning and literacy (Vol. 7, pp. vii–x). Lawrence Erlbaum Associates. [Google Scholar]
- Bingman, M. B., & Smith, C. (2007). Professional development and evidence-based practice in adult education. In A. Belzer (Ed.), Toward defining and improving quality in adult basic education (pp. 69–84). Lawrence Erlbaum Associates. [Google Scholar]
- Comings, J. P. (2009). Student persistence in adult literacy and numeracy programs. In S. Reder, & J. Bynner (Eds.), Tracking adult literacy and numeracy skills: Findings from longitudinal research (pp. 160–176). Routledge. [Google Scholar]
- Comings, J. P., Parrella, A., & Soricone, L. (1999). Persistence among adult basic education students in pre-GED classes (NCSALL-R-12). National Center for the Study of Adult Learning and Literacy, Harvard Graduate School of Education. [Google Scholar]
- Comings, J. P., & Soricone, L. (2007). Adult literacy research: Opportunities and challenges. Occasional Paper of the National Center for the Study of Adult Learning and Literacy (NCSALL). Harvard Graduate School of Education. Available online: http://www.ncsall.net/fileadmin/resources/research/op_opps_challenges.pdf (accessed on 3 June 2026).
- Data Recognition Corporation (DRC). (2017). TABE 11 & 12 technical manual. Available online: https://tabetest.com/PDFs/TABE_11_12_Objective_Structure_07_12_17.pdf (accessed on 3 June 2026).
- Dirkx, J. M., & Jha, L. R. (1994). Completion and attrition in adult basic education: A test of two pragmatic prediction models. Adult Education Quarterly, 45(1), 269–285. [Google Scholar] [CrossRef] [Scilit]
- Dolnick, B., & Ward, K. (2025). Adult education is losing its backbone: Teachers. COABE Journal: The Resource for Adult Education, 14(1), 104. [Google Scholar]
- Fitzgerald, N. B., & Young, M. B. (1997). The influence of persistence on literacy learning in adult education. Adult Education Quarterly, 47(2), 78–91. [Google Scholar] [CrossRef] [Scilit]
- Gardner, J., & Stotts, A. A. (2022). Zooming past the pandemic: New perspectives and positive outcomes in remote learning. COABE Journal: The Resource for Adult Education, 11(2), 39–42. [Google Scholar] [CrossRef] [Scilit]
- Greenberg, D., Wise, J. C., Frijters, J. C., Morris, R., Fredrick, L. D., Rodrigo, V., & Hall, R. (2013). Persisters and nonpersisters: Identifying the characteristics of who stays and who leaves from adult literacy interventions. Reading and Writing: An Interdisciplinary Journal, 26(4), 495–514. [Google Scholar]
- Greenberg, D., Wise, J. C., Morris, R., Fredrick, L., Nanda, A. O., & Pae, H. K. (2011). A randomized control study of instructional approaches for struggling adult readers. Journal of Research on Educational Effectiveness, 4(2), 101–117. [Google Scholar] [CrossRef] [Scilit] [PubMed]
- Ison, M. P. (2022). Dual enrollment, performance-based funding, and the completion agenda: An analysis of post-secondary credential outcomes of dual enrollment students by credential type. Community College Review, 50(1), 51–70. [Google Scholar] [CrossRef] [Scilit]
- Kim, H., & NguyenVoges, S. R. (2024). Student communication motives and perceived effectiveness of the course between online and hybrid classes. Currents in Teaching & Learning, 16(1), 22–34. [Google Scholar] [CrossRef] [Scilit]
- Konruff, B. (2025). Building momentum for student success: Investigating the relationship between two-year college integrated education and training programs and student outcomes. Teachers College Record, 127(4), 30–55. [Google Scholar] [CrossRef] [Scilit]
- Lesgold, A. M., & Welch-Ross, M. (Eds.). (2012). Improving adult literacy instruction: Options for practice and research. National Academies Press. [Google Scholar]
- Lüdecke, D. (2018). ggeffects: Tidy data frames of marginal effects from regression models. Journal of Open Source Software, 3(26), 772. [Google Scholar] [CrossRef] [Scilit]
- Malicky, G. V., & Norman, C. A. (1994). Participation patterns in adult literacy programs. Adult Basic Education, 3(3), 144–156. [Google Scholar]
- Martinez, J., Greenberg, D., Puranik, C., Braasch, J. L., Philippakos, Z. A. T., MacArthur, C. A., & Miller, C. (2024). Utility value of improving writing skills for adult basic education students. Journal of Adolescent & Adult Literacy, 2024(68), 211–222. [Google Scholar] [CrossRef] [Scilit]
- Mellard, D. F., Krieshok, T., Fall, E., & Woods, K. (2013). Dispositional factors affecting motivation during learning in adult basic and secondary education programs. Reading and Writing: An Interdisciplinary Journal, 26(4), 515–538. [Google Scholar] [CrossRef] [Scilit] [PubMed][Green Version]
- Nanda, N., Talwar, A., Cronen, S., Lotas, S., & Stockham, J. (2025). Pathways to opportunity: A quantitative case study of persistence and credential attainment among adult education learners in Washington, DC [Research Brief]. American Institutes for Research. Available online: https://files.eric.ed.gov/fulltext/ED674392.pdf (accessed on 3 June 2026).
- National Center for Education Statistics [NCES]. (2019). Highlights of the 2017 U.S. PIAAC results web report (NCES 2020-777). U.S. Department of Education. Available online: https://nces.ed.gov/surveys/piaac/current_results.asp (accessed on 3 June 2026).
- National Center for Education Statistics [NCES]. (2024). Highlights of the 2023 U.S. PIAAC results web report (NCES 2024-202). U.S. Department of Education. Available online: https://nces.ed.gov/surveys/piaac/2023/national_results.asp (accessed on 3 June 2026).
- Patterson, M. B. (2008). Learning disability prevalence and adult education. Program characteristics. Learning Disabilities Research & Practice, 23(1), 50–59. [Google Scholar] [CrossRef] [Scilit]
- Pickard, A. (2024). Each one can’t just teach one. Adult Literacy Education: The International Journal of Literacy, Language, and Numeracy, 6(3), 32–36. [Google Scholar] [CrossRef] [Scilit]
- Podolsky, A., Kini, T., & Darling-Hammond, L. (2019). Does teaching experience increase teacher effectiveness? A review of US research. Journal of Professional Capital and Community, 4(4), 286–308. [Google Scholar] [CrossRef] [Scilit]
- Quigley, B. A. (1992). Understanding and overcoming resistance to adult literacy education. Pennsylvania State University, Institute for the Study of Adult Literacy. Available online: https://eric.ed.gov/?id=ED357196 (accessed on 3 June 2026).
- R Core Team. (2026). R: A language and environment for statistical computing. R Foundation for Statistical Computing. [Google Scholar]
- Sabatini, J. P., Shore, J., Holtzman, S., & Scarborough, H. S. (2011). Relative effectiveness of reading intervention programs for adults with low literacy. Journal of Research on Educational Effectiveness, 4(2), 118–133. [Google Scholar] [CrossRef] [Scilit] [PubMed]
- Scarborough, H. S., Sabatini, J. P., Shore, J., Cutting, L. E., Pugh, K., & Katz, L. (2013). Meaningful reading gains by adult literacy learners. Reading and Writing: An Interdisciplinary Journal, 26(4), 593–613. [Google Scholar] [CrossRef] [Scilit]
- Scheiber, C., Reynolds, M. R., Hajovsky, D. B., & Kaufman, A. S. (2015). Gender differences in achievement in a large, nationally representative sample of children and adolescents. Psychology in the Schools, 52(4), 335–348. [Google Scholar] [CrossRef] [Scilit]
- Smith, C. (2017). Professional development and professionalization in the field of adult basic education. New Directions for Adult and Continuing Education, 2017(155), 71–81. [Google Scholar] [CrossRef] [Scilit]
- Smith, C., & Gillespie, M. (2007). Research on professional development and teacher change: Implications for adult basic education. In J. Comings, B. Garner, & C. Smith (Eds.), Annual review of adult learning and literacy (Vol. 7, pp. 205–244). Lawrence Erlbaum Associates. [Google Scholar]
- Smith, C., Hofer, J., & Gillespie, M. (2001). The working conditions of adult literacy teachers: Preliminary findings from the NCSALL staff development study (NCSALL, Focus on Basics, Vol. 4, Issue D). National Center for the Study of Adult Learning and Literacy, Harvard Graduate School of Education. Available online: http://www.ncsall.net/index.html@id=291.html (accessed on 3 June 2026).
- Spitzig, J., & Renner, B. J. (2025). Student engagement and retention of adult learners at community colleges. Journal of College Student Retention: Research, Theory, & Practice, 26(4), 1010–1027. [Google Scholar] [CrossRef] [Scilit]
- Stanovich, K. E. (1986). Matthew effects in reading: Some consequences of individual differences in the acquisition of literacy. Reading Research Quarterly, 22, 360–407. [Google Scholar] [CrossRef] [Scilit]
- Technical College System of Georgia, Office of Adult Education (TCSG). (2025). Adult learner assessment policies and procedures manual: FY2026 (Rev. May 28 2025). Available online: https://www.tcsg.edu/wp-content/uploads/2022/06/Georgia-FY2023-Adult-Learner-Assessment-Policies-and-Procedures-Manual_20220722.pdf (accessed on 3 June 2026).
- Tests of Adult Basic Education (TABE). (n.d.). Discover TABE 9 & 10. Available online: https://tabetest.com/PDFs/TABE_9_10_Brochure.pdf (accessed on 3 June 2026).
- Tighe, E. L., Barnes, A. E., Connor, C. M., & Steadman, S. C. (2013). Defining success in adult basic education settings: Multiple stakeholders, multiple perspectives. Reading Research Quarterly, 48(4), 415–435. [Google Scholar] [CrossRef] [Scilit] [PubMed][Green Version]
- United States Census Bureau. (2023). American community survey data. Available online: https://www.census.gov/programs-surveys/acs/news/data-releases.2023.html (accessed on 3 June 2026).
- U.S. Department of Education, Office of Career, Technical, and Adult Education. (2024). National reporting system for adult education: Technical assistance guide for performance accountability. National Reporting System for Adult Education. Available online: https://nrsweb.org/sites/default/files/NRS-TA-Mar2021-2024-508.pdf (accessed on 3 June 2026).
- Yamashita, T., Smith, T. J., Sahoo, S., & Cummins, P. A. (2022). Motivation to learn by age, education, and literacy skills among working-age adults in the United States. Large-Scale Assessments in Education, 10(1), 1–20. [Google Scholar] [CrossRef] [Scilit]
- Yin, M., Cronen, S., Condelli, L., & Ogut, B. (2022). Teacher effectiveness in adult education: The relationship between teacher characteristics and student test gains and transitions into postsecondary education. Adult Education Quarterly, 72(3), 262–283. [Google Scholar] [CrossRef] [Scilit]
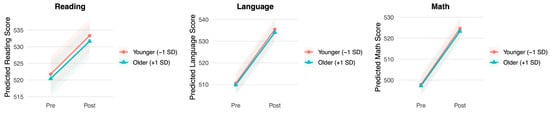
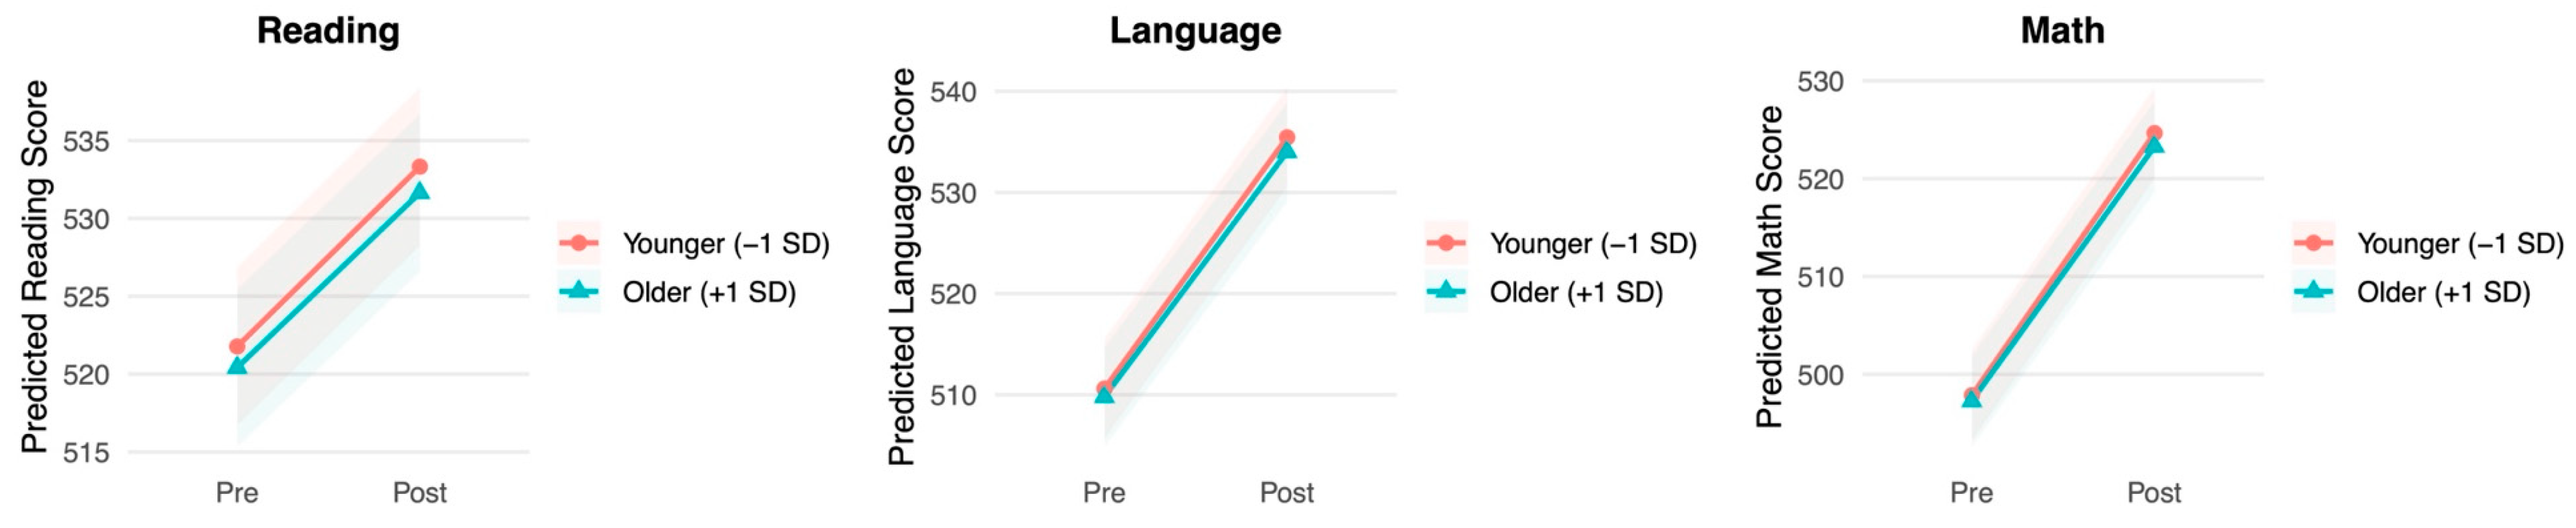
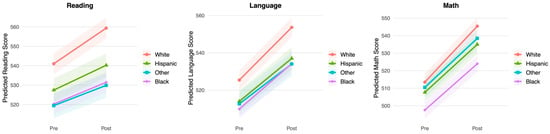
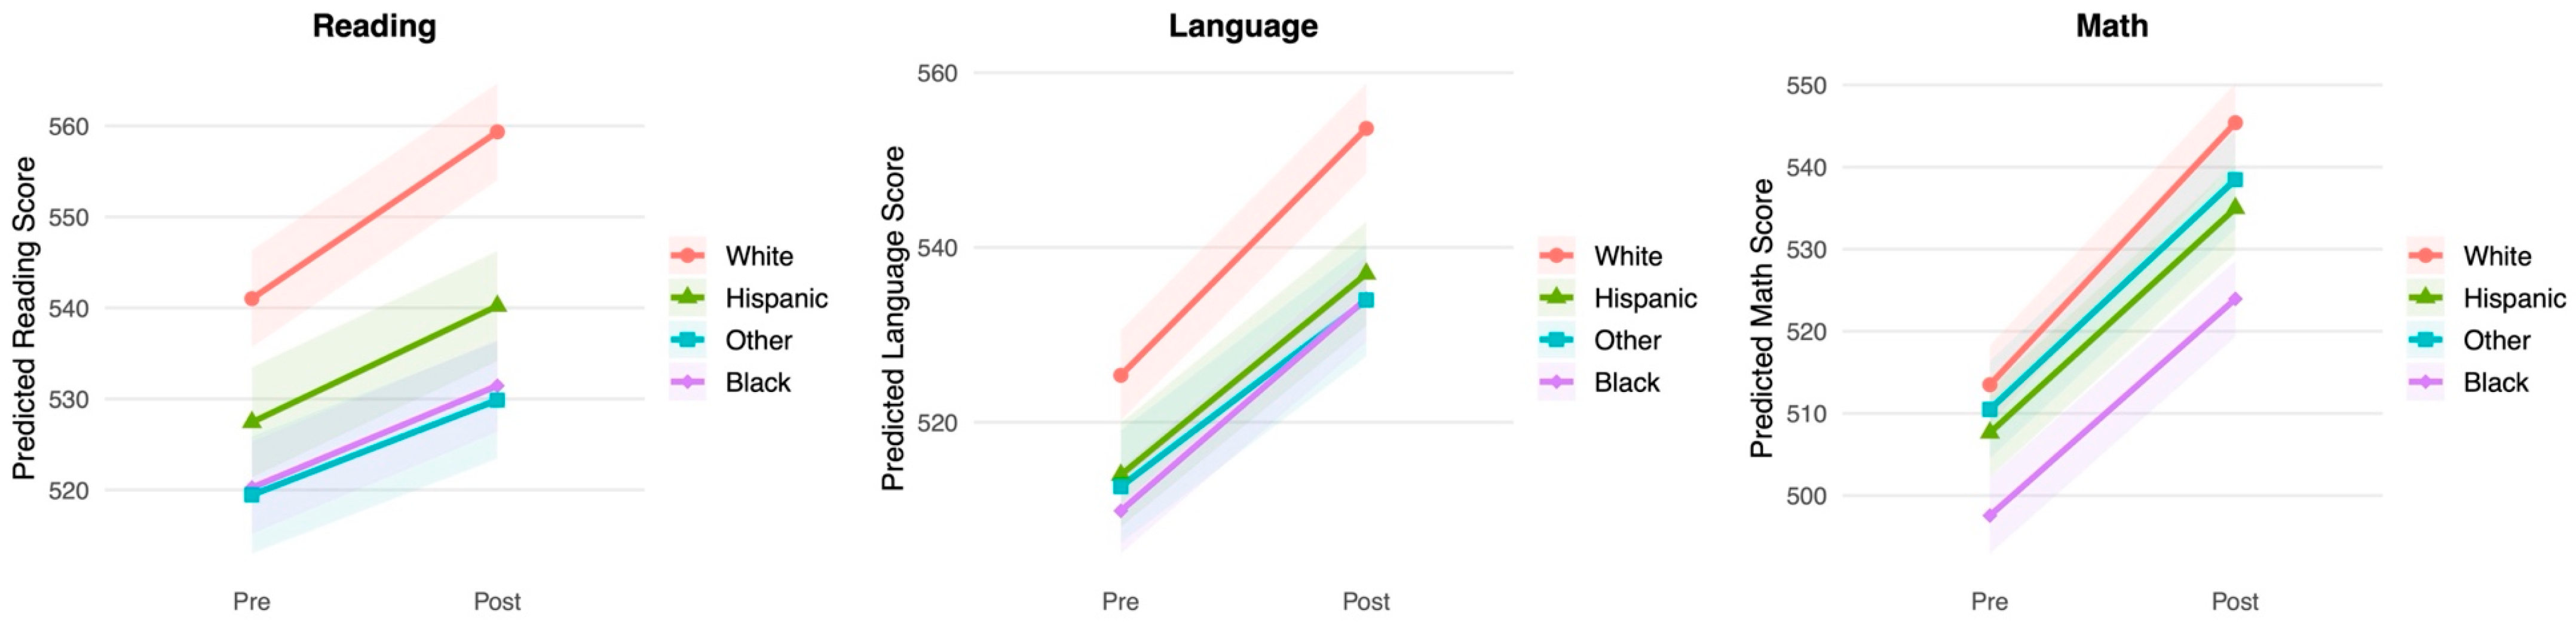
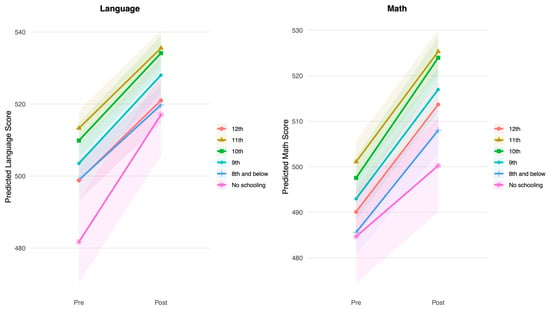
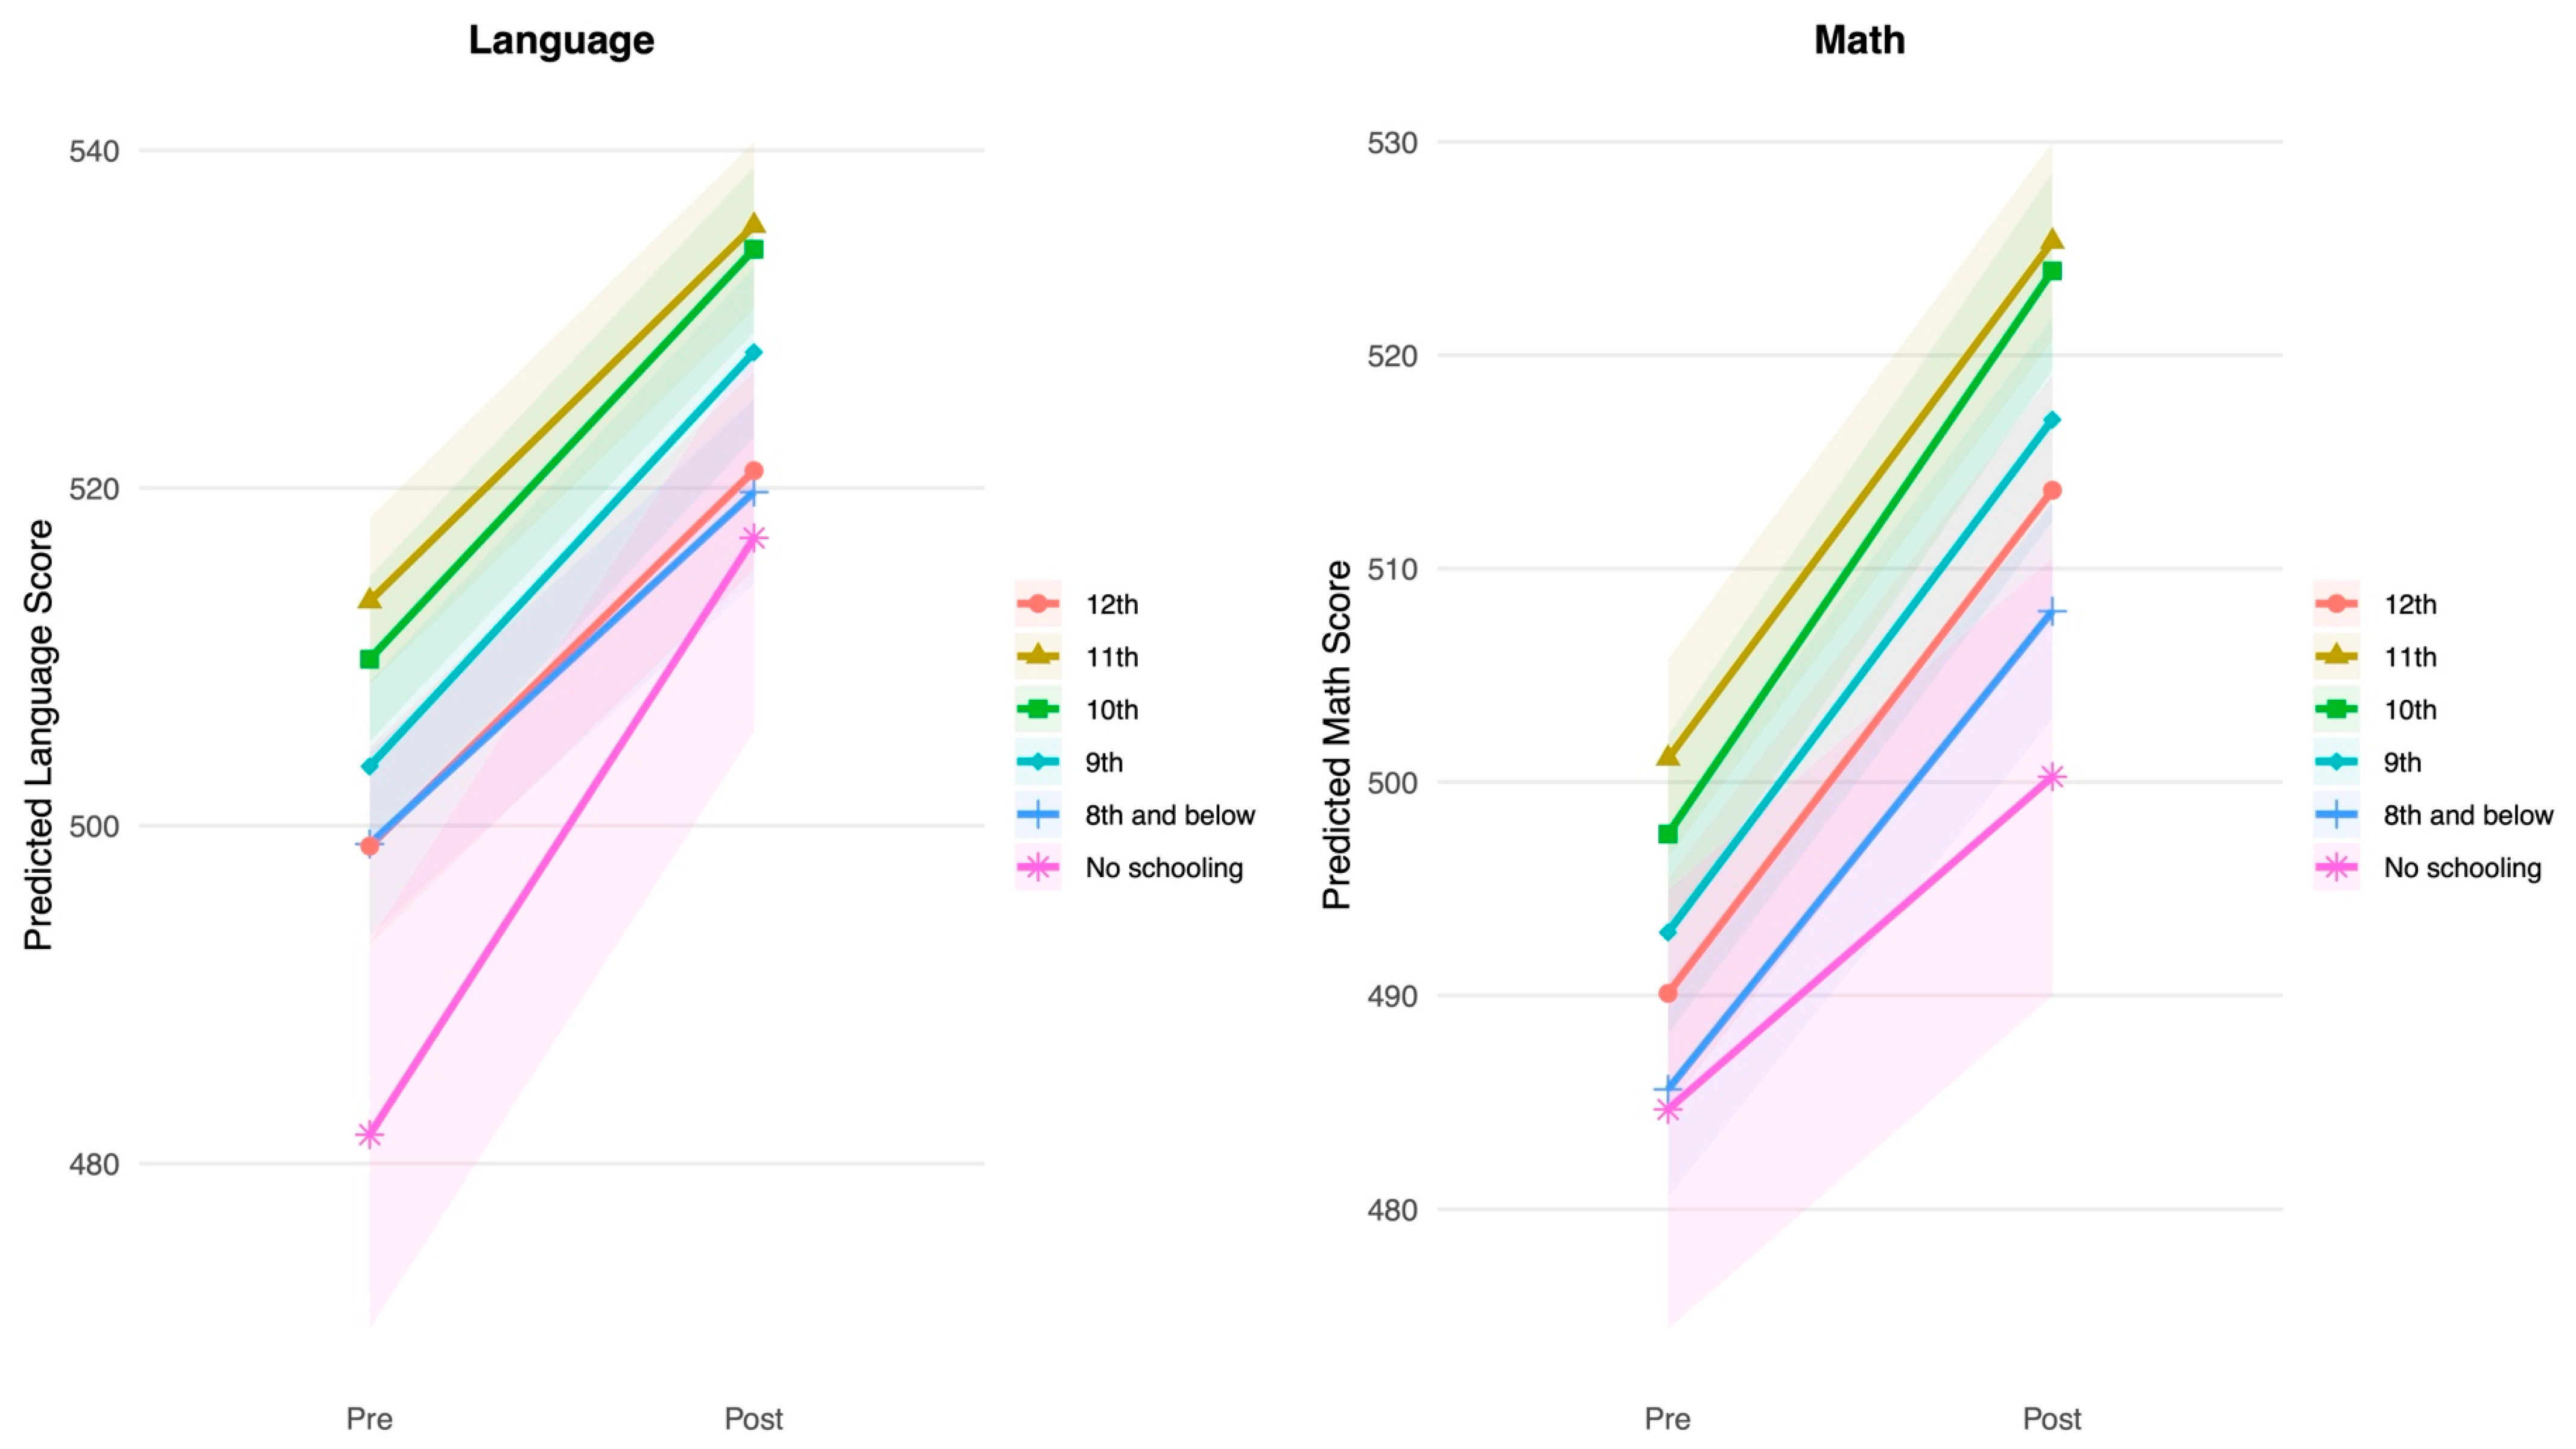
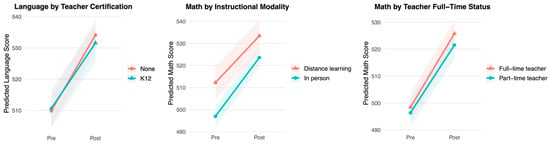
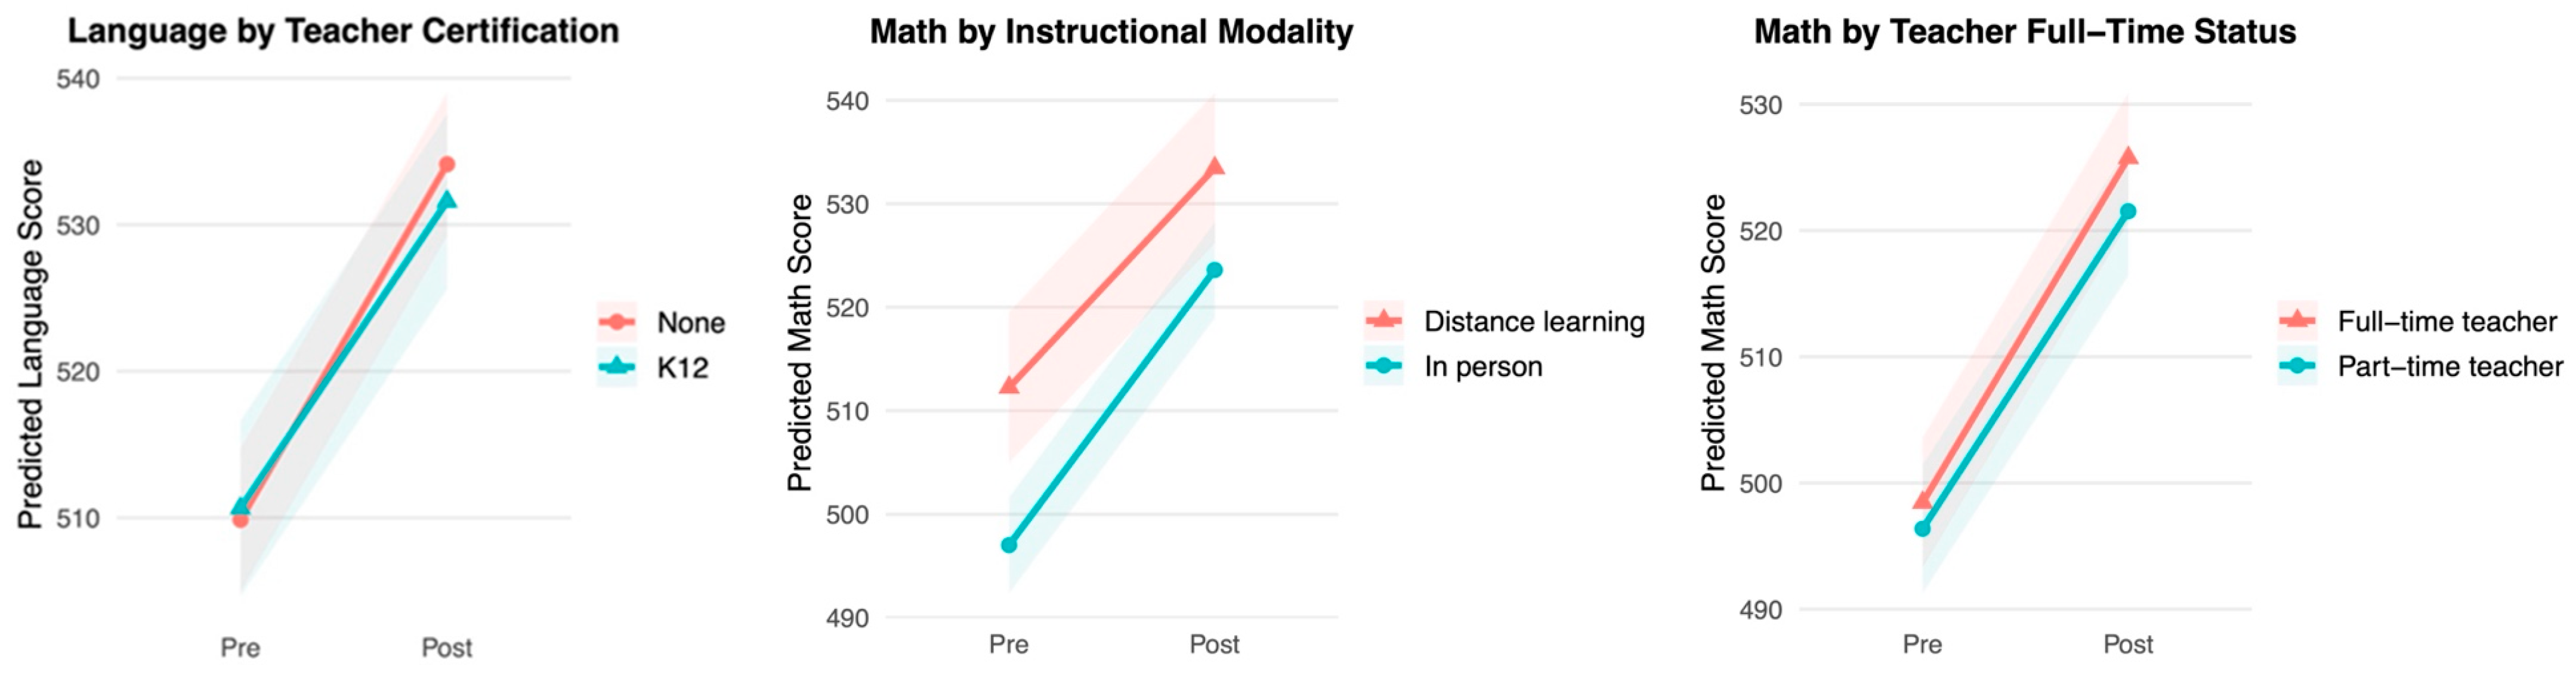
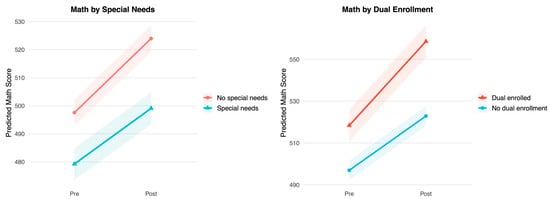
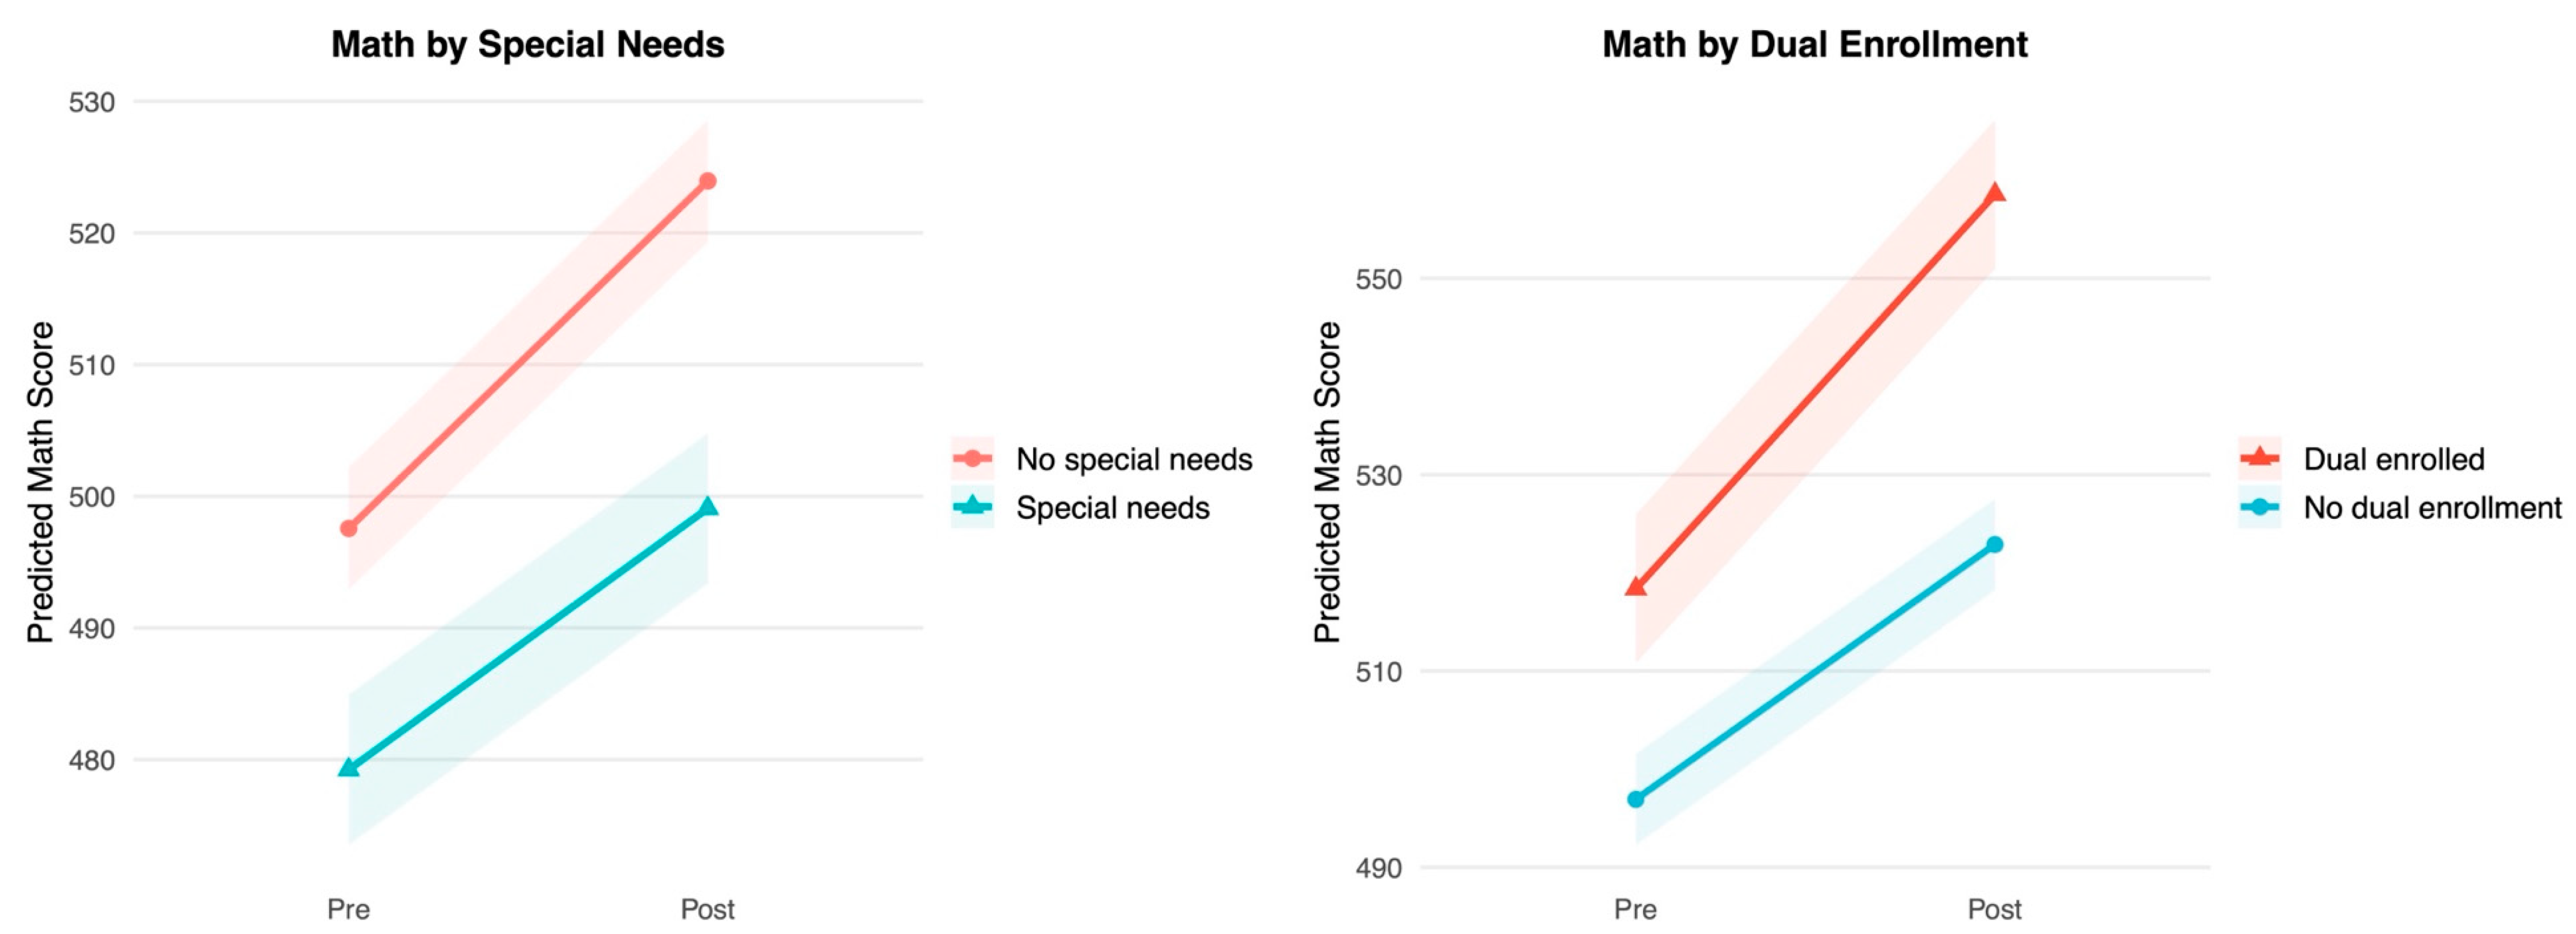

Disclaimer/Publisher’s Note: The statements, opinions and data contained in all publications are solely those of the individual author(s) and contributor(s) and not of MDPI and/or the editor(s). MDPI and/or the editor(s) disclaim responsibility for any injury to people or property resulting from any ideas, methods, instructions or products referred to in the content. |
© 2026 by the authors. Licensee MDPI, Basel, Switzerland. This article is an open access article distributed under the terms and conditions of the Creative Commons Attribution (CC BY) license.