Article

Boosting Sustainable Action: Co-Designing Interactive Visualizations to Bridge Awareness Gaps in Universities


1
Department of Computer Science and Engineering, University of Bologna, 40126 Bologna, Italy
2
Department of Political and Social Sciences, University of Bologna, 40126 Bologna, Italy
*
Author to whom correspondence should be addressed.
Educ. Sci. 2026, 16(5), 771; https://doi.org/10.3390/educsci16050771
Submission received: 25 March 2026 / Revised: 5 May 2026 / Accepted: 6 May 2026 / Published: 13 May 2026

Abstract

Universities are increasingly positioning sustainability as a core institutional commitment, often publishing annual reports that showcase their contributions to the 17 Sustainable Development Goals (SDGs). Yet these documents frequently go unnoticed by the academic community, limiting their educational impact and their potential to inspire informed, responsible, and sustainable behaviors. To address this gap, this study explores how participatory and technology-enhanced educational approaches can transform sustainability reporting into an accessible, engaging, and pedagogically meaningful learning experience. Engaging 121 university students during a participatory process, we developed an interactive digital system that integrates innovative strategies, including interactive data visualizations, gamification, and a chatbot capable of dialoguing with the university’s sustainability report, to foster environmental awareness and promote sustainable practices. The system aims to empower learners on two intertwined levels: (i) understanding the institution’s sustainability actions and commitments, and (ii) recognizing concrete, everyday opportunities to contribute to environmental wellbeing, thereby counteracting feelings of eco-powerlessness and supporting agency-driven behavioral change. Findings highlight the effectiveness of participatory design in shaping impactful digital tools for sustainability education and demonstrate how interdisciplinary design principles can enhance student engagement with complex environmental issues. The study contributes to ongoing scholarly discourse by proposing six key guidelines (technology, content, data producer, learning strategy, gamification, and data visualization) for designing interactive systems that support education for a more resilient and sustainable future.

1. Introduction

Sustainability has emerged as a critical issue in modern society, capturing the attention of policymakers, businesses, and individuals, especially after the release of the 2030 Agenda for Sustainable Development (United Nations General Assembly, 2015). In this agenda, the United Nations identified 17 Sustainable Development Goals (SDGs) encompassing environmental, social, and economic perspectives to improve sustainability by 2030. As the effects of climate change, resource depletion, and environmental degradation become increasingly evident, the urgency to adopt sustainable practices has never been greater. According to the United Nations, global CO2 emissions reached a record high of 57.4 gigatons in 2022 (United Nations Environment Programme, 2023), underscoring the need for immediate action to mitigate environmental impact. At the same time, it is important not to lose sight of the social and economic aspects of sustainability. As proof of this, alarming data from the 2023 Sustainable Development Goals Report show that the probability that young women were not in education, employment, or training was 32.1%, compared to 15.4% for young men (United Nations, 2023).
In this context, universities play a pivotal role in the transition towards sustainable development (Filho, 2011; Monzó-Martínez et al., 2024; Parr, 2022) not only as producers of knowledge but also as key actors in fostering Education for Sustainable Development (ESD). Higher education institutions are increasingly expected to create learning environments that support the development of sustainability-related competencies, such as critical thinking, systems thinking, and responsible action, while responding to growing demands for accountability and transparency (Moggi, 2023). Universities, therefore, represent privileged spaces in which sustainability can be experienced, discussed, and critically reflected upon through educational practices that actively engage students (Tripon et al., 2023). Within this educational perspective, the public dissemination of sustainability-related data linked to the 17 SDGs can serve not only accountability purposes but also pedagogical ones. Making such information accessible and understandable supports learning processes that empower students to interpret institutional practices and reflect on their own role in promoting sustainability. This approach aligns with the broader trend of data democratization (Awasthi & George, 2020; Lefebvre et al., 2021), which seeks to enable both technical and non-technical audiences to access, interpret, and meaningfully engage with data as part of an informed and participatory learning experience.
The discourse on university campus sustainability and students’ perceptions of sustainability has garnered significant attention in academic research (Emanuel & Adams, 2011; Prandi et al., 2021). Numerous studies have explored institutional policies, infrastructure developments, student engagement programs, and the integration of sustainability principles into academic curricula (Pereira Ribeiro et al., 2021). Scholars have emphasized that fostering a culture of sustainability requires not only structural improvements but also innovative educational practices capable of engaging students in meaningful ways. The recent literature highlights how interactive, technology-supported learning environments can influence students’ attitudes and behaviors towards sustainability (Celik et al., 2014; Ulkhaq & George Joseph, 2023). These findings align with the growing interest in leveraging digital platforms and immersive tools to enhance environmental literacy and promote active participation in sustainability initiatives.
Building on the broader framework of Education for Sustainable Development, recent scholarship has begun to articulate a more specific construct: Digital Education for Sustainable Development (D-ESD), which refers to the intentional use of digital technologies to mediate, scaffold, and deepen learners’ engagement with sustainability-related knowledge and competencies (García-Hernández et al., 2022; Ricard et al., 2020). D-ESD moves beyond digitizing content; it uses interactive, data-driven learning environments to cultivate systems thinking, critical reflection, and informed agency in learners (Jackson, 2016). Within this emerging paradigm, a growing body of work has begun examining how advanced digital tools, including AI-assisted systems and data visualization platforms, can make complex ESG (Environmental, Social, and Governance) data more accessible to non-expert audiences (Chen, 2024; Vieru & Plugge, 2025). While some scholars have explored the potential of Generative Artificial Intelligence in this regard (Baskara, 2024), our work focuses on co-designed interactive systems as a means of bridging the gap between institutional sustainability data and student awareness. This perspective underscores the need to design digital learning environments that not only present sustainability data but actively support students in interrogating, contextualizing, and connecting such information to their own lived experiences and institutional contexts.
The United Nations Educational, Scientific and Cultural Organization has reinforced the importance of universities in implementing and conveying sustainability practices by releasing the General Guidelines for the Implementation of Sustainability in Higher Education Institutions (Galán-Muros, 2023). According to these guidelines, the university community (students, academics, and administrative staff) must be actively involved in multiple stages of the transition toward sustainability, from developing a shared understanding of the concept to participating directly in sustainable actions. However, based on a preliminary survey conducted with students enrolled in courses taught by the authors, we found that 37 out of 41 students (90.2%) were not aware of the sustainability report released by the university (Ceccarini et al., 2023). This lack of awareness and knowledge highlights a gap that digital tools could help bridge by making sustainability information more accessible, interactive, and engaging.
Hence, to ensure active participation, students need to be informed and educated about the university’s initiatives and practices, as well as ways they can contribute to sustainability both on and off campus. Providing such information through interactive digital environments is crucial, as these tools can help reduce feelings of powerlessness and environmental anxiety, particularly among younger people (Brophy et al., 2023). Building on this perspective, our work examines how digital and interactive tools, specifically those co-designed with students, can contribute to raising environmental awareness and encouraging more sustainable behaviors.
Beyond digital approaches, place-based education (PBE) has emerged as a compelling pedagogical strategy for fostering students’ connection with nature and addressing sustainability challenges through direct, situated experiences in local environments (Gruenewald, 2003; Sobel, 2004). By grounding learning in real contexts, PBE has demonstrated effectiveness in developing environmental identity, ecological awareness, and pro-environmental values (Caiman & Kjällander, 2023). The potential of combining such experiential, place-based approaches with interactive digital tools represents a promising and underexplored direction, one in which technology can scaffold, extend, and deepen the learning that begins in the natural world (Wals, 2014).
Our study aims to answer the following research question: RQ1: Can co-design with students (who are part of the younger generation and part of our target community) help in identifying features for creating interactive systems able to raise awareness about the practices carried out by the university and improve their own sustainable behavior? and, in particular, RQ1.1: Which of these features can actually work?
To answer these questions, we designed and implemented an interactive system based on six guidelines that emerged from a co-design session with 19 students, and evaluated the prototype with the community of interest.
The findings of this study (Section 4) show that participatory design is an effective approach for identifying meaningful digital features that can support sustainability education and foster students’ engagement with complex environmental issues. Building on this, the study expands current research by outlining six key guidelines (i.e., technology, content, data producer, learning strategy, gamification, and data visualization) that should inform the design of interactive systems aimed at raising awareness and promoting education on sustainability topics.

2. Related Work

Human–Computer Interaction (HCI) research has increasingly focused on how technology can support and enhance environmental awareness and education, an area often referred to as sustainable HCI (DiSalvo et al., 2010; Dourish, 2010). Within this domain, digital tools have emerged as powerful educational scaffolds capable of catalyzing behavioral shifts and fostering pro-environmental agency in users’ everyday lives (Adaji et al., 2024; Hajj-Hassan et al., 2024). Through personalized recommendations, gamification elements, and real-time feedback, these platforms engage learners in adopting eco-friendly habits, such as reducing energy consumption or minimizing waste, while providing a digital space for informal environmental education (Bitrián et al., 2021; Soares et al., 2024). By empowering individuals to monitor their progress and reinforcing a sense of accountability, technology-enabled solutions strengthen the impact of sustainability initiatives and foster the widespread adoption of environmentally responsible practices (Dash et al., 2024; Deepthi, 2025; Uda & Basrowi, 2024).
At the same time, HCI scholarship has turned its attention toward the psychological and sociocultural barriers that inhibit sustainable action, particularly the phenomenon of eco-powerlessness among university students (Ceccarini et al., 2023; Nilan, 2017). Eco-powerlessness, defined as a sense of helplessness in the face of global ecological crises, is deeply intertwined with a lack of critical consciousness regarding one’s role within systemic structures (Kennedy & Givens, 2019). Evidence shows that lower-status participants experience more pronounced feelings of disempowerment (Kennedy & Givens, 2019), whereas pro-environmental digital awareness can serve as a transformative force to strengthen engagement (Ruiu et al., 2024). Despite high levels of awareness (Abbas & Singh, 2014), students frequently report a “knowledge-action gap,” feeling unable to make meaningful contributions to systemic change (Kleres & Wettergren, 2017; Novotnỳ et al., 2021). In this context, education must move beyond knowledge transmission to foster a critical understanding of how individual actions intersect with institutional and global challenges.
A key theoretical framework informing the design of motivational effective digital interventions is Self-Determination Theory (SDT) (Ryan & Deci, 2024), which posits that sustained intrinsic motivation depends on the satisfaction of three basic psychological needs: autonomy, competence, and relatedness (Deci et al., 1999). SDT has been increasingly applied to gamified educational systems, where research consistently shows that game elements are most effective when they jointly address all three needs rather than targeting any single one in isolation (Mekler et al., 2017; Sailer et al., 2017). In sustainability education contexts, this distinction is particularly consequential, as systems relying solely on extrinsic reward mechanics risk producing short-lived compliance rather than the reflective, values-driven engagement that ESD frameworks demand. Grounding the design of sustainability-oriented digital environments in SDT, therefore, represents a meaningful step toward fostering genuine and enduring pro-environmental agency.
In response to these challenges, HCI interventions have increasingly sought to mitigate eco-powerlessness by designing interactive systems that promote environmental education, engagement, and activism (Dourish, 2010). Gamified applications, participatory platforms, persuasive technologies, and data-driven feedback tools aim to enhance students’ sense of agency and efficacy (Ceccarini et al., 2023). Leveraging principles of user engagement (Plitt, 2019), behavioral feedback (Rossitto et al., 2022), and data-informed decision-making (Brain & Newcombe, 2015), these tools help transform eco-anxiety into proactive environmental stewardship. Integrating such strategies within sustainable HCI represents a promising pathway for enabling young adults to take meaningful action in response to global environmental challenges.
However, despite the demonstrated potential of digital tools in fostering environmental literacy, supporting behavioral change, and enhancing student engagement, existing systems often prioritize individual actions without adequately embedding them within structured educational processes. In particular, few digital interventions in the sustainable HCI domain leverage real institutional sustainability data as learning resources, nor do they integrate participatory and co-design approaches that position students as active contributors to sustainability education. This gap limits the ability of such systems to support deeper learning, critical reflection, and a sustained sense of agency, highlighting the need for educationally grounded, participatory digital environments that empower students to understand, interpret, and act upon sustainability practices within their university context.

3. Materials and Methods

In this section, we describe the multi-phase methodology adopted for this study. The process began with an exploratory phase of interviews designed to elicit participants’ perceptions and needs (Section 3.1.1), which subsequently informed the co-design activities (Section 3.1.3). During these activities, participants contributed to the development of low- and medium-fidelity prototypes. Rather than iteratively refining these prototypes into a single solution, we analyzed them to extract a core set of design guidelines. These guidelines served as the foundation for the actual system implementation, detailed in Section 3.2. Finally, Section 3.3 reports on the evaluation of the implemented system. This evaluation was not conceived as an iterative refinement; instead, it aimed to assess the effectiveness of the derived guidelines and to verify whether the vision that emerged from the co-design phase could be generalized to a broader student population beyond the original participants.

3.1. Methodology

The overall process adopted in this study unfolds across three interconnected phases: Design, Development, and Evaluation. The Design phase began with exploratory interviews aimed at understanding students’ perceptions of sustainability. Insights from these interviews, together with an examination of institutional sustainability reports and external rankings, informed a structured data analysis that served as the foundation for the subsequent co-design workshops, where participants were provided with a leaflet with a summary of the findings. The outcomes of this participatory phase guided the Development stage, in which a functional prototype was created by translating the co-designed concepts into an interactive digital solution. Finally, in the Evaluation phase, the prototype was assessed through a questionnaire administered to university’s students, enabling us to gather evidence on the effectiveness of the proposed features and to validate the design guidelines derived from the earlier stages. The process is visible in Figure 1.

3.1.1. Interviews

To explore sustainability awareness, we opted for semi-structured interviews as our primary research method. We chose this approach for its flexibility, allowing us to adhere to a set of predetermined questions while also providing the freedom to delve into any emerging topics of interest during the interviews (Corbetta, 2003). This method fosters a more informal conversation, helping interviewees feel at ease and encouraging them to discuss what they consider important (Qu & Dumay, 2011). The relaxed atmosphere of the interviews also facilitates the discussion of sensitive topics, such as critiques, authority, relationships with peers or academic staff, and even personal emotions or potentially embarrassing subjects.
Given the interview setting on a university campus and the participants being students, we decided to use a concise set of questions to maximize participation, as visible in Table 1. Thus, we conducted 36 of what we termed “quick interviews”, which comprised four key questions and concluded with a bonus request for a small drawing.
Quick interviews offer the benefit of being time-efficient for participants, allowing us to conduct interviews during students’ breaks. However, this time constraint may limit the depth of information gathered. Nevertheless, interviewees are always welcome to elaborate on any topic they feel strongly about. The primary objective of these interviews was to gain a broad understanding of students’ personal experiences with sustainable practices on campus, rather than a deeper understanding of the modalities and values behind personal sustainable practices.
For these reasons, we find quick interviews to be a suitable and effective method for this study.
Participants and Results
We engaged 36 students with different backgrounds during their break in the campus’s bar. Participants were asked to provide informed consent prior to their involvement. The consent form explained the purpose of the study, the nature of their participation, and how the collected data would be used. All data were collected and processed in an anonymous and aggregated form, ensuring that no personally identifiable information was retained. The study was conducted in compliance with GDPR regulations. The aim was to extract key insights to compile an informative leaflet. This leaflet is intended to communicate the perceived experiences of sustainability in daily campus life and illustrate how these perceptions influence personal behaviors. The interview findings, which informed the subsequent stages of this study, are extensively presented in (Ceccarini et al., 2023).

3.1.2. Data Analysis

In the second phase of our process, we aimed to equip the university community with concrete data sourced directly from the university and other external entities. These data focus on evaluating the performance of various universities in terms of sustainability and the SDGs. To provide more context, we began by identifying the SDGs highlighted through the interviews and then extracted corresponding data from official sources. This approach enabled us to develop a comprehensive leaflet. One section of the leaflet presents the community’s perceptions of the most relevant SDGs within the university and campus environment, while the other section displays official data for comparison. We utilized three primary sources for the official data. The first source is the annual official report published by the authors’ university, which details the contributions of various institutional activities towards achieving the 17 SDGs. Since 2016, the report has detailed the direct and indirect impacts of the university’s activities, categorized into four key dimensions: education, research, third mission, and institutional operations. The second source we utilized is the World University Rankings provided by UI GreenMetric1. Launched in 2010 by Universitas Indonesia, this ranking assesses the environmental sustainability and green initiatives of university campuses. It specifically evaluates six key dimensions: setting and infrastructure, energy and climate change, waste management, water conservation, transportation, and education and research.
Lastly, the third source we considered is the Times Higher Education Impact Rankings2. Starting from 2019, this ranking analyses and evaluates universities in terms of SDGs and exploits four dimensions: research, stewardship, outreach, and teaching. For the data, we considered the calendar year 2021, as it was the closest year with rankings and reports.

3.1.3. Co-Design

Following the data analysis phase, we engaged the university community in a co-design activity. As articulated by Sanders and Stappers, co-design involves the collaborative creativity of both designers and non-designers throughout the design development process (Sanders & Stappers, 2008). The primary objective of our co-design session was to develop low-fidelity mock-ups. These mock-ups were intended to represent an interactive application aimed at increasing awareness of individual contributions to sustainability on university premises. Additionally, the application was designed to inform users about the university’s existing sustainability initiatives and efforts towards achieving the SDGs.
The activity was planned to span one and a half hours and was structured as follows:
Introduction (15 min): We began by introducing the project and the session’s objectives to the participants, which included a brief overview of co-design principles and low-fidelity mock-ups. We also provided suggestions on techniques they could use to raise awareness, such as data visualization, gamification (Deterding et al., 2011), and eco-feedback. After this phase, participants were divided into five groups of three to four people.
Co-design (50 min): This phase involved the actual co-design activity, where four groups composed of 4 participants and one group made of 3 participants (19 in total) each created paper-based, low-fidelity mock-ups. To facilitate this process, we supplied the informative leaflet summarizing the information gathered from the first two steps (interviews and data analysis). Specifically, it withheld this information:
  • A summary of the interview outcomes;
  • Reports from the university, focusing on the dimensions highlighted during the interviews;
  • Information on external rankings comparable to university reports.
Presentation and Questions (5 min per group): Each group presented their mock-ups to the other participants, followed by a Q&A session to further explain their ideas and outcomes.
Participants
We recruited 19 students enrolled in the “Mobile Systems Programming” class (Bachelor’s Degree in Computer Science and Engineering). Students were asked to provide informed consent prior to their involvement. The consent form explained the purpose of the study, the nature of their participation, and how the collected data would be used. All data were collected and processed in an anonymous and aggregated form, ensuring that no personally identifiable information was retained. The study was conducted in compliance with GDPR regulations. All the information about this phase can be found in (Ceccarini et al., 2023).
Guidelines for Prototypes
The paper-based low-fidelity mock-ups have been analyzed and compared on the basis of six different categories: content, data visualization, gamification, data producer, technology, and learning strategy (Ceccarini et al., 2023). Through this categorization, we identified the core features necessary for a system designed by and for campus students to enhance knowledge and awareness about environmental sustainability on campus. In particular, six guidelines (G1–6) emerged:
  • G1: Technology. The system should make use of some kind of technology, in addition to the main application, to increase engagement and daily life usage;
  • G2: Content. The system should display information and data about all 17 SDGs to convey a more complete idea of what sustainability is (highlighting that it includes social, economic, and environmental aspects) and what can be done to improve it in daily life;
  • G3: Data producer. The system should display individuals’ data to make them aware of their impact and to mitigate feelings of eco-powerlessness;
  • G4: Learning strategy. The system should include at least one explicit learning strategy (e.g., fun facts or quizzes) to make the users learn directly through the system’s usage;
  • G5: Gamification. The system should make use of gamification strategies as a way to engage the community, exploiting a sense of competition between individuals;
  • G6: Data Visualization. The system should make use of data visualization techniques to make the data easier to understand.
These features directed the development of our system, which is detailed in the next Section 3.2. The co-design session also highlighted the necessity to address sustainability awareness on two fronts: (i) what the university has done and is currently doing for each SDG; and (ii) what each member of the community can do in daily life to improve sustainability inside and outside the campus premises and to promote a more responsible and sustainable behavior.

3.2. The System

Taking into account the established guidelines and the objectives identified during the research process, a system was developed and subsequently evaluated (see Section 3.3). This section provides a detailed analysis of how each guideline aligns with the twofold objective identified earlier.

3.2.1. G1: Technology

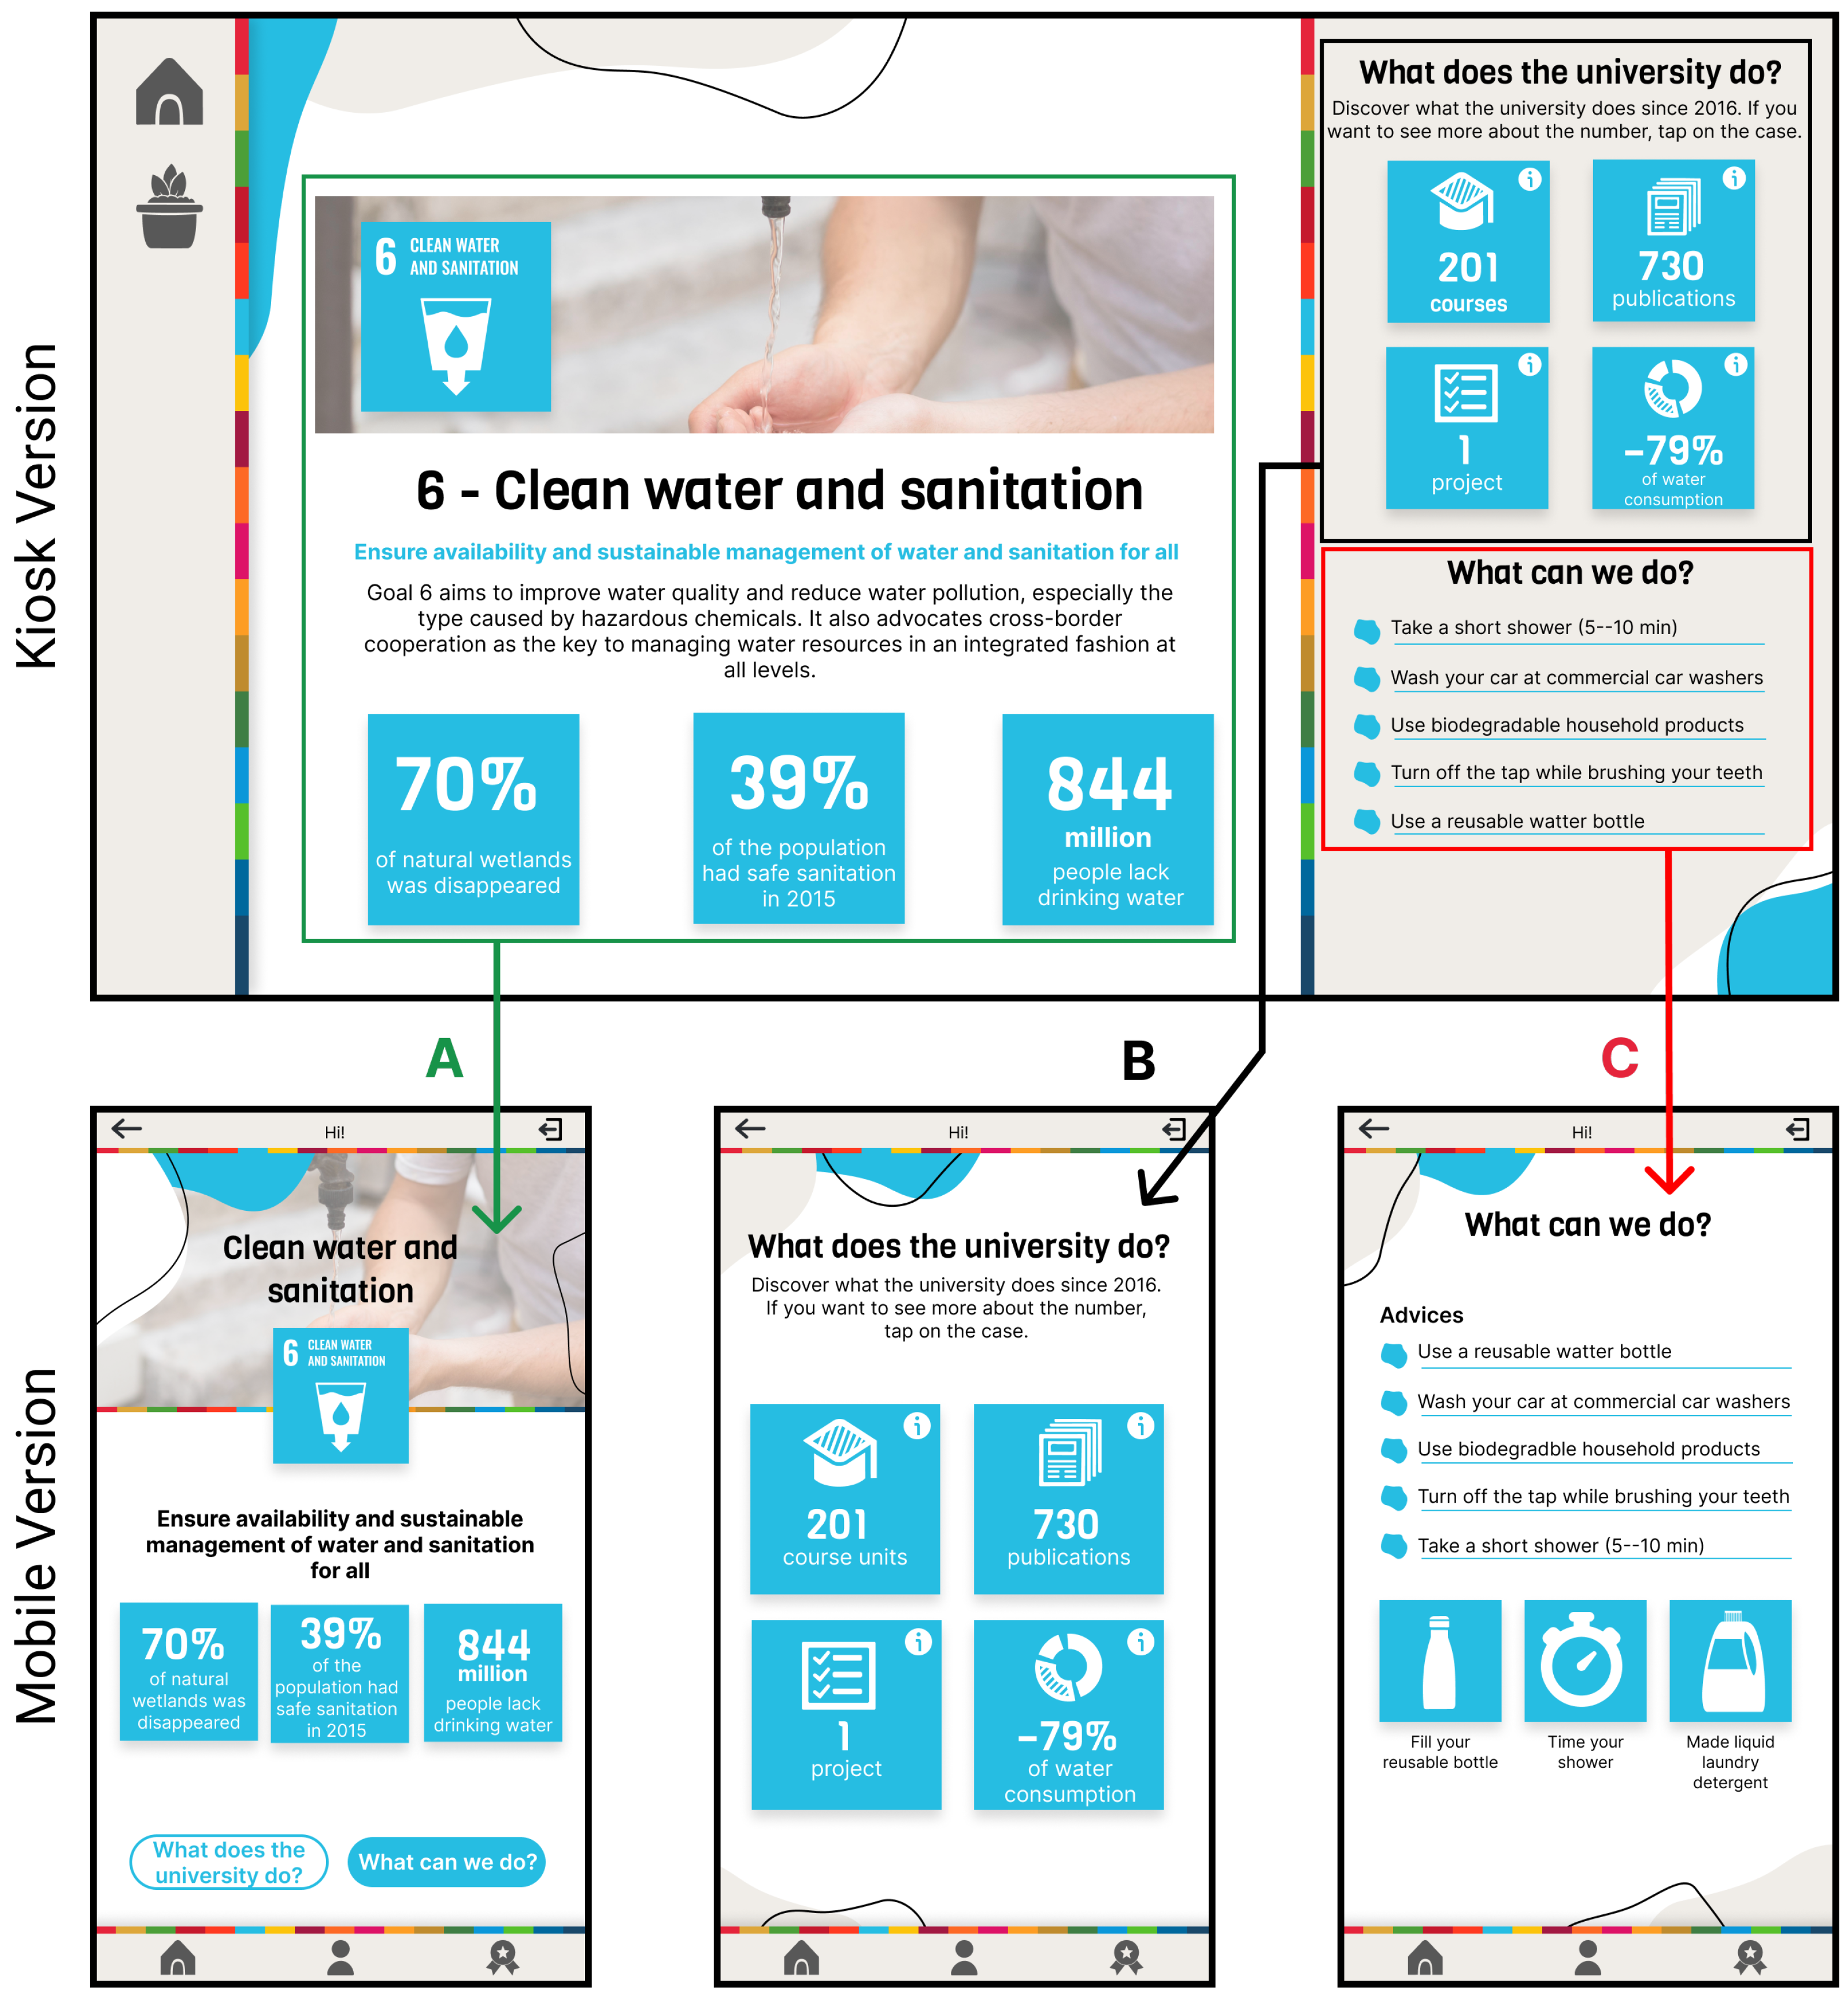
Considering the technological aspect derived from G1, we opted for a solution that integrates a public display version and a mobile version. We chose these two versions for their intrinsic nature. The public display, situated at the entrance of the campus, allowed us to have a public visualization accessible to everyone. This visualization has all the basic information (as shown in the upper part of Figure 2), allowing each community member to learn something about (i) the SDGs, (ii) what the university is doing, and (iii) what they can do in daily life. The advantages are twofold. On the one hand, the users do not have to install anything to have the basic information, and, on the other hand, based on its position, it can reach a larger population, which can casually explore the visualization.
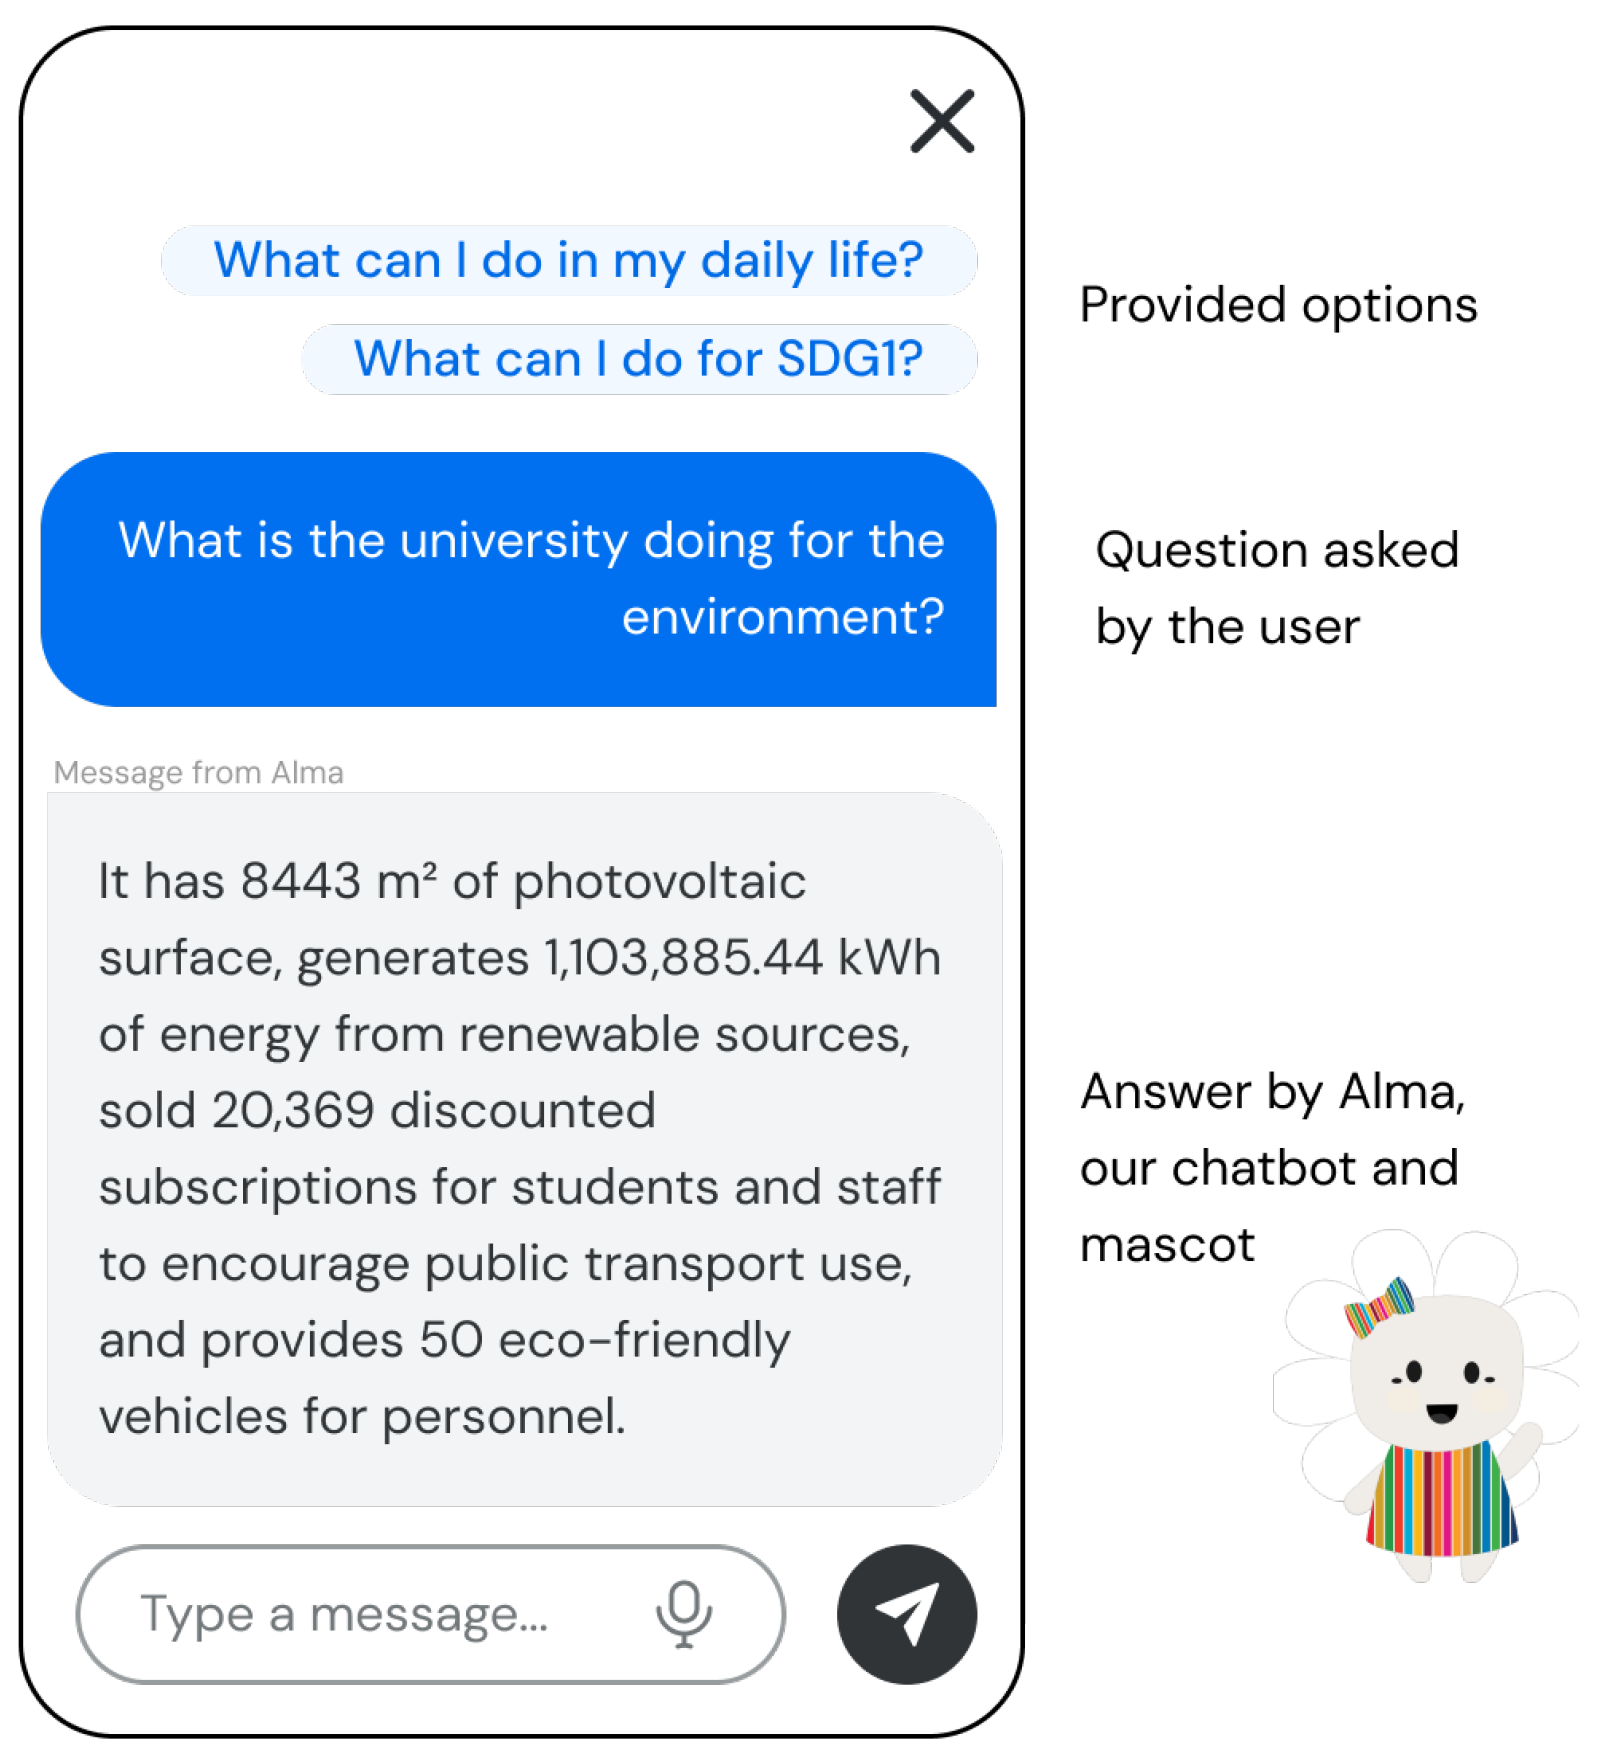
On the contrary, the mobile version is a way to uniquely target a community member and increase their engagement through techniques connected to gamification and data humanism, with the final aim of promoting a more responsible and sustainable behavior both inside and outside the campus premises. As visible in the lower part of Figure 2, the mobile version has all the information provided by the public version in order to always have that information at hand, but, at the same time, it provides some tasks that the user has to complete to obtain a badge. Moreover, following a suggestion that emerged from one of the groups, we also integrated a chatbot feature capable of conversing with the university’s sustainability reports (PDFs). This addition leverages emerging natural language processing technologies to enhance user engagement, enabling community members to explore the sustainability documents in a more accessible, conversational, and personalized manner. Building upon this idea, we designed a complete pipeline for transforming the university’s sustainability reports into a machine-interpretable format: each page of the PDF is converted into an image and processed through a multimodal language model able to interpret textual, graphical, and structural components, thereby producing coherent and structured outputs. In particular, we employed Google’s Gemini model, specifically the gemini-2.0-flash variant, which offers low-latency inference and stable performance while remaining accessible through a free API tier, thus supporting a scalable and fully automated workflow without requiring high-end local hardware. Cloud-based inference was preferred over running a local large language model (LLM) through platforms such as Ollama or LM Studio, as local execution would have required significantly more computational resources and would have resulted in processing times of several minutes per page, in addition to the accuracy degradation associated with quantized models. Each page is processed together with a carefully engineered prompt that defines extraction rules, constrains the JSON output structure, and instructs the model to focus exclusively on relevant quantitative information, helping reduce inconsistencies and formatting variability. The resulting data are then aggregated into a unified representation that feeds an interactive application through which users can access visual summaries and initiate conversational queries. Within this environment, the chatbot interprets natural-language questions, identifies the most relevant topics from the extracted dataset, and generates context-aware explanations that may include dynamically generated charts, as shown in Figure 3. The conversational component of the system is implemented using a pre-trained LLM, specifically a vision-capable model (named Gemini 2). While LLMs provide significant advantages in terms of flexibility and natural language understanding, their use raises well-known concerns regarding the generation of inaccurate or “hallucinated” information. To address this limitation, the proposed system adopts a grounded architecture in which the chatbot does not directly access the original PDF documents, but instead operates on a structured dataset obtained through a dedicated extraction pipeline. In particular, the extraction process converts each report’s page into images and processes them to produce structured JSON outputs, which are subsequently aggregated into a unified data repository. This separation ensures that all information used by the chatbot is explicitly derived from the source document and can be verified independently. Furthermore, the use of constrained prompt engineering, low-temperature settings, and predefined output schemas reduces variability in the extracted data. A manual validation phase is also included to ensure the correctness of critical indicators, exploiting a human-in-the-loop Validation. Within the chatbot, responses are generated by conditioning the LLM on the structured data only, effectively limiting its role to interpretation and contextualization rather than fact generation. Hence, the chatbot is prompted to answer only using the available structured data and to avoid speculation when information is missing. This integration of automated PDF data extraction with conversational interaction not only improves the navigability and comprehension of the reports but also demonstrates how advanced AI-driven tools can support transparent and inclusive communication of sustainability information. To further support users, especially those less familiar with conversational interfaces, an initial set of example questions has been integrated into the interface, helping them start the interaction and discover the range of possible queries. This integration of automated PDF data extraction with conversational interaction not only improves the navigability and comprehension of the reports but also demonstrates how advanced AI-driven tools can support transparent and inclusive communication of sustainability information.

3.2.2. G2: Content

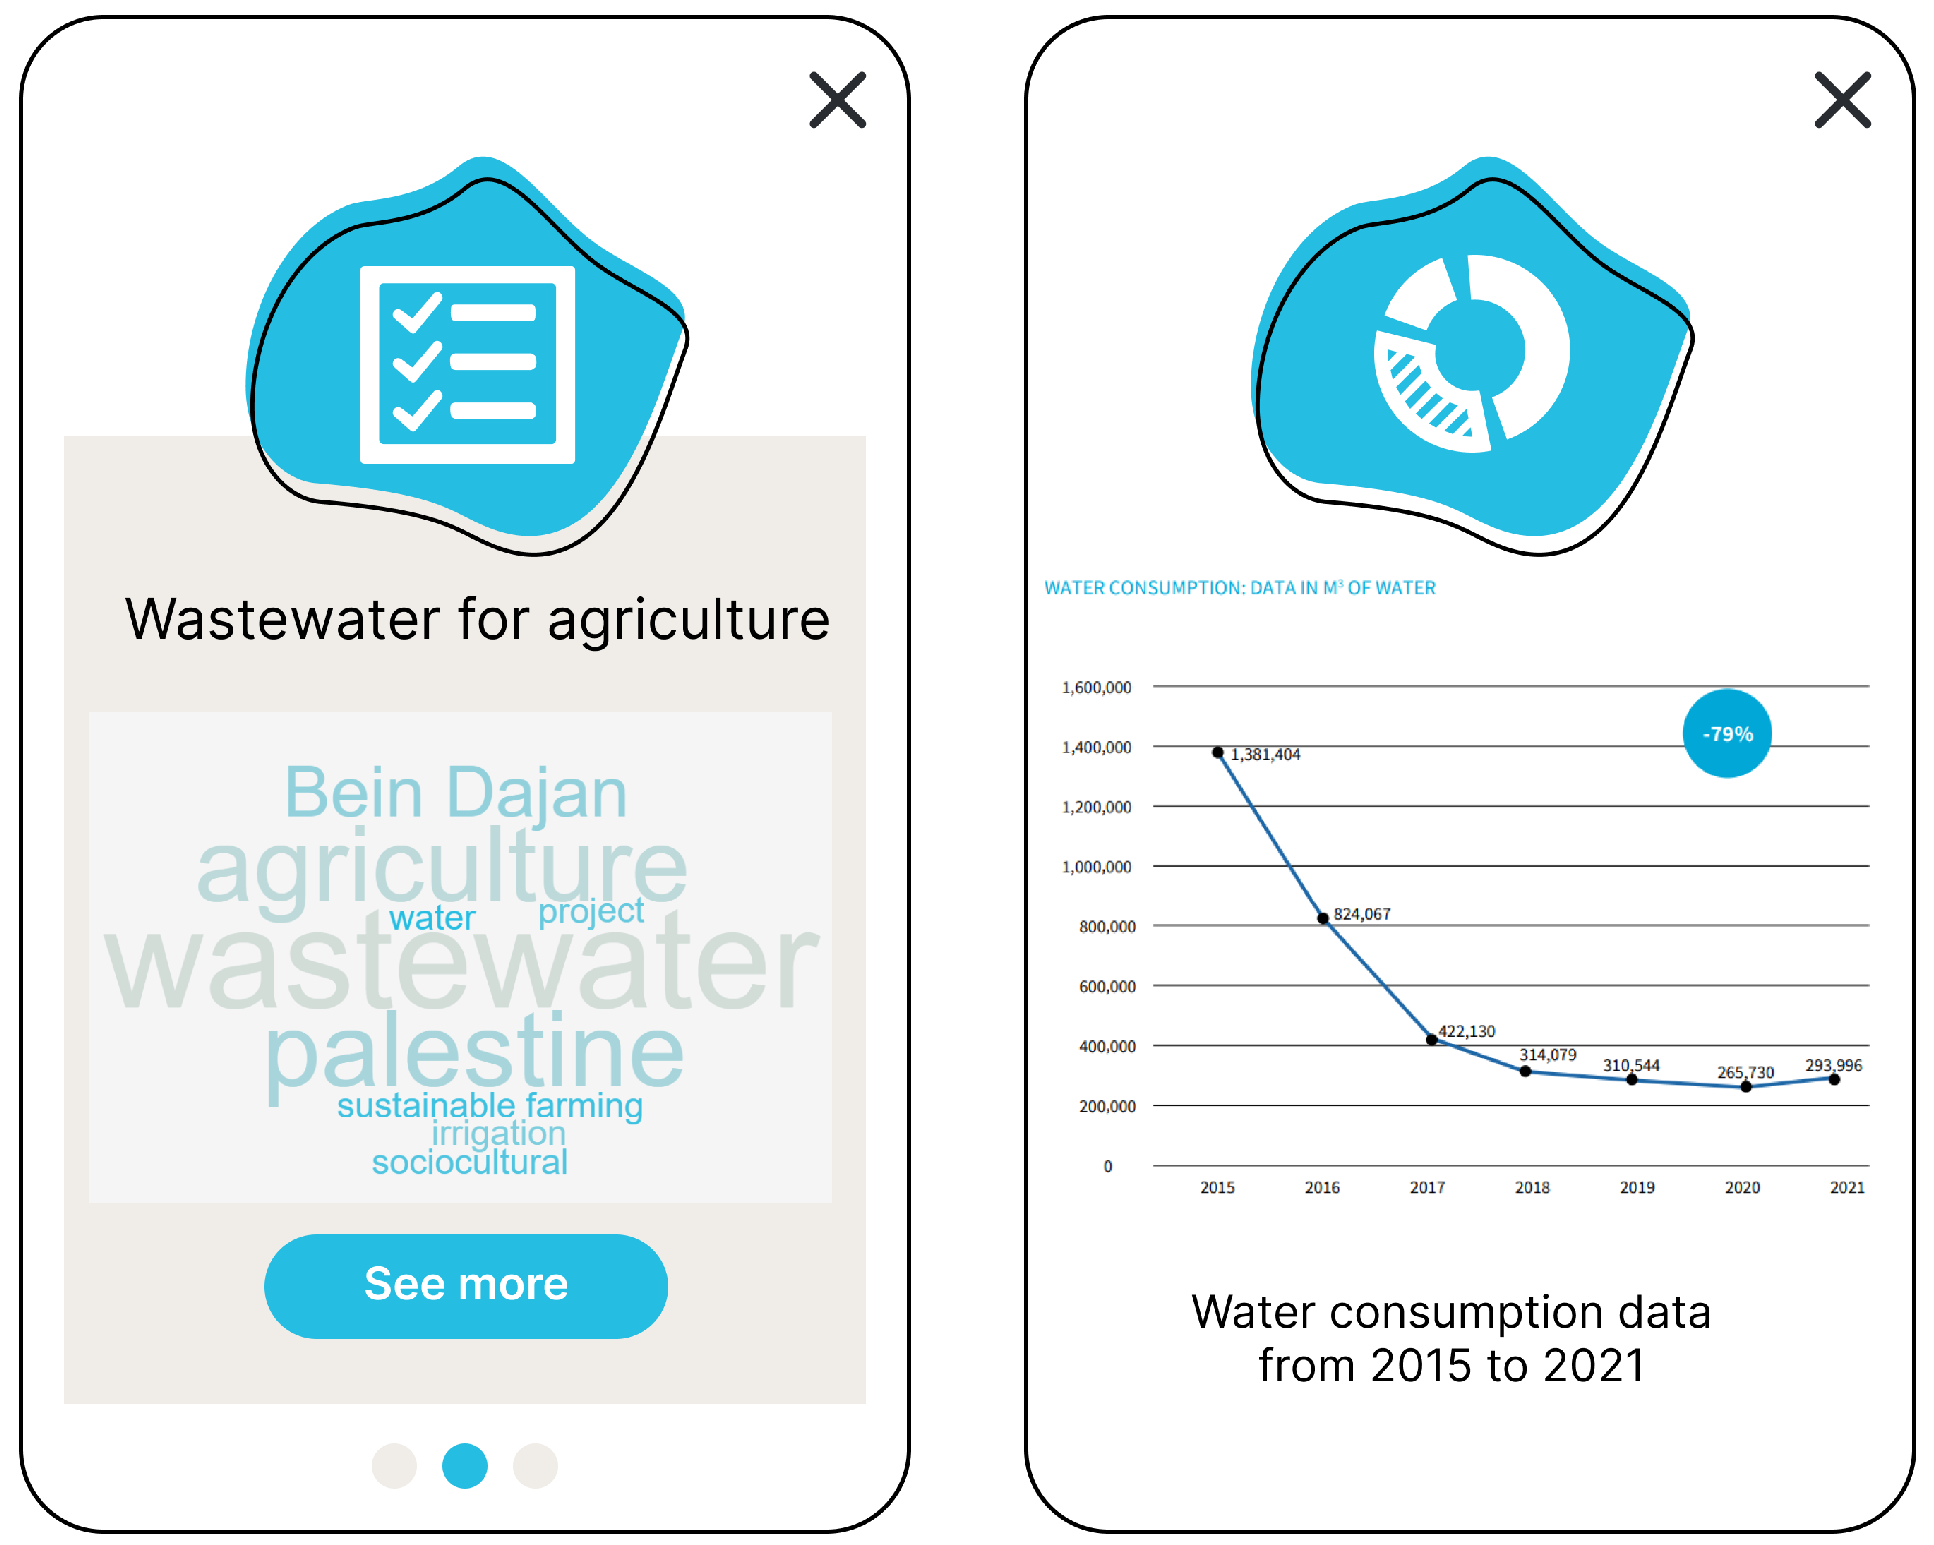
There is a tendency to identify sustainability as a monolithic concept, often identified with just the environmental sphere. As emerged from the interviews we conducted during a preliminary phase of this study, the word “sustainability” was strictly linked to Earth and the environment, conscious consumption, and renewable energy, often ignoring the economic and social sphere. Hence, in our system, we decided to include all 17 SDGs to display all the different facets of sustainability. For each one, we arranged an explanatory section (part A in Figure 2) with a few lines of text to introduce the SDG and its main goal and three key numbers to make people reflect on its importance. All the data and information displayed are from the United Nations’ official site about SDGs (United Nations, 2015). Moreover, since sustainability is something that can be achieved at different levels, from the “upper” level of bigger organizations or universities to the “lower” level of individuals, we structured our system’s interface in a way that is able to display: (i) information on what our university is doing for each SDG, shedding light on the reports released each year (part B in Figure 2), and (ii) advice to accomplish a sustainable behavior in relation to each SDGs (part C in Figure 2). This advice is strategically designed to bridge the gap between different spheres of a student’s life, since they are not restricted to the campus environment; they also target the personal life context, such as the home and the city. For instance, while some prompts encourage in situ learning through campus-specific activities, others guide users toward adopting sustainable habits in their daily routines outside the university. This dual focus aims to foster a holistic transition toward sustainability, ensuring that the behavioral change triggered by the system generalizes across multiple social and physical contexts. Considering the university section, we analyzed the report released and selected four types of data that reflected the complexity of this kind of institution, which revolves around teaching, research, third mission, and the institution. For the teaching aspect, we displayed the number of courses related to that specific SDG. These data came from a survey conducted by asking all professors about the link between their course units of a study program and the SDGs. For the research side, we selected the total number of publications taken from the Scopus database, considering all articles since 2016 that contain a specific sequence of keywords (related to each SDG) and an author affiliated with the university. For the third mission, we selected the number of cooperation and social engagement projects active, providing some information in the form of a word cloud for each of them, to convey a general idea to the user. Finally, for the institution part, we selected a key number indicating what the university (institution) has done in order to achieve that SDG (e.g., reducing water consumption for SDG 6).

3.2.3. G3: Data Producer

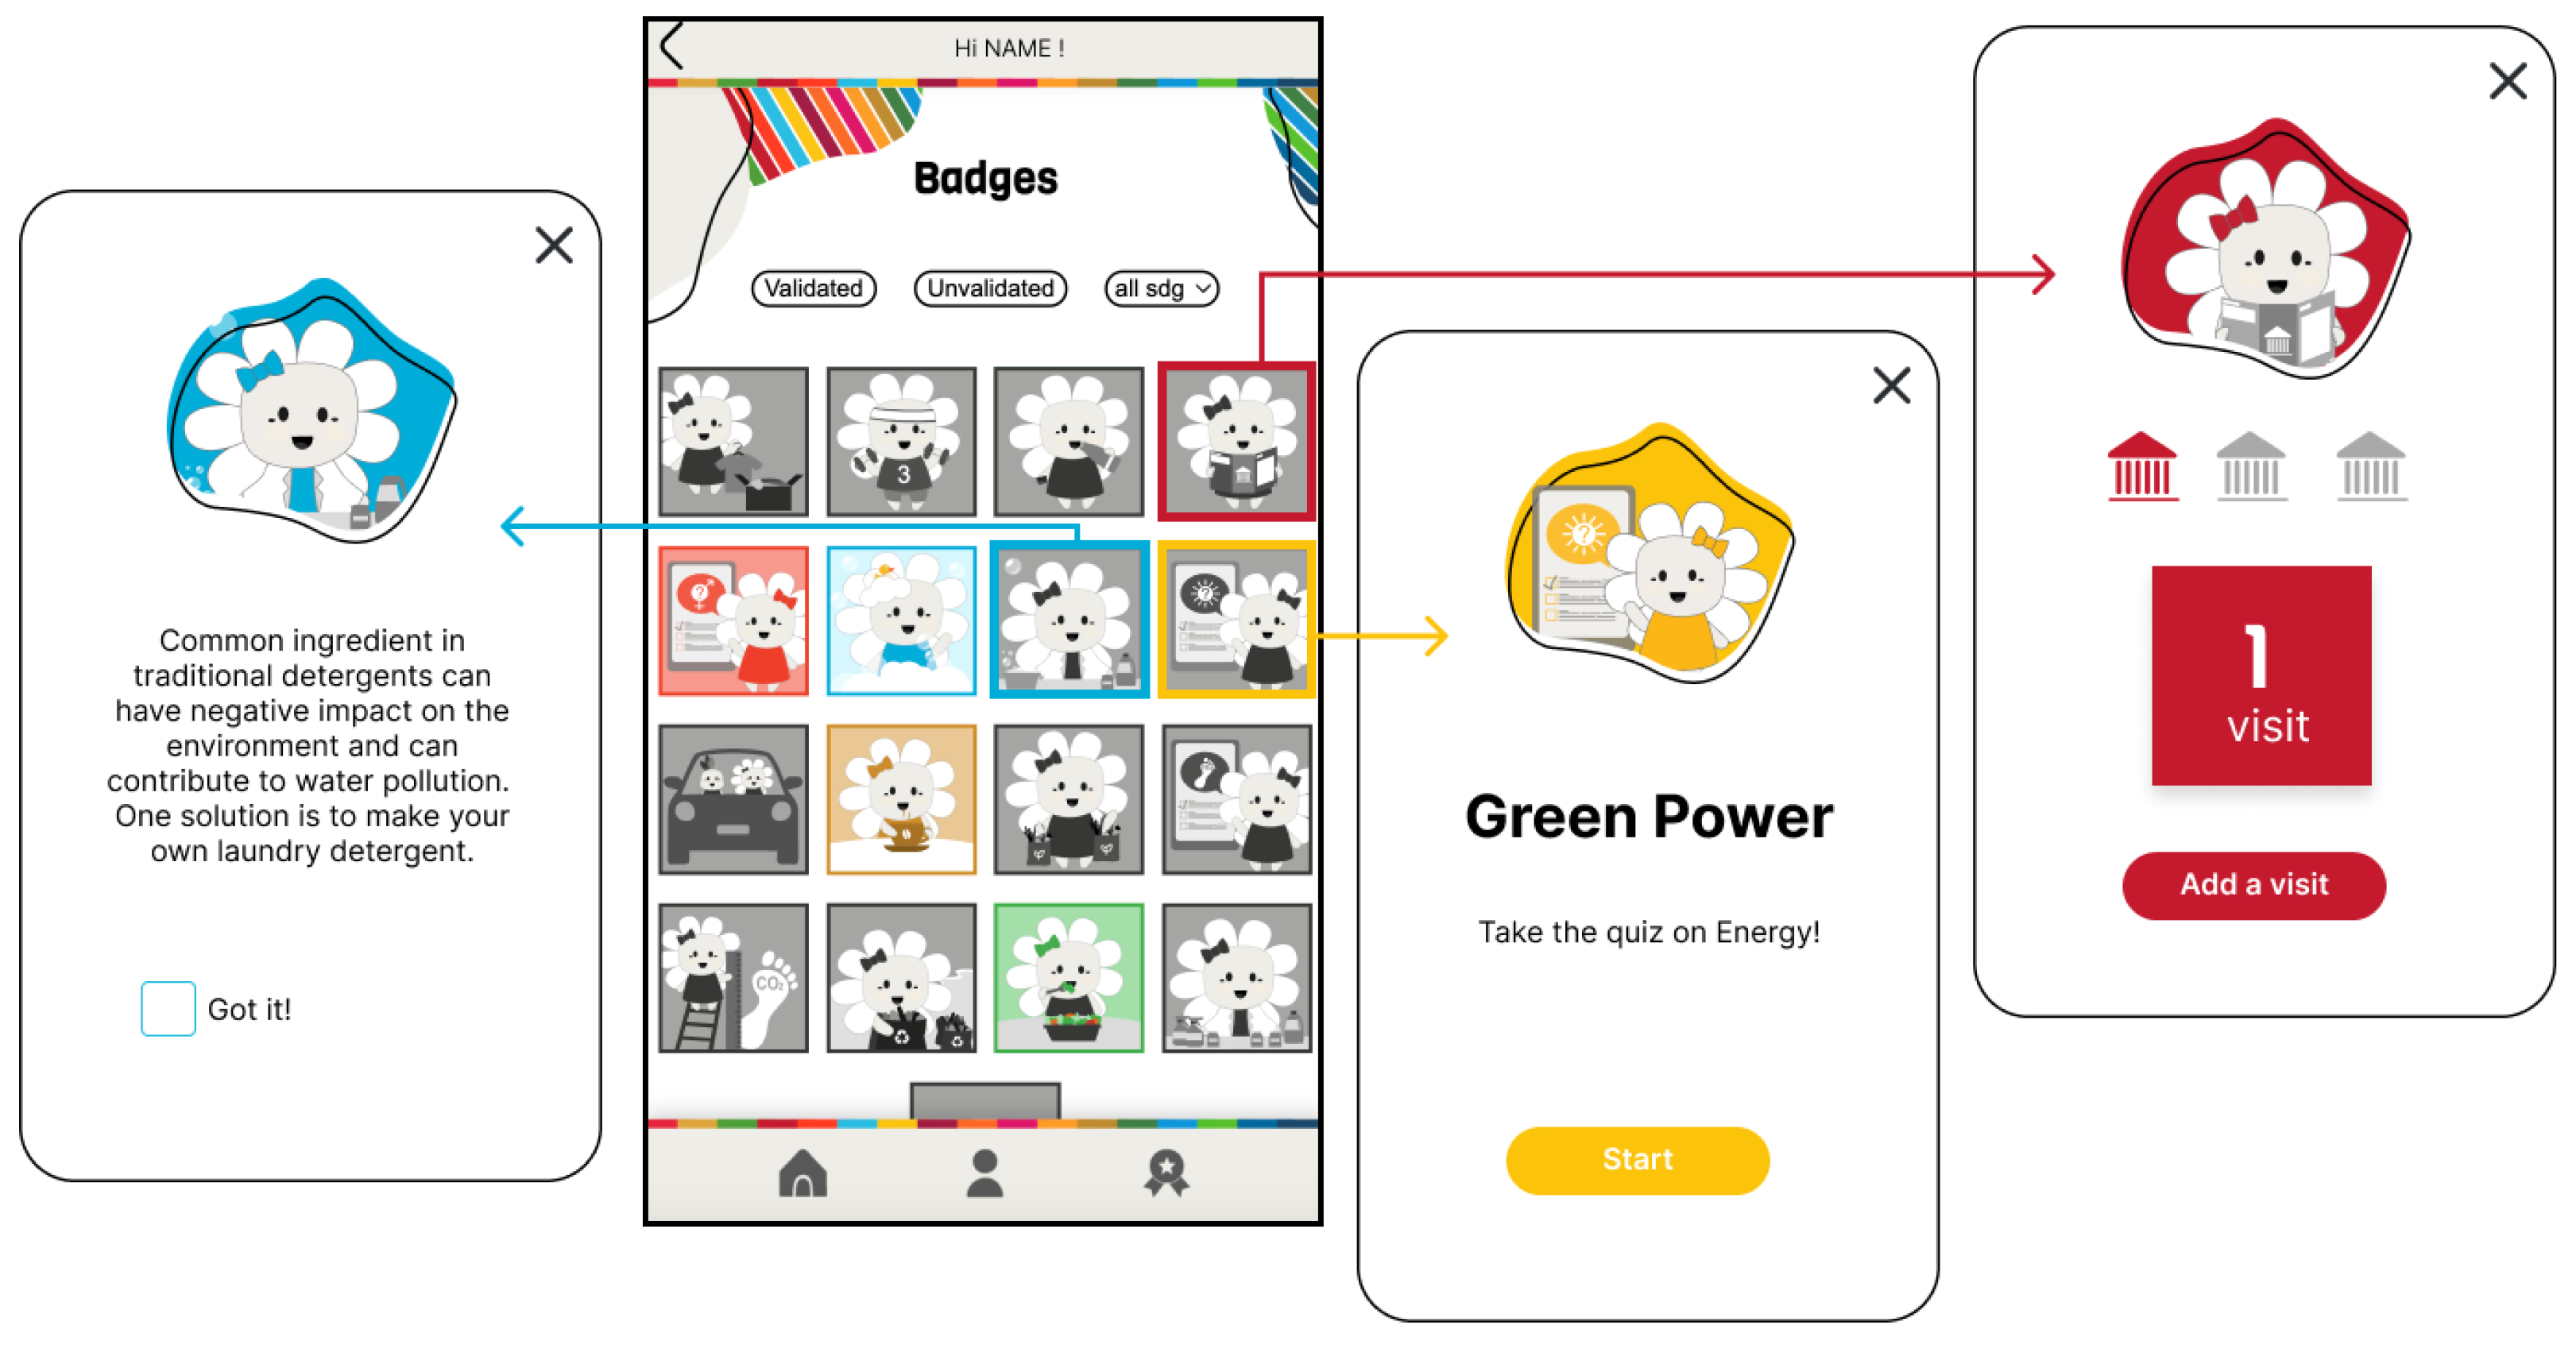
The third guideline is partially connected with the previous one. In this case, the focus is on the users themselves, who will be the data producers for a section in the app, and their impact in relation to sustainability and SDGs. Since the attention is on the individual user, we included this section only in the mobile version of the system (visible in the lower part of screenshot C in Figure 2). In particular, we asked the users to complete certain tasks (e.g., fill their reusable water bottles or put a timer on their shower). We identified three kinds of tasks, as visible in Figure 4: (i) a practical activity that should be done (e.g., go to a museum or reuse a water bottle), (ii) answer a questionnaire to test their knowledge on the topic (e.g., green power) and the connection with the topic and their daily life, and (iii) read a fun fact on a topic (e.g., the negative impact of common detergents). The first two types of tasks will be the source of the individual data we will display in the application to make the users more aware of their impact. We had two reasons for choosing the tasks as a form of data production inside our system. Firstly, we aimed to create practical and achievable tasks that people can incorporate into their daily lives to help them improve their behavior. Secondly, we wanted to address the feeling of eco-powerlessness that people often experience when it comes to sustainability issues. By completing these tasks, people can see that they have the ability to make a positive impact on the environment in their own small way. The tasks that appear in the mobile application are strategically designed to be completed in the campus environment and in the personal life context of the students, such as the home and the city. For instance, while some prompts encourage in situ learning through campus-specific activities, others guide users toward adopting sustainable habits in their daily routines outside the university.

3.2.4. G4: Learning Strategy

In line with the fourth guideline, in our final prototype, we included two explicit learning strategies in the form of quizzes and fun facts (as shown in Figure 4). Based on what emerged in the previous co-design session, almost all the groups that participated in the activity exploited fun facts or some sort of hint to inform the users about sustainability notions and curiosities that can create the desire to improve their daily behavior. Moreover, we added some quizzes to make the users learn in an interactive and engaging way. We believe the system can be utilized as a powerful educational tool to inspire users to make sustainable choices and act responsibly in their daily lives. By using the system, we want users to gain knowledge and insights to make well-informed decisions that will have a positive impact. Our system recognizes the importance of individual user knowledge, which is why we have included these two learning strategies in the mobile version. This ensures that users have access to personalized information relevant to their needs. On the other hand, the kiosk version only displays “static information” (i.e., the general explanation of SDGs, information on the university’s work, and the advice, as visible in the upper part of Figure 2), which is suitable for more general purposes.

3.2.5. G5: Gamification

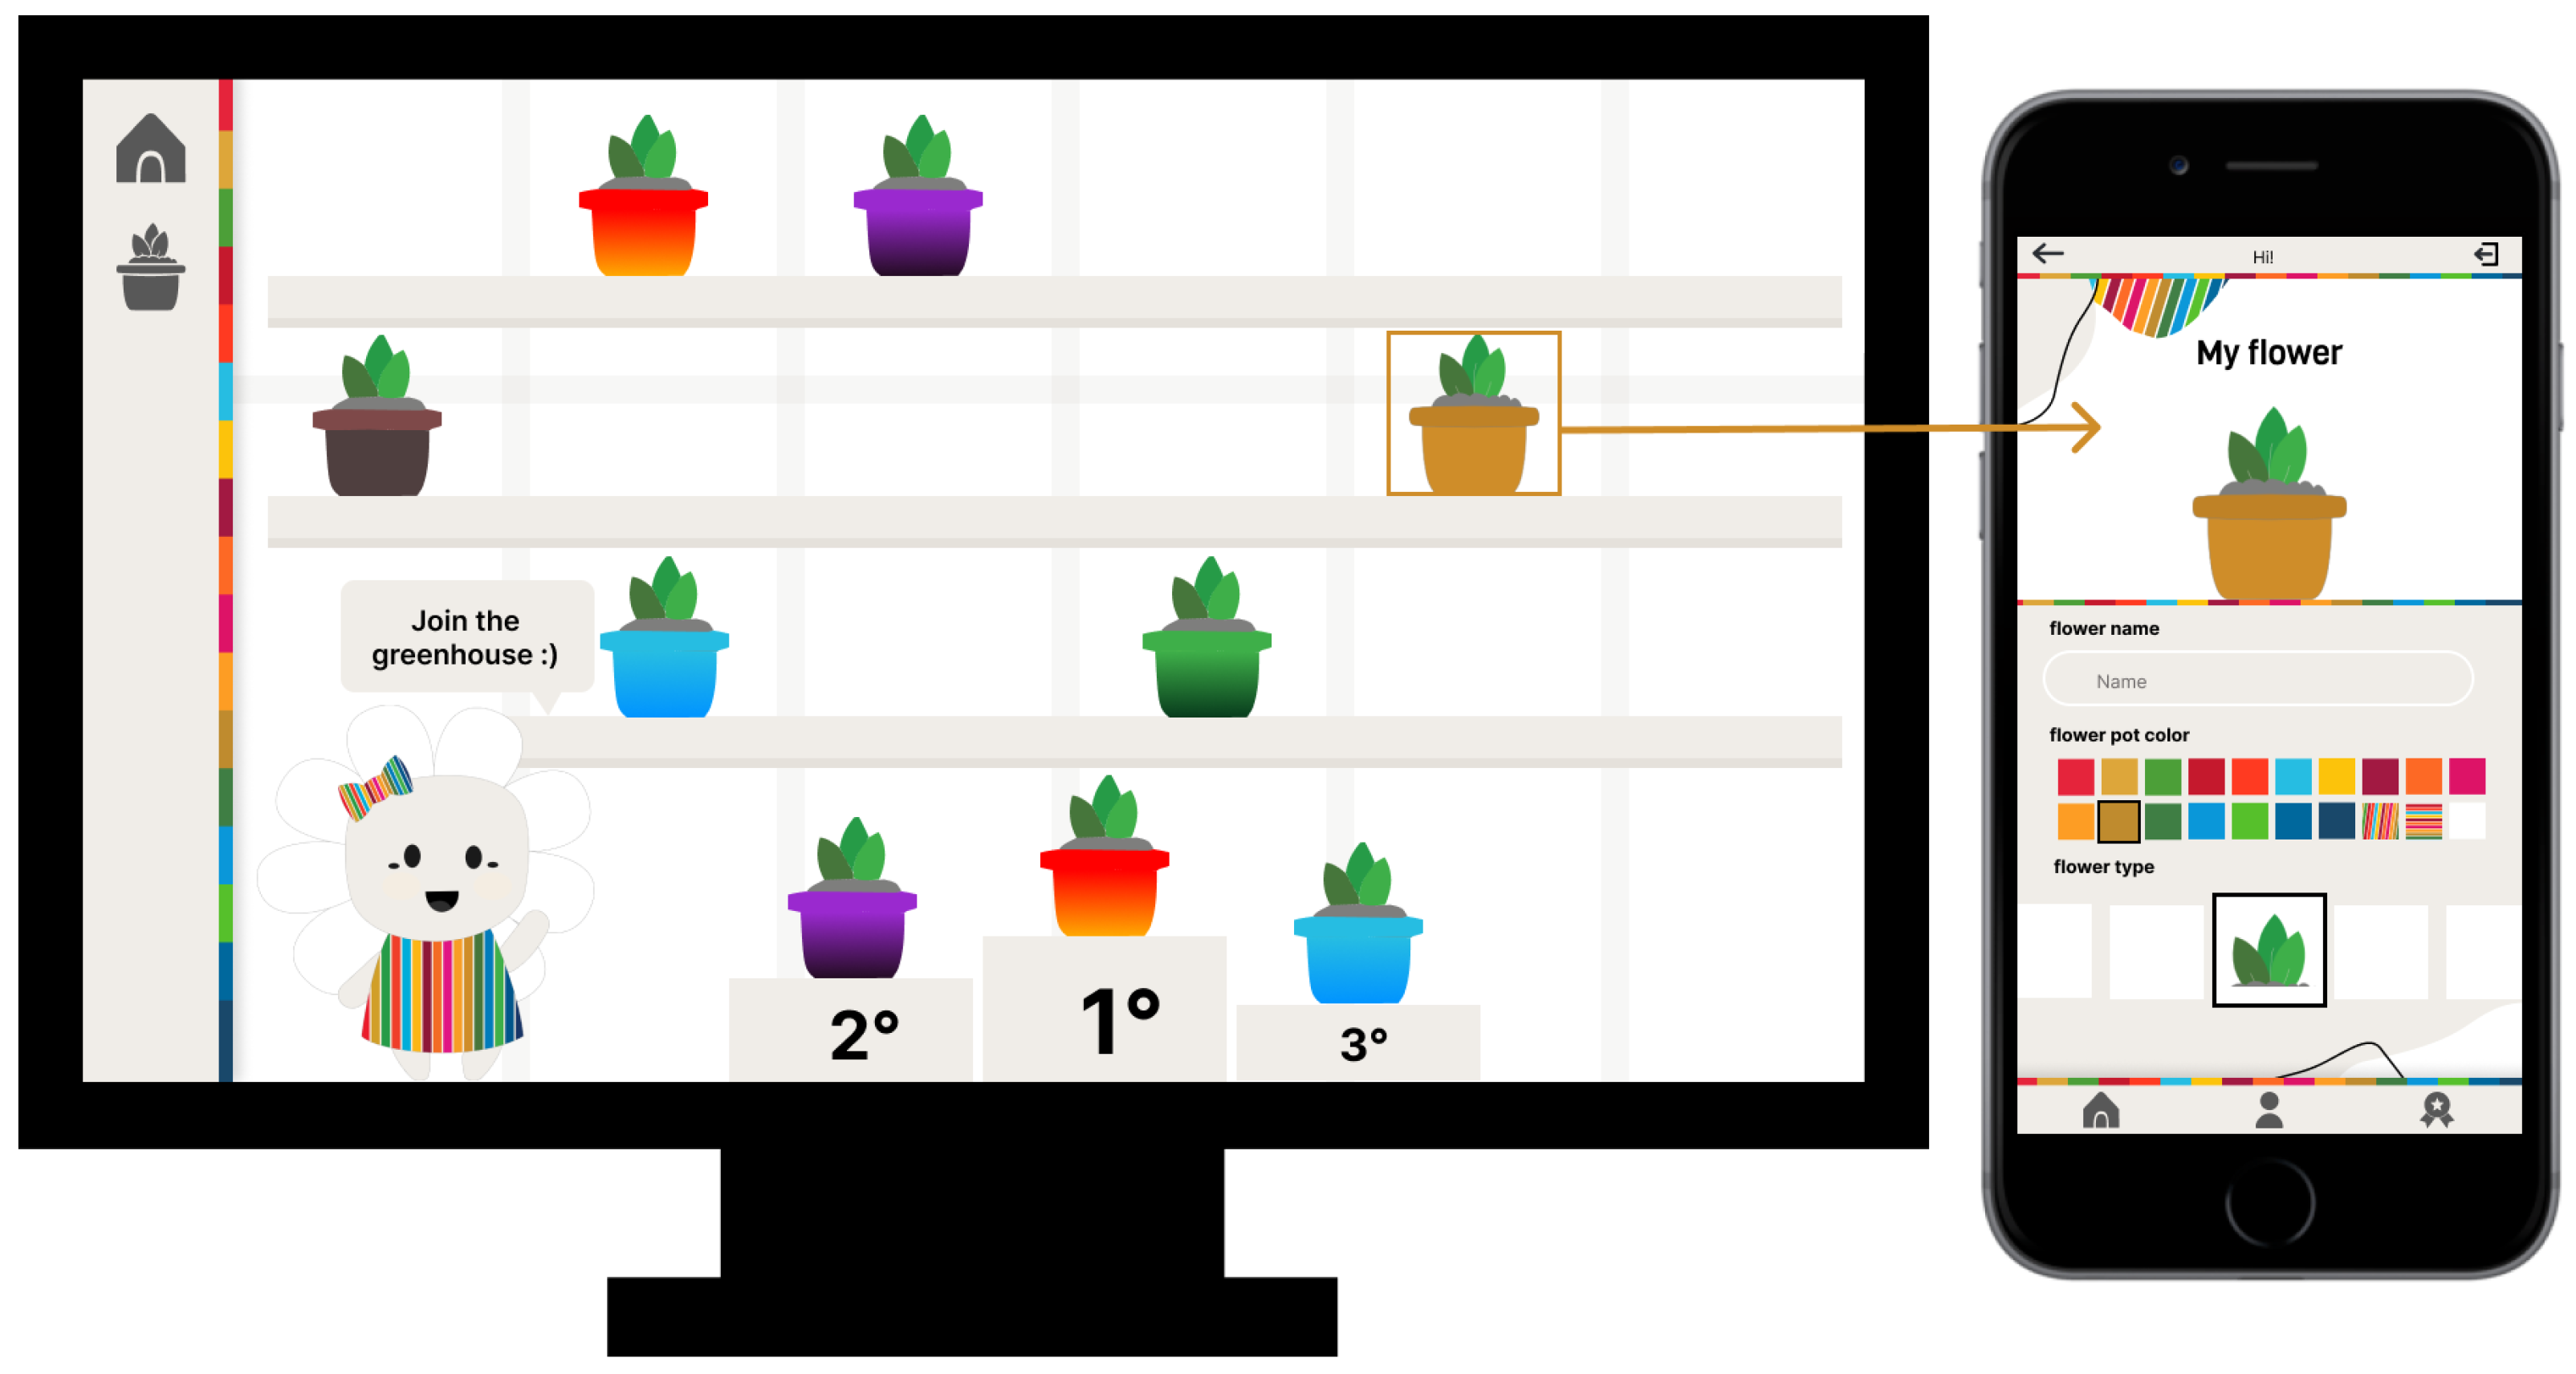
Based on the insights from the co-design session, we have identified four main gamification elements that can drive user engagement and enhance the overall experience. These elements include a ranking system, badges, and avatars, all of which leverage different psychological mechanisms and motivations. Inspired by the taxonomy made by Schöbel et al. (2020), we exploit the leaderboard as intrinsic motivation in the sense that the users will do something not for an expected outcome but for the pleasure or interest it brings. Moreover, leaderboards also rely on the sense of competitiveness with other users who are members of the campus community. We decided to include only the best three positions in the leaderboard (visible in Figure 5). On the contrary, we exploited badges as an extrinsic motivation, where the users are forced to do something to obtain an outcome (a badge). All of our badges have a regular degree of surprise, in the sense that all of them are visible on the badge board inside the mobile version of the system (as visible in the second screenshot in Figure 4). Although we implemented both static and developing badges. The static badges (e.g., reading the fun fact on detergent or answering the green power quiz in Figure 4) are obtained for doing quizzes or one-time actions. On the contrary, the developing badges are obtained after doing a positive action a number of times (e.g., going to a museum three times). Finally, we included an avatar, in the form of a plant with its pot, to represent each user. The avatar relies on intrinsic motivation and, in our case study, we exploit a developing user avatar, where the avatars became the visualization for the user’s progress in the system. As a matter of fact, the users can personalize their plants and plots. In particular, the users can change the color of the plot by choosing between the 17 solid colors of the 17 SDGs and some colorful textures. The color is unlocked based on the badges earned: once the users complete all the tasks for an SDG, its color is unlocked and can be used for the plot. Moreover, the users can personalize the plant, choosing between different kinds of leaves and flowers. This personalization is linked to the number of badges earned: by increasing the number of completed tasks, the users increase the possibilities of choice.

3.2.6. G6: Data Visualization

As our system wants to convey a lot of data and information, we included different kinds of data visualization techniques to make them more understandable and insightful for the final user. In particular, we decided to exploit a word cloud to synthesize the description of the different projects carried out by the university, highlighting the most important keywords to give the users a general idea at first sight. At the same time, for some SDGs, we have some historical trends to provide more details instead of just a key number. For example, going back to Figure 2, we implemented a click on the block “−79% of water consumption” that will show a line chart displaying water consumption data from 2015 to 2021 (the year of the last report released at the time of the study, due to the long release times of the report itself). Both the visualizations are visible in Figure 6, and the users can see them through a click on the relative block to gain an explanation (the two lower blue blocks in Figure 2B). Finally, we exploited the plant and the plot as a form of data visualization, in line with the data humanism concept (Lupi, 2017) to show the progress of the users and their positive behavior and impact, thanks to the actions undertaken: the more the plant is personalized and thriving, the more the user has done good deeds. All the data visualizations produced are visible in both the mobile and kiosk versions.

3.3. Evaluation

To address our RQs and investigate the effectiveness of (i) the guidelines extrapolated from the co-design session and (ii) our prototype, we designed an evaluation in two phases. The first was the direct interaction with our prototype, and the second was an online questionnaire addressed to the university community to gain both quantitative and qualitative data.

3.3.1. Interaction with Our Prototype

First of all, we made the participants interact with our prototype (both the kiosk and the mobile version) using Maze3. In particular, we created some tasks to guide their interaction and make sure that they will discover all the sections of our system. For both the kiosk and the mobile version, we asked the participants to:
1.
learn more about SDG 6;
2.
discover more about the course number and how this number is calculated;
3.
discover more about the number of publications and how this number is calculated;
4.
discover more about the projects;
5.
discover more about the water consumption trend based on the university policies.
After that, for the kiosk version, we focused on the plant and the greenhouse. In particular, we asked the participants to explore the greenhouse and discover more about the user who is currently in second place on the leaderboard. For the mobile version, we focused on the user, making the participants discover more about the task they should complete in order to obtain badges (like “time your shower”), their user’s profile, their plant with the options to customize it, and the badges page.
Once all the tasks were completed, we redirected the participants to our questionnaire.

3.3.2. Online Questionnaire

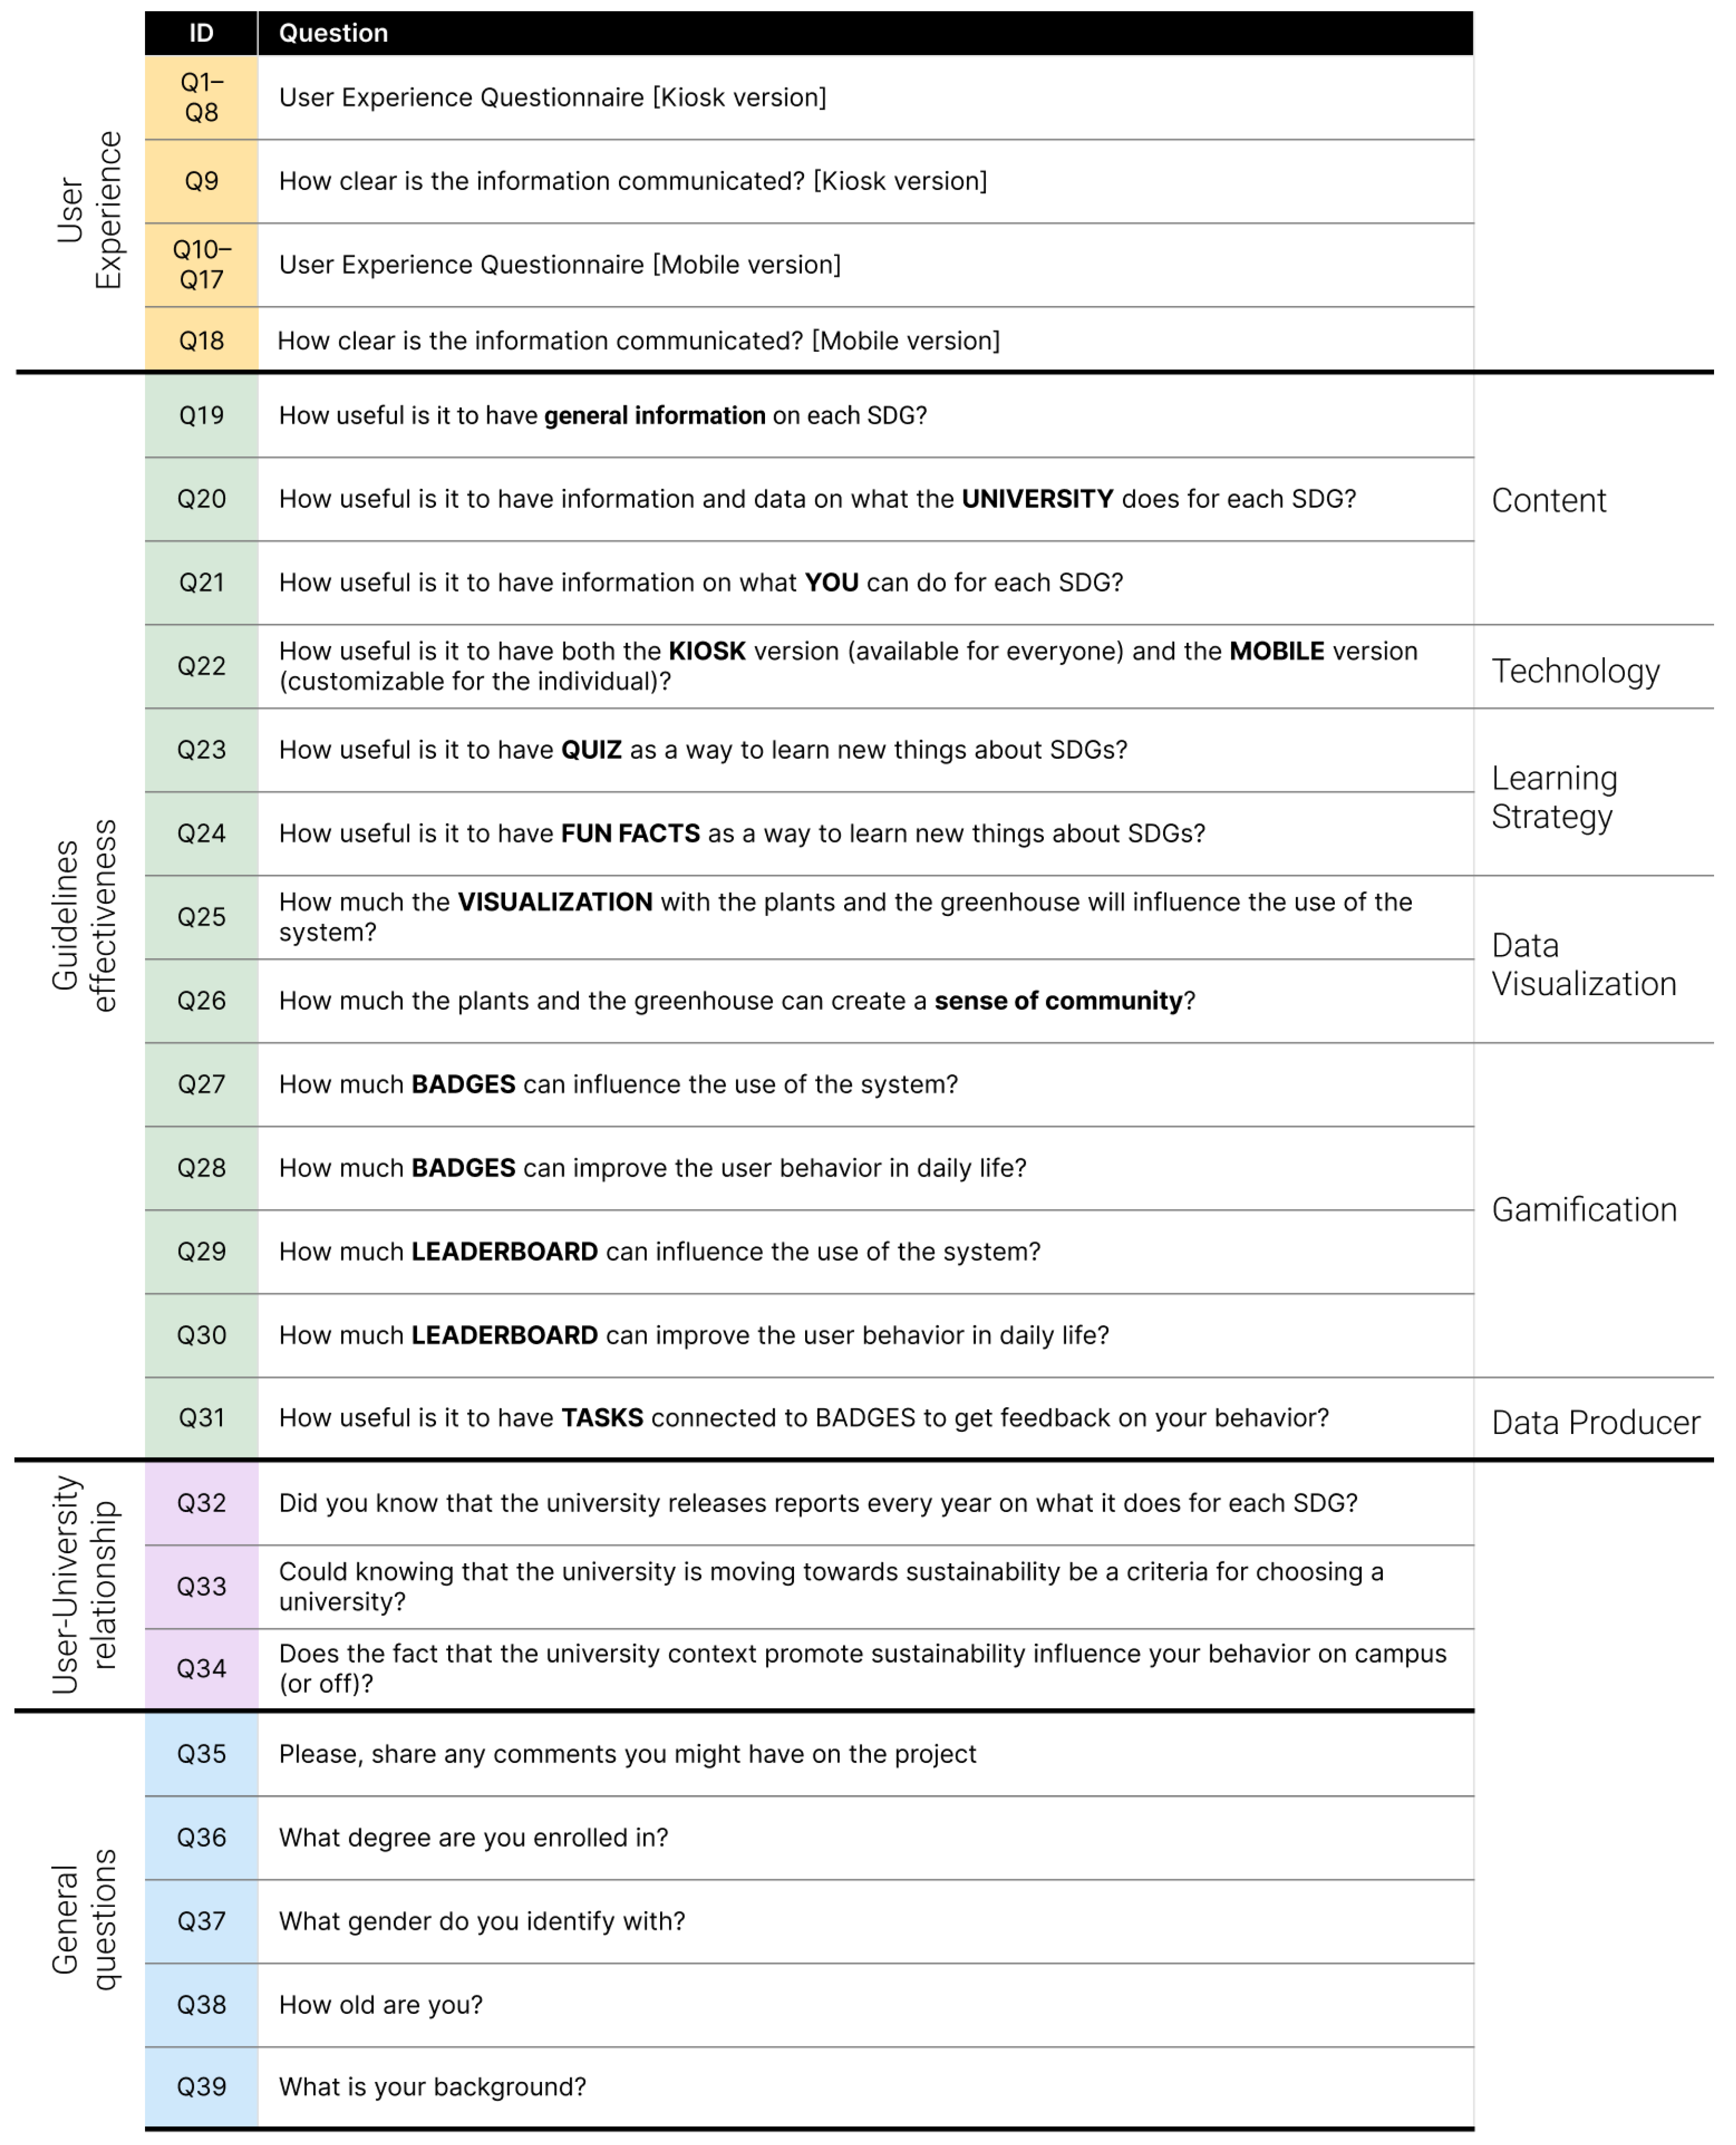
Our online questionnaire consisted of four sections, as visible in Figure 7. Prior to its distribution, the questionnaire underwent a preliminary pilot phase with a researcher to refine the wording and validate the overall structure before the formal data collection.
Section One: User Experience
In the first section, we investigated the user experience in both the kiosk (Q1–Q8) and the mobile version (Q10–Q17). In particular, we exploited the short version of the User Experience Questionnaire (UEQ-S), which consists of eight 7-point Likert scale questions to evaluate pragmatic and hedonic quality (Schrepp et al., 2017). The pragmatic interaction qualities encompass the product’s capacity to effectively assist users in completing their tasks, its ease of use, which includes intuitive navigation and user-friendly features, its efficiency in enabling users to achieve their goals in a timely manner, and its ability to provide clarity and minimize confusion in the user experience. The hedonic qualities refer to the emotional and experiential aspects of user interaction with a system, rather than its ability to help users achieve specific goals. Specifically, the questionnaire aims to evaluate the level of excitement and interest elicited by the system, as well as how cutting-edge and inventive the users perceive the system. Finally, to complete this section, we included two questions (one for the kiosk version and one for the mobile) related to the clarity of the information communicated (Q9 and Q18).
Section Two: Guidelines Effectiveness
In the second section, we focused on testing the effectiveness of the guidelines extrapolated from the co-design session by exploiting a 5-point Likert scale. In particular, focusing on the system’s content (G2), we wanted to verify the benefit of displaying (i) general information about each SDG to give a context for our system (Q19), (ii) information and data on what the university is doing toward sustainability (Q20), and (iii) information on what an individual can do to improve its behavior in terms of sustainability (Q21). Then, we focused on the technological aspect (G1), asking an opinion on the usefulness of having both a kiosk version, which will be made available for everyone at the entrance of the campus, and a mobile version, which will be customizable for the individual (Q22). Concerning the learning strategy (G4), we included two questions on the effectiveness of quizzes and fun facts as a way of learning new things (Q23–Q24). For the guideline on gamification (G5), we investigated the influence of badges and leaderboards on the system’s usage (Q27 and Q29) and on the improvements in users’ behavior (Q28 and Q30). Concerning G3 (“data producer”), we did not include any particular question, but we exploited a combination of the previously mentioned questions, and, in particular, Q21 and Q27–Q31. As a matter of fact, the way for the individual to “produce” data or see their impact is through the information on what they can do and through the badges obtained with the task. Finally, to test the guideline on data visualization (G6), we included two questions on the effects of plant visualization and greenhouse. In particular, we investigated whether this kind of visualization can foster the system’s usage (Q25) and can eventually create a sense of community inside the campus (Q26).
Section Three: Relationship Between the User and the University
The third section wanted to investigate the relationship between the user, as a university member, and the university. In particular, we were interested in discovering whether the users already knew the existence of sustainability reports released by the university (Q32), as also a way to improve the importance of this system inside the community. Then, we wanted to investigate if the sustainability actions and practices carried on by the university can be a way to help teenagers in their choice of the university, as a form of discernment (Q33). Finally, we explored whether studying in a context that emphasizes improving sustainability would positively impact individuals, both on and off campus (Q34). These two last options are only possible if the university’s sustainability efforts are clearly and effectively communicated to everyone.
Section Four: General Questions
Finally, in the last section, we asked the participants for qualitative feedback on the project (Q35) and their demographic data, like their degree (Q36), gender (Q37), age (Q38), and background (Q39).

4. Results

In this section, we present the results of the evaluation of our prototype. The testing was conducted in an informal setting at the campus bar to actively engage university students. Two researchers facilitated the process by encouraging students to interact with the prototypes and complete a questionnaire.

4.1. Participants

Participants involved in the evaluation phase were recruited through a combination of convenience and snowball sampling strategies. We first invited students enrolled in our courses to take part in the study on a voluntary basis. In addition, we approached students informally during their breaks at the campus bar, asking them to test the prototype and complete the questionnaire. To further broaden participation, initial participants were encouraged to share the study with peers who might be interested, following a snowball sampling approach. This mixed recruitment strategy allowed us to involve participants with diverse academic backgrounds. The students who participated in the first phases of the study were not involved in this evaluation. Prior to their involvement, students were asked to provide informed consent. The consent form explained the purpose of the study, the nature of their participation, and how the collected data would be used. All data were collected and processed in an anonymous and aggregated form, ensuring that no personally identifiable information was retained. The study was conducted in compliance with GDPR regulations. We engaged a total of 66 potential users, aged between 18 and 34 years old, ensuring gender balance with 50% male and 50% female participants. The participants came from diverse academic backgrounds, with a majority representing fields such as architecture (30 participants) and computer science (20 participants).

4.2. User Experience

We obtained positive results after analyzing the User Experience Questionnaire (UEQ) for the kiosk version (Q1–Q8). Specifically, for the pragmatic qualities, which measure usability and effectiveness in supporting user goals, we achieved a score of 1.89 on a scale ranging from −3 to 3. Similarly, the assessment of hedonic quality, which captures the app’s aesthetic appeal and the satisfaction it provides beyond basic functionality, resulted in a score of 1.57. In terms of the mobile version (Q10–Q17), we also achieved positive results, with even higher scores than the kiosk version. Notably, we obtained scores of 2.03 for pragmatic qualities and 1.63 for hedonic qualities.
Furthermore, we received very positive results regarding the clarity of the information presented in both the kiosk version ( μ = 6 , 20 , σ = 0.96 ) (Q9) and the mobile version ( μ = 6 , 21 , σ = 0.87 ) (Q18).

4.3. Guidelines Effectiveness

In this subsection, the results for each guideline will be presented to assess their effectiveness and validate their impact.

G1: Technology

Considering the technological aspect derived from G1, we evaluated our solution of engaging users with a solution that integrates a public display version and a mobile version for their intrinsic nature. Based on the result on a 5-point Likert scale, we can deduce that this solution was appreciated by the participants ( μ = 4.30 , σ = 0.89 ) (Q22). From the comments that emerged during the interaction with our prototype, users generally appreciated mobile for having their own personalized version but recognized the usefulness of having a kiosk version with the more generic and important information (P12: “I appreciate the mobile version so I can have my own profile to update” or P4: “I think the kiosk version can reach more people by being placed at the entrance of the campus”). The approach of combining multiple technologies was appreciated but also seen as a starting point for a more pervasive technology, as mentioned by P57: “In addition to the kiosk put at the entrance, taking the goal on water consumption as an example, if feasible I would put similar devices in areas of relevance such as in bathrooms so the user is in the best position to be more aware of certain behaviors”.

G2: Content

Based on G2, we have made information about all 17 SDGs available, a choice that the participants highly valued ( μ = 4.27 , σ = 0.80 ) (Q19). In particular, analyzing the feedback gathered during the interaction, participants generally appreciated having information on all 17 SDGs to better understand what they can do for each one, going beyond just environmental impact to include social and economic aspects as well. Moreover, participants appreciated having information on what the university is doing relating to the SDGs ( μ = 4.03 , σ = 0.89 ) (Q20) and advice on what individuals can do in their daily life ( μ = 4.45 , σ = 0.79 ) (Q21).

G3: Data Producer

To assess the effectiveness of the third design guideline, which focuses on engaging users as data producers through sustainability-related tasks, we analyzed responses to Q31. This question evaluated how useful participants found the opportunity to complete tasks and earn badges as a form of feedback on their sustainable behavior. The results indicate a generally positive perception ( μ = 4.13 , σ = 0.87 ). This suggests that users appreciate the integration of interactive activities and gamification elements to enhance their awareness of sustainability.

G4: Learning Strategy

The fourth design guideline focused on integrating learning strategies within the system to enhance user engagement and knowledge acquisition on sustainability topics. To evaluate this aspect, we analyzed user feedback on two key learning features: quizzes (Q23) and fun facts (Q24).
Participants rated the usefulness of quizzes with an average score of μ = 4.23 ( σ = 0.99 ), indicating a generally positive perception of this interactive learning approach. The higher standard deviation suggests some variability in user opinions, possibly reflecting differences in learning preferences. Fun facts received an even stronger positive response ( μ = 4.58 , σ = 0.61 ), highlighting their effectiveness in engaging users and providing easily digestible sustainability-related information. The lower standard deviation suggests a more consistent agreement among participants regarding the value of this feature.

G5: Gamification

To assess the influence of gamification elements on user engagement and behavioral change, we analyzed participants’ responses regarding the perceived impact of badges and leaderboards on system usage and real-life sustainability behaviors. The results indicate a moderately positive perception of badges. Participants rated the influence of badges on system usage at μ = 3.85 ( σ = 0.93 ) (Q27) and their impact on behavior change at μ = 3.86 ( σ = 0.89 ) (Q28). While these findings suggest that badges are a useful motivational tool, qualitative feedback from participants highlights some limitations. One user noted that “the badge mechanic has limited use because once a badge is obtained, there are no further in-app incentives to continue performing the required actions.” This suggests that badges alone may not be sufficient to sustain long-term engagement unless combined with additional motivators. Leaderboards, on the other hand, received higher ratings. Users perceived leaderboards as more influential in encouraging system usage, with an average score of μ = 4.17 ( σ = 1.05 ) (Q29). Similarly, their impact on real-world behavior change was rated at μ = 4.06 ( σ = 1.04 ) (Q30). The slightly higher standard deviation for leaderboards suggests more variability in user opinions, possibly reflecting differences in competitive engagement among participants. Several users expressed enthusiasm for the leaderboard feature, with one stating, “I really like the idea of badges and leaderboards, but I’m not sure how points can be assigned fairly without affecting the system’s integrity.” Another participant, identifying as a competitive player, noted, “As a collector, I love the idea of earning badges, but if it’s too easy (e.g., unlimited quiz attempts), it would lose its appeal.” These insights emphasize the importance of designing a balanced reward system that maintains engagement without diminishing the challenge. Additionally, users suggested that leaderboards could be further personalized to enhance engagement. One participant proposed: “Creating internal rankings for different courses and competing with friends would make the experience even more enjoyable.” This highlights an opportunity to leverage social and peer-based competition to increase motivation.

G6: Data Visualization

To evaluate the effectiveness of using data visualization as an engagement tool, we analyzed user perceptions regarding their influence on system usage and sense of community. The results indicate a generally positive response. Participants positively rated the impact of plant visualizations on system usage ( μ = 4.11 , σ = 1.04 ) (Q25) and their role in fostering a sense of community ( μ = 4.06 , σ = 1.08 ) (Q26). These findings suggest that the visual representation of sustainability progress through plants is an engaging and meaningful approach for users. Qualitative feedback further supports this insight, with multiple participants expressing enthusiasm for the plant-growing mechanic during the demo of the mobile application. Some users even indicated that they would be motivated to use the app specifically for this feature, stating that they would appreciate the ability to “have the app for the plant” and “customize it”. This highlights the potential of personalization as a key factor in maintaining long-term engagement.

4.4. Relationship Between the User and the University

To assess the relationship between users and the university regarding sustainability efforts, we explored participants’ awareness of the sustainability reports, the potential influence of sustainability actions on their choice of university, and whether the university’s initiatives affect their own behavior.
The results indicate that the majority of participants (66.7%, 44 out of 66) were unaware that the university publishes annual sustainability reports. This suggests a gap in communication or visibility of these initiatives among students. Increasing awareness of such reports could help strengthen the connection between students and the university’s sustainability efforts.
Regarding the role of sustainability in university selection, responses were mixed. 27 participants stated that sustainability actions would influence their choice, 27 answered “maybe”, and 12 responded negatively. This suggests that while sustainability initiatives can be a deciding factor for some students, for others, they may not be a primary criterion.
A stronger impact was observed when examining the influence of university-led sustainability efforts on students’ own behavior. A significant 86.4% of respondents (57 out of 66) reported that knowing about the university’s sustainability actions influences their behavior on campus or beyond. This finding underscores the potential of institutional sustainability policies not only to improve campus practices but also to foster individual behavioral change among students.

5. Discussion

Grounded in a participatory process involving over 121 students across two campuses (36 in the quick interviews, 19 in the co-design phase, and 66 in the evaluation phase), this project invited participants to devise, design, and evaluate every aspect of a system aimed at educating about sustainability while increasing awareness of the sustainability practices carried out by the university. From an educational perspective, the co-design process itself functioned as a learning experience, enabling students to critically reflect on sustainability issues, institutional responsibilities, and their own potential role as agents of change, emphasizing active involvement and knowledge co-construction.
The findings demonstrate that digital systems constitute a promising avenue for enhancing environmental education and engaging students with sustainability-related content. The positive usability and hedonic scores obtained for both the kiosk and mobile versions indicate that well-designed digital tools can effectively support students in navigating complex ecological topics. These results align with the growing body of research suggesting that interactive and user-centered digital platforms can improve accessibility of information and comprehension when dealing with multifaceted issues such as climate change, biodiversity loss, and, more broadly, SDGs (Mondejar et al., 2021; Rist & Masoodian, 2022).
A key contribution of this study is the integration of complementary technologies, namely a public kiosk and a personalized mobile application, which participants consistently evaluated as useful. This multi-platform approach echoes the need for more pervasive digital ecosystems capable of meeting learners in different contexts and offering layered entry points to environmental topics. The qualitative feedback further suggests that contextual placement of technologies (e.g., kiosks positioned in strategic campus locations) can strengthen situational awareness and foster everyday engagement with sustainability practices. Moreover, having a public display and situated data representation also increases the possibility of reaching a new audience, not necessarily part of the community or initially interested in the topic (Van Den Bosch et al., 2024), and creating new opportunities to explore ecological issues through place-based learning (Caiman & Kjällander, 2023).
The potential of digital tools to support place-based learning (Caiman & Kjällander, 2023) deserves deeper elaboration, as the two approaches need not be conceived as alternatives but rather as mutually reinforcing pedagogical strategies. Place-based education (PBE) grounds learning in direct, sensory engagement with local environments, fostering ecological identity, a sense of belonging, and sustainability values through authentic encounters with the natural and social world (Gruenewald, 2003; Sobel, 2004). The interactive digital system presented in this study can function as a meaningful preparatory or reflective layer within such experientially grounded approaches. For instance, the data visualizations presenting the university’s environmental indicators (e.g., water consumption trends, biodiversity-related projects) could serve to scaffold students’ conceptual understanding before a field-based inquiry on campus green spaces, or to deepen their critical reflection after direct contact with the local ecosystem. Similarly, the actionable tips embedded in the system for each SDG could be activated and tested in situ during place-based learning activities, transforming digital awareness into embodied, context-specific action. This articulation between digital and place-based modalities aligns with emerging calls for hybrid pedagogies in Education for Sustainable Development, in which technology amplifies rather than replaces the affective, relational, and situated dimensions of learning in and about nature (Wals, 2014). Designing learning sequences that deliberately alternate between digital engagement and direct environmental experience may therefore deepen students’ sense of place while simultaneously building the critical digital literacy increasingly required for sustainability citizenship in the twenty-first century.
Another insight emerging from the results concerns the role of content breadth and relevance. The inclusion of information on all 17 SDGs, together with data about the university’s own sustainability actions and actionable advice for daily life, was highly appreciated by participants. This reflects the growing need for educational tools that not only transmit sustainability-related knowledge but also support the development of environmental literacy and sustainability competencies by connecting global frameworks to local institutional practices and individual agency. By linking abstract sustainability goals to concrete, everyday actions, the platform helped bridge the persistent gap between knowledge and action, encouraging more informed, reflective, and responsible decision-making. The inclusion of tasks and actionable tips is consistent with the literature, where it is important not only to present and explain the data, but also to provide options that can support more sustainable behaviors (Perera et al., 2024).
Interactive and participatory features, such as quizzes, fun facts, tasks, and badges, proved particularly effective in supporting engagement and learning. The strong positive evaluations of quizzes and fun facts highlight that micro-learning strategies embedded within digital interfaces can facilitate knowledge acquisition in a lightweight and motivating manner. Gamification elements yielded more nuanced results: while badges were perceived as moderately useful, leaderboards showed stronger potential for influencing both system usage and real-world sustainability behaviors. These findings suggest that competitive or socially driven mechanisms may foster deeper involvement, especially when personalized or adapted to peer groups. This aligns with the works on digital tools that promote active participation and collaborative engagement in environmental issues (Hafferty et al., 2024; Zawieska et al., 2022).
The gamification results can be interpreted more deeply through the lens of SDT (Ryan & Deci, 2024), which posits that sustained intrinsic motivation requires the simultaneous satisfaction of three basic psychological needs: autonomy, competence, and relatedness (Ryan & Deci, 2024). Read in this light, the divergence between badge and leaderboard ratings is theoretically meaningful rather than incidental. Badges, as implemented in our system, primarily address competence by providing feedback on task completion and sustainable behavior. However, as one participant noted, once a badge is obtained, there are no further in-app incentives to continue performing the required actions, which is consistent with SDT-informed research showing that competence support alone is insufficient to sustain motivation unless accompanied by a perceived sense of autonomy (Deci et al., 1999). Leaderboards, by contrast, received higher scores for both system usage and behavior change, likely because they engage in relatedness more actively by situating individual effort within a social and peer-based context. This aligns with SDT predictions that relatedness, the sense of feeling connected to others through shared activity, can amplify and sustain engagement beyond what individual reward mechanisms alone can achieve (Sailer et al., 2017). Furthermore, the autonomy need appears to be addressed more broadly across the system rather than within gamification alone: the mobile personal profile, the freedom to choose which SDGs to explore, and the personalized plant visualization all provide users with a sense of agency over their own sustainability journey. Taken together, these findings suggest that the effectiveness of gamification in sustainability education contexts depends less on the presence of game mechanics per se, and more on the extent to which those mechanics jointly support autonomy, competence, and relatedness in an integrated way.
The plant-based data visualizations also contributed meaningfully to student engagement and understanding of ecological dynamics. Participants reported that the visualization of progress through virtual plants fostered a sense of connection and community, emphasizing the potential of metaphor-driven analytics to create emotional bonds with sustainability practices. Personalization emerged as a recurring theme in the feedback, indicating that customizable visual representations may further enhance long-term engagement and learning outcomes. This is in line with the current literature (Sou et al., 2024). Furthermore, the choice of a plant as the central avatar may carry additional pedagogical resonance, as it gently counters the well-documented phenomenon of plant blindness (Wandersee & Schussler, 1999), fostering greater attention to plant life as part of students’ broader environmental awareness.
Finally, the findings related to the relationship between students and the university highlight a critical area for environmental education: awareness of institutional sustainability actions. Despite the fact that most participants were initially unaware of the university’s sustainability reports, a substantial majority indicated that knowing about these initiatives influences their own behaviors. This underscores the transformative potential of digital tools not only to disseminate information but also to make institutional actions visible, relatable, and impactful. Such visibility can strengthen students’ sense of belonging and responsibility toward campus sustainability, fulfilling an important goal of environmental education frameworks emphasized in the call for papers.
Overall, this study illustrates how a combination of digital approaches, including multi-platform access, interactive content, chatbots, gamification, and engaging visualizations, can support Education for Sustainable Development in higher education contexts. By fostering environmental literacy, enhancing students’ sense of agency, and making institutional sustainability practices visible and meaningful, such digital environments can contribute to more dynamic, participatory, and transformative learning experiences.

5.1. Policy and Practice Implications

The findings of this study offer several implications for both institutional policy and educational practice in higher education. From a policy perspective, the results highlight the importance of moving beyond static sustainability reporting toward more transparent, accessible, and educationally oriented forms of communication. Universities seeking to advance their commitments to sustainability and the SDGs should consider treating institutional sustainability data not only as accountability tools but also as pedagogical resources that can be integrated into everyday campus life. Embedding such data within interactive and participatory digital systems can enhance students’ awareness of institutional actions while strengthening their sense of responsibility and belonging within the university community.
From a practice-oriented standpoint, the study underscores the value of participatory and co-design approaches as effective strategies for sustainability education. Involving students in the design of digital learning environments supports learner-centered pedagogies, fosters critical reflection, and enhances the relevance of sustainability-related content. The results further suggest that multi-platform solutions, combining public and personal interfaces, can extend learning beyond formal instructional settings and support informal and place-based learning across campus spaces. For educators and practitioners, integrating interactive features such as micro-learning activities, gamification, and meaningful data visualizations can facilitate engagement while supporting the development of environmental literacy and sustainability competencies. Collectively, these insights point to the need for institutional policies and educational practices that recognize students not merely as recipients of sustainability information but as active partners in shaping and enacting sustainable futures within higher education institutions.

5.2. Limitations and Future Directions

Despite the promising findings, this study presents several limitations that should be acknowledged. First, the system was evaluated with a limited number of participants (66 students) relative to the size of the overall university community. While the results provide valuable insights into students’ perceptions and engagement, future studies involving larger and more diverse samples would be necessary to assess the educational impact of the system at scale and across different learner profiles.
Second, the tasks assigned to users relied on self-reporting, as no direct verification mechanisms were implemented to confirm task completion. Although self-reporting is commonly used in educational and behavioral research, this approach introduces uncertainty regarding actual engagement. Future iterations of the system could explore alternative strategies, such as reflective prompts, peer validation, or integration with institutional data, to better capture meaningful learning and action without undermining learners’ autonomy.
Third, while the findings suggest that the system can positively influence students’ awareness and self-reported behaviors, the study did not examine the long-term sustainability of these effects. Longitudinal research is therefore needed to understand whether such digital and participatory educational interventions can support enduring learning outcomes, habit formation, and sustained engagement with sustainability beyond the immediate context of use.
Fourth, the system was co-designed within the specific context of two campuses at a single university, which may limit the generalizability of the findings. As with many community-based and participatory educational initiatives, the approach’s strength lies in its contextual grounding. Nevertheless, by providing a detailed account of the co-design process and design guidelines, this study supports the transferability and replicability of the approach across other higher education contexts seeking to integrate participatory digital tools into sustainability education.
Finally, the system was evaluated as a standalone tool, without integration with real-context, nature-based learning experiences. Future research should explore how combining our digital approach with place-based education (Gruenewald, 2003; Sobel, 2004), such as field-based ecological inquiry or campus garden activities, can produce synergistic learning outcomes and enrich the transformative dimensions of Education for Sustainable Development (Wals, 2014).

Author Contributions

C.C.: Conceptualization, Methodology, Data curation, Visualization, Writing—original draft, Writing—review and editing; T.Z.: Methodology, Data curation, Writing—original draft, Writing—review and editing; N.D.L.: Conceptualization, Writing—review and editing, Supervision, Funding acquisition; C.P.: Conceptualization, Methodology, Writing—review and editing, Supervision, Funding Acquisition. All authors have read and agreed to the published version of the manuscript.

Funding

This research was funded by the Alma Idea 2022 (linea di intervento B2—sostenibilità) Grant from the University of Bologna. The publication was produced by a researcher with a research contract financed by FSE+ 2021–2027 funds pursuant to art. 24, paragraph 3, letter a), of Law 240/2010 and subsequent amendments and of D.G.R. 693/2023 (REF. PA: 2023-20090/RER-7—CUP: J19J23000730002).

Institutional Review Board Statement

Ethical review and approval were waived by the local Ethics Committee of the University of Bologna for this study because all data were collected in an anonymous manner, and all participants provided informed consent and voluntarily agreed to participate.

Informed Consent Statement

Informed consent was obtained from all subjects involved in the study.

Data Availability Statement

The raw data supporting the conclusions of this article will be made available by the authors if requested.

Acknowledgments

The authors would like to thank Apolline Chenais for the graphical resources used in the prototype and Jiekai Sun for implementing the chatbot and the extraction pipeline. A special thanks goes to all the participants in the study.

Conflicts of Interest

The authors declare no conflicts of interest.

Abbreviations

The following abbreviations are used in this manuscript:
SDGSustainable Development Goal
LLMLarge Language Model
HCIHuman–Computer Interaction

Notes

1
UI GreenMetric. Overall Rankings 2023. https://uigreenmetric.com/rankings/university/overall-rankings-2023 (accessed on 26 May 2024).
2
Times Higher Education (THE). Impact Rankings 2023. https://www.timeshighereducation.com/rankings/impact/2023/overall (accessed on 26 May 2024).
3
https://maze.co/ (accessed on 25 September 2025).

References

  1. Abbas, M. Y., & Singh, R. (2014). A survey of environmental awareness, attitude, and participation amongst university students: A case study. International Journal of Science and Research, 3(5), 1755–1760. [Google Scholar]
  2. Adaji, I., Idoko, P., & Adisa, M. O. (2024). Insights from the review of apps that influence environmental sustainability. In Adjunct proceedings of the 32nd ACM conference on user modeling, adaptation and personalization (pp. 154–159). ACM. [Google Scholar] [CrossRef] [Scilit]
  3. Awasthi, P., & George, J. J. (2020). A case for data democratization. In Amcis 2020 proceedings—Americas conference on information systems. AIS Library. [Google Scholar]
  4. Baskara, F. R. (2024). Generative AI as an enabler of sustainable education: Theoretical perspectives and future directions. British Journal of Teacher Education and Pedagogy, 3(3), 122–134. [Google Scholar] [CrossRef] [Scilit]
  5. Bitrián, P., Buil, I., & Catalán, S. (2021). Enhancing user engagement: The role of gamification in mobile apps. Journal of Business Research, 132, 170–185. [Google Scholar] [CrossRef] [Scilit]
  6. Brain, T., & Newcombe, J. (2015). Exploring environmental stewardship through data-driven practices. Media Art and the Urban Environment: Engendering Public Engagement with Urban Ecology, 5, 47–61. [Google Scholar]
  7. Brophy, H., Olson, J., & Paul, P. (2023). Eco-anxiety in youth: An integrative literature review. International Journal of Mental Health Nursing, 32(3), 633–661. [Google Scholar] [CrossRef] [Scilit]
  8. Caiman, C., & Kjällander, S. (2023). Elementary students’ ‘outdoor—digital’ explorations in ecology—Learning through chains of transduction. Environmental Education Research, 30(1), 83–100. [Google Scholar] [CrossRef] [Scilit]
  9. Ceccarini, C., Zambon, T., De Luigi, N., & Prandi, C. (2023). SDGs like you have never seen before!: Co-designing data visualization tools with and for university students. In Proceedings of the 2023 ACM conference on information technology for social good (pp. 521–529). Association for Computing Machinery. [Google Scholar] [CrossRef] [Scilit]
  10. Celik, B. G., Ozbek, M. E., Attaran, S., & Jalili, M. (2014). Comparison of environmental responsibility of construction management students based on exposure to sustainability in curricula and on campus. International Journal of Construction Education and Research, 10(2), 96–110. [Google Scholar] [CrossRef] [Scilit]
  11. Chen, Y. (2024). A Panoramic overview of the opportunities and challenges artificial intelligence brings to ESG investing. In Artificial intelligence, finance, and sustainability: Economic, ecological, and ethical implications (pp. 19–32). Palgrave Macmillan. [Google Scholar] [CrossRef] [Scilit]
  12. Corbetta, P. (2003). Social research: Theory, methods and techniques. SAGE Research Methods. [Google Scholar]
  13. Dash, A., Mathur, B., & Patil, P. (2024). EcoTrack: A mobile application for real-time carbon footprint tracking and sustainable living. In 2024 IEEE international multi-conference on smart systems & green process (IMC-SSGP) (pp. 1–6). IEEE. [Google Scholar] [CrossRef] [Scilit]
  14. Deci, E. L., Koestner, R., & Ryan, R. M. (1999). A meta-analytic review of experiments examining the effects of extrinsic rewards on intrinsic motivation. Psychological Bulletin, 125(6), 627. [Google Scholar] [CrossRef] [Scilit] [PubMed]
  15. Deepthi, D. P. (2025). Lepre tracker: Small choices, big change. International Journal for Research in Applied Science and Engineering Technology, 13(5), 4093–4099. [Google Scholar] [CrossRef] [Scilit]
  16. Deterding, S., Dixon, D., Khaled, R., & Nacke, L. (2011). From game design elements to gamefulness: Defining “gamification”. In Proceedings of the 15th international academic mindtrek conference: Envisioning future media environments (pp. 9–15). Association for Computing Machinery. [Google Scholar]
  17. DiSalvo, C., Sengers, P., & Brynjarsdóttir, H. (2010). Mapping the landscape of sustainable HCI. In Proceedings of the sigchi conference on human factors in computing systems (pp. 1975–1984). Association for Computing Machinery. [Google Scholar]
  18. Dourish, P. (2010). HCI and environmental sustainability: The politics of design and the design of politics. In Proceedings of the 8th ACM conference on designing interactive systems (pp. 1–10). Association for Computing Machinery. [Google Scholar] [CrossRef] [Scilit]
  19. Emanuel, R., & Adams, J. (2011). College students’ perceptions of campus sustainability. International Journal of Sustainability in Higher Education, 12(1), 79–92. [Google Scholar] [CrossRef] [Scilit]
  20. Filho, W. L. (2011). About the role of universities and their contribution to sustainable development. Higher Education Policy, 24, 427–438. [Google Scholar] [CrossRef] [Scilit]
  21. Galán-Muros, V. (2023). General guidelines for the implementation of sustainability in higher education institutions. In Set4hei. UNESCO IESALC; United Nations Academic Impact. [Google Scholar]
  22. García-Hernández, A., García-Valcárcel Muñoz-Repiso, A., Casillas-Martín, S., & Cabezas-González, M. (2022). Sustainability in digital education: A systematic review of innovative proposals. Education Sciences, 13(1), 33. [Google Scholar] [CrossRef] [Scilit]
  23. Gruenewald, D. A. (2003). The best of both worlds: A critical pedagogy of place. Educational Researcher, 32(4), 3–12. [Google Scholar] [CrossRef] [Scilit]
  24. Hafferty, C., Reed, M. S., Brockett, B. F., Orford, S., Berry, R., Short, C., & Davis, J. (2024). Engagement in the digital age: Understanding “what works” for participatory technologies in environmental decision-making. Journal of Environmental Management, 365, 121365. [Google Scholar] [CrossRef] [Scilit]
  25. Hajj-Hassan, M., Chaker, R., & Cederqvist, A.-M. (2024). Environmental education: A systematic review on the use of digital tools for fostering sustainability awareness. Sustainability, 16(9), 3733. [Google Scholar] [CrossRef] [Scilit]
  26. Jackson, L. (2016). Education for sustainable development: From environmental education to broader views. In Handbook of research on applied learning theory and design in modern education (pp. 41–64). IGI Global Scientific Publishing. [Google Scholar]
  27. Kennedy, E. H., & Givens, J. E. (2019). Eco-habitus or eco-powerlessness? Examining environmental concern across social class. Sociological Perspectives, 62(5), 646–667. [Google Scholar] [CrossRef] [Scilit]
  28. Kleres, J., & Wettergren, Å. (2017). Fear, hope, anger, and guilt in climate activism. Social Movement Studies, 16(5), 507–519. [Google Scholar] [CrossRef] [Scilit]
  29. Lefebvre, H., Legner, C., & Fadler, M. (2021). Data democratization: Toward a deeper understanding. In Icis. AIS Library. [Google Scholar]
  30. Lupi, G. (2017). Data humanism: The revolutionary future of data visualization—PRINT magazine. Available online: https://www.printmag.com/article/data-humanism-future-of-data-visualization/ (accessed on 9 May 2025).
  31. Mekler, E. D., Brühlmann, F., Tuch, A. N., & Opwis, K. (2017). Towards understanding the effects of individual gamification elements on intrinsic motivation and performance. Computers in Human Behavior, 71, 525–534. [Google Scholar] [CrossRef] [Scilit]
  32. Moggi, S. (2023). Sustainability reporting, universities and global reporting initiative applicability: A still open issue. Sustainability Accounting, Management and Policy Journal, 14(4), 699–742. [Google Scholar] [CrossRef] [Scilit]
  33. Mondejar, M. E., Avtar, R., Diaz, H. L. B., Dubey, R. K., Esteban, J., Gómez-Morales, A., Hallam, B., Mbungu, N. T., Okolo, C. C., Prasad, K. A., She, Q., & Garcia-Segura, S. (2021). Digitalization to achieve sustainable development goals: Steps towards a Smart Green Planet. Science of The Total Environment, 794, 148539. [Google Scholar] [CrossRef] [Scilit]
  34. Monzó-Martínez, A., Ortiz-Cermeño, E., & Martínez-Agut, M. P. (2024). Global citizenship education and its role in sustainability at the university level. Education Sciences, 14(8), 847. [Google Scholar] [CrossRef] [Scilit]
  35. Nilan, P. (2017). The ecological habitus of Indonesian student environmentalism. Environmental Sociology, 3(4), 370–380. [Google Scholar] [CrossRef] [Scilit]
  36. Novotnỳ, R., Huttmanová, E., Valentiny, T., & Kalistová, A. (2021). Evaluation of environmental awareness of university students: The case of the University of Presov, Slovakia. European Journal of Sustainable Development, 10(2), 59. [Google Scholar] [CrossRef] [Scilit]
  37. Parr, A. (2022). Knowledge-driven actions: Transforming higher education for global sustainability (Tech. Rep.). UNESCO. [Google Scholar]
  38. Pereira Ribeiro, J. M., Hoeckesfeld, L., Dal Magro, C. B., Favretto, J., Barichello, R., Lenzi, F. C., Secchi, L., Montenegro de Lima, C. R., & Salgueirinho Osório de Andrade Guerra, J. B. (2021). Green campus initiatives as sustainable development dissemination at higher education institutions: Students’ perceptions. Journal of Cleaner Production, 312, 127671. [Google Scholar] [CrossRef] [Scilit]
  39. Perera, D., Verdezoto Dias, N., Lannon, S., Gwilliam, J., & Eslambolchilar, P. (2024). Exploring the design of physical artefacts to visualise household consumption for encouraging sustainable practices. Behaviour & Information Technology, 43(14), 3356–3370. [Google Scholar] [CrossRef] [Scilit]
  40. Plitt, S. (2019). Digital tools for urban green infrastructure: Investigating the potential of e-tools to inform and engage stewards. Stockholms Universitet, Stockholm Resilience Centre. [Google Scholar]
  41. Prandi, C., Ceccarini, C., Nisi, V., & Salomoni, P. (2021). Designing interactive infographics to stimulate environmental awareness: An exploration with a University community. Multimedia Tools and Applications, 80(9), 12951–12968. [Google Scholar] [CrossRef] [Scilit]
  42. Qu, S. Q., & Dumay, J. (2011). The qualitative research interview. Qualitative Research in Accounting & Management, 8(3), 238–264. [Google Scholar] [CrossRef] [Scilit]
  43. Ricard, M., Zachariou, A., & Burgos, D. (2020). Digital education, information and communication technology, and education for sustainable development. In Radical solutions and elearning: Practical innovations and online educational technology (pp. 27–39). Springer. [Google Scholar]
  44. Rist, T., & Masoodian, M. (2022). Interactive map visualizations for supporting environmental sustainable development goals. In C. Ardito, R. Lanzilotti, A. Malizia, M. Larusdottir, L. D. Spano, J. Campos, M. Hertzum, T. Mentler, J. A. Nocera, L. Piccolo, S. Sauer, & G. van der Veer (Eds.), Sense, feel, design (pp. 36–46). Springer International Publishing. [Google Scholar]
  45. Rossitto, C., Comber, R., Tholander, J., & Jacobsson, M. (2022). Towards digital environmental stewardship: The work of caring for the environment in waste management. In Proceedings of the 2022 CHI conference on human factors in computing systems. Association for Computing Machinery. [Google Scholar] [CrossRef] [Scilit]
  46. Ruiu, M. L., Ruiu, G., Ragnedda, M., & Addeo, F. (2024). Exploring digital-environment habitus in Italy—How digital practices reflect users’ environmental orientations? Sustainability, 16(12), 4880. [Google Scholar] [CrossRef] [Scilit]
  47. Ryan, R. M., & Deci, E. L. (2024). Self-determination theory. In Encyclopedia of quality of life and well-being research (pp. 6229–6235). Springer. [Google Scholar]
  48. Sailer, M., Hense, J. U., Mayr, S. K., & Mandl, H. (2017). How gamification motivates: An experimental study of the effects of specific game design elements on psychological need satisfaction. Computers in Human Behavior, 69, 371–380. [Google Scholar] [CrossRef] [Scilit]
  49. Sanders, E. B.-N., & Stappers, P. J. (2008). Co-creation and the new landscapes of design. Co-Design, 4(1), 5–18. [Google Scholar] [CrossRef] [Scilit]
  50. Schöbel, S. M., Janson, A., & Söllner, M. (2020). Capturing the complexity of gamification elements: A holistic approach for analysing existing and deriving novel gamification designs. European Journal of Information Systems, 29(6), 641–668. [Google Scholar] [CrossRef] [Scilit]
  51. Schrepp, M., Hinderks, A., & Thomaschewski, J. (2017). Design and evaluation of a short version of the user experience questionnaire (UEQ-S). International Journal of Interactive Multimedia and Artificial Intelligence, 4(6), 103–108. [Google Scholar] [CrossRef] [Scilit]
  52. Soares, M., Romão, T., & Rodrigues, A. (2024). A gamified platform to encourage sustainable behaviours. AGILE: GIScience Series, 5, 13. [Google Scholar] [CrossRef] [Scilit]
  53. Sobel, D. (2004). Place-based education: Connecting classrooms and communities. Education for Meaning and Social Justice, 17(3), 63–64. [Google Scholar]
  54. Sou, D., Stebler, D., Principe, M., Kowatsch, T., & Nißen, M. (2024). Please CyMe: Towards enhancing menstrual health awareness through customization and personalized visualization in a menstrual health app. In Proceedings of mensch und computer 2024 (pp. 674–683). ACM. [Google Scholar] [CrossRef] [Scilit]
  55. Tripon, C., Gonța, I., & Bulgac, A. (2023). Nurturing minds and sustainability: An exploration of educational interactions and their impact on student well-being and assessment in a sustainable university. Sustainability, 15(12), 9349. [Google Scholar] [CrossRef] [Scilit]
  56. Uda, S., & Basrowi, B. (2024). Environmental education using SARITHA-Apps to enhance environmentally friendly supply chain efficiency and foster environmental knowledge towards sustainability. Uncertain Supply Chain Management, 12(1), 359–372. [Google Scholar] [CrossRef] [Scilit]
  57. Ulkhaq, M. M., & George Joseph, R. S. (2023). Students’ attitudes towards campus sustainability: A comparison among three universities in Sweden. Environment, Development and Sustainability, 26, 16289–16313. [Google Scholar] [CrossRef] [Scilit]
  58. United Nations. (2015). The 17 GOALS|sustainable development. Available online: https://sdgs.un.org/goals (accessed on 8 May 2025).
  59. United Nations. (2023). The sustainable development goals report 2023. Available online: https://unstats.un.org/sdgs/report/2023/The-Sustainable-Development-Goals-Report-2023.pdf (accessed on 1 July 2025).
  60. United Nations Environment Programme. (2023, November). Emissions gap report 2023. Available online: https://www.unep.org/resources/emissions-gap-report-2023 (accessed on 27 June 2025).
  61. United Nations General Assembly. (2015). Transforming our world: The 2030 agenda for sustainable development. United Nations. [Google Scholar]
  62. Van Den Bosch, C., Peeters, N., Urkens, J., Ipers, G., Wolff, A., & Claes, S. (2024). Situating data stories in space to entice new audiences to engage with science. Behaviour & Information Technology, 43(14), 3325–3339. [Google Scholar] [CrossRef] [Scilit]
  63. Vieru, D., & Plugge, A. (2025). Overcoming the AI opacity in ESG reporting: A digital platform-based knowledge boundary-spanning perspective. R-Libre Open Access Research Repository. [Google Scholar] [CrossRef] [Scilit]
  64. Wals, A. E. (2014). Social learning-oriented capacity-building for critical transitions towards sustainability. In Schooling for sustainable development in europe: Concepts, policies and educational experiences at the end of the un decade of education for sustainable development (pp. 87–107). Springer. [Google Scholar]
  65. Wandersee, J. H., & Schussler, E. E. (1999). Preventing plant blindness. The American Biology Teacher, 61(2), 82–86. [Google Scholar] [CrossRef] [Scilit]
  66. Zawieska, J., Obracht-Prondzyńska, H., Duda, E., Uryga, D., & Romanowska, M. (2022). In search of the innovative digital solutions enhancing social pro-environmental engagement. Energies, 15(14), 5191. [Google Scholar] [CrossRef] [Scilit]
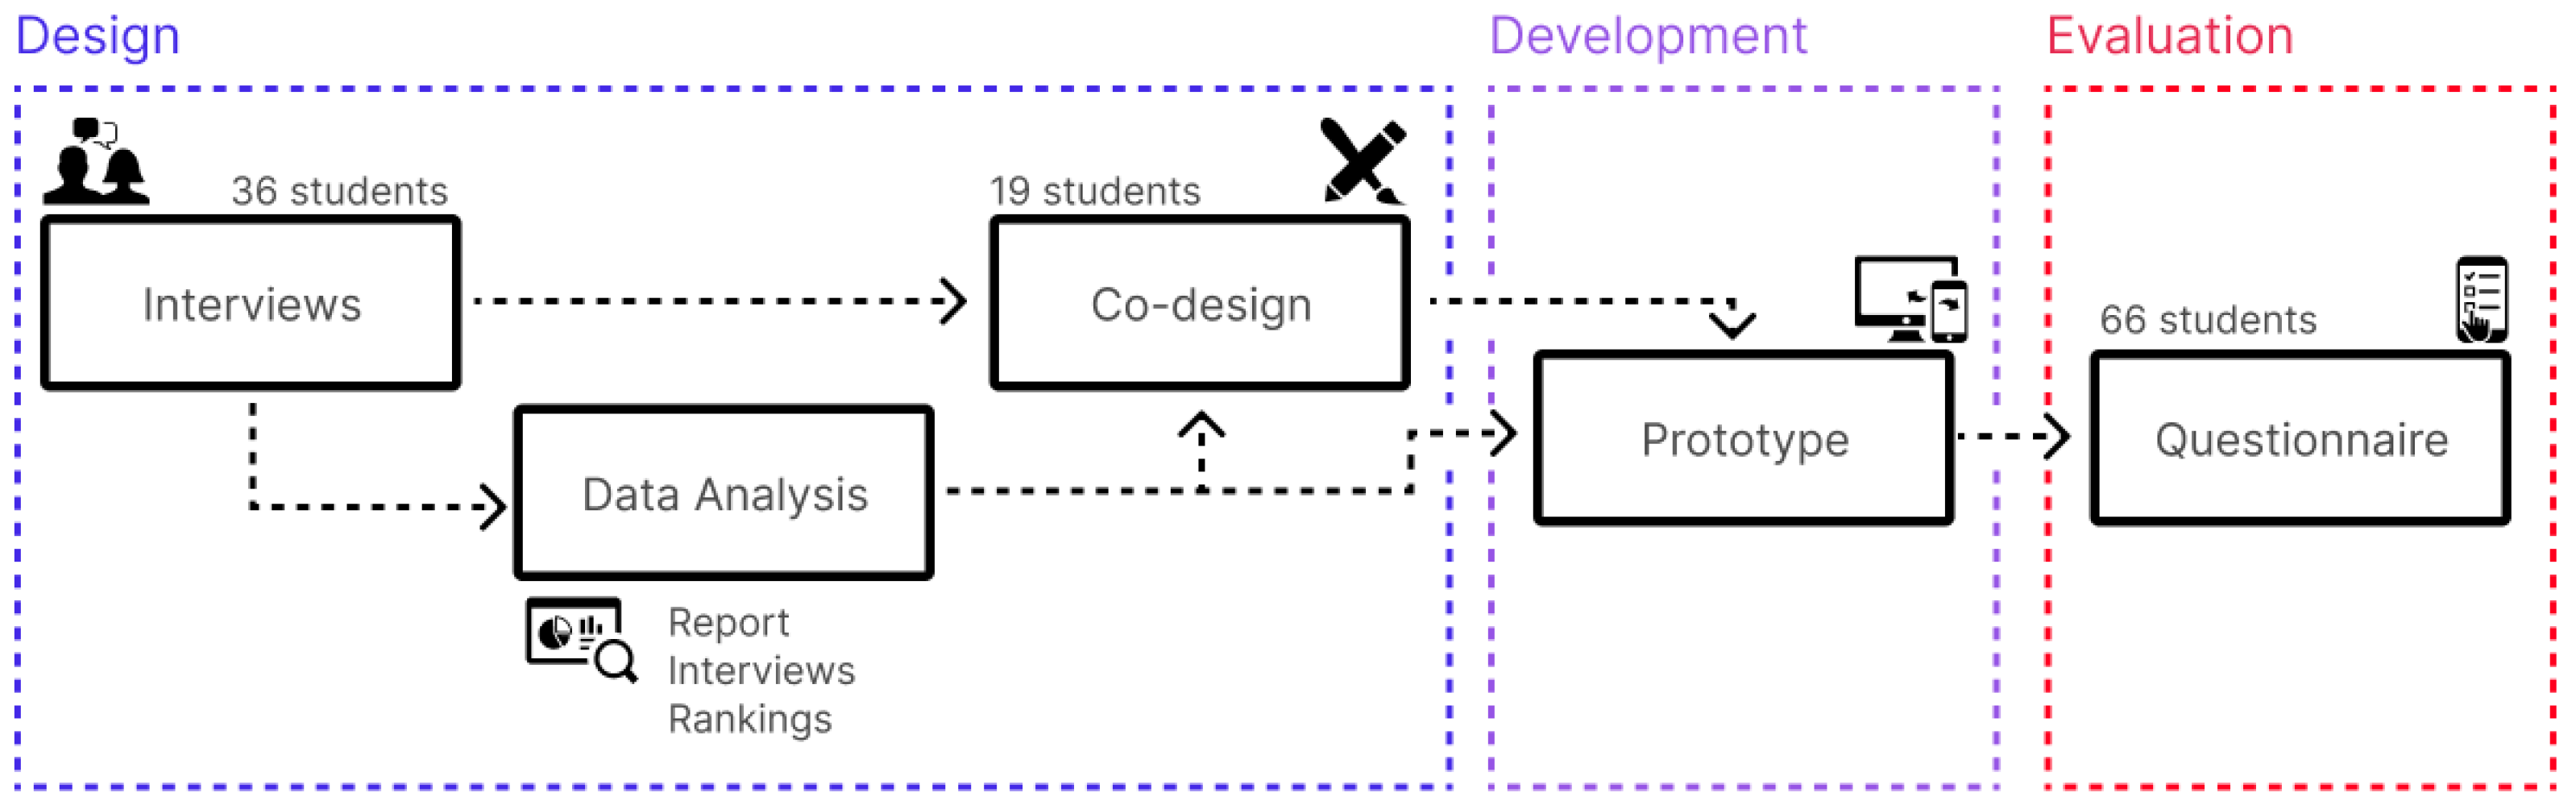
Figure 1. The overall process adopted in this study, which unfolds across three interconnected phases: Design, Development, and Evaluation.
Education 16 00771 g001
Figure 2. The interface of one SDG (SDG 6), both in the kiosk version (above) and in the mobile version (below). (A) represents the general information about the SDG; (B) the data on what the university is doing in terms of courses related to that SDG, publications, projects, and significant data; and (C) some advice on what a person can do to improve their behavior in relation to that SDG.
Education 16 00771 g002
Figure 3. An example of a conversation with the chatbot.
Education 16 00771 g003
Figure 4. Examples of tasks (read a fun fact about common detergent—in blue, take a quiz on green power—in yellow, and visit a museum at least three times—in red), which, once completed, make the users earn badges. The second screenshot represents the badges page, where users can see their achievements and how to collect the missing badges.
Education 16 00771 g004
Figure 5. On the left, the greenhouse visible in the kiosk version of the system, where every plant is the avatar for each community member. In this interface, the leaderboard is also visible, showing just the three best users. On the right, the mobile version, where every user can personalize their paint and plot based on their progress in the system.
Education 16 00771 g005
Figure 6. Examples of two data visualizations to highlight project keywords (through a word cloud) and the decreasing water consumption trend (through a line chart) due to some university policies.
Education 16 00771 g006
Figure 7. Questions asked in the online questionnaire. The first section (Q1–Q18) revolves around the user experience, the second one (Q19–Q30) wants to test the effectiveness of the guidelines extrapolated from the co-design session with students, the third one (Q31–Q33) investigates the relationship between the university (and its sustainable practices) and the community member, and the last one (Q34–Q38) asks for feedback on the project and demographic information.
Education 16 00771 g007
Table 1. Interview question list.
IDQuestion
1What does sustainability mean to you?
2In what ways do you perceive sustainability being implemented on campus?
3What actions do you personally take to support sustainability while you are on campus?
4Do you have any suggestions for improving sustainable behaviors within the campus community?
BonusCould you draw something that represents sustainability on campus? If you wish, you may describe your drawing during the process.
Disclaimer/Publisher’s Note: The statements, opinions and data contained in all publications are solely those of the individual author(s) and contributor(s) and not of MDPI and/or the editor(s). MDPI and/or the editor(s) disclaim responsibility for any injury to people or property resulting from any ideas, methods, instructions or products referred to in the content.