


Abstract
Numerical abilities are essential for everyday functioning. However, little is known about how developmental dyscalculia (DD) affects everyday mathematical functioning beyond academic contexts and how these difficulties are related to mathematics anxiety (MA). The present analysis investigated everyday mathematical functioning and its association with MA in individuals with DD. In addition, the potential effects of a targeted math intervention on MA were investigated. Analyses were based on a combined dataset of 198 participants aged 14–27 years, including 130 adolescents and young adults with DD and 68 controls, with sample sizes varying across analyses depending on data availability. Individuals with DD reported significantly greater everyday mathematical difficulties and higher levels of MA than controls. Within the DD group, MA was associated with sociodemographic factors, but not with cognitive factors. No significant intervention effects were found for MA. Moreover, everyday mathematical difficulties were positively associated with MA. These findings indicate that DD has far-reaching consequences for everyday functioning, affecting multiple domains of daily life, and is associated with increased MA.
1. Introduction
Numerical and mathematical skills are fundamental for everyday functioning. They are required in common activities such as managing time, handling money, estimating quantities, shopping, cooking, and making health-related or financial decisions. Consequently, persistent difficulties in mathematics can affect not only academic achievement but also occupational opportunities, psychological well-being, and independent functioning in daily life (Kucian & von Aster, 2015; Vigna et al., 2022). Examining the impact of developmental dyscalculia (DD) is therefore of considerable scientific and practical relevance.
DD is a specific neurodevelopmental learning disorder characterized by persistent impairments in the acquisition and use of mathematical skills that cannot be explained by intellectual disability, inadequate schooling, sensory impairments, or neurological conditions (World Health Organization, 2022). Individuals with DD typically show difficulties in basic arithmetic processing, number sense, calculation fluency, arithmetic fact retrieval, and mathematical reasoning (Kucian & von Aster, 2015; Luoni et al., 2023). Prevalence estimates commonly range between 3 and 7%, although reported rates vary depending on diagnostic criteria and assessment methods (Haberstroh & Schulte-Körne, 2019; Van Luit & Toll, 2018). The etiology of DD is considered heterogeneous and multifactorial, involving genetic, neurobiological, cognitive, and environmental factors (Kaufmann et al., 2013; Mahmud et al., 2020). However, causal mechanisms remain insufficiently understood because much of the available evidence is cross-sectional rather than longitudinal (Fias et al., 2013; Vogel & De Smedt, 2021).
Existing findings indicate that DD is associated with both domain-specific deficits, such as impaired magnitude processing and arithmetic fact retrieval, and domain-general deficits (Kaufmann et al., 2020). Domain-general difficulties may include working memory, attention, and visuo-spatial processing (Ashkenazi & Henik, 2010; Fias et al., 2013; Kaufmann et al., 2020; Mammarella et al., 2015). Most research on DD has been conducted on children. Consequently, there is a paucity of research on adults. In adolescence and adulthood, dyscalculics’ mathematical difficulties often persist rather than disappear, particularly without targeted intervention (De Visscher et al., 2018; Gliksman & Henik, 2019; Kaufmann et al., 2020). In later developmental stages, the consequences of DD may extend beyond school performance and affect everyday activities, financial management, educational pathways, and career opportunities (Bruine de Bruin & Slovic, 2021; Staller et al., 2025; Vigna et al., 2022). Nevertheless, adolescents and young adults with DD remain underrepresented in empirical research.
One affective factor that has received increasing attention in relation to mathematical difficulties is mathematics anxiety (MA). MA refers to feelings of tension, worry, discomfort, or fear in situations involving numbers or mathematical tasks (Hembree, 1990; Richardson & Suinn, 1972). It is not considered a clinical disorder but is a relevant academic form of anxiety that can interfere with learning, performance, and engagement with mathematics (Devine et al., 2018; Orbach et al., 2019). MA is commonly understood as a multidimensional construct involving cognitive components such as worry, affective components such as fear or nervousness, behavioral components such as avoidance, and physiological responses such as increased arousal (Barroso et al., 2021; Cipora et al., 2019; Dowker et al., 2016).
A substantial body of research shows that MA is negatively associated with mathematical performance (Ashcraft & Krause, 2007; Barroso et al., 2021; Namkung et al., 2019; Zhang et al., 2019). However, the direction and mechanisms of this relationship remain debated. One explanation proposes that anxiety consumes working memory resources during mathematical tasks, thereby reducing the cognitive capacity available for problem solving (Ashcraft & Kirk, 2001; Eysenck & Calvo, 1992; Pellizzoni et al., 2022). Research further suggests that MA may develop as a result of repeated negative experiences with mathematics, insufficient understanding, and low self-efficacy, often in interaction with environmental and individual factors such as teaching quality, time pressure, and personality traits (Ahmmed et al., 2024; Devine et al., 2012; Finlayson, 2014). A third view emphasizes reciprocal effects, in which poor performance and MA reinforce each other over time through avoidance and reduced practice (Hembree, 1990; Skagerlund et al., 2019). These explanations are particularly relevant for individuals with DD, who often report elevated levels of MA compared to individuals without mathematical learning difficulties (Devine et al., 2018; Kucian et al., 2018; Lai et al., 2015).
Several additional factors may shape MA. Gender differences have been reported frequently, with females often reporting higher levels of MA than males (Devine et al., 2012; Hart & Ganley, 2019; Hill et al., 2016). However, these differences may partly reflect lower mathematics self-concept, stereotype effects, or greater willingness to report anxiety rather than actual performance differences (Bieg et al., 2015; Goetz et al., 2013; Sokolowski et al., 2019). Findings on gender differences in DD are also inconsistent and appear to depend strongly on diagnostic criteria. Specifically, absolute mathematics-performance cut-offs yield comparable prevalence rates for males and females, whereas discrepancy-based criteria comparing mathematics and reading performance tend to identify more females. This pattern appears to reflect females’ relatively stronger reading skills rather than greater mathematical impairment (Cantlon, 2022; Devine et al., 2013).
Similarly, the association between intelligence and MA remains inconclusive. Some studies report negative associations between MA and general or numerical intelligence (Schillinger et al., 2018; Svraka et al., 2024), whereas other findings suggest that MA is more closely related to mathematical competence than to general intellectual ability (Kucian et al., 2018).
Despite increasing interest in DD and MA, little is known about how adolescents and young adults with DD experience mathematical difficulties in everyday life. Available evidence suggests that low numeracy and DD may affect money management, time estimation, navigation, shopping, employment-related tasks, and confidence in daily situations involving numbers (Mutlu, 2024; Vigna et al., 2022). A recent study also identified number-related key deficits, daily struggles and broader emotional and behavioral consequences among university students with DD. Daily struggles particularly involved money use, time management, estimation, and applying mathematical concepts in real-life situations (Staller et al., 2025). Furthermore, few studies have examined whether interventions designed to improve mathematical skills also reduce MA, especially beyond childhood. Existing evidence from participants ranging from children to adults suggests that mathematics-focused, anxiety-focused, and combined interventions can reduce MA, with combined approaches showing particularly promising effects (Liu et al., 2026). However, long-term evidence for adolescents and young adults with DD remains limited.
The present study addresses these gaps by examining adolescents and young adults with DD in comparison with control participants. Specifically, it asks whether individuals with DD experience greater everyday mathematical difficulties and math anxiety (MA), which cognitive and sociodemographic factors are associated with MA, and whether MA contributes to everyday mathematical functioning beyond the cognitive characteristics of DD. Furthermore, it exploratively examines potential associations between participation in a targeted intervention and math anxiety (MA) and everyday mathematical difficulties in individuals with DD. Overall, the study aims to provide a comprehensive understanding of the cognitive, affective, and practical everyday consequences of DD beyond childhood.
2. Materials and Methods
2.1. Study Design and Data Sources
The present study was based on a pooled dataset comprising data from three different sources, namely the SMILE study, the NumRisk study, and clinical patient data from the Center for MR-Research of the University Children’s Hospital Zurich (for an overview of the sociodemographic characteristics see Table 1; for an overview of the data sources for each research question see Appendix A.1 Table A1). Data from these sources were combined depending on the respective research question.
Table 1.
Baseline Sociodemographic Characteristics of the Samples.
Data from the SMILE project (Development and Evaluation of an Intervention for Adolescents and Adults with Dyscalculia) were collected as part of a monocentric national intervention study conducted in Switzerland at the Center for MR-Research of the University Children’s Hospital Zurich and the Institute of Education of the University of Zurich. The SMILE project investigates adolescents and young adults with DD who participate in a mathematics intervention. The intervention is an individually tailored educational support program and based on “Mathe sicher können” (Prediger et al., 2017, 2026; Selter et al., 2025). Participants with DD receive 12 one-to-one intervention units with a trained educational specialist. Exercises are adapted to participants’ mathematical skills. Furthermore, manipulatives are used to build up mental representations. Participants without DD do not receive any intervention and serve as a control group (CG). The SMILE study is still ongoing. Consequently, all participants who were assessed up to 13 July 2026 were included in the present study.
Within the SMILE study, the Mathematics Anxiety Interview (MAI; Kohn et al., 2013) was administered at each assessment time point. The Numerical Behavior in Daily Life Questionnaire was assessed in participants with DD only after completion of the intervention. Cognitive measures and demographic information were also collected (see details below).
To increase statistical power for analyses involving mathematics anxiety (MA), additional patient data from the Center for MR-Research of the University Children’s Hospital Zurich were included. These data consisted primarily of demographic information and MAI scores from individuals diagnosed with DD who had consented to the use of their data for research purposes. Six duplicate cases overlapping with the SMILE sample were excluded.
The NumRisk (Neural origins of disrupted magnitude processing and risk taking in dyscalculia) study is a monocentric study conducted in Switzerland at Zurich Center for Neuroeconomics of the University of Zurich and the Center for MR-Research of the University Children’s Hospital Zurich. The NumRisk study comprised adolescents and young adults aged 15–23 years and included both participants with DD and controls. Because the Numerical Behavior in Daily Life Questionnaire was not administered before the intervention in the SMILE DD group, pre-intervention data from the NumRisk study were used as a cross-sectional comparison sample. Details of the cross-sectional analysis of everyday numerical difficulties, corresponding results, and the associated figure are provided in Appendix C.
2.2. Participants
Participants included a total of 198 adolescents, of which 130 had a diagnosis of DD (mean age 17.62, 106 female) and 68 served as controls (mean age 18.46, 55 female). The included data stem from participants of two scientific studies and patient data of the Center for MR-Research of the University Children’s Hospital.
The SMILE sample comprised 70 participants (35 participants with DD and 35 control participants). The DD group included 28 female and 7 male participants, with a mean age of 17.17 years. The control group included 27 female and 8 male participants, with a mean age of 17.66 years. Inclusion criteria for participants with DD in the SMILE study were an age between 14 and 27 years, a confirmed diagnosis of DD, written informed consent, sufficient availability and willingness to participate in the intervention, and a score of 73 points or below on the BASIS-MATH 4–8 test (Moser Opitz et al., 2010). Exclusion criteria were neurological disorders, contraindications according to the MR-safety guidelines of the Center for MR-Research of the University Children’s Hospital Zurich, pregnancy, use of medication that could affect neuronal activity (unless it could be discontinued 24 h before MRI measurement), and an IQ score below 70 on the WISC-V or WAIS-IV screener. The same criteria applied to control participants, except that they had to score in the normal range in mathematics (BASIS-MATH 4–8 score of 67 or above). Classification was based on the clinical diagnosis and additional assessment information rather than the BASIS-MATH 4–8 score alone: all participants with dyscalculia had a prior expert diagnosis and scored ≤73, whereas controls had no history of mathematical difficulties, reported no current difficulties, and had sufficient or good mathematics grades, although some also scored within the BASIS-MATH 4–8 tolerance range (67–73).
The additional patient sample from the Center for MR-Research comprised 63 participants, including 51 female and 12 male participants, with a mean age of 17.09 years. Inclusion criteria for the patient sample were an age between 14 and 27 years, a confirmed diagnosis of DD, and consent for the continued use of the collected data for research purposes.
Inclusion criteria for participants with DD in the NumRisk sample were an age between 15 and 23 years, a confirmed diagnosis of DD, and general cognitive abilities within the IQ range of 75–120 as assessed with the IDS screening. The same age and cognitive criteria applied to the NumRisk control group. However, control participants had no diagnosis of DD and had not received any mathematical intervention. The NumRisk sample comprised 65 participants after exclusion of one duplicate case. The DD group included 32 participants, of whom 27 were female and 5 were male, with a mean age of 19.16 years. The control group included 33 participants, of whom 28 were female and 5 were male, with a mean age of 19.3 years.
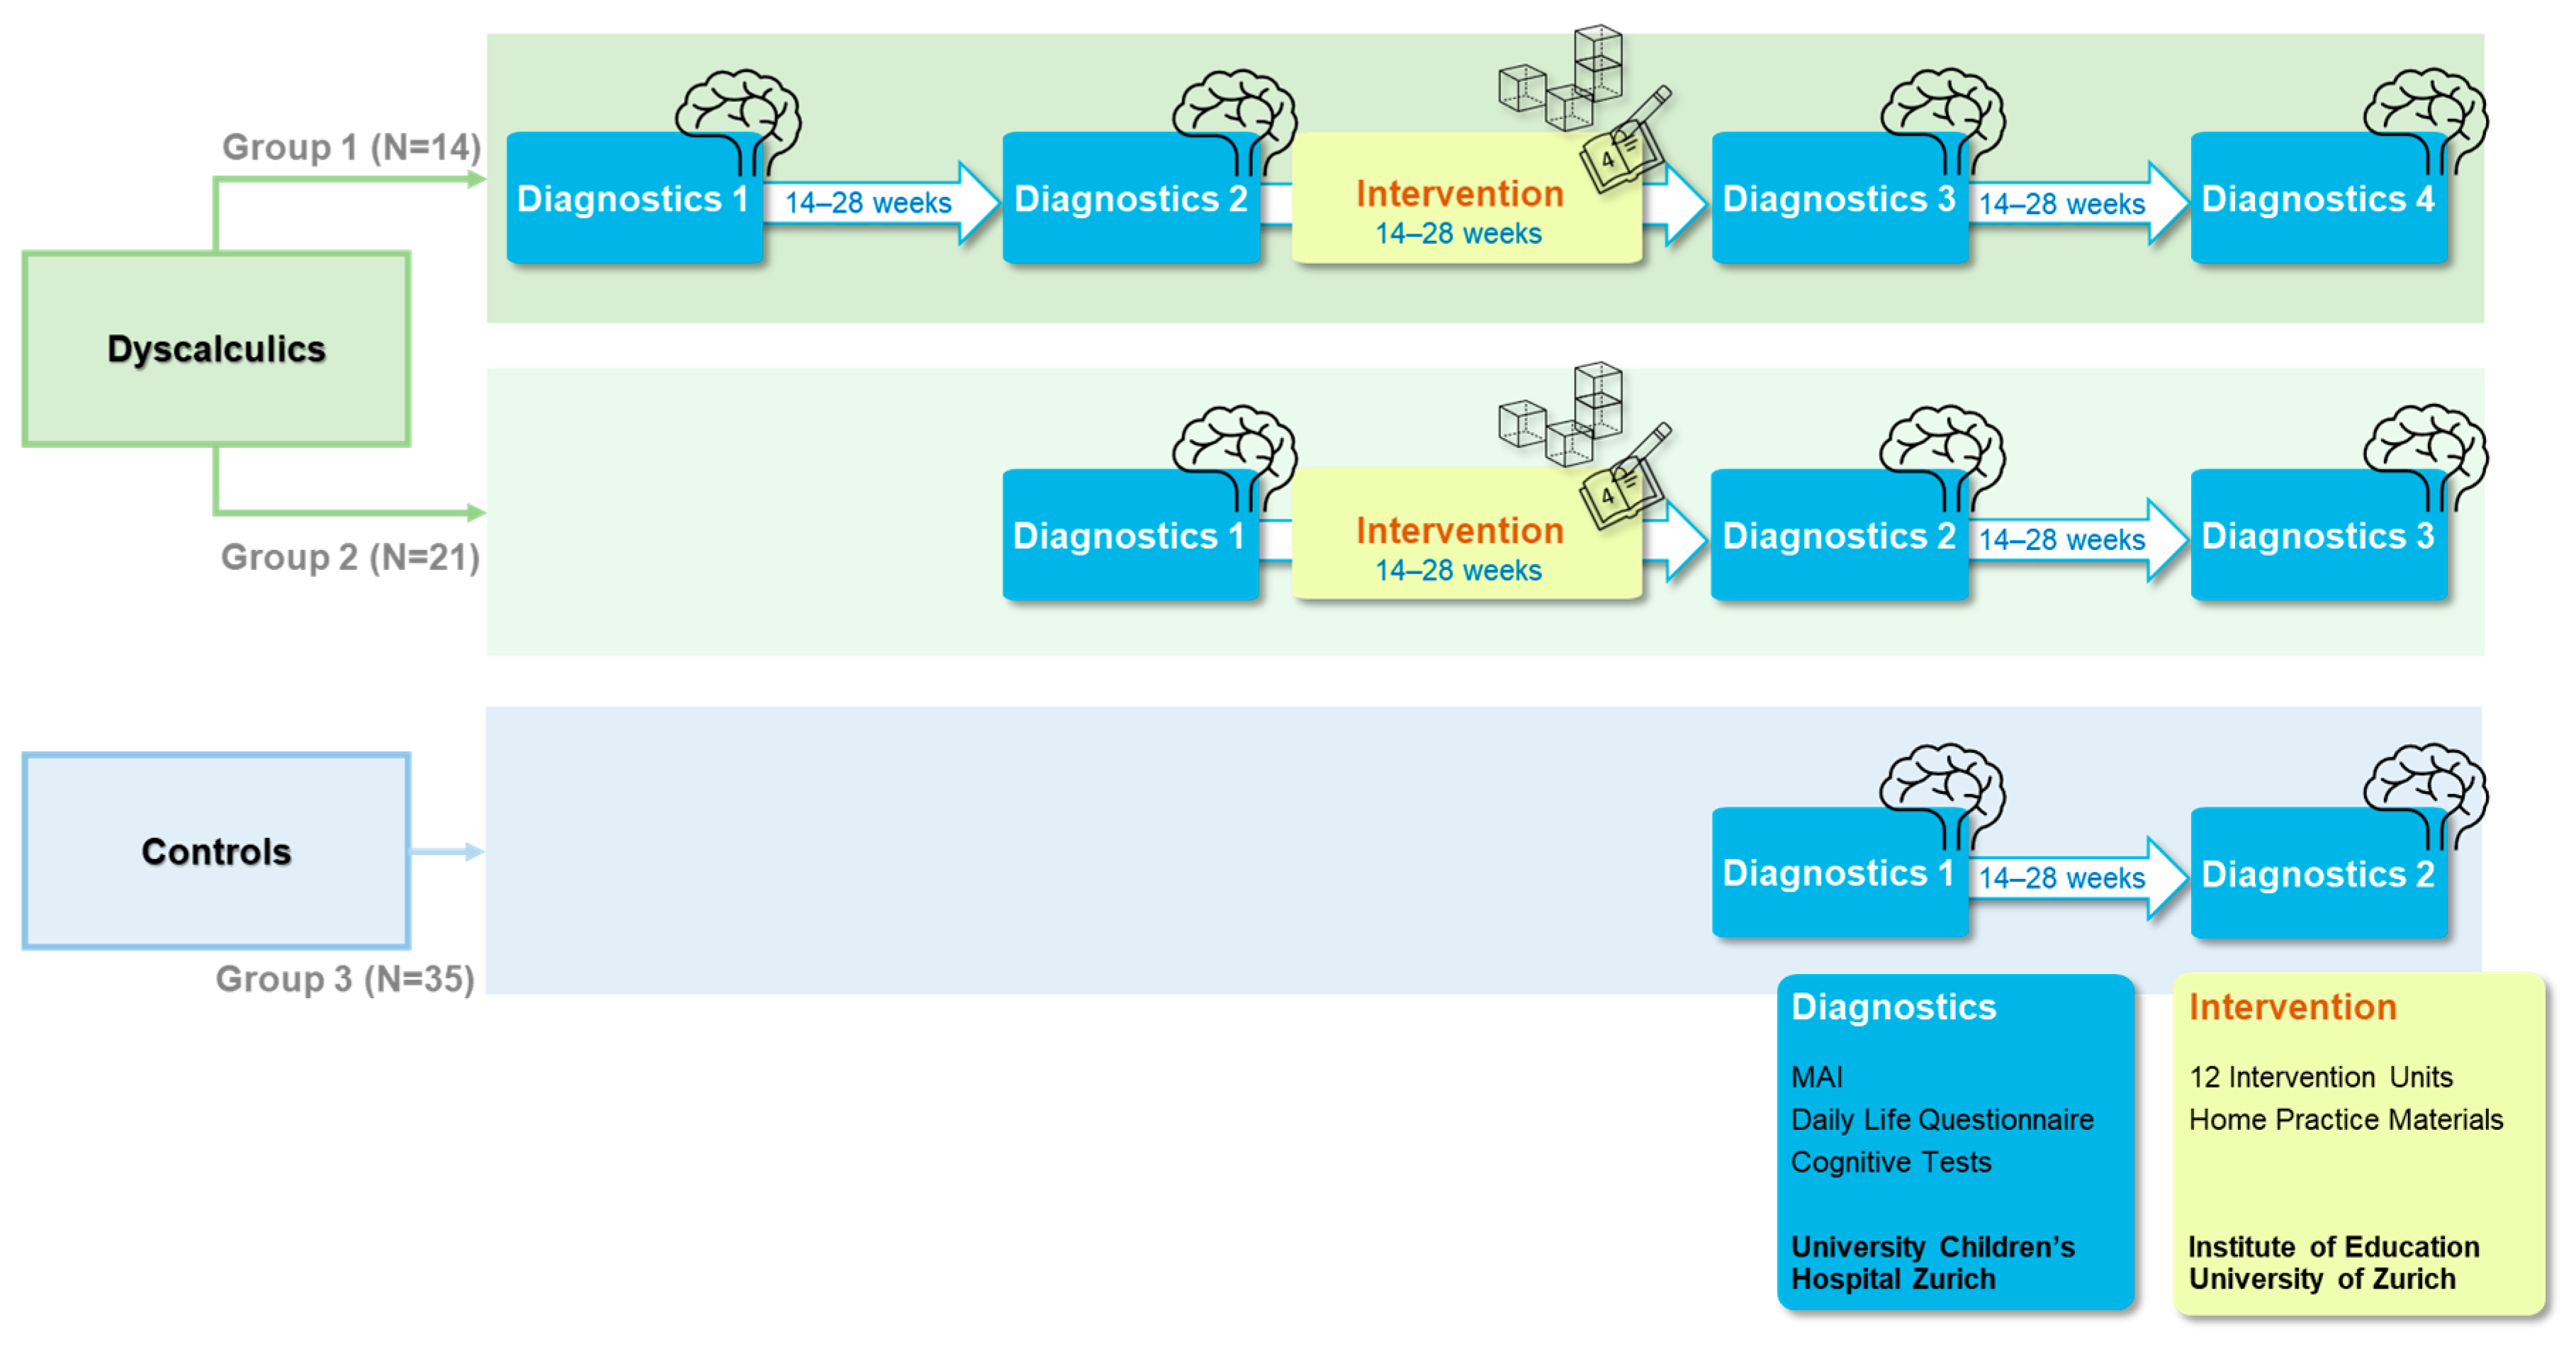
Participants with DD in the SMILE study were assigned to two subgroups. Dyscalculia Group 1 completed an additional pre-intervention assessment 14 to 28 weeks before the start of the intervention, resulting in four assessment time points. This extended baseline was included to strengthen causal interpretation of intervention-related changes. Dyscalculia Group 2 completed three assessment time points. Control participants completed two assessments separated by 14 to 28 weeks (see Appendix A.3 Figure A1). Participants from the patient population of the University Children’s Hospital and the NumRisk study were assessed once.
2.3. Measures
2.3.1. Mathematics Anxiety Interview
Mathematics anxiety was assessed using the self-report Mathematics Anxiety Interview (MAI), which was developed for German-speaking populations (Kohn et al., 2013). The MAI includes four mathematics-related situations, such as being in math class, doing math homework, prior to a math test, and while shopping. Each situation is presented verbally and visually. Participants rate statements reflecting affective, cognitive, behavioral, and physiological components of anxiety on a scale from 0 (does not apply at all) to 3 (applies completely). In addition, participants are asked to rate their overall anxiety in each situation using an anxiety thermometer ranging from 0 to 10. The total score ranges from 0 to 88, with higher scores indicating higher mathematics anxiety. The MAI has shown high internal consistency (Cronbach’s α = 0.90) and satisfactory criterion validity (Kohn et al., 2013).
2.3.2. Numerical Behavior in Daily Life Questionnaire
Everyday mathematical difficulties were assessed using the self-report Numerical Behavior in Daily Life Questionnaire, which was developed within the NumRisk study. The questionnaire consists of 14 verbally presented everyday situations involving numerical or mathematical behavior. Participants indicate how often each statement applies to them on a 5-point Likert scale ranging from 1 (never) to 5 (very often). Items refer to everyday numerical situations such as handling money, estimating quantities, managing time, or dealing with numerical information in daily life. Higher scores indicate greater everyday mathematical difficulties (range: 14–70). Although exploratory analyses suggested a potentially multidimensional structure, a total score was calculated to provide a broad composite measure of self-reported mathematical difficulties across diverse everyday numerical contexts. The Numerical Behavior in Daily Life Questionnaire demonstrated good internal consistency in the present sample (Cronbach’s α = 0.87; McDonald’s ω = 0.87; N = 103) (see Appendix A.4).
2.3.3. Intelligence and Working Memory
Cognitive abilities were assessed using standardized intelligence measures. The Stanford–Binet Intelligence Scales, Fifth Edition (SB-5) Screening Tool was used to assess fluid reasoning through the non-verbal Matrices subtest and knowledge through the verbal Vocabulary subtest. Working memory was assessed using the SB-5 working memory subtests, including verbal and non-verbal tasks. The SB-5 has high reliability for intelligence scores (Grob et al., 2019).
In addition, the WISC-V or WAIS-IV screening tools were administered as supplementary estimates of cognitive ability. The WISC-V was used for participants aged 14.0 to 15.11 years, whereas the WAIS-IV was used for participants aged 16 years and older. For both instruments, the Matrix Reasoning and Vocabulary subtests were administered. Both instruments show excellent reliability for total scores (Wechsler, 2012, 2017). The reliability of the short form of the WAIS-IV was reported to be high (r = 0.94). The correlation between the full-Scale IQ and the short-form IQ was r = 0.86, indicating a strong association between the two scores. Differences between the two forms fell within the critical value limits for 71% of the sample at p = 0.15 (Daseking et al., 2014).
2.3.4. Mathematical Performance
Mathematical performance was assessed using the Basis-Math 4–8 and the Decimals, Fractions, and Percentages Test. The Basis-Math 4–8 assesses fundamental mathematical competencies and is particularly sensitive in the lower performance range. It consists of 48 tasks covering basic arithmetic operations, calculation strategies, place-value understanding, counting skills, understanding of arithmetic operations, and mathematical reasoning. The instrument has high internal consistency (α = 0.92) and good split-half reliability (Moser Opitz et al., 2010).
The Decimals, Fractions, and Percentages Test consists of 46 items covering mental arithmetic, the place-value system, fractions, decimals, and percentages. It was developed at the Institute of Education of the University of Zurich and is based on previous work on mathematical learning and assessment (Holzer et al., 2017; Kuhl et al., 2022; Moser Opitz et al., 2021).
2.3.5. Statistical Analysis
All statistical analyses were conducted in R (version 4.5.3) using RStudio (2026.09). Descriptive statistics were calculated as means (M), standard deviations (SD), and frequencies. Analyses were based on available data, with missing observations excluded from the respective analyses. Consequently, sample sizes varied across research questions. The data sources are summarized in Appendix A.1 Table A1, while sample sizes, assessment time points, and statistical analyses are detailed in Appendix A.2 Table A2.
Statistical assumptions were assessed using Shapiro–Wilk tests, Levene’s tests, and graphical inspection where appropriate. Group differences were examined using Welch’s t-tests or Wilcoxon rank-sum tests, depending on distributional assumptions. Pearson correlations were used when parametric assumptions were met and Spearman correlations otherwise. Potential outliers in the age–mathematics anxiety association were assessed using Rosner’s test and Cook’s distance, followed by sensitivity analyses excluding one influential observation and applying Kendall’s tau.
Pre–post changes in mathematics anxiety were examined using paired-samples t-tests. Educational attainment and the independent-cohort comparison were analyzed exploratorily. Multiple item-level comparisons were adjusted using the Holm method. The main group comparisons, the association between everyday mathematical difficulties and mathematics anxiety, and the pre–post analysis of mathematics anxiety were treated as primary analyses, while additional subgroup and sensitivity analyses were interpreted cautiously. The significance level was set at α = 0.05, and effect sizes were reported where applicable.
2.4. Ethical Approval and Data Availability
The study involved human participants and was conducted in accordance with applicable ethical and data protection requirements. Ethical approval was obtained from the local ethics committee. All participants, or their legal guardians where applicable, provided informed consent before participation.
3. Results
Descriptive statistics for all measures and samples, including sample sizes (N), means (M), and standard deviations (SD), are presented in Table 2. The statistics are reported separately for participants with developmental dyscalculia (DD) and participants in the control group (CG) across the SMILE and NumRisk samples, as well as for the additional patient sample. The table includes scores from the Mathematics Anxiety Interview (MAI), the Numerical Behavior in Daily Life Questionnaire, and the cognitive and mathematical performance measures.
Table 2.
Behavioral Data of the Samples.
3.1. Everyday Mathematical Difficulties in Participants with DD and Controls
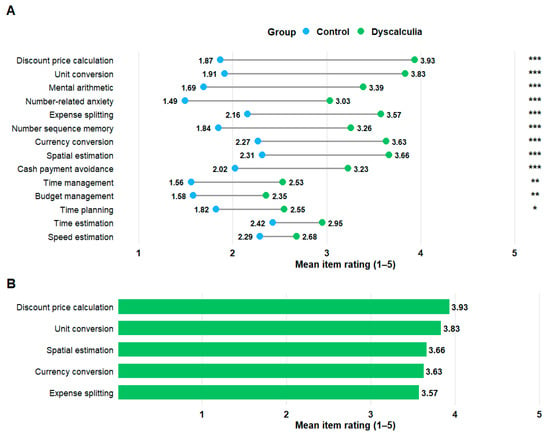
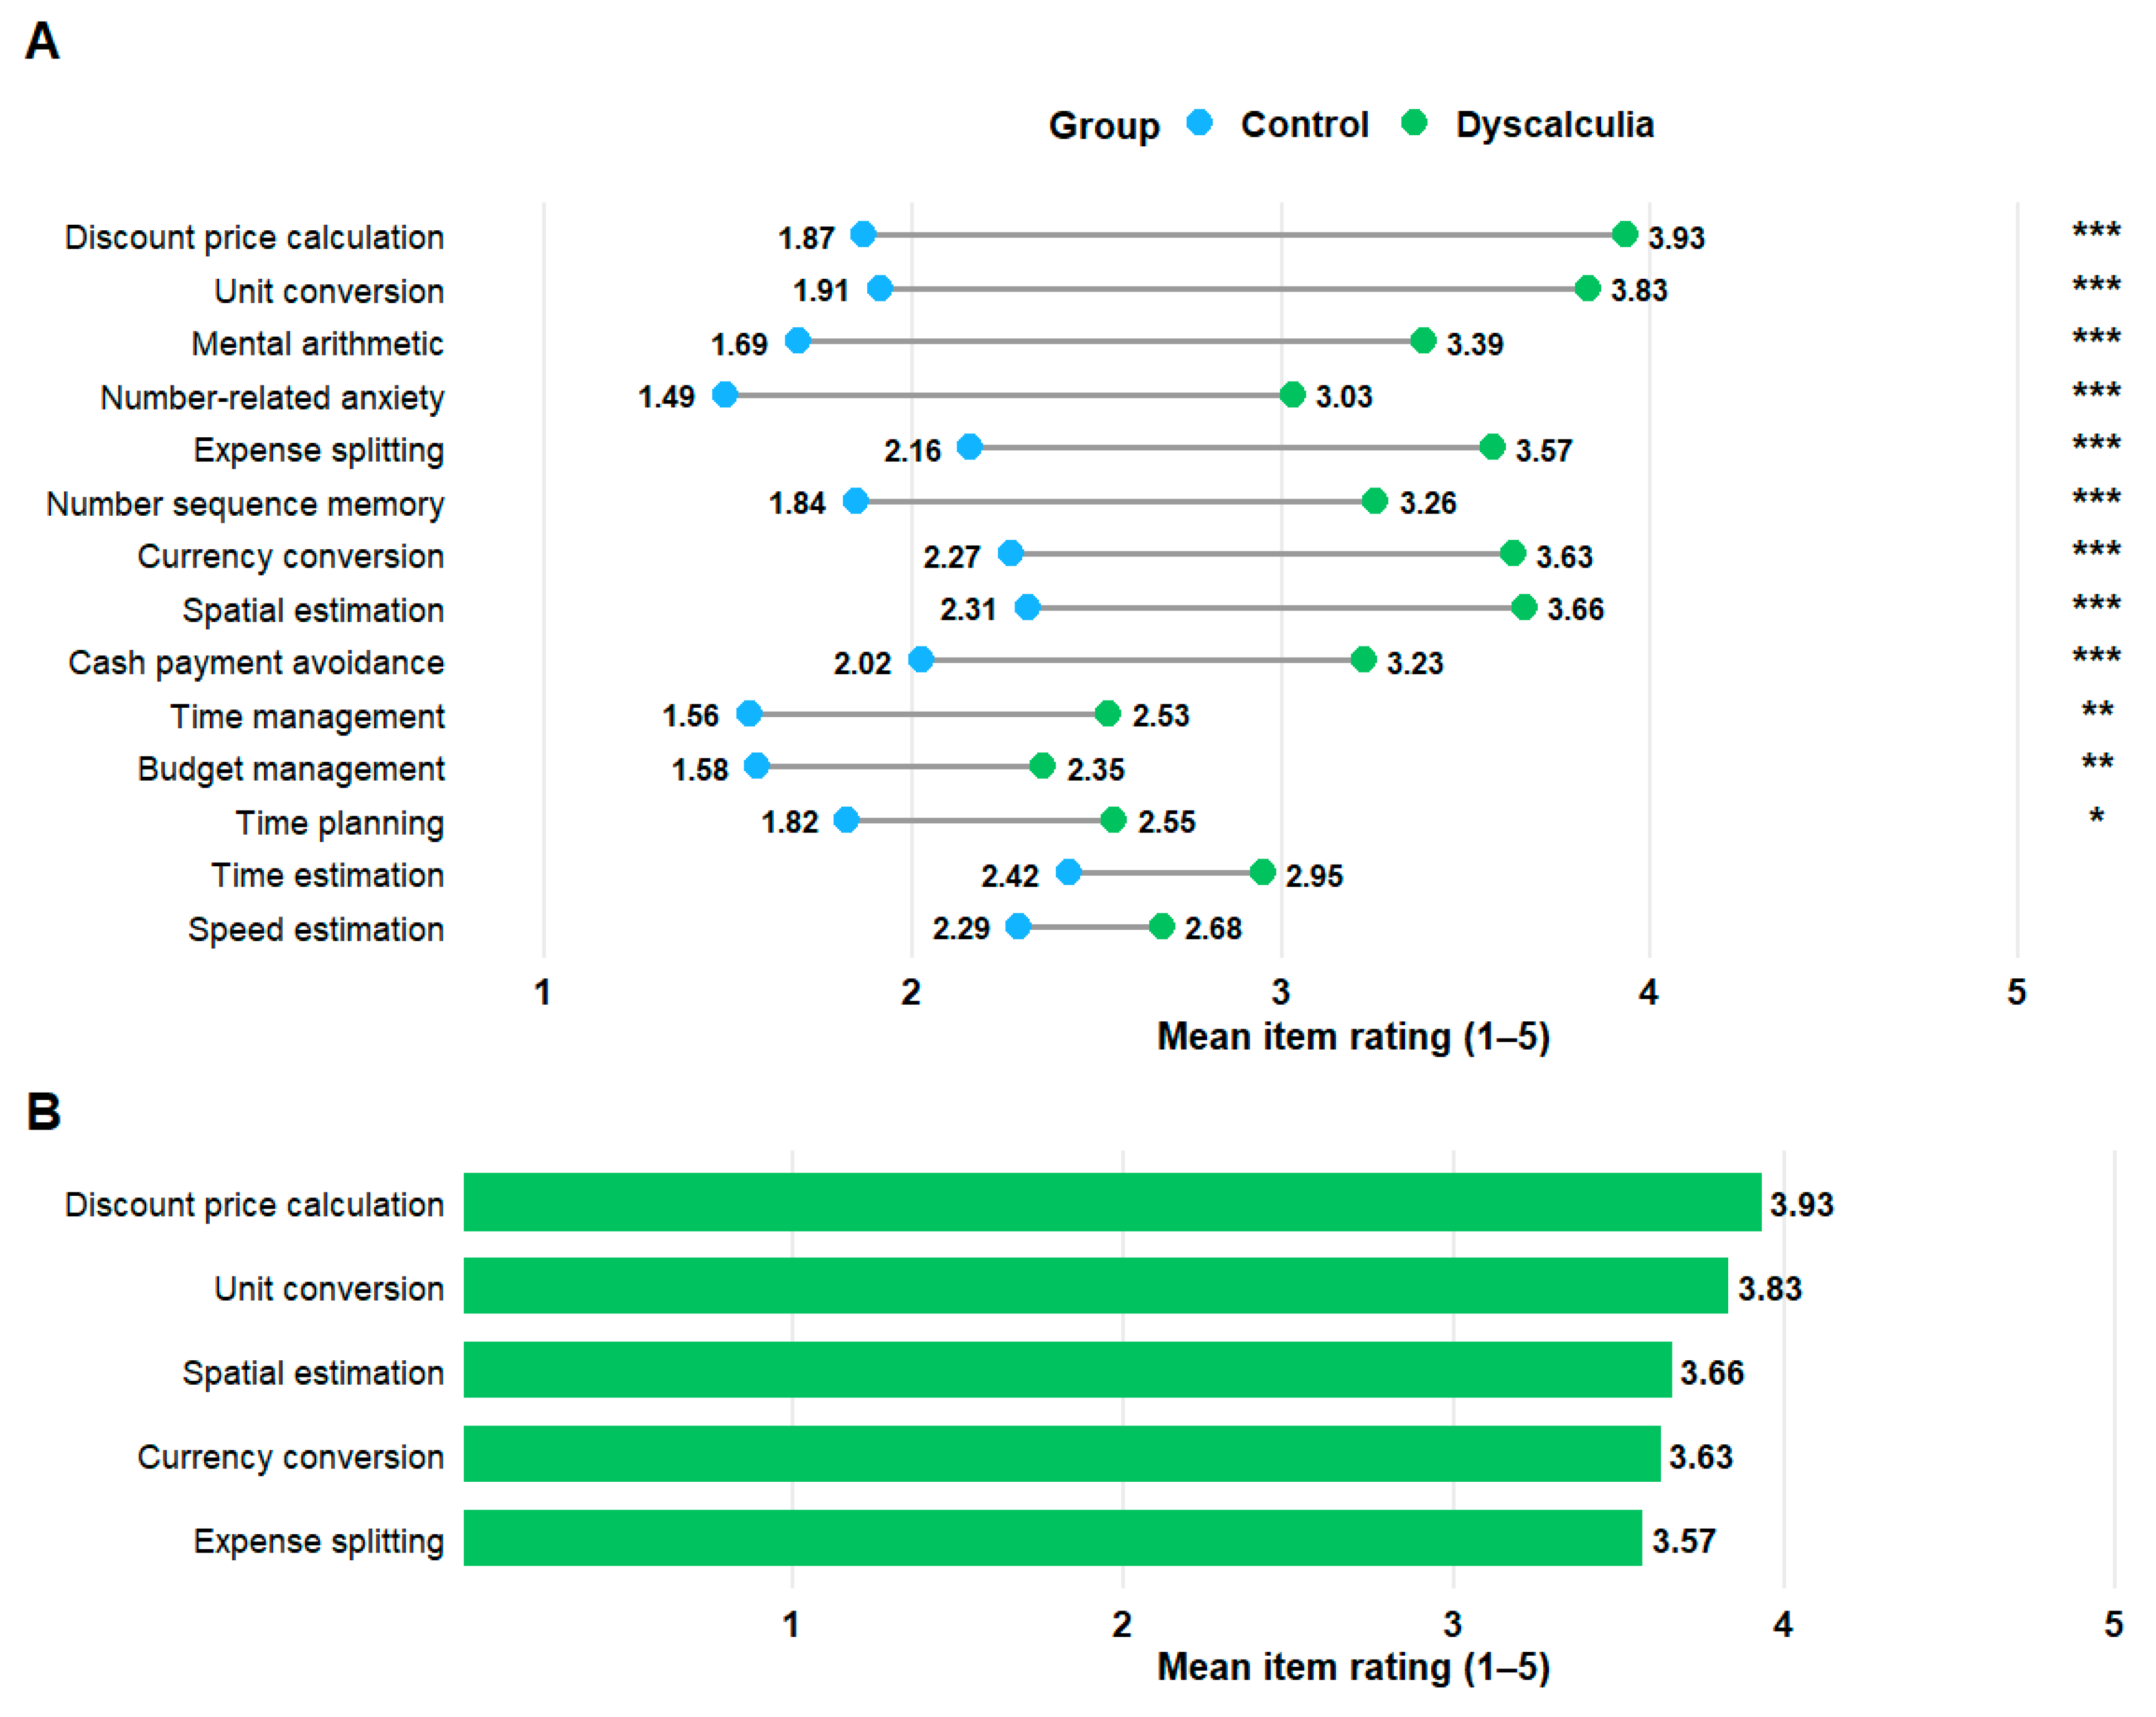
Everyday mathematical difficulties were examined at item level and at total-score level. Item-level descriptive statistics showed that participants with DD reported the highest mean scores for discount price calculation, unit conversion, estimation of lengths, heights, and distances, expense splitting, and currency conversion (see Figure 1). Moderate mean scores were observed for simple mental calculations, memory of digit sequences, cash payments, time estimation, and anxiety in number-related everyday situations. Lower mean scores were observed for speed estimation, time management, time planning, and budget management.
Figure 1.
Item-Level Group Differences and Most Pronounced Everyday Mathematical Difficulties in Dyscalculia. (A) Mean item ratings for the DD and CG group across the 14 everyday mathematical situations. Items are ordered by the magnitude of the mean difference between groups, from largest to smallest. Higher scores indicate greater self-reported difficulties. Significance levels are based on Holm-adjusted p values (* p < 0.05, ** p < 0.01, *** p < 0.001). (B) The five items with the highest mean ratings in the DD group, representing the everyday mathematical situations in which participants with DD reported the greatest difficulties.
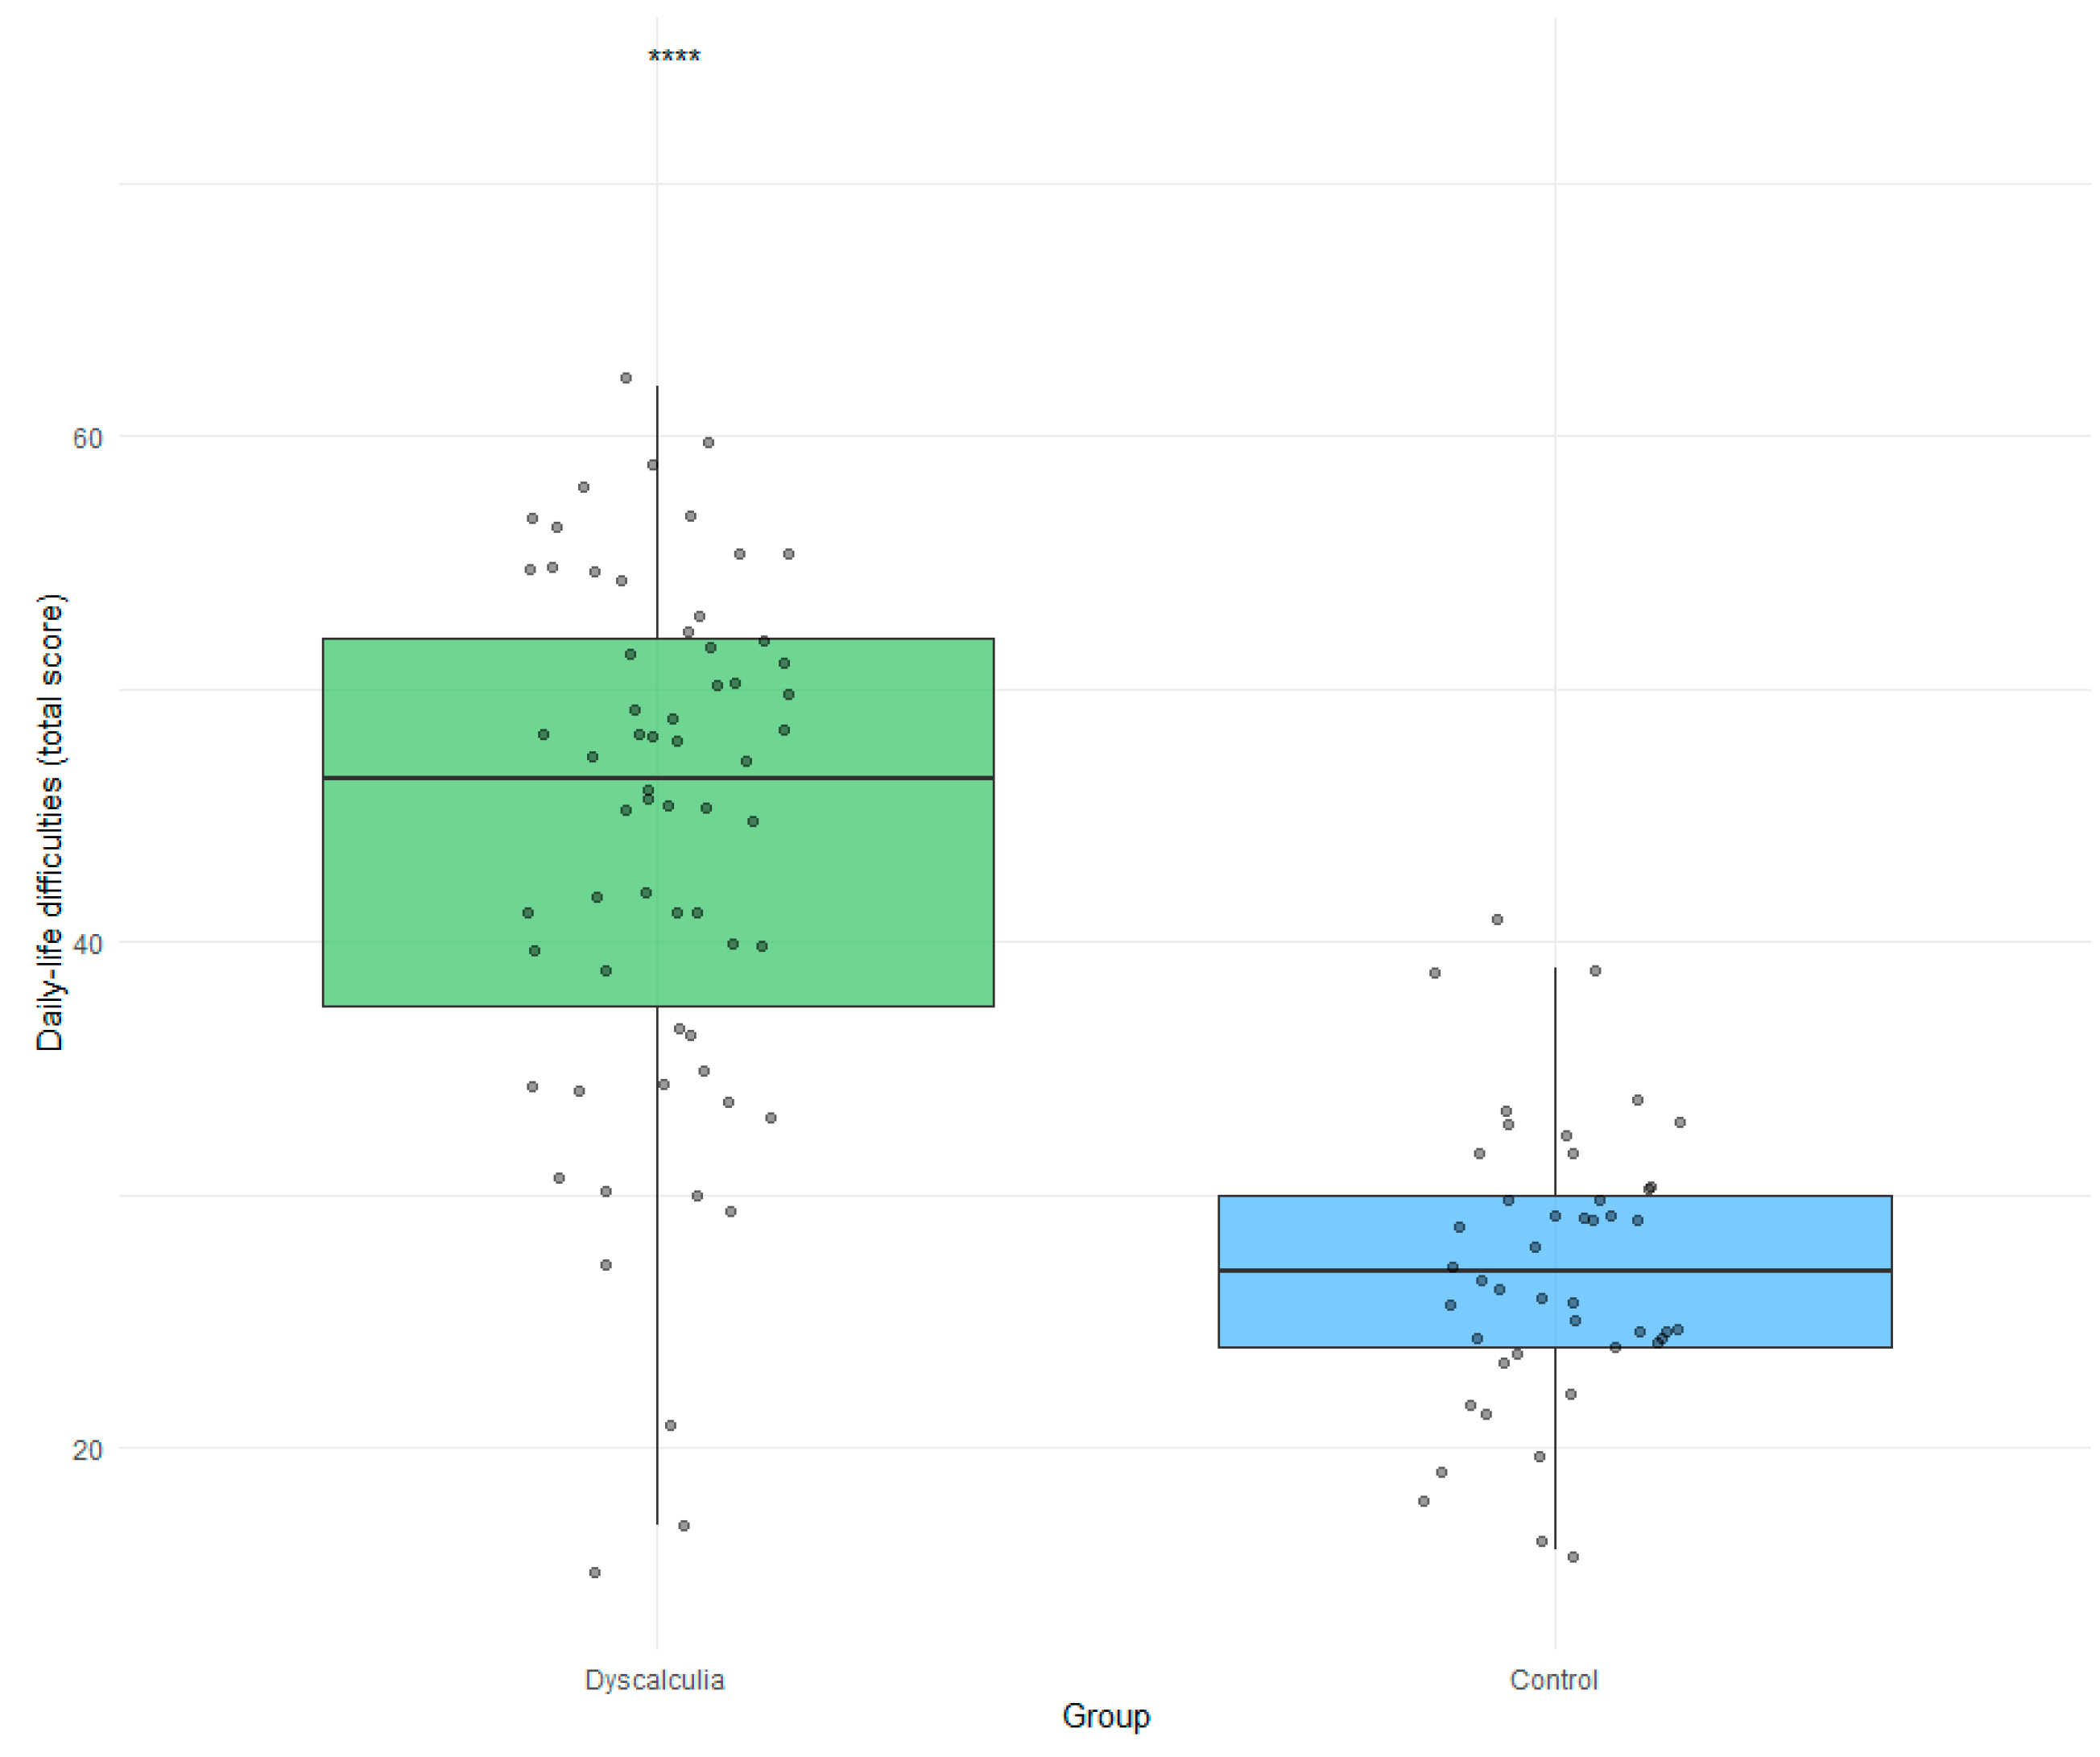
The mean total score was 44.29 (SD = 10.57) in the DD group (N = 62) and 27.22 (SD = 5.60) in the control group (N = 45). The group comparison revealed W = 2554.50, p < 0.001, rrb = 0.831, 95% CI [0.748, 0.888] (see Appendix B.1). After Holm correction for multiple comparisons, statistically significant group differences were observed for 12 of the 14 items (see Table 3).
Table 3.
Group Comparison of Everyday Mathematical Difficulties.
The largest item-level group differences were observed for unit conversion (rrb = 0.742) and discount price calculation (rrb = 0.739). Further significant group differences were found for simple mental calculations (rrb = 0.630), anxiety in number-related everyday situations (rrb = 0.613), currency conversion (rrb = 0.568), expense splitting (rrb = 0.559), estimation of lengths, heights, and distances (rrb = 0.568), memory for number sequences (rrb = 0.553), cash payment avoidance (rrb = 0.416), time management (rrb = 0.360), budget management (rrb = 0.325), and time planning (rrb = 0.258) (see Figure 1). No significant group differences after Holm correction were found for time estimation (item 7) and speed estimation (item 11) in traffic situations.
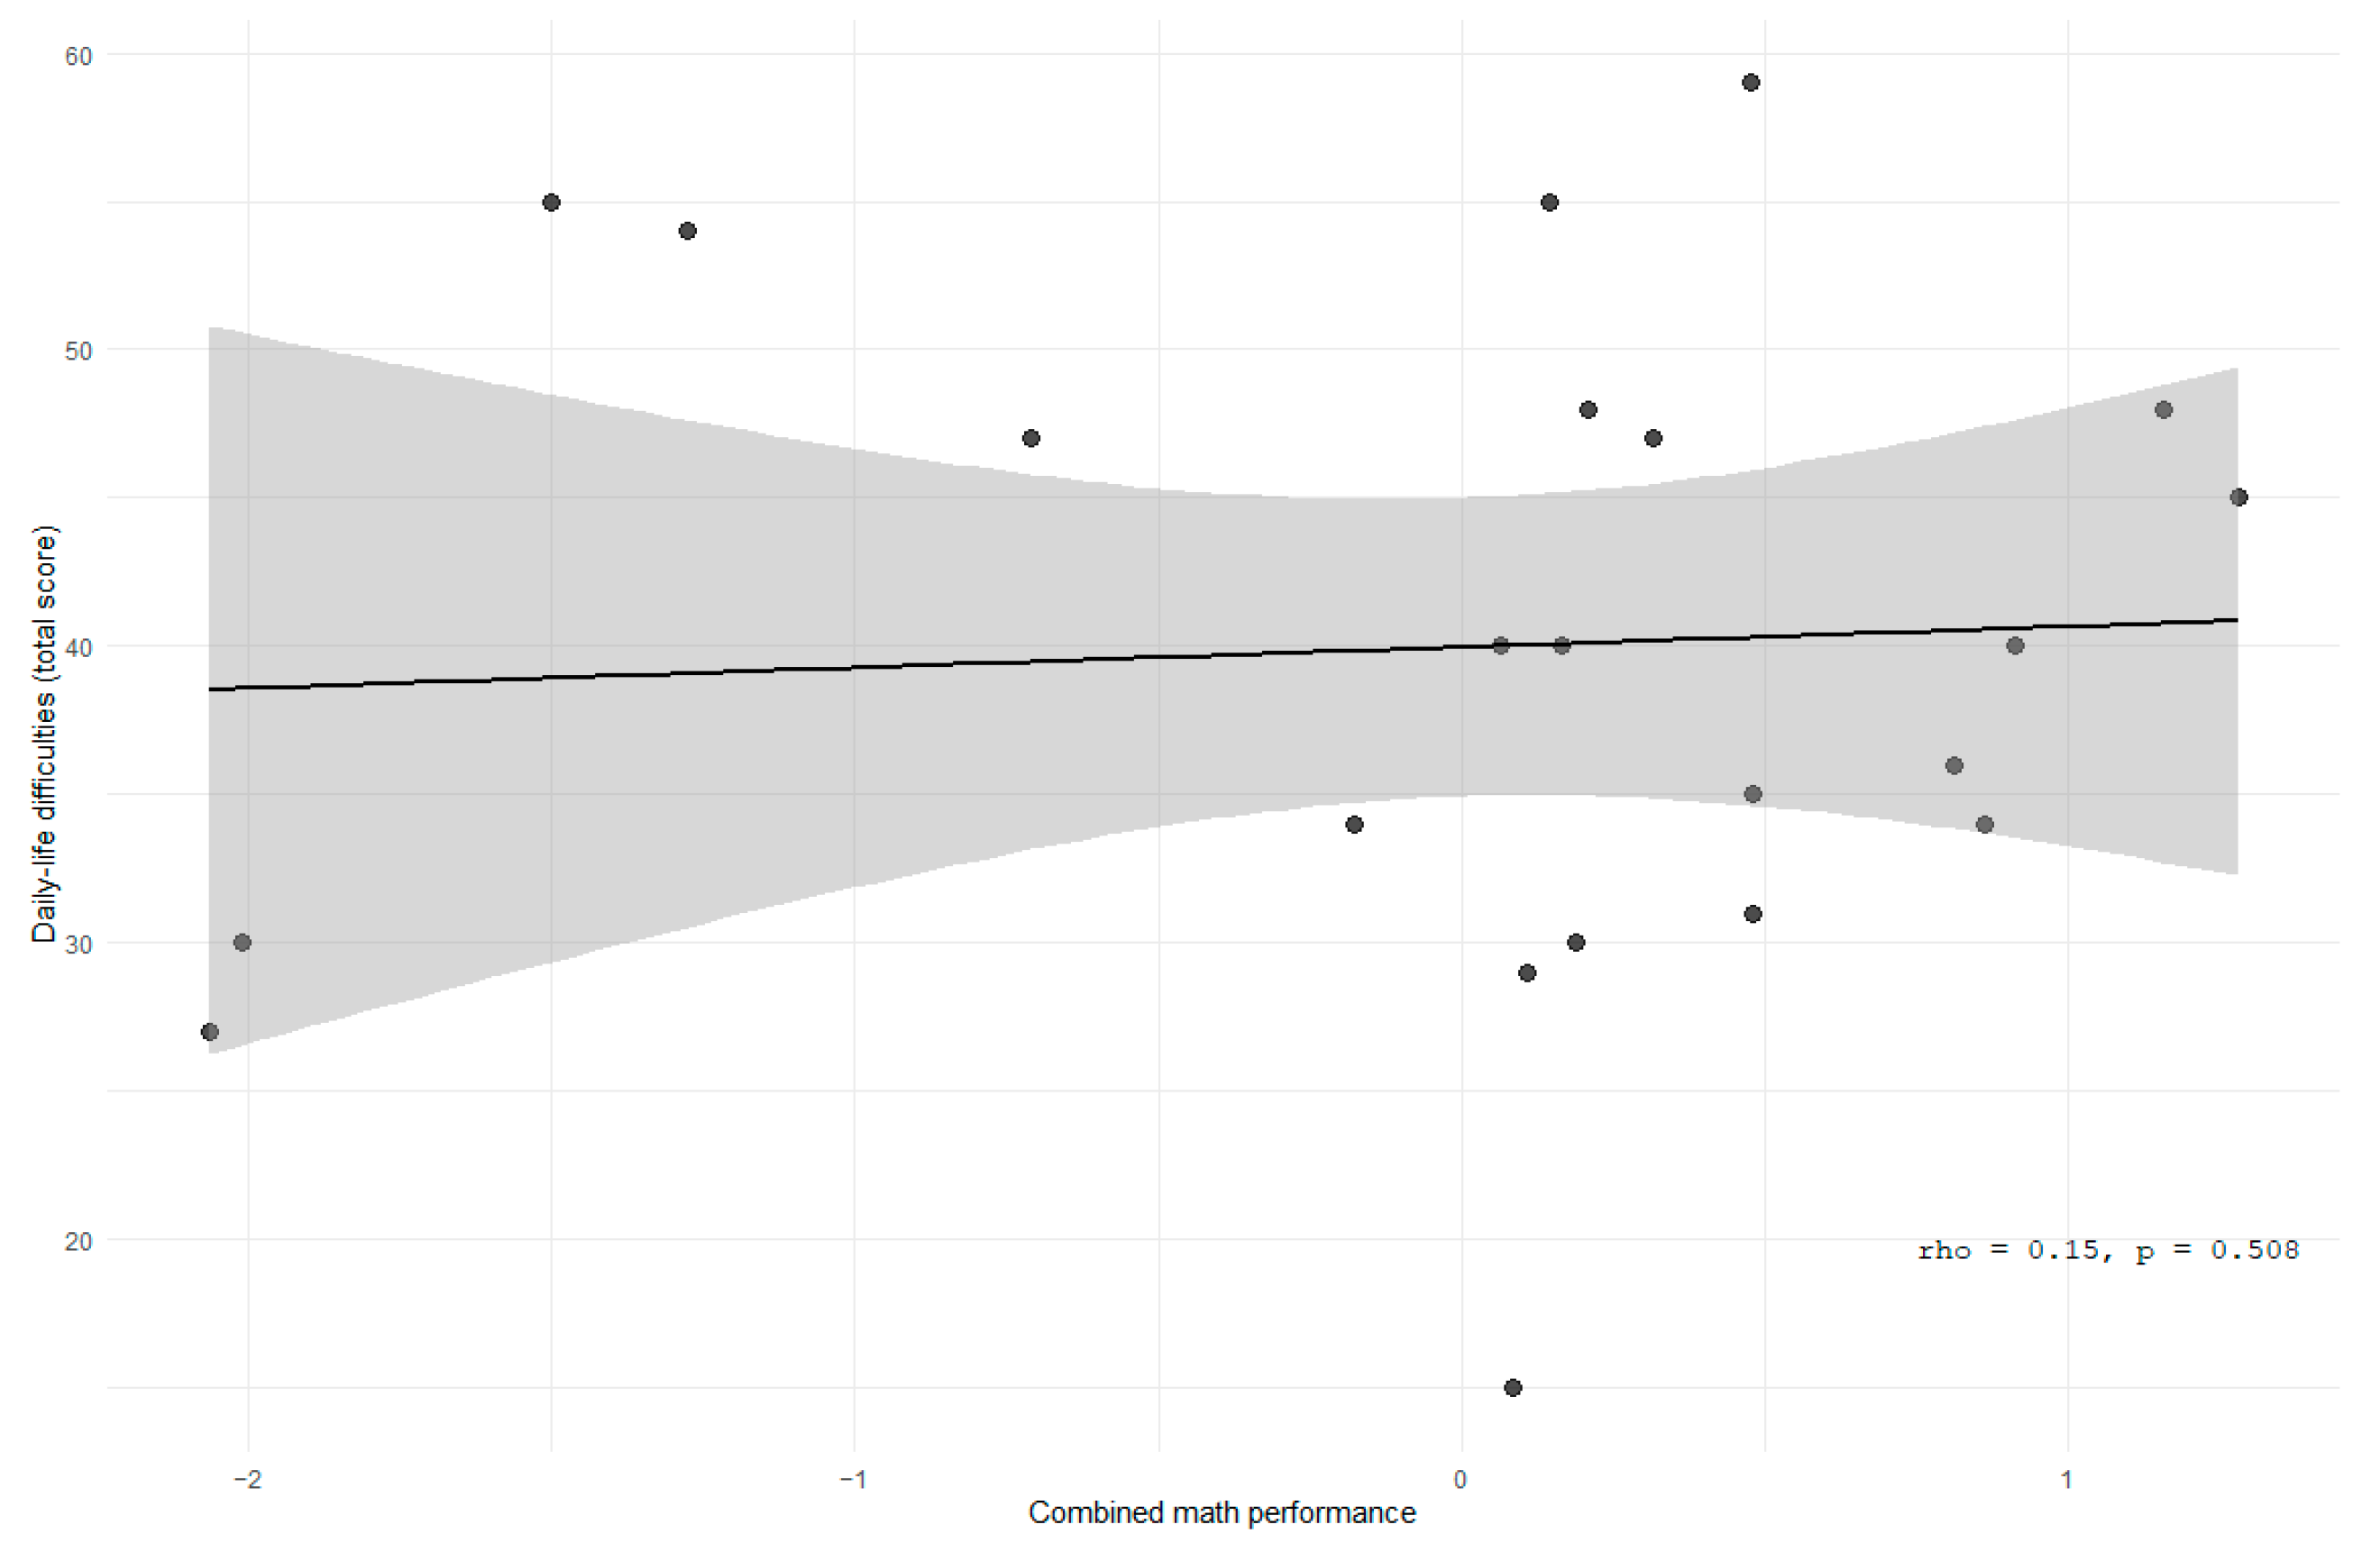
Mathematical performance was not significantly associated with everyday mathematical difficulties within the DD group, N = 22, ρ = 0.149, p = 0.508 (see Appendix B.2).
3.2. Mathematics Anxiety in Participants with DD and Controls
3.2.1. MA and Sociodemographic Factors
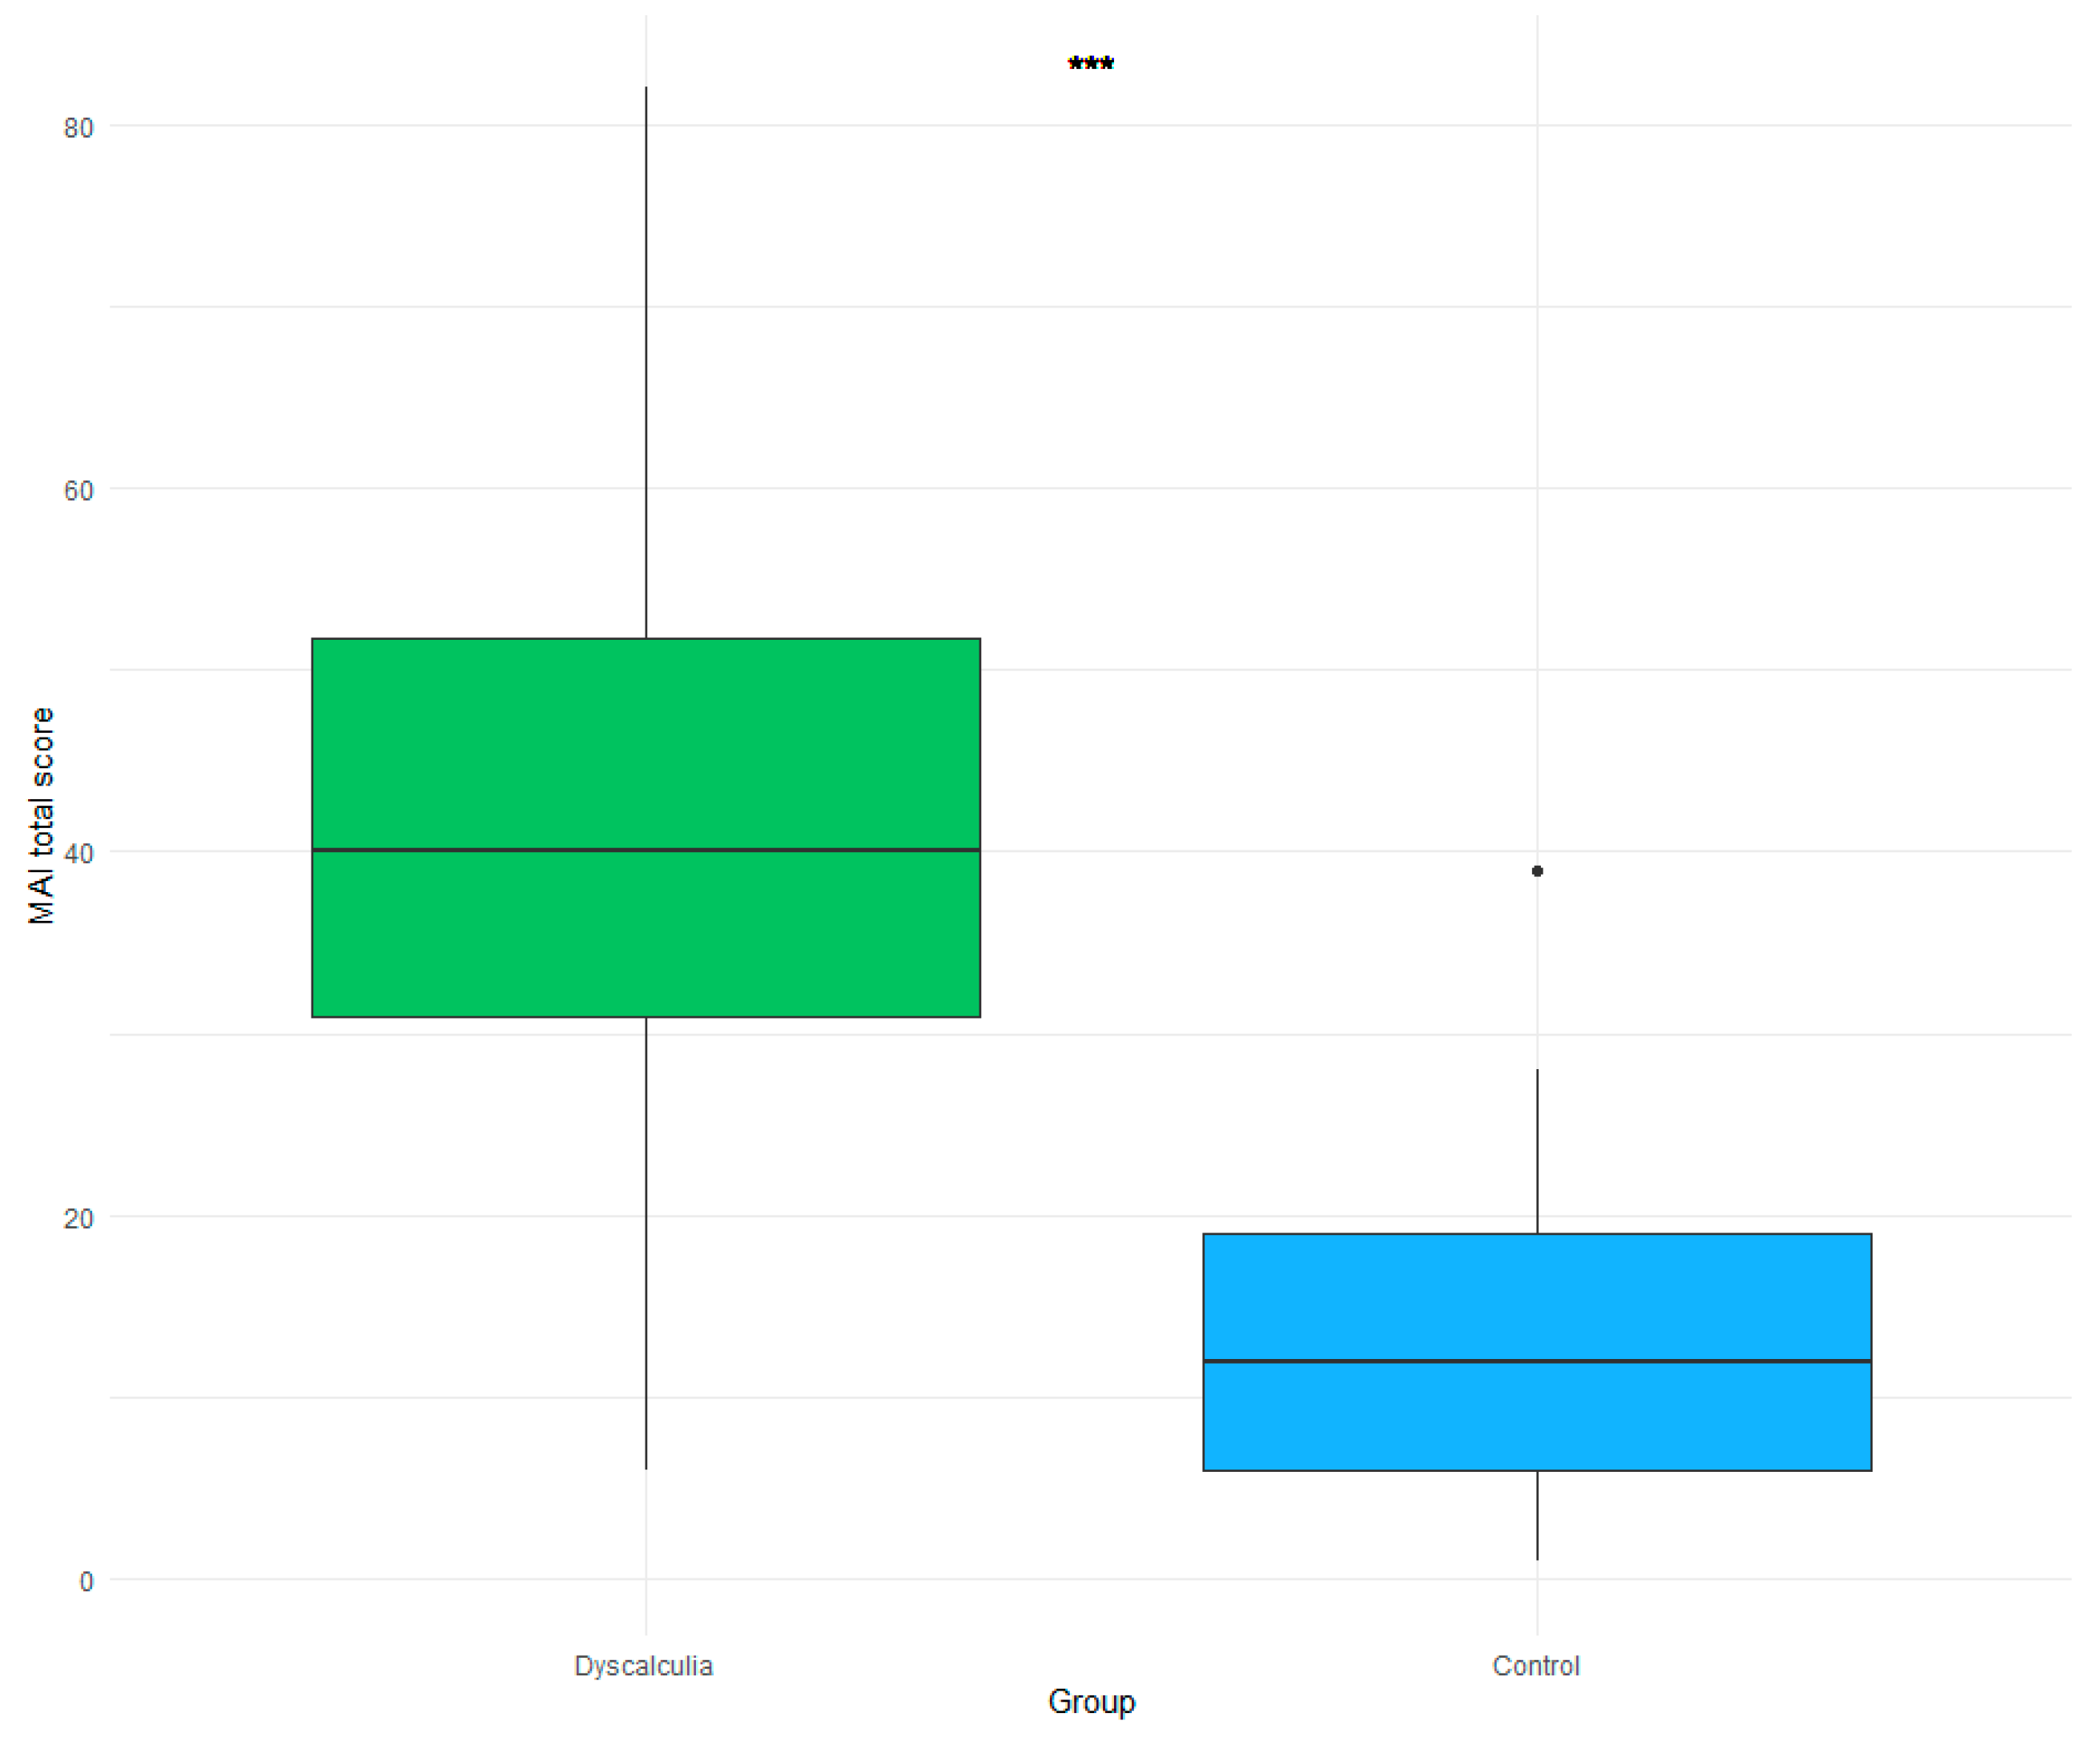
Participants with DD (N = 98) reported higher mathematics anxiety scores (M = 41.21, SD = 17.15) than controls (N = 35, M = 13.03, SD = 8.68). The group difference was significant, t = 12.42, p < 0.001, d = 2.07, 95% CI [23.69, 32.68] (see Appendix B.4 Figure A5).
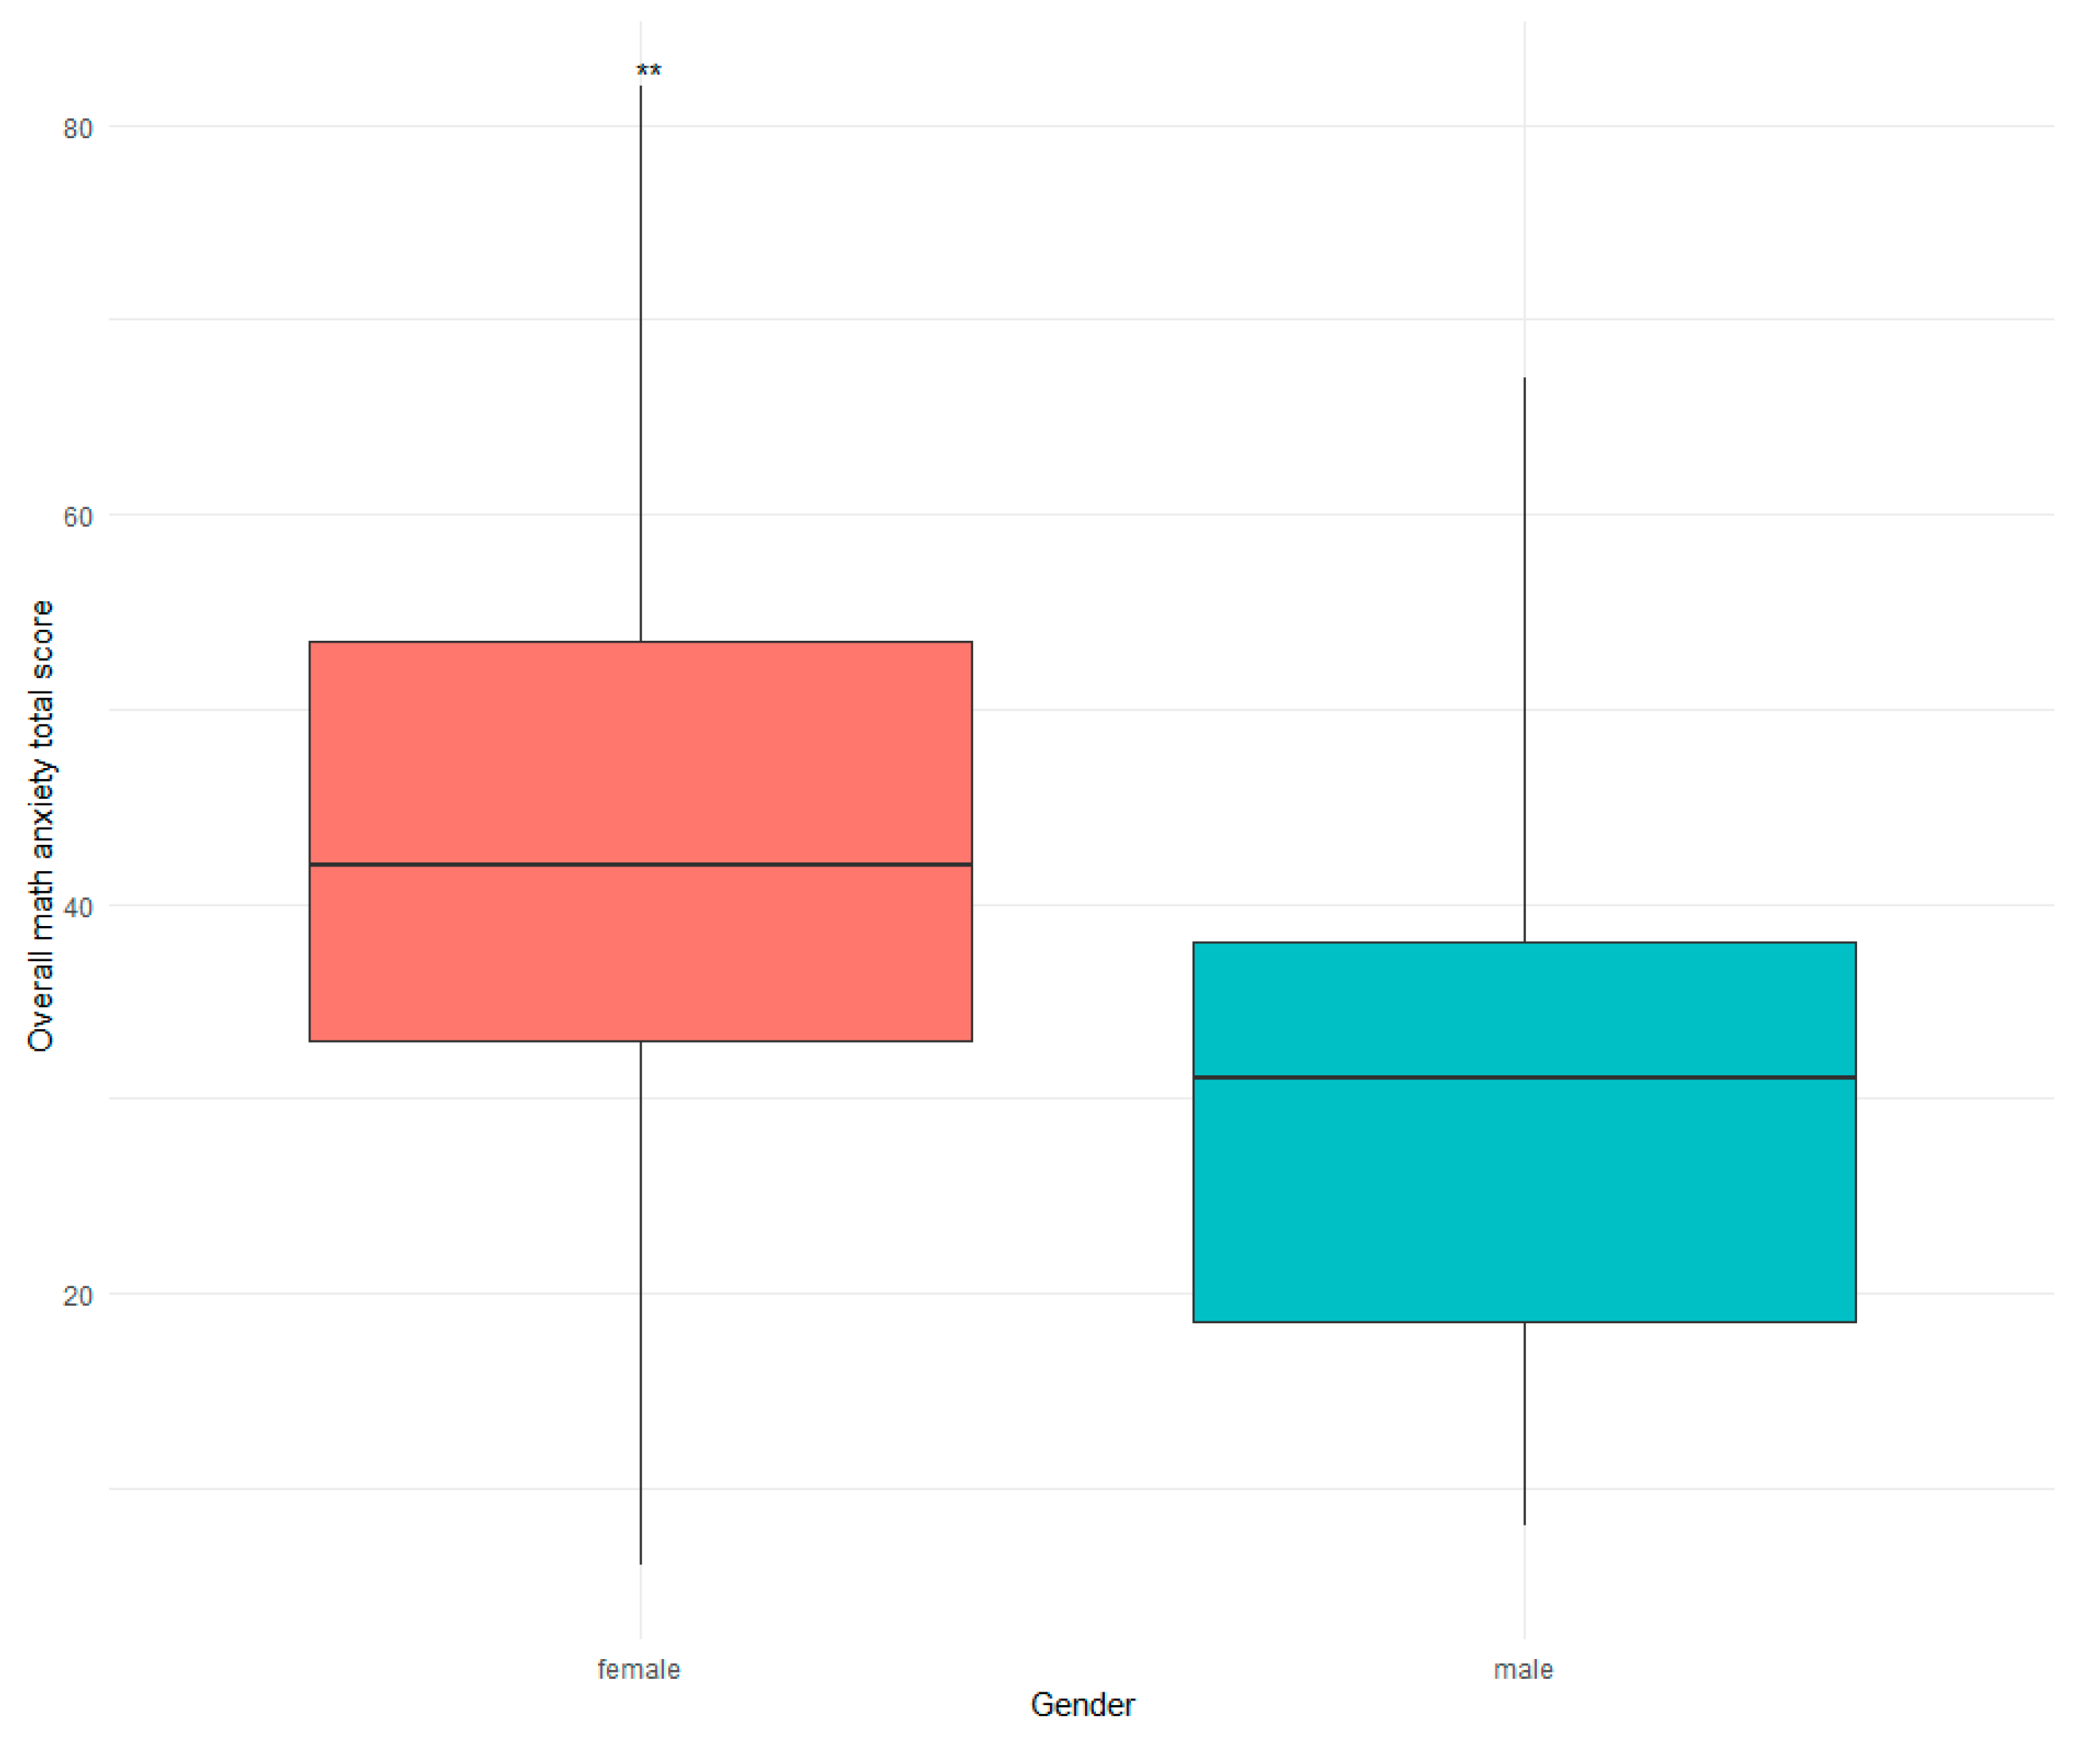
Within the DD group, female participants (N = 79) exhibited a higher mean mathematics anxiety score of 43.71 (SD = 16.84), while male participants (N = 19) demonstrated a mean score of 30.84 (SD = 14.69). The gender difference was significant, t(30.46) = 3.33, p = 0.002, d = 0.78, 95% CI [4.97, 20.76] (see Appendix B.5 Figure A6).
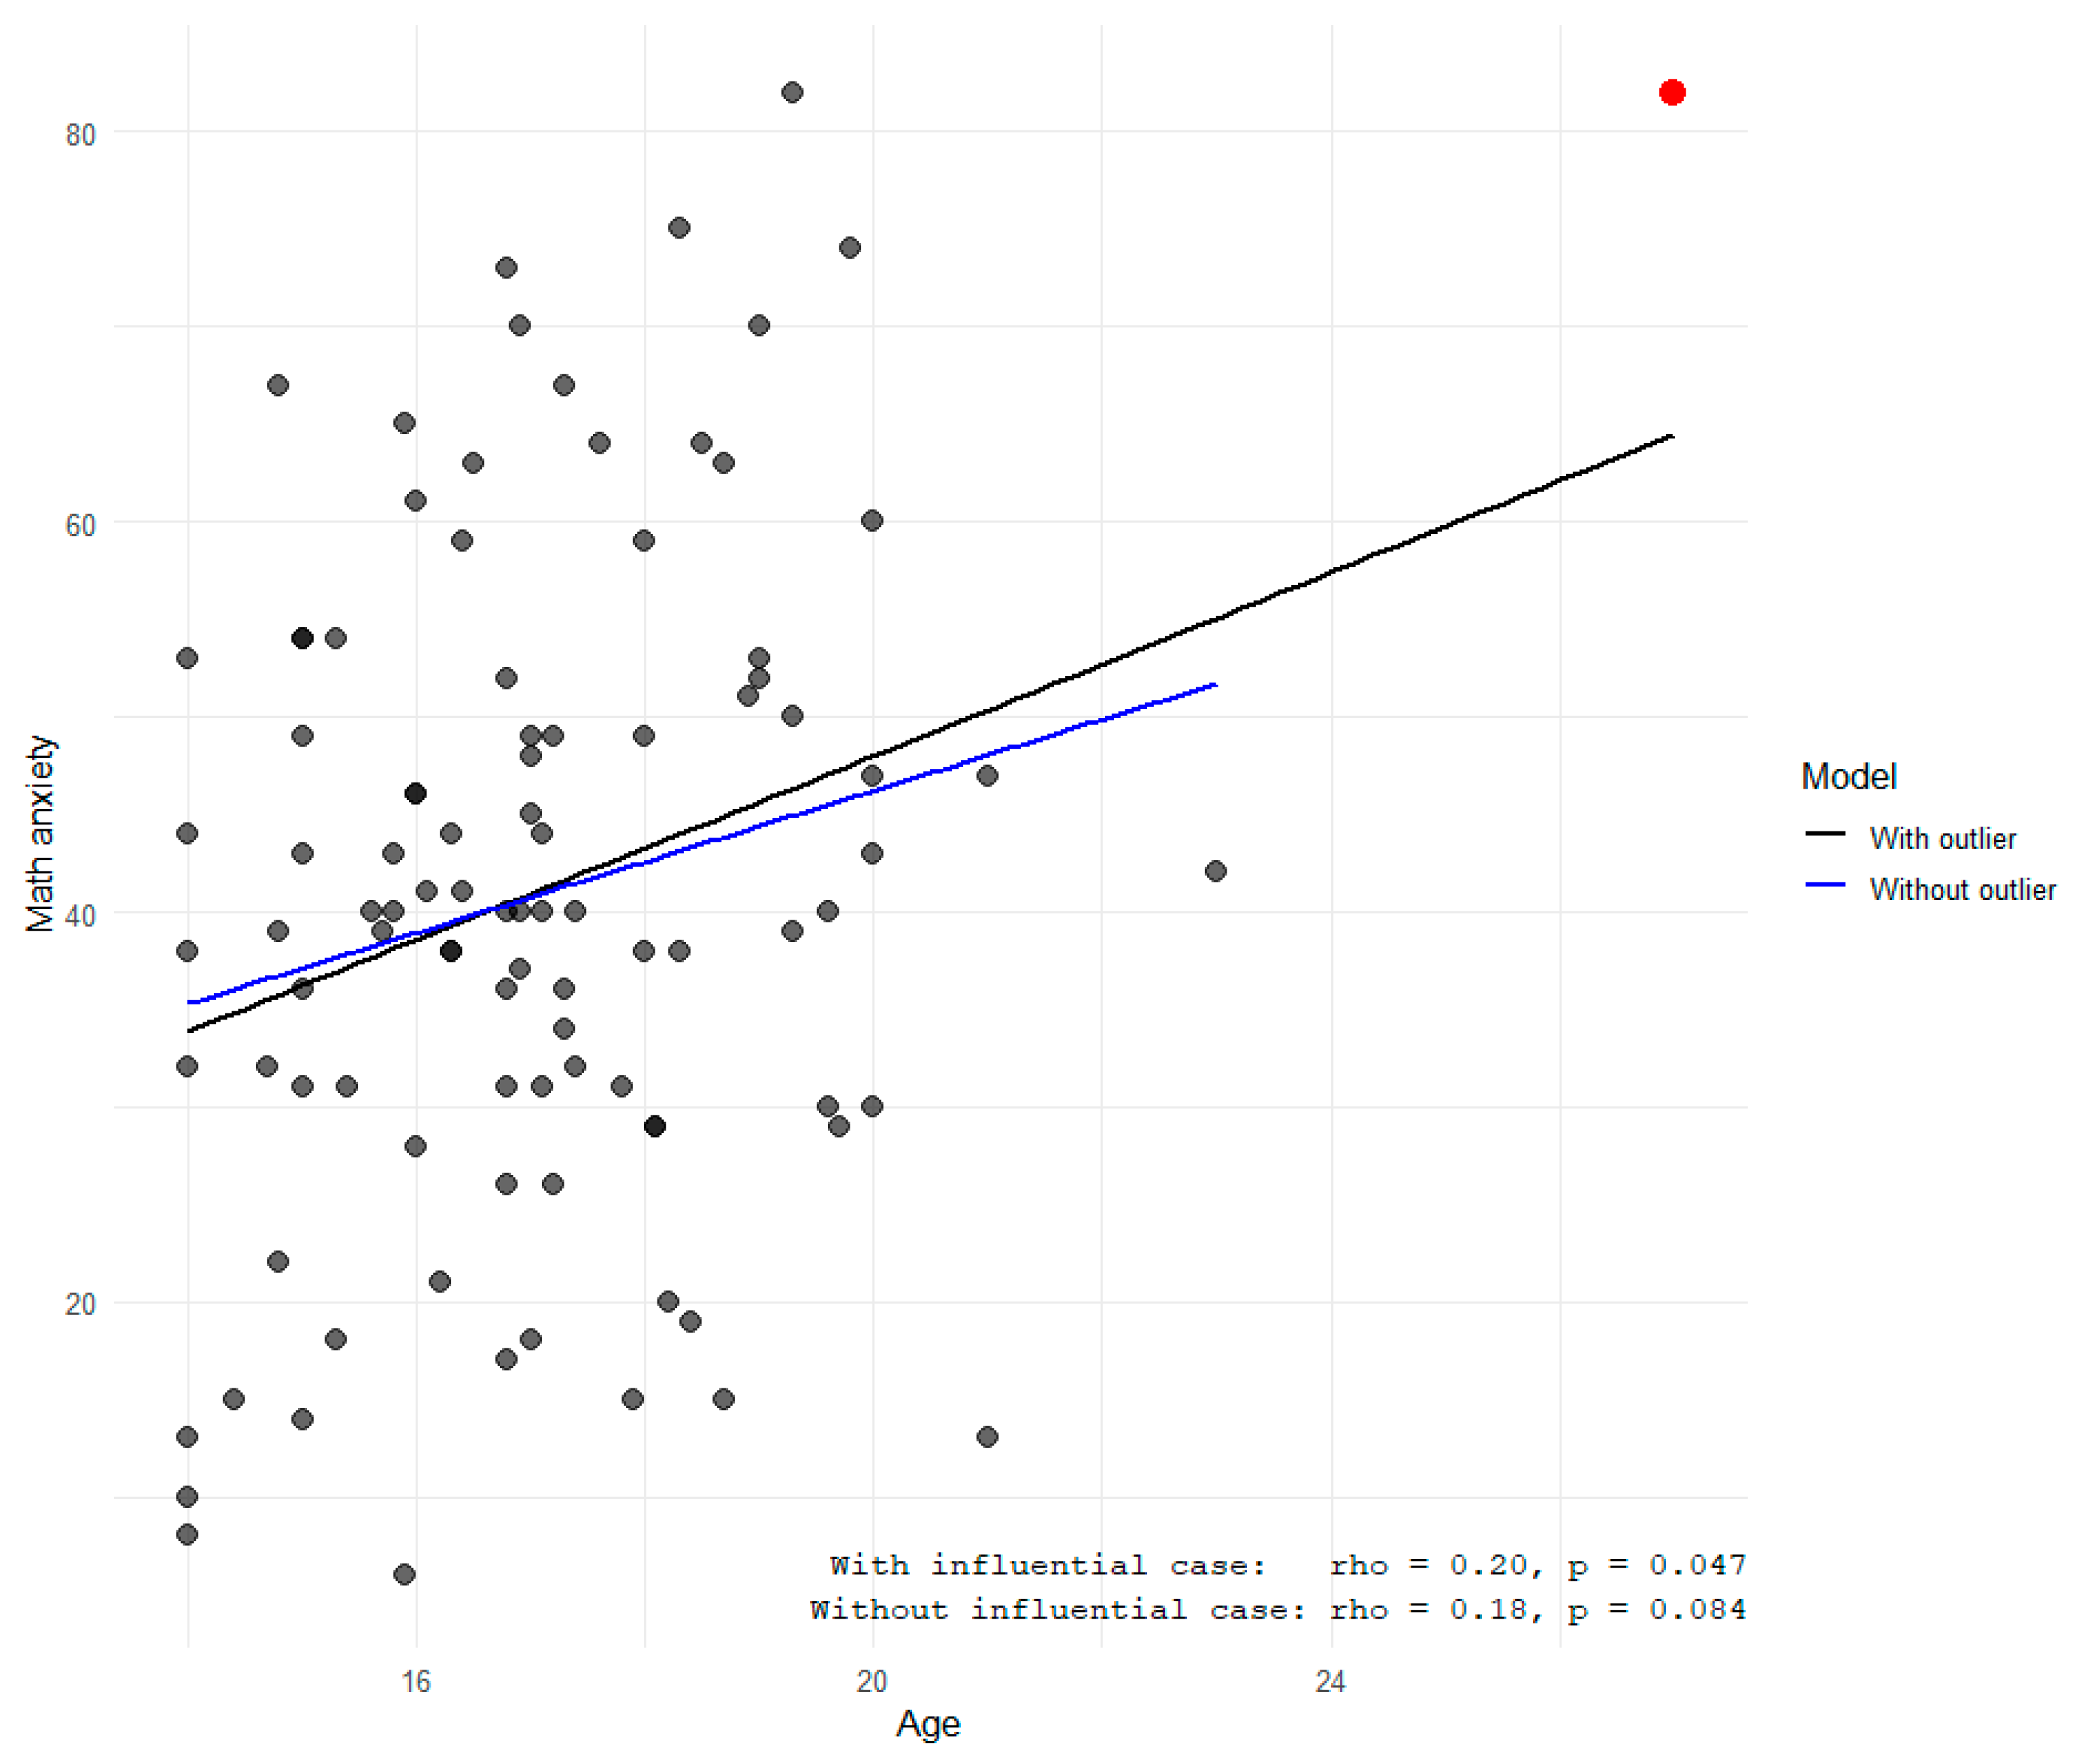
A Spearman rank-order correlation indicated a weak positive association between age and mathematics anxiety (ρ = 0.20, p = 0.047, N = 98). A sensitivity analysis excluding one influential observation identified by Rosner’s outlier test yielded a similar correlation that did not reach statistical significance (ρ = 0.18, p = 0.084, N = 97). A further sensitivity analysis using Kendall’s tau in the full sample yielded a borderline result (τ = 0.136, z = 1.94, p = 0.052; see Appendix B.6 Figure A7).
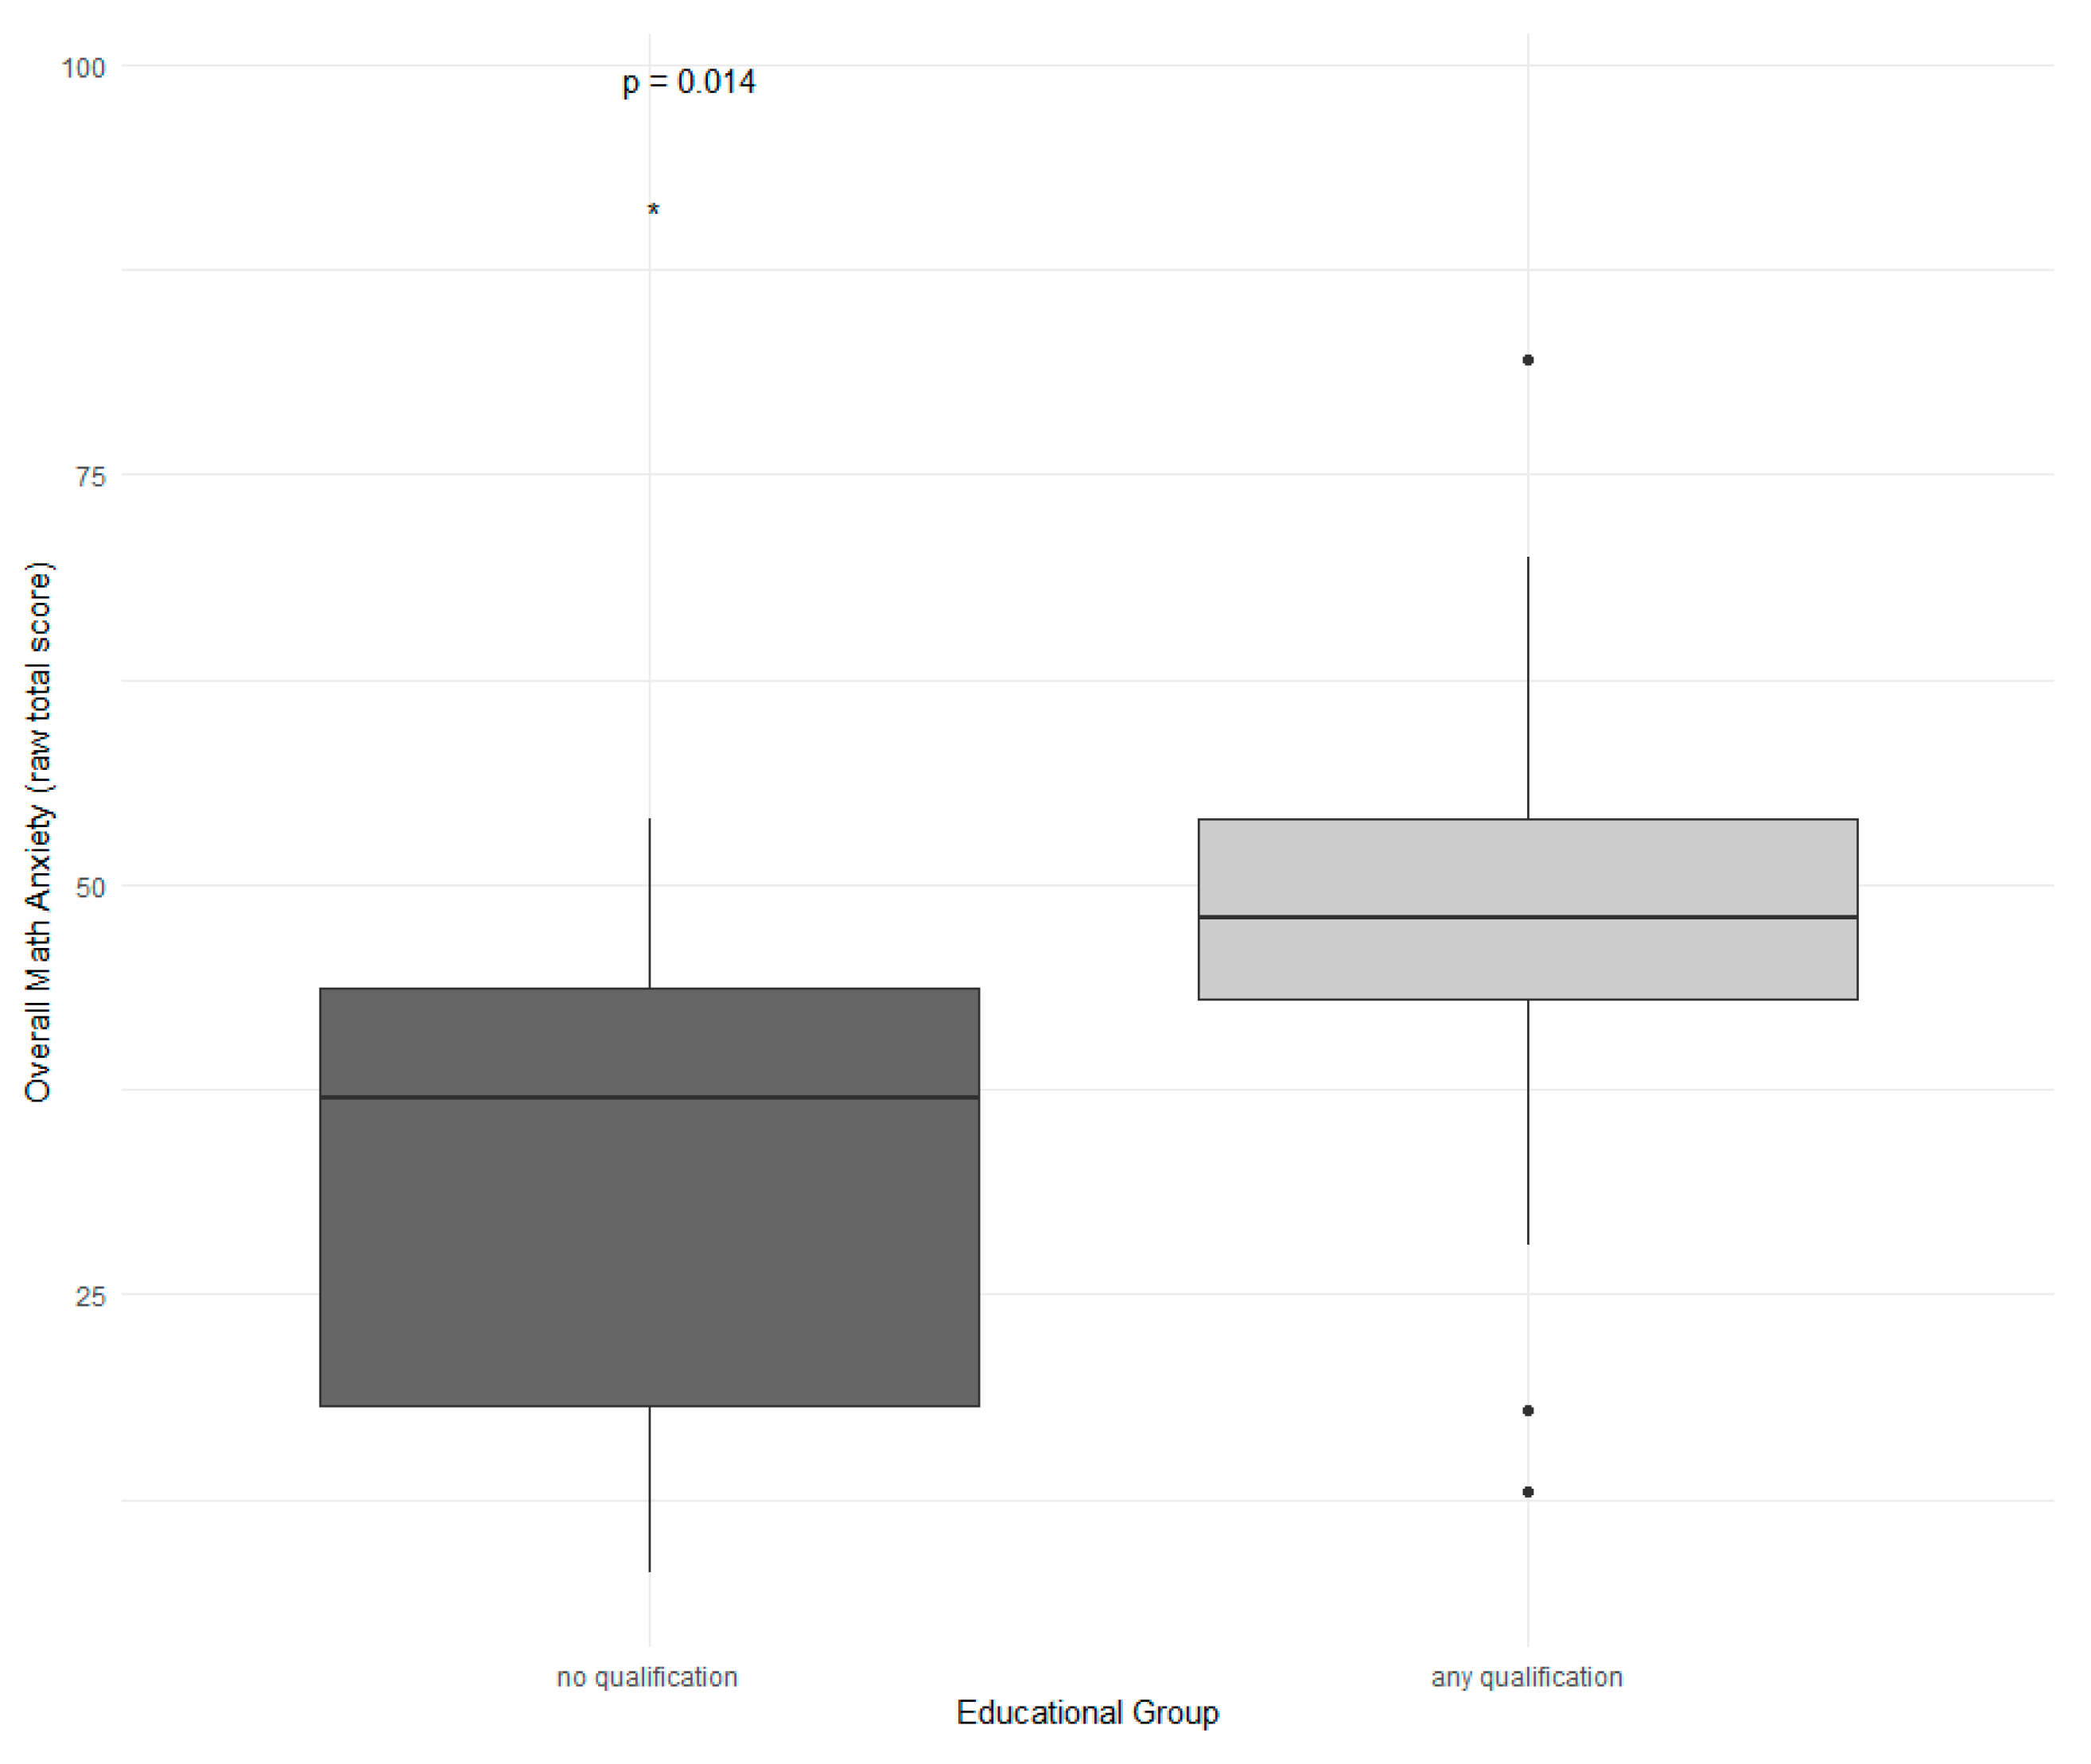
In an exploratory analysis, SMILE participants who had not yet obtained a compulsory school qualification (N = 14) had a lower score of mean mathematics anxiety (M = 33.07, SD = 15.93), compared to participants with a compulsory school qualification or further qualification (N = 21, M = 47.48, SD = 15.92). The group difference was significant, t(28.01) = −2.62, p = 0.014, d = −0.90, 95% CI [−25.66, −3.15] (see Appendix B.7 Figure A8).
3.2.2. MA and Cognitive Factors
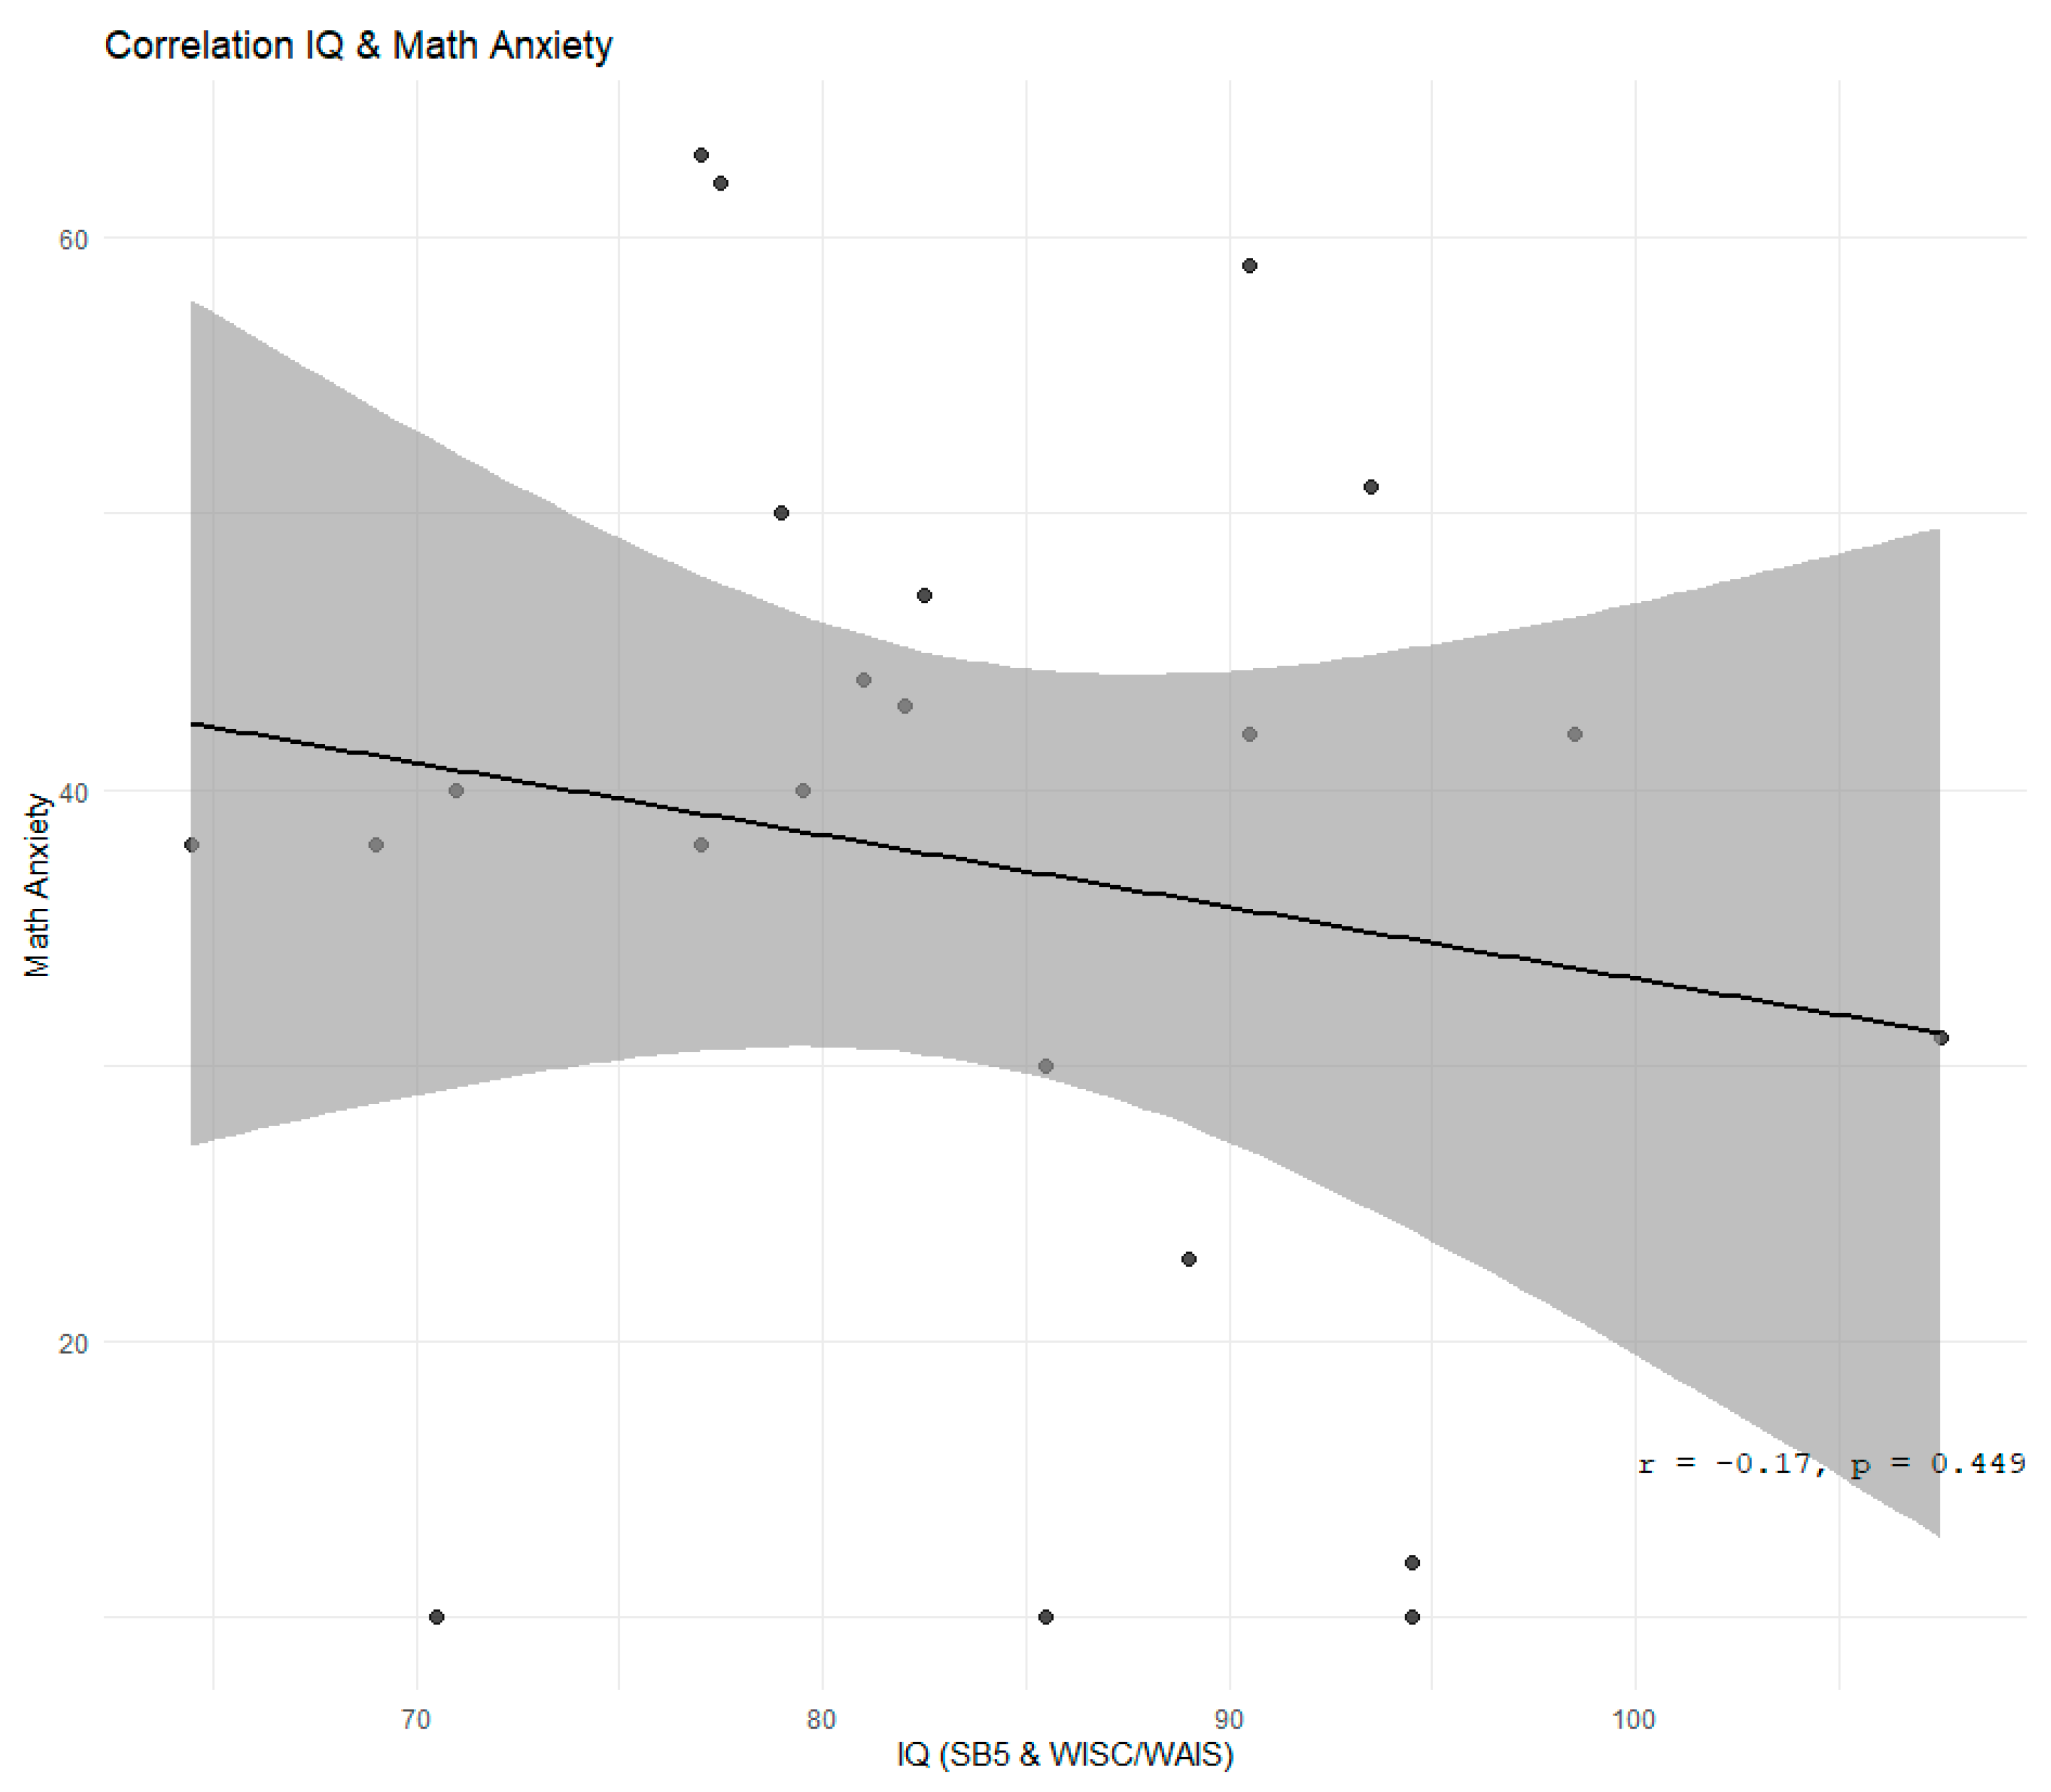
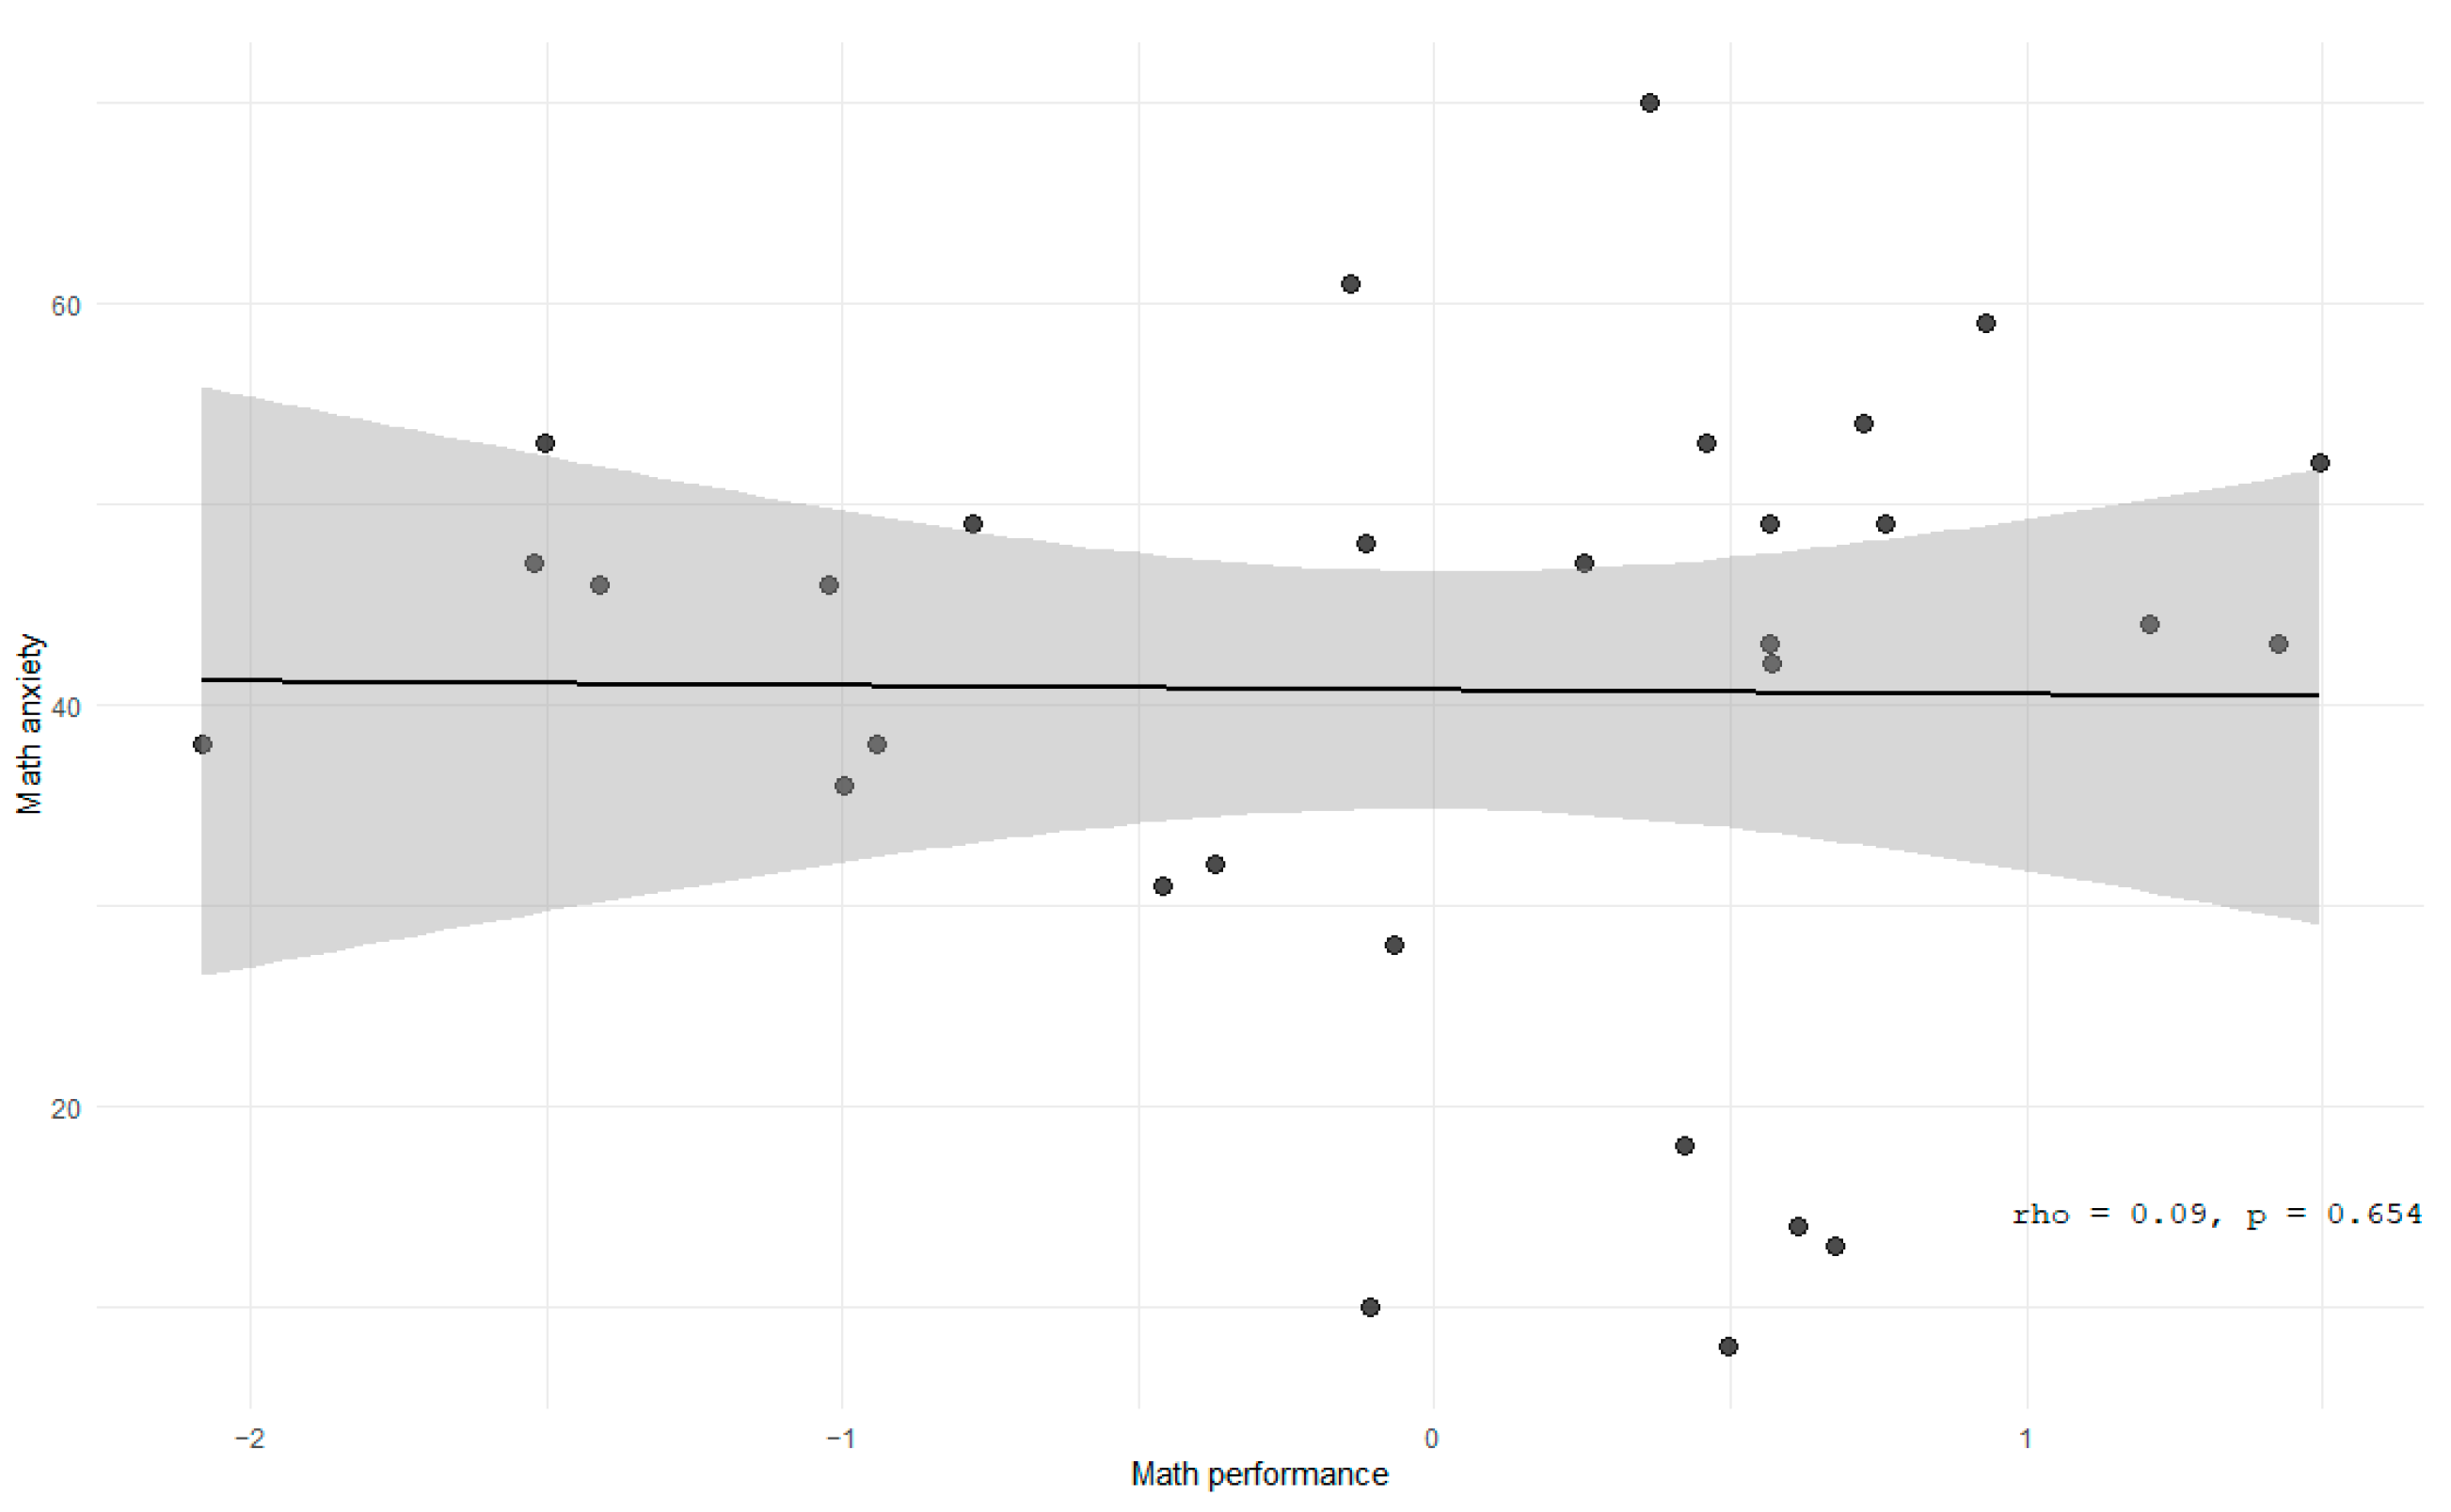
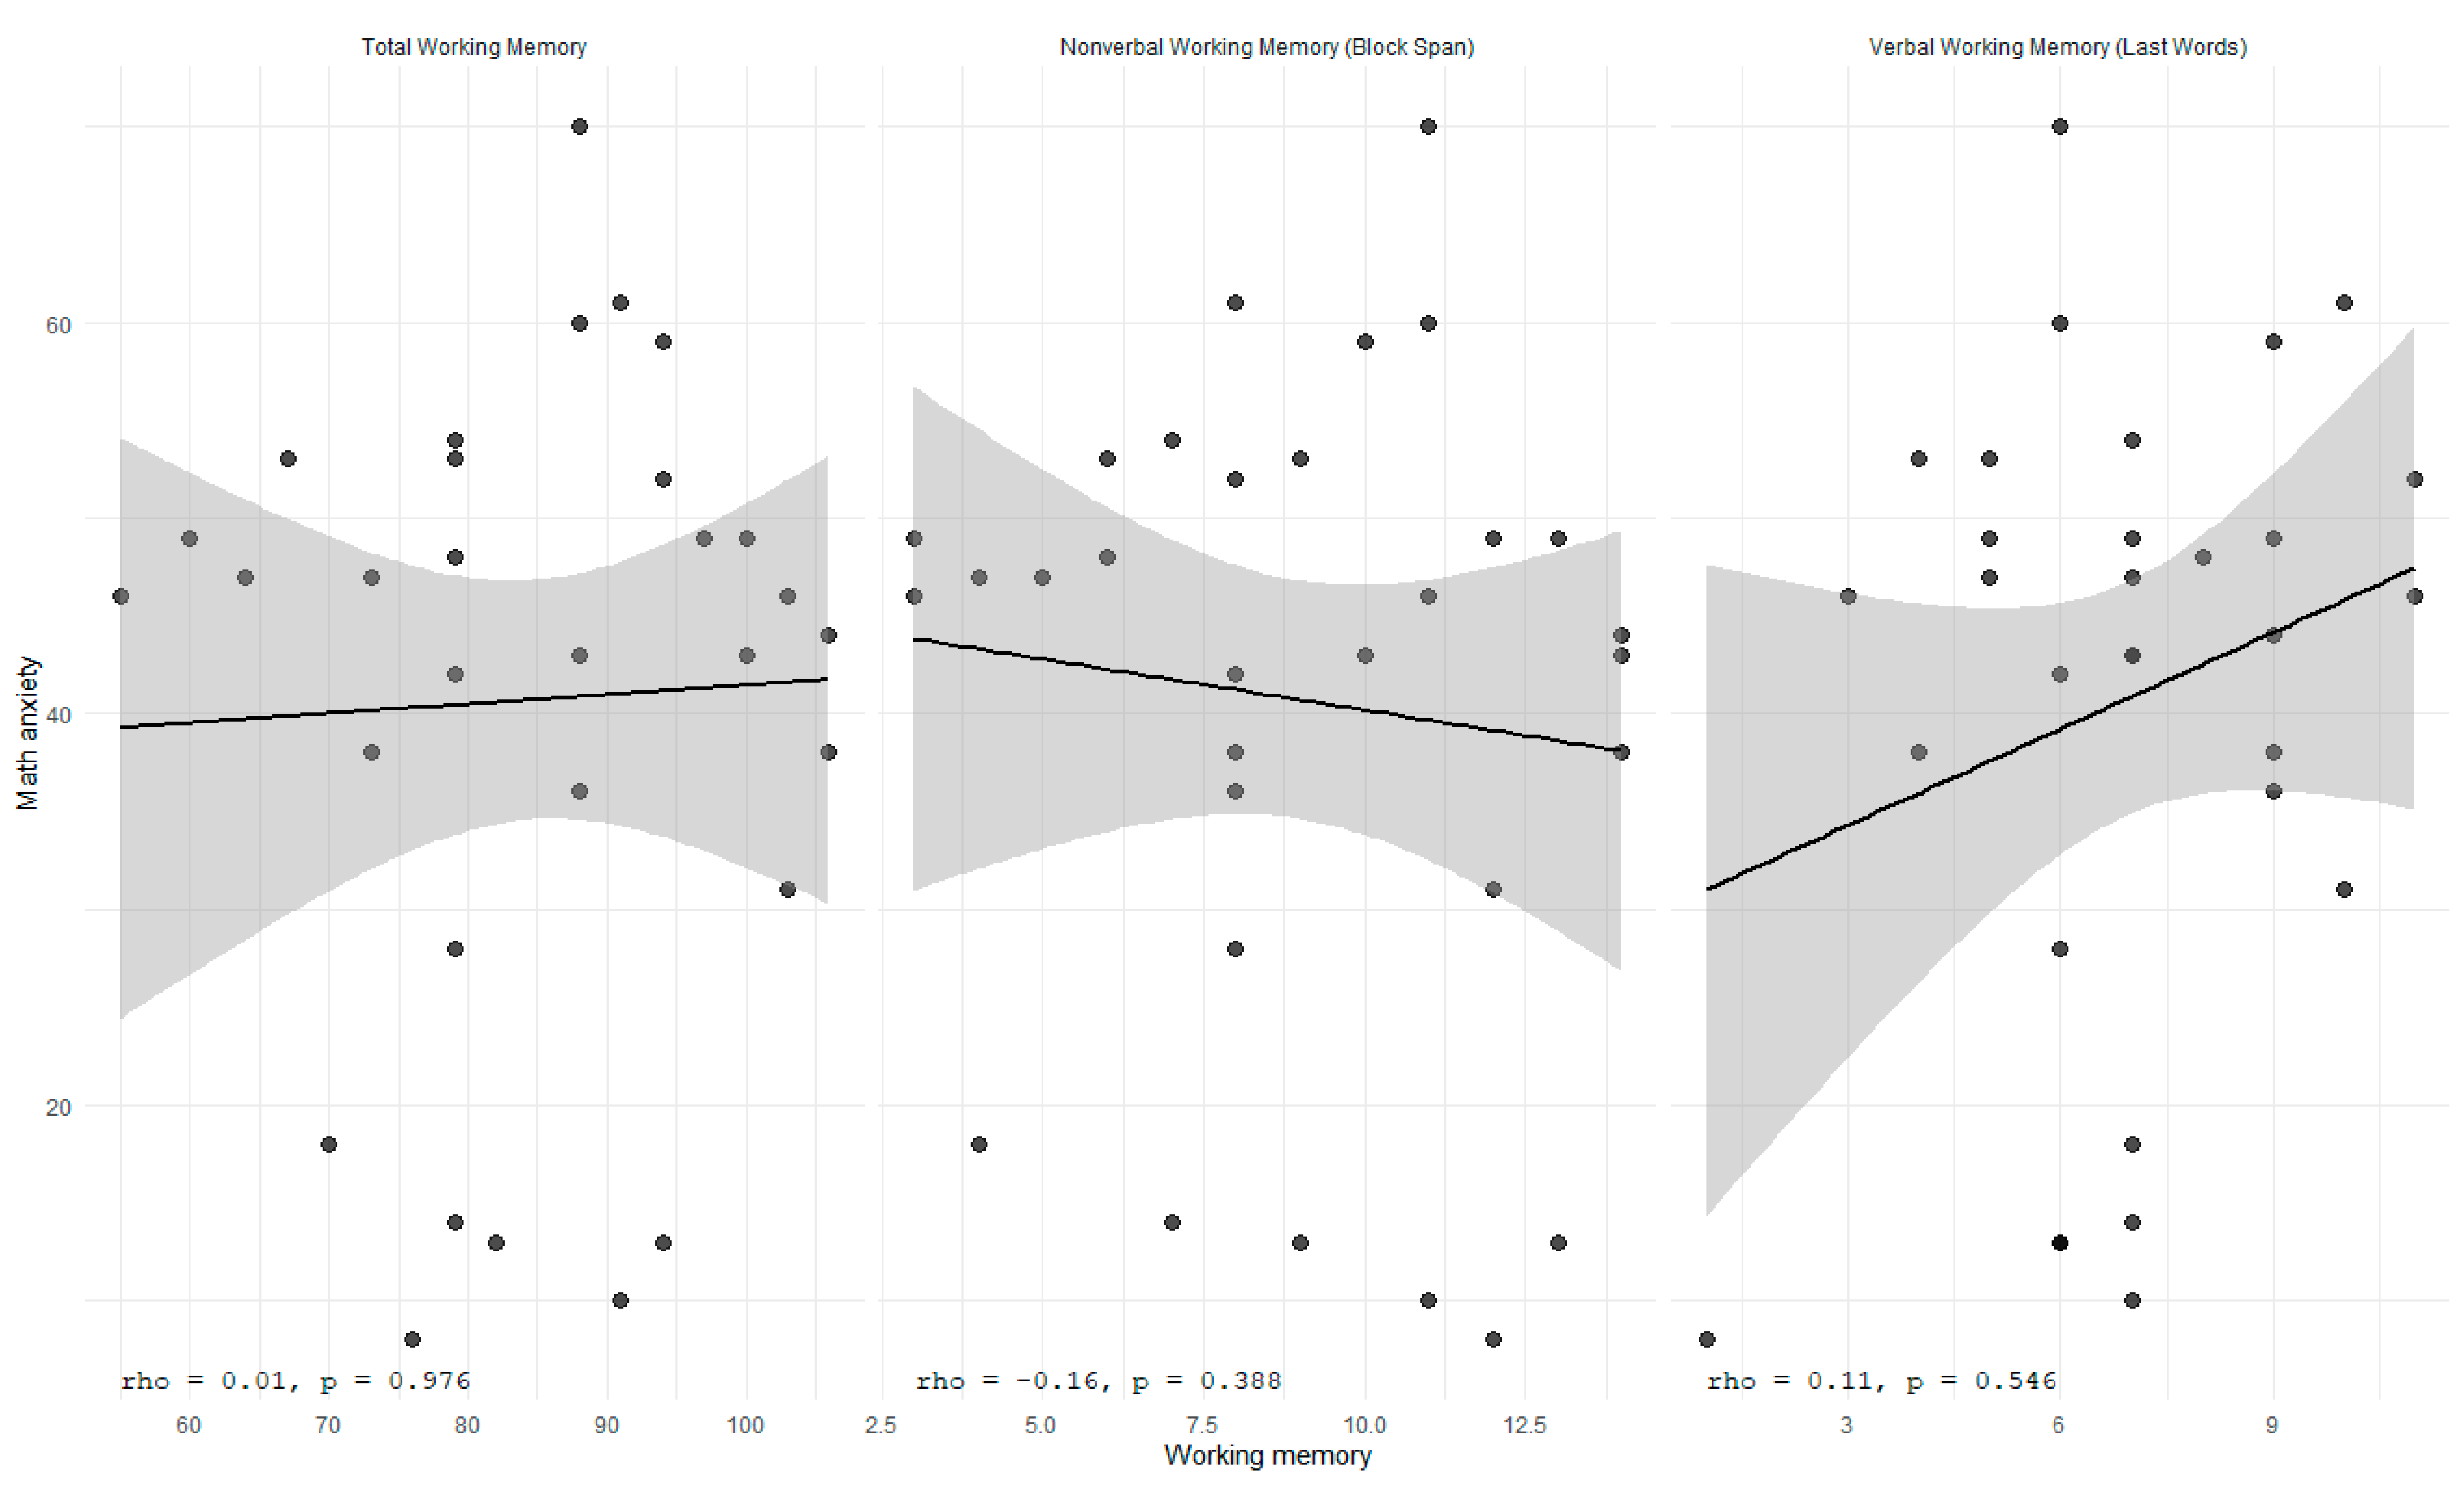
IQ was not significantly correlated with mathematics anxiety within the SMILE DD sample, r = −0.17, p = 0.449 (N = 22) (see Appendix B.8 Figure A9). Similarly, no statistically significant correlations were observed between mathematics anxiety and mathematical performance, ρ = 0.085, p = 0.654 (N = 30) (see Appendix B.9 Figure A10), or working memory, ρ = 0.006, p = 0.976 (N = 31). Separate analyses of verbal and non-verbal working memory also revealed non-significant results (p = 0.546 and p = 0.388, respectively) (see Appendix B.10 Figure A11).
3.3. Association Between Everyday Mathematical Difficulties and Mathematics Anxiety
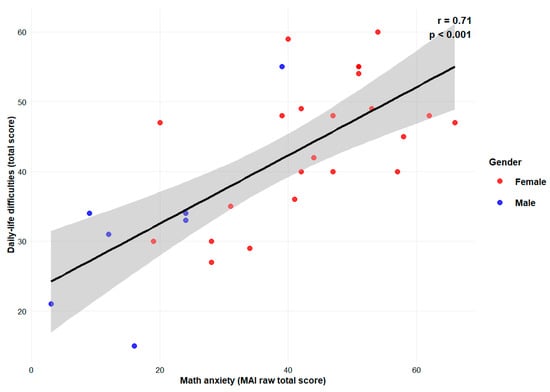
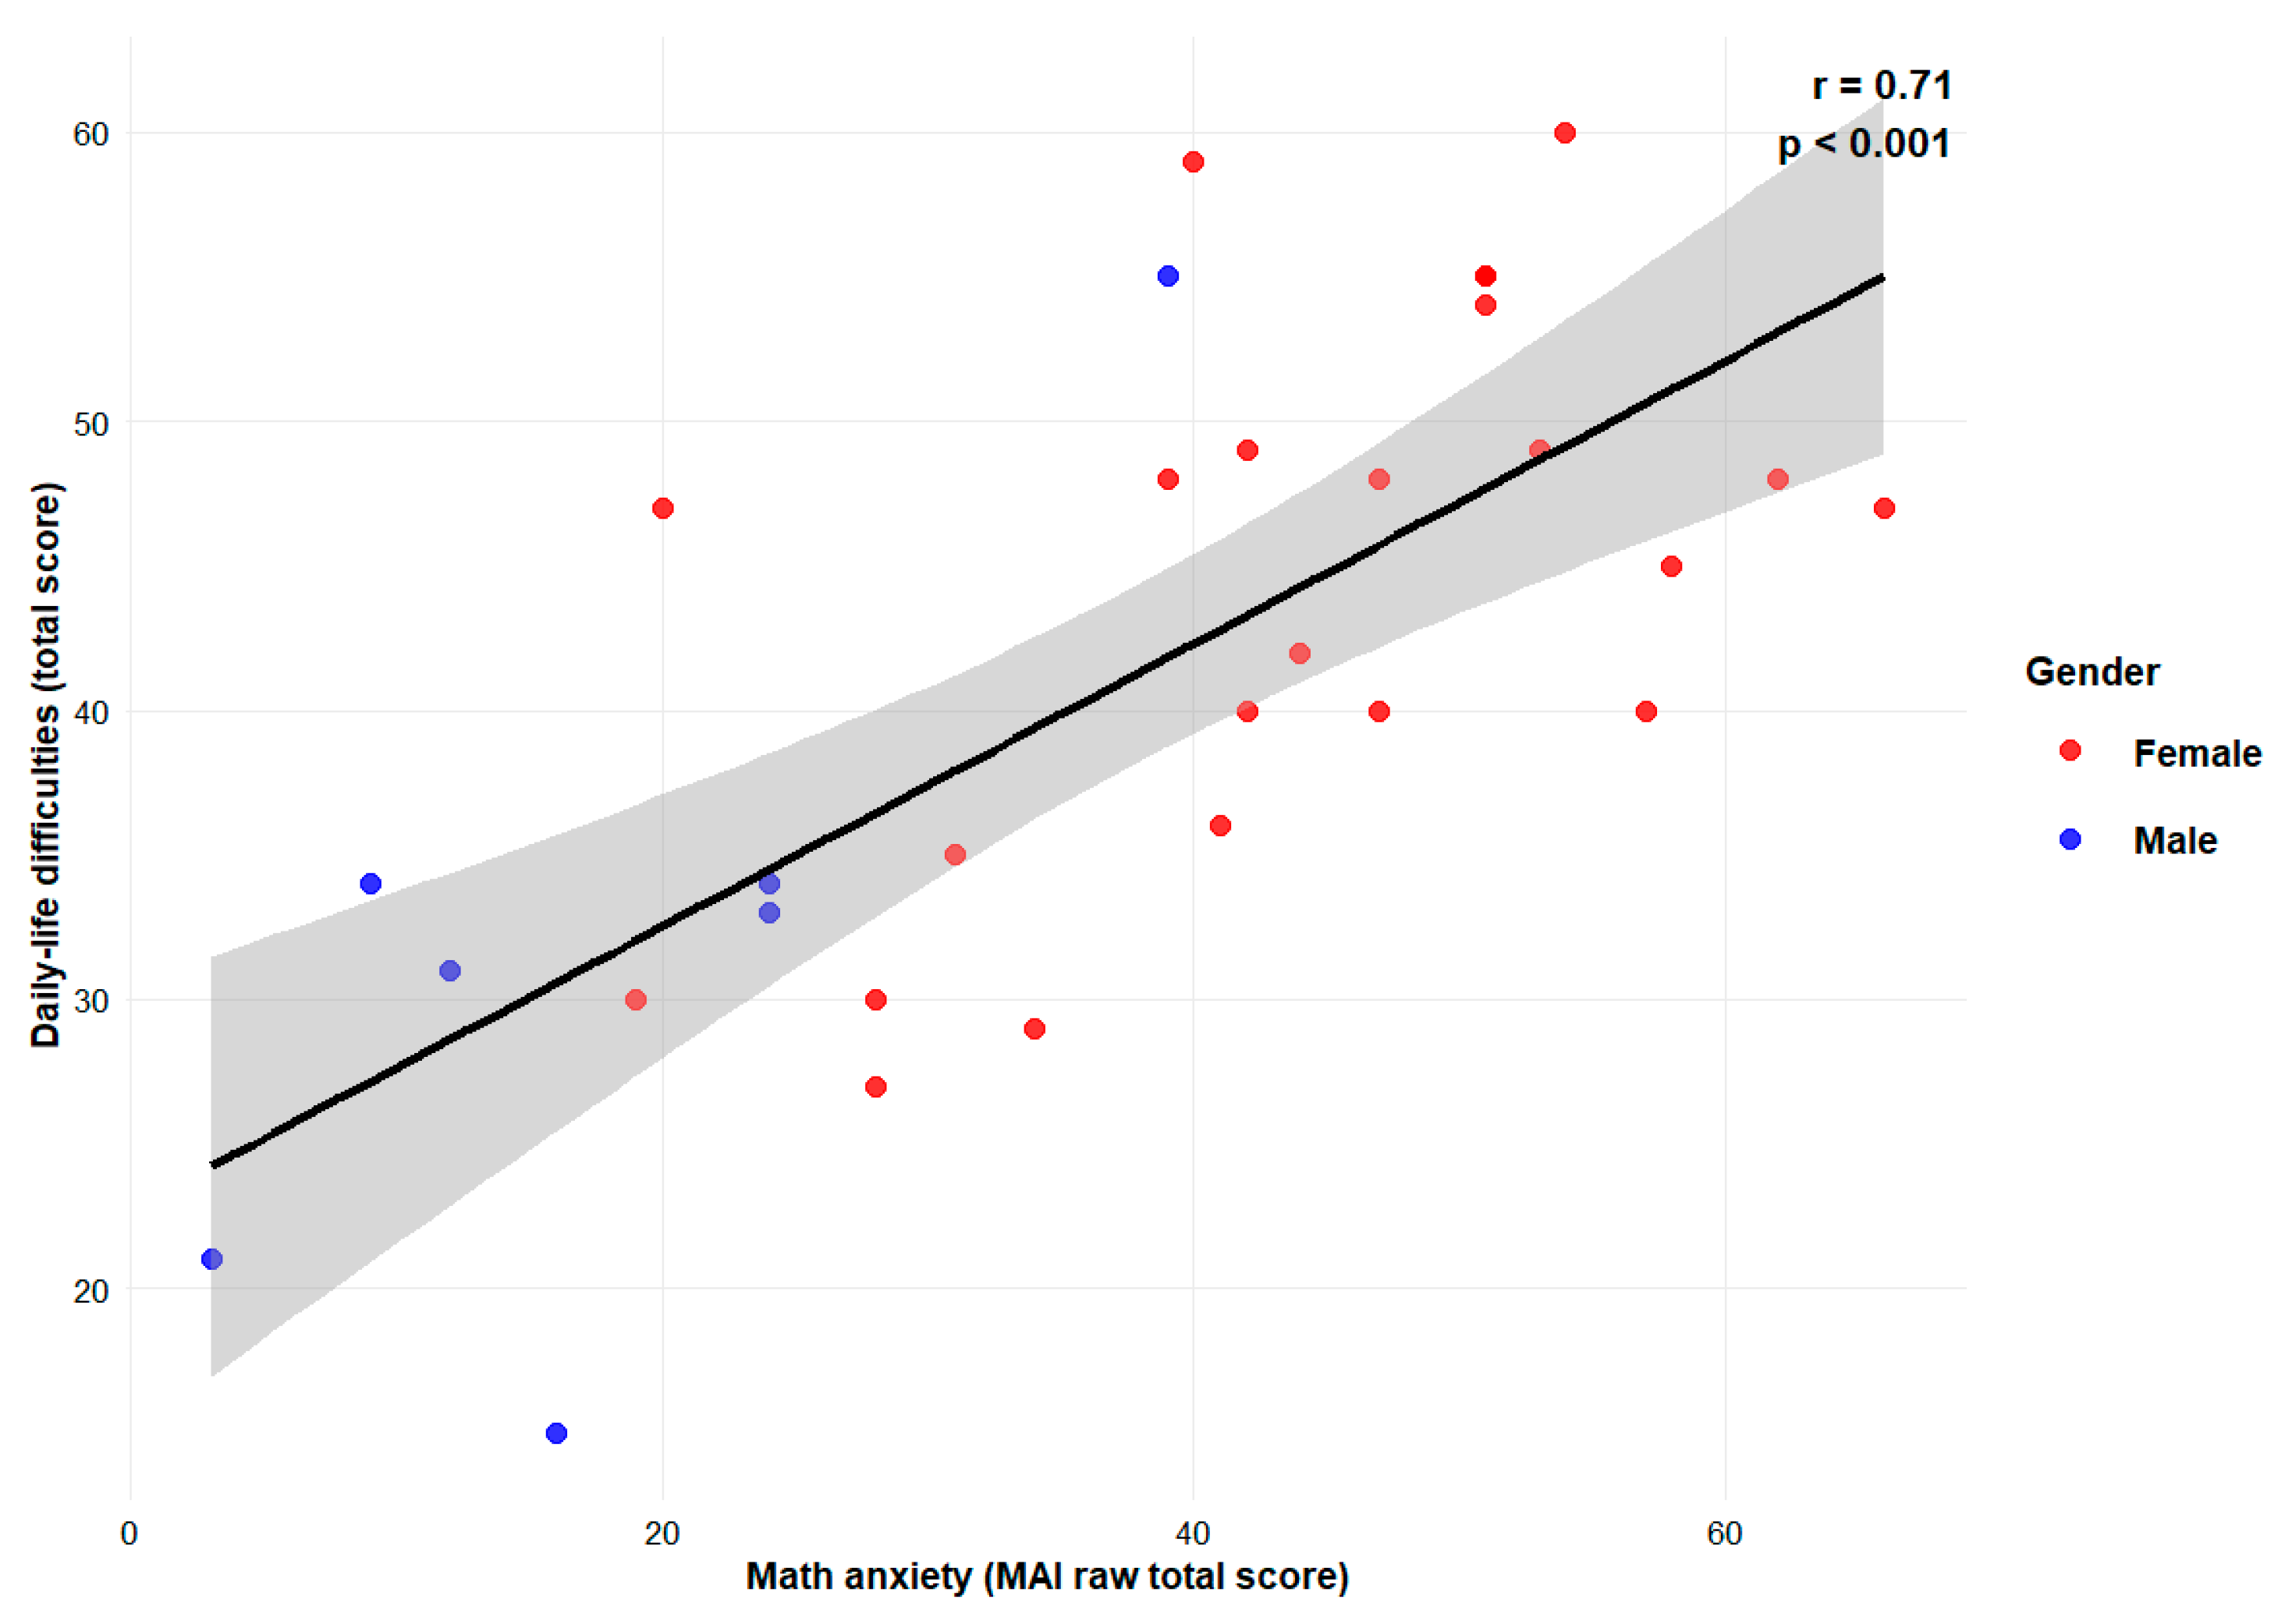
The association between everyday mathematical difficulties and mathematics anxiety was examined among SMILE participants (N = 30) with DD after the intervention. Participants had a mean mathematics anxiety score of M = 37.73 (SD = 16.53) and a mean everyday mathematical difficulties score of M = 41.20 (SD = 11.43). Everyday mathematical difficulties were positively associated with mathematics anxiety, N = 30, r(28) = 0.707, 95% CI [0.47, 0.85], t(28) = 5.29, p < 0.001 (see Figure 2). To examine whether the association between everyday mathematical difficulties and MA was influenced by overlapping item content, a sensitivity analysis was conducted excluding Item 9, which assesses anxiety about making mistakes when dealing with numbers. The correlation remained virtually unchanged (r(28) = 0.704, 95% CI [0.46, 0.85], p < 0.001, N = 30), compared with the original correlation (r = 0.707), suggesting that the association was not substantially influenced by the inclusion of this item.
Figure 2.
Association between MA and Daily Mathematical Difficulties. Also illustrated are the regression line and 95 percent confidence interval in grey shade.
3.4. Intervention Effects
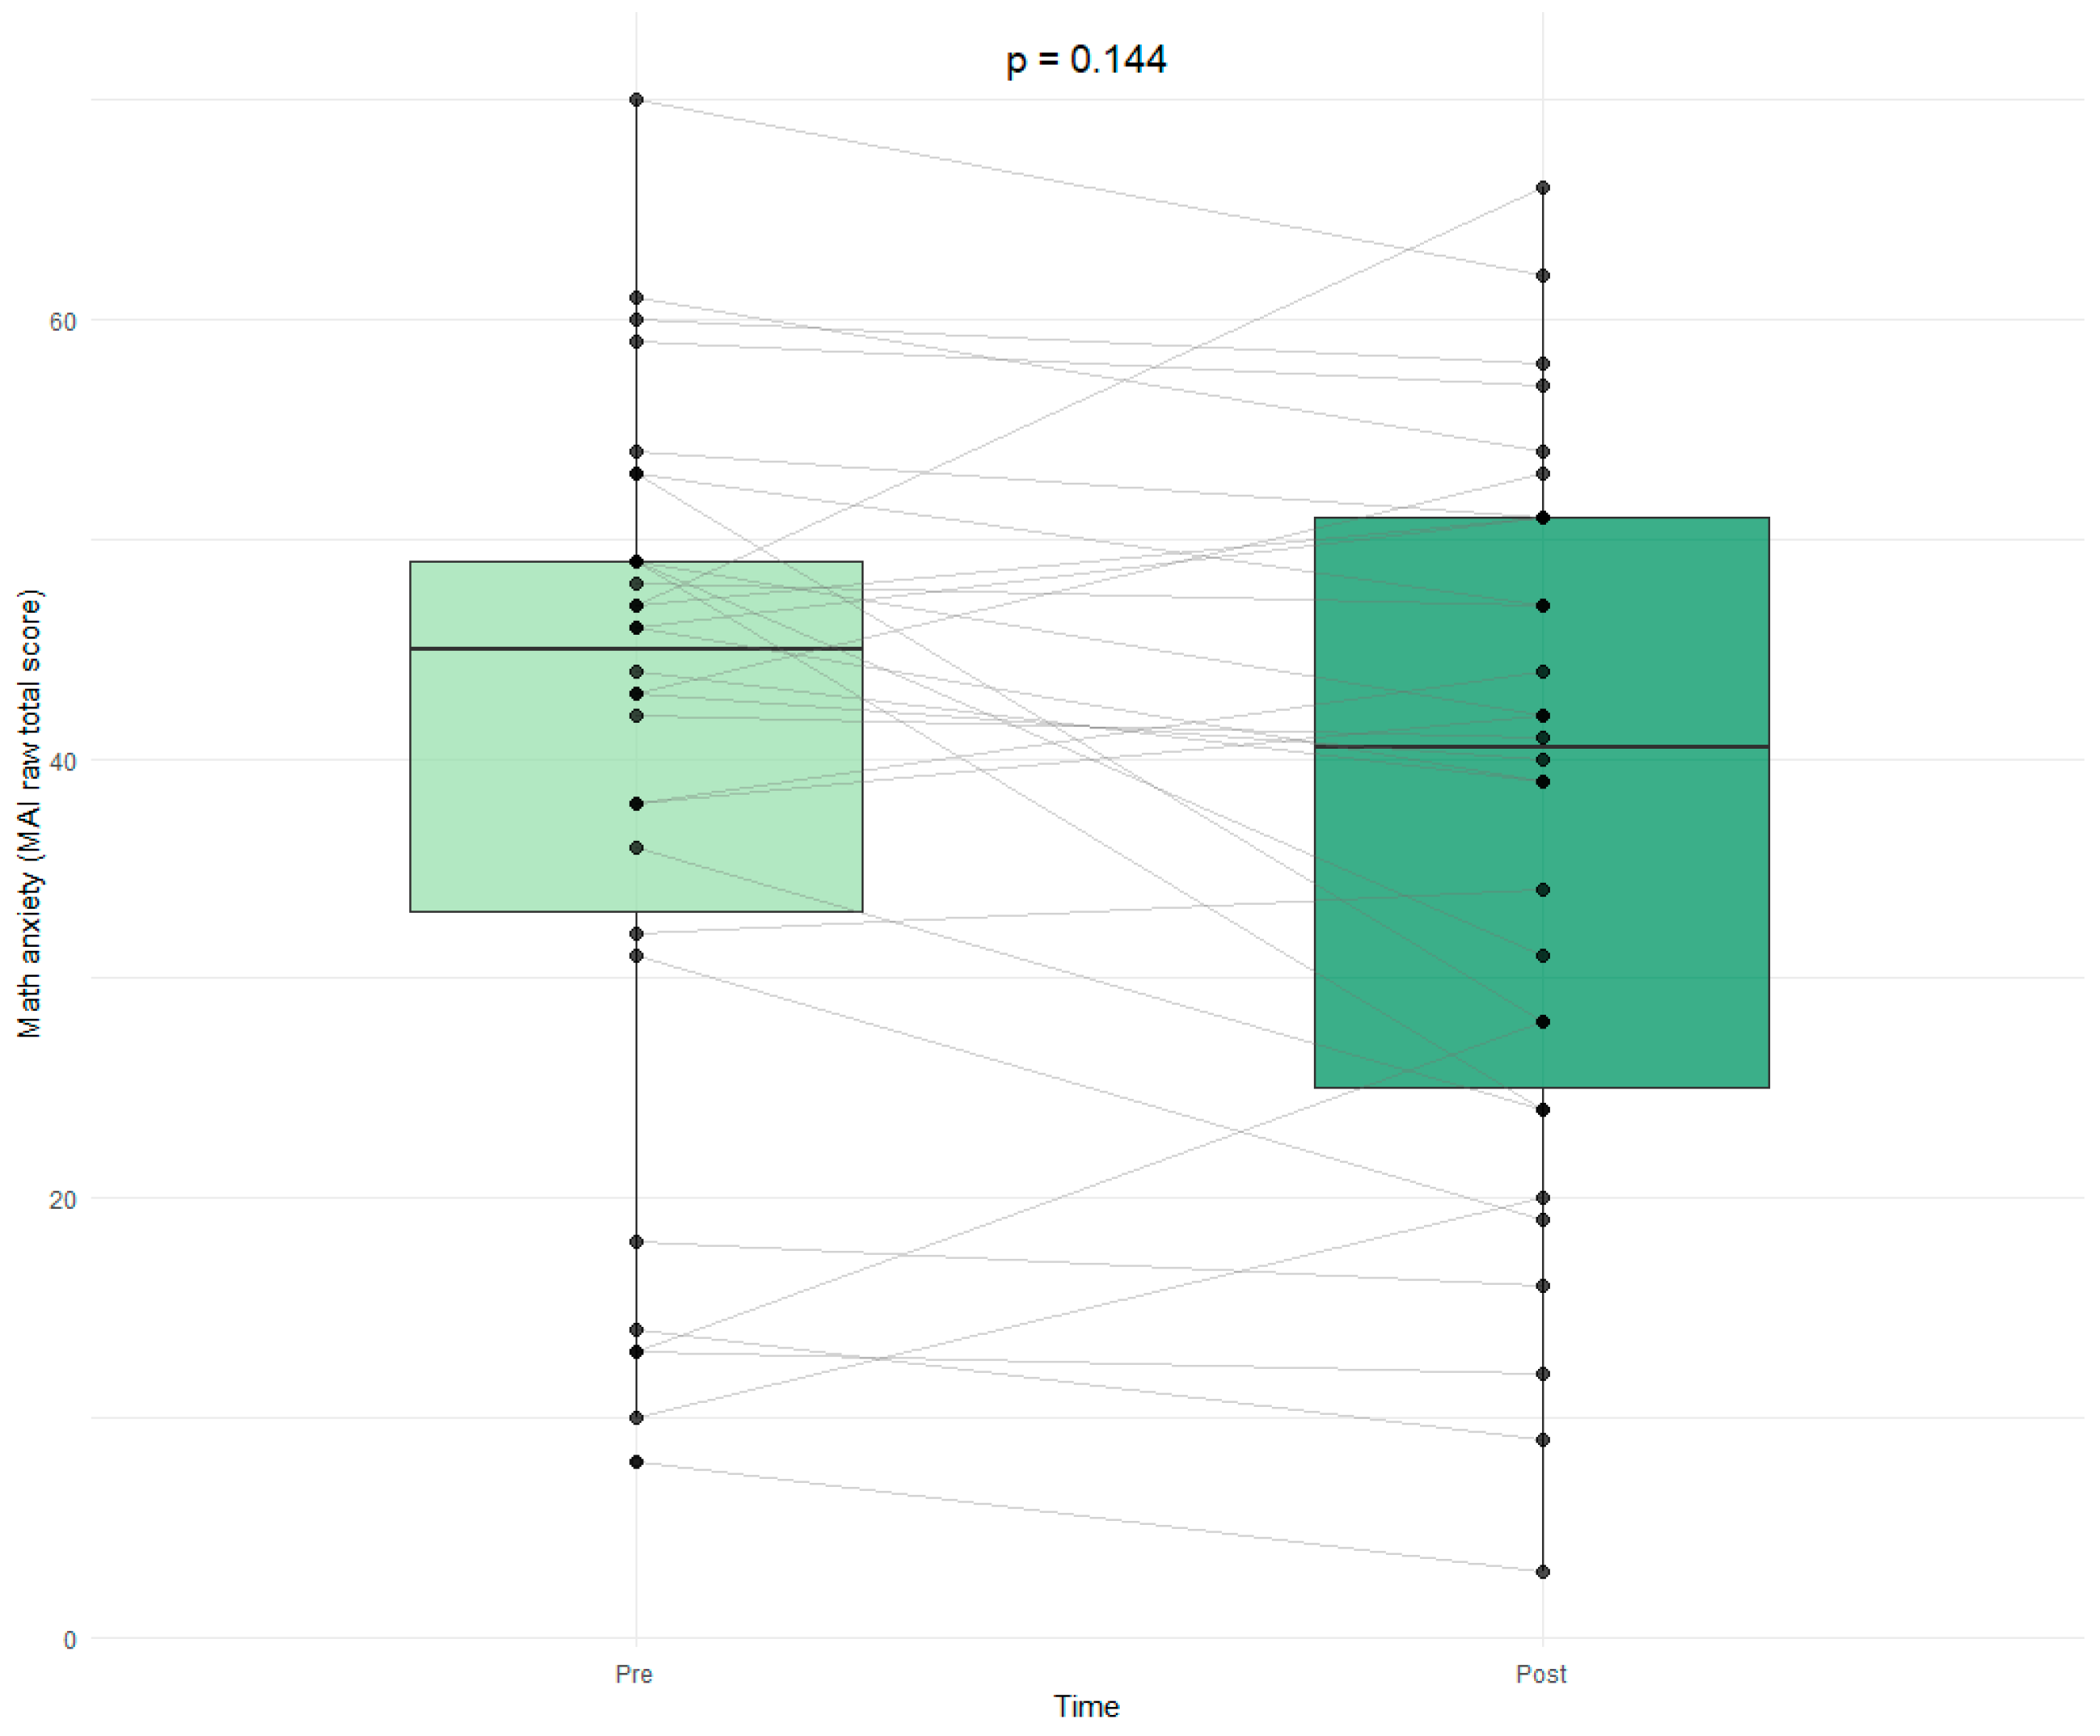
For mathematics anxiety, scores were descriptively lower after the intervention (M = 37.73, SD = 16.53) than before the intervention (M = 40.47, SD = 16.46). The mean pre–post difference was 2.73 points (95% CI [−0.99, 6.45]) and did not reach statistical significance (t(29) = 1.50, p = 0.144, d = 0.27) (see Appendix B.3 Figure A4).
4. Discussion
The present study examined everyday mathematical difficulties, mathematics anxiety (MA), their association, and intervention-related changes in adolescents and young adults with developmental dyscalculia (DD). The findings indicate that individuals with DD experience substantial functional difficulties in everyday numerical situations and greater mathematics-related emotional burden, reflected in greater everyday mathematical difficulties and higher levels of MA than controls. Moreover, everyday mathematical difficulties were positively associated with MA among individuals with DD. The findings further suggest a small descriptive decrease in perceived MA following the targeted mathematics-specific intervention, although this change was not statistically significant.
4.1. Everyday Mathematical Difficulties
A central finding of the present study is that adolescents and young adults with DD reported significantly greater everyday mathematical difficulties than control participants. This result extends previous research, which has primarily focused on mathematical performance in academic settings, by showing that the consequences of DD are also evident in everyday life. Previous studies have shown that DD and low numeracy may affect broader life domains beyond school achievement, including financial management, employment opportunities, health-related decision-making, and independent functioning (Bruine de Bruin & Slovic, 2021; Haberstroh & Schulte-Körne, 2019; Vigna et al., 2022). The present study identified several everyday mathematical difficulties that were particularly pronounced among participants with DD. These included discount price calculation, unit conversion, estimation of lengths, heights, and distances, expense splitting, and currency conversion. These skills underpin many routine activities of daily living, such as shopping, travelling, managing personal finances, interpreting measurements, and estimating quantities. Consequently, impairments in these domains may interfere with independent functioning and place individuals with DD at a disadvantage in situations that require rapid and accurate numerical judgments. The item-level pattern suggests that everyday mathematical difficulties in DD are not restricted to formal arithmetic but extend to applied numerical reasoning. Tasks such as calculating discounts or splitting expenses require flexible use of numerical knowledge in dynamic and often socially embedded situations. These situations may be particularly challenging because they frequently require quick responses, mental calculation, and confidence in the absence of extensive external support. This interpretation is consistent with qualitative evidence showing that individuals with symptoms of DD may experience difficulties in shopping, cash payment, mental calculation, navigation, and other everyday numerical tasks (Mutlu, 2024). Similarly, Staller et al. (2025) reported difficulties in money usage and estimation skills. In contrast, tasks such as monthly budget management or time management were reported as comparatively less challenging in the present sample. One possible explanation is that these activities allow greater use of compensatory strategies, including calculators, smartphone applications, written notes, or support from others. Thus, perceived everyday difficulty may depend not only on numerical complexity but also on contextual factors such as immediacy, social pressure, emotional salience, and the availability of external aids.
These findings are consistent with previous work suggesting that the impact of DD changes across development. While mathematical difficulties in childhood are often discussed mainly in relation to school achievement, their consequences in adolescence and adulthood may increasingly affect broader domains of everyday functioning, including financial decision-making, occupational opportunities, and independent living (Kaufmann et al., 2020; Staller et al., 2025; Vigna et al., 2022). The present results therefore support the view that DD should be conceptualized as a persistent learning disorder with functional consequences extending beyond the classroom.
Interestingly, everyday mathematical difficulties were not significantly associated with standardized mathematical performance within the DD group. This finding suggests that perceived daily-life impairment cannot be fully inferred from test-based mathematical achievement. Standardized assessments capture important aspects of numerical competence, but everyday mathematical situations often involve additional demands, such as planning, multitasking, decision-making, emotional regulation, and social interaction. This may explain why objective mathematical performance and perceived everyday difficulties did not show a significant association. A person may therefore show comparable performance to others with DD on a standardized mathematical test while still experiencing substantial difficulties in daily numerical situations. These findings further suggest that standardized assessments for adolescents and adults may benefit from incorporating more everyday-relevant numerical tasks. Including such tasks could provide a more comprehensive picture of functional impairment and may contribute to improving the assessment and diagnosis of DD. It is also possible that associations with MA may differ across specific components of mathematical performance and that broader performance measures may not fully capture these relationships. In addition, some of the numerical skills assessed by the performance measures used in the present study may be less directly relevant to everyday numerical functioning, as not all mathematical abilities may contribute equally to difficulties encountered in daily life. Future research could therefore examine distinct numerical subdomains separately to explore which aspects of mathematical competence are most closely associated with MA and everyday numerical difficulties in individuals with DD.
4.2. Mathematical Anxiety
The present analysis further showed that participants with DD reported significantly higher MA than control participants. This finding is consistent with previous research demonstrating elevated MA among individuals with mathematical learning difficulties (Devine et al., 2018; Kiss & Vukovic, 2017; Kucian et al., 2018). Repeated experiences of difficulty, failure, or negative feedback in mathematical contexts may contribute to the development of anxiety toward mathematics. This interpretation corresponds to the Deficit Theory, which assumes that poor mathematical performance can contribute to the development of MA through repeated negative experiences in mathematical situations (Devine et al., 2018). Over time, these experiences may reinforce negative self-perceptions, avoidance behavior, and reduced confidence in dealing with numerical tasks (Devine et al., 2012; Finlayson, 2014; Skagerlund et al., 2019). The present findings therefore support the interpretation that MA is a relevant emotional correlate of DD rather than a secondary or peripheral phenomenon.
Within the DD group, MA was associated with sociodemographic factors, particularly gender and educational attainment. Female participants reported higher MA than male participants, which is in line with previous findings on gender differences in self-reported MA (Devine et al., 2012; Hart & Ganley, 2019; Rossi et al., 2023; Xie et al., 2024). This difference may partly reflect lower mathematics self-concept among females, sociocultural stereotypes regarding mathematical ability, or gender-related differences in the reporting of anxiety (Dowker et al., 2016; Hutchison et al., 2019; Sáinz & Eccles, 2012; Sokolowski et al., 2019).
Regarding age, the association with mathematics anxiety was weak and should be interpreted cautiously. Although the full-sample analysis indicated a small positive association, the result was sensitive to the exclusion of one influential observation, and the association did not reach statistical significance in the sensitivity analysis. Previous research has reported particularly elevated mathematics anxiety during adolescence and lower levels in adulthood (Hart & Ganley, 2019; Hembree, 1990; Wang et al., 2020). However, these studies did not directly compare adolescents and adults within the same sample. In the present study, conclusions regarding developmental differences are limited by the uneven age distribution, as most participants were between 14 and 20 years old and older participants were underrepresented. In addition, many participants attended academically demanding secondary schools, meaning that elevated mathematics anxiety may partly reflect continuing performance pressure rather than age-related differences. Future studies should examine this association in larger and more evenly distributed samples across adolescence and young adulthood.
An exploratory analysis indicated a difference in MA according to educational attainment, although the observed pattern differed from previous findings suggesting that higher educational attainment is generally associated with lower MA (Hart & Ganley, 2019; Soysal et al., 2022). In the present sample, participants who had already completed compulsory schooling reported higher MA than those who had not yet completed compulsory schooling. One possible explanation is that longer exposure to mathematics-related evaluation, grades, and academic pressure may intensify MA in individuals with persistent mathematical difficulties. However, the planned analysis of educational attainment could not be conducted as intended. The initial objective was to differentiate between multiple educational levels. However, this was not possible due to the restricted sample size and the constrained distribution of participants across educational categories.
Although no statistically significant associations were detected between mathematics anxiety and IQ, mathematical performance, or working memory in the available samples, these findings should be interpreted with caution due to the small sample sizes, particularly for IQ (N = 22). Accordingly, the absence of statistically significant associations does not provide sufficient evidence to conclude that these cognitive factors are unrelated to mathematics anxiety.
Previous research has similarly suggested that MA is more closely linked to mathematical competence than to general intelligence, and that associations between MA and IQ may disappear when DD and control groups are examined separately (Kucian et al., 2018). The non-significant associations with mathematical performance and working memory may indicate that, within a clinically defined DD sample, MA is shaped by more than current cognitive performance alone. The non-significant association with mathematical performance contrasts with previous research reporting a negative relationship between MA and mathematical performance (Lau et al., 2024; Zhang et al., 2019). However, comparable non-significant associations have also been found within DD samples (Devine et al., 2018). Similarly, the absence of an association with WM is inconsistent with studies reporting a negative relationship between WM and MA (Ma & Sun, 2025; Skagerlund et al., 2019), although Kucian et al. (2018) also found no significant association in children with DD. These non-significant findings should also be interpreted in light of the relatively small subsample sizes, which may have limited statistical power. At the same time, accumulated learning experiences, perceived competence, avoidance behavior, and emotional responses to numerical situations may be particularly relevant. This finding is important because it suggests that MA should not be treated merely as a by-product of low test performance but as a distinct affective factor that may require specific attention.
4.3. Relation Between Everyday Mathematical Difficulties and Mathematical Anxiety
A further central finding is the significant positive association between MA and everyday mathematical difficulties. Participants who reported higher MA also reported greater difficulties in everyday mathematical situations. This result suggests that emotional and functional aspects of DD are closely related. Everyday numerical situations may trigger MA, especially when they require quick calculations, involve financial responsibility, or occur in social contexts. Conversely, MA may be associated with greater perceived difficulty, lower confidence, avoidance, and increased stress during numerical tasks. These possible links are consistent with previous research showing that MA is associated with poorer mathematical performance and the avoidance of mathematics-related educational and career choices (Ashcraft & Krause, 2007; Namkung et al., 2019), lower calculation-related self-efficacy and confidence (McMullan et al., 2012), and poorer financial management behavior (Staller et al., 2025; Xin et al., 2023).
While everyday mathematical difficulties were significantly related to MA, they were not significantly associated with mathematical performance. Although these findings do not imply that mathematical skills are unimportant, they suggest that everyday mathematical difficulties may be associated with emotional factors beyond those captured by mathematical performance alone. Thus, everyday functioning may be influenced not only by mathematical skills, but also by individuals’ emotional reactions when encountering numerical challenges in everyday life. This distinction has important theoretical and practical implications, as the relationship between MA and everyday functioning has received little empirical attention in individuals with DD. Although the present findings cannot establish the direction of this relationship, difficulties in everyday numerical situations and heightened MA may potentially reinforce each other. For example, anxiety and avoidance may be associated with reduced engagement in numerical tasks, while challenging experiences in these situations may contribute to anxiety. This interpretation is consistent with previous evidence showing that MA can interfere with mathematical performance through increased cognitive load and avoidance behaviors (Hembree, 1990; Skagerlund et al., 2019). A further important factor may be the social environment, as supportive family and teaching contexts have been linked to lower MA and, indirectly, to better mathematical outcomes (Huang, 2026).
4.4. Intervention Effects
Although mathematics anxiety decreased descriptively following the intervention, the observed change did not reach statistical significance. The 95% confidence interval included zero, indicating that the findings do not provide sufficient evidence for a reduction in mathematics anxiety, while also not ruling out a potentially meaningful effect. One possible explanation is that MA often develops over a long period through repeated negative experiences, avoidance, and reduced confidence. A mathematics-specific intervention may improve skills or perceived competence in daily numerical situations, but emotional responses toward mathematics may require more time or more directly anxiety-focused components to change substantially. This interpretation is consistent with intervention research indicating that mathematics skills-oriented interventions can reduce MA, but that combined interventions targeting both mathematical skills and MA tend to show stronger effects (Liu et al., 2026). Evidence from intervention studies with children further suggests that targeted mathematical training can positively affect MA and related socio-emotional outcomes, although the available evidence remains more limited for adolescents and young adults with DD (Lambert & Spinath, 2014; Rauscher et al., 2017). It would also be interesting to investigate whether the intervention had an impact on everyday life skills. As only post-test data is available for the DD SMILE group, this question can only be answered on the basis of preliminary exploratory findings. A cross-sectional comparison between the groups (data from the NumRisk DD group and post-test data from the SMILE DD group) provide preliminary evidence that an intervention targeting mathematical performance may reduce everyday mathematical difficulties in adolescents and young adults with DD. However, the cross-sectional design limits interpretation of these effects (for details see Appendix C) and further research is needed.
4.5. Limitations
Several limitations of the present study should be acknowledged. First, the sample was relatively heterogeneous, comprising participants from three sources: the SMILE study, the NumRisk study, and patient data. Combining these sources enabled us to investigate a considerably larger cohort, which is particularly valuable in dyscalculia research, where studies often rely on relatively small samples. However, some analyses were based on smaller subsamples, limiting statistical power. Furthermore, different standardized measures were used to assess mathematics performance and IQ across samples, which may limit direct comparability and generalizability. In addition, assessment time points differed across the three data sources, as participants were assessed at different stages of the respective studies. This temporal heterogeneity may have introduced additional variability into the pooled data. Nevertheless, all measures were based on standardized neuropsychological assessments and provide reliable estimates of the respective constructs.
A further limitation concerns the Numerical Behavior in Daily Life Questionnaire, as some items may be less relevant for younger participants, particularly those aged 14–18 years. Thus, it remains unclear whether all items adequately capture everyday mathematical difficulties in this age group. Although the questionnaire demonstrated good internal consistency in the present sample, its psychometric properties and dimensional structure require further investigation.
Whether interventions targeting mathematical difficulties can reduce the everyday life burdens associated with dyscalculia cannot be determined from our data. Potential intervention effects were examined using a between-subjects design with independent pre- and post-intervention groups; these analyses were therefore reported only in the Appendix C. Future longitudinal studies are needed to establish whether improvements in mathematical abilities translate into reduced everyday life burdens.
An additional limitation is the overrepresentation of female participants in our sample. Although gender distributions were comparable between the DD and control groups, the imbalance limited our ability to draw firm conclusions about gender-related differences. Exploratory analyses showed higher MA scores among females than males (see Appendix B.5), consistent with previous research. However, these findings should be interpreted cautiously given the unequal gender distribution.
Finally, sociodemographic and cognitive factors associated with everyday mathematical difficulties should be investigated more systematically. The present study examined these associations primarily in an exploratory manner, highlighting the need for future hypothesis-driven research to clarify the factors contributing to everyday mathematical difficulties.
4.6. Conclusions
In conclusion, the present study shows that the consequences of DD extend beyond formal mathematical performance to affect everyday life. Adolescents and young adults with DD reported substantially greater everyday mathematical difficulties and higher MA than controls. Furthermore, everyday difficulties were strongly associated with MA, but not with mathematical performance. This association suggests that emotional factors may be relevant to how individuals with DD experience numerical demands in everyday life, although the direction of this relationship remains unclear. MA did not significantly change following the mathematics-specific intervention. Overall, these findings highlight that understanding DD should not be limited to mathematical performance, but also its functional and emotional consequences, which may be important to consider when developing support approaches that address both everyday challenges and the well-being of affected individuals.
Author Contributions
Conceptualization, C.B., K.K., M.R. and U.M.; methodology, C.B., K.K. and V.H.; formal analysis, V.H.; investigation, C.B., N.B., O.S., M.F., M.B., M.R., U.M. and V.H.; resources, K.K., C.C.R. and E.M.O.; data curation, C.B., N.B., O.S., M.F., M.B., M.R. and V.H.; writing—original draft preparation, V.H., K.K. and C.B.; writing—review and editing, V.H., C.B. and K.K.; visualization, V.H.; supervision, K.K. and C.B.; project administration, C.B., N.B., O.S., M.F., M.B., M.R. and V.H.; funding acquisition, K.K., C.C.R. and E.M.O. All authors have read and agreed to the published version of the manuscript.
Funding
The SMILE study was funded by the University Children’s Hospital Zurich, the Institute of Education University of Zurich, the Palatin foundation, the Adaptive Brain Circuits in Development and Learning (AdaBD) of the University of Zurich, Switzerland, the Lotteriefonds of the Canton of Zurich, Foundation Dora, the Wiederkehr Foundation, and the “Giving-back” of the UZH-Foundation. The NumRisk study was funded by the Adaptive Brain Circuits in Development and Learning (AdaBD) of the University of Zurich, Switzerland.
Institutional Review Board Statement
The SMILE and NumRisk study was conducted in accordance with the Declaration of Helsinki, and approved by the local Ethics Committee of the canton of Zurich (SMILE BASEC-Nr. 2023-01592; NumRisk BASEC-Nr. 2022-01828).
Informed Consent Statement
Informed consent was obtained from all subjects or their legal guardians involved in the study.
Data Availability Statement
The data from the SMILE and the NumRisk project may be sent to other databases in Switzerland and abroad for further analyses, provided that those databases comply with the same standards as those in Switzerland. Data of patient who gave general consent for research purposes were included.
Acknowledgments
We would like to thank all participants and patients, as well as the PIs for their willingness to harmonize and share data across studies to complete the present study.
Conflicts of Interest
The authors declare no conflicts of interest. The funders had no role in the design of the study; in the collection, analyses, or interpretation of data; in the writing of the manuscript; or in the decision to publish the results.
Abbreviations
The following abbreviations are used in this manuscript:
| CG | Control Group |
| CI | Confidence Interval |
| DD | Developmental Dyscalculia |
| IQ | Intelligence Quotient |
| M | Mean |
| MA | Mathematics Anxiety |
| MAI | Mathematics Anxiety Interview |
| MR | Magnetic Resonance |
| MRI | Magnetic Resonance Imaging |
| SB-5 | Stanford–Binet Intelligence Scales, Fifth Edition |
| SD | Standard Deviation |
| SMILE | Development and Evaluation of an Intervention for Adolescents and Adults with Dyscalculia |
| WAIS-IV | Wechsler Adult Intelligence Scale-Fourth Edition |
| WISC-V | Wechsler Intelligence Scale for Children-Fifth Edition |
Appendix A
Appendix A.1. Data Sources for Research Questions
Table A1.
Data Sources for Research Questions.
Appendix A.2. Overview of Samples, Assessments, and Statistical Analyses
Table A2.
Overview of Samples, Assessments, and Statistical Analyses.
Appendix A.3. Intervention Timeline of the SMILE Study
Figure A1.
Intervention Timeline of the SMILE Study.
Appendix A.4. Questionnaire on Numerical Behaviour in Daily Life
Questionnaire on Numerical Behaviour in Daily Life (from the NumRisk study; orally administered, Version 1, 18 August 2023)
Instructions:
“Below, I will describe a series of situations. Please indicate how often each situation applies to you.”
Response scale:
1 = never/very rarely 2 = rarely 3 = sometimes 4 = often 5 = very often
Items:
- I actively try to avoid paying the exact amount in cash (e.g., I prefer to pay by card or TWINT, or I use large banknotes).
☐ never/very rarely ☐ rarely ☐ sometimes ☐ often ☐ very often
- 2.
- If my friends and I have outstanding shared expenses (e.g., the cost from a group outing), I leave it to the others to split the costs.
☐ never/very rarely ☐ rarely ☐ sometimes ☐ often ☐ very often
- 3.
- I find it difficult to work out the final price of an item during a sale.
☐ never/very rarely ☐ rarely ☐ sometimes ☐ often ☐ very often
- 4.
- I find it particularly difficult to keep track of my monthly budget, including my income and expenses.
☐ never/very rarely ☐ rarely ☐ sometimes ☐ often ☐ very often
- 5.
- I find converting currencies extremely complicated (e.g., when travelling abroad).
☐ never/very rarely ☐ rarely ☐ sometimes ☐ often ☐ very often
- 6.
- I find it difficult to plan my time (e.g., deciding when to set my alarm for the next morning, or estimating how much time I will need for a particular task).
☐ never/very rarely ☐ rarely ☐ sometimes ☐ often ☐ very often
- 7.
- In limited situations where I am under time pressure (e.g., during exams), I worry that I will not be able to estimate the remaining time accurately.
☐ never/very rarely ☐ rarely ☐ sometimes ☐ often ☐ very often
- 8.
- My general uncertainty about estimating time affects how I plan (e.g., I avoid using public transport or plan too many or too few activities for a particular period of time).
☐ never/very rarely ☐ rarely ☐ sometimes ☐ often ☐ very often
- 9.
- Whenever numbers are involved in an everyday situation (e.g., telephone numbers or PINs), I become anxious that I might make a mistake.
☐ never/very rarely ☐ rarely ☐ sometimes ☐ often ☐ very often
- 10.
- I find it very difficult to remember sequences of numbers (e.g., telephone numbers or PINs).
☐ never/very rarely ☐ rarely ☐ sometimes ☐ often ☐ very often
- 11.
- I find it difficult to estimate speed in traffic situations (e.g., when driving, I need to check the speedometer very frequently).
☐ never/very rarely ☐ rarely ☐ sometimes ☐ often ☐ very often
- 12.
- I do not feel confident performing simple mental calculations (e.g., when adjusting the quantities in a recipe).
☐ never/very rarely ☐ rarely ☐ sometimes ☐ often ☐ very often
- 13.
- I find it difficult to estimate lengths, heights, or distances (e.g., how tall a tree is or how far away a car is).
☐ never/very rarely ☐ rarely ☐ sometimes ☐ often ☐ very often
- 14.
- Converting between different units of measurement confuses me (e.g., centimetres into metres or grams into kilograms).
☐ never/very rarely ☐ rarely ☐ sometimes ☐ often ☐ very often
Appendix B
Appendix B.1. Group Differences in Daily Life Difficulties
Figure A2.
Group Differences in Daily Life Difficulties. **** p < 0.0001.
Appendix B.2. Relation Between Mathematical Performance and Daily Life Difficulties
Figure A3.
Mathematical Performance and Daily Life Difficulties. Also illustrated are the regression line and 95 percent confidence interval in grey shade.
Appendix B.3. Intervention Effects on Math Anxiety
Figure A4.
MA Pre–Post Intervention.
Appendix B.4. Group Difference in Math Anxiety
Figure A5.
Group Difference in MA. *** p < 0.001.
Appendix B.5. Gender Difference in Math Anxiety
Figure A6.
Gender Difference in MA. ** p < 0.01.
Appendix B.6. Relation Between Age and Math Anxiety
Figure A7.
Age and MA. Red dot indicates the identified outlier.
Appendix B.7. Math Anxiety by Educational Attainment
Figure A8.
MA by Educational Attainment. * p < 0.05.
Appendix B.8. Relation Between IQ and Math Anxiety
Figure A9.
IQ and MA. Also illustrated are the regression line and 95 percent confidence interval in grey shade.
Appendix B.9. Relation Between Mathematical Performance and Math Anxiety
Figure A10.
Mathematical Performance and MA. Also illustrated are the regression line and 95 percent confidence interval in grey shade.
Appendix B.10. Relation Between Working Memory and Math Anxiety
Figure A11.
Working Memory and MA. Also illustrated are the regression line and 95 percent confidence interval in grey shade.
Appendix C. Exploratory Intervention-Related Differences in Everyday Mathematical Difficulties
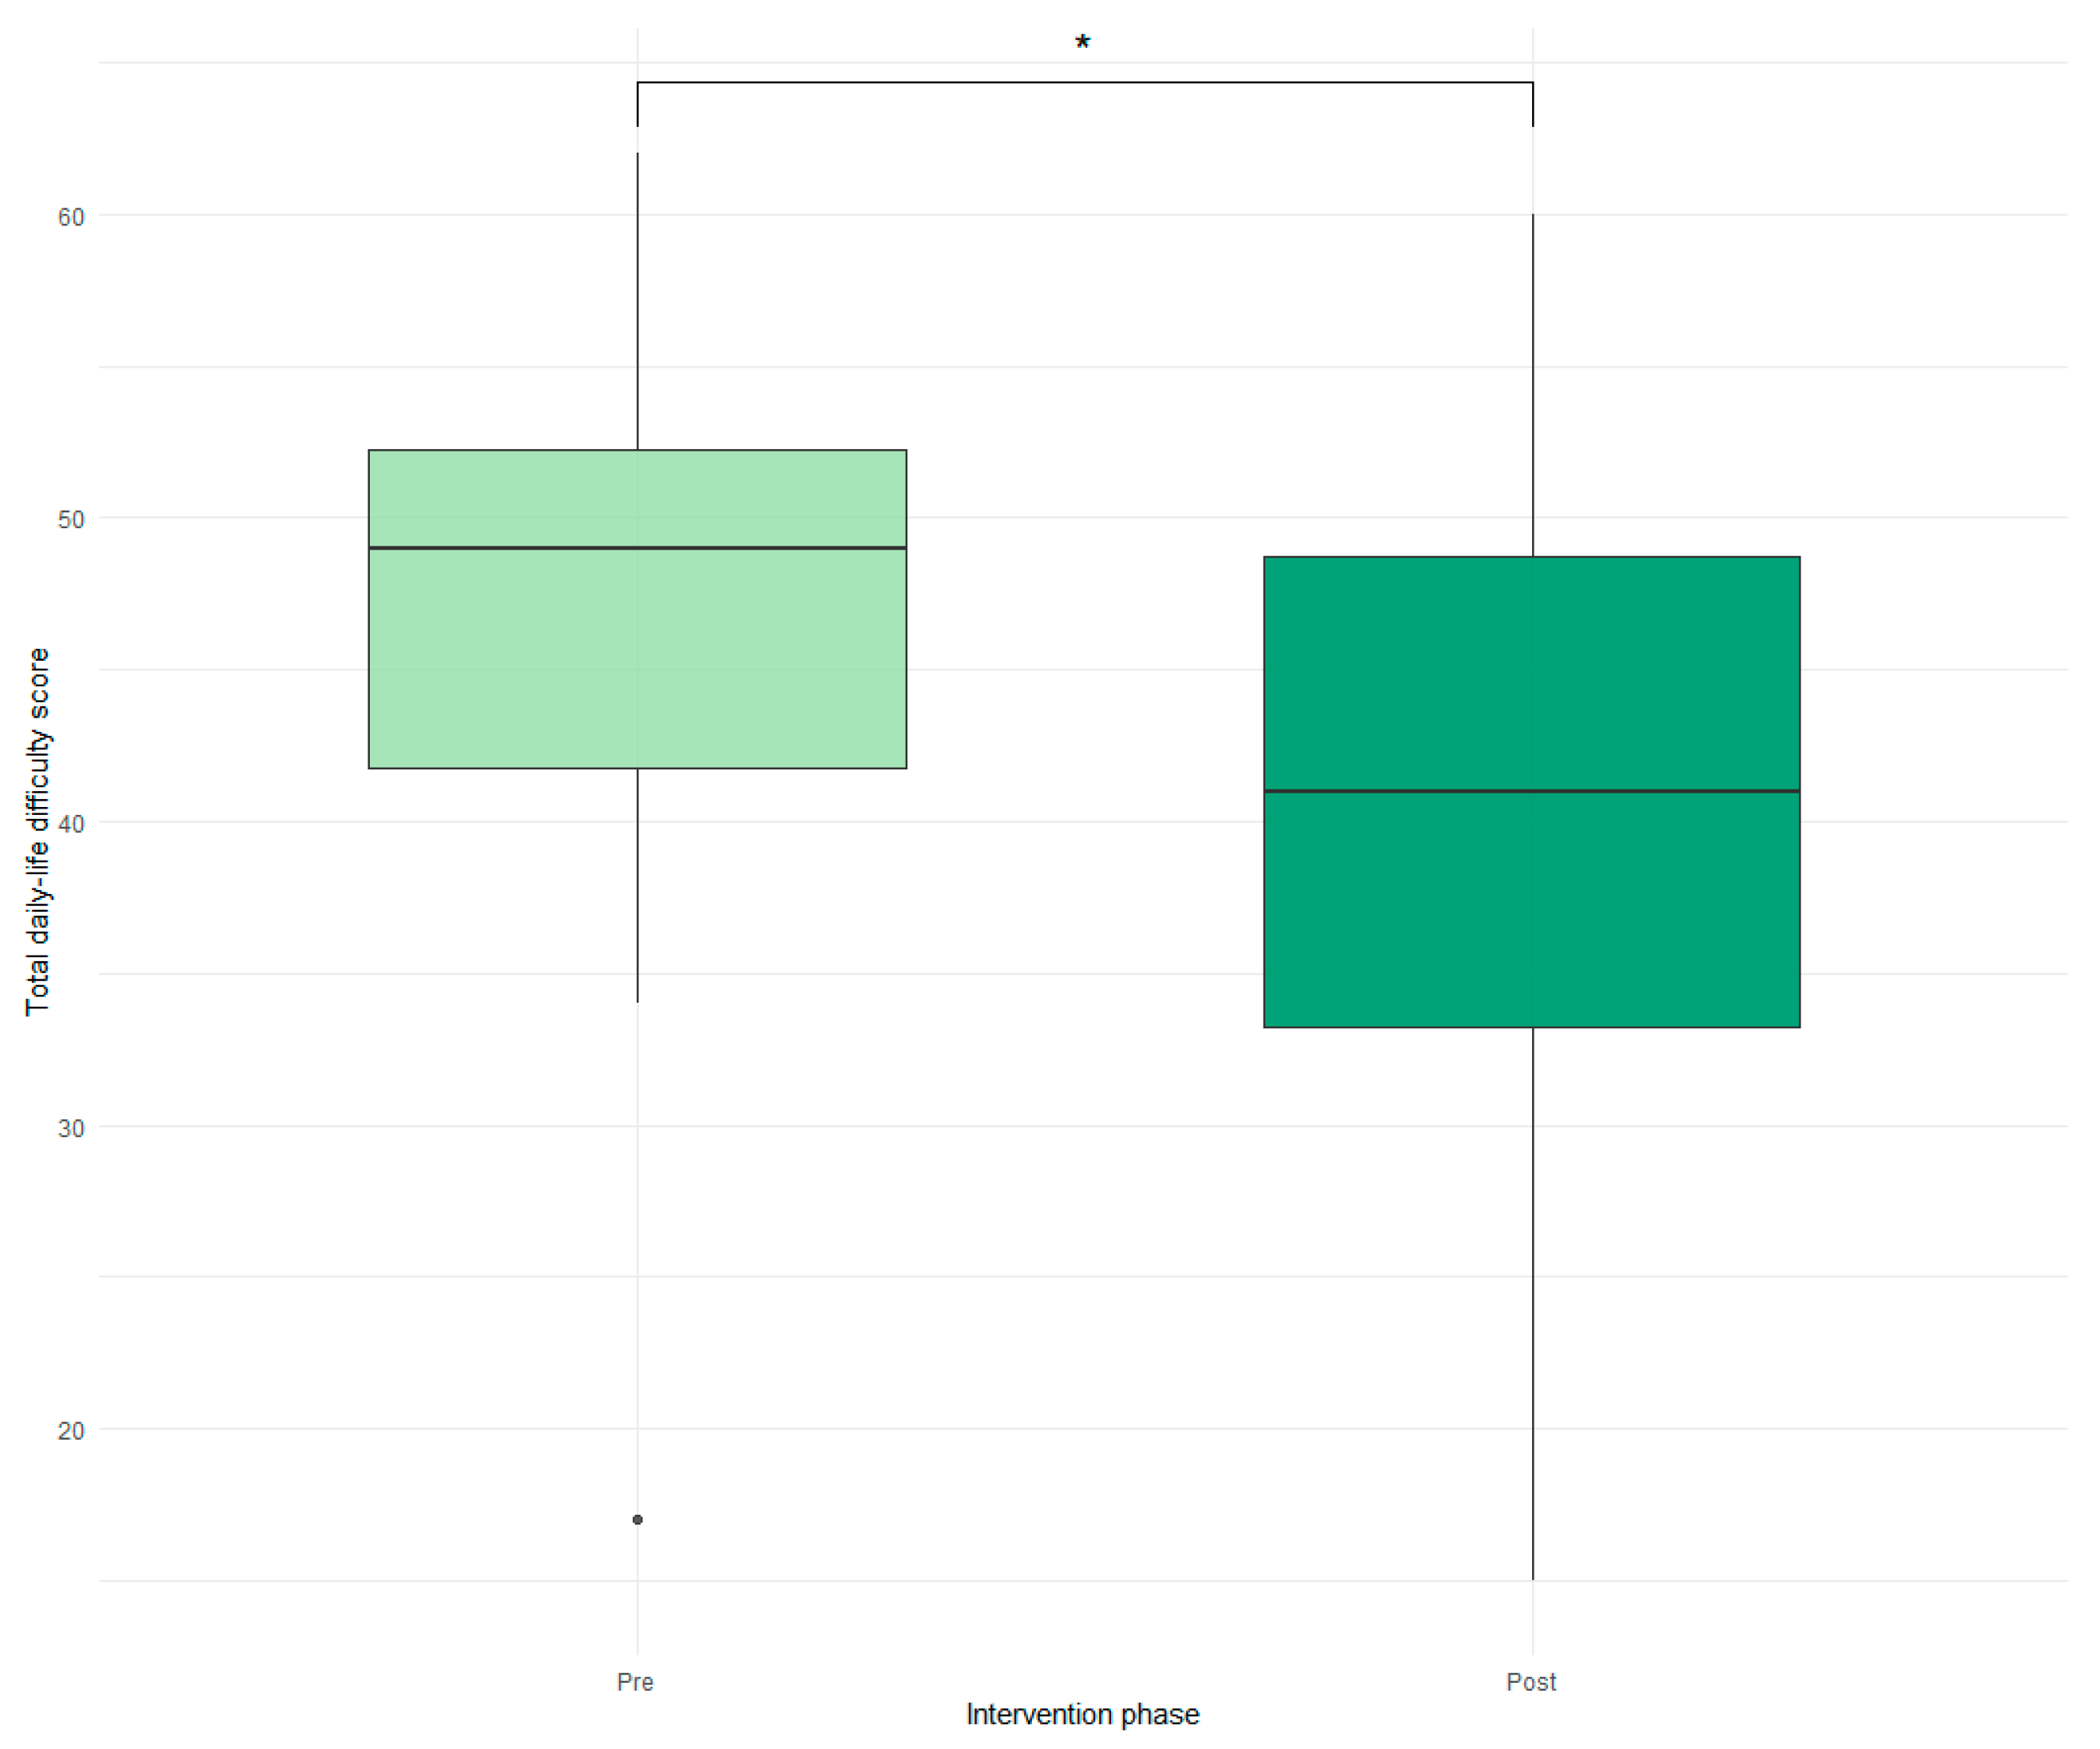
Data from the NumRisk DD group were compared with post-intervention data from the SMILE DD group. This cross-sectional comparison was necessary because the Numerical Behavior in Daily Life Questionnaire had not been administered to the SMILE DD group before the intervention.
For everyday mathematical difficulties within DD, the pre-intervention (NumRisk study) group reported higher scores (M = 47.19, SD = 8.94, N = 32) than the post-intervention group (M = 41.2, SD = 11.43, N = 30). The difference was significant (W = 639, p = 0.025, r = 0.28).
Participants assessed after the intervention reported significantly fewer everyday mathematical difficulties than the pre-intervention reference group. However, this finding should be interpreted with caution, as different participants were assessed before and after the intervention, precluding conclusions about individual-level change or direct intervention effects. Investigating whether interventions targeting mathematical performance can also reduce everyday mathematical difficulties would be of great interest, but requires future longitudinal studies assessing everyday functioning before and after the intervention.
Figure A12.
Intervention-Related Differences in Everyday Mathematical Difficulties. * p < 0.05.
References
- Ahmmed, S., Saha, J., Tamal, M. A., Abdullah Al Mamun, K., & Islam, S. (2024). Factors predicting the mathematics anxiety of adolescents: A structural equation modeling approach. Frontiers in Psychiatry, 15, 1484381. [Google Scholar] [CrossRef] [Scilit] [PubMed]
- Ashcraft, M. H., & Kirk, E. P. (2001). The relationships among working memory, math anxiety, and performance. Journal of Experimental Psychology: General, 130(2), 224–237. [Google Scholar] [CrossRef] [PubMed]
- Ashcraft, M. H., & Krause, J. A. (2007). Working memory, math performance, and math anxiety. Psychonomic Bulletin & Review, 14(2), 243–248. [Google Scholar] [CrossRef] [Scilit] [PubMed]
- Ashkenazi, S., & Henik, A. (2010). A disassociation between physical and mental number bisection in developmental dyscalculia. Neuropsychologia, 48(10), 2861–2868. [Google Scholar] [CrossRef] [Scilit] [PubMed]
- Barroso, C., Ganley, C. M., McGraw, A. L., Geer, E. A., Hart, S. A., & Daucourt, M. C. (2021). A meta-analysis of the relation between math anxiety and math achievement. Psychological Bulletin, 147(2), 134–168. [Google Scholar] [CrossRef] [Scilit] [PubMed]
- Bieg, M., Goetz, T., Wolter, I., & Hall, N. C. (2015). Gender stereotype endorsement differentially predicts girls’ and boys’ trait-state discrepancy in math anxiety. Frontiers in Psychology, 6, 1404. [Google Scholar] [CrossRef] [Scilit] [PubMed]
- Bruine de Bruin, W., & Slovic, P. (2021). Low numeracy is associated with poor financial well-being around the world. PLoS ONE, 16(11), e0260378. [Google Scholar] [CrossRef] [Scilit] [PubMed]
- Cantlon, J. F. (2022). Gender and sex differences in dyslexia and dyscalculia. In M. A. Skeide (Ed.), The Cambridge handbook of dyslexia and dyscalculia (1st ed., pp. 233–250). Cambridge University Press. [Google Scholar] [CrossRef] [Scilit]
- Cipora, K., Artemenko, C., & Nuerk, H.-C. (2019). Different ways to measure math anxiety. In I. C. Mammarella, S. Caviola, & A. Dowker (Eds.), Mathematics anxiety (1st ed., pp. 20–41). Routledge. [Google Scholar] [CrossRef] [Scilit]
- Daseking, M., Petermann, F., & Waldmann, H.-C. (2014). Schätzung der allgemeinen Intelligenz mit einer Kurzform der WAIS-IV bei neurologischen Fragestellungen. Aktuelle Neurologie, 41(6), 349–355. [Google Scholar] [CrossRef] [Scilit]
- Devine, A., Fawcett, K., Szűcs, D., & Dowker, A. (2012). Gender differences in mathematics anxiety and the relation to mathematics performance while controlling for test anxiety. Behavioral and Brain Functions, 8(1), 33. [Google Scholar] [CrossRef] [Scilit] [PubMed]
- Devine, A., Hill, F., Carey, E., & Szűcs, D. (2018). Cognitive and emotional math problems largely dissociate: Prevalence of developmental dyscalculia and mathematics anxiety. Journal of Educational Psychology, 110(3), 431–444. [Google Scholar] [CrossRef] [Scilit]
- Devine, A., Soltész, F., Nobes, A., Goswami, U., & Szűcs, D. (2013). Gender differences in developmental dyscalculia depend on diagnostic criteria. Learning and Instruction, 27, 31–39. [Google Scholar] [CrossRef] [Scilit] [PubMed]
- De Visscher, A., Noël, M.-P., Pesenti, M., & Dormal, V. (2018). Developmental dyscalculia in adults: Beyond numerical magnitude impairment. Journal of Learning Disabilities, 51(6), 600–611. [Google Scholar] [CrossRef] [Scilit] [PubMed]
- Dowker, A., Sarkar, A., & Looi, C. Y. (2016). Mathematics anxiety: What have we learned in 60 years? Frontiers in Psychology, 7, 508. [Google Scholar] [CrossRef] [Scilit] [PubMed]
- Eysenck, M. W., & Calvo, M. G. (1992). Anxiety and performance: The processing efficiency theory. Cognition & Emotion, 6(6), 409–434. [Google Scholar] [CrossRef] [Scilit]
- Fias, W., Menon, V., & Szűcs, D. (2013). Multiple components of developmental dyscalculia. Trends in Neuroscience and Education, 2(2), 43–47. [Google Scholar] [CrossRef] [Scilit]
- Finlayson, M. (2014). Addressing math anxiety in the classroom. Improving Schools, 17(1), 99–115. [Google Scholar] [CrossRef] [Scilit]
- Gliksman, Y., & Henik, A. (2019). Enumeration and alertness in developmental dyscalculia. Journal of Cognition, 2(1), 5. [Google Scholar] [CrossRef] [Scilit] [PubMed]
- Goetz, T., Bieg, M., Lüdtke, O., Pekrun, R., & Hall, N. C. (2013). Do girls really experience more anxiety in mathematics? Psychological Science, 24(10), 2079–2087. [Google Scholar] [CrossRef] [Scilit] [PubMed]
- Grob, A., Gygi, J. T., & Hagmann-von Arx, P. (2019). Stanford-Binet intelligence scales (5th ed.). Hogrefe. [Google Scholar]
- Haberstroh, S., & Schulte-Körne, G. (2019). The diagnosis and treatment of dyscalculia. Deutsches Ärzteblatt International, 116, 107–114. [Google Scholar] [CrossRef] [Scilit] [PubMed]
- Hart, S. A., & Ganley, C. M. (2019). The nature of math anxiety in adults: Prevalence and correlates. Journal of Numerical Cognition, 5(2), 122–139. [Google Scholar] [CrossRef] [Scilit] [PubMed]
- Hembree, R. (1990). The nature, effects, and relief of mathematics anxiety. Journal for Research in Mathematics Education, 21(1), 33–46. [Google Scholar] [CrossRef] [Scilit]
- Hill, F., Mammarella, I. C., Devine, A., Caviola, S., Passolunghi, M. C., & Szűcs, D. (2016). Maths anxiety in primary and secondary school students: Gender differences, developmental changes and anxiety specificity. Learning and Individual Differences, 48, 45–53. [Google Scholar] [CrossRef] [Scilit]
- Holzer, N., Lenart, F., & Schaupp, H. (2017). Eggenberger Rechentest für Jugendliche und Erwachsene: Diagnostikum für Dyskalkulie für Beginn der 7. Schulstufe bis Ende der 8. Schulstufe und nach Schulabschluss. Hogrefe. [Google Scholar]
- Huang, M. (2026). Family support and teacher support in Vietnamese math education: Gendered pathways through math anxiety to math achievement based on PISA 2022. Acta Psychologica, 264, 106475. [Google Scholar] [CrossRef] [Scilit] [PubMed]
- Hutchison, J. E., Lyons, I. M., & Ansari, D. (2019). More similar than different: Gender differences in children’s basic numerical skills are the exception not the rule. Child Development, 90(1), e66–e79. [Google Scholar] [CrossRef] [Scilit] [PubMed]
- Kaufmann, L., Mazzocco, M. M., Dowker, A., Von Aster, M., Göbel, S. M., Grabner, R. H., Henik, A., Jordan, N. C., Karmiloff-Smith, A. D., Kucian, K., Rubinsten, O., Szucs, D., Shalev, R., & Nuerk, H.-C. (2013). Dyscalculia from a developmental and differential perspective. Frontiers in Psychology, 4, 516. [Google Scholar] [CrossRef] [Scilit] [PubMed]
- Kaufmann, L., Von Aster, M., Göbel, S. M., Marksteiner, J., & Klein, E. (2020). Developmental dyscalculia in adults: Current issues and open questions for future research. Lernen und Lernstörungen, 9(2), 126–137. [Google Scholar] [CrossRef] [Scilit]
- Kiss, A., & Vukovic, R. (2017). Math anxiety and attitudes toward mathematics: Implications for students with mathematics learning disabilities. Perspectives on Language and Literacy, 43(1), 35. [Google Scholar]
- Kohn, J., Richtmann, V., Rauscher, L., Kucian, K., Käser, T., Grond, U., Esser, G., & Von Aster, M. (2013). Das Mathematikangstinterview (MAI): Erste psychometrische Gütekriterien. Lernen und Lernstörungen, 2(3), 177–189. [Google Scholar] [CrossRef] [Scilit]
- Kucian, K., & von Aster, M. (2015). Developmental dyscalculia. European Journal of Pediatrics, 174(1), 1–13. [Google Scholar] [CrossRef] [Scilit] [PubMed]
- Kucian, K., Zuber, I., Kohn, J., Poltz, N., Wyschkon, A., Esser, G., & Von Aster, M. (2018). Relation between mathematical performance, math anxiety, and affective priming in children with and without developmental dyscalculia. Frontiers in Psychology, 9, 263. [Google Scholar] [CrossRef] [Scilit] [PubMed]
- Kuhl, J., Prediger, S., Schulze, S., Wittich, C., & Pulz, I. (2022). Inklusiver Mathematikunterricht in der Sekundarstufe—Eine Pilotstudie zur Prozentrechnung. Unterrichtswissenschaft, 50(2), 309–329. [Google Scholar] [CrossRef] [Scilit]
- Lai, Y., Zhu, X., Chen, Y., & Li, Y. (2015). Effects of mathematics anxiety and mathematical metacognition on word problem solving in children with and without mathematical learning difficulties. PLoS ONE, 10(6), e0130570. [Google Scholar] [CrossRef] [Scilit] [PubMed]
- Lambert, K., & Spinath, B. (2014). Do we need a special intervention program for children with mathematical learning disabilities or is private tutoring sufficient? Journal for Educational Research Online, 6(1), 68–93. [Google Scholar] [CrossRef] [PubMed]
- Lau, N. T. T., Ansari, D., & Sokolowski, H. M. (2024). Unraveling the interplay between math anxiety and math achievement. Trends in Cognitive Sciences, 28(10), 937–947. [Google Scholar] [CrossRef] [Scilit] [PubMed]
- Liu, Y., Peng, P., & Li, S. (2026). How to reduce mathematics anxiety: A systematic review and meta-analysis on intervention studies. Journal of Educational Psychology, 118(3), 299–324. [Google Scholar] [CrossRef] [Scilit]
- Luoni, C., Scorza, M., Stefanelli, S., Fagiolini, B., & Termine, C. (2023). A neuropsychological profile of developmental dyscalculia: The role of comorbidity. Journal of Learning Disabilities, 56(4), 310–323. [Google Scholar] [CrossRef] [Scilit] [PubMed]
- Ma, H., & Sun, C. (2025). The relationship between the mathematics anxiety and mathematics achievement of middle school students: The moderating effect of working memory. Behavioral Sciences, 15(11), 1566. [Google Scholar] [CrossRef] [Scilit] [PubMed]
- Mahmud, M. S., Zainal, M. S., Rosli, R., & Maat, S. M. (2020). Dyscalculia: What we must know about students’ learning disability in mathematics? Universal Journal of Educational Research, 8(12B), 8214–8222. [Google Scholar] [CrossRef] [Scilit]
- Mammarella, I. C., Hill, F., Devine, A., Caviola, S., & Szűcs, D. (2015). Math anxiety and developmental dyscalculia: A study on working memory processes. Journal of Clinical and Experimental Neuropsychology, 37(8), 878–887. [Google Scholar] [CrossRef] [Scilit] [PubMed]
- McMullan, M., Jones, R., & Lea, S. (2012). Math anxiety, self-efficacy, and ability in British undergraduate nursing students. Research in Nursing & Health, 35(2), 178–186. [Google Scholar] [CrossRef] [Scilit] [PubMed]
- Moser Opitz, E., Labhart, D., Grob, U., & Prediger, S. (2021). BASIS-MATH-G 6+: Gruppentest zur Basisdiagnostik Mathematik für das vierte Quartal der 6. Klasse und das erste Quartal der 7. Klasse (1st ed.). Hogrefe. [Google Scholar]
- Moser Opitz, E., Reusser, L., Moeri Müller, M., Anliker, B., Wittich, C., & Freesemann, O. (2010). Basisdiagnostik Mathematik für die Klassen 4–8. Hogrefe. [Google Scholar]
- Mutlu, Y. (2024). Effects of dyscalculia on personal, social, academic, professional and daily life: A case study. International Electronic Journal of Elementary Education, 17(1), 89–101. [Google Scholar] [CrossRef] [Scilit]
- Namkung, J. M., Peng, P., & Lin, X. (2019). The relation between mathematics anxiety and mathematics performance among school-aged students: A meta-analysis. Review of Educational Research, 89(3), 459–496. [Google Scholar] [CrossRef] [Scilit]
- Orbach, L., Herzog, M., & Fritz, A. (2019). State- und Trait-Mathematikängste. Hemmende Prädiktoren mathematischer Leistungsfähigkeit? Empirische Sonderpädagogik, 11, 3–30. [Google Scholar] [CrossRef] [PubMed]
- Pellizzoni, S., Cargnelutti, E., Cuder, A., & Passolunghi, M. C. (2022). The interplay between math anxiety and working memory on math performance: A longitudinal study. Annals of the New York Academy of Sciences, 1510(1), 132–144. [Google Scholar] [CrossRef] [Scilit] [PubMed]
- Prediger, S., Selter, C., Hußmann, S., & Nührenbörger, M. (2017). Mathe sicher können. Sachrechnen. Förderbausteine zur Sicherung mathematischer Basiskompetenzen. Cornelsen. [Google Scholar]
- Prediger, S., Selter, C., Hußmann, S., & Nührenbörger, M. (2026). Mathe sicher können. Diagnose- und Förderkonzept zur Sicherung mathematischer Basiskompetenzen: Brüche, Prozente, Dezimalzahlen (2. Aufl.). Cornelsen. Available online: https://mathe-sicher-koennen.dzlm.de/bpd (accessed on 9 October 2026).
- Rauscher, L., Kohn, J., Käser, T., Kucian, K., McCaskey, U., Wyschkon, A., Moraske, S., Esser, G., & Von Aster, M. (2017). Effekte des Calcularis-Trainings: Teil 2: Veränderungen psychosozialer Merkmale. Lernen und Lernstörungen, 6(2), 75–86. [Google Scholar] [CrossRef] [Scilit]
- Richardson, F. C., & Suinn, R. M. (1972). The mathematics anxiety rating scale: Psychometric data. Journal of Counseling Psychology, 19(6), 551–554. [Google Scholar] [CrossRef] [Scilit]
- Rossi, S., Xenidou-Dervou, I., & Cipora, K. (2023). Emotions and mathematics: Anxiety profiles and their influence on arithmetic performance in university students. Royal Society Open Science, 10(10), 230861. [Google Scholar] [CrossRef] [Scilit] [PubMed]
- Sáinz, M., & Eccles, J. (2012). Self-concept of computer and math ability: Gender implications across time and within ICT studies. Journal of Vocational Behavior, 80(2), 486–499. [Google Scholar] [CrossRef] [Scilit]
- Schillinger, F. L., Vogel, S. E., Diedrich, J., & Grabner, R. H. (2018). Math anxiety, intelligence, and performance in mathematics: Insights from the German adaptation of the Abbreviated Math Anxiety Scale (AMAS-G). Learning and Individual Differences, 61, 109–119. [Google Scholar] [CrossRef] [Scilit]
- Selter, C., Prediger, S., Nührenbörger, M., & Hußmann, S. (2025). Mathe sicher können. Diagnose- und Förderkonzept zur Sicherung mathematischer Basiskompetenzen: Natürliche Zahlen (2. Aufl.). Cornelsen. Available online: https://mathe-sicher-koennen.dzlm.de/nz (accessed on 9 October 2026).
- Skagerlund, K., Östergren, R., Västfjäll, D., & Träff, U. (2019). How does mathematics anxiety impair mathematical abilities? Investigating the link between math anxiety, working memory, and number processing. PLoS ONE, 14(1), e0211283. [Google Scholar] [CrossRef] [Scilit] [PubMed]
- Sokolowski, H. M., Hawes, Z., & Lyons, I. M. (2019). What explains sex differences in math anxiety? A closer look at the role of spatial processing. Cognition, 182, 193–212. [Google Scholar] [CrossRef] [Scilit] [PubMed]
- Soysal, D., Bani-Yaghoub, M., & Riggers-Piehl, T. A. (2022). A machine learning approach to evaluate variables of math anxiety in STEM students. Pedagogical Research, 7(2), em0125. [Google Scholar] [CrossRef] [Scilit]
- Staller, L., Moeller, K., Weiss, E. M., & Dresen, V. (2025). Neurodivergent conditions critically limit societal participation—The case of dyscalculia in adults. Neurodiversity, 3, 27546330251406911. [Google Scholar] [CrossRef] [Scilit]
- Svraka, B., Lasker, J., & Ujma, P. P. (2024). Cognitive, affective and sociological predictors of school performance in mathematics. Scientific Reports, 14(1), 26480. [Google Scholar] [CrossRef] [Scilit] [PubMed]
- Van Luit, J. E. H., & Toll, S. W. M. (2018). Associative cognitive factors of math problems in students diagnosed with developmental dyscalculia. Frontiers in Psychology, 9, 1907. [Google Scholar] [CrossRef] [Scilit] [PubMed]
- Vigna, G., Ghidoni, E., Burgio, F., Danesin, L., Angelini, D., Benavides-Varela, S., & Semenza, C. (2022). Dyscalculia in early adulthood: Implications for numerical activities of daily living. Brain Sciences, 12(3), 373. [Google Scholar] [CrossRef] [Scilit] [PubMed]
- Vogel, S. E., & De Smedt, B. (2021). Developmental brain dynamics of numerical and arithmetic abilities. npj Science of Learning, 6(1), 22. [Google Scholar] [CrossRef] [Scilit] [PubMed]
- Wang, Z., Oh, W., Malanchini, M., & Borriello, G. A. (2020). The developmental trajectories of mathematics anxiety: Cognitive, personality, and environmental correlates. Contemporary Educational Psychology, 61, 101876. [Google Scholar] [CrossRef] [Scilit]
- Wechsler, D. (2012). Wechsler adult intelligence scale—Fourth edition (1st ed.). Pearson. [Google Scholar]
- Wechsler, D. (2017). Wechsler intelligence scale for children—Fifth edition (1st ed.). Pearson. [Google Scholar]
- World Health Organization. (2022). 6A03.2 Developmental learning disorder with impairment in mathematics. Available online: http://id.who.int/icd/entity/771231188 (accessed on 20 October 2026).
- Xie, Y., Lan, X., & Tang, L. (2024). Gender differences in mathematics anxiety: A meta-analysis of Chinese children. Acta Psychologica, 248, 104373. [Google Scholar] [CrossRef] [Scilit] [PubMed]
- Xin, Z., Xiao, H., & Lin, G. (2023). Math anxiety and financial anxiety predicting individuals’ financial management behavior. Depression and Anxiety, 2023, 3131631. [Google Scholar] [CrossRef] [Scilit] [PubMed]
- Zhang, J., Zhao, N., & Kong, Q. P. (2019). The relationship between math anxiety and math performance: A meta-analytic investigation. Frontiers in Psychology, 10, 1613. [Google Scholar] [CrossRef] [Scilit] [PubMed]

Disclaimer/Publisher’s Note: The statements, opinions and data contained in all publications are solely those of the individual author(s) and contributor(s) and not of MDPI and/or the editor(s). MDPI and/or the editor(s) disclaim responsibility for any injury to people or property resulting from any ideas, methods, instructions or products referred to in the content. |
© 2026 by the authors. Licensee MDPI, Basel, Switzerland. This article is an open access article distributed under the terms and conditions of the Creative Commons Attribution (CC BY) license.