


Abstract
The digital transformation of schools requires analysis at the organisational level, yet primary education remains underrepresented in empirical research on institutional digital capacity. This study examines organisational digital competence in primary schools in Extremadura, Spain. Data were collected in October 2023 through the Self-reflection on Effective Learning by Fostering the use of Innovative Educational technologies (SELFIE) tool in 209 schools (47.07% of the region’s schools). SELFIE aggregated the responses of 616 members of school leadership teams, 4112 teachers and 21,892 students into school-level means for each group, so the school was the unit of analysis. In both adult groups, pedagogical support and resources and infrastructure and equipment obtained the highest ratings, whereas assessment practices and collaboration and networking were the least developed. Teachers rated leadership, pedagogical and assessment dimensions higher than school leadership teams. All dimensions were positively interrelated, and infrastructure was the condition least associated with classroom implementation. Uses that support existing practice reached clearly positive ratings, whereas uses that change the roles of teachers and students remained neutral. In the participating schools, digitalisation therefore appears to remain predominantly functional.
1. Introduction
The digital transformation of education systems has become a strategic priority internationally, driven by the need to respond to societies heavily shaped by technology and to new educational demands centred on active participation in digital contexts. The digitalisation of education is therefore regarded as a structural process linked to improving the quality, equity and resilience of education systems (Cosgrove & Cachia, 2025; Mizova et al., 2026). However, the availability of technology does not automatically translate into improved educational practices, which reflects the complexity of the process (Chiu et al., 2024).
The concept of digital competence has evolved from approaches centred on individual technical skills towards a multidimensional construct that integrates the knowledge, skills, attitudes and critical capacities required for effective participation in digital environments (Ure-de-Oliveira & Bonilla-Algovia, 2025; Zubizarreta Pagaldai et al., 2025).
This evolution has given rise to perspectives that frame digital competence at the organisational level and regard educational institutions as systems in which leadership, infrastructure, teachers’ professional development, teaching practices, assessment and collaboration interact (Cachia et al., 2024).
The European Framework for Digitally Competent Educational Organisations (DigCompOrg) is a central reference in this field, as it proposes a systemic model in which digital competence is analysed as an organisational dimension rather than as the sum of individual competences (Kampylis et al., 2015). From this perspective, the analysis of digitalisation in education adopts institutional and multi-level approaches that address its complexity through the interaction between different educational stakeholders.
In this study, digital competence refers to the knowledge, skills and attitudes needed to use digital technologies confidently, critically and responsibly (Cosgrove & Cachia, 2025), and organisational digital competence, or digital capacity, to the extent to which a school’s culture, policies, infrastructure and staff and student competence support the integration of digital technologies into teaching and learning (Costa et al., 2021). Digitalisation designates the process by which schools incorporate these technologies, and pedagogical transformation designates changes in teaching, learning and assessment that alter what students do.
Studies carried out in several European countries report differences between structural dimensions, particularly technological infrastructure and access to digital resources, and pedagogical dimensions (Nguyen et al., 2024; Romero-Tena et al., 2024; Ure-de-Oliveira & Bonilla-Algovia, 2025). Empirical evidence also indicates that teacher training tends to be more effective when it is integrated into organisational dynamics and communities of practice than when it relies on individual or one-off approaches (Amemasor et al., 2025). These findings have been interpreted as indicative of digitalisation processes in transition, in which the incorporation of technology does not translate uniformly into changes in educational practices.
Among the dimensions examined in previous studies, the assessment of learning is one of the areas that present the greatest challenges for development. Even in contexts with adequate technological resources, traditional assessment models persist, with limited use of formative strategies, student participation and data to improve learning (Agtarap et al., 2024). This situation has been identified as an important factor in understanding the gap between the use of technology and its pedagogical impact.
Digital divides also persist. They are not limited to access to technology but extend to the development of skills and the meaningful use of digital resources. These divides affect educational stakeholders unequally and limit the capacity of schools to develop inclusive and equitable practices (Bešić et al., 2025; Cerezo-Cortijo & González-Pérez, 2026). Consequently, the digitalisation of education has been approached as a process shaped by pedagogical, organisational and social factors.
This need for an integrated analysis is particularly significant in primary education. Despite its importance in the early development of digital competence, institutional evidence specific to this stage is scarce. Large-scale studies in Spain rely mainly on teachers’ self-assessments (García-Delgado et al., 2023; Palacios-Rodríguez et al., 2025), SELFIE studies cover all educational stages together (Castaño Muñoz et al., 2022), and institutional studies of primary schools are mostly qualitative case studies of few schools (Sosa Díaz & Valverde Berrocoso, 2022). Its specific characteristics, such as the role of the school as an organisational unit, the influence of pedagogical leadership and the lower degree of teacher specialisation, call for contextualised studies (Munar Garau et al., 2024; Rasdiana et al., 2024).
These considerations reveal a gap in the literature: few studies address digital competence in primary education from an integrated, multi-stakeholder perspective. Moreover, there is limited evidence that allows the mismatches between the structural and pedagogical dimensions of digitalisation, and their implications for educational practice, to be analysed jointly.
In response to this gap, this study aims to analyse organisational digital competence in primary schools from a systemic and integrated perspective that incorporates the views of school leadership teams, teachers and students, in order to identify patterns of development, discrepancies between dimensions and opportunities to improve educational digitalisation.
2. Methods
This study adopted a quantitative approach with a non-experimental design, since no intervention was implemented and no variables were manipulated.
2.1. Research Questions and Objectives
The general objective of the study was to analyse the level of development of organisational digital competence in primary schools.
The study addressed four research questions (RQs):
- RQ1. What level of development do primary schools reach in the structural and organisational dimensions of organisational digital competence, namely leadership, collaboration and networking, and infrastructure and equipment?
- RQ2. To what extent are digital technologies integrated into educational practices, as reflected in continuous professional development, pedagogical support and resources, and classroom implementation?
- RQ3. What level of development do assessment practices and students’ digital competence reach?
- RQ4. Do school leadership teams and teachers differ in their perceptions, how are the eight dimensions related to one another, and how much do the results vary across schools?
The following specific objectives (SOs) were defined in relation to the research questions:
- SO1. To analyse the level of development of the structural dimensions of organisational digital competence, including leadership, digital strategy, collaboration and networking, infrastructure and technological resources.
- SO2. To examine the integration of digital technologies into educational practices, considering teachers’ professional development, pedagogical practices and the organisation of learning.
- SO3. To analyse the development of digital competence in learning processes, including assessment practices and students’ digital competence, in relation to the organisational dynamics of the school.
- SO4. To examine the differences between school leadership teams and teachers, the relationships among the SELFIE dimensions and the variability of results across schools.
2.2. Participants
The study population comprised the 444 schools in the Autonomous Community of Extremadura (Spain) that offered the second cycle of Early Childhood Education and Primary Education, with a total enrolment of 47,365 students during the 2023–2024 academic year (Consejo Escolar de Extremadura, 2025). Staff of both stages answered the questionnaire, but only Primary Education students answered the student version. Early Childhood Education pupils did not take part for methodological and ethical reasons.
A non-probability convenience sampling strategy was used, with school participation as the criterion for inclusion in the study. All publicly funded Early Childhood and Primary schools in the region, except special education schools, were invited through the Regional Government’s educational technology coordinators. The sample comprised the schools that agreed to take part and sent their SELFIE school report to the research team. The final sample comprised 21,892 primary school students from 209 schools, representing 47.07% of all schools in the region and 46.2% of the total pupil population.
Most participating schools were publicly owned (92.82%), and 7.18% were state-subsidised private schools. In terms of geographical distribution, 41.15% of the schools were located in the province of Cáceres and 58.85% in Badajoz. Rural settings predominated, with 78.5% of the participating schools located in municipalities with fewer than 30,000 inhabitants.
A total of 4112 teachers took part, representing 50.32% of the regional teaching workforce, and their geographical distribution was consistent with the demographic profile of Extremadura (Spain). In addition, 616 members of school leadership teams took part in the study.
Participant data are presented in Table 1.
Table 1.
Distribution of the invited and participating samples by educational stakeholder group.
Because the sample was non-probabilistic, no confidence level or margin of error is reported, and the results cannot be generalised statistically to the region. Schools more engaged with the Digital Education Project may have been more likely to take part, so a self-selection bias cannot be ruled out.
2.3. Description of the Questionnaire
Data were collected with SELFIE, an instrument developed on the basis of DigCompOrg and promoted by the European Commission in collaboration with the Joint Research Centre and other European educational organisations. SELFIE is an institutional self-reflection tool designed to assess, in a structured manner, the extent to which digital technologies are embedded in educational institutions.
The questionnaire has three versions tailored to the profiles of the participants (students, teachers and members of school leadership teams), which allows digital competence to be assessed from several perspectives within the same organisation.
The instrument consists of 62 items covering technological, pedagogical and organisational aspects. These items are organised into eight areas: leadership, collaboration and networking, infrastructure and equipment, continuous professional development, pedagogical support and resources, implementation in teaching and learning, assessment practices, and students’ digital competence. Most responses are recorded on a five-point Likert scale, complemented by several multiple-choice questions.
The study used the official Spanish version of the SELFIE primary school questionnaire without any change to the items. The analysis was based on the compulsory indicators of the eight areas. Optional indicators were reported only descriptively, and items added by schools were not analysed. The three versions share the same areas and response scale, but students answer only part of them, so results are reported separately for each group.
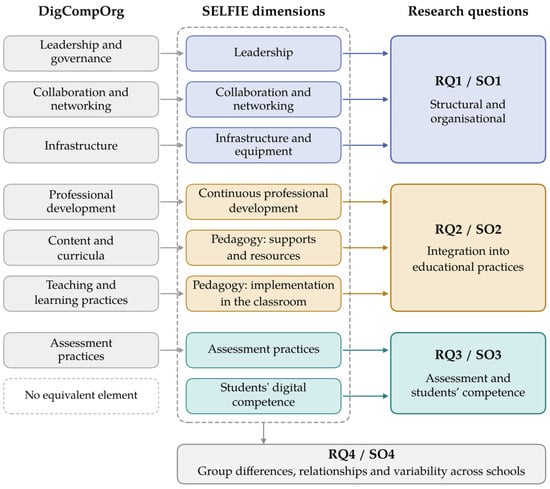
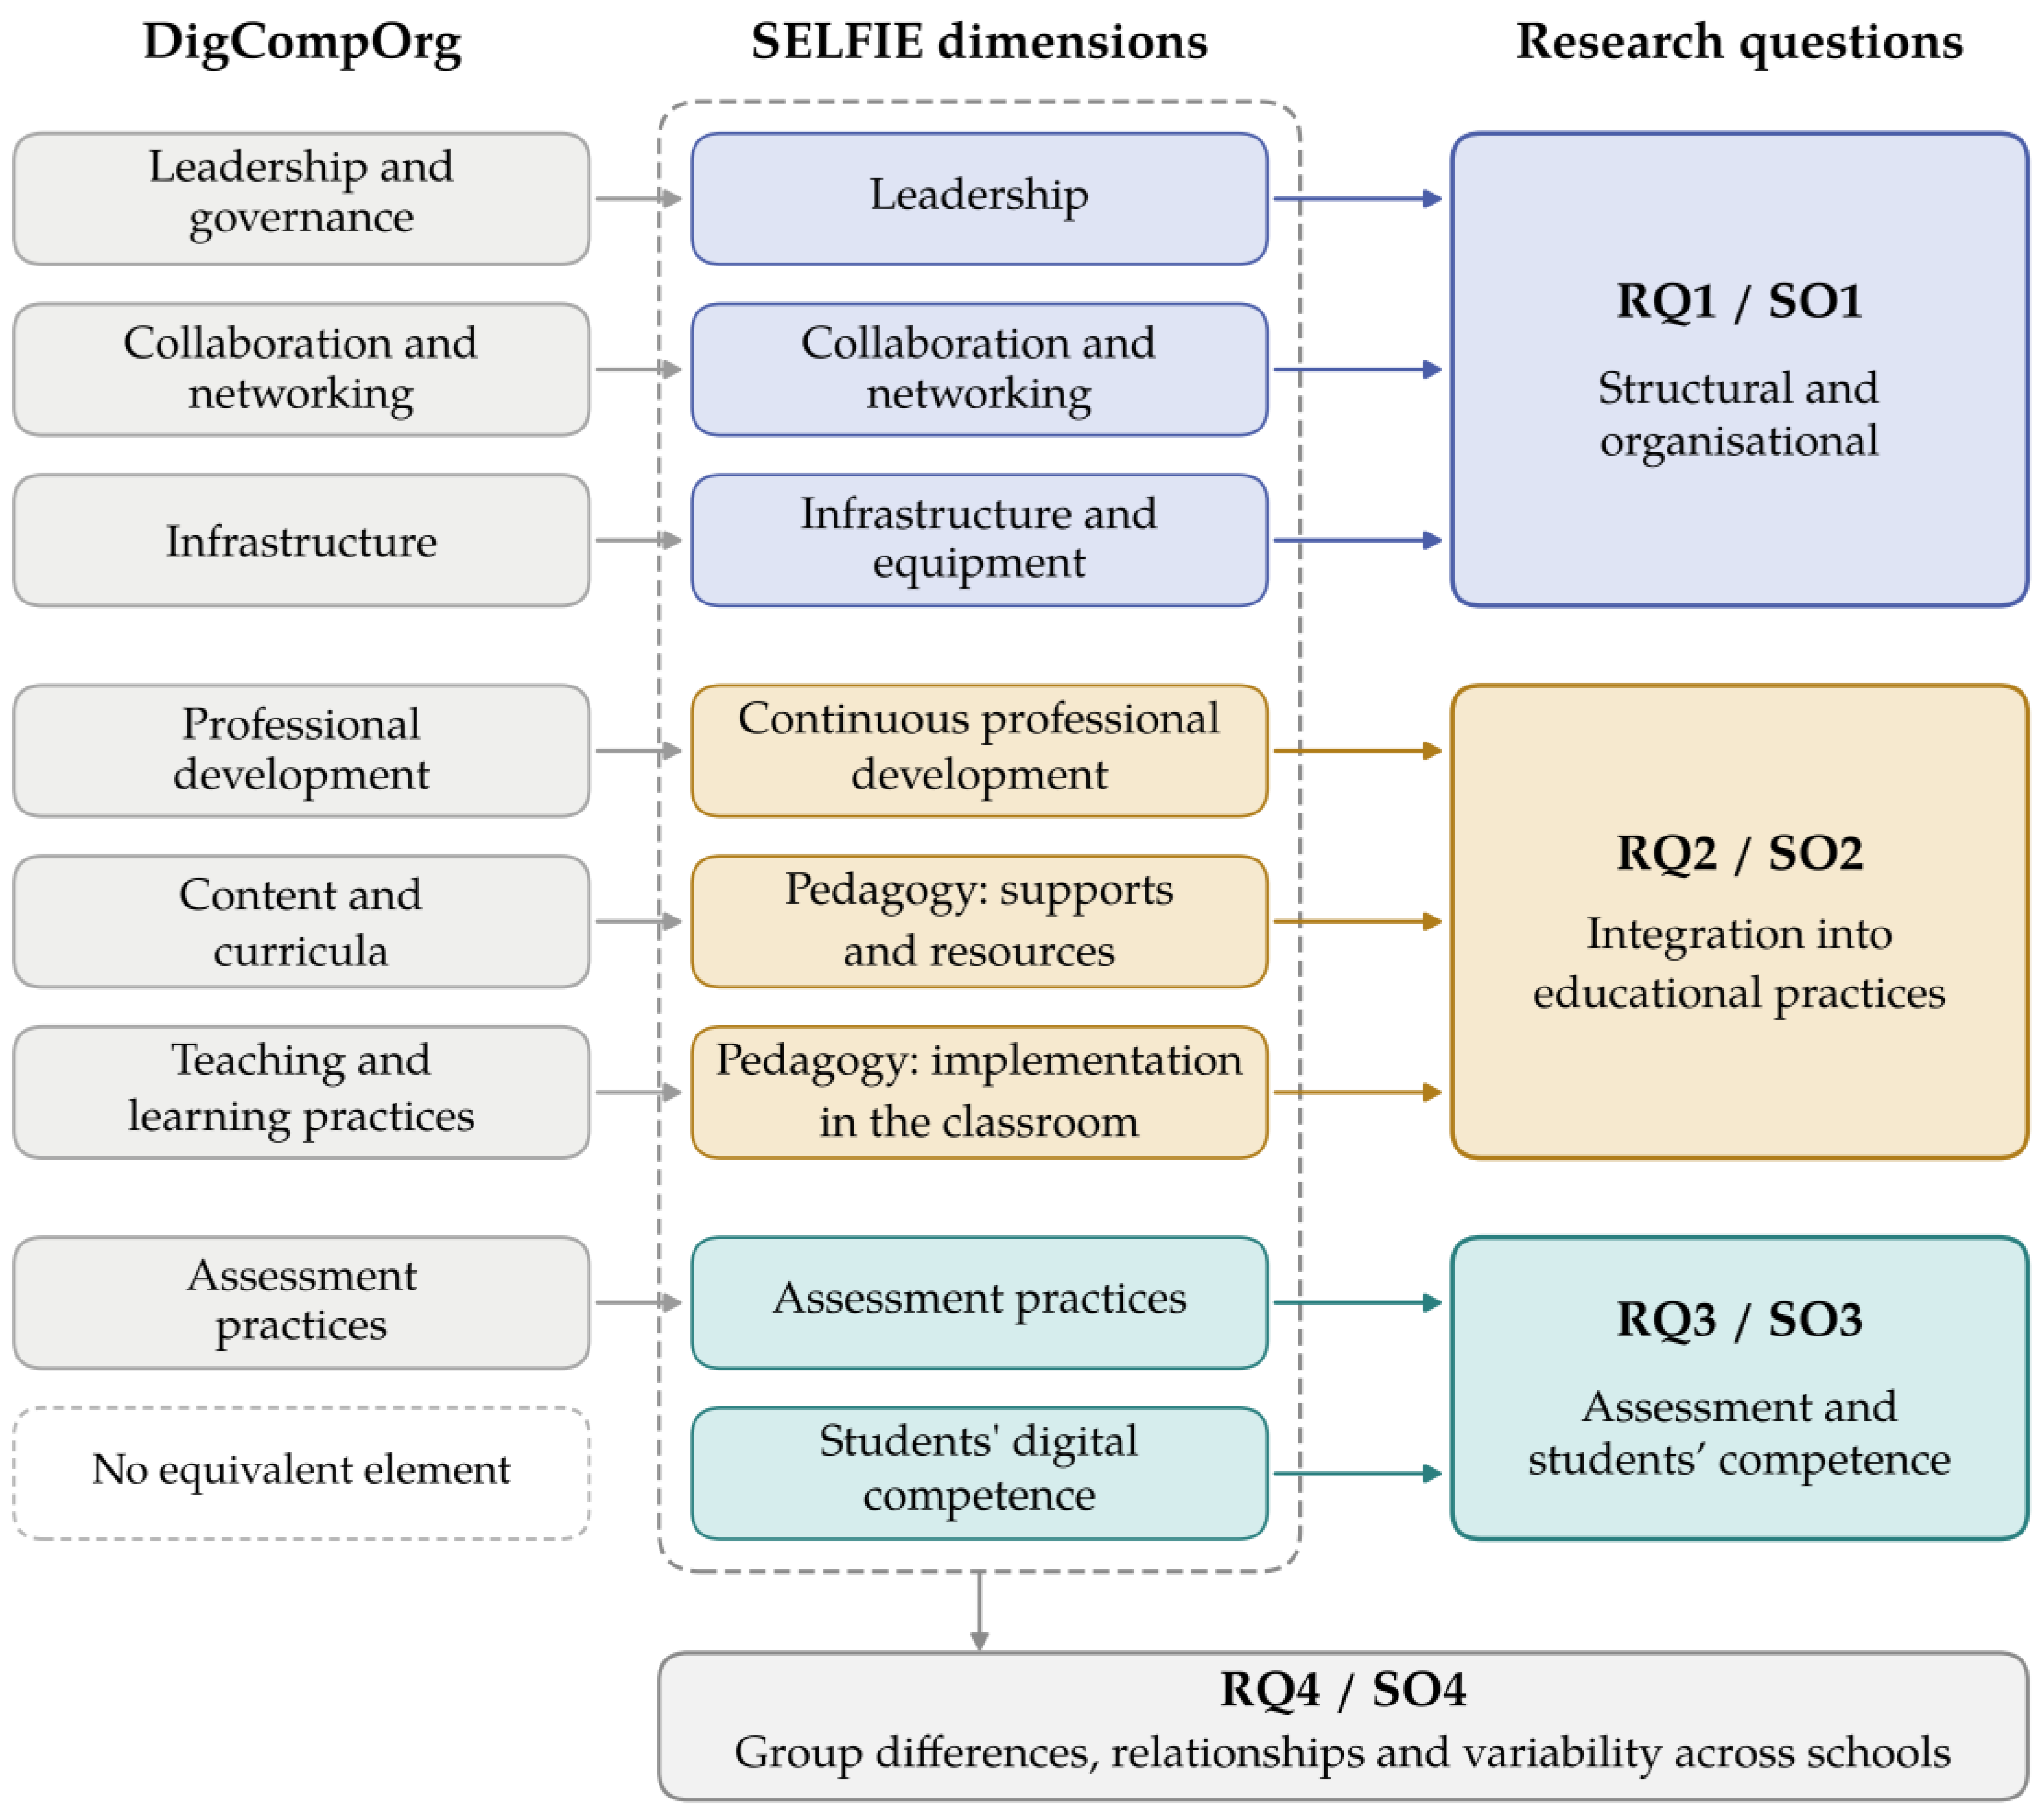
SELFIE operationalises DigCompOrg (Costa et al., 2021; Kampylis et al., 2015). Seven of its areas correspond to elements of the framework, and the eighth, students’ digital competence, refers to the expected outcome of these conditions. Figure 1 shows this correspondence and how the eight areas were grouped to answer the research questions.
Figure 1.
Conceptual framework of the study.
SELFIE was chosen because the object of the study is the digital capacity of the school as experienced by its community. The three versions of the questionnaire gather the views of school leadership teams, teachers and students on the same school, so the perspective of those who plan digitalisation can be contrasted with that of those who implement it in the classroom and those who experience it as learners. The reliability and construct validity of the instrument have been examined through item response theory and confirmatory factor analysis, with results that support its use to describe the digital capacity of schools (Costa et al., 2021).
2.4. Procedure for Data Collection and Analysis
Data collection was planned systematically and began after approval by the Bioethics Committee of the University of Extremadura (Spain) and the corresponding institutional authorisations from the participating schools. School selection was based on eligibility criteria associated with participation in the Regional Government of Extremadura’s Digital Education Project during the 2023–2024 academic year.
Data were collected in October 2023 through the online SELFIE questionnaire, which was distributed via the Rayuela educational platform. Most participants completed the questionnaire at school using mobile devices, and it took approximately 20 to 30 min. Throughout the process, expert guidance was provided to ensure the correct interpretation of the items.
Confidentiality, anonymity and responsible data management were ensured at all stages of the study in accordance with the applicable ethical and legal regulations.
2.5. Data Analysis
SELFIE aggregates the responses of each group within each school and returns the mean of every indicator for school leadership teams, teachers and students separately. Only these school reports were available, so the data matrix comprised 209 cases and every school carried the same weight regardless of its number of respondents. Indicator means (Table 2, Table 3, Table 4, Table 5, Table 6, Table 7, Table 8 and Table 9) were computed on the schools that included each indicator. For the remaining analyses, each dimension score was the mean of its compulsory indicators (1 = strongly disagree, 5 = strongly agree), with Cronbach’s alpha between 0.700 and 0.936 (Table A1). SELFIE records only complete questionnaires, and school-level missing values were not imputed. Treating the school as the unit of analysis avoids treating respondents from the same school as independent observations, although variance within schools could not be modelled.
Table 2.
Descriptive statistics for the Leadership dimension.
Table 3.
Descriptive statistics for the Collaboration and Networks dimension.
Table 4.
Descriptive statistics for the Infrastructure and Equipment dimension.
Table 5.
Descriptive statistics for the Continuing Professional Development dimension.
Table 6.
Descriptive statistics for the Pedagogy: Support and Resources dimension.
Table 7.
Descriptive statistics for the Pedagogy: Implementation in the Classroom dimension.
Table 8.
Descriptive statistics for the Assessment Practices dimension.
Table 9.
Descriptive statistics for the Students’ Digital Competences dimension.
Differences between school leadership teams and teachers were tested with paired-samples t tests and Cohen’s d (Cohen, 1988), and relationships among dimensions were tested with Pearson correlations computed separately for each group. The Benjamini–Hochberg procedure controlled the false discovery rate (Benjamini & Hochberg, 1995). Variability across schools was described with the coefficient of variation. Analyses were run with SPSS version 27.0.1.
To distinguish functional digitalisation from pedagogical transformation, two indices were defined from compulsory indicators. The functional index included internet access, digital devices for learning, online educational resources, communication with the educational community and students’ safe and responsible behaviour. The transformation index, based on more demanding uses of technology (Schmitz et al., 2023), included the creation of digital resources, student collaboration, interdisciplinary projects, reflection on learning, peer feedback and digital content creation. Digitalisation was considered predominantly functional when the functional index reached 3.5 or higher while the transformation index remained below it.
3. Results
This section presents the results for each of the areas examined in the three groups of participants: members of school leadership teams, teachers and students.
3.1. Leadership
Students did not answer the Leadership dimension, so the analysis is limited to members of school leadership teams and teachers. Among members of school leadership teams, the highest score was recorded for the implementation of new teaching methods using digital technologies (3.69). The school’s digital strategy (3.16) and its collaborative development (3.13) obtained intermediate ratings. The lowest-rated indicator was the time available to explore teaching with digital technologies (2.80).
Among teachers, new teaching methods also obtained the highest score (3.86), followed by the collaborative development of the digital strategy (3.52) and the digital strategy itself (3.16).
Three of the four indicators exceeded the midpoint of the scale (3) in both groups. The time available to explore teaching with digital technologies fell below it, reaching 2.80 among members of school leadership teams and 2.87 among teachers. The main difference between groups concerned the collaborative development of the digital strategy, which teachers rated higher.
3.2. Collaboration and Networks
Students answer only part of the indicators in the Collaboration and Networking dimension, so the analysis of individual indicators is limited to members of school leadership teams and teachers. Of the four indicators in this dimension, members of school leadership teams gave the highest score to discussions on the use of digital technologies, and teachers to collaboration with other organisations. In both groups, the evaluation of progress in teaching and learning through digital technologies was among the lowest-rated aspects of the dimension.
The indicators in this dimension clustered at or slightly above the midpoint of the scale (3). Among teachers, all four exceeded it by a narrow margin, with values between 3.06 and 3.18. Among members of school leadership teams, two indicators were exactly at the midpoint: the evaluation of progress in teaching and learning and the promotion of synergies for blended learning. The collaboration and networking dimension was therefore perceived in neutral rather than clearly positive terms. Development was also uneven across indicators. Professional dialogue and external collaboration appeared more established, whereas less progress was observed in the systematic evaluation of teaching and learning processes supported by digital technologies and in the promotion of synergies for blended learning.
3.3. Infrastructure and Equipment
Within the Infrastructure and Equipment dimension, internet access obtained the highest scores among both members of school leadership teams and teachers. Among students, the availability of digital devices for learning was the highest-rated aspect. These results suggest a generally positive perception of connectivity and of the availability of basic digital resources in schools.
By contrast, the lowest scores were concentrated in indicators related to the digital divide, particularly support for addressing the challenges of digital and blended learning. Comparatively low ratings were also given to assistive technologies by members of school leadership teams and to the availability of digital devices for students by teachers.
Overall, the results point to uneven development of digital infrastructure and equipment. Connectivity and basic technological resources appear to be well-established.
Two indicators fell below the midpoint of the scale (3) among members of school leadership teams. Support for addressing the challenges posed by digital and blended learning reached 2.89 and assistive technologies 2.99. These results suggest that challenges remain in relation to equity-oriented measures, support for diverse learning needs, and efforts to reduce the digital divide.
3.4. Continuing Professional Development
The Continuous Professional Development dimension is answered only by members of school leadership teams and teachers. In both groups, the highest-rated indicator was participation in continuous professional development activities, which suggests a positive perception of access to training on the educational use of digital technologies. The sharing of experiences received moderately positive ratings, which indicates a moderate development of collaborative practices that support professional learning.
By contrast, the lowest-rated indicator in both groups was the identification of professional development needs, which was the least developed aspect of the dimension. Overall, these results reflect the importance attributed to continuous professional development in schools. They also point to the need to strengthen the identification of professional development needs and to align training provision with the actual requirements of teaching practice.
3.5. Pedagogy: Support and Resources
The Pedagogical Support and Resources dimension was analysed for members of school leadership teams and teachers. In both groups, the highest scores were recorded for communication with the educational community and the use of online educational resources, which indicates that digital technologies are widely used to access educational content and to support institutional communication.
By contrast, the lowest scores were observed for the creation of digital resources among members of school leadership teams and for the use of virtual learning environments among teachers. The remaining indicators, including open educational resources, obtained intermediate scores in both groups.
Overall, these findings indicate that digital technologies are mainly used to access existing educational content and to communicate with the educational community. Practices that require teachers to produce their own materials or to organise learning in virtual environments are less consolidated. All indicators in this dimension exceeded the midpoint of the scale (3) in both groups.
3.6. Pedagogy: Implementation in the Classroom
The Pedagogy: Classroom Implementation dimension was analysed for the three groups of participants. Student engagement received high scores in all three groups, which reflects a shared perception of the central role of active participation in teaching and learning supported by digital technologies.
Among members of school leadership teams, the highest scores were recorded for student engagement and student collaboration, whereas interdisciplinary projects received the lowest. Among teachers, adaptation to students’ needs was the highest-rated indicator, followed by student engagement, and interdisciplinary projects were again the least developed aspect. Among students, the highest scores corresponded to student engagement and adaptation to students’ needs, whereas student collaboration received the lowest rating.
Overall, these results suggest a stronger emphasis on pedagogical practices that promote student engagement and adapt to learners’ needs, whereas interdisciplinary approaches supported by digital technologies appear less firmly embedded in classroom practice. Interdisciplinary projects was the only indicator of the dimension to fall below the midpoint of the scale (3), reaching 2.99 among members of school leadership teams.
3.7. Assessment Practices
Students did not answer the Assessment Practices dimension, so the analysis is limited to members of school leadership teams and teachers. The highest scores were reported for digital assessment by teachers and for the assessment of skills developed outside school by members of school leadership teams. These results suggest an emerging adoption of broader assessment approaches supported by digital technologies.
By contrast, the lowest-rated indicator was peer feedback, that is, students’ comments on the work of their classmates. The remaining indicators, including skills assessment, appropriate feedback and the documentation of learning, obtained intermediate scores in both groups.
This was the only dimension whose mean fell below the midpoint of the scale in one of the groups surveyed, reaching 2.97 among members of school leadership teams. Four indicators also fell below the midpoint. Peer feedback reached 2.69 among members of school leadership teams and 2.81 among teachers. Reflection on learning reached 2.87 and the use of data to improve learning 2.75, both among members of school leadership teams. These results suggest that participatory and formative assessment practices are not yet firmly embedded within schools. This applies in particular to co-assessment and to the systematic use of digital technologies to improve assessment and support student learning.
3.8. Students’ Digital Competences
The Students’ Digital Competence dimension was analysed for the three groups, although students did not answer all of its indicators. The highest scores were recorded for learning to communicate, particularly according to members of school leadership teams and teachers. Students’ responsible and safe behaviour when using digital technologies also received high ratings. These results suggest a positive perception of competences associated with the ethical, safe and communicative use of digital technologies.
By contrast, learning to code or programme and solving technical problems obtained the lowest scores and were the least developed aspects of the dimension. The remaining indicators, including digital content creation and the evaluation of information quality, obtained intermediate scores.
Most indicators exceeded the midpoint of the scale (3), including all those answered by students, with values between 3.57 and 3.91. Two indicators fell below the midpoint in both staff groups. Learning to code or programme reached 2.49 among members of school leadership teams and 2.56 among teachers, and solving technical problems reached 2.81 and 2.89, respectively. The ratings therefore indicate a higher perceived level of development in competences related to digital behaviour and communication than in more advanced technical and computational skills, whose integration appears to remain comparatively limited.
3.9. Global Results by Areas of SELFIE Questionnaire
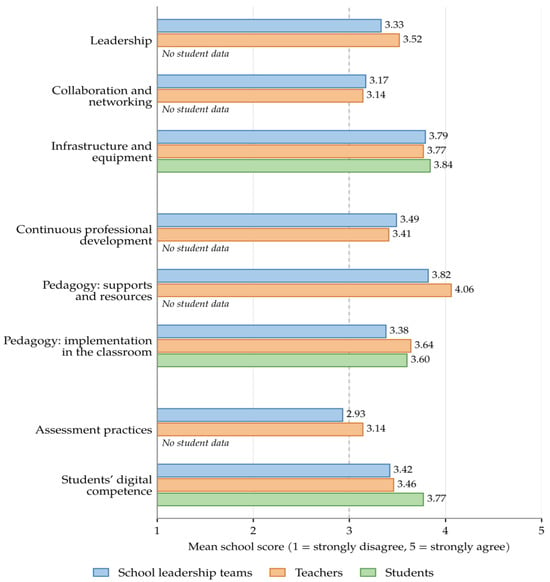
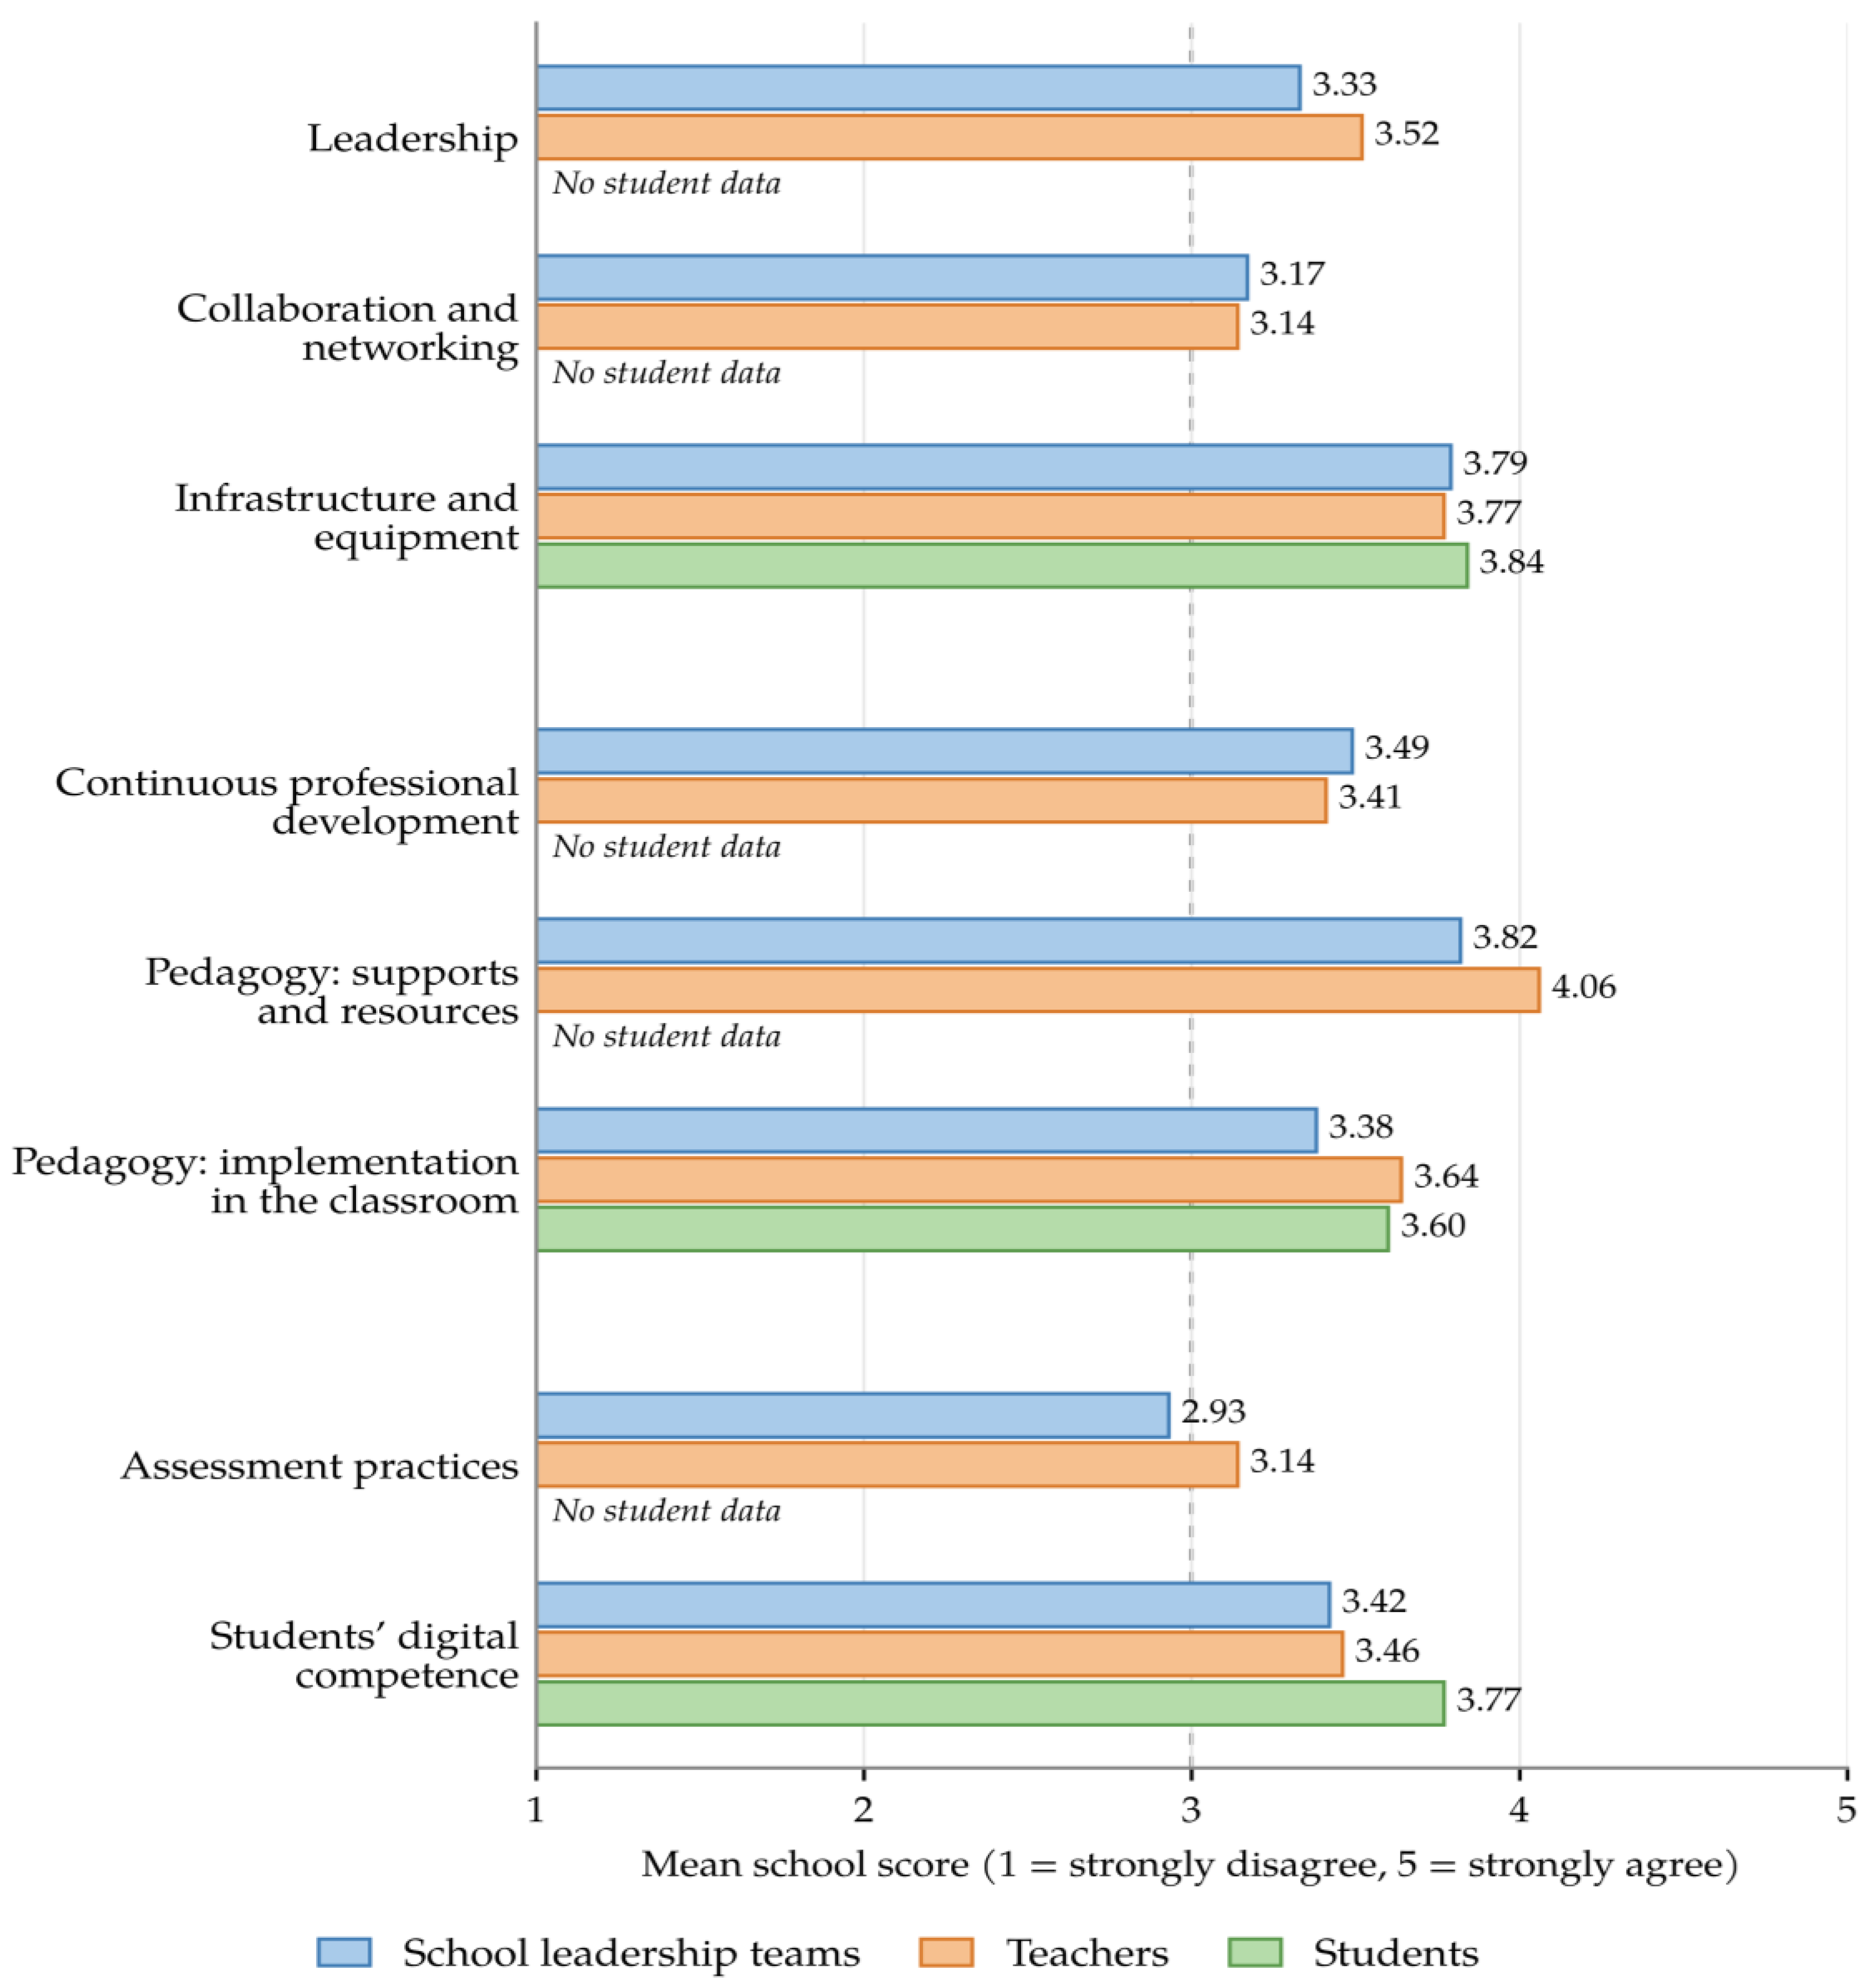
Because indicators and respondent groups differ across dimensions, dimensions were compared within each group rather than through a pooled mean (Figure 2, Table A1).
Figure 2.
Mean score of each SELFIE dimension.
The ordering of the dimensions was consistent across the two groups that answered all eight of them. Pedagogy: supports and resources and infrastructure and equipment obtained the two highest scores among both school leadership teams (M = 3.82 and M = 3.79) and teachers (M = 4.06 and M = 3.77). Assessment practices (M = 2.93 and M = 3.14) and collaboration and networking (M = 3.17 and M = 3.14) were the two lowest-rated dimensions in both groups. Assessment practices was the only dimension below the midpoint of the scale, among school leadership teams. Leadership occupied an intermediate position (M = 3.33 and M = 3.52). Among students, infrastructure and equipment was the highest-rated of the three dimensions they answered (M = 3.84), followed by students’ digital competence (M = 3.77) and classroom implementation (M = 3.60).
The functional index reached the agreement zone in both groups (M = 3.95 among school leadership teams and M = 3.97 among teachers), whereas the transformation index remained neutral (M = 3.08 and M = 3.28). The difference was large in both groups (t(198) = 22.22, d = 1.58, and t(202) = 29.28, d = 2.06, p < 0.001), so according to the criterion defined, digitalisation was predominantly functional.
3.10. Differences Between School Leadership Teams and Teachers
Table 10 compares the dimension scores of school leadership teams and teachers within the same schools. Teachers gave significantly higher ratings in pedagogy: supports and resources (d = 0.49), pedagogy: implementation in the classroom (d = 0.45), assessment practices (d = 0.33) and leadership (d = 0.26). The other four dimensions did not differ after correction. The correlation between both groups’ scores in the same school ranged from 0.36 to 0.49.
Table 10.
Differences between school leadership teams and teachers in the SELFIE dimensions.
3.11. Relationships Among Dimensions
Table 11 presents the correlations among the eight dimensions. All were positive and significant (p < 0.001 after correction). Classroom implementation was most strongly associated with assessment practices (r = 0.832 among school leadership teams and r = 0.852 among teachers) and with students’ digital competence (r = 0.743 and r = 0.725). Among the conditions that precede classroom practice, infrastructure and equipment showed the weakest association with classroom implementation (r = 0.453 and r = 0.533) and pedagogy: supports and resources showed the strongest (r = 0.661 and r = 0.716).
Table 11.
Correlations among the eight SELFIE dimensions computed at school level.
3.12. Variability Across Schools
Dispersion across schools was largest in assessment practices, leadership and collaboration and networking among school leadership teams (coefficients of variation of 0.23, 0.22 and 0.22) and smallest in pedagogy: supports and resources among teachers (0.07) (Table A1). The two lowest-rated dimensions were therefore also among those in which schools differed most.
4. Discussion
The findings indicate that the digitalisation process in primary schools in Extremadura (Spain) rests on well-established infrastructure and pedagogical support. However, its implementation remains uneven across the pedagogical, assessment and collaborative dimensions. Beyond confirming previously identified patterns, the study suggests that this gap may be associated with organisational and cultural conditions, as well as with the level of development achieved. In particular, the time available for innovation, the persistence of traditional assessment approaches and the limited development of collaboration provide a coherent framework for interpreting these tensions. The discussion is organised around the four research questions, and the interpretations offered are tentative because the design is cross-sectional and based on perceptions.
With regard to the structural and organisational dimensions (RQ1), the experience of education systems such as that of Portugal helps to contextualise these findings, since the widespread adoption of SELFIE has been associated with greater coherence between diagnosis and subsequent action (European Commission, Directorate-General for Education, Youth, Sport and Culture, 2024; Giannoutsou, 2024). In the schools analysed, however, diagnostic processes do not appear to translate systematically into organisational improvements, which suggests that progress depends on the effective integration of such tools into sustained institutional practices, as well as on their availability.
Similarly, evidence from Cyprus and the Netherlands suggests that the potential of SELFIE depends on its integration into collective processes of strategic reflection (Giannoutsou et al., 2023). The limitations identified in the schools analysed in Extremadura, particularly in collaboration and in the evaluation of progress, indicate that these conditions are not yet fully established. Therefore, although schools have diagnostic capacity, the limited development of organisational structures may limit the potential for sustained transformation.
A further challenge concerns the limited consolidation of collaborative structures. One possible interpretation of the limited coordination of professional networks and the limited evaluation of collective progress is that innovation develops in a fragmented manner. As previous research has indicated, the absence of stable networks tends to encourage innovation based primarily on individual initiatives, thereby reducing its systemic impact (Castaño Muñoz et al., 2023; Maya-Jariego et al., 2023).
Similarly, the limitations identified in digital inclusion and assistive technologies suggest that equity remains a challenge. Even where infrastructure is well-developed, digitalisation may give rise to subtler forms of inequality associated with the effective use of available resources, which supports the need to address this dimension in educational policy.
With regard to the integration of digital technologies into educational practices (RQ2), these technologies appear to be widely used for instrumental purposes, particularly for communication and access to educational resources. More complex practices, such as digital content creation and interdisciplinary work, appear to be less common.
This interpretation is consistent with evidence from Greece, where, despite widespread access to digital resources, the use of digital devices for learning is among the lowest in Europe, which suggests a limited pedagogical integration of technology (OECD, 2026).
In contrast to the United Kingdom, where these tools have been associated with improved learning outcomes (Giannoutsou, 2024), the findings from Greece and from the present study suggest that digitalisation has been directed mainly towards enhancing existing practices rather than transforming them pedagogically (OECD, 2026).
With regard to learning processes (RQ3), assessment appears as both a central organising element of the education system and one of its least developed dimensions in the schools analysed. The limited presence of practices such as co-assessment, self-regulation and the use of data to support learning suggests that barriers persist in one of the most established components of educational practice. Because assessment shapes what is taught and how learning is valued, its limited development may influence other dimensions and could contribute to the gap between the potential of digitalisation and its actual impact (Agtarap et al., 2024; Cîmpean & Bocoș, 2023). The strong association between assessment practices and classroom implementation observed in both groups is consistent with this interpretation, although the cross-sectional design does not allow its direction to be established.
The profile of students’ digital competence is consistent with this interpretation. Competences related to the safe and communicative use of digital technologies appear more developed than more advanced skills, which suggests an uneven progression. In education systems such as those of Estonia and Ireland, where curriculum, pedagogy and assessment are more closely aligned (European Commission, Directorate-General for Education, Youth, Sport and Culture, 2024; Maya-Jariego et al., 2023), a more balanced pattern of development has been reported, which suggests that such coherence is only partially established in the schools analysed.
With regard to the differences between groups and the relationships among dimensions (RQ4), the relational analyses qualify this reading. Schools that progressed in one dimension tended to progress in the others, but infrastructure was the condition least related to classroom implementation, whereas pedagogical support and assessment practices were the most closely related. This is consistent with evidence that school digital infrastructure does not predict more demanding uses of technology (Schmitz et al., 2023).
Within the Spanish context, these findings are consistent with the recent emphasis on technological provision (Giannoutsou, 2024). However, the high prevalence of intermediate responses and the significant divergence between members of school leadership teams and teachers in leadership and in the pedagogical and assessment dimensions suggest a limited degree of organisational alignment. This concentration of intermediate responses should not be interpreted as neutrality. It may instead reflect limited cultural consolidation, uneven patterns of adoption and a digitalisation process that still depends on individual initiatives rather than on established institutional structures.
Taken together, these findings suggest that the limitations observed in the participating schools may be related less to a lack of resources than to the incomplete transformation of organisational and cultural conditions. As an implication rather than a direct finding, it may be advisable to reorient digitalisation strategies towards transforming the conditions that shape teaching practice, particularly with regard to the availability of time, assessment approaches, and collaborative dynamics.
In the participating schools, digitalisation appears to have reached a structural threshold. Its future development may depend less on the provision of additional technology than on the capacity of the system to transform its organisational, pedagogical and assessment-related foundations. Without such changes, digitalisation could stabilise at a functional level, with a limited impact on teaching and learning.
5. Conclusions
In the primary schools analysed, the development of digital competence is characterised by a gap between organisational maturity and pedagogical transformation. Although considerable progress has been made in areas such as infrastructure, access to resources and pedagogical support, this progress does not appear to be accompanied by a comparable implementation of more complex pedagogical, assessment and collaborative practices. In these schools, digitalisation appears to play a predominantly functional role, focused on enhancing existing practices rather than substantially transforming their pedagogical foundations.
With regard to the objectives of the study, the multidimensional approach made it possible to identify different levels of development and patterns of inconsistency across dimensions. The findings suggest that progress in digitalisation depends largely on the alignment between organisational, pedagogical and assessment-related processes. In this respect, assessment and collaboration were the least developed dimensions, and their limited development may be associated with slower progress in other areas.
This lack of alignment is particularly evident in students’ digital competence, which was rated higher in the safe and communicative use of digital technologies than in technical and computational thinking skills. This finding suggests that the pedagogical scope of digitalisation remains limited, since it does not appear to support the systematic development of more advanced digital competences.
In the participating schools in Extremadura, digitalisation appears to remain at a predominantly functional level, a pattern that coincides with limited coherence between its core dimensions. In this regard, the study offers a relational perspective on digitalisation that goes beyond approaches centred exclusively on the availability of technological resources. It also shows the usefulness of SELFIE for the systemic analysis of digitalisation processes in schools.
Consequently, the results suggest that, in this regional context, digitalisation strategies could prioritise greater internal coherence across the educational system. In particular, the findings point to the need to transform assessment approaches, strengthen collaborative structures, align teachers’ professional development with the training needs identified and address the organisational conditions that facilitate innovation, especially the availability of time and institutional support.
Some limitations should be acknowledged. SELFIE describes digital capacity as perceived by the school community (Costa et al., 2021), which is consistent with the aim of the study, but it does not directly measure the effectiveness of digital transformation, the quality of teaching or students’ actual competence. Future studies could combine it with classroom observation or performance-based measures. Only school-level reports were available, participation was voluntary and the design is cross-sectional, so causal relationships cannot be established. The study was also limited to Extremadura (Spain), so transferability to other contexts should be considered with caution.
Finally, future research should adopt comparative and longitudinal designs to examine how digitalisation processes evolve and which factors influence the development of digital competence in different educational contexts.
Author Contributions
Conceptualization, I.C.-C. and A.G.-P.; methodology, I.C.-C.; software, I.C.-C.; validation, I.C.-C. and A.G.-P.; formal analysis, I.C.-C. and A.G.-P.; investigation, I.C.-C. and A.G.-P.; resources, I.C.-C. and A.G.-P.; data curation, I.C.-C.; writing—original draft preparation, I.C.-C. and A.G.-P.; writing—review and editing, I.C.-C. and A.G.-P.; visualization, I.C.-C.; supervision, I.C.-C. and A.G.-P. All authors have read and agreed to the published version of the manuscript.
Funding
This research received no external funding. This research forms part of a doctoral thesis carried out within the Doctoral Programme in Innovation in Teacher Training, Guidance, Analysis of Educational Practice and ICT in Education (R010) at the University of Extremadura, Spain.
Institutional Review Board Statement
The study was conducted in accordance with the Declaration of Helsinki and approved by the Bioethics and Biosafety Committee of the University of Extremadura, Spain (protocol code 5/2023, approved on 21 March 2023).
Informed Consent Statement
Participation was voluntary and anonymous. Institutional authorisation was obtained from the leadership team of every participating school, and the SELFIE tool incorporates its own consent mechanism, through which each respondent explicitly authorises the use of their anonymised results for research purposes. The tool collects no personal data and the research team accessed only school-level aggregated reports, so no identifiable individual data were processed.
Data Availability Statement
The dataset presented in this article is not readily available because it cannot be shared with third parties in accordance with the ethical approval.
Conflicts of Interest
The authors declare no conflicts of interest.
Appendix A
Table A1.
Descriptive statistics of the SELFIE dimensions.
References
- Agtarap, H. J., Januto, A. C., Aglibot, K. A., & Toquero, C. M. (2024). Assessment strategies and challenges of teachers in evaluating students during online learning. Journal of Digital Educational Technology, 4(2), ep2418. [Google Scholar] [CrossRef] [Scilit]
- Amemasor, S. K., Oppong, S. O., Ghansah, B., Benuwa, B.-B., & Essel, D. D. (2025). A systematic review on the impact of teacher professional development on digital instructional integration and teaching practices. Frontiers in Education, 10, 1541031. [Google Scholar] [CrossRef] [Scilit]
- Benjamini, Y., & Hochberg, Y. (1995). Controlling the false discovery rate: A practical and powerful approach to multiple testing. Journal of the Royal Statistical Society: Series B (Methodological), 57(1), 289–300. [Google Scholar] [CrossRef] [Scilit]
- Bešić, E., Frizzarin, A., & Todorova, K. (2025). Digital technology use in inclusive schools in four European countries: Within- and between-school differences. Journal of Research on Technology in Education, 57(5), 1190–1203. [Google Scholar] [CrossRef] [Scilit]
- Cachia, R., Pokropek, A., & Giannoutsou, N. (2024). Supporting the monitoring of the digital capacity of schools through optimal shortening of the SELFIE tool. Computers & Education, 208, 104938. [Google Scholar] [CrossRef] [Scilit]
- Castaño Muñoz, J., Pokropek, A., & Weikert García, L. (2022). For to all those who have, will more be given? Evidence from the adoption of the SELFIE tool for the digital capacity of schools in Spain. British Journal of Educational Technology, 53(6), 1937–1955. [Google Scholar] [CrossRef] [Scilit]
- Castaño Muñoz, J., Vuorikari, R., Costa, P., Hippe, R., & Kampylis, P. (2023). Teacher collaboration and students’ digital competence—Evidence from the SELFIE tool. European Journal of Teacher Education, 46(3), 476–497. [Google Scholar] [CrossRef] [Scilit]
- Cerezo-Cortijo, I., & González-Pérez, A. (2026). Competencia digital del alumnado de primaria en contextos de digitalización educativa. ReiDocrea, 15(37), 504–518. Available online: https://hdl.handle.net/10481/114467 (accessed on 1 July 2026).
- Chiu, T. K. F., Falloon, G., Song, Y., Wong, V. W. L., Zhao, L., & Ismailov, M. (2024). A self-determination theory approach to teacher digital competence development. Computers & Education, 214, 105017. [Google Scholar] [CrossRef] [Scilit]
- Cîmpean, M. E., & Bocoș, M. (2023). Digital competences in school education: Selfie. Current perspectives and challenges. In E. Soare, & C. Langa (Eds.), Education facing contemporary world issues—EDU WORLD 2022 (Vol. 5, pp. 53–73). European Publisher. [Google Scholar] [CrossRef] [Scilit]
- Cohen, J. (1988). Statistical power analysis for the behavioral sciences (2nd ed.). Lawrence Erlbaum Associates. [Google Scholar]
- Consejo Escolar de Extremadura. (2025). Informe sobre el estado y situación del sistema educativo en Extremadura. Ministerio de Educación, Formación Profesional y Deportes. Available online: https://www.educacionfpydeportes.gob.es/mc/cee/publicaciones/informes-del-sistema-educativo/informe-2024.html (accessed on 1 July 2026).
- Cosgrove, J., & Cachia, R. (2025). DigComp 3.0: European digital competence framework (5th ed.). Publications Office of the European Union. [Google Scholar] [CrossRef]
- Costa, P., Castaño-Muñoz, J., & Kampylis, P. (2021). Capturing schools’ digital capacity: Psychometric analyses of the SELFIE self-reflection tool. Computers & Education, 162, 104080. [Google Scholar] [CrossRef] [Scilit]
- European Commission, Directorate-General for Education, Youth, Sport and Culture. (2024). Education and training monitor 2024: Comparative report. Publications Office of the European Union. [Google Scholar] [CrossRef]
- García-Delgado, M. Á., Rodríguez-Cano, S., Delgado-Benito, V., & Di Giusto-Valle, C. (2023). Digital teaching competence among teachers of different educational stages in Spain. Education Sciences, 13(6), 581. [Google Scholar] [CrossRef] [Scilit]
- Giannoutsou, N. (2024). Enabling the digital transformation in education: Looking through a “SELFIEs” lens. Publications Office of the European Union. [Google Scholar] [CrossRef] [PubMed]
- Giannoutsou, N., Dimitriadis, Y., Villagrá-Sobrino, S., Ioannou, A., Timotheou, S., McKenney, S., Van der Linden, S., Jorrín-Abellán, I., Martínez-Monés, A., Adamou, M., Cachia, R., Hogenkamp, L., Gallego-Lema, V., Coca-Jiménez, P., & García-Sastre, S. (2023). Empowering schools to drive their digital transformation: Insights from the evaluation of SELFIE. European Commission. Available online: https://publications.jrc.ec.europa.eu/repository/handle/JRC135407 (accessed on 1 July 2026).
- Kampylis, P., Punie, Y., & Devine, J. (2015). Promoting effective digital-age learning: A European framework for digitally-competent educational organisations. Publications Office of the European Union. [Google Scholar] [CrossRef] [PubMed]
- Maya-Jariego, I., Holgado-Ramos, D., Santolaya, F., Villar-Onrubia, D., Cachia, R., Herrero, C., & Giannoutsou, N. (2023). Teachers’ personal network analysis reveals two types of pioneers in educational digitalization: Formal and informal intermediaries at schools. Computers and Education Open, 4, 100137. [Google Scholar] [CrossRef] [Scilit]
- Mizova, B., Parvanova, Y., & Peytcheva-Forsyth, R. (2026). Leading the digital transformation of education: The perspective of school principals. Administrative Sciences, 16(1), 57. [Google Scholar] [CrossRef] [Scilit]
- Munar Garau, J., Oceja, J., & Salinas Ibáñez, J. (2024). Equivalencias entre los indicadores de la herramienta SELFIE y el marco DigCompEdu a partir de la técnica Delphi. Pixel-Bit, Revista de Medios y Educación, (69), 131–168. [Google Scholar] [CrossRef] [Scilit]
- Nguyen, T. Q., Ngoc, P. T. A., Phuong, H. A., Duy, D. P. T., Hiep, P. C., McClelland, R., & Noroozi, O. (2024). Digital competence of Vietnamese citizens: An application of DigComp framework and the role of individual factors. Education and Information Technologies, 29(15), 19267–19298. [Google Scholar] [CrossRef] [Scilit]
- OECD. (2026). Improving learning outcomes in Greece: Strengthening school governance, teacher professionalism and digital education. OECD Publishing. [Google Scholar] [CrossRef] [Scilit]
- Palacios-Rodríguez, A., Llorente-Cejudo, C., Lucas, M., & Bem-haja, P. (2025). Macroevaluación de la competencia digital docente. Estudio DigCompEdu en España y Portugal. RIED-Revista Iberoamericana de Educación a Distancia, 28(1), 177–196. [Google Scholar] [CrossRef] [Scilit]
- Rasdiana, Wiyono, B. B., Imron, A., Rahma, L., Arifah, N., Azhari, R., Elfira, Sibula, I., & Maharmawan, M. A. (2024). Elevating teachers’ professional digital competence: Synergies of principals’ instructional e-supervision, technology leadership and digital culture for educational excellence in digital-savvy era. Education Sciences, 14(3), 266. [Google Scholar] [CrossRef] [Scilit]
- Romero-Tena, R., Barragán-Sánchez, R., Gutiérrez-Castillo, J. J., & Palacios-Rodríguez, A. (2024). Análisis de la competencia digital docente en Educación Infantil. Perfil e identificación de factores que influyen. Bordón. Revista de Pedagogía, 76(2), 45–63. [Google Scholar] [CrossRef] [Scilit]
- Schmitz, M.-L., Antonietti, C., Consoli, T., Cattaneo, A., Gonon, P., & Petko, D. (2023). Transformational leadership for technology integration in schools: Empowering teachers to use technology in a more demanding way. Computers & Education, 204, 104880. [Google Scholar] [CrossRef] [Scilit]
- Sosa Díaz, M. J., & Valverde Berrocoso, J. (2022). Hacia una educación digital: Modelos de integración de las TIC en los centros educativos. Revista Mexicana de Investigación Educativa, 27(94), 939–970. [Google Scholar]
- Ure-de-Oliveira, R., & Bonilla-Algovia, E. (2025). Digital divides and educational inclusion: Perceptions from the educational community in Spain. Education Sciences, 15(8), 939. [Google Scholar] [CrossRef] [Scilit]
- Zubizarreta Pagaldai, A., Marín, V. I., & Imaz Agirre, A. (2025). Mixed-methods analysis of SELFIE in basic vocational education and training: A triple case study. Edutec, Revista Electrónica de Tecnología Educativa, (94), 292–312. [Google Scholar] [CrossRef] [Scilit]

Disclaimer/Publisher’s Note: The statements, opinions and data contained in all publications are solely those of the individual author(s) and contributor(s) and not of MDPI and/or the editor(s). MDPI and/or the editor(s) disclaim responsibility for any injury to people or property resulting from any ideas, methods, instructions or products referred to in the content. |
© 2026 by the authors. Licensee MDPI, Basel, Switzerland. This article is an open access article distributed under the terms and conditions of the Creative Commons Attribution (CC BY) license.