Abstract
This paper describes a small, quasi-experimental, mixed method study investigating teacher and child outcomes for a preschool data science intervention condition compared to a business-as-usual comparison condition. The intervention included both hands-on activities and a free digital tool called the Preschool Data Toolbox to engage young children in foundational data science activities. The intervention activities aligned with a learning blueprint that articulated a set of early childhood data science learning goals based on K-12 computer science and early mathematics standards. The intervention supports teachers to implement foundational data science investigations using an intuitive tablet app that scaffolds the DS process through structured and open-ended instructional experiences. Findings from classroom observations, teacher surveys, and interviews indicate high feasibility and engagement, with teachers reporting ease of use, developmental appropriateness, and positive impacts on children’s data acumen and math skills (n = 217). After controlling pre-test scores, children who participated in the intervention demonstrated statistically higher post-test scores (p = 0.001) compared to those in the comparison group, highlighting the effectiveness of the program in fostering early STEM skills. The study underscores the potential of developmentally appropriate DS experiences to foster early learning, support teacher confidence, and prepare children for future academic success, while highlighting the need for further research and professional development to scale such interventions effectively.
1. Introduction
High-quality data science (DS) education is essential for preparing students to successfully address the complex decisions of everyday life—from interpreting health data and managing conditions such as diabetes (Rubin, 2022) to evaluating and making informed financial decisions (Bargagliotti et al., 2020b). As our data-driven information economy continues to generate vast amounts of data (Hariri et al., 2019), students will need to know not only how to use data to answer important questions, but also how data might be misused to manipulate people and spread misinformation (Raine & Anderson, 2017). Importantly, education systems must take responsibility for introducing students to DS perspectives that promote meaningful problem solving, even in the early years (Frye et al., 2024). In fact, the process of building DS skills or “data acumen” (Bargagliotti et al., 2020a) should begin in the early years (Boaler et al., 2021; Martinez & LaLonde, 2020; National Academies of Sciences, Engineering, and Medicine [NASEM], 2023) as young children instinctively take in information and sort and categorize data to understand the world around them. Yet, despite these calls for beginning DS education early, research remains limited on precisely what and how young children should learn.
Data science has been described as an investigative process that combines subject-area expertise, statistical and mathematical knowledge, and computational and digital technologies (H. S. Lee et al., 2022) to solve real world problems using data (Jiang et al., 2022). In Data Science: A Joint Position Statement of NCTM, NSTA, ASA, NCSS, and CSTA (2024), leading U.S. organizations representing education disciplines—including mathematics, science, statistics, social studies, and computer science—acknowledged that while each individual discipline may conceptualize data and data analysis differently, they all share the core practice of “working through a problem and answering questions with data” (Reynante et al., 2020; National Academies of Sciences, Engineering, and Medicine [NASEM], 2023; Danyluk et al., 2021, p. 1). Together they developed guiding principles to further the field’s understanding and support for the teaching and learning of data science. Building from the practices of data scientists, they declared data science to be interdisciplinary but grounded in the inquiry process. Donoho (2017), in a description of the difference between statistics and data science, explains that data science is an expansion of the statistics field, thus making it a “Big-tent” broader field in which traditional statistics is included (Carmichael & Marron, 2017). Thus, when students engage in data science they pose interesting questions, collect data, analyze and answer questions, use age-appropriate technology to work with the data, find meaning in the data, and communicate the results. A critical guiding principle is that data science is for everyone, and that students’ experiences of making sense of data should begin early (Danyluk et al., 2021).
Similarly, the ACM Data Science Task Force report (Danyluk et al., 2021) highlighted the interdisciplinary nature of data science, emphasizing that data science is more than the sum of its parts. They included three core components that need to be effectively integrated: Domain Knowledge (the subject area and context that produces the data), Mathematics and Statistics (the methods for analyzing, modeling and drawing inferences from data), and Computer Science (the tools for storing, managing, and processing data efficiently). Simply teaching something from each of these components does not suddenly make it data science. Rather, data science is distinct in that each of the components are weaved together so that students learn and engage in each core skill as they work to solve real-world problems with data. To create an early childhood data science program, these core components would still need to be effectively integrated. For example, preschoolers could engage with the components in developmentally appropriate ways by seeing how data is connected to their real-world questions (the domain), how data can be organized and represented (mathematics and statistics), and how tools (digital or physical) could be used to make sense of data. For early childhood teachers, this means providing integrated experiences with data so that children experience all the pieces together.
1.1. What Is Data Science for Young Children?
Data science education is a nascent and evolving discipline, which makes defining it challenging (J. Rosenberg & Jones, 2024), regardless of the educational level or grade band. The field is still establishing what counts as core data science knowledge and practice, and this is particularly true for early learners. While not specific to early DS learning, a recent literature review of data science definitions was used to inform an approach to teaching early childhood data science. Common among the definitions was an emphasis on using data to drive decision making and using data to extract knowledge and generate insights in real-world contexts (Malallah et al., 2023a). Despite increasing attention to early childhood DS, and a shared perspective that early childhood DS is important, in a 2025 review of U.S. data science trends, tools, and gaps (Aponte et al., 2025) researchers found significant gaps in data science education research, curricula, and tools in early childhood. The review underscored the urgent need for specific, developmentally appropriate curricula that can equip all students, from all ages, stages, and backgrounds, with foundational data skills. The review also highlighted the dearth of DS frameworks and curricula designed for early childhood and early grades learners compared with those for older students.
From an early age, children engage in science, technology, engineering, and mathematics (STEM) and show a clear readiness and capacity to learn about STEM concepts and practices (McClure et al., 2017). Data science connects these disciplines as “data lie at the heart of scientific and mathematical pursuits” (Weintrop et al., 2016, p. 135). For early learners, data science (DS) can serve as a developmentally appropriate bridge between mathematics and science and can be a platform for meaningful inquiry that incorporates technology (Lewis Presser & Young, 2024). Data science is not simply a collection of content area domains, but the integration of these components, using data to produce meaningful results.
Given the significant gaps in data science education in early childhood (Aponte et al., 2025) there is an urgent need for early childhood DS frameworks. Existing data science frameworks for K-12 education claim that the content is appropriate for early learners, but it has been shown to be more suitable for students in grade 4 and above (Malallah et al., 2023b). In addition, to foster equitable opportunities to engage in data science beginning in the early years, it is essential to articulate a suitable developmental pathway for learning data science (Drozda, 2021). Indeed, the Data Science Working Group provided several recommendations for the data science education field, the first of which was to articulate a coherent data science learning progression beginning in the early years. Indeed, to our knowledge, no data science learning progression in early childhood exists.
Given the dearth of data science research in the early years (Aponte et al., 2025) and the need for a clear definition of data science that includes young children (Drozda, 2021), we propose that data science in early childhood is grounded in scientific inquiry and uses an investigation process that incorporates foundational concepts from mathematics, statistics, and computing—to investigate and solve real-world problems with data. This aligns with the ACM Task Force report (Danyluk et al., 2021), emphasizing the interdisciplinary nature of data science. Thus, early data science investigations should not be isolated math or science tasks, but instead opportunities for children to experience the meaningful collection, organization, representation, and analysis of data to answer authentic questions.
1.2. Developmental Appropriateness of Data Science for Preschoolers
Increasingly, there are calls for younger students to learn about data because providing meaningful “data-rich learning environments” will help to prepare them for the jobs of the future (Martinez & LaLonde, 2020). Efforts supporting a focus on DS also advocate that DS should begin early in the educational process (English, 2010, 2011; National Academies of Sciences, Engineering, and Medicine [NASEM], 2023), as DS authentically connects mathematics content with scientific practices that use data to answer research questions (English & Watson, 2015). Thus, DS in preschool involves children problem-solving with data, as they use their growing mathematics knowledge in counting, sorting, classifying, comparing, and contrasting to answer meaningful research questions. Preschool DS experiences therefore build the conceptual foundation for data science; thus, it may look like children sorting small toys, objects, or cards, moving their own bodies to sort themselves into categories, and representing those categories in visual displays (Platas, 2018). Indeed, preschool classrooms are filled with examples of children and teachers engaging in the conceptual precursors to DS. For example, early learners might measure their height and then display the varying heights on a chart; or answer a “question of the day” in which the class gathers data, sorts it into categories, and then graphs or tallies the data so it can be counted and compared. These types of visual displays are a natural extension of sorting and classifying (Copley, 2010) and provide young children with an intuitive way of representing information that they can “read” just by looking.
English and Watson (2015) argue for the early introduction of investigations with data that lay the foundation for data science. They describe the developmental process as beginning “with young children’s inquiries and investigations of meaningful phenomena, progressing to deciding what is worthy of attention (i.e., identifying attributes of the phenomena), and then moving toward organizing, visualizing, and representing data” (English, 2010, pp. 26–27). Thus, capitalizing on young learners’ curiosity and playful engagement can be an effective way to build their early DS knowledge and skills.
1.3. Teaching Data Science in Early Childhood
While DS is sometimes a separate course of study at the secondary school level (Israel-Fishelson et al., 2024), for early learners there is widespread agreement that DS should be integrated into mathematics and science curricula (Weiland & Engledowl, 2022). For young children, early educators can set the stage for the data science they will encounter in later years. These early data investigations can build foundational skills for future data science learning. Moreover, in early childhood, children can engage in the practices of data science (e.g., collecting, organizing, visualizing, interpreting data). However, early educators often “underestimate what young children know and can learn” (Sarama & Clements, 2009, p. 7) and while teachers and preschoolers can often be found engaging in foundational DS activities, they are often short and disconnected (i.e., one-offs), and building conceptual understanding of the investigation process is often overlooked. Evidence suggests that teachers typically focus too much of their attention on procedures (e.g., graphing data) or performing calculations, with minimal emphasis on formulating questions, data collection, and interpretation (Litke & Hill, 2020). In addition, early educators typically lack confidence in teaching DS. This is not particularly surprising, as very few studies focus on teaching DS to young children (Aponte et al., 2025)—with even fewer resources available to educators (J. M. Rosenberg et al., 2020) to support implementation of developmentally appropriate DS learning experiences (Brenneman et al., 2019). There is still a significant need in DS education to understand what makes DS different from mathematics, computer science, or statistics, and why it might require new approaches to research and instructional design (M. H. Wilkerson & Polman, 2020) especially for early learners.
To teach DS effectively, M. H. Wilkerson and Polman (2020) highlight three core pedagogical recommendations for DS education. The first is that educators must support students’ technical skills, including learning to use new tools and methods for working with data. The second is that DS must be situated in meaningful investigations where learners pose questions, obtain data, and are able to communicate findings within specific disciplines. Finally, a critical goal for educators is to develop students’ identities as data practitioners who understand that it is people who tell the stories about data.
As a field, DS has been conceptualized as “the study of extracting value from data,” (Wing, 2019, p. 1) which often includes the use of computational tools and methods to collect, process, store, analyze and visualize data as a way to make sense of the world around us (H. H. Wilkerson & Polman, 2022; Louie et al., 2021). Yet to do this in early childhood, there is a dearth of high-quality tools for teachers to use with early learners to foster foundational DS skills. Moreover, teachers need a tool that supports their collection, visualization, and discussion of the meaning of data without a 1-1 technology model, as this is not feasible in preschool. Additionally, it is crucial that we prepare teachers to be able to confidently work with digital tools (National Academies of Sciences, Engineering, and Medicine [NASEM], 2023). Critically, teachers often feel underprepared to teach DS investigations that promote students’ engagement with real-world problem-solving activities with data (Herro et al., 2025).
To engage preschoolers in DS, educators need to bring the investigation process to life in fun, developmentally appropriate ways. The Computational Science (CS) Framework states that children learn about data by using common digital devices and that integrating data into early childhood classrooms can be achieved with developmentally appropriate teaching practices (K–12 Computer Science Framework, 2016; Resnick, 2003). This can also provide an “on-ramp” for children to develop their skills in gathering and manipulating data using digital tools (McNamara, 2019, p. 382). The CS Framework’s “powerful ideas” relate DS concepts and practices to those embedded within mathematics (e.g., patterns, sequencing), science (e.g., problem solving), and literacy (e.g., representation) and enacted through play. Moreover, it is incredibly powerful for children to formulate their own questions that can be answered through observing the world around them and gathering data to answer these questions. This process fuels students’ natural curiosity about the world around them and allows them to see themselves as producers of data, not just consumers of data (Johnson et al., 2022). Data-rich investigations and a digital tool for teachers could therefore support students’ engagement in mathematics in an appropriate sequence and foster scientific inquiry which helps to promote a deeper understanding of these concepts and processes (Clements & Sarama, 2021). In this study we describe a DS digital tool created specifically for and with preschool teachers with the aim of supporting their implementation of developmentally appropriate data-rich investigations, while also encouraging the use of hands-on manipulatives.
1.4. Articulating Data Science Learning Goals
At the outset of the development process of the digital tool and data-rich investigations, our team created a “learning blueprint” which articulated the learning goals of interest and served as an anchor document for developing a DS curricular intervention (Lewis Presser & Young, 2024) and assessment tasks. As data science is at the intersection of mathematics and computer science, we drew from early mathematics learning trajectories (Clements & Sarama, 2014; e.g., counting, sorting, comparing, and classifying) and computer science concepts from the data and analysis strand, which includes: data collection, storage, visualization; inferences; and models (K–12 Computer Science Framework, 2016). The blueprint articulated specific learning goals for preschool DS and described the links between mathematics learning trajectories (e.g., counting, classifying; Clements & Sarama, 2014) and data science practices (K–12 Computer Science Framework, 2016). We drew from the K–12 CS Framework because it includes specific data science practices such as data collection, visualization, and inference skills, that the mathematics learning trajectory did not. Table 1 illustrates how the blueprint conceptually links the preschool DS learning goals, mathematics learning goals, and DS practices, and includes descriptions of example tasks to address the specific DS learning goals, ways to vary task difficulty, and scaffolding strategies. Our learning blueprint is organized by the DS and computational thinking learning goals which align to an overarching mathematics learning goal which is further broken down by specific math subgoals. For example, one overarching mathematics learning goal, “Children sort objects and use one or more attributes to solve problems”, includes specific learning goals, such as “Sort objects by (a) one attribute or (b) sort by multiple attributes” and the DS learning goal, “children sort and classify objects/data as a strategy to solve a larger problem or answer a question.” This organization of learning goals shows the connection among the DS and computational thinking learning goals and the mathematics goals that intersect with computational thinking and data analysis.

Table 1.
Learning Blueprint Elements.
These specific learning goals then formed the basis for the parallel and independent development of classroom intervention activities and child assessment. This process was conducted in parallel so that both the intervention and assessment were aligned with the learning blueprint rather than to each other. The learning goals in the blueprint served as an anchor in the project (Lewis Presser et al., 2023). Indeed, the early years provide a unique opportunity to lay the foundation for DS, technological literacy, and problem-solving skills children will need to support their future educational and workplace success.
2. Materials and Methods
This quasi-experimental study was the fourth study in a series of design-based implementation research (DBIR; Clements, 2007; Cobb et al., 2003) studies intended to develop and refine an intervention to support preschoolers’ problem-solving skills through collecting and using data to answer simple, developmentally appropriate research questions. The curriculum and app development process was built on the DBIR process, but this study was the first test of the full intervention. Building on the learning blueprint (see description above), classroom activities and a digital tool were developed to address the data science and mathematics learning goals. The first iteration of the intervention and digital tool was formatively tested to examine the developmental appropriateness of the activities and integration of the digital tool, alignment with preschool curricula and routines, implementation feasibility, and affordances (Lewis Presser et al., 2022a). After revising the tool and investigations in response to those findings, a pilot study solicited a new round of teacher feedback, while continuing to explore the feasibility of classroom implementation and students’ initial learning (Lewis Presser et al., 2022b). A third revision to the intervention was tested again in a second pilot study (Lewis Presser et al., 2023).
This final small, quasi-experimental study sought to continue researching teachers’ implementation of the intervention by comparing the intervention (10 classrooms) and comparison (5 classrooms) groups using a mixed-methods approach that included both qualitative and quantitative data sources. Intervention classes implemented the intervention between November and May of the 2022–2023 academic year.
Comparison and intervention classrooms continued to implement their regular curriculum which drew primarily from a comprehensive curriculum resource that includes all subjects, of which science and mathematics are components, including typical classroom routines such as a question of the day. However, as referenced above (Danyluk et al., 2021), while domain specific investigations in science were a component of the resource, using mathematics to answer questions using data, and computer science analysis tools were not integrated as a component of these investigations. Thus, these investigations would not be considered data science and therefore preschoolers’ experiences in the business-as-usual condition did not include data science content. In addition, it is important to note that preschool mathematics instruction is often focused on numeracy using a teacher-led approach (Mazzocco et al., 2024). In this case, comparison group teachers did not teach about data science in their business-as-usual curriculum beyond typical classroom routines such as a question of the day. Comparison classrooms did not have access to the Preschool Data Toolbox digital tool until the intervention concluded. Intervention classrooms taught both this comprehensive curriculum and the data science intervention for this study.
In intervention classrooms, teacher interviews and surveys were collected at the end of the implementation period and classroom observations were conducted by researchers. Child assessment data from a sample of children with parental consent within each classroom was collected in both intervention and comparison classrooms at the beginning and end of the intervention period.
2.1. Research Questions
The first three research questions focus on understanding more about what supports implementation and the last two research questions seek feedback on learning outcomes from teachers and child assessment scores. The study answers the following research questions:
- Digital Tool Features: What aspects of the Preschool Data Toolbox supported the learning process for teachers and children?
- Implementation Feasibility: How did teachers implement the intervention (investigations and digital app)?
- Child Engagement: What does engagement in data science investigations that includes hands-on materials and apps look like?
- Teacher Perceptions of Children’s Learning: Do teachers implementing the intervention perceive improved learning for children in their classroom?
- Child Learning Outcomes: Do children who experience the intervention improve learning in comparison to children in the comparison group?
2.2. Recruitment and Participants
Preschool classrooms from Massachusetts, Rhode Island, New York, and Vermont were recruited to participate in this study. Classrooms were recruited through a large network of Head Start preschools in the Massachusetts and Rhode Island region and through previous connections with individual preschools in New York and Vermont. To be eligible, teachers needed to express willingness to participate in professional development sessions and implement the curriculum during the study period, serve low-income communities, and work with preschool children 4 to 5 years of age.
Twenty-eight total classrooms participated (9 intervention; 19 comparison). This unbalanced design was used to collect data from as many classrooms as possible. Because we did not collect class lists, we cannot report the total number of children in each classroom. To estimate the number of children experiencing the intervention we assume 15 children per classroom, we estimate that there were approximately 135 children across the intervention classrooms and 285 children across the comparison classrooms. For the early learning pre- and post-assessment, a total of 217 children had data at both time points (56 intervention, 161 comparison).
The gender proportion was similar in both groups with 64% girls in the intervention group and 60% girls in the comparison group. The overall mean age was 4.45 years old, with the intervention group mean of 4.44 years and the comparison group mean of 4.45 years old at the beginning of the study. Specific socioeconomic status was not collected from individual children; however, each school indicated that they served a high proportion of students from low socioeconomic status.
One of the intervention teachers who was originally recruited into the intervention classroom could not implement the intervention or complete the survey due to a drastic change in the needs of the children in her classroom and was thus excluded from all analyses. Of the remaining nine teachers, three described their school as located in an urban area (33%), three as suburban (33%), and three as rural (33%). Most teachers described the socioeconomic status of the children in their classroom as low income (89%), and most taught dual language learners (78%). All teachers were women and had obtained either a bachelor’s (78%) or graduate degree (22%). They identified their race or ethnicity as White (56%), Black (33%), or Other (11%), and ranged in their amount of teaching experience from 2 to 40 years. Comparison teachers reported a bachelor’s degree (71%), master’s degree (12%), associate (6%), or some college (6%). They identified their race or ethnicity as White (71%), American Indian (12%), Other (12%), or Missing (6%).
2.3. Instruments
2.3.1. Classroom Observations
Intervention group classrooms were observed in January and February 2023 to describe data science math content that emerged, the way children engaged with the investigations, and the way teachers and children used the app and discussed data. We also noted challenges that emerged and the ways in which teachers offered instructional supports throughout the investigations.
All observers were trained on the observation protocol and reliably used the protocol to code a series of training videos before the classroom observations. During each classroom observation, the observers visited the classroom and (1) completed a running record describing the context of the activity and the actions and conversations of the teacher and children, (2) rated the activity’s pace, length, and children’s level of engagement, (3) recorded how children engaged with the app, which of the app features were used, and how they created data visualizations, (4) recorded instances of math content such as counting, sorting, or comparing categories, (5) indicated if and how teachers used the provided data talk questions to facilitate conversation, and (6) noted challenges and ways in which the teacher modified the activity. Observers completed 39 total observations from four different intervention investigations.
Observation notes and codes were analyzed descriptively based on the ratings categories. Codes related specifically to implementation features (e.g., group type such as whole, small, individual), activity features (e.g., using hands-on materials), observer ratings of pacing, activity length, the extent to which children followed directions, and the extent to which implementation went as expected. These codes were assigned a numerical value to determine the percentage of times each occurred.
2.3.2. Teacher Interviews
Teachers in the intervention group completed a two-part virtual interview. Teachers completed the first part of the mid-intervention interview in February or March of 2023. This interview lasted approximately 30 min and focused on asking teachers to reflect on each investigation by describing (1) what went well, (2) what was challenging (including challenges with the materials, technology, or content), and (3) what recommendations they had for improving the investigation or the implementation instructions for teachers. Teachers completed the second part of the interview in May 2023 after they completed the intervention. This interview lasted approximately an hour and focused on (1) teachers’ reflections on the overall experience of carrying out the investigations (e.g., their comfort level with performing data collection and analysis with preschoolers, their classroom’s overall experience, reflections on the experience of participating in the professional development), (2) the experience using the [blinded app name] (e.g., features that were helpful or challenging, ease of navigation, perceptions of how it supported student learning), and (3) feedback on the Teacher’s Guide (e.g., how they used it, helpfulness, and suggestions for improvement). Teachers also answered the specific questions from the first part of the interview for any investigations they had not completed at the time.
Open-ended interview responses were analyzed by project staff using qualitative coding organized around themes tied to each research question with the goal of understanding teachers’ perspectives on implementation and the way the intervention impacted children’s engagement and learning, as well as the successes and challenges they encountered during implementation (LeCompte, 2000). Our hybrid approach started with broad, deductive coding that related to each research question and throughout the process additional coding themes were included through an inductive, grounded theory approach (Saldana, 2021). For example, teacher interview responses related to digital tool features (Research Question 1) were tagged and grouped together through deductive coding; then, all responses were coded more specifically to uncover successes and challenges the teachers and/or children experienced related to the digital tool features. For instance, responses related to the sorting tool were summarized based on what was successful and what was challenging, noting whose experiences those responses reflected. In cases where additional themes emerged inductively, those were applied to all responses in the set.
2.3.3. Teacher Surveys
Teachers in the intervention group completed an online survey via Qualtrics at the end of the intervention.
- App Ease of Use. First, the survey asked teachers about their experience using [blinded app name], including the ease of use (e.g., “How easy or difficult was it to navigate through the existing investigations and activities in the app?” on a 4-point Likert scale (1 = very difficult, 4 = very easy), the helpfulness of various features (e.g., “When changing a graph from pictograph to bar graph, there is a transitional box graph, which shows each piece of data as a distinct box rather than a picture or solid bar for the whole group. How helpful was it to have this transitional graph?” on a 4-point scale (1 = not at all helpful, 4 = very helpful)), and their suggestions for improving the app (e.g., “What changes, if any, do you recommend for making navigation easier in the app?”). Finally, teachers rated how likely they would be to recommend the [blinded app name] to another teacher on a 10-point scale.
- Overall Experience with the Investigations. The survey also asked teachers about their overall experience using the investigations in their classroom, specifically the elements of the investigations that were most and least engaging for children and accuracy of the suggested pacing. On a 5-point scale (1 = strongly disagree, 5 = strongly agree), teachers also rated the fit of the investigations with their children’s current math skills, the fit with the curriculum, the fit into their regular classroom schedule, and if the investigations supported children’s learning of new math skills. Finally, teachers rated how likely they would be to recommend the investigations to another teacher on a 10-point scale.
- Experience with Each Investigation. Teachers were also asked to think about their experience with each of the specific investigations (1. What Do We Wear?, 2. Animal Data Shuffle, 3. Our Feelings Freeze, 4. Measure with Me, 5. Hungry Caterpillar, 6. Frame It, 7. Create Your Own, and 8. Design a Data Story) and answer two sets of questions. First, they were asked about the extent they agreed with the following statements on a 5-point scale (1 = strongly disagree, 5 = strongly agree): “The instructions for the investigation were easy to follow”, “It was easy to prepare for this investigation”, “I had the materials I needed to complete this investigation”, “This investigation was developmentally appropriate for my students” and “This investigation was easy to fit into my classroom routine”. Second, they rated whether or not they felt each investigation met the following learning goals: counting, sorting, comparing, classifying, collecting data, describing data, creating visual representations of data, organizing data, and interpreting data. For the Create Your Own and Design a Data Story investigations, teachers were also asked about how easy or difficult these lessons were for teachers and children to implement.
- Teacher Comfort with Data Collection and Analysis. The final part of the survey asked teachers to rate their agreement with the following statements on a 5-point scale (1 = strongly disagree, 5 = strongly agree): “My understanding of how to include data collection and analysis in my lessons has improved”, “I think data collection and analysis is developmentally appropriate for my students”, “I feel comfortable engaging in data collection and analysis with young children”, “I think children are interested in data collection and graphing activities”, and “I feel comfortable using technology in my teaching”.
Most questions on the survey asked teachers to rate aspects of their experience on a Likert scale. These ratings were assigned a numerical value and the percentage of teachers with a particular rating were reported. Means and standard deviations were reported on questions. The survey also contained a small number of open-ended response questions that were analyzed using thematic analysis (LeCompte, 2000).
2.3.4. Child Individual Assessment Tasks
In order to learn about children’s understanding of data science concepts and related mathematics concepts, the research team developed and iteratively (Lewis Presser et al., 2022b, 2023) tested an individually administered assessment. Children were presented with pictures and hands-on materials and asked a series of questions related to learning goals articulated in the learning blueprint. Children responded by pointing to indicate their selection of an image or by responding verbally to open-ended questions. In an example of a picture-based item focused on mathematical concepts, children view a page with three squirrels—red, yellow, and blue- with different quantities of acorns and children selected the squirrel with the most or least acorns. In an example of an item that uses hands-on materials, children were asked to sort objects by color or size. In other items, children viewed simple graphs or tally charts and answered questions (e.g., how many, most, least). Table 2 below shows an item to determine if children can identify the squirrel with the most acorns and a later item that asks children to identify the color with the most votes within the context of a tally chart data visualization.
Table 2.
Example Assessment Prompts and Visuals.
The assessment was administered over 20–30 min and included 34 items. Item responses were scored as correct (1) or incorrect (0). Items had a good range of difficulty, ranging from 0.15 to 0.92 at post-intervention with a mean of 0.57 (SD = 0.23). Scale scores were calculated by averaging scores across items to create a proportion correct. The scale had good internal reliability at both pre- and post-intervention (Cronbach’s alpha of 0.887 and 0.889). The effects of the intervention on post-intervention scores were analyzed using a two-level hierarchical linear model (HLM, Version 7.03) to account for the nested data structure and the shared variance of children’s scores within classrooms.
2.4. Intervention
This classroom-based intervention consists of a series of nine data-infused curricular investigations that have been described in prior work (Lewis Presser & Young, 2024; Lewis Presser et al., 2022a, 2022b, 2023). Built to be implemented with a digital tool called the Preschool Data Toolbox, each investigation consists of three to five activities to allow preschoolers to engage in short 5–15-min data-focused activities. The intervention consists of three types of investigations: (1) Structured investigations (6 of 9) include lesson plans that can be implemented as written, (2) “Create Your Own” investigations (2 or more) allow teachers to create their own graphs and tally charts based on questions developed by their class, and (3) “design your own data story (DYODS)” is a final investigation that generates a narrated story that helps teachers review what the class learned from these investigations. Investigations include hands-on materials and physical movement components in keeping with developmentally appropriate practices. For example, several books were included in the investigations and teachers used commonly found materials, such as sticky notes, cards with pictures of animals, chalk, and counting objects.
To prepare for implementation, teachers have access to the Digital Teachers Guide, which is both online https://first8studios.org/gracieandfriends/guide/dca/videos.html (accessed on 13 October 2025) and embedded in the app itself. Within each investigation plan, teachers can view lesson plans, read background information about data science for preschool audiences, and view videos. This video library includes a video for each investigation (e.g., investigations 1–6), videos to guide teachers as they create their own investigations (e.g., investigations 7–8) and design a data story (e.g., investigation 9), as well as general topics, such as how to have a data talk with young children.
Teachers in the intervention group used a tablet to access the digital tool, yet real-world implementation could take place without the digital device if the technology is not available. Integrating digital tools can allow children to gather and manipulate data in engaging ways, further enhancing their learning experiences (McNamara, 2019). However, there are few digital tools that support data science learning built with young preliterate children to mind. While the Preschool Data Toolbox is intended to be a teacher-facing app, meaning that teachers hold and operate the tablet while children view the screen, the interface is intuitive enough for young children to use without needing to read. The app also scaffolds the investigation process, which helps teachers to guide their early learners through the entire inquiry cycle. The six structured investigations are preloaded on the app and include each lesson’s research question. The full set of investigations are available as a Digital Teacher’s Guide that can be accessed from the app or online.
Each investigation uses the same four steps: stating the research question, collecting and organizing data, creating simple data representations in the form of charts and tally charts, and having group discussions to interpret and make sense of the data and the charts and graphs (data talks). The app uses a simple format that allows teachers to select a research question (for investigations 1–6) or write it in (for the create your own investigations), pick icons or take pictures to visually represent category labels, select the type of data display, and enter data intuitively with plus and minus symbols (as whole numbers which is developmentally appropriate for preschoolers, yet invites them to use the symbols of mathematics).
Thus, to tie back to the ACM Data Science Task Force report (Danyluk et al., 2021), the Preschool Data Toolbox curriculum and digital tool were intentionally designed to effectively integrate the three core components of data science: 1. children investigate a real-world question (Domain Knowledge—which in the case of these investigations aim to naturally engage children in mathematical thinking); 2. children use mathematics to analyze and interpret their data (Mathematics and Statistics); and 3. children learn to use a specially designed digital tool that supports preschoolers to store, manage, and process data efficiently by quickly and easily creating data visualizations (Computer Science). These components were coherently integrated through the creation of a Learning Blueprint that articulated specific learning goals in mathematics and computer science as described in Table 1. Ultimately, children engage with meaningful, developmentally appropriate mathematics (the math sub-goals) as each investigation produces the context within which children collect data, organize, and create models of that data with both hands-on manipulatives and a digital app. While some early childhood program policies prohibit the use of “screens” the investigations can be adapted to be “screen-free” so that they are accessible to these programs. Thus, all young children can engage in the “Computer Science” domain as they can create their own analog tools to store, manage and process their data and create data displays.
The Preschool Data Toolbox includes four functionality features to help teachers present data to preschoolers. Figure 1 shows how the “draw” features allow teachers to draw on the screen to emphasize specific aspects of a data representation (e.g., mathematics and statistics as children count and compare their data and keep track of their findings). Figure 2 illustrates how the “sorting buttons” allows categories to be sorted so that they are viewed in ascending or descending order, each category can be dragged and dropped on the analysis screen and arranged any way they desire (e.g., computer science core component as they manage and process data). Figure 3 represents how the “slider” can transform a display of data from a pictograph (such as the emoji pictograph in Figure 2) to a series of stacked boxes (as shown in Figure 3) to one large bar for each variable on the graph (e.g., mathematics and statistics as the data representation flows from concrete to abstract). Illustrated at the bottom of Figure 4 is an example of the “data prompt” feature which provides teachers with discussion questions for each investigation (e.g., domain knowledge). There is also a progress bar at the top of the page that shows the parts of the investigation, allowing teachers to both see where they are in the investigation process and easily return to an earlier step if needed.
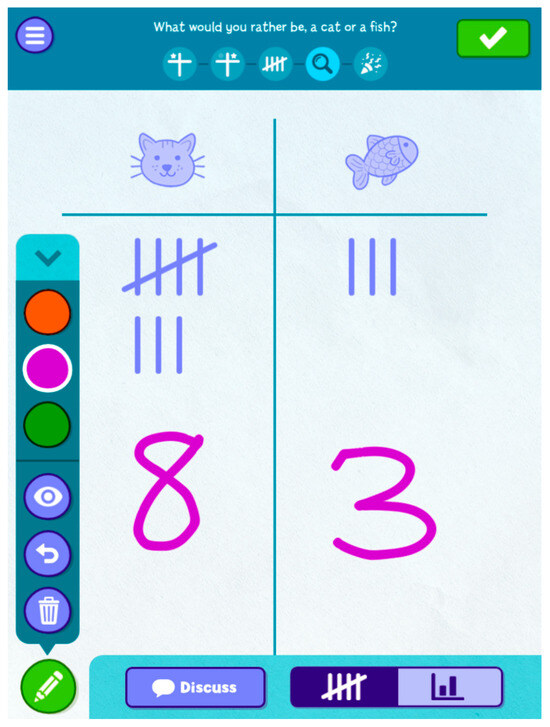
Figure 1.
Draw App Feature.
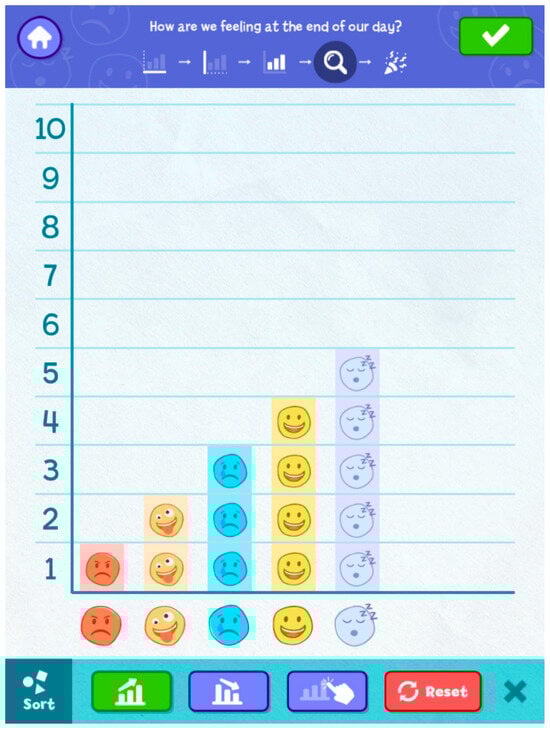
Figure 2.
Sort App Feature.
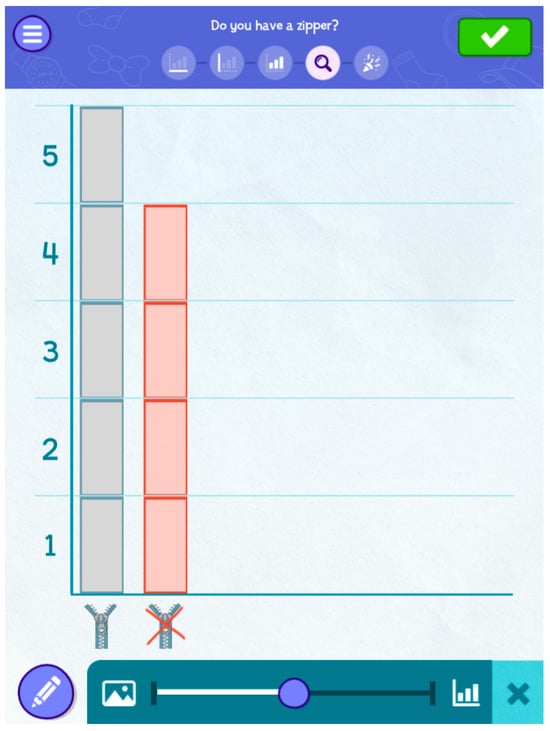
Figure 3.
Slider App Feature.
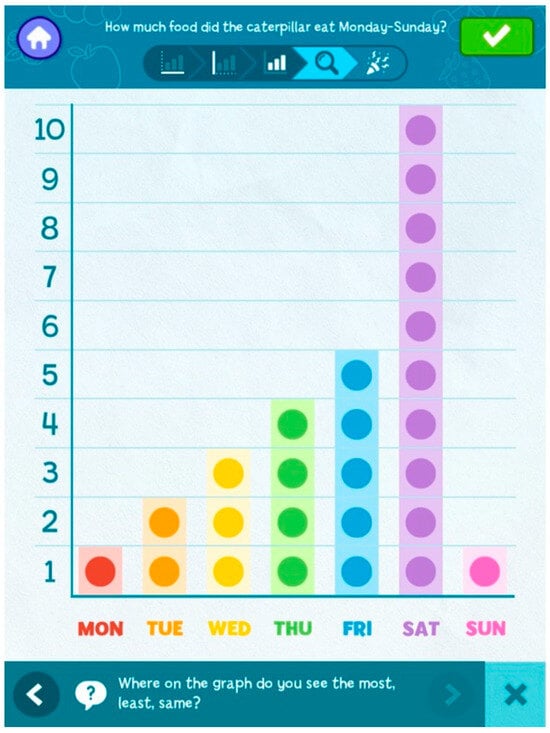
Figure 4.
Data Talk Prompt App Feature.
2.5. Professional Development
Teachers in the intervention group engaged in online professional development sessions both before the beginning of the study and periodically throughout implementation. Specifically, the first session was two hours in length, and two additional sessions were held for two hours each, for a total of six hours of mandatory professional development. The first session described the goals of the project, study elements, and the investigations in detail, allowing teachers to start planning for implementation. Short videos were embedded throughout the session, and in the Digital Teachers Guide, to introduce and explore each investigation and topic. All of these sessions provided opportunities for teachers to think of and plan ideas for their own teacher-generated investigations and data stories (investigations 7–9). Teachers were offered optional additional sessions (up to two additional hours), either individually or in small groups, throughout the study to help them plan data investigations and to address challenges during the implementation period.
3. Results
Findings from teacher surveys, interviews, classroom observations, and child assessments are presented to address the study’s five research questions. The findings are organized by research questions to provide insight into the effectiveness of developmentally appropriate data science experiences in preschool settings and the potential of digital tools to support both teaching and learning.
3.1. Research Question 1: Digital Tool Features
In 91.7% of observed activities, children engaged with the digital tool, with only three technological challenges noted. Teachers consistently reported that the app was easy to navigate (77.8% very easy and 22.2% somewhat easy), that handline the iPad during teaching as manageable (55.6% very easy, 33.3% somewhat easy), and that the status bar was helpful (88.9% very and 11.1% somewhat helpful). Observations indicated that all four core app features were regularly used, with data talk prompts incorporated in 86.1% of activities, category sorting in 47.2%, slider transitions in 44.4%, and drawing tools in 33.3%, while the transition box feature unanimously rated as helpful. Teachers suggested improvements such as clearer step icons, larger fonts, easier editing options, and more space for photos. Despite these recommendations, all teachers rated their likelihood of recommending the app to others as a 7 or higher (Figure 5; M = 9.0, SD = 1.323), while ratings for the investigations varied more widely, ranging from 2 to 10 (Figure 5; M = 7.28, SD = 2.95). Table 3 provides a snapshot of each app feature, the percentage of activities observed that used that feature, and a short summary of teacher feedback.
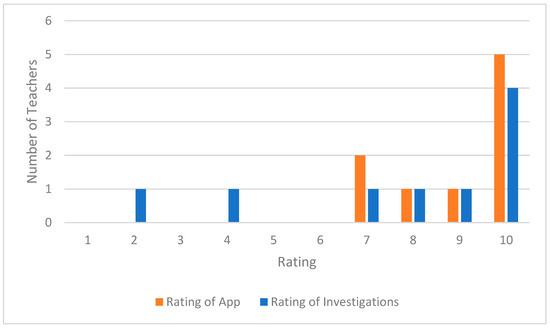
Figure 5.
Teacher Recommendation of App and Investigations to Other Teachers.
Table 3.
Features Used in Observed Activities.
3.2. Implementation Feasibility
Using teacher feedback from surveys, interviews, and classroom observations, we examined how teachers implement the intervention (investigations and digital app).
Teachers reported that the investigations fit with their curriculum, routines, and regular class schedule. Lesson instructions were easy to follow, preparation was easy, they were able to access and use the materials, and teachers were likely to recommend the intervention to other teachers. Teachers found the “create your own” and the “design your own data story” type investigations to be slightly more challenging but provided opportunities to personalize the learning experiences. In terms of the content, teachers felt that the intervention content was developmentally appropriate for preschoolers and supported children’s learning of additional mathematics.
3.2.1. Implementation Descriptions
Most teachers agreed (22.2% strongly; 77.8% agreed) that the investigations fit into their curriculum, their classroom schedule (22.2% strongly; 66.7% agreed), and that lesson plans were easy to follow (44.4% strongly; 55.6% agreed). Observations suggest that 63.9% of observed investigations took place with a whole group and 36.1% with a small group activity format. Investigations took place on the rug (83.3%) or table (16.7%). In the majority of observations, the teacher implemented the investigation as expected (75%); however, some teachers (25%) modified the activity in some way, such as splitting activities into multiple parts or using different materials.
Challenges in implementation were noted in a third of observed lessons (36.1%). One observer mentioned a challenge related to how the activity was carried out. In the “Create Your Own Graph” activity, children were asked to vote on which classroom activity they wanted to do next. However, many children did not fully understand the voting process—specifically, that each child only has one vote and cannot repeatedly vote in different categories—which caused some difficulties in that classroom. Overall, observers reported positively about how this activity was enacted in the classroom. Implementation worked best when the teacher chose a topic that was very familiar to the children and easy for them to understand. One noted that the activity might benefit from a clarification at the end that refers children back to how the goal of the graph is to answer a question by collecting data. Another observer noted that some of the younger children lost interest and were not interested and/or able to follow along. These younger children were often in classrooms that included three-year-olds, who are outside the target age for the intervention.
3.2.2. Mathematics Content
Teachers were observed teaching mathematics content that was focused on counting, sorting, and identifying and comparing categories, all of which was taught in multiple formats. Through the survey, teachers were asked to indicate how well each investigation met the learning goal. The majority of teachers agreed that the investigations met a series of mathematics and data science learning goals (see Table 4). Averaging across all investigations, the majority of teachers reported that these learning goals were addressed: counting (100%), sorting (96.30%), comparing (100%), classifying (94.44%), collecting data (98.15%), describing data (96.30%), creating visual representations of data (98.15%), organizing data (98.15%), and interpreting data (98.15%).
Table 4.
Percentage of Learning Goals Met by Investigation.
3.2.3. How Mathematics Content Is Taught
A key element of mathematics that was repeatedly practiced involved counting how many were in a category. Teachers reported that the counting of quantity within each category was taught within the app (75%), with hands-on data (13.9%), visuals in books (2.8%), or other (5.6%) formats. While looking at the data representation, either in the app or with another visual representation, children used a variety of counting strategies. These strategies include using their fingers to count how many are in each stack in a bar graph; counting the number of cards in a pile representing a category; sorting themselves physically into a designated location for each category; and/or looking at an illustration in a book and counting the number of pictures that fit a particular category.
Similarly, sorting objects and/or people into categories was taught within the app (41.7%), with hands-on data (8.3%), visuals in books (2.8%), or other (2.8%) formats.
When sorting categories in the app, the most common format was most-to-least (41.7%), least-to-most (11.1%), or manually (2.8%) using the relevant app buttons. Throughout observed lessons, 44.4% included a comparison of categories, and 38.9% included identifying categories.
The observations also examined the representations created, which could include more than one representation in a single activity. Of those, 88.9% included a bar graph with individual blocks, 38.9% included a pictograph, 22.2% included a bar graph with one large bar, 5.6% included a tally chart. These data visualizations were created with a variety of materials, including the app (86.1%), with hands-on materials (13.9%), and on paper (11.1%). Within these data visualizations, the individual data point was included in the majority of cases (69.4%), the categories on the x-axis (62.9%), and descriptions of graph quantities on the y-axis (58.3%). Discussions about how to interpret data to answer the research question was engaged in by teachers only (27.8%), children only (16.7%), or through and interaction between teachers and children (61.1%). In the majority of observed lessons, the teacher asked data talk questions (88.9%) and children provided the answer (86.1%).
3.2.4. Aspects of Implementation
Teachers were asked about aspects of implementation, such as pacing, instructions, preparation, materials, activity length, and child engagement. Across the six initial investigations, both survey and observation data indicated that pacing, clarity, materials, length of activity, and child attentiveness were generally strong, though some challenges emerged. Teachers reported pacing was “about right” in 53.7% of cases, while 38.9% took more days than expected and only 2.8% took fewer days or were not completed. Classroom observations aligned with these reports, showing pacing was “just right” in 72.2% of lessons and “too slow” in 27.8%. Nearly all teachers strongly agreed or agreed that the instructions were clear (96.3%), preparation was easy (96.3%), and materials were available (98.1%). Observers noted that 30.6% of lessons lacked hands-on materials, but when present, found children engaged with them directly in 76.0% of cases. Activity length was judged appropriate in 72.2% of observations, too long in 25.0%, and too short in 2.8%. Finally, child attentiveness remained consistently high, with children attentive all of the time in 69.4% of lessons and most of the time in 30.6%, highlighting that overall implementation quality was strong, despite minor challenges with timing and materials. Table 5 provides a snapshot of each implementation feature and the percentage from both survey and observation findings.
Table 5.
Teacher and Classroom Observation Ratings of Implementation Features.
3.2.5. Specific Investigation Feedback
Each investigation was analyzed based on teacher feedback to determine whether revisions were needed. Teachers generally gave positive feedback on all investigations, noting strong alignment with classroom themes and high child engagement. “What Do We Wear?” fit well with clothing studies and excited children. “Animal Data Shuffle” was engaging but sometimes too long and challenging for younger kids, leading to a revised shorter format. “Our Feelings Freeze” supported emotional learning and daily use. “Measure with Me” was fun and hands-on, though space was occasionally limited. “Hungry Caterpillar” connected well to a familiar story and encouraged creativity. “Frame It” engaged children in outdoor data collection and nature exploration. “Create Your Own” allowed personalization and fit naturally into curricula, despite some children’s limited patience during graph discussions. “Design a Data Story” was meaningful and developmentally appropriate, though some teachers found it initially confusing and had difficulty sharing stories with families. Overall, investigations were seen as engaging and relevant, with suggestions for clearer instructions and easier sharing features.
3.3. Child Engagement
Using teacher surveys, interviews, and classroom observations, we explored what engagement in data science investigations look like.
Teachers were asked about what elements of the data science investigations were most engaging for children, to which teachers mentioned the hands-on nature of the activities, the use of materials and cards with pictures on them, and opportunities for children to interact with the technology (e.g., enter data themselves, choose the color around a variable) and the data representations (e.g., draw on the graphs) directly. Teachers specifically mentioned three investigations that included these interactive components—Animal Data Shuffle, Measure with Me, and Frame It. For example, teachers stated:
“The children were excited to use different materials in the classroom to measure and add the number of materials together, such as color blocks and their shoes. Children are also excited about the outdoor hunt of their choice.”
“The children became proficient at inputting the data. The variety of the investigations and that some were connected to familiar storybooks also impacted engagement in a positive way. The children were connected to the character Gracie. I would introduce the activity by saying, “Let’s see what Gracie has for us today.” The children looked forward to the “hooray” at the end of the analysis project.”
Elements of the investigations that were less engaging for children include the use of a small screen (e.g., on a tablet) and waiting for their turn. In addition, the interpretation and analysis was often a time when teachers noticed children losing interest, particularly when comparing graphs.
3.4. Teacher Comfort with Teaching Data Collection and Analysis
Using teacher surveys, interviews, and classroom observations, we examined whether teachers felt more comfortable and confident teaching data science after the study.
On the survey at the end of the intervention, teachers were asked to rate the extent to which they agreed with statements about their comfort with data collection and analysis on a scale from 1 (“strongly agree”) to 5 (“strongly disagree”). All teachers rated these items as 3 or higher (Figure 6). All teachers strongly agreed or agreed with the statements: “My understanding of how to include data collection and analysis in my lessons has improved”, with a mean of 3.78 (SD = 0.441) and “I feel comfortable engaging in data collection and analysis with young children”, with a mean of 3.67 (SD = 0.500). Teachers strongly agreed, agreed, or were neutral with the following statements: “I think data collection and analysis is developmentally appropriate with young children” and “I think children are interested in data collection and graphing activities,” both with a mean of 3.56 (SD = 0.726). In responses to the statement: “I feel comfortable using technology in my teaching” teachers responded with strongly agree, agree, or neutral with a mean of 3.44 (SD = 0.726; see Figure 6).
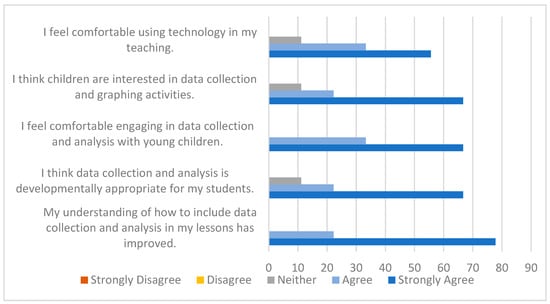
Figure 6.
Teachers Survey Questions: Percentages by Question.
3.5. Child Learning
Using score on an individual child assessment, we sought to answer the following research question: Do children who experience the intervention improve learning in comparison to children in the comparison group?
A two-level hierarchical linear modeling (HLM) analysis was conducted with children’s post-intervention scores at Level 1 nested within classrooms at Level 2. This structure of children nested in classrooms is appropriate for a classroom intervention, as children within a classroom share many experiences. For added precision, child pre-test scores were incorporated as child-level (Level 1) covariates and the study condition (intervention or comparison group) was included as a Level 2 covariate, as including such covariates generally improves statistical accuracy (Bloom, 2005; Bloom et al., 2007).
3.5.1. Model Assumptions
Residuals were analyzed to check for violations of the assumptions of the linear regression model. A scatterplot of the residuals (Figure 7) shows approximately random points around the zero point, suggesting that the assumption of linearity has been met. These residuals were also mapped onto a normal curve. A P-P plot of the expected and observed outcomes (Figure 8) shows that the data points follow the lines, and thus a normal distribution.
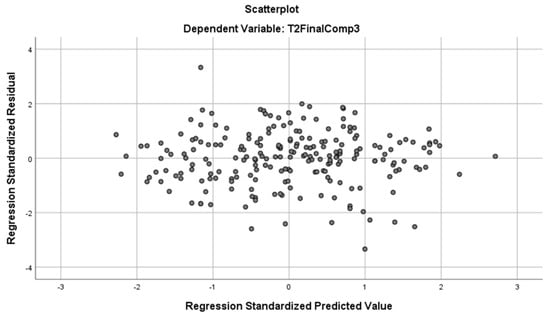
Figure 7.
Scatterplot of Residuals.
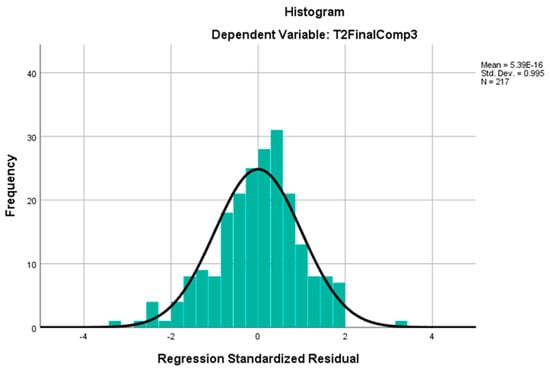
Figure 8.
P-P Plot.
Multicollinearity was detected between pre-and post-test scores correlations (r = 0.703, p = 0.001), which is to be expected as a measure taken multiple times on the same individual, but not detected between post-test scores and the group variable (r = 0.039, p = 0.572). The variance inflation factor (VIF) for the predictor pre-test scores was 1.000, while the VIF for group was 1.009, near the 1.000 that suggests no multicollinearity. Given the quasi-experimental nature of this study, we considered the assumptions met and proceeded with the HLM analysis.
3.5.2. Baseline Equivalence
At the beginning of the study, children’s pretest scores differed significantly, with the comparison group starting the study with a higher mean score in relation to the intervention group. Specifically, the intervention (M = 17.98, SD = 8.09) and comparison (M = 19.63, SD = 7.49) groups did differ statistically at the first testing point (p = 0.001, effect size = 0.11); favoring the comparison group at pretest.
3.5.3. Child Post-Learning Outcomes
An intraclass correlation coefficient (ICC) was calculated using a null (intercept-only) model to determine the proportion of variance in post-test scores that was attributable to the pre-test scores and group. An ICC of 0.23 was found, suggesting that approximately 23% of the total variance in post-test scores was explained by controlling pretest scores and clustering of individuals within condition.
A 2-level HLM analysis indicated that the intervention condition was significantly positively associated with post-test scores (M = 24.03; SD = 8.14) relative to the comparison condition (M = 23.37; SD = 7.28) when children’s pretest scores were statistically controlled (p = 0.001, effect size = 0.40). This outcome favored the intervention group after participation in the intervention. This pattern was consistent when a 2-level HLM analysis compared the improvement made from pre- to post-test (Figure 9), as the intervention continued to outperform the comparison group when group was used as a covariate at level 2 (p = 0.001, effect size = 0.45).
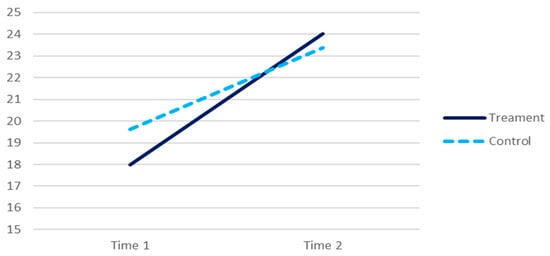
Figure 9.
Students’ scores on data science pre- and post-test by condition.
Summary of the model specified
Level-1 Model
T2Scoreij = β0j + β1j*(T1Scoreij) + rij
Level-2 Model
β0j = γ00 + γ01*(GROUPj) + u0j
β1j = γ10
β1j = γ10
Mixed Model
T2FINALCij = γ00 + γ01*GROUPj
+ γ10*T1Scoreij + u0j + rij
+ γ10*T1Scoreij + u0j + rij
4. Discussion
This study’s findings strongly support the importance of introducing data science education in early childhood. A key implication of this study is that integrating playful, foundational data science investigations into early childhood classrooms is both feasible and beneficial, providing a meaningful context for developing foundational STEM skills. As highlighted, young children naturally engage with data through sorting, classifying, and making sense of their world, which aligns with the core components of data science—domain knowledge, mathematics, and computer science. The current study provides evidence that young children’s investigations with data, which include the intentional teaching of data science concepts to preschoolers, in playful and developmentally appropriate ways, promotes their learning of foundational data science and mathematics knowledge. This aligns with findings from older students, where engaging experiences with data further developed students’ understanding of related mathematical concepts (Stohlmann & Albarracín, 2016). Thus, reasoning with data may be a critical component of mathematical cognition that is amenable to intervention, but currently no single learning trajectory is sufficient to describe DS learning for young children. Thus, more research is needed to articulate a comprehensive DS early learning trajectory—or developmental progression with aligned learning activities—for preschool.
Our results demonstrate that when provided with developmentally appropriate tools and guided investigations, preschoolers can actively participate in meaningful data science activities that foster foundational STEM skills. Given the critical role that early mathematics knowledge plays in predicting later academic success (Duncan et al., 2007), identifying how and under what conditions a DS learning trajectory could effectively support children’s mathematical thinking and reasoning, particularly for students underrepresented in STEM, is especially important for practitioners and policymakers considering how to close achievement and opportunity gaps, and better prepare all children to be data-literate and workforce ready.
The positive teacher feedback on the Preschool Data Toolbox app and investigations highlight the potential for digital tools to support hands-on, inquiry-based learning that aligns with existing curricula and classroom routines. The observed improvements in children’s learning and positive teacher feedback support the assertion that early data science experiences are both developmentally appropriate and effective, addressing the scarcity of research and curricula tailored for this age group. Moreover, the observed engagement and preliminary child learning gains suggest that preschoolers can successfully develop data acumen when given developmentally appropriate opportunities supported by well-designed interventions.
However, challenges such as maintaining children’s interest during data interpretation discussions and variability in teacher familiarity with data science content underscore the need for ongoing refinement of instructional materials and targeted teacher support. The increased teacher comfort and confidence with DS investigations and data collection and analysis highlight the necessity of professional development and accessible digital tools.
These outcomes reinforce calls from leading organizations for integrated, inquiry-based data science learning beginning in the earliest grades, emphasizing that early exposure not only supports academic growth but also prepares children to navigate an increasingly data-driven world. These findings contribute to the growing evidence base advocating for early introduction of data science concepts and computational thinking within STEM education, emphasizing the importance of accessible resources and scalable professional learning models to promote STEM readiness from a young age.
4.1. Recommendations for Teacher Implementation
Overall, this study’s findings suggest that teachers can help children build foundational data science knowledge. To do so effectively and in a developmentally appropriate way, teachers can integrate data science into daily routines, leverage hands-on materials, and approach answering research questions with an inquiry-driven approach. For example, daily “questions of the day” can help teachers weave data use into a developmentally appropriate classroom environment, allowing children to engage with meaningful questions, collect simple data, and use that data to engage in data talks about what that data means.
With or without access to digital tools, teachers can engage children in hands-on, play based learning with the use of movement and story-based contents for each investigation. Teachers can scaffold the data collection and visualization process to help connect children’s understanding of the implication of quantities in each category. Data talks help scaffold the experience of verbalizing what children see in data visualizations and connect that data back to the research question. Teachers can foster children’s ownership of the process by allowing them to co-create their own questions based on their curiosities and interests. Yet, teachers should keep activities short and break the investigation into manageable pieces to sustain children’s engagement.
4.2. Limitations
The study’s limitations include a small sample size, limited geographic and participant diversity, and relatively short duration, which may affect the generalizability of the findings and limit our understanding of the long-term impacts on children’s learning. In addition, the study did not investigate the potential variation in teachers’ implementation fidelity, which could affect the consistency of outcomes, and the study relied heavily on teacher self-report that may introduce bias. Additionally, many teachers were unfamiliar with data science content at the outset, which could have influenced implementation fidelity and outcomes. The research was conducted in a post-COVID context, where schools faced simultaneous challenges such as child absences and language barriers, potentially impacting participation and engagement. While teacher feedback and observations were made about children’s engagement, a direct measure of this outcome was not included. Finally, the process of developing and refining the child assessment was ongoing, indicating that measurement tools may still require further validation. This study is a good step towards growing our knowledge of the impact on this domain, but a larger, fully powered randomized controlled trial as a next step would be the needed.
4.3. Future Directions
Future research should focus on exploring the developmental trajectories of data science skills in early childhood to better understand how these competencies evolve over time. Investigating how children use data within play contexts could provide insights into more naturalistic and engaging learning opportunities. There is also a need for studies that support widespread implementation of data science curricula, including scalable professional development models for early childhood educators. Additionally, future work should address refining assessment tools and explore strategies to overcome challenges related to teacher familiarity with data science content, ensuring equitable access to high-quality STEM learning experiences from an early age.
5. Conclusions
This study suggests that integrating data science into preschool STEM education is both developmentally appropriate and effective in supporting early mathematics and computational thinking skills. The Preschool Data Toolbox app, combined with hands-on investigations, successfully engaged young children by fostering curiosity through interactive activities and visual data representations. Intervention teachers reported that the intervention was feasible to implement within their existing curricula and routines, perceiving it as developmentally suitable and beneficial for children’s learning. While child engagement was generally high, some challenges were noted during data interpretation phases, indicating areas for refinement. Importantly, teachers’ comfort and confidence in teaching data collection and analysis improved following professional development and classroom implementation. Furthermore, statistical analyses of child assessment scores indicate that children in the intervention group made significant gains in data science knowledge compared to their peers in the comparison group, providing evidence of the program’s positive impact on early learning outcomes. Despite these promising findings, limitations such as a small sample size and varying teacher familiarity with data science content highlight the need for further research and enhanced professional support. Future work should investigate the longitudinal development of data science skills and focus on widespread dissemination of research-based curricula and teacher training to support equitable STEM learning opportunities from an early age.
6. Patents
Intellectual property of the apps and the teacher’s guide belong to [Gracie & Friends, WGBH Educational Foundation, 2014, 2022] and the instructional materials belong to [Education Development Center].
Author Contributions
Conceptualization, A.E.L.P. and J.M.Y.; Methodology, A.E.L.P. and J.M.Y.; Formal analysis, A.E.L.P., J.M.Y., E.B. and R.V.; Investigation, A.E.L.P., J.M.Y., E.B. and R.V.; Writing—original draft, A.E.L.P., J.M.Y., E.B. and R.V.; Writing—review and editing, A.E.L.P., J.M.Y., E.B. and R.V.; Visualization, A.E.L.P. and E.B.; Supervision, A.E.L.P. and J.M.Y.; Project administration, A.E.L.P. and J.M.Y.; Funding acquisition, A.E.L.P. and J.M.Y. All authors have read and agreed to the published version of the manuscript.
Funding
This research was funded by the National Science Foundation grant number 1933698. Any opinions, findings, conclusions, or recommendations expressed in this material are those of the authors and do not necessarily reflect the views of the National Science Foundation.
Institutional Review Board Statement
The study was conducted in accordance with the Decla-ration of Helsinki, and approved by the Institutional Review Board the Education Development Center (2194, 8 December 2022).
Informed Consent Statement
Informed consent was obtained from all subjects involved in the study.
Data Availability Statement
The data presented in this study may be requested by contacting the corresponding author, who will work with EDC Office of General Counsel and EDC Human Protection to ensure that sharing data complies with human protections standards and abides by EDC intellectual property policy. The data are not publicly available due to the terms of the consent forms signed by preschool center directors, teachers, and parents that specify that data will be kept confidential (e.g., “Video and audio recordings will not be used other than by researchers from this research study”).
Acknowledgments
We thank our participating teachers and students, as well as project advisors who have provided valuable feedback. We also wish to thank all the project staff at WGBH Education Foundation and EDC.
Conflicts of Interest
The authors declare no conflicts of interest. The funders had no role in the design of the study; in the collection, analyses, or interpretation of data; in the writing of the manuscript; or in the decision to publish the results.
References
- Aponte, C. G., Malallah, S., & Shamir, L. (2025, June 22–25). A review of K–12 data science education in the United States: Trends, tools, and gaps. 2025 ASEE Annual Conference & Exposition, Montreal, QC, Canada. [Google Scholar] [CrossRef]
- Bargagliotti, A., Binder, W., Blakesley, L., Eusufzai, Z., Fitzpatrick, B., Ford, M., Huchting, K., Larson, S., Rovetti, R., Seal, K., & Zachariah, T. (2020a). Undergraduate learning outcomes for achieving data acumen. Journal of Statistics Education, 28(3), 197–211. [Google Scholar] [CrossRef]
- Bargagliotti, A., Franklin, C., Arnold, P., Gould, R., Johnson, S., Perez, L., & Spangler, D. (2020b). Pre-K–12 guidelines for assessment and instruction in statistics education II (GAISE II). American Statistical Association and National Council of Teachers of Mathematics. [Google Scholar]
- Bloom, H. (Ed.). (2005). Randomizing groups to evaluate place-based programs. In Learning more from social experiments: Evolving analytic method (pp. 115–172). Russell Sage Foundations. [Google Scholar]
- Bloom, H., Richburg-Hayes, L., & Black, A. (2007). Using covariates to improve precision for studies that randomize schools to evaluate educational interventions. Educational Evaluation and Policy Analysis, 29(1), 30–59. [Google Scholar] [CrossRef]
- Boaler, J., LaMar, T., & Williams, C. (2021). Making sense of a data-filled world. Mathematics Teacher: Learning and Teaching PK-12, 114(7), 508–517. [Google Scholar] [CrossRef]
- Brenneman, K., Lange, A., & Nayfeld, I. (2019). Integrating STEM into preschool education: Designing a professional development model in diverse settings. Early Childhood Education Journal, 47, 15–28. [Google Scholar] [CrossRef]
- Carmichael, I., & Marron, J. (2017). Data science vs. statistics: Two cultures? Japanese Journal of Statistics and Data Science, 1, 117–138. [Google Scholar] [CrossRef]
- Clements, D. H. (2007). Curriculum research: Toward a framework for ‘research-based curricula’. Journal for Research in Mathematics Education, 38, 35–70. [Google Scholar]
- Clements, D. H., & Sarama, J. (2014). Learning and teaching early math: The learning trajectories approach (2nd ed.). Routledge. [Google Scholar]
- Clements, D. H., & Sarama, J. (2021). Learning and teaching early math: The learning trajectories approach (3rd ed.). Routledge. [Google Scholar]
- Cobb, P., Confrey, J., di Sessa, A., Lehrer, R., & Schauble, L. (2003). Design experiments in educational research. Educational Researcher, 32(1), 9–13. [Google Scholar] [CrossRef]
- Copley, J. (2010). Data analysis and probability in the early childhood curriculum. In The young child and mathematics (pp. 147–166). National Association for Education of Young Children. [Google Scholar]
- Danyluk, A., Leidig, P., McGettrick, A., Cassel, L., Doyle, M., Servin, C., Schmitt, K., & Stefik, A. (2021). Computing competencies for undergraduate data science programs: An ACM task force final report. In Proceedings of the 52nd ACM technical symposium on computer science education (SIGCSE’21) (pp. 1119–1120). Association for Computing Machinery. [Google Scholar] [CrossRef]
- Donoho, D. (2017). 50 years of data science. Journal of Computational and Graphical Statistics, 26, 745–766. [Google Scholar] [CrossRef]
- Drozda, Z. (2021). NCER IES catalyzing a new field: Data science education in K-12. Technical Working Group (TWG) Meeting. Available online: https://ies.ed.gov/learn/blog/catalyzing-data-science-education-k-12-recommendations-panel-experts (accessed on 14 October 2025).
- Duncan, G. J., Dowsett, C. J., Claessens, A., Magnuson, K., Huston, A. C., Klebanov, P., Pagani, L. S., Feinstein, L., Engel, M., Brooks-Gunn, J., Sexton, H., Duckworth, K., & Japel, C. (2007). School readiness and later achievement. Developmental Psychology, 43(6), 1428–1446. [Google Scholar] [CrossRef]
- English, L. D. (2010). Young children’s early modelling with data. Mathematics Education Research Journal, 22(2), 24–47. [Google Scholar] [CrossRef]
- English, L. D. (2011, July 3). Data modelling in the beginning school years. 34th Annual Conference of the Mathematics Education Research Group of Australia (MERGA) (pp. 226–234), Alice Springs, Australia. [Google Scholar]
- English, L. D., & Watson, J. (2015). Statistical literacy in the elementary school: Opportunities for problem posing. In J. Cai, F. M. Singer, & N. F. Ellerton (Eds.), Mathematical problem posing: From research to effective practice (pp. 241–256). Springer. [Google Scholar]
- Frye, K. E., Boss, D. L., Anthony, C. J., Du, H., & Xing, W. (2024). Content analysis of the CASEL framework using K–12 state SEL standards. School Psychology Review, 53, 208–222. [Google Scholar] [CrossRef]
- Hariri, R. H., Fredericks, E. M., & Bowers, K. M. (2019). Uncertainty in big data analytics: Survey, opportunities, and challenges. Journal of Big Data, 6, 44. [Google Scholar] [CrossRef]
- Herro, D., Adisa, I. O., & Abimbade, O. (2025). Teachers co-designing and enacting elementary data science curriculum through connected learning. Journal of Statistics and Data Science Education, 1–19. [Google Scholar] [CrossRef]
- Israel-Fishelson, R., Moon, P., Tabak, R., & Weintrop, D. (2024). Understanding the data in K-12 data science. Harvard Data Science Review, 6(2), 1–32. [Google Scholar] [CrossRef]
- Jiang, S., Lee, V. R., & Rosenberg, J. M. (2022). Data science education across the disciplines: Underexamined opportunities for K-12 innovation. British Journal of Educational Technology, 53, 1073–1079. [Google Scholar] [CrossRef]
- Johnson, N. C., Franke, M. L., & Turrou, A. C. (2022). Making competence explicit: Helping students take up opportunities to engage in math together. Teachers College Record, 124(11), 117–152. [Google Scholar] [CrossRef]
- K–12 Computer Science Framework. (2016). Available online: http://www.k12cs.org (accessed on 14 October 2025).
- LeCompte, M. D. (2000). Analyzing qualitative data. Theory into Practice, 39(3), 146–154. [Google Scholar] [CrossRef]
- Lee, H. S., Mojica, G. M., Thrasher, E. P., & Baumgartner, P. (2022). Investigating data like a data scientist: Key practices and processes. Statistics Education Research Journal, 21(2), 1–23. [Google Scholar] [CrossRef]
- Lewis Presser, A. E., Young, J., Cerrone, M., Clements, L., & Sherwood, H. (2022a). The potential and developmental appropriateness of data collection and analysis activities for preschoolers: A formative study with teachers. International Journal of Integrating Technology in Education, 11(1), 1–15. [Google Scholar]
- Lewis Presser, A. E., Young, J., Clements, L., Rosenfeld, D., Kook, J. F., Sherwood, H., & Cerrone, M. (2022b). Exploring preschool data collection and analysis: A pilot study. Education Sciences, 12(2), 118. [Google Scholar] [CrossRef]
- Lewis Presser, A. E., & Young, J. M. (2024). Preschool data scientists: Using a digital tool to create child-centered investigations. Science and Children, 61(3), 25–33. [Google Scholar] [CrossRef]
- Lewis Presser, A. E., Young, J. M., Rosenfeld, D., Clements, L. J., Kook, J. F., Sherwood, H., & Cerrone, M. (2023). Data collection and analysis for preschoolers: An engaging context for integrating mathematics and computational thinking with digital tools. Early Childhood Research Quarterly, 65(4), 42–56. [Google Scholar] [CrossRef]
- Litke, E., & Hill, H. C. (2020). Exploring central tendencies: The teaching of data and statistics in elementary mathematics classrooms. The Elementary School Journal, 120(3), 480–506. [Google Scholar] [CrossRef]
- Louie, J., Stiles, J., Fagen, E., Roy, S., & Chance, B. (2021). Data investigations to further social justice inside and outside of STEM. Connected Science Learning, 3(1), 12318679. [Google Scholar] [CrossRef]
- Malallah, S., Shamir, L., Hsu, W., Weese, J., & Alfailakawi, S. (2023a, June 25–28). Data science (Dataying) for early childhood. 2023 ASEE Annual Conference & Exposition, ASEE Conferences (p. 42867), Baltimore, MD, USA. [Google Scholar]
- Malallah, S., Weese, J. L., & Alsalmi, K. N. (2023b, June 25–28). The “besTech” technology practice framework for early childhood education. ASEE Annual Conference & Exposition, Baltimore, MD, USA. [Google Scholar]
- Martinez, W. L., & LaLonde, D. (2020). Data science for everyone starts in kindergarten: Strategies and initiatives from the American Statistical Association. Harvard Data Science Review, 2(3), 1–7. [Google Scholar] [CrossRef]
- Mazzocco, M., Burchinal, M., Schulte, A., Vandell, D., Sanabria, A., Hwang, J., & Connor, C. (2024). Mathematics in U.S. preschool and kindergarten classrooms. Early Childhood Research Quarterly, 69, 25–37. [Google Scholar] [CrossRef]
- McClure, E. R., Guernsey, L., Clements, D. H., Bales, S. N., Nichols, J., Kendall-Taylor, N., & Levine, M. H. (2017). STEM starts early: Grounding science, technology, engineering, and math education in early childhood. The Joan Ganz Cooney Center at Sesame Workshop. [Google Scholar]
- McNamara, A. (2019). Key attributes of a modern statistical computing tool. The American Statistician, 73(4), 375–384. [Google Scholar] [CrossRef]
- National Academies of Sciences, Engineering, and Medicine (NASEM). (2023). Foundations of data science for students in grades K–12: Proceedings of a workshop. The National Academies Press. [Google Scholar] [CrossRef]
- Platas, L. (2018). Data in the preschool classroom. DREME blog (Development and Research in Early Math Education). Available online: https://dreme.stanford.edu/news/data-in-the-preschool-classroom/ (accessed on 14 October 2025).
- Raine, L., & Anderson, J. (2017, February 8). Code-dependent: Pros and cons of the algorithm age. Pew Research Center. Available online: https://www.pewresearch.org/internet/2017/02/08/code-dependent-pros-and-cons-of-the-algorithm-age/ (accessed on 14 October 2025).
- Resnick, M. (2003). Playful learning and creative societies. Education Update, 8(6). Available online: http://web.media.mit.edu/~mres/papers/education-update.pdf (accessed on 1 May 2009).
- Reynante, B. M., Selbach-Allen, M. E., & Pimentel, D. R. (2020). Exploring the promises and perils of integrated STEM through disciplinary practices and epistemologies. Science & Education, 29, 785–803. [Google Scholar] [CrossRef]
- Rosenberg, J., & Jones, R. S. (2024). Data science learning in grades K–12: Synthesizing research across divides. Harvard Data Science Review, 6(3), 1–30. [Google Scholar] [CrossRef]
- Rosenberg, J. M., Lawson, M. A., Anderson, D. J., Jones, R. S., & Rutherford, T. (2020). Making data science count in and for education. In E. Romero-Hall (Ed.), Research methods in learning design & technology (pp. 94–110). Routledge. [Google Scholar] [CrossRef]
- Rubin, A. (2022). Chapter 8: Learning to reason with data: How did we get here and what do we know? In J. H. Wilkerson, & J. L. Polman (Eds.), Situating data science—Exploring how relationships to data shape learning (pp. 154–164). Routledge. [Google Scholar]
- Saldana, J. (2021). The coding manual for qualitative researchers (4th ed.). SAGE Publications. [Google Scholar]
- Sarama, J., & Clements, D. H. (2009). Early childhood mathematics education research: Learning trajectories for young children (1st ed.). Routledge. [Google Scholar] [CrossRef]
- Stohlmann, M. S., & Albarracín, L. (2016). What is known about elementary grades mathematical modelling. Education Research International, 2016(1), 5240683. [Google Scholar] [CrossRef]
- Weiland, T., & Engledowl, C. (2022). Transforming curriculum and building capacity in K–12 data science education. Harvard Data Science Review, 4(4). [Google Scholar] [CrossRef]
- Weintrop, D., Beheshti, E., Horn, M., Orton, K., Jona, K., Trouille, L., & Wilensky, U. (2016). Defining computational thinking for mathematics and science classrooms. Journal of Science Education and Technology, 25(1), 127–147. [Google Scholar] [CrossRef]
- Wilkerson, H. H., & Polman, J. L. (2022). Chapter 1: Introduction. In J. H. Wilkerson, & J. L. Polman (Eds.), Situating data science—Exploring how relationships to data shape learning. Routledge. [Google Scholar]
- Wilkerson, M. H., & Polman, J. L. (2020). Situating data science: Exploring how relationships to data shape learning [Special Issue]. Journal of the Learning Sciences, 29(1), 1–15. [Google Scholar] [CrossRef]
- Wing, J. M. (2019). The data life cycle. Harvard Data Science Review. [Google Scholar] [CrossRef]


Disclaimer/Publisher’s Note: The statements, opinions and data contained in all publications are solely those of the individual author(s) and contributor(s) and not of MDPI and/or the editor(s). MDPI and/or the editor(s) disclaim responsibility for any injury to people or property resulting from any ideas, methods, instructions or products referred to in the content. |
© 2025 by the authors. Licensee MDPI, Basel, Switzerland. This article is an open access article distributed under the terms and conditions of the Creative Commons Attribution (CC BY) license (https://creativecommons.org/licenses/by/4.0/).