


Abstract
This study examines South Africa’s long-run growth slowdown, with particular attention to investment dynamics, using quarterly data spanning 1960Q1–2025Q3. The analysis combines Bayesian Structural Time Series (BSTS) modelling to estimate the evolution of latent trend growth with Bayesian Model Averaging (BMA) to assess the robustness of selected macroeconomic growth correlates. The BSTS results reveal a substantial long-run decline in trend growth, with particularly strong posterior evidence of deterioration following the global financial crisis. In the baseline BMA specification, investment growth emerges as the most robust contemporaneous correlate of GDP growth, with a posterior inclusion probability of 1.000, a result that remains stable across alternative prior specifications and treatment of the interest rate. However, when lagged GDP growth is introduced alongside lagged investment growth, GDP persistence dominates, while the posterior support for lagged investment declines substantially. The findings therefore qualify interpretations of investment as an independent predictor or causal driver of growth. Rather, weak investment dynamics constitute an important feature of South Africa’s prolonged low-growth environment alongside substantial persistence in economic activity. The results suggest that sustainable growth requires not merely higher investment, but improvements in the structural conditions that determine its productivity, including infrastructure reliability, logistics efficiency, institutional capacity, and policy certainty.
1. Introduction
South Africa’s growth slowdown is widely acknowledged, yet its underlying drivers remain insufficiently quantified. Over the past two decades, the economy has experienced a marked decline in growth performance, with successive recoveries failing to restore earlier expansion dynamics. Real GDP growth has remained persistently below historical norms, raising concerns about the sustainability of economic progress in a context of rising unemployment, fiscal pressures, and declining living standards. A large and well-established empirical literature identifies a broad set of determinants underpinning economic growth across countries. Early cross-country studies emphasise the roles of capital accumulation, human capital, and policy stability (Barro, 1991; Mankiw et al., 1992), while subsequent work highlights the importance of institutions and governance quality (Acemoglu et al., 2001). More recent contributions stress the role of infrastructure, financial development, and trade openness in shaping long-run growth trajectories (Calderón & Servén, 2014; Aghion et al., 2005; Barro & Sala-i-Martin, 2004). Importantly, the empirical growth literature has increasingly recognised the problem of model uncertainty, leading to the adoption of Bayesian Model Averaging techniques to identify robust growth determinants (Fernández et al., 2001; Sala-i-Martin et al., 2004; Eicher et al., 2011). Contemporary panel evidence continues to confirm that investment, institutional quality, and macroeconomic stability remain among the most robust predictors of growth performance across both advanced and developing economies. Recent evidence shows that South Africa’s growth has stagnated over the past decade as a result of entrenched structural rigidities and weak reform momentum (IMF, 2025). Similarly, the World Bank reports that growth slowed to 0.6 percent in 2023, undermined by constraints in product and input markets and a broad-based weakening in productivity and public investment (World Bank, 2024). Country-specific assessments also suggest that structural bottlenecks—especially electricity shortages and declining potential output—have become central drags on long-run growth performance (Janse van Rensburg & Morema, 2023). More broadly, recent OECD analysis shows that potential growth has fallen sharply in recent years, reflecting the cumulative effects of load-shedding, infrastructure constraints, and weak capital accumulation (OECD, 2025). While cyclical factors have contributed to short-term fluctuations, the persistence of weak growth suggests that structural constraints remain the dominant forces shaping South Africa’s long-run economic trajectory (Medici et al., 2025).
A central but under-examined feature of this slowdown is the behaviour of investment. Historically, periods of strong economic expansion in South Africa have been closely associated with robust capital accumulation, reflecting the critical role of investment in expanding productive capacity and supporting long-run growth (Fedderke & Simkins, 2012; Rodrik, 2008). Empirical evidence consistently highlights the importance of capital formation and infrastructure in driving growth outcomes, particularly in emerging markets characterised by structural constraints (Calderón & Servén, 2010; Fedderke & Garlick, 2008). However, this relationship appears to have weakened significantly in recent years. Gross fixed capital formation has stagnated, investment growth has become increasingly volatile, and capital deepening has slowed (World Bank, 2024; IMF, 2025). These developments have unfolded alongside persistent structural challenges—including energy supply disruptions, infrastructure bottlenecks, and policy uncertainty—all of which are widely recognised as impediments to sustained investment activity (Calitz & Fourie, 2022; South African Reserve Bank, 2023; OECD, 2025).
Recent empirical and policy-oriented evidence increasingly points to investment as a key constraint on South Africa’s growth performance. Macroeconomic assessments by the International Monetary Fund identify weak investment and infrastructure deficiencies as central factors limiting economic expansion (IMF, 2023). Similarly, the World Bank emphasises that declining capital formation and structural bottlenecks in energy and logistics continue to weigh heavily on growth outcomes (World Bank, 2024). Evidence from the South African Reserve Bank further indicates that subdued investment has contributed to the decline in potential growth over the past decade (Janse van Rensburg & Morema, 2023). Despite this emerging consensus, the empirical literature has not yet provided a systematic and robust assessment of the relative importance of investment vis-à-vis other macroeconomic drivers of growth within a framework that accounts for model uncertainty and evolving growth dynamics. This empirical attempt addresses this gap by probing the extent to which decline in investment explains South Africa’s growth slowdown. In order to address this, the study adopts a Bayesian empirical framework that combines time-varying trend estimation with probabilistic model selection. First, a Bayesian Structural Time Series (BSTS) model is used to characterise the evolution of South Africa’s growth dynamics over the period 1960Q1–2025Q3, allowing for gradual shifts in the underlying growth process. Second, a Bayesian Model Averaging (BMA) approach is employed to identify the most robust determinants of economic growth across a wide set of competing specifications. By explicitly accounting for model uncertainty, this approach avoids the limitations of single-model inference and provides a more reliable assessment of the drivers of growth.
The empirical results reveal a persistent deterioration in South Africa’s underlying growth performance accompanied by a pronounced weakening in investment dynamics. The BSTS estimates indicate a substantial decline in latent trend growth over the sample period, with particularly strong posterior evidence of deterioration following the global financial crisis. Within the baseline BMA specification, investment growth emerges as the most robust contemporaneous macroeconomic correlate of GDP growth, receiving a posterior inclusion probability of 1.000 and retaining strong posterior support across alternative prior specifications and alternative treatment of the interest rate. Exchange-rate movements also exhibit substantial explanatory relevance, while the posterior support for government expenditure and monetary conditions is more specification-dependent.
Importantly, the dynamic robustness analysis qualifies the interpretation of investment’s role. Although lagged investment growth initially exhibits strong posterior support, its inclusion probability falls considerably when lagged GDP growth is introduced as a competing predictor, while lagged GDP growth receives a posterior inclusion probability of 1.000. This indicates that part of the predictive content attributed to past investment reflects the persistence and pro-cyclicality of aggregate economic activity. The results therefore do not establish causal dominance of investment. Rather, they identify weak investment dynamics as an important feature of South Africa’s prolonged low-growth environment while highlighting the broader persistence of the growth slowdown itself.
These findings have important implications for both research and policy. Empirically, they demonstrate the value of combining a time-varying representation of underlying growth with Bayesian assessment of competing macroeconomic correlates, while also illustrating the importance of distinguishing robust contemporaneous associations from independent predictive or causal effects. From a policy perspective, the evidence suggests that simply increasing the volume of investment is unlikely to be sufficient to restore sustained growth. The more relevant challenge is to create conditions under which productive investment can translate into higher capacity and productivity by addressing constraints affecting its expected return and effectiveness, including electricity reliability, transport and logistics performance, infrastructure delivery, institutional capacity, and policy certainty.
While previous studies have widely recognised the importance of investment for economic growth, the present study contributes to the literature in three respects. First, it combines Bayesian Structural Time Series and Bayesian Model Averaging within a unified empirical framework, allowing the evolution of latent trend growth to be examined alongside the robustness of selected macroeconomic growth correlates. Second, the analysis employs a long quarterly dataset spanning 1960Q1–2025Q3, permitting growth and investment dynamics to be examined across markedly different macroeconomic periods. Third, the study distinguishes between investment intensity and investment-growth dynamics and further tests whether the apparent predictive relevance of investment survives explicit competition from persistence in GDP growth. In doing so, the analysis provides a more qualified account of the investment-growth relationship: weakening investment momentum is closely associated with South Africa’s growth slowdown, but its independent predictive importance diminishes once output persistence is explicitly considered.
The remainder of the paper is structured as follows. Section 2 presents the stylised facts and motivates the empirical analysis. Section 3 outlines the data and methodological framework. Section 4 reports and discusses the main empirical findings, including the posterior trend estimates and robustness analyses. Section 5 concludes and presents the policy implications.
2. Stylized Facts and Motivation: Investment Dynamics and Growth Slowdown in South Africa
South Africa’s recent macroeconomic performance has been widely characterised by persistently weak growth, with international and domestic policy institutions consistently highlighting structural constraints as the primary drivers of this slowdown. Over the past decade, economic growth has remained subdued, with medium-term projections indicating only modest improvements despite ongoing reform efforts (IMF, 2025; World Bank, 2024). This pattern reflects deeper structural rigidities within the economy, including weak productivity growth, declining capital accumulation, and inefficiencies in key network industries.
A recurring theme across recent policy assessments is the central role of investment in shaping South Africa’s growth trajectory. Evidence from the International Monetary Fund indicates that economic growth has stagnated largely due to entrenched structural rigidities, with reforms in governance, business regulation, and labour markets identified as critical for unlocking higher levels of investment and output. Similarly, the World Bank emphasises that weak capital formation and declining investment efficiency have constrained the economy’s capacity to expand productive potential, particularly in the presence of infrastructure and logistics bottlenecks.
The OECD reinforces this view by highlighting the interaction between structural constraints and investment dynamics, noting that uncertainty, regulatory inefficiencies, and infrastructure gaps continue to weigh on private sector investment decisions (OECD, 2025). In particular, persistent challenges in energy supply and transport logistics have been identified as major impediments to capital formation, raising production costs and reducing the expected returns to investment. These constraints have contributed to a prolonged period of weak investment performance, limiting the scope for productivity improvements and long-term growth.
Domestic evidence from the South African Reserve Bank further underscores the importance of investment in explaining the country’s growth outcomes. Recent assessments indicate that potential growth has declined significantly over time, reflecting both reduced capital accumulation and structural inefficiencies in the economy (South African Reserve Bank, 2024, 2025). In addition, the Reserve Bank highlights that investment has remained insufficient to offset depreciation and sustain capital deepening, thereby constraining the economy’s productive capacity.
Taken together, these findings point to a consistent narrative: South Africa’s growth slowdown is closely associated with weak and unstable investment dynamics, arising from a combination of structural bottlenecks, policy uncertainty, and declining productivity. While cyclical factors and external shocks have contributed to short-term fluctuations, the weight of evidence from international and domestic institutions suggests that the underlying challenge is structural in nature. This raises an important empirical question regarding the extent to which investment drives growth outcomes relative to other macroeconomic factors, particularly in a context characterised by evolving economic conditions and uncertainty.
These stylised observations are consistent with a growing body of recent empirical and policy-oriented evidence emphasising the central role of investment and infrastructure in shaping growth trajectories in developing and emerging economies. Recent cross-country analyses indicate that persistent gaps in capital accumulation and infrastructure provision remain key constraints on long-run growth performance, particularly in Africa and other emerging regions (OECD, 2025; World Bank, 2024). For instance, large-scale infrastructure investment is shown to generate substantial short- and long-term growth gains, with estimates suggesting that closing infrastructure gaps could significantly raise GDP growth rates across developing economies. Similarly, recent empirical studies confirm that infrastructure financing and investment efficiency play a critical role in determining economic performance in emerging markets (Tayeng et al., 2024). In the South African context, weak investment, structural rigidities, and institutional constraints continue to act as binding impediments to sustained economic expansion (IMF, 2025; Janse van Rensburg & Morema, 2023). Despite this emerging consensus, there remains limited empirical evidence quantifying the relative importance of investment vis-à-vis other macroeconomic drivers of growth within a unified framework that explicitly accounts for model uncertainty—an important gap this study seeks to address. This study builds on these insights by adopting a Bayesian empirical framework to systematically assess the role of investment in shaping South Africa’s growth dynamics, while accounting for model uncertainty and time-varying relationships.
Empirical studies emphasise the role of investment, structural constraints, and institutional quality in shaping long-run growth trajectories (Moral-Benito, 2015; Eicher et al., 2011; Aghion et al., 2015). In the African context, weak infrastructure, policy uncertainty, and limited capital accumulation have been identified as key constraints on growth (Fosu, 2013; Calderón & Servén, 2014). These findings reinforce the relevance of examining investment dynamics within a framework that accounts for model uncertainty and evolving macroeconomic conditions.
The emphasis on investment in this study does not imply that investment is the sole or ultimate cause of South Africa’s growth slowdown. Rather, investment is treated as a key transmission channel through which deeper structural constraints affect aggregate growth. Electricity shortages, logistics bottlenecks, weak public-sector capacity, policy uncertainty, and institutional frictions can reduce expected returns to capital and weaken both public and private investment. In this sense, declining investment may reflect underlying structural constraints while also amplifying their effects through weaker capital accumulation, lower productivity growth, and reduced employment creation. The empirical analysis therefore interprets investment not as an isolated causal force, but as a macroeconomic channel through which structural constraints are transmitted to growth outcomes.
It is also important to recognize that South Africa’s investment dynamics have evolved within a broader global macroeconomic environment. As a relatively open emerging economy with substantial exposure to global commodity cycles, external capital flows, exchange-rate pressures, and international financial conditions, domestic investment behaviour cannot be interpreted solely through internal macroeconomic factors. Periods of elevated investment activity have often coincided with favourable global commodity conditions and stronger external demand, while investment slowdowns have frequently occurred alongside tightening global financial conditions, exchange-rate volatility, and weaker international growth. In this regard, fluctuations in investment may partly reflect the interaction between domestic structural constraints and broader global market conditions. Although the parsimonious BMA specification adopted in this study does not explicitly model all external transmission channels, these broader dynamics remain important for interpreting South Africa’s long-run growth and investment performance and represent an important avenue for future research.
3. Methodology
3.1. Theoretical Framework and Empirical Strategy
This study is grounded in neoclassical and endogenous growth theories, which provide the conceptual basis for examining the relationship between investment and economic growth. In the neoclassical growth framework (Solow, 1956), investment contributes to capital accumulation and increases the productive capacity of the economy. Endogenous growth models extend this perspective by emphasising channels through which capital formation can facilitate technological adoption, productivity improvements, human-capital accumulation, and knowledge spillovers (Romer, 1986, 1990; Lucas, 1988; Aghion & Howitt, 1992). These mechanisms provide a theoretical basis for examining investment alongside fiscal, monetary, and external conditions as potential correlates of South Africa’s growth performance.
The empirical analysis adopts a two-stage Bayesian strategy. First, a Bayesian Structural Time Series (BSTS) model is used to estimate the latent trend in real GDP and its time-varying slope, allowing the underlying pace of economic growth to evolve over time. This component addresses whether the deterioration observed in realised GDP growth is also evident in the estimated underlying growth trajectory. Second, Bayesian Model Averaging (BMA) is employed within a deliberately parsimonious set of macroeconomic variables to assess the robustness of investment growth relative to government expenditure growth, monetary conditions, and exchange-rate dynamics across competing specifications. The BMA exercise is therefore interpreted as an assessment of specification uncertainty within a focused model space, rather than an exhaustive search over the wider universe of potential growth determinants.
Investment is expected to be associated with economic growth through several channels. Capital formation expands productive capacity, while investment in machinery, technology, infrastructure, and productive assets can enhance efficiency and productivity. At the same time, investment conditions in South Africa interact with structural constraints, including electricity reliability, transport and logistics performance, infrastructure capacity, and the broader policy environment. The empirical analysis does not attempt to identify these individual structural channels directly. Rather, it evaluates the evolution of underlying growth and the robustness of the association between investment dynamics and aggregate economic performance.
This combined approach is particularly useful for the present study because the two Bayesian components answer different questions. The BSTS model characterises how South Africa’s underlying growth trajectory has evolved, whereas BMA evaluates the relative posterior support for selected macroeconomic correlates of observed GDP growth. The results are interpreted as probabilistic evidence of association and specification robustness and not, in the absence of a separate identification strategy, as structural causal effects.
3.2. Bayesian Structural Time Series Model
To estimate the evolution of South Africa’s underlying growth trajectory, the study employs a Bayesian Structural Time Series model with a local linear trend. BSTS provides a state-space representation in which the observed series is decomposed into latent stochastic components whose evolution is estimated probabilistically (Scott & Varian, 2014). This specification is appropriate for a long macroeconomic series such as South African real GDP because it does not require the underlying trend or its growth rate to remain constant over the entire sample.
The observed log real GDP series is decomposed into a trend component and an irregular component:
where denote the log real GDP, represents the latent trend and is a stochastic error term.
The trend component is modelled as a local linear trend process:
where captures the slope (the growth rate) of the trend, and and are mutually independent Gaussian disturbances.
The BSTS framework allows for time-varying growth rates, making it particularly suitable for capturing structural changes in economic performance. The model is estimated using Bayesian techniques, which provide full posterior distributions for the latent states and parameters.
Trend growth is computed as the annualised change in the estimated trend component:
This transformation yields an interpretable measure of quarterly annualised trend growth.
While the Hodrick–Prescott (HP) filter is widely used for trend–cycle decomposition, it suffers from several well-documented limitations, including end-point bias, sensitivity to the choice of smoothing parameter, and the lack of an explicit stochastic structure governing the evolution of the trend component. In contrast, the Bayesian Structural Time Series (BSTS) framework provides a fully probabilistic and model-based approach to trend estimation, allowing for time-varying growth rates and structural changes to be explicitly modelled within a state-space representation. By estimating the latent trend as a stochastic process, BSTS avoids arbitrary smoothing assumptions and yields full posterior distributions for both the level and slope of the trend. This makes it particularly well suited for analysing economies such as South Africa, where growth dynamics are subject to structural breaks, policy shifts, and external shocks. As such, the BSTS approach provides a more flexible and theoretically grounded alternative to purely statistical filtering methods such as the HP filter.
3.3. Identification of Structural Regimes
To analyse the evolution of growth dynamics over time, the study classifies the sample into three distinct macroeconomic regimes- Pre-GFC period, Post-GFC, Pre-COVID period and COVID/Post-COVID period. Hence, the sample is divided into three regimes: Pre-GFC (1960Q1–2007Q4), Post-GFC and Pre-COVID (2008Q1–2019Q4), and COVID/Post-COVID (2020Q1–2025Q3). The final regime includes both the pandemic contraction and the subsequent recovery period, reflecting the combined effect of the COVID-19 shock and its aftermath.
This regime classification is motivated by major global and domestic economic events that are likely to have influenced South Africa’s growth trajectory. Descriptive statistics and comparative analysis across these regimes provide preliminary evidence on the persistence and magnitude of the growth slowdown.
3.4. Bayesian Model Averaging (BMA)
To assess the robustness of selected macroeconomic correlates of economic growth, the study employs Bayesian Model Averaging (BMA). Rather than selecting a single regression specification, BMA integrates evidence across alternative combinations of candidate explanatory variables, weighting each specification according to its posterior model probability (Raftery et al., 1997; Hoeting et al., 1999). In the present application, BMA is used as a focused specification-uncertainty framework rather than an exhaustive search over a large universe of potential growth determinants. The candidate set is deliberately parsimonious and comprises investment growth, government expenditure growth, the interest rate, and exchange-rate growth.
A methodological issue in analysing the relationship between investment and GDP is that gross fixed capital formation forms part of GDP under the expenditure approach. The contemporaneous association between investment growth and GDP growth may therefore partly reflect national-accounting linkages. The purpose of the BMA exercise is not to establish a strict causal effect of investment on GDP, but to assess whether investment growth remains the most robust macroeconomic correlate of growth when considered alongside other policy and external variables under model uncertainty. Accordingly, the results are interpreted as evidence of robust empirical association and macroeconomic relevance, rather than as direct causal estimates.
The empirical strategy adopted in this study aligns with a growing body of literature that applies Bayesian methods to growth analysis. Bayesian Model Averaging has been widely used to identify robust determinants of economic growth under model uncertainty (Eicher et al., 2011; Moral-Benito, 2015; Zeugner & Feldkircher, 2009). Similarly, Bayesian time series approaches such as BSTS have been employed to capture evolving macroeconomic dynamics and structural changes (Scott & Varian, 2014). The combination of BSTS and BMA in this study therefore reflects recent methodological developments at the research frontier.
The baseline growth equation is specified as:
where
represents the real GDP growth, is the investment growth (gross fixed capital formation), is government expenditure growth is the interest rate and is the exchange rate growth.
With explanatory variables, the model space consists of possible models. For each model the posterior model probability is given by:
where denotes the data. The study adopts a uniform model prior and the unit information prior (UIP) for parameter estimation.
A key output of the BMA framework is the posterior inclusion probability (PIP):
which measures the probability that variable belongs to the true model. Variables with high PIPs are considered robust determinants of economic growth.
The selection of variables in this study is intentionally parsimonious and guided by both theoretical relevance and data consistency over a long-time horizon. While a broader set of variables—such as human capital, institutional quality, and trade openness—may provide additional insights, consistent quarterly data for these variables over the full sample period (1960–2025) are not readily available. Moreover, the Bayesian Model Averaging (BMA) framework is designed to evaluate robustness across model specifications, and its effectiveness does not necessarily depend on large variable sets but on the systematic assessment of competing models. The focus on core macroeconomic variables therefore ensures both data reliability and interpretability, while allowing the BMA procedure to identify the most robust determinants of growth within a theoretically grounded and empirically consistent framework. It is important to note that the BMA framework identifies robust growth-associated variables under model uncertainty rather than establishing strict structural causality.
The BMA analysis is deliberately parsimonious and is intended to address specification uncertainty within a focused set of theoretically motivated macroeconomic variables rather than to conduct an exhaustive search over a large universe of potential growth determinants. With four candidate regressors, the model space comprises possible specifications. BMA is used to integrate evidence across these competing specifications rather than selecting a single preferred regression. To assess whether posterior variable rankings depend on the coefficient prior, the baseline Unit Information Prior (UIP) results are compared with BRIC and hyper-g alternatives while retaining a uniform model prior.
Real GDP, gross fixed capital formation, government expenditure, and the exchange rate are transformed into year-on-year growth rates. The interest rate enters the baseline specification in levels because its level represents the prevailing monetary and financing conditions faced by households and firms. Accordingly, its coefficient has a different interpretation from those attached to the growth-rate variables. To assess whether this transformation choice affects the posterior results, an alternative specification replaces the interest-rate level with its first difference, . This robustness exercise permits an assessment of whether the posterior ranking of the candidate growth correlates is sensitive to measuring monetary conditions in levels rather than changes.
3.5. Dynamic and Specification Robustness Checks
Several robustness exercises are conducted to examine whether the principal empirical patterns depend on growth measurement, investment timing, prior assumptions, variable transformations, or persistence in GDP growth.
First, BSTS-based latent trend growth is compared with an alternative trend estimate obtained using the HP filter. Real GDP growth is also reconstructed using annualised quarter-on-quarter changes as an alternative to the baseline year-on-year measure. These exercises assess whether the documented deterioration in economic performance is sensitive to the method used to measure underlying or realised growth.
Second, to reduce the influence of the contemporaneous national-accounting relationship between investment and GDP, the BMA model is re-estimated by replacing contemporaneous GFCF growth with its one-quarter lag. A distributed-lag specification containing one- to five-quarter lags of investment growth is subsequently estimated to examine whether the posterior relevance of investment varies across horizons. Because adjacent investment lags may contain overlapping information, the individual distributed-lag coefficients and PIPs are interpreted cautiously as evidence about dynamic association rather than separate structural effects.
Third, lagging investment does not by itself eliminate the possibility that its apparent predictive relevance reflects persistence in aggregate economic activity. Both GDP and investment are pro-cyclical and serially persistent. A more demanding specification therefore introduces one-quarter lagged GDP growth as a competing predictor alongside one-quarter lagged GFCF growth, government expenditure growth, the interest rate, and exchange-rate growth. This test directly evaluates whether lagged investment retains substantial posterior support once GDP’s own persistence is allowed to compete within the same BMA model space. The exercise is not intended as a causal identification strategy but as a test of whether the predictive association attributed to lagged investment is distinguishable from a simpler persistence-based explanation.
Finally, posterior variable rankings are compared across UIP, BRIC, and hyper-g priors, and the baseline interest-rate level is replaced by its first difference. Together, these exercises provide evidence on the sensitivity of the findings to the coefficient prior, monetary-policy transformation, investment timing, alternative growth measures, and persistence in aggregate output.
3.6. Data and Variables Construction
The analysis is based on quarterly data for South Africa spanning 1960Q1 to 2025Q3, sourced primarily from the South African Reserve Bank. Real GDP, government expenditure, and gross fixed capital formation are expressed in real terms, while interest rates and exchange rates are included in levels or growth rates as appropriate. All variables are transformed to ensure consistency and interpretability. In particular, as shown in Table 1, growth rates are computed as year-on-year percentage changes, Log transformations are applied where necessary and Trend growth is annualised for comparability.
Table 1.
Variable Definitions and Data Sources.
4. Empirical Results
4.1. Summary Property of the Data/Stationarity and Time-Series Properties
Table 2 presents the descriptive statistics for the key macroeconomic variables used in the analysis. Over the sample period spanning 1960Q1 to 2025Q3, real GDP averages approximately 2.7 million in constant prices, reflecting the long-term expansion of the South African economy. Government expenditure and gross fixed capital formation average about 123,467 and 104,433 respectively, highlighting the relative scale of fiscal activity and capital investment over the period. The summary statistics also reveal notable variation across the macroeconomic variables. The interest rate averages approximately 10.5 percent, with values ranging from 4.75 percent to 17.79 percent, reflecting episodes of tight monetary policy associated with inflation stabilization and macroeconomic adjustment. Similarly, the exchange rate exhibits substantial dispersion, with the rand ranging from 0.67 to 18.90 per US dollar, capturing the long-run depreciation of the domestic currency and the increasing exposure of the South African economy to global financial conditions. The investment ratio which is defined as annualized quarterly gross fixed capital formation as a percentage of GDP, averages approximately 15.00 percent, with relatively moderate variation over time. While the ratio appears relatively stable, this measure masks significant fluctuations in investment growth across different economic periods. As will be shown in the subsequent stylised analysis, investment dynamics exhibit pronounced cyclical and structural changes, particularly following the global financial crisis and the COVID-19 pandemic. Overall, the descriptive statistics suggest substantial variability in key macroeconomic indicators, providing a useful foundation for the subsequent empirical analysis examining the determinants of South Africa’s growth performance.
Table 2.
Descriptive Statistics of Key Variables.
Given the long quarterly sample and the presence of substantial structural change, the time-series properties of the variables were examined using Augmented Dickey–Fuller (ADF) and Kwiatkowski–Phillips–Schmidt–Shin (KPSS) tests. The results, reported in Appendix A Table A1, indicate clear non-stationarity in log real GDP and the interest-rate level. The growth-rate variables generally reject the ADF unit-root null, although the KPSS results provide mixed evidence for real GDP and government expenditure growth, consistent with the substantial structural variation present over the 1960Q1–2025Q3 sample. Investment and exchange-rate growth display stronger evidence of stationarity. First-difference checks confirm stationarity for changes in GDP growth, government expenditure growth, and the interest rate. Importantly, the BSTS specification is estimated on log real GDP within a local-linear-trend state-space framework that explicitly permits the latent level and slope to evolve stochastically; stationarity around a fixed deterministic trend is therefore not imposed. Indeed, a KPSS trend-stationarity test rejects deterministic trend stationarity for log real GDP. For the BMA analysis, growth transformations are used for the principal macroeconomic variables, while robustness to the non-stationary interest-rate level is assessed by replacing it with its stationary first difference.
4.2. Stylised Facts of Growth and Investment Dynamics in South Africa
Figure 1 illustrates the evolution of South Africa’s real GDP in logarithmic form over the period 1960Q1–2025Q3. The figure reveals a long-run upward trajectory in economic activity, reflecting sustained expansion of the South African economy over several decades. However, the slope of the series appears to flatten gradually from the late 2000s onward, suggesting a deceleration in growth momentum. The most pronounced contraction occurs in 2020 during the COVID-19 pandemic, where a sharp but temporary decline in output is observed. Although the economy subsequently recovers, the pandemic/post-pandemic trajectory remains relatively subdued compared with earlier decades, consistent with concerns regarding a structural slowdown in South Africa’s growth performance.
Figure 1.
Long-Run Evolution of Log Real GDP in South Africa. Note: Real GDP is expressed in natural logarithms to highlight long-run growth dynamics. Data are sourced from the South African Reserve Bank.
Figure 2 presents the logarithmic evolution of gross fixed capital formation (GFCF), a key measure of investment activity. The figure shows that investment expanded steadily from the 1960s through the late 1970s, reflecting periods of industrial expansion and infrastructure development. However, the investment trajectory becomes considerably more volatile from the 1980s onward. Notably, while investment rises significantly during the early 2000s—coinciding with improved macroeconomic stability and commodity-driven growth—it stagnates and begins to weaken after the global financial crisis. The pandemic shock in 2020 also produces a sharp contraction in investment. Unlike GDP, however, investment has not fully recovered to its pre-pandemic trend, indicating a persistent weakness in capital formation that may have important implications for long-term growth.
Figure 2.
Evolution of Log Gross Fixed Capital Formation in South Africa. Note: Gross fixed capital formation (GFCF) is expressed in natural logarithms to highlight long-run investment dynamics. Data are sourced from the South African Reserve Bank.
Figure 3 presents the posterior distribution of South Africa’s latent trend-growth rate estimated from the local-linear-trend BSTS model. The results reveal a pronounced long-run weakening in underlying growth momentum. Posterior mean trend growth was above 5% at the beginning of the sample but declined substantially over subsequent decades, notwithstanding a temporary recovery during the late 1990s and early 2000s. Following the mid-2000s, the estimated trend weakened persistently and reached particularly low levels around the COVID-19 period. Although trend growth subsequently recovered modestly, the posterior mean remains close to 1.1% by 2025Q3, substantially below the rates estimated during earlier periods. Importantly, the 95% credible interval widens and encompasses zero during parts of the later sample, indicating considerable uncertainty regarding the precise magnitude of recent trend growth. The evidence therefore supports a sustained deterioration in South Africa’s underlying growth momentum, while cautioning against interpreting individual posterior estimates as precisely identified structural breaks.
Figure 3.
Posterior Estimate of South Africa’s Latent Trend Growth from the BSTS Model. Note: The solid line represents the posterior mean of annualised latent trend growth obtained from the local-linear-trend BSTS model. The shaded area represents the 95% posterior credible interval. Quarterly latent slope draws are annualised as . The horizontal dashed line denotes zero trend growth.
The posterior comparisons reported in Table 3 provide further evidence that the weakening in South Africa’s underlying growth momentum is not merely a visual feature of the estimated trend. Average latent trend growth during the Post-GFC/Pre-COVID period is estimated to be approximately 1.54 percentage points lower than during the Pre-GFC period, with a 95% credible interval of −2.68 to −0.39 percentage points. The posterior probability of a decline is 0.996, providing strong evidence of a deterioration in underlying trend growth following the earlier high-growth period. Consistent with this result, average trend growth during the Post-COVID period is approximately 2.19 percentage points below the Pre-GFC average, with a posterior probability of decline of 0.996.
Table 3.
Posterior Comparisons of BSTS Latent Trend Growth Across Economic Regimes.
The evidence concerning an additional deterioration after COVID-19 is more qualified. Relative to the Post-GFC/Pre-COVID period, average Post-COVID latent trend growth is estimated to be 0.65 percentage points lower, and the posterior probability of a decline is 0.805. However, the 95% credible interval (−2.19, 0.91) includes zero. Thus, while the posterior distribution assigns greater probability to a further weakening in trend growth after the pandemic, the evidence is insufficient to establish a precisely identified additional decline. A focused comparison of the five years immediately before and after the global financial crisis similarly yields a 0.947 posterior probability of lower trend growth, although its credible interval marginally includes zero. Taken together, the results provide particularly strong evidence of a long-run deterioration in South Africa’s underlying growth trajectory, while suggesting greater uncertainty about attributing a discrete additional trend break to either the GFC or COVID-19 alone.
Figure 4 plots the investment ratio, measured as annualised quarterly gross fixed capital formation relative to real GDP. The figure shows that the investment ratio fluctuated substantially over the sample period, reflecting changes in the intensity of capital accumulation relative to economic output. The ratio remained relatively low during the early 1960s, averaging close to 12 percent of GDP, before increasing steadily through the 1970s and early 1980s, indicating periods of stronger investment activity. Following a decline during the late 1980s and early 1990s, the investment ratio recovered gradually and rose sharply during the mid-2000s, peaking at above 20 percent around the period preceding the global financial crisis.
Figure 4.
Evolution of the Investment Ratio (GFCF as a Share of Real GDP) in South Africa. Note: Investment Ratio refers to annualised quarterly gross fixed capital formation as a percentage of real GDP. Data are sourced from the South African Reserve Bank.
However, the figure also reveals that the investment ratio weakened noticeably following the global financial crisis and declined further during the COVID/Post-COVID period. Although the investment share remained moderate relative to historical standards, the downward trend observed in recent years suggests a weakening investment environment and reduced capital accumulation intensity. These developments are consistent with the broader slowdown in South Africa’s economic performance and point to the importance of investment dynamics in understanding the country’s long-run growth trajectory.
Figure 5 depicts the year-on-year growth rate of real GDP. The figure highlights substantial fluctuations in economic growth across different periods. In earlier decades, growth rates were relatively robust, frequently exceeding 4–6 percent during expansionary phases. However, growth volatility becomes more pronounced from the 1980s onward, with several episodes of negative growth associated with macroeconomic disruptions and global economic shocks. The most dramatic contraction occurs during the COVID-19 pandemic in 2020, where output declines sharply before rebounding in the subsequent period. Importantly, the figure also reveals a gradual decline in average growth rates over time, particularly after the global financial crisis, consistent with the hypothesis that South Africa may be experiencing a prolonged period of subdued economic expansion.
Figure 5.
Dynamics of Year-on-Year Real GDP Growth in South Africa. Note: Real GDP growth is computed as the year-on-year percentage change. The dashed horizontal line represents the zero-growth benchmark. Data are sourced from the South African Reserve Bank.
The interpretation of South Africa’s long-run growth slowdown also requires some caution given the extended historical sample employed in the analysis. Part of the relatively higher growth observed during the earlier decades of the sample may reflect lower-base effects, structural transformation, industrial expansion, and earlier stages of capital accumulation characteristic of developing economies during periods of economic transition. Consequently, the subsequent moderation in growth should not be interpreted solely as evidence of declining investment performance. Rather, the observed slowdown likely reflects the interaction between weakening investment dynamics, structural rigidities, changing external conditions, and the gradual maturation of the economy over time.
Figure 6 shows the year-on-year growth rate of gross fixed capital formation. Investment growth exhibits considerably greater volatility than GDP growth, reflecting the pro-cyclical nature of investment spending. Periods of strong economic expansion are generally associated with rapid increases in investment, while downturns often coincide with sharp contractions in capital formation. The figure reveals several episodes of pronounced investment decline, particularly during the mid-1980s, the global financial crisis, and the COVID-19 pandemic. More importantly, investment growth appears to weaken structurally after the global financial crisis, remaining relatively subdued in the post-2008 period. This persistent slowdown in investment activity provides an important stylised fact motivating the subsequent econometric analysis.
Figure 6.
Dynamics of Year-on-Year Investment Growth (GFCF) in South Africa. Note: Investment growth is computed as the year-on-year percentage change in gross fixed capital formation (GFCF). The dashed horizontal line represents the zero-growth benchmark.
Altogether, Figure 1, Figure 2, Figure 3, Figure 4, Figure 5 and Figure 6 provide important insights into the long-run dynamics of South Africa’s economy. While real output has continued to expand over time, the pace of growth has slowed noticeably in recent decades. At the same time, investment activity has become increasingly volatile and has weakened significantly since the global financial crisis. These patterns suggest that deteriorating investment performance may play a critical role in explaining the country’s persistent growth slowdown. To examine this relationship more formally, the next section compares growth and investment dynamics across different economic regimes.
4.3. Growth and Investment Across Economic Regimes
To better understand the evolution of South Africa’s growth performance over time, the sample period is divided into three distinct macroeconomic regimes: the pre–global financial crisis period (Pre-GFC), the post-GFC but pre-COVID period, and the COVID/post-COVID period. This regime classification allows for a comparison of growth and investment dynamics across different structural phases of the South African economy.
Table 4 presents summary statistics for real GDP growth across the three regimes, while Table 5 reports the corresponding statistics for investment growth measured by gross fixed capital formation (GFCF). Figure 7 complements these tables by visually comparing average GDP growth and the investment ratio across the different regimes.
Table 4.
Real GDP Growth Across Economic Regimes.
Table 5.
Investment Growth Across Economic Regimes.
Figure 7.
Average Real GDP Growth and Investment Ratio Across Economic Regimes. Note: The figure compares average real GDP growth and the investment ratio (gross fixed capital formation as a percentage of real GDP) across three economic regimes: Pre-GFC (1960Q1–2007Q4), Post-GFC and Pre-COVID (2008Q1–2019Q4), and COVID/Post-COVID (2020Q1–2025Q3). Values represent period averages.
The results reveal a clear deterioration in South Africa’s growth performance over time. During the Pre-GFC period, the economy experienced relatively robust growth, with average real GDP growth of 3.31 percent and a median growth rate of 3.54 percent. This period coincided with relatively favourable global economic conditions, rising commodity prices, and improvements in macroeconomic stability. However, economic performance weakened substantially after the global financial crisis. During the Post-GFC, Pre-COVID period, average GDP growth declined sharply to 1.43 percent, representing a reduction of more than half relative to the earlier period. This slowdown reflects a combination of structural constraints, declining investment momentum, electricity supply challenges, and subdued productivity growth.
The deterioration in economic performance becomes even more pronounced in the Post-COVID period, where average GDP growth falls further to approximately 0.63 percent. Although the COVID-19 pandemic generated an unprecedented contraction followed by a temporary rebound, the average growth performance in the pandemic/post-pandemic period remains significantly weaker than in previous decades. The much higher standard deviation observed during this period also reflects the heightened volatility associated with pandemic-related economic disruptions.
The patterns observed in GDP growth closely mirror developments in investment activity. As shown in Table 5, investment growth was relatively strong in the Pre-GFC period, averaging 4.67 percent year-on-year. In contrast, investment growth deteriorated sharply after the global financial crisis. During the Post-GFC, Pre-COVID period, average investment growth fell to approximately −0.06 percent, indicating near stagnation in capital formation. The decline becomes even more pronounced in the COVID/Post-COVID period, where average investment growth drops to −1.79 percent, reflecting persistent weakness in private and public investment.
Figure 7 further illustrates the relationship between economic growth and investment dynamics across the three regimes by comparing average real GDP growth with the investment ratio. The investment ratio indicates that gross fixed capital formation averaged approximately 14.5 percent of GDP during the Pre-GFC period, increased to about 17.7 percent during the Post-GFC and Pre-COVID period, and declined moderately to 14.3 percent during the COVID/Post-COVID period. In contrast, average GDP growth declined sharply across the same regimes, falling from 3.31 percent in the Pre-GFC period to 1.43 percent in the Post-GFC and Pre-COVID period, and further to 0.63 percent during the COVID/Post-COVID period.
Importantly, the relatively elevated investment ratio observed during the Post-GFC and Pre-COVID period contrasts with the substantial slowdown in both GDP growth and investment growth reported earlier. This suggests that the investment share alone does not fully capture the weakening dynamics of capital accumulation. Rather, the results indicate that the slowdown is more closely associated with declining investment momentum and weaker investment growth dynamics than with the investment ratio itself. This distinction highlights the importance of differentiating between the level of investment relative to output and the dynamic behaviour of investment growth over time.
Overall, the evidence suggests that South Africa’s growth slowdown is closely linked to a sustained weakening in investment performance, particularly following the global financial crisis and during the COVID/Post-COVID period. These descriptive patterns motivate the subsequent Bayesian Model Averaging analysis, which formally evaluates the relative importance of investment and other macroeconomic variables in explaining South Africa’s growth dynamics under model uncertainty.
4.4. Macroeconomic Correlates of Economic Growth: Bayesian Model Averaging Results
To assess the relative robustness of selected macroeconomic variables associated with economic growth in South Africa, this study employs a Bayesian Model Averaging (BMA) framework. The BMA approach accounts for specification uncertainty by evaluating alternative combinations of candidate explanatory variables and assigning posterior probabilities across the resulting model space. This enables the computation of posterior inclusion probabilities (PIPs), which indicate the degree of posterior support for including each candidate variable in explaining variations in economic growth within the specified model space.
The empirical specification includes four candidate macroeconomic variables: investment growth (gross fixed capital formation), government expenditure growth, the interest rate, and exchange-rate growth. With four candidate regressors, the model space consists of possible model combinations, evaluated under a uniform model prior and a Unit Information Prior (UIP). Given the deliberately parsimonious candidate set, the results are interpreted as evidence of relative robustness among the variables considered rather than as an exhaustive assessment of all potential drivers of South Africa’s economic growth.
The results presented in Table 6 show that investment growth receives the strongest posterior support among the four candidate variables. Its posterior inclusion probability of 1.000 indicates that investment growth is included in all high-probability specifications within the baseline model space. The positive posterior mean of 0.214 indicates a strong positive association between investment growth and real GDP growth. Since both variables are expressed as percentage growth rates, the estimate implies that a one-percentage-point increase in investment growth is associated with approximately a 0.214-percentage-point increase in real GDP growth, conditional on the BMA specification. This relationship should be interpreted as an association rather than a causal effect.
Table 6.
Baseline Bayesian Model Averaging Results.
This baseline result is visually reinforced in Figure 8, which plots the posterior inclusion probabilities of the four candidate variables. Investment growth receives the strongest posterior support, with a PIP of 1.000, followed by exchange-rate growth, the interest rate, and government expenditure growth. The differences in PIPs indicate variation in the degree of posterior support across the candidate growth correlates within the baseline model space.
Figure 8.
Posterior Inclusion Probabilities of Growth Determinants. Note: The figure reports posterior inclusion probabilities (PIPs) from the baseline Bayesian Model Averaging specification. Higher PIPs indicate stronger posterior support for inclusion within the specified candidate set and should not be interpreted as evidence of causal effects.
Exchange-rate growth receives the second-highest posterior inclusion probability, at 0.831. Its negative posterior mean indicates that exchange-rate depreciation is associated with weaker growth outcomes within the baseline specification, potentially reflecting South Africa’s reliance on imported inputs and the effects of currency movements on domestic production costs and investment conditions. Figure 8 similarly shows relatively strong posterior support for exchange-rate growth, although below that of investment growth.
The interest rate receives moderate posterior support, with a posterior inclusion probability of 0.612. Its negative posterior mean is consistent with an inverse association between prevailing interest-rate conditions and economic growth, potentially operating through borrowing costs and investment activity. However, its lower PIP relative to investment and exchange-rate growth indicates weaker posterior support within the candidate set considered.
Government expenditure growth receives the lowest posterior inclusion probability, at 0.412. Although its posterior mean is positive, the comparatively low PIP indicates weaker posterior support for its inclusion in the baseline growth specification. This should not be interpreted as evidence that fiscal policy is unimportant for economic growth; rather, government expenditure growth displays less consistent explanatory relevance than the other candidate variables within the particular model space examined.
The finding that investment emerges as the most robust growth-associated variable in the BMA framework is consistent with a broad empirical literature emphasizing the central role of capital accumulation in economic development and long-run productivity enhancement (Barro & Sala-i-Martin, 2004; Eicher et al., 2011; Aghion et al., 2015). More recent empirical evidence likewise reinforces the importance of investment and infrastructure accumulation as critical drivers of growth performance, particularly in emerging and developing economies characterised by structural bottlenecks and infrastructure deficits (Calderón & Servén, 2014; Fosu, 2013). In the South African context, several studies and policy-oriented analyses have increasingly identified weak investment dynamics, infrastructure deterioration, and energy constraints as key impediments to sustained economic expansion (Kumo, 2012; IMF, 2025; OECD, 2025). Empirical evidence further suggests that deficiencies in transport, electricity, and logistics infrastructure have significantly constrained productivity growth and private sector investment in South Africa (Fedderke & Garlick, 2008; OECD, 2025).
However, the strong posterior support assigned to investment growth in the baseline BMA specification suggests that investment is particularly relevant among the macroeconomic correlates considered in the baseline model space This likely reflects the interaction between capital accumulation and persistent structural constraints, particularly electricity supply disruptions, logistics bottlenecks, and infrastructure inefficiencies, which have increasingly shaped investment behaviour and productive capacity over the past decade (Enebeli et al., 2026; Reuters, 2025; Reuters, 2026). In this setting, fluctuations in investment growth may capture not only changes in aggregate demand conditions, but also broader shifts in infrastructure reliability, business confidence, and the economy’s productive potential. The findings therefore support the view that weakening investment momentum constitutes an important transmission channel through which structural rigidities translate into persistent growth underperformance in South Africa.
At the same time, the relatively lower importance of government expenditure and interest rates contrasts with some strands of the literature that emphasize fiscal and monetary transmission channels. This may indicate that, in the presence of binding structural constraints, traditional macroeconomic policy tools have limited effectiveness unless complemented by sustained investment and structural reform (Loewald et al., 2020; National Treasury, 2024). Recent South African evidence further suggests that the effectiveness of monetary policy weakens under conditions of heightened uncertainty and structural rigidities, thereby reducing the growth impact of conventional policy interventions (Phahlamohlaka & Buthelezi, 2025; Balcilar et al., 2021). Similarly, empirical studies on fiscal and monetary policy interactions in South Africa report that policy shocks often produce modest or delayed effects on real economic activity, particularly in low-growth environments characterized by infrastructure bottlenecks, weak investment, and subdued private-sector confidence (Aye, 2021; Mavundla et al., 2025).
While the baseline BMA results provide useful evidence on the relative posterior support for the candidate growth correlates, it is important to assess their sensitivity to alternative modelling assumptions and specifications. The subsequent robustness analysis therefore considers alternative measures of economic growth, prior specifications, the treatment of the interest rate, lagged and distributed-lag investment dynamics, and the inclusion of lagged GDP growth as a competing predictor to account explicitly for persistence in economic activity. These exercises provide a more stringent assessment of the extent to which the baseline investment-growth association remains robust under alternative specifications.
4.5. Robustness Checks
To ensure that the baseline findings are not sensitive to the choice of growth measure or modelling approach, this section presents a set of robustness checks based on alternative definitions of economic growth. Specifically, the analysis considers a trend-based growth measure derived using the Hodrick–Prescott (HP) filter, and an alternative high-frequency growth measure based on annualised quarter-on-quarter changes in real GDP.
Alternative Trend-Based Growth Measure
Figure 9 compares the baseline growth dynamics with an alternative trend growth series obtained using the Hodrick–Prescott (HP) filter applied to log real GDP. The HP filter provides a widely used benchmark for decomposing macroeconomic time series into trend and cyclical components.
Figure 9.
Trend Growth Comparison: HP-Filtered Trend vs. Actual Real GDP Growth in South Africa. Note: The figure compares actual real GDP growth (year-on-year percentage change) with the estimated trend growth obtained using the Hodrick–Prescott (HP) filter. The HP filter is applied with a smoothing parameter of λ = 1600, appropriate for quarterly data. The divergence between actual and trend growth highlights cyclical fluctuations and structural shifts in South Africa’s growth trajectory.
The results reveal a strong alignment between the HP-filtered trend growth and the observed year-on-year growth series. In particular, both series capture the key turning points in South Africa’s economic trajectory, including the gradual decline in growth following the global financial crisis and the sharp contraction during the COVID-19 period. Importantly, the HP-based trend also indicates a persistently low level of growth in the COVID/post-COVID period, reinforcing the view that the slowdown reflects structural rather than purely cyclical factors.
Overall, the close correspondence between the two series suggests that the baseline findings are robust to alternative methods of extracting underlying growth trends.
To further assess robustness, the analysis is repeated using annualised quarter-on-quarter real GDP growth as an alternative measure of economic performance. This higher-frequency indicator captures short-term fluctuations and provides an additional perspective on growth dynamics.
As reported in Table 7, the pattern of economic growth across regimes remains broadly consistent with the baseline results obtained using year-on-year growth. The Pre-GFC period is characterised by relatively strong growth, with an average rate of 3.24 percent, while the Post-GFC, Pre-COVID period exhibits a marked slowdown, with mean growth declining to 1.33 percent. The COVID/Post-COVID period records the lowest average growth rate of approximately 0.62 percent, indicating a further deterioration in economic performance.
Table 7.
Real GDP Growth Across Economic Regimes (Annualised Quarter-on-Quarter Measure).
In addition to the decline in average growth, Table 7 also reveals a substantial increase in volatility during the COVID/post-COVID period, as reflected in the significantly higher standard deviation. This suggests that the recent growth environment is not only weaker but also more unstable.
Figure 10 complements the evidence in Table 7 by providing a visual comparison of average growth across regimes. The figure confirms the same downward trajectory in growth performance, reinforcing the conclusion that South Africa’s economic slowdown is robust to alternative growth definitions.
Figure 10.
Real GDP Growth Across Economic Regimes (Annualised Quarter-on-Quarter Measure). Note: The figure presents average annualised quarter-on-quarter real GDP growth across three economic regimes: Pre-GFC (1960Q1–2007Q4), Post-GFC and Pre-COVID (2008Q1–2019Q4), and COVID/Post-COVID (2020Q1–2025Q3). Values represent period averages. The figure complements the evidence reported in Table 7.
In addition to the HP filter and alternative growth measures, the robustness of the findings is reinforced by the consistency of results across different economic regimes and model specifications within the BMA framework. The convergence of evidence from multiple empirical approaches strengthens confidence in the central finding that investment remains the most robust determinant of growth. While further extensions—such as alternative prior specifications or structural break tests—may provide additional insights, the current robustness framework captures both cyclical and structural dimensions of the growth process.
4.6. Additional Robustness: Lagged Investment Growth and Prior Sensitivity of BMA Results
- Lagged Investment Growth
To address concerns that the relationship between investment and GDP growth may partly reflect contemporaneous national-accounting linkages, an additional robustness check is conducted using lagged investment growth. Specifically, the baseline BMA model is re-estimated by replacing contemporaneous GFCF growth with one-quarter lagged GFCF growth. This specification allows the analysis to examine whether past investment growth remains relevant for explaining subsequent GDP growth, thereby providing evidence beyond the contemporaneous association between GDP and one of its expenditure components.
The results, reported in Table 8, show that one-quarter lagged investment growth remains the most robust macroeconomic correlate of real GDP growth, with a posterior inclusion probability of 1.000. The posterior mean is positive, indicating that stronger investment growth in the previous quarter is associated with higher subsequent output growth. Exchange rate growth, interest rates, and government expenditure growth also enter the model with moderate to high inclusion probabilities, but none dominates lagged investment growth. This finding reinforces the main result that investment dynamics play a central role in South Africa’s growth process.
Table 8.
Robustness Check Using Lagged Investment Growth.
Figure 11 complements the lagged BMA robustness results by illustrating the posterior inclusion probabilities of the explanatory variables when one-quarter lagged investment growth is used in place of contemporaneous investment growth. The figure confirms that lagged investment growth remains the most robust determinant of GDP growth, receiving an inclusion probability of 1.000. This finding provides additional evidence that the relationship between investment and growth is not driven solely by contemporaneous national-accounting linkages, but also reflects dynamic investment-growth interactions over time. Although this does not establish strict causality, it provides additional evidence consistent with the interpretation that investment affects growth through dynamic capital-accumulation and productive-capacity channels.
Figure 11.
Lagged Investment Growth Robustness Check. Note: The figure reports posterior inclusion probabilities from the Bayesian Model Averaging estimation using one-quarter lagged investment growth instead of contemporaneous investment growth. Lagged investment growth remains the most robust determinant of GDP growth, suggesting that the relationship is not driven solely by contemporaneous national-accounting linkages.
Table 9 extends the robustness analysis by estimating a distributed-lag Bayesian Model Averaging (BMA) specification incorporating consecutive lags of investment growth from one to five quarters. The results reveal that the one-quarter lag of investment growth remains the most robust growth-associated variable, receiving a posterior inclusion probability of 1.000 alongside a positive posterior mean. This finding suggests that past investment performance contains substantial information relevant for subsequent economic growth outcomes in South Africa. In contrast, the second- and third-quarter lags display relatively low inclusion probabilities, indicating limited explanatory relevance at these intermediate horizons.
Table 9.
Distributed-Lag BMA Robustness Results.
Interestingly, the fourth-quarter lag exhibits a relatively high posterior inclusion probability but a negative posterior mean, while the fifth-quarter lag retains a moderate positive association with growth. This pattern suggests that the investment-growth relationship is dynamic and potentially non-linear across different time horizons. In particular, the negative sign observed at the fourth-quarter lag may reflect delayed adjustment effects, cyclical reversals, financing constraints, or temporary macroeconomic corrections following periods of elevated investment activity. Moreover, the inclusion of multiple adjacent lagged investment terms may introduce substantial overlap in information content across lags, implying that individual lag coefficients should be interpreted cautiously and primarily as indicators of temporal persistence rather than isolated structural effects. Given the substantial overlap in information across adjacent lagged investment variables, some coefficient instability across longer horizons is not unexpected in distributed-lag specifications estimated under model uncertainty.
In economies characterised by structural rigidities, infrastructure bottlenecks, and external volatility, investment surges may not translate into uniformly positive growth effects across all horizons.
Overall, the distributed-lag results indicate that the relationship between investment and growth is strongest at shorter horizons, particularly at the one-quarter lag, while longer-term effects appear more heterogeneous and less stable over time. Although these findings do not establish strict causality, they provide additional evidence consistent with the interpretation that investment dynamics play an important role in shaping South Africa’s growth performance through capital-accumulation and productive-capacity channels.
Figure 12 shows that the one-quarter lag of investment growth remains the most robust growth-associated variable, while the explanatory relevance of longer lags varies across horizons. The figure further suggests that the investment-growth relationship in South Africa is dynamic and time-dependent rather than purely contemporaneous or uniformly linear.
Figure 12.
Distributed-Lag Investment Robustness Check. Note: This figure presents posterior inclusion probabilities from the distributed-lag Bayesian Model Averaging (BMA) specification incorporating one- to five-quarter lags of investment growth alongside other macroeconomic variables.
- Prior Sensitivity of the BMA Results
Given the deliberately parsimonious candidate set, an additional robustness exercise examines whether the BMA findings are sensitive to the choice of coefficient prior. The baseline Unit Information Prior (UIP) is therefore compared with BRIC and hyper-g alternatives while retaining the same uniform model prior and set of candidate regressors. As shown in Table 10, the central result is highly stable across prior specifications. Investment growth retains a posterior inclusion probability of 1.000 under all three priors, providing strong posterior support for its inclusion within the candidate model space. Exchange-rate growth also remains the second-ranked variable, with PIPs ranging from 0.831 under the UIP and BRIC specifications to 0.863 under the hyper-g prior. The corresponding probabilities for the interest rate range from 0.612 to 0.655, while government expenditure growth remains the least strongly supported variable, although its PIP increases from 0.412 to 0.489 under the hyper-g specification. Thus, while the posterior support for the secondary variables exhibits some sensitivity to prior choice, the ranking of the variables and, most importantly, the strong posterior support for investment growth remain unchanged.
Table 10.
Prior Sensitivity of Posterior Inclusion Probabilities.
4.7. Robustness to Output-Growth Persistence
The strong posterior support for one-quarter-lagged investment growth in the preceding specifications raises an important question: whether this relationship reflects information specific to investment or more general persistence in aggregate economic activity. Since investment and output are strongly pro-cyclical, and GFCF forms part of aggregate expenditure, lagging investment alone does not fully separate these channels. A more stringent robustness exercise therefore allows one-quarter-lagged GDP growth and one-quarter-lagged investment growth to compete directly within the same BMA model space, alongside government expenditure growth, the interest rate, and exchange-rate growth. With five candidate regressors, the specification comprises 32 possible models, all of which are evaluated.
The results in Table 11 materially qualify the preceding lagged-investment evidence. Once lagged GDP growth is allowed to compete directly with lagged investment growth, output persistence becomes the dominant predictor, with a posterior inclusion probability of 1.000 and a posterior mean of 0.595. In contrast, the PIP of one-quarter-lagged investment growth declines from the strong support observed in the investment-only lag specifications to 0.238, while its posterior mean falls to 0.009. Exchange-rate growth remains strongly supported, with a PIP of 0.873.
Table 11.
BMA Robustness Controlling for Output-Growth Persistence.
This comparison indicates that the high posterior support previously obtained for lagged investment growth partly reflects broader persistence in economic activity rather than an independent investment-specific predictive relationship. The finding does not negate the strong contemporaneous association between investment growth and GDP growth identified in the baseline BMA model, nor does it invalidate the distributed-lag evidence concerning the temporal pattern of that association. It does, however, narrow its interpretation: investment growth is a strong contemporaneous growth correlate within the baseline model space, but lagged investment does not dominate GDP’s own persistence when the two are allowed to compete directly. Accordingly, the BMA evidence is interpreted as evidence of association rather than causal identification.
4.8. Robustness to the Treatment of the Interest Rate
As an additional specification check, the baseline BMA model is re-estimated by replacing the interest rate in levels with its first difference, thereby distinguishing changes in monetary conditions from the prevailing level of financing conditions. The results, reported in Appendix A Table A2, leave the principal baseline ranking largely intact. Investment growth retains a posterior inclusion probability of 1.000, with a posterior mean of 0.220 compared with 0.214 in the baseline specification, while exchange-rate growth receives even stronger posterior support (PIP = 0.985). Government expenditure growth receives moderate support (PIP = 0.610). By contrast, the change in the interest rate has a low inclusion probability of 0.060, compared with 0.612 when the interest rate enters in levels. This suggests that the baseline investment result is not sensitive to the transformation of the interest-rate variable, while the explanatory relevance of monetary conditions appears to reside more in the prevailing interest-rate level than in short-run changes in the rate.
5. Conclusions and Policy Implications
This study examined South Africa’s long-run growth slowdown, with particular attention to the role of investment dynamics, using quarterly data spanning 1960Q1–2025Q3. Combining a Bayesian Structural Time Series (BSTS) model with Bayesian Model Averaging (BMA), the analysis provides evidence on both the evolution of underlying trend growth and the robustness of selected macroeconomic correlates of realised GDP growth. The results point to a sustained weakening of South Africa’s growth performance. The BSTS estimates show a pronounced decline in latent trend growth over time, with posterior evidence indicating that trend growth was substantially lower after the global financial crisis than during the earlier period. The decline between the Post-GFC/Pre-COVID and COVID/Post-COVID periods is less precisely estimated, suggesting that the longer-run deterioration predates the pandemic rather than being attributable exclusively to COVID-19.
Investment dynamics nevertheless constitute an important part of this deterioration. Investment growth weakened markedly after the global financial crisis and remained subdued through the COVID/Post-COVID period. In the baseline BMA specification, investment growth receives a posterior inclusion probability of 1.000 and a positive posterior mean, making it the most robust contemporaneous macroeconomic correlate of GDP growth within the deliberately parsimonious model space considered. This result is insensitive to alternative BMA priors and to replacing the interest-rate level with its first difference. The descriptive evidence also shows why the investment ratio alone is insufficient for understanding the slowdown: the investment share of GDP remained relatively elevated during the Post-GFC/Pre-COVID period even while both GDP and investment growth weakened considerably. Investment momentum, rather than simply the investment share, therefore appears more informative about the deterioration in growth performance.
The additional dynamic evidence, however, provides an important qualification. Although one-quarter-lagged investment growth receives strong posterior support when considered alongside the original macroeconomic variables, its inclusion probability falls substantially when lagged GDP growth is introduced as a competing predictor. In that specification, lagged GDP growth receives a PIP of 1.000, compared with 0.238 for lagged investment growth. Thus, part of the apparent predictive content of past investment reflects the broader persistence and pro-cyclicality of economic activity. The evidence should therefore not be interpreted as establishing a causal effect of investment on growth. Rather, the combined results identify weak investment as an important feature of South Africa’s low-growth environment while showing that growth persistence itself is central to explaining short-run dynamics.
These findings have specific implications for South African economic policy. The persistence of weak growth means that restoring investment is unlikely to be sufficient if the structural conditions determining the productivity and expected return of that investment remain impaired. Policy should therefore focus not simply on raising aggregate capital expenditure, but on removing constraints that prevent investment from translating into productive capacity. Continued improvement in electricity reliability, greater efficiency and capacity in freight rail and ports, maintenance and expansion of economically productive infrastructure, and stronger municipal infrastructure delivery are particularly important. These constraints affect firms through higher operating costs, uncertainty, delayed production and weaker expected returns, thereby linking South Africa’s structural problems directly to investment decisions and productive capacity.
The distinction between the quantity and quality of investment is especially important under South Africa’s tight fiscal conditions. The results do not support indiscriminate fiscal expansion as a growth strategy. With limited fiscal space, public resources should be concentrated on infrastructure with high economic spillovers and on improving the efficiency with which existing capital budgets are executed. Greater private participation in infrastructure, appropriately structured public–private partnerships and credible regulatory frameworks can help mobilise capital without placing the entire financing burden on the public balance sheet. Similarly, continued reforms affecting Eskom and Transnet should be evaluated not only in terms of institutional performance but also by their ability to lower economy-wide costs and crowd in productive private investment.
The findings also caution against expecting monetary or fiscal stabilisation alone to reverse a slowdown that has developed over an extended period. Macroeconomic stability remains necessary for investment, but the BSTS evidence indicates that the weakening of trend growth is a longer-running phenomenon, while the BMA results show that exchange-rate conditions also retain substantial explanatory relevance. A credible growth strategy therefore requires complementarity between macroeconomic stability and structural measures that improve infrastructure reliability, policy certainty, institutional capacity and the environment for productive private capital formation.
Overall, the evidence suggests that South Africa’s growth slowdown cannot be reduced to a single determinant. It reflects a persistent deterioration in underlying growth dynamics accompanied by weak investment performance and broader structural constraints. Investment remains a particularly strong contemporaneous correlate of GDP growth, but the persistence robustness exercise demonstrates that this relationship should not be interpreted as independent causal dominance. The policy challenge is consequently broader than simply increasing investment expenditure: it is to create conditions in which sustained productive investment can raise capacity, productivity and potential growth.
The study has several limitations. BMA addresses uncertainty over the included model specifications but does not resolve endogeneity or establish causal effects, and the persistence results reinforce the need for caution in interpreting the investment-growth relationship. The candidate-variable set is intentionally parsimonious and therefore does not encompass all potential determinants of South African growth. In addition, the long historical sample encompasses substantial institutional and structural change, while the analysis does not explicitly model sectoral heterogeneity. Future research could extend the framework using structural or instrumental-variable identification, richer sets of candidate growth determinants, explicit structural-break specifications and sector-level investment and output data. Cross-country extensions could also establish whether the dynamics identified here are distinctive to South Africa or characteristic of other structurally constrained emerging-market economies.
Author Contributions
Conceptualization, K.A.S. and Z.D.-K.; methodology, K.A.S.; software, K.A.S.; validation, K.A.S. and Z.D.-K.; formal analysis, K.A.S.; investigation, K.A.S.; resources, K.A.S. and Z.D.-K.; data curation, K.A.S.; writing—original draft preparation, K.A.S.; writing—review and editing, K.A.S. and Z.D.-K.; visualization, K.A.S. and Z.D.-K.; supervision, Z.D.-K.; project administration, K.A.S.; funding acquisition, Z.D.-K. All authors have read and agreed to the published version of the manuscript.
Funding
This research received no external funding.
Institutional Review Board Statement
Not applicable.
Informed Consent Statement
Not applicable.
Data Availability Statement
Quarterly data from 1960Q1 to 2025Q3 on all the variables were obtained from South African Reserve Bank.
Acknowledgments
We acknowledge the anonymous reviewers for their rigorous comments that have tremendously improved the quality of manuscript.
Conflicts of Interest
The authors declare no conflicts of interest.
Appendix A
Table A1.
Unit-Root and Stationarity Diagnostics.
Table A2.
BMA Robustness Using the First Difference in the Interest Rate.
References
- Acemoglu, D., Johnson, S., & Robinson, J. A. (2001). The colonial origins of comparative development. American Economic Review, 91(5), 1369–1401. [Google Scholar] [CrossRef] [Scilit]
- Aghion, P., Akcigit, U., & Howitt, P. (2015). The Schumpeterian growth paradigm. Annual Review of Economics, 7(1), 557–575. [Google Scholar] [CrossRef] [Scilit]
- Aghion, P., & Howitt, P. (1992). A model of growth through creative destruction. Econometrica, 60(2), 323–351. [Google Scholar] [CrossRef] [Scilit]
- Aghion, P., Howitt, P., & Mayer-Foulkes, D. (2005). The effect of financial development on convergence. Quarterly Journal of Economics, 120(1), 173–222. [Google Scholar] [CrossRef] [Scilit]
- Aye, G. C. (2021). Effect of fiscal and monetary policies on economic activities in South Africa: The role of policy uncertainty. In 2021 conference, August 17–31, 2021, virtual (No. 314953). International Association of Agricultural Economists. [Google Scholar]
- Balcilar, M., Gupta, R., & Kisten, T. (2021). The impact of uncertainty shocks in South Africa: The role of financial regimes. Review of Financial Economics, 39(4), 442–454. [Google Scholar] [CrossRef] [Scilit]
- Barro, R. J. (1991). Economic growth in a cross section of countries. Quarterly Journal of Economics, 106(2), 407–443. [Google Scholar] [CrossRef] [Scilit]
- Barro, R. J., & Sala-i-Martin, X. (2004). Economic growth (2nd ed.). MIT Press. [Google Scholar]
- Calderón, C., & Servén, L. (2010). Infrastructure and economic development in Sub-Saharan Africa. Journal of African Economies, 19(Suppl. S1), i13–i87. [Google Scholar] [CrossRef] [Scilit]
- Calderón, C., & Servén, L. (2014). Infrastructure, growth, and inequality. World Development, 52, 102–120. [Google Scholar]
- Calitz, E., & Fourie, J. (2022). Electricity supply constraints and economic growth in South Africa. Economic Research Southern Africa. [Google Scholar]
- Eicher, T. S., Papageorgiou, C., & Raftery, A. E. (2011). Default priors and predictive performance in Bayesian model averaging. Journal of Applied Econometrics, 26(1), 30–55. [Google Scholar] [CrossRef] [Scilit]
- Enebeli, E. L., Enebeli, U. U., Dakyen, Y. J., Cherima, Y. J., Hassan, R. K., Mikailu, F., & Orya, E. E. (2026). A world bank data-driven analysis of income, investment, and sectoral change in ECOWAS economies (2000–2024). Hensard Journal of Policy, Economics and Development, 1(1), 1–18. [Google Scholar] [CrossRef] [Scilit]
- Fedderke, J. W., & Garlick, R. (2008). Infrastructure development and economic growth in South Africa: A review of the accumulated evidence. Economic Research Southern Africa (ERSA). [Google Scholar]
- Fedderke, J. W., & Simkins, C. (2012). Economic growth in South Africa since the late nineteenth century. Journal of Economic Surveys, 26(2), 176–208. [Google Scholar]
- Fernández, C., Ley, E., & Steel, M. F. J. (2001). Model uncertainty in cross-country growth regressions. Journal of Applied Econometrics, 16(5), 563–576. [Google Scholar] [CrossRef] [Scilit]
- Fosu, A. K. (2013). Growth of African economies: Productivity, policy syndromes and the importance of institutions. Journal of African Economies, 22(4), 523–551. [Google Scholar] [CrossRef] [Scilit]
- Hoeting, J. A., Madigan, D., Raftery, A. E., & Volinsky, C. T. (1999). Bayesian model averaging: A tutorial. Statistical Science, 14(4), 382–417. [Google Scholar] [CrossRef] [Scilit]
- IMF. (2023). South Africa: 2023 article IV consultation—Press release; staff report; and statement by the executive director for South Africa. International Monetary Fund. [Google Scholar]
- International Monetary Fund (IMF). (2025). South Africa: Selected issues. International Monetary Fund. [Google Scholar]
- Janse van Rensburg, T., & Morema, K. (2023). Potential growth in South Africa: Estimates and determinants. South African Reserve Bank. [Google Scholar]
- Kumo, W. L. (2012). Infrastructure investment and economic growth in South Africa: A granger causality analysis. African Development Bank. [Google Scholar]
- Loewald, C., Faulkner, D., & Makrelov, K. (2020). Time consistency and economic growth: A case study of South African macroeconomic policy: Working Paper 842 (ERSA Working Paper Series). Economic Research Southern Africa. [Google Scholar]
- Lucas, R. E., Jr. (1988). On the mechanics of economic development. Journal of Monetary Economics, 22(1), 3–42. [Google Scholar] [CrossRef] [Scilit]
- Mankiw, N. G., Romer, D., & Weil, D. N. (1992). A contribution to the empirics of economic growth. Quarterly Journal of Economics, 107(2), 407–437. [Google Scholar] [CrossRef] [Scilit] [PubMed]
- Mavundla, A., Nyati, M. C., & Msomi, S. (2025). The coordination of monetary–Fiscal policy in South Africa. Economies, 13(10), 280. [Google Scholar] [CrossRef] [Scilit]
- Medici, A., Li, E., Tavares, M. M. M., Kim, M. T., & Meyer-Cirkel, A. (2025). Growth benefits of macro-structural reforms in South Africa. International Monetary Fund. [Google Scholar]
- Moral-Benito, E. (2015). Model averaging in economics: An overview. Journal of Economic Surveys, 29(1), 46–75. [Google Scholar] [CrossRef] [Scilit]
- National Treasury. (2024). Macroeconomic policy: A review of trends and choices. Government of South Africa. Available online: https://www.treasury.gov.za/documents/national%20budget/2024/Macroeconomic%20Policy%20Review.pdf (accessed on 23 May 2026).
- Organisation for Economic Co-operation and Development (OECD). (2025). OECD economic surveys: South Africa 2025. OECD Publishing. Available online: https://www.oecd.org/en/publications/oecd-economic-surveys-south-africa-2025_7e6a132a-en.html (accessed on 23 May 2026).
- Phahlamohlaka, T., & Buthelezi, E. M. (2025). Breaking the inflation ceiling: Analysing monetary policy responses to inflation breaches in South Africa. Scientific African, 30, e03031. [Google Scholar] [CrossRef] [Scilit]
- Raftery, A. E., Madigan, D., & Hoeting, J. A. (1997). Bayesian model averaging for linear regression models. Journal of the American Statistical Association, 92(437), 179–191. [Google Scholar] [CrossRef]
- Reuters. (2025, May 5). South Africa’s infrastructure and power constraints continue to weigh on economic growth. Reuters News. Available online: https://www.reuters.com/business/energy/south-africas-eskom-aiming-no-power-cuts-next-four-months-2025-05-05/ (accessed on 15 March 2026).
- Reuters. (2026, March 10). South Africa faces persistent logistics and electricity bottlenecks despite reform efforts. Reuters News. Available online: https://www.reuters.com/world/africa/south-africas-economy-grows-04-qq-fourth-quarter-2026-03-10/ (accessed on 15 March 2026).
- Rodrik, D. (2008). Understanding South Africa’s economic puzzles. Economics of Transition, 16(4), 769–797. [Google Scholar] [CrossRef] [Scilit]
- Romer, P. M. (1986). Increasing returns and long-run growth. Journal of Political Economy, 94(5), 1002–1037. [Google Scholar] [CrossRef] [Scilit] [PubMed]
- Romer, P. M. (1990). Endogenous technological change. Journal of Political Economy, 98(5), S71–S102. [Google Scholar] [CrossRef] [Scilit] [PubMed]
- Sala-i-Martin, X., Doppelhofer, G., & Miller, R. I. (2004). Determinants of long-term growth: A Bayesian averaging of classical estimates (BACE) approach. American Economic Review, 94(4), 813–835. [Google Scholar] [CrossRef] [Scilit]
- Scott, S. L., & Varian, H. R. (2014). Predicting the present with Bayesian structural time series. International Journal of Mathematical Modelling and Numerical Optimisation, 5(1–2), 4–23. [Google Scholar] [CrossRef] [Scilit]
- Solow, R. M. (1956). A contribution to the theory of economic growth. Quarterly Journal of Economics, 70(1), 65–94. [Google Scholar] [CrossRef] [Scilit]
- South African Reserve Bank (SARB). (2023). Quarterly bulletin. South African Reserve Bank. [Google Scholar]
- South African Reserve Bank (SARB). (2024). Quarterly bulletin. South African Reserve Bank. [Google Scholar]
- South African Reserve Bank (SARB). (2025). Quarterly bulletin. South African Reserve Bank. [Google Scholar]
- Tayeng, T., Assumi, K. H., Khaiyum, S., Amin, R., Shah, P., Chandratreya, A., & Dhote, S. (2024). Infrastructure financing and economic growth in emerging markets. Journal of Infrastructure Policy and Development, 8(15), 9560. [Google Scholar] [CrossRef] [Scilit]
- World Bank. (2024). Global economic prospects: Sub-Saharan Africa. World Bank. [Google Scholar]
- Zeugner, S., & Feldkircher, M. (2009). Benchmark priors revisited: On adaptive shrinkage and the supermodel effect in Bayesian model averaging. International Monetary Fund. [Google Scholar]
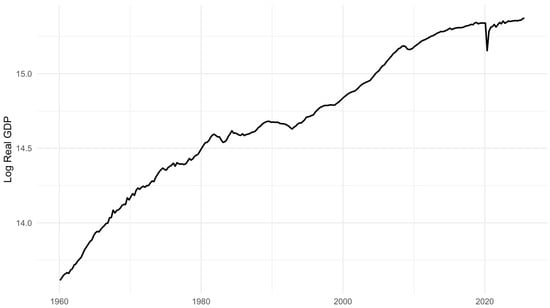
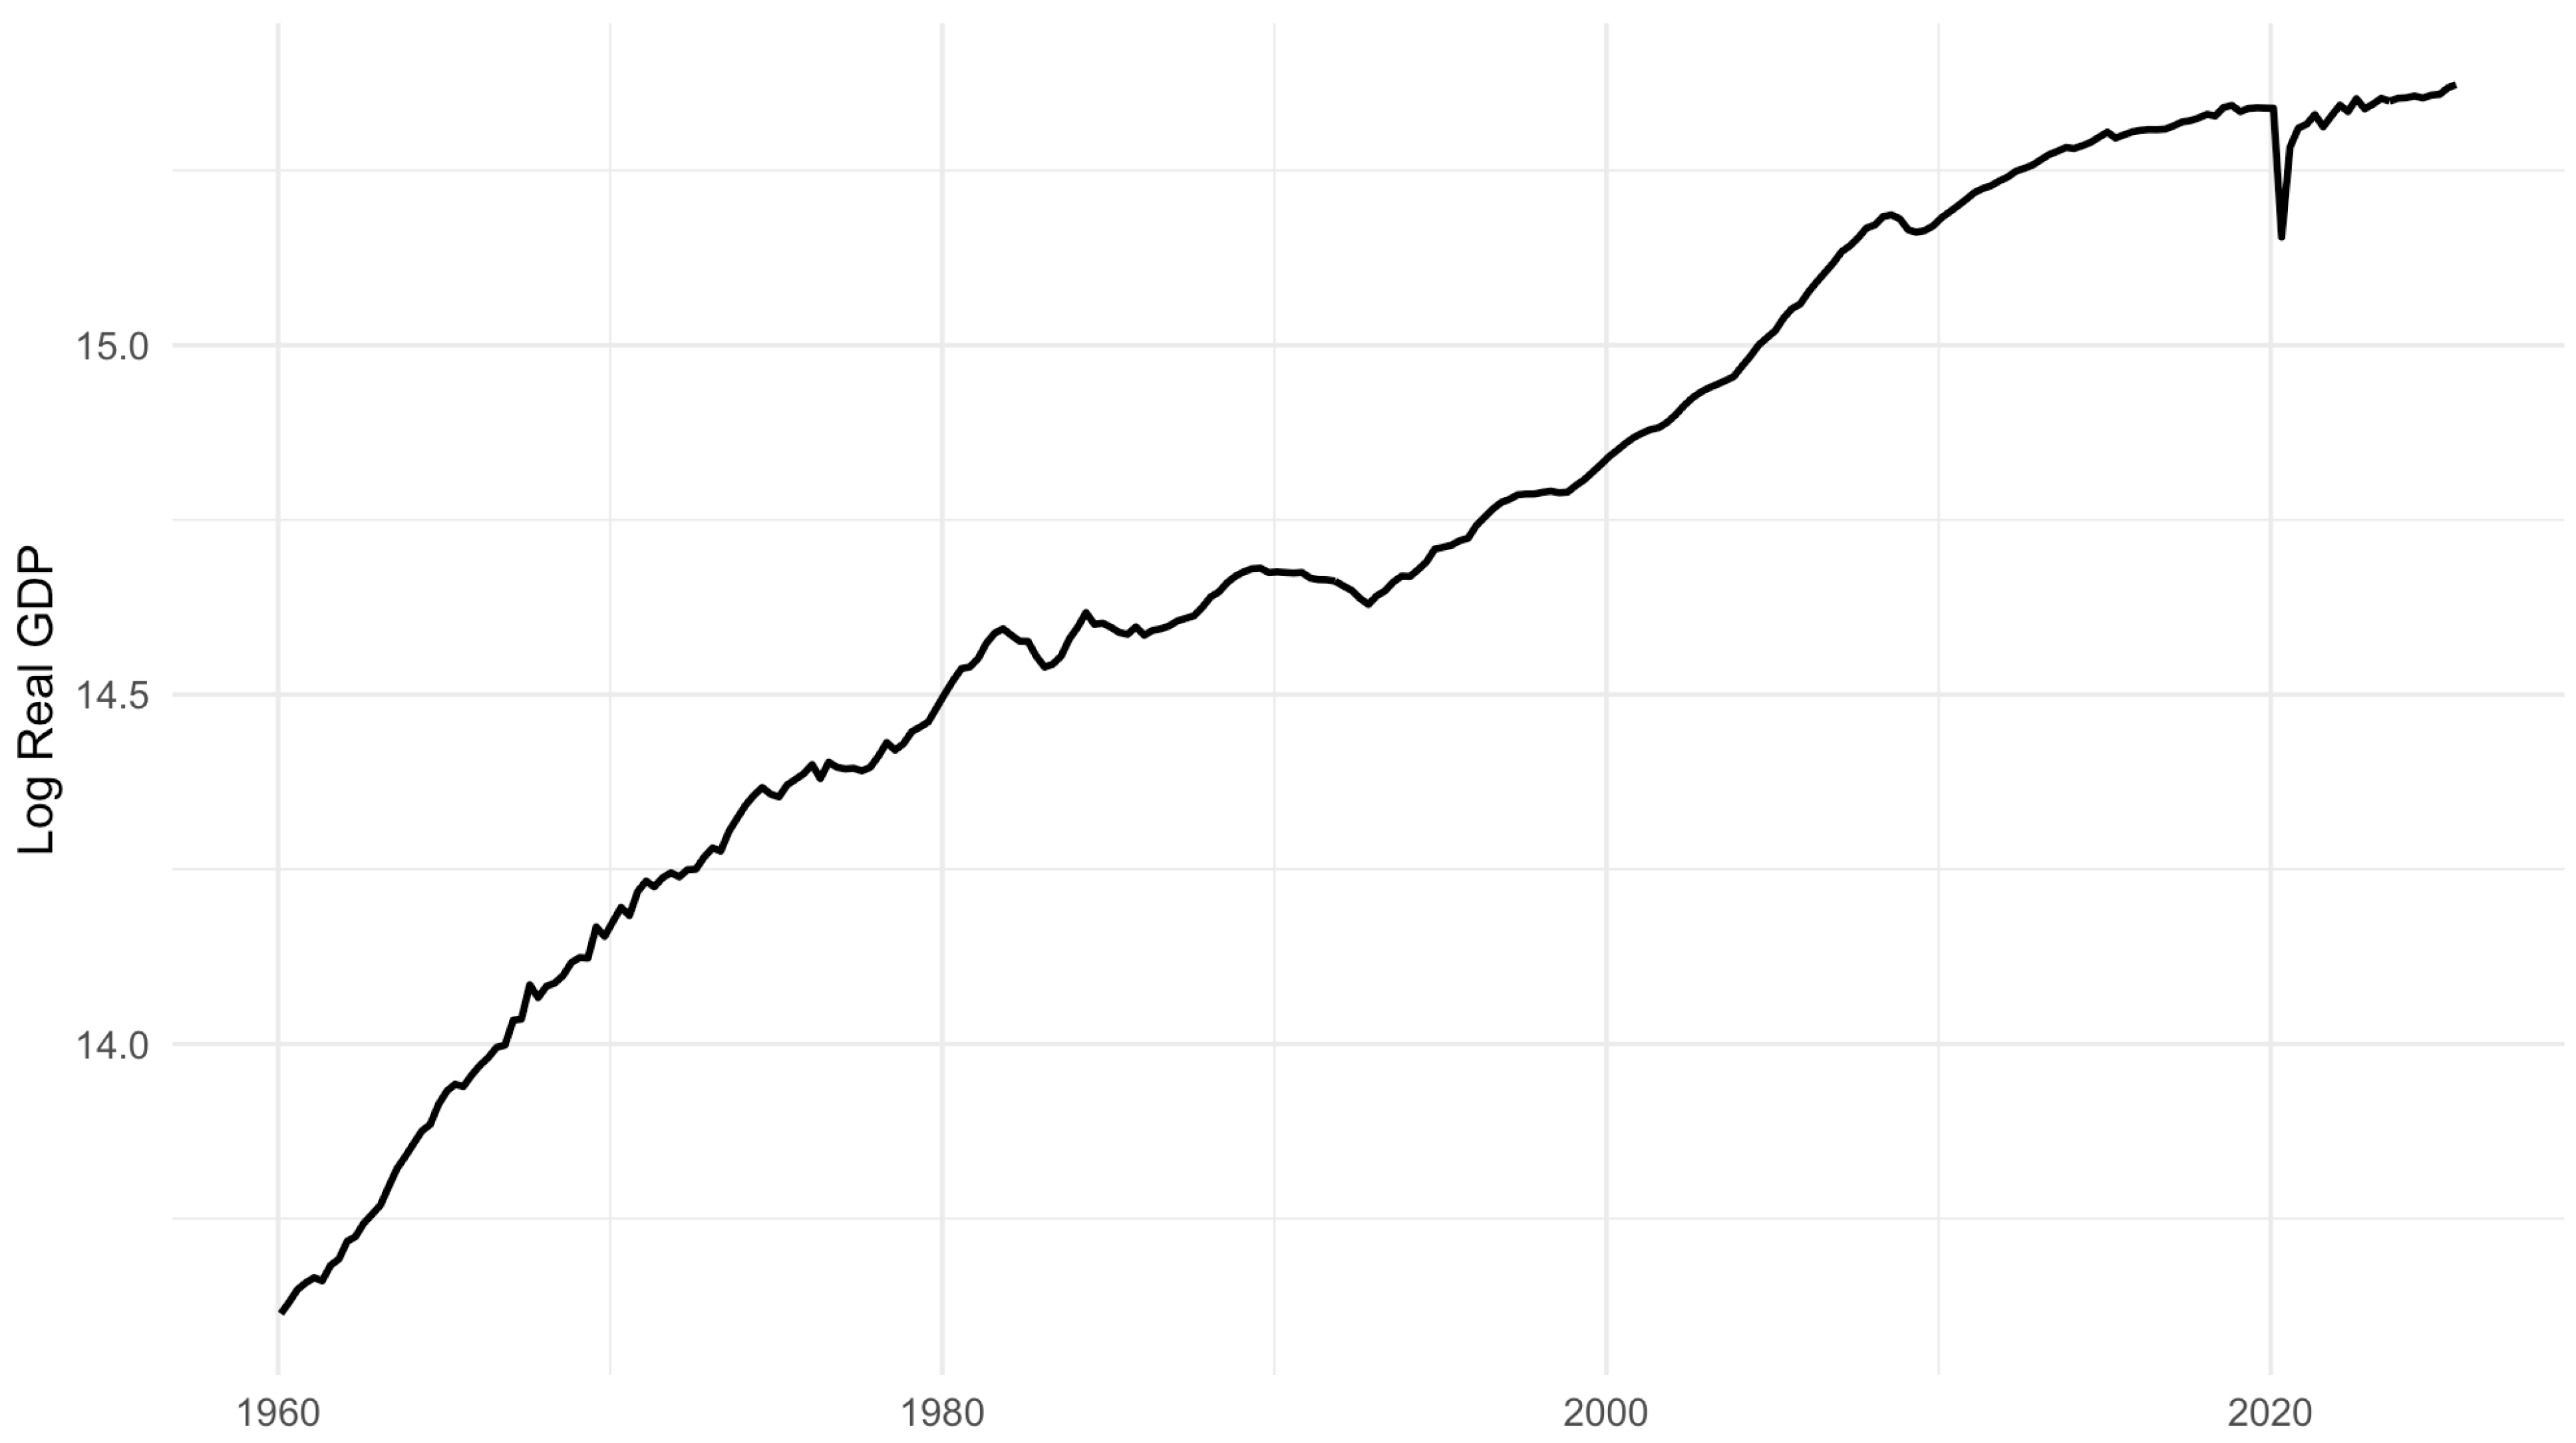
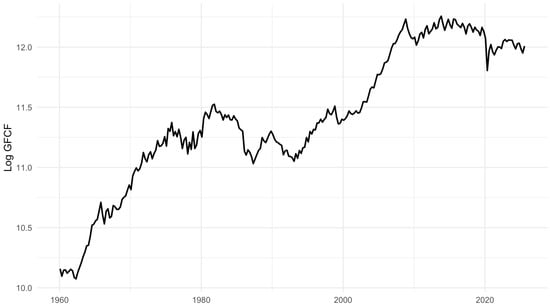
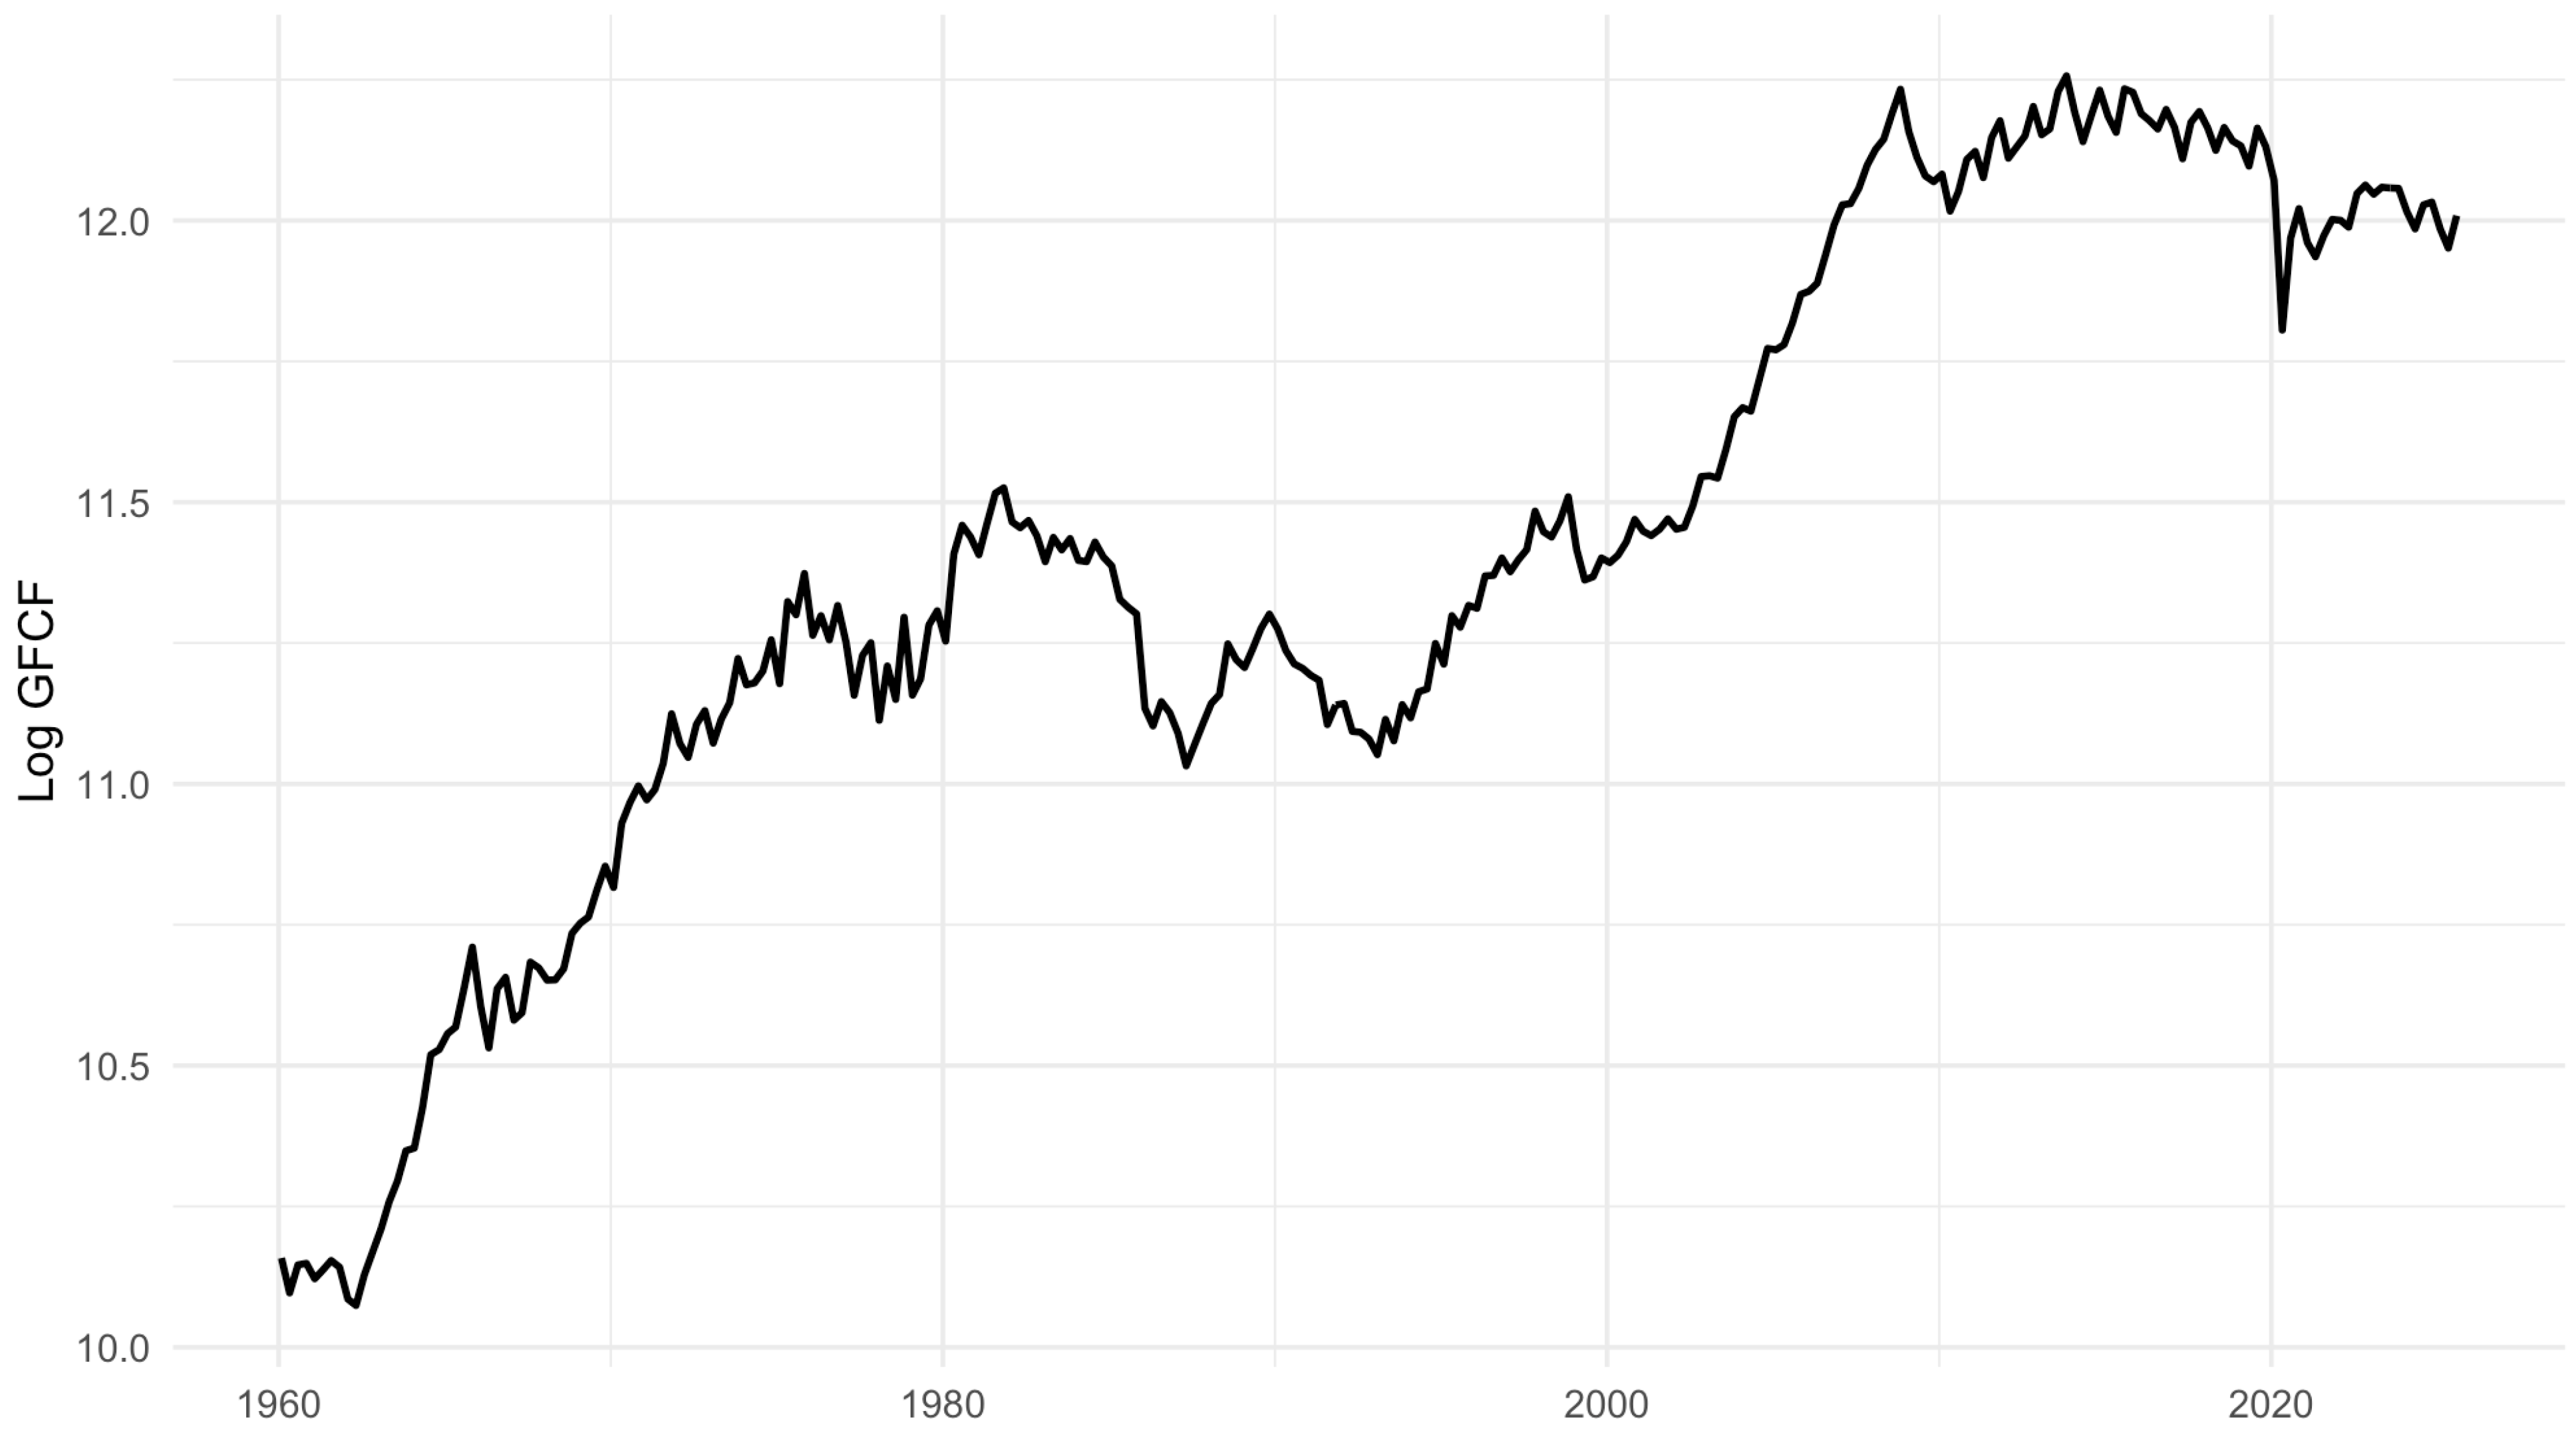
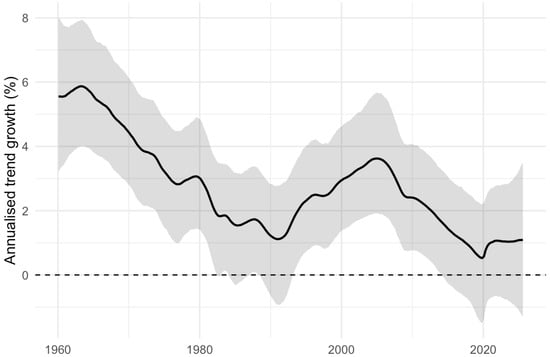
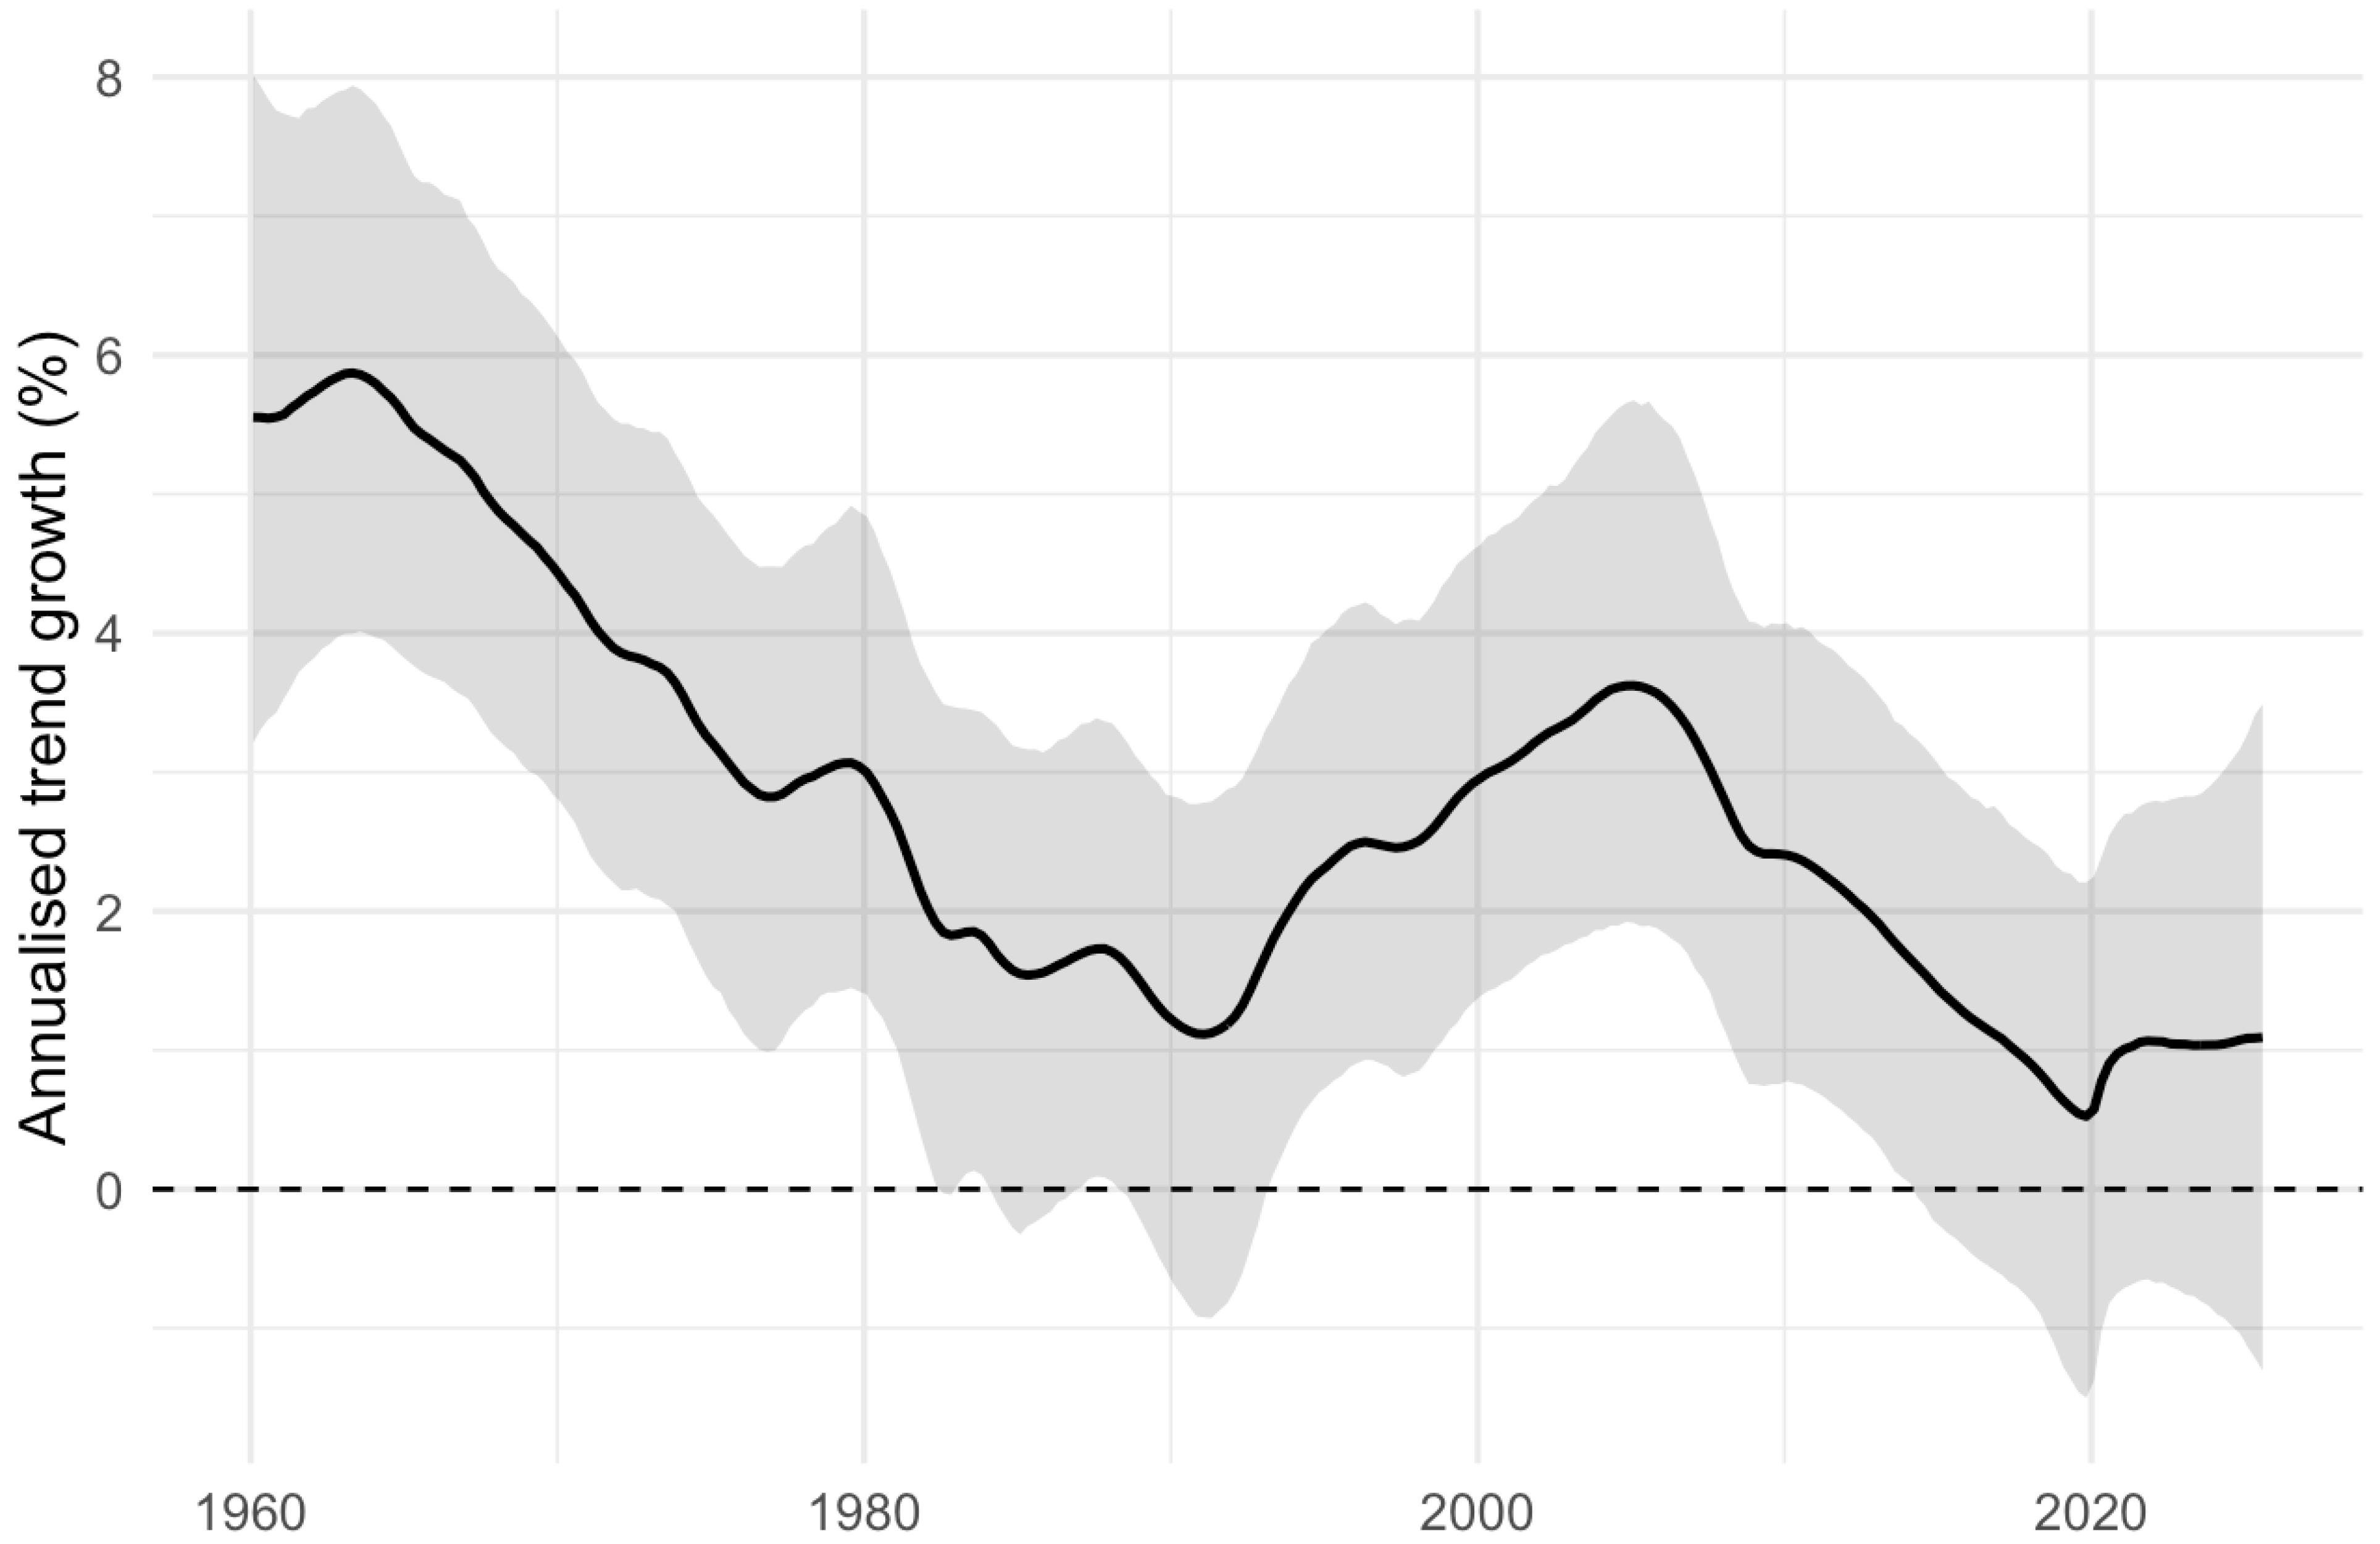
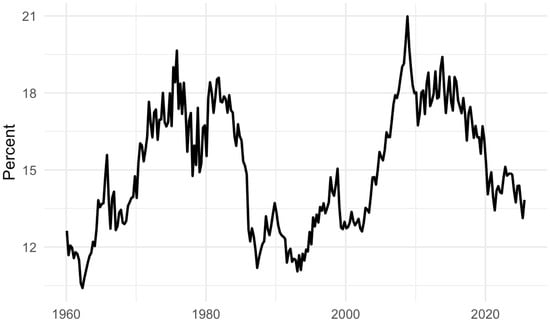
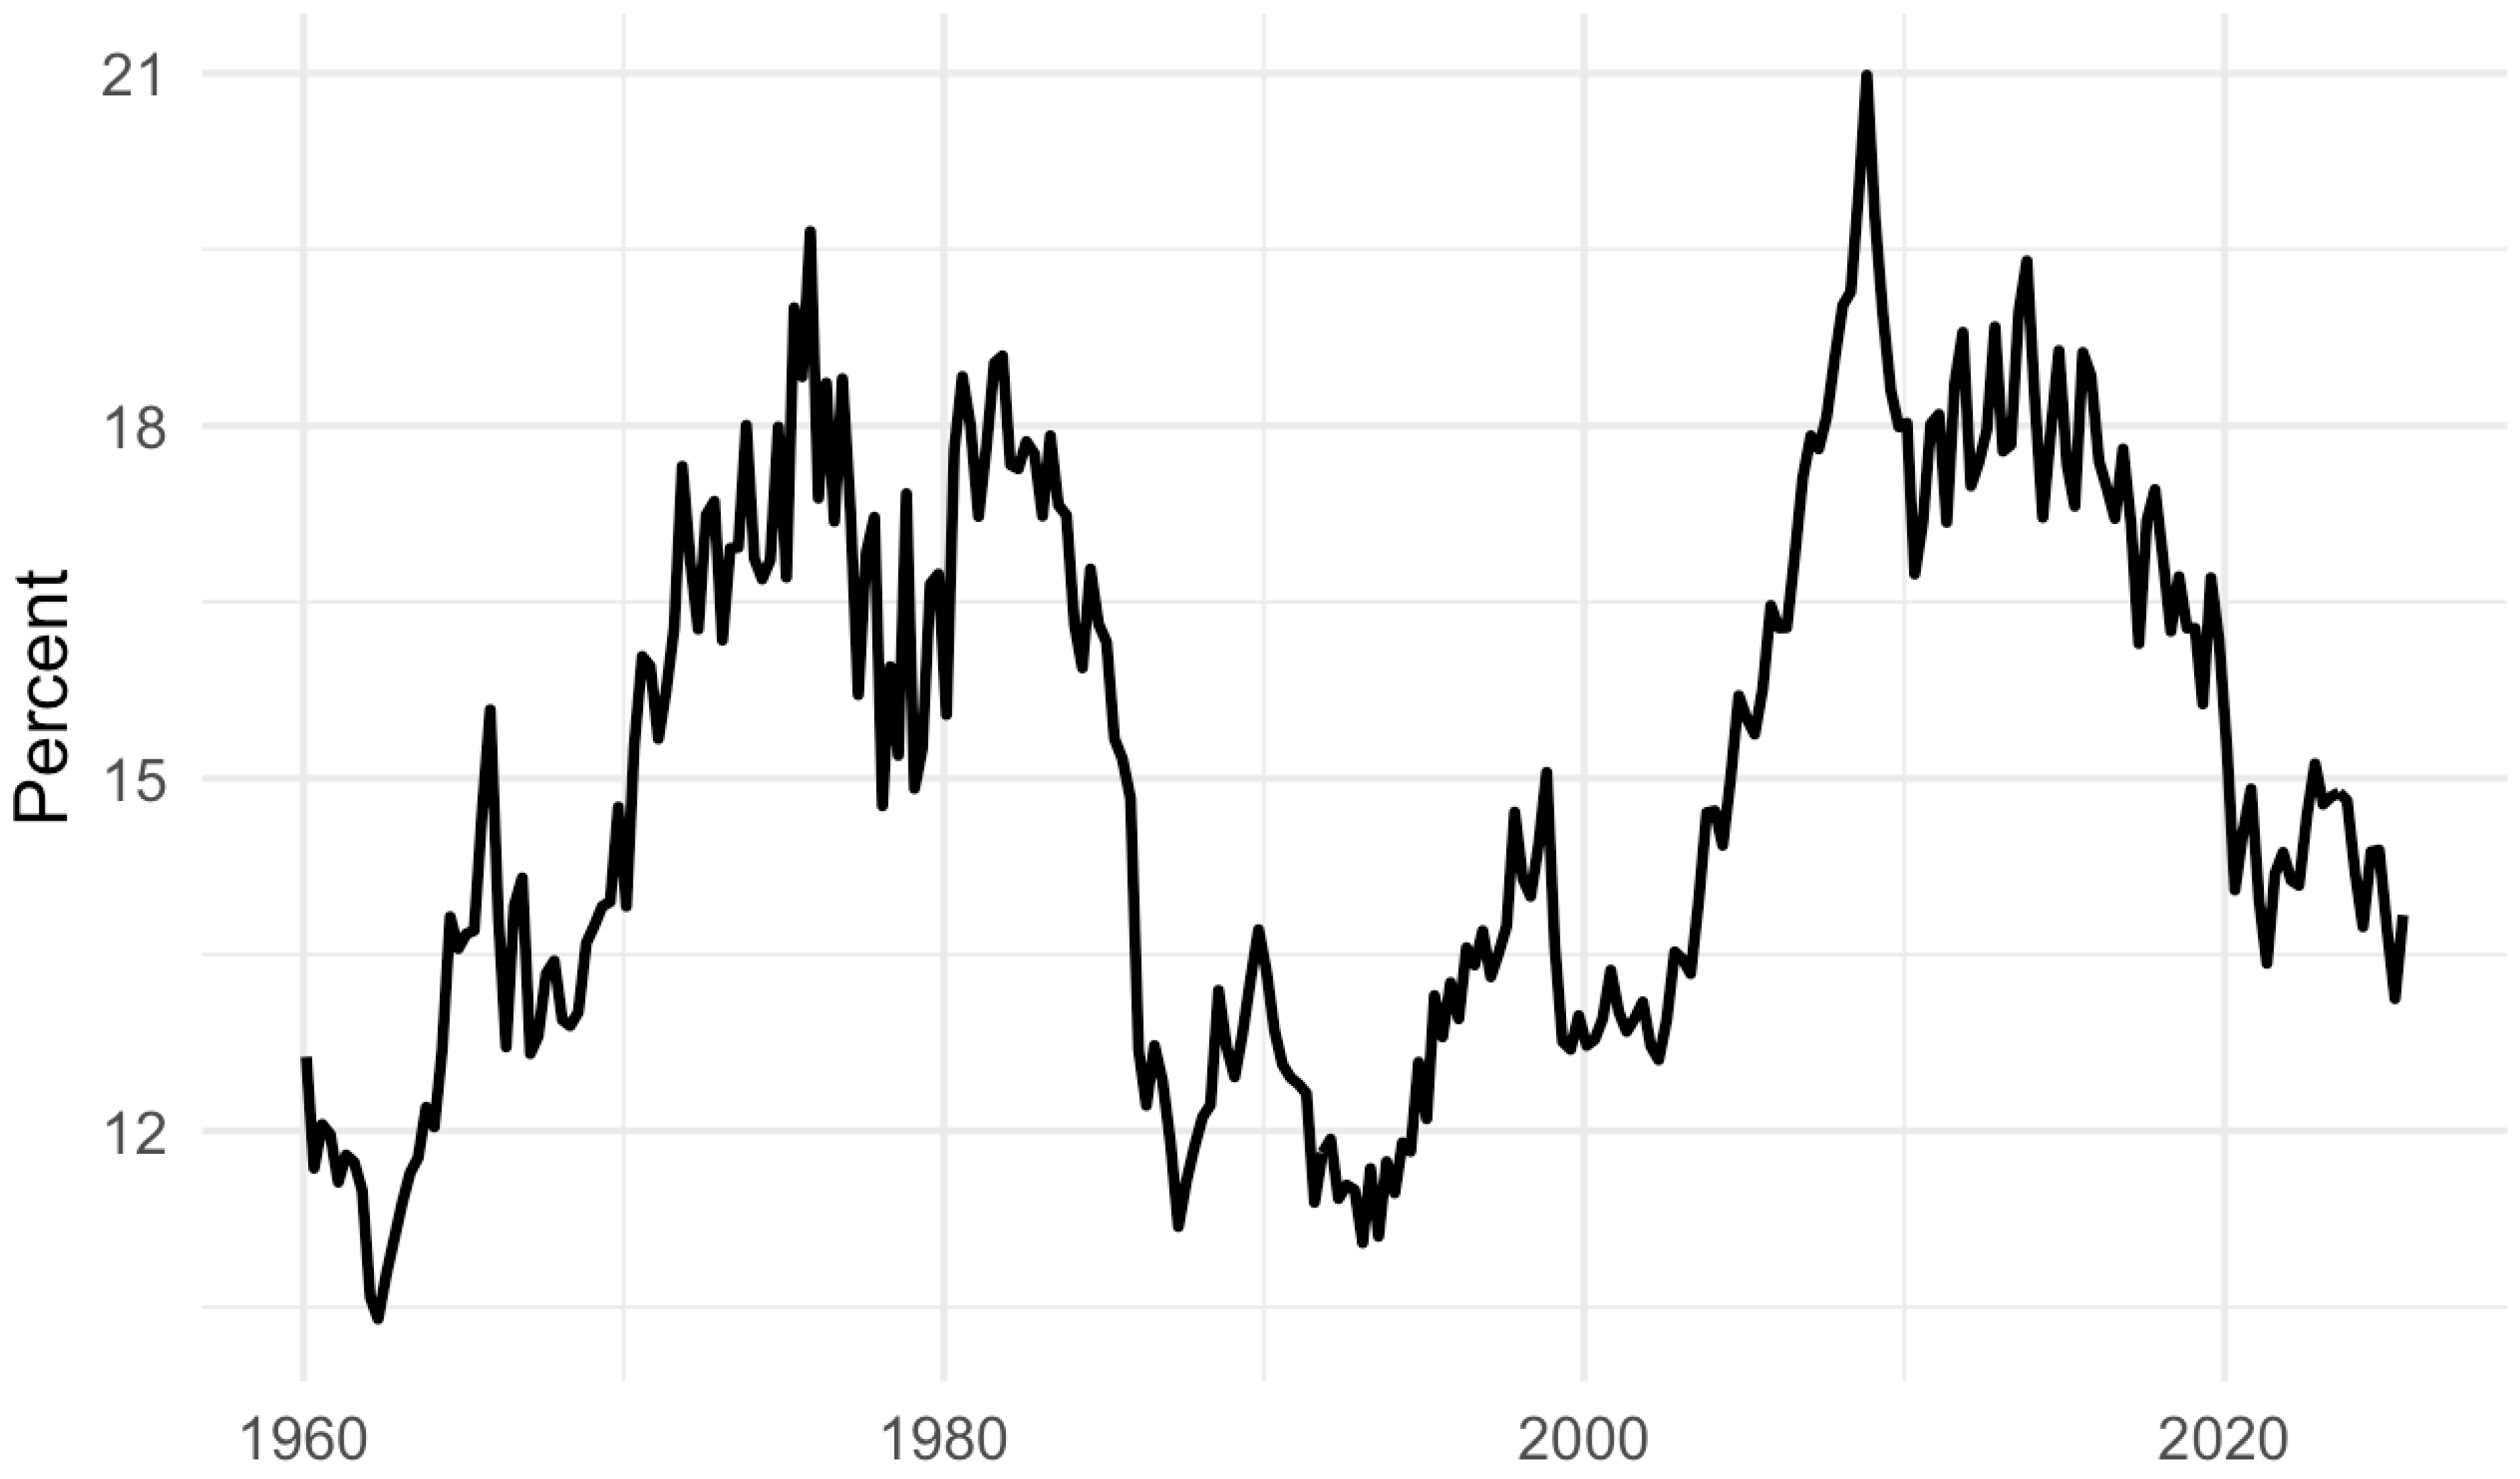
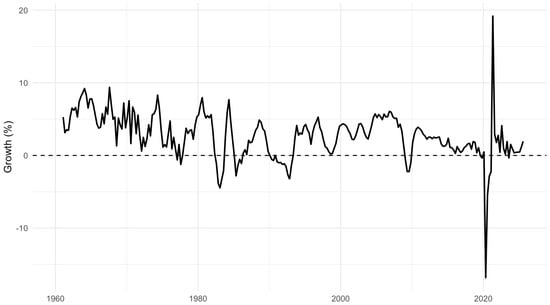
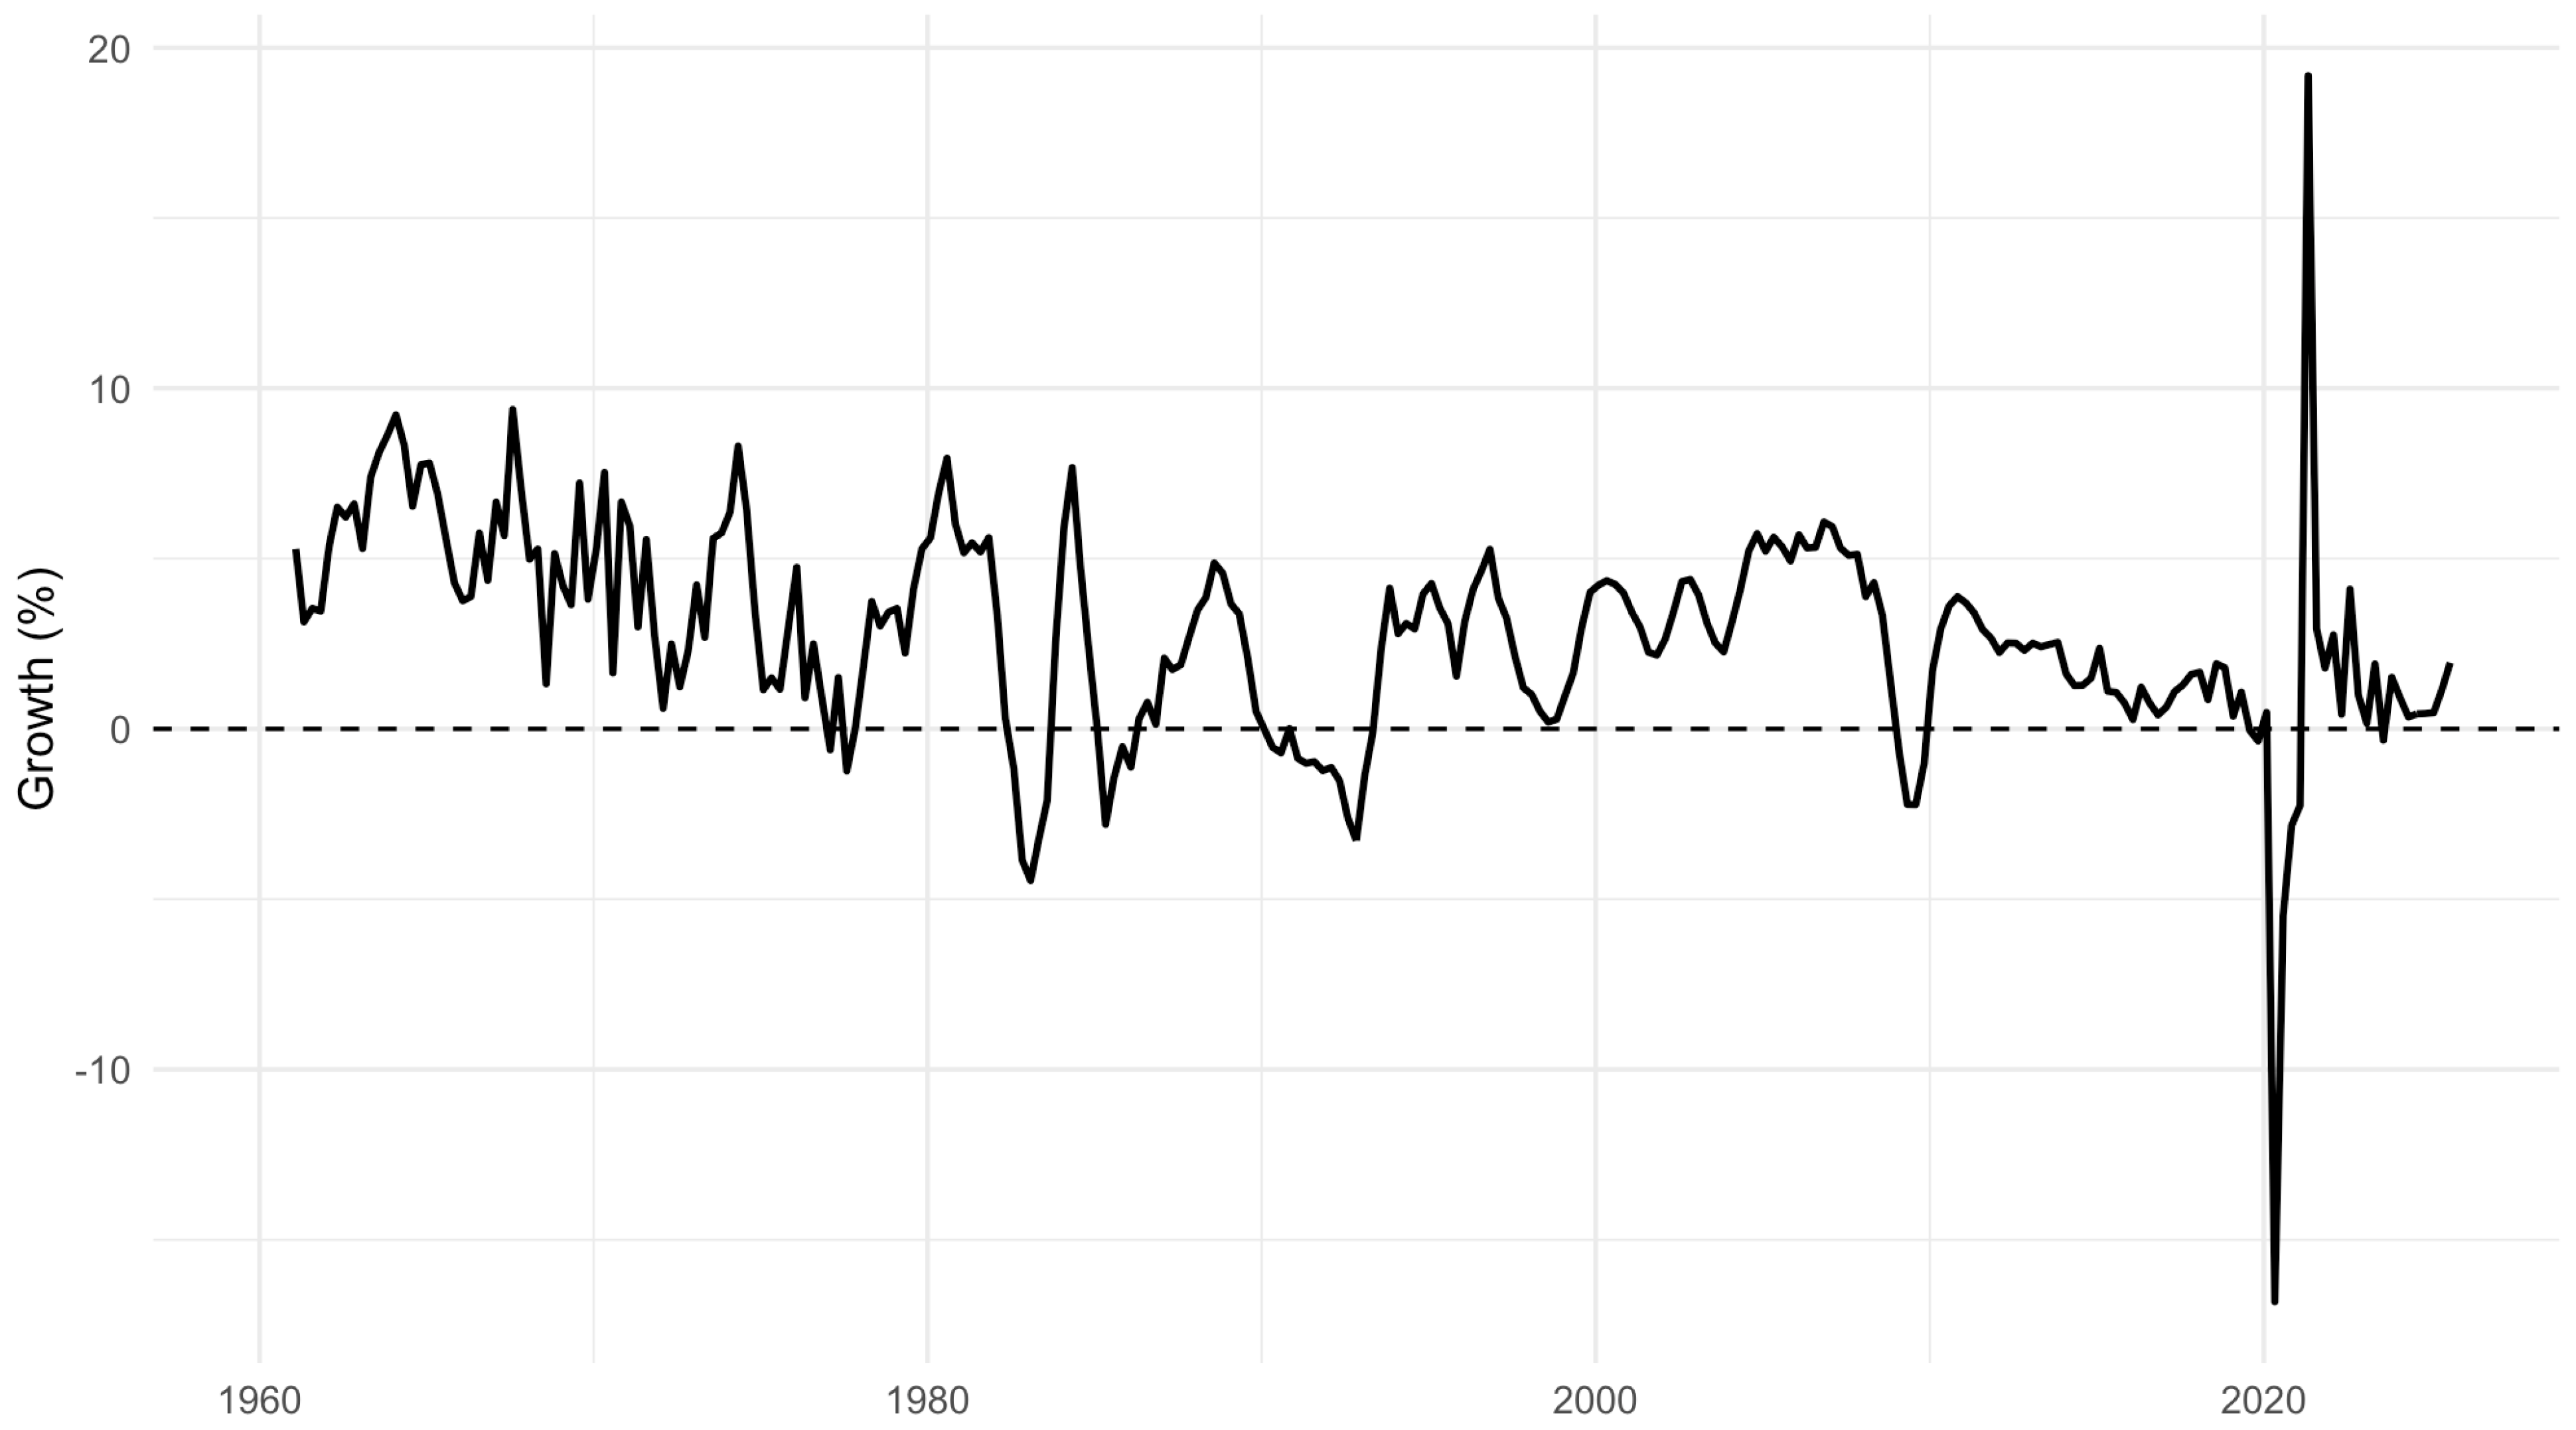
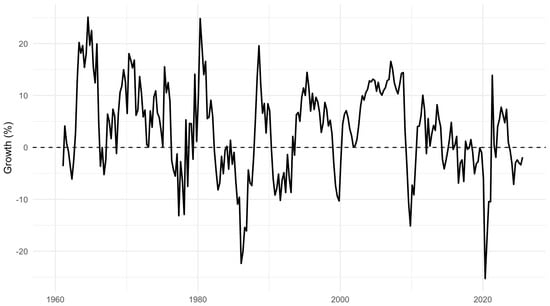
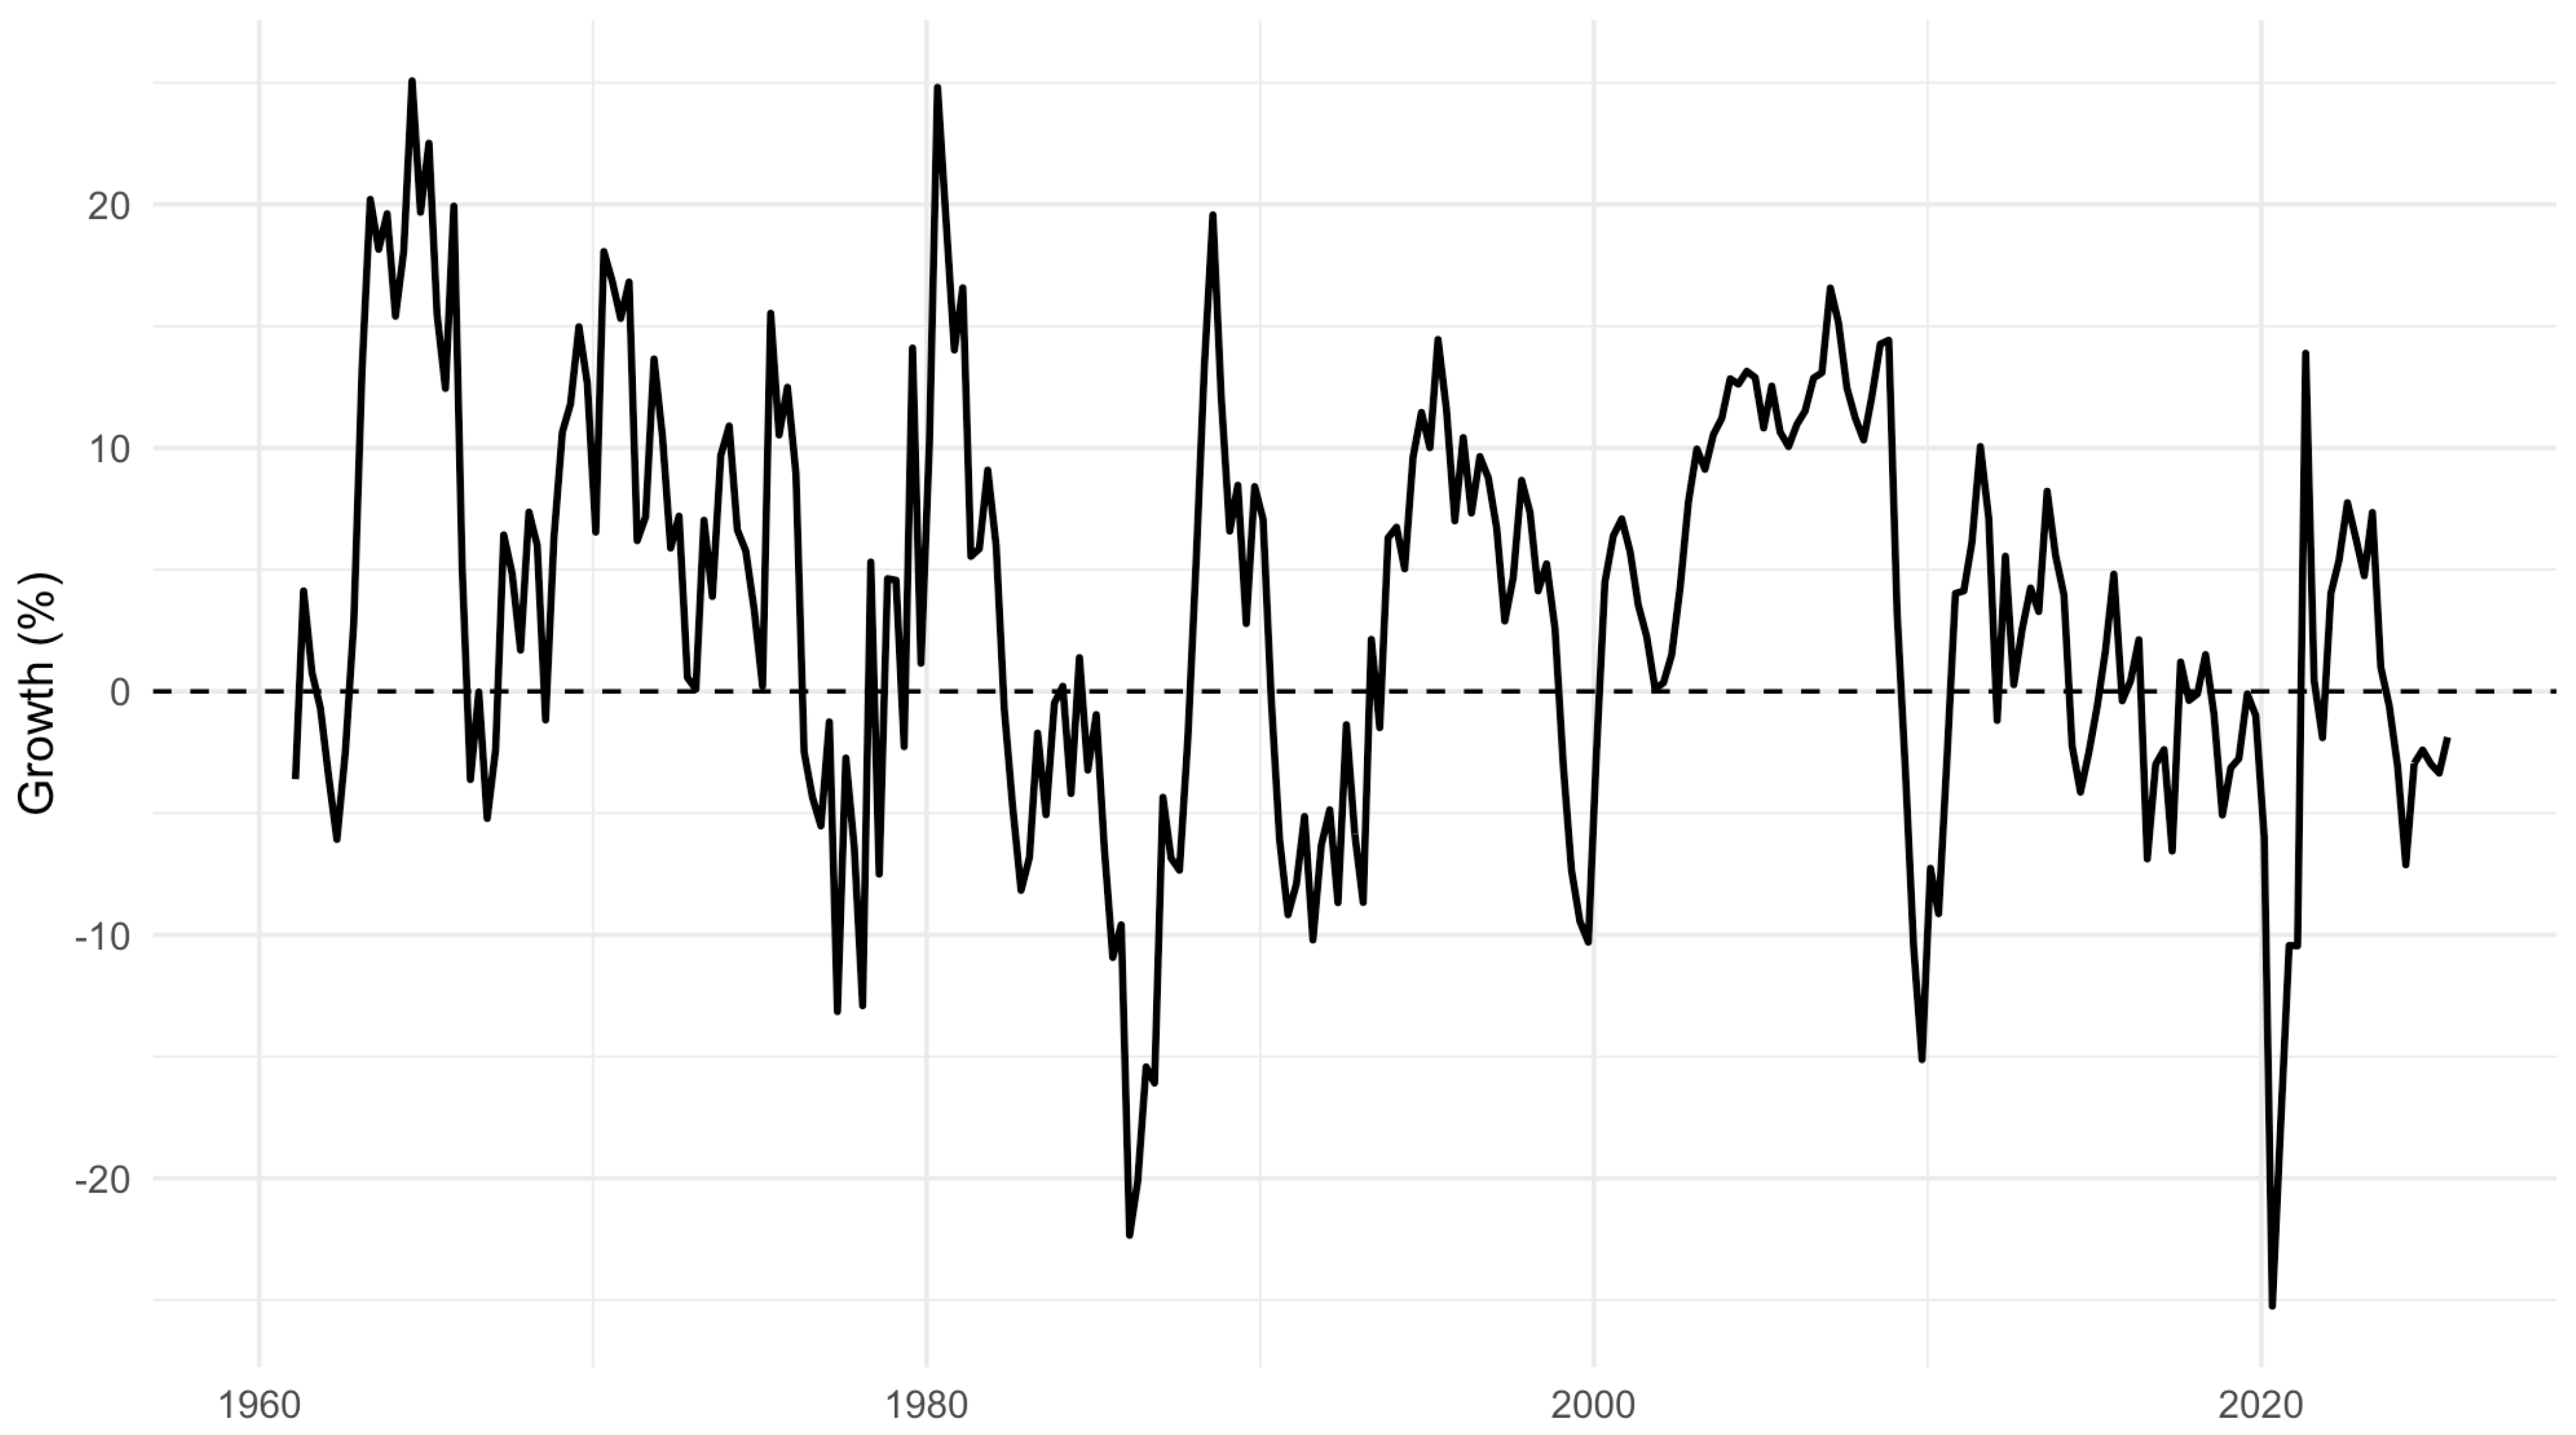
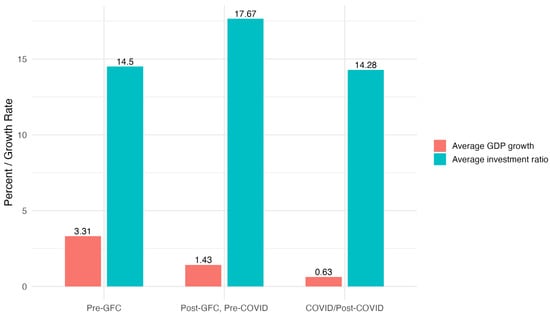
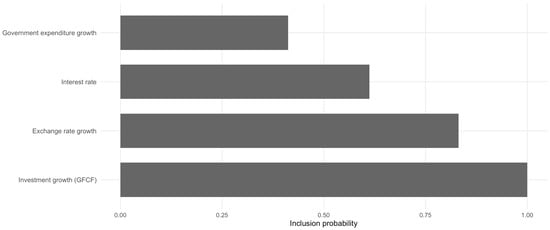
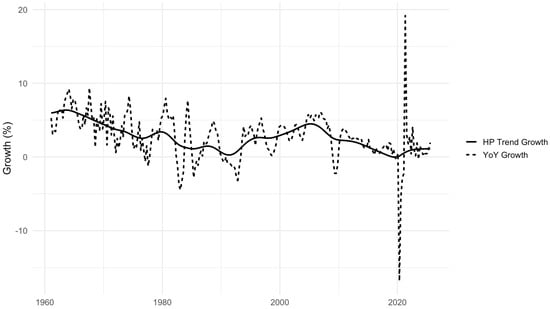
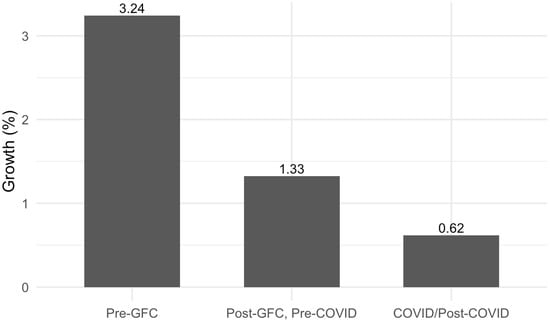
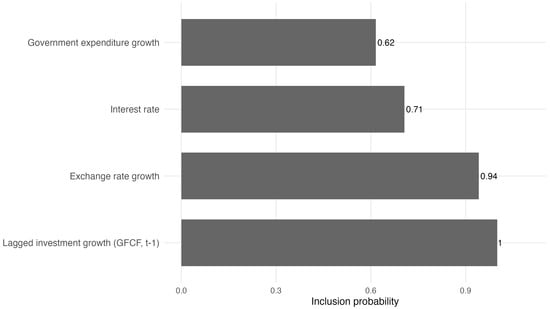
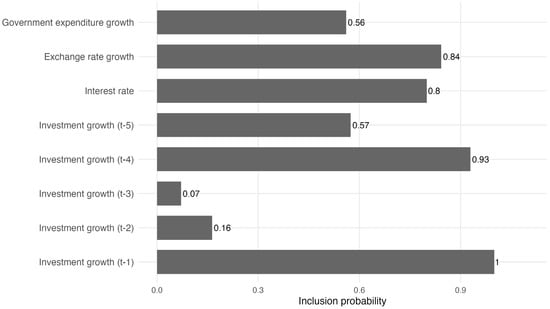

Disclaimer/Publisher’s Note: The statements, opinions and data contained in all publications are solely those of the individual author(s) and contributor(s) and not of MDPI and/or the editor(s). MDPI and/or the editor(s) disclaim responsibility for any injury to people or property resulting from any ideas, methods, instructions or products referred to in the content. |
© 2026 by the authors. Licensee MDPI, Basel, Switzerland. This article is an open access article distributed under the terms and conditions of the Creative Commons Attribution (CC BY) license.