


Abstract
Following the formal implementation of the Environmental Protection Tax Law of the People’s Republic of China in 2018, debate has persisted regarding its policy effectiveness, particularly concerning its impact on carbon emissions. In the context of the ‘dual carbon’ targets, accurately evaluating the emission-reduction effects of the environmental protection tax is of considerable policy significance. This study treats the 2018 transition from pollution discharge fees to the environmental protection tax (hereinafter referred to as the ‘fee-to-tax reform’) as a quasi-natural experiment. Utilising provincial-level panel data from China spanning 2007 to 2022, and employing TWFE, DID, and SDM-DID models, the analysis comprehensively assesses the impact of the fee-to-tax reform on per capita carbon emissions and carbon emissions intensity. The findings indicate that the transition from pollution discharge fees to the environmental protection tax significantly curbed the growth of both carbon emissions and carbon emission intensity; this result remains robust across a series of sensitivity tests. Heterogeneity analysis demonstrates that regions with a higher degree of ‘greening’ in their tax systems experience more pronounced reductions in carbon emissions. Further spatial econometric analysis reveals that while the environmental protection tax effectively curbs local carbon emissions, it may also increase the risk of ‘carbon leakage’ to neighbouring regions. These results provide empirical evidence and policy guidance to refine the design of environmental tax systems and promote coordinated regional carbon emissions reductions.
1. Introduction
As the world’s largest developing country and carbon emitter, China faces the dual pressures of economic development and environmental protection. In recent years, the Chinese government has made slowing the growth of carbon emissions and protecting the ecological environment key priorities of its national strategy. In September 2020, the Chinese government solemnly announced at the United Nations General Assembly that China would reach peak carbon emissions by 2030 and achieve carbon neutrality by 2060. Subsequently, the state clarified that it would prioritise controlling fossil fuel consumption and gradually transition to a ‘dual-control’ system that governs both the total volume and the intensity of carbon emissions. This strategic shift marks a critical phase in China’s ecological civilisation efforts, characterised by a focus on carbon reduction and the promotion of synergies between pollution control and carbon reduction.
However, achieving the ‘dual carbon’ targets is a formidable and systematic undertaking. As 2026 marks the first year of China’s full transition from dual control of energy consumption to dual control of carbon emissions, it signifies that assessment indicators will shift from merely total energy consumption and intensity to direct constraints on carbon emissions. Whilst this transition affords greater scope for the development of non-fossil energy sources, it also imposes more precise regulatory requirements on the transformation of high-carbon industries. Beyond administrative measures, how to use market-based environmental regulatory tools to achieve carbon-reduction targets at lower socio-economic cost has become a focal point for both the academic community and policymakers.
As China’s first standalone tax law embodying the concept of a ‘green tax system’, the Environmental Protection Tax is a typical form of mandatory environmental regulation designed to address environmental pollution. Its core logic lies in internalising the external costs of environmental pollution through the ‘Pigouvian tax’ principle, thereby curbing emissions by directly intervening in the polluting behaviour of economic entities. The implementation of the Environmental Protection Tax has contributed to reduced emissions of key pollutants (Ma, 2022). Although the tax has indeed reduced emissions of major pollutants, issues such as incomplete coverage of pollutant categories and a lack of proactive reviews of tax rates persist (H. Chen et al., 2021). Whilst the Environmental Protection Tax has had a significant mitigating effect on air pollutants, heterogeneity exists across regions due to differences in taxation standards (Deng et al., 2022). The levying of the environmental protection tax has a significant promotional effect on enterprises’ green development at the source. Still, the promotional effect at the end-of-pipe stage is not pronounced (P. Wang et al., 2022).
A study of emissions in G7 countries between 1991 and 2017 found that environmental taxes can reduce carbon dioxide emissions (Hao et al., 2021), whilst a study of environmental taxes in 29 OECD economies between 1994 and 2018, focusing on their impact on reducing energy consumption and energy intensity, found that environmental taxes help to control overall energy consumption and improve energy efficiency (Bashir et al., 2021). An analysis of European Union data covering the period from 1995 to 2019 revealed that increasing environmental taxes can encourage EU member states to transition towards a more low-carbon economy (Dogan et al., 2023). Extensive research across OECD countries suggests that the impact of environmental taxes on low-carbon development is stronger than that of improvements in green technology (Yasmeen et al., 2023). Although tax policies can have a significant direct impact on traditional energy industries and energy-intensive sectors, China has maintained a cautious stance regarding tax policies related to low-carbon development (S. Chen & Li, 2023). Based on the current environmental protection tax, simulations with a dynamic CGE model examining higher tax rates have shown that the higher the tax rate, the greater the reduction in carbon dioxide emissions in Jiangsu Province (J. Wang et al., 2023). At present, the tax items under China’s environmental protection tax do not directly cover carbon emissions; consequently, there is still relatively little research on the tax’s direct impact on carbon emissions.
In light of the aforementioned research gaps, this paper utilises panel data from 30 Chinese provinces covering the period 2006–2021 to construct a difference-in-differences (DID) model and a spatial difference-in-differences (SDM-DID) model, thereby systematically evaluating the impact of the environmental protection tax on carbon emissions and its spatial spillover characteristics. In terms of the policy treatment variable, this paper not only considers the general shock resulting from the implementation of the Environmental Protection Tax Law (did1), but also further distinguishes the differences in the magnitude of tax rate increases across provinces (did2), to capture the heterogeneous effects of the degree of ‘greening’ of the tax system. In the spatial dimension, this paper constructs a neighbouring-space weight matrix and, through a series of spatial autocorrelation and model selection tests, identifies the direct emission-reduction effects and spatial spillover effects of the environmental protection tax policy, and decomposes these effects to examine the risk of ‘carbon leakage’. The marginal contributions of this paper are primarily reflected in three aspects: firstly, by extending the research perspective from traditional pollutants to carbon emissions, it enriches the dimensions for assessing the effects of environmental protection tax policies and provides empirical support for tax system optimization under the ‘dual carbon’ targets; secondly, by introducing a spatial analysis framework to reveal the spatial spillover mechanisms of the policy, it addresses the shortcoming in the existing literature regarding insufficient attention to spatial effects; third, by combining a difference-in-differences design with spatial econometric methods, the study effectively addresses the issues of policy endogeneity and spatial dependence, thereby enhancing the credibility of causal identification and providing a theoretical basis for the formulation of regional collaborative emission reduction policies.
2. Methodology
2.1. Model Design
2.1.1. STIRPAT Model
The IPAT model emerged around 1970. It analyses the factors influencing environmental change by breaking down environmental impact factors into population size (P), level of economic development (A), and level of technology (T). The specific formula is as follows:
The IPAT model has certain limitations in research. In the IPAT model, changes in the three influencing factors (population, economy and technology) and the environment occur proportionally. Although this reflects, to a certain extent, the impact of population, economy and technology on the environment, in reality the impact of these factors on the environment is not proportional. To reflect the impact of population, economy and technology on the environment more accurately, the STIRPAT model was developed as a further refinement of the IPAT model. The STIRPAT model incorporates the three main influencing factors of population, economy and technology, as shown below:
Taking the natural logarithm of both sides of Equation (2) yields:
2.1.2. Difference-in-Differences Model (DID)
China’s environmental protection tax was introduced as a direct replacement for the pollution discharge fee and came into effect nationwide on 1 January 2018. As the net policy effect is offset in the classic DID model, this paper draws on the approach adopted by Wu et al. (2024) to extend the DID model using the STIRPAT model. The basic model is as follows:
In Equation (1), ci represents carbon emission intensity; pce represents per capita carbon emissions; represents policy dummy, equals 1 if province i raised its collection standard in year t (post-2018), else 0; and represents Policy intensity dummy, equals 1 if province i’s tax rate is above the national median in year t, else 0. represents a vector of control variables comprising urbanisation rate (), GDP per capita (), energy structure (), industrial structure (), technological innovation (), openness (), and infrastructure ().
2.1.3. Spatial Difference-in-Differences Model
The DID model requires the assumption of stability of individual treatment effects to hold; the scope of the policy’s impact is limited to the experimental group, whilst the control group remains unaffected by the policy. China’s environmental protection tax does not have a uniform tax rate across the country; this means that differences in tax rates between provinces may affect neighbouring regions, leading either to a reduction in pollutant emissions or to the displacement of pollution. Consequently, the policy may indirectly affect the control group, resulting in bias in the evaluation of the policy’s effectiveness.
2.2. Variable Selection
2.2.1. The Dependent Variable
The dependent variables in this paper are carbon emission intensity (ci) and per capita carbon emissions (pce). Carbon emission intensity is defined as the ratio of a region’s total carbon emissions to its GDP, whilst per capita carbon emissions is defined as the ratio of a region’s total carbon emissions to its population. The total carbon emissions for a region are calculated as the total consumption of fossil fuels in that region, as per the following formula:
Among them, CE represents the total carbon emissions resulting from regional energy consumption; represents the physical volume of energy consumption of type i, which includes the physical volumes of fossil fuel, electricity and heat consumption; and represents the carbon emission factor for energy type i, the value of which is derived from the “Guidelines for the Compilation of Provincial Greenhouse Gas Inventories” published by the National Development and Reform Commission of China (DRC) and the carbon emission guidelines of the IPCC.
2.2.2. The Explanatory Variables
The Environmental Protection Tax was introduced in 2018 as a direct replacement for the pollution discharge fee; takes the value 0 for years before 2018 and 1 for 2018 and subsequent years, and is treated as a policy dummy variable. To accurately identify the policy effects of the Environmental Protection Tax, this paper constructs two sets of core explanatory variables based on the differences in the extent of adjustments to collection standards across regions during the implementation of the 2018 Environmental Protection Tax Law. Specifically, is a binary dummy variable: a value of 0 indicates that the Environmental Protection Tax collection standard in that region remained unchanged from the original pollution discharge fee, meaning there was no substantive policy change; a value of 1 indicates that the collection standard in that region was raised, meaning the policy was implemented more rigorously. Given that the Environmental Protection Tax employs a banded tax rate system and that the actual intensity of collection varies across regions, this paper further introduces a policy variable, , where a value of 0 indicates that the region’s Environmental Protection Tax collection standard is at or below the national median for that year, whilst a value of 1 indicates that the collection standard is above the median. The specification of these two sets of variables captures the policy heterogeneity of the Environmental Protection Tax reform from the dual dimensions of ‘whether the collection standard has been raised’ and ‘the level of collection intensity’.
2.2.3. Control Variables
Urbanization rate (ur): Existing research indicates that demographic factors are a key driver of carbon emissions. Given China’s energy consumption structure, which is dominated by fossil fuels, the impact of population changes on carbon emissions is reflected not only in an overall increase in scale but also in shifts in the urban-rural population structure. Changes in the urban-rural population structure are typically reflected by the urbanization rate, which is the proportion of the permanent urban population to the total permanent population in a region. This indicator reflects shifts in residents’ lifestyles and energy consumption patterns during the urbanization process, which in turn influence regional carbon emissions. Selecting the urbanization rate as a control variable effectively mitigates the confounding effects of demographic factors on carbon emissions, thereby enabling a precise identification of the relationship between the environmental protection tax policy and carbon emissions.
GDP per capita (pgdp): Existing research indicates that carbon emissions are highly correlated with China’s economic development; rapid economic growth, accompanied by high energy consumption, further increases carbon emissions. It is therefore necessary to control for economic development in the regression analysis to eliminate its impact on the policy variables. This paper uses pgdp, which eliminates the influence of population size on total economic output and provides a more accurate reflection of regional economic development levels. Per capita GDP is expressed as the ratio of regional gross domestic product to the permanent resident population at the end of the year.
Energy structure (es): Energy consumption has a direct impact on carbon emissions; shifting away from traditional energy consumption patterns towards cleaner energy sources is key to reducing carbon emissions. The energy mix indicator is expressed as the ratio of coal consumption converted to tonnes of standard coal to total energy consumption converted to tonnes of standard coal. In China, the coal-fired power generation sector dominates coal consumption. Improvements in regional technological standards can enhance energy efficiency and optimize the energy consumption structure. Advances in new and renewable energy technologies have made their costs significantly lower than those of coal-fired power generation, whilst also reducing carbon dioxide emissions; furthermore, with technological advancements, existing high-carbon, high-emission industries can opt for green upgrading and transformation by replacing fossil fuels with new and renewable energy sources. Where such substitution is not feasible, industries may undertake technological retrofitting to incorporate energy-saving, emission-reduction and low-carbon production technologies to reduce carbon dioxide emissions. Consequently, the higher the level of technological development in a region, the lower the proportion of coal consumption within that region’s energy consumption structure.
Industrial structure (ind): Industrial structure is a key factor influencing carbon emissions; carbon emissions from the primary, secondary and tertiary sectors differ significantly due to variations in energy consumption and energy utilization rates. The primary sector is dominated by agriculture, with carbon emissions arising from land use and livestock farming in agricultural production; the secondary sector is dominated by industry and construction, with carbon emissions arising from energy consumption in industrial production and construction works; the tertiary sector is dominated by transport, commercial services and other industries, with carbon emissions primarily arising from energy consumption in transport and other service sectors. Although the production processes of all three sectors generate carbon emissions, the secondary sector accounts for a far higher volume of emissions than the primary and tertiary sectors. A higher proportion of the secondary sector in a region indicates that the region’s industrial development is likely to follow a carbon-intensive trajectory; therefore, the share of value added by the secondary sector in the region’s gross domestic product is used to reflect the region’s industrial structure.
Technological innovation (tech): The Chinese government has repeatedly stated in public speeches and official documents that technological innovation is a key driver for achieving the ‘dual carbon’ targets. Raising the level of technological innovation can effectively provide practical solutions from a technical perspective to help China achieve these targets. Technological innovation drives low-carbon development primarily in two ways. On the one hand, through the optimization of production processes and the research and development of new equipment and products, it improves energy efficiency and reduces carbon emissions. On the other hand, by transforming the model of economic development, it promotes a shift in China’s economy from material factors such as energy towards knowledge-based factors, thereby reducing carbon emissions through the low-carbon transformation and upgrading of traditional, energy-intensive and highly polluting industries. This paper uses the intensity of R&D expenditure as a measure of the level of technological innovation.
Opening up to the outside world (ope): According to the ‘Pollution Paradise Hypothesis’, developed countries implement stricter environmental pollution control policies, whilst those in developing countries are relatively lax. As the costs of environmental pollution control are higher in developed countries than in developing countries, developed countries generally take advantage of developing countries’ opening up to the outside world to relocate the production of energy-intensive, highly polluting and high-emission industries to developing countries, thereby increasing carbon emissions in the countries concerned. This paper uses the ratio of a region’s import and export trade value to its GDP to measure the level of openness to the outside world, with the exchange rates for import and export trade values calculated using historical exchange rates published on the National Bureau of Statistics’ official website.
Infrastructure (ti): A significant proportion of China’s carbon emissions stems from energy consumption, with the industrial and transport sectors accounting for a large share of this. Improvements to transport infrastructure can effectively reduce carbon emissions. As a major player in infrastructure development, the greater the length of transport networks in a region, the more developed its infrastructure is; this facilitates the exchange of factors of production between regions, enhances production efficiency and reduces carbon emissions. The level of infrastructure development is measured by the ratio of the length of road networks to the permanent resident population at the end of the year.
2.2.4. Spatial Weight Matrix
The spatial weight matrix forms the basis of spatial econometric analysis, quantifying the extent of mutual influence between regions. This paper employs an adjacency-based spatial weighting matrix, which takes full account of the extent of carbon dioxide diffusion in the atmosphere.
In this context, d refers to the distance between the geographical centers of the two regions.
2.2.5. Data Sources and Descriptive Statistics
This paper takes 30 provinces, municipalities, and autonomous regions in China from 2007 to 2022 as its research subjects, with data sourced from the official website of the National Bureau of Statistics of China and the “China Energy Statistical Yearbook”. Table 1 presents the descriptive statistics for the main variables. The sample size is 480, comprising panel data from the 30 provinces. Among the dependent variables, the mean value of per capita carbon emissions (pce) is 19,150 metric tonnes, with a standard deviation of 0.505; the mean value of carbon emission intensity (ci) is 4640 metric tonnes per 10,000 yuan, with a standard deviation of 0.576, indicating that there are certain differences in carbon emission levels across different regions. The mean values of the core explanatory variables, did1 and did2, were 0.188 and 0.146, respectively, indicating that 18.8 percent and 14.6 percent of the observations in the sample were in the policy treatment group. About the control variables, variables such as the urbanization rate (ur), per capita GDP (pgdp), and energy structure (es) were all log-transformed, with standard deviations ranging from 0.24 to 0.97, indicating that the sample possesses sufficient variability in these control variables. The minimum and maximum values for each variable fall within reasonable ranges, with no extreme outliers observed; the sample data are of appropriate quality and meet the requirements for subsequent econometric analysis.
Table 1.
Descriptive statistics for variables.
3. Regression Results
3.1. Results of the DID Model
Table 2 reports the estimated effects of did1 and did2 on pce and ci, respectively, based on a Two-way Fixed Effects (TWFE) estimator. The TWFE model controls for both province-specific unobserved heterogeneity and common time trends. The Hausman test strongly rejects the random effects model ( = 60.82, p < 0.01), justifying the use of fixed effects. All models include control variables such as the urbanization rate, per capita GDP, energy structure, industrial structure, technological innovation, openness to the outside world, and infrastructure, and account for individual and time fixed effects. The results show that the regression coefficients for did1 on pce and ci are −0.063 and −0.073, respectively, both significant at the 1 percent level. This indicates that, compared with regions where the levy threshold has not been adjusted, regions that have raised the environmental protection tax levy threshold have seen a significant reduction in both per capita carbon emissions and carbon emission intensity. The coefficients of did2 on pce and ci are −0.127 and −0.138, respectively, also significant at the 1 percent level, with the absolute values of the coefficients being approximately twice those of did1. This suggests that in regions with high-intensity regulation (where the levy intensity exceeds the national median), the carbon emission reduction effect is far stronger than in regions that merely raised their levy standards. This difference intuitively reflects the marginal effect of policy intensity: the greater the increase in the levy standard and the higher the absolute intensity, the more pronounced the effect on curbing carbon emissions. The R2 values for all models exceeded 0.96, indicating an ideal fit, whilst the constant term was significantly positive, consistent with the fundamental pattern that carbon emissions increase with the expansion of economic scale. The baseline regression provides preliminary validation of the effective logic whereby the environmental protection tax internalizes the external costs of carbon emissions through the ‘Pigouvian tax’ mechanism.
Table 2.
Benchmark Regression Analyses of the Impact of the Environmental Protection Tax on Carbon Emissions.
3.2. Robustness Tests
3.2.1. Assessment of the Parallel Trends Hypothesis (Dynamic Effect)
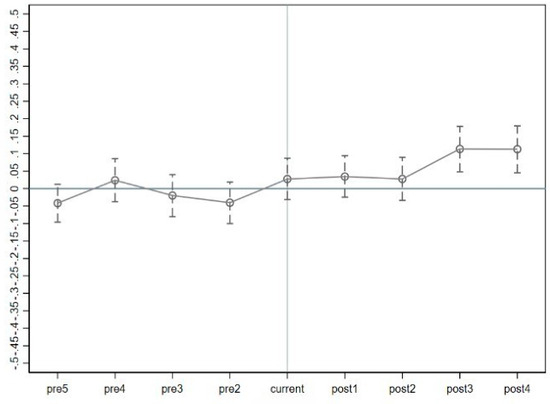
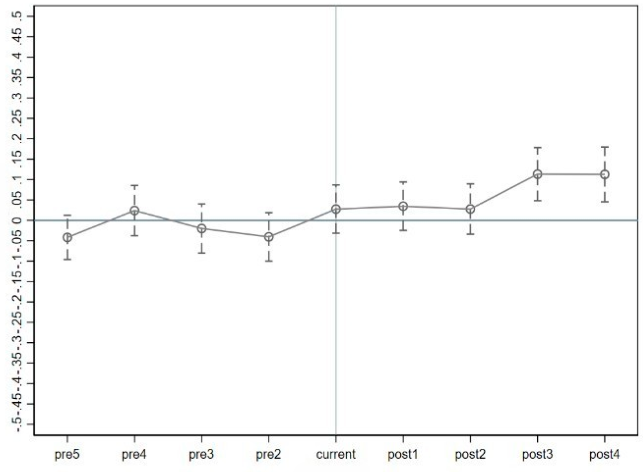
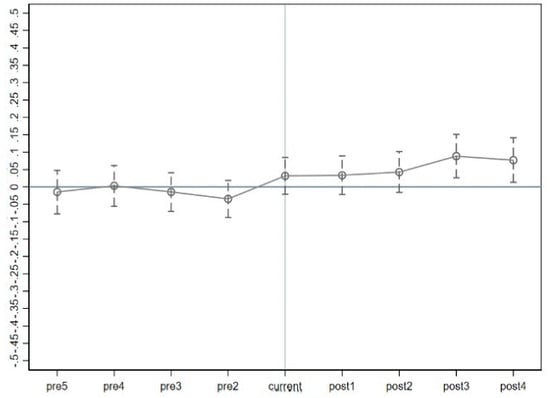
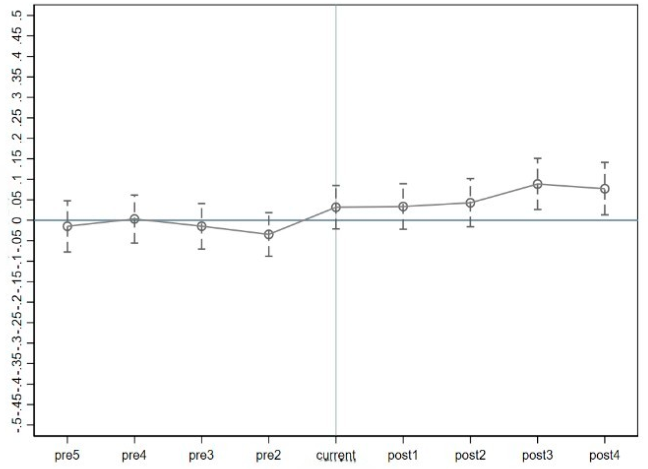
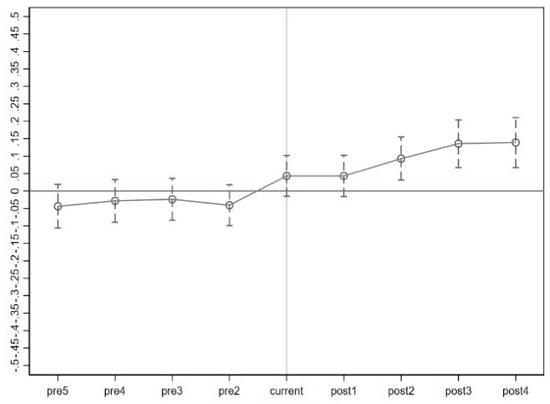
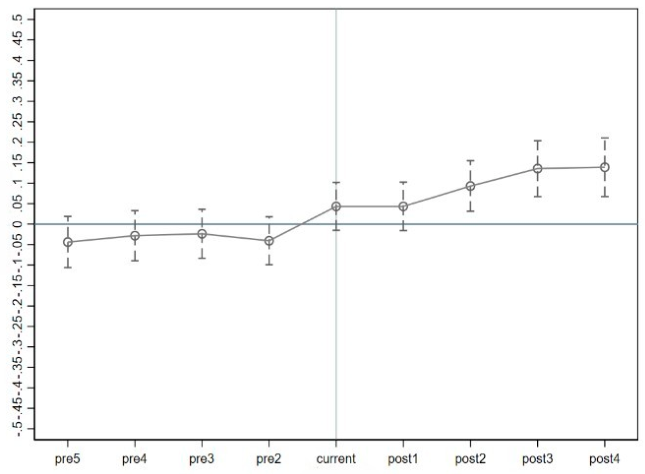
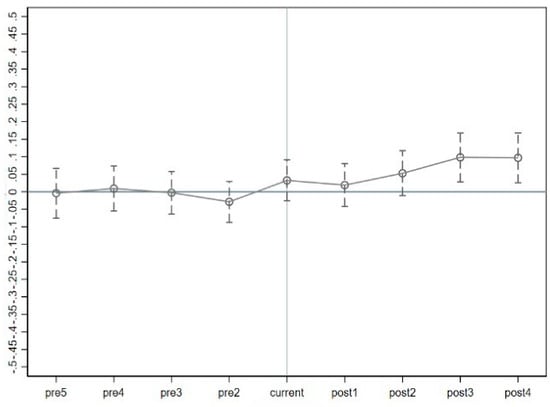
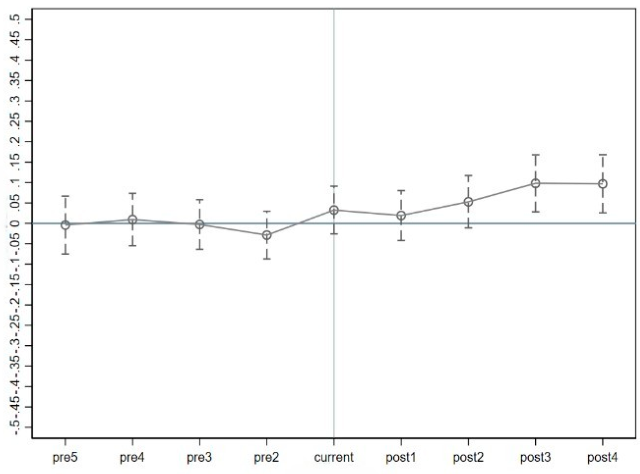
The parallel trends assumption is a fundamental assumption of the difference-in-differences method. It requires that the experimental and control groups exhibit identical trends before policy implementation; only when the trends of the experimental and control groups are parallel before policy implementation can the results of the difference-in-differences regression be considered valid. Figure 1 and Figure 2 present the parallel trends tests for the two groups, with per capita carbon emissions as the dependent variable, within 95 percent confidence intervals; Figure 3 and Figure 4 present the parallel trends tests, with 95 percent confidence intervals, for the two groups where the dependent variable is carbon emission intensity. The test results indicate that, before the reform of environmental protection taxes and fees, the policy effect was neither significant nor pronounced. This suggests that, before the reform, neither per capita carbon emissions nor carbon emission intensity underwent significant changes over time, and the hypothesis of parallelism with the prior trend was not rejected.
Figure 1.
Parallel Trend Test (pce treat1).
Figure 2.
Parallel Trend Test (pce treat2).
Figure 3.
Parallel Trend Test (ci treat1).
Figure 4.
Parallel Trend Test (ci treat2).
As the reform of environmental protection levies into a tax grants local governments the flexibility to set tax rates within a certain range, this reform entails a degree of complexity and a lag in policy effects. Furthermore, because the environmental protection tax does not directly tax carbon emissions but rather indirectly influences them by taxing exhaust emissions, the impact of this reform on per capita carbon emissions and carbon emission intensity may exhibit dynamic effects, with policy outcomes gradually becoming apparent over time. Based on the patterns of change associated with dynamic policy effects following a policy shock, the impact on per capita carbon emissions and carbon emission intensity is not immediately apparent in the early stages of the transition from environmental protection fees to the environmental protection tax; however, the policy effects begin to manifest over time. Nevertheless, as the environmental protection tax does not directly tax carbon emissions, the impact of the policy shock begins to decline from the fourth year of implementation onwards.
3.2.2. Placebo Test
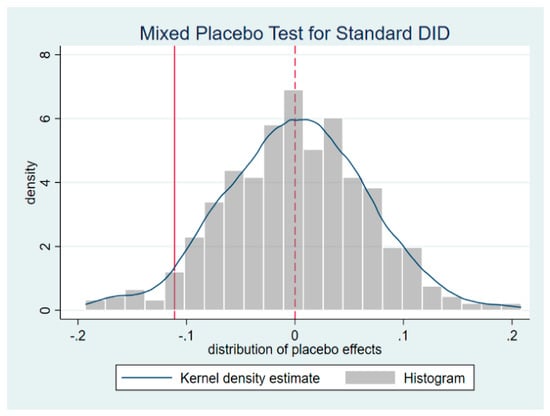
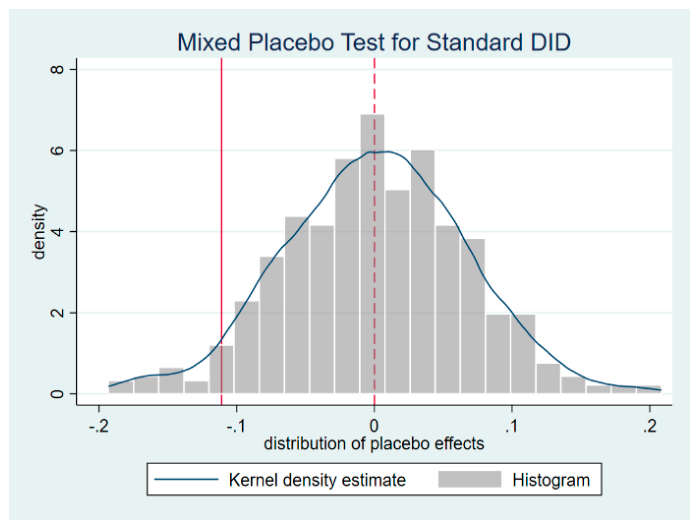
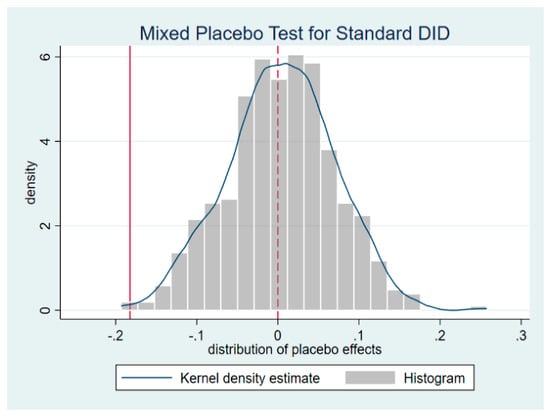
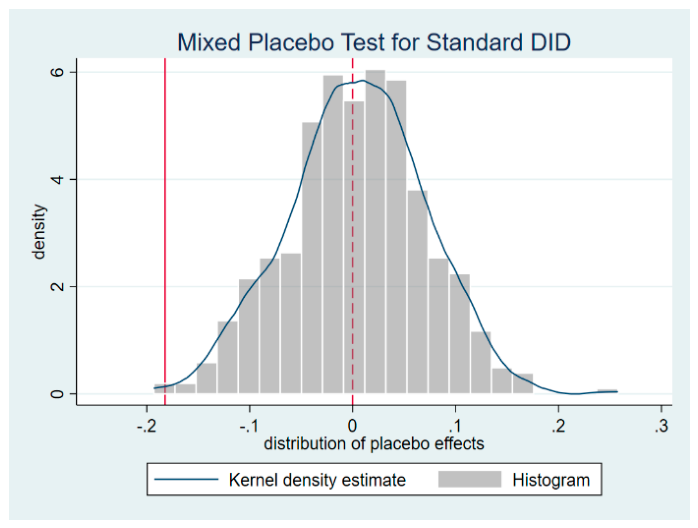
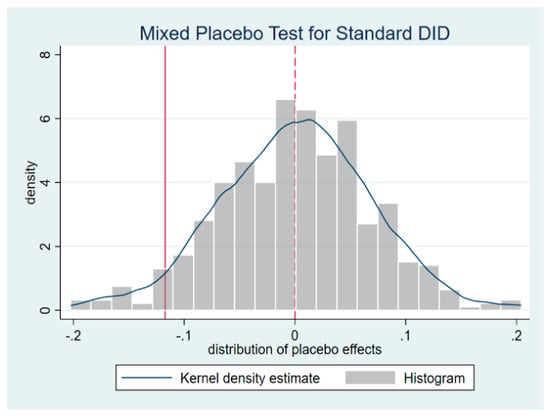
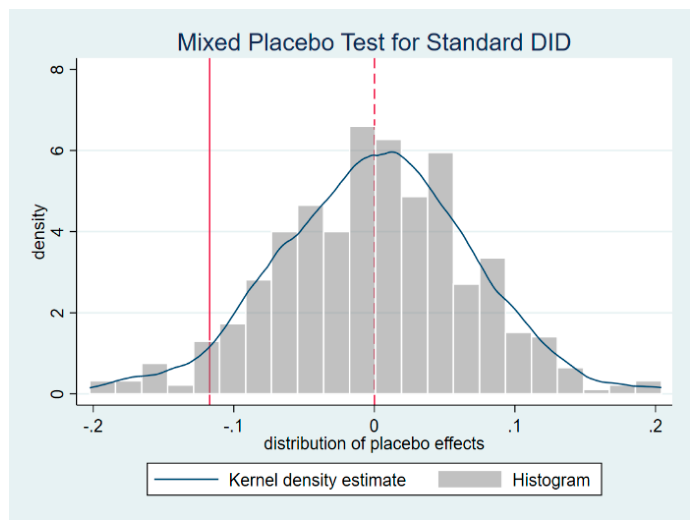
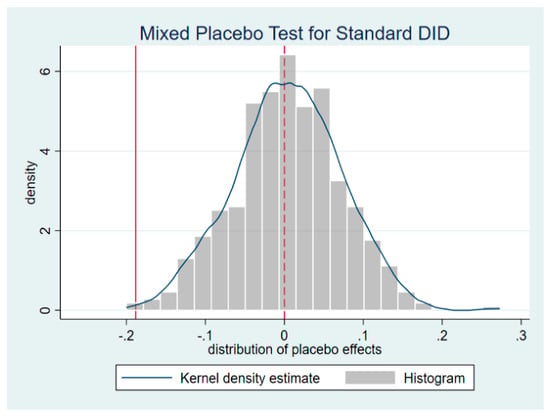
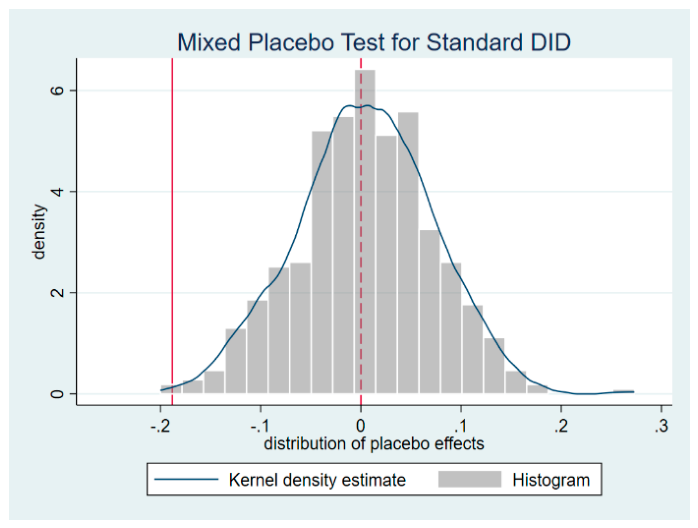
This paper adopts Q. Chen et al.’s (2025) constrained mixed placebo test method, randomly selecting a subset of samples from the original sample of 30 (maintaining the same proportion as in the original sample ) to form a pseudo-experimental group, with the remaining samples forming a new pseudo-control group. For each placebo sample, a time point was randomly selected as the pseudo-policy shock point, and 500 repeated DID estimations were carried out to obtain the distribution of the placebo effect and estimates of the treatment effect.
As shown in Figure 5, Figure 6, Figure 7 and Figure 8, the experiments for both the treatment and control groups are simulated at this stage; there is no significant difference between the outcome variables of the treatment and control groups. The regression coefficients of the interaction terms are concentrated around zero and follow a normal distribution, indicating that the policy shock effect obtained in the DID regression in this section is attributable to the reform of environmental protection levies into a tax. At the same time, because the interaction term coefficients are concentrated around 0, and this is inconsistent with the results of the DID regression in this paper, it indicates that the results of the regression are not caused by unobserved factors. The results of the double difference model regression in this paper have robustness. Additionally, the estimated treatment effects lie in the left tail of the normal distribution. The reform of environmental protection taxes and fees helps to reduce per capita carbon emissions and lower carbon emission intensity; this conclusion has passed the placebo test and is robust.
Figure 5.
Placebo test (pce did1).
Figure 6.
Placebo test (pce did2).
Figure 7.
Placebo test (ci did1).
Figure 8.
Placebo test (ci did2).
3.3. Heterogeneity Analysis
The groups are classified as high and low based on the degree of tax system greening, and the policy effects of raising the levy threshold were estimated separately for each group. The results are shown in Table 3. In the group with a high degree of tax system greening, the coefficients of did1 for pce and ci were −0.061 (significant at the 5 percent level) and −0.080 (significant at the 1 percent level), respectively; in the group with a low degree of greening, the coefficients were −0.047 (significant at the 5 percent level) and −0.053 (significant at the 5 percent level), respectively. The emission reduction coefficients in the high-greening group were greater than those in the low-greening group for both types of dependent variables, and the difference was more pronounced for carbon emission intensity (ci). This indicates that in regions where the levy threshold has been raised by a greater margin, the environmental protection tax exerts a stronger constraining effect on carbon emissions, and the emission-reduction dividends resulting from the greening of the tax system are realized more fully in regions with stricter regulatory measures. It is worth noting that the did1 coefficient for the low-greening group remains significantly negative, suggesting that even with a limited increase, a marginal rise in the levy threshold can still curb carbon emissions to some extent.
Table 3.
Heterogeneity Test of Tax System Greening Degree-Based Taxation Standard Adjustment Groups.
The data are divided into two groups, high and low, based on the degree of greening of the tax system, and the policy effects are estimated separately for the median tax collection groups. The results are shown in Table 4. In the group with a high degree of tax system greening, the coefficients of did2 for pce and ci are −0.047 and −0.083 respectively, but neither reaches the conventional significance level (p > 0.1); whereas in the group with a low degree of tax system greening, the coefficients of did2 for pce and ci are −0.081 and −0.091 respectively, both of which are significant at the 1 percent level. Whilst this result may appear to be at odds with the findings in Table 3, it actually stems from differences in the grouping criteria and the combination of policy variables: Table 3 uses ‘whether a rate increase occurred’ as the core policy shock (did1) and groups data according to the actual magnitude of the increase, whereas Table 4 uses ‘whether the tax intensity is above the median’ as the core policy shock (did2) and groups data according to the median; there are substantial differences in the composition of the two sample groups. The significant effect of did2 in the low-greening group may be attributed to the fact that this group comprises a large number of regions with previously low tax intensity; when these regions cross the median threshold to enter the high-intensity range, the marginal emission-reduction effect of the policy shock is particularly pronounced. In contrast, the high-greening group is already within the high-intensity regulatory range, leaving limited scope for further strengthening tax intensity, and the policy effect is no longer significant. This finding reveals that the emission-reduction effects of the environmental protection tax exhibit diminishing returns; policy optimization should therefore focus on the differentiated impact of initial tax burden levels.
Table 4.
Heterogeneity Test Based on Median Grouping of Tax System Greening Collection.
Judging by the results of the heterogeneity test on the reform of environmental protection taxes and levies (Table 3 and Table 4), the carbon emission reduction effect of the environmental protection tax is not uniform across the country; the policy’s effectiveness is significantly influenced by the existing foundation of green tax policies in each region. Table 3 shows that, whether per capita carbon emissions (pce) or carbon emission intensity (ci) is used as the dependent variable, regions with a larger increase in the levy rate (the ‘high green tax system’ group) have a higher emission reduction coefficient than regions with a smaller increase (the ‘low’ group), and the difference in the suppression of carbon emission intensity is even more pronounced; Table 4 further reveals that, in groupings distinguished by the median level of tax intensity, the did2 coefficient for the low-greening group is significantly negative at the 1 percent level, whereas that for the high-greening group is not significant. The above results indicate that the constraining effect of the policy to replace environmental protection levies with a tax does not operate in isolation, but rather exhibits positive synergies with the region’s existing green tax system and environmental regulatory framework, rather than a simple substitution or redundancy relationship. In regions with a relatively weak tax system foundation, the environmental protection tax constitutes a new substantive constraint, fully unleashing its marginal emission reduction effects; whereas in regions with a relatively well-developed tax system, the complementary and cumulative effects of multiple policy instruments may have limited the scope for the marginal impact of any single policy.
At the same time, analysis of the results based on median tax rate brackets reveals that the reduction in carbon intensity achieved through the reform of environmental protection levies into a tax does not follow a simple linear positive correlation with the tax rate. Once the tax intensity exceeds a certain threshold, the marginal emissions reduction benefits of further increasing the tax rate tend to diminish, suggesting that policymakers should take regional differences into account when optimizing the tax system design and avoid a ‘one-size-fits-all’ approach to raising standards to achieve an optimal balance between the benefits of carbon emission reductions and the associated socio-economic costs.
4. Further Analysis
4.1. Selection of Spatial DID Models
The results of testing the spatial econometrics DID models, which were grouped according to the adjusted expropriation standards, are shown in Table 5. First, an LM test was conducted on the models, revealing that some models failed the robust LM test; these models might degrade into Spatial Lag Models or Spatial Autoregressive Models. Therefore, Wald and LR tests were further conducted on all models. The results indicate that all models passed both the Wald and LR tests at the 1 percent significance level, suggesting that the models will not degrade from the Spatial Durbin Model to a Spatial Error Model or a Spatial Autoregressive Model; the SDM is therefore the optimal choice. Furthermore, additional tests confirmed that a model with both individual and time fixed effects is preferable.
Table 5.
Testing of the Spatial Modelling Model for Groups with Increased Levy Rates.
Similarly, the results of testing the SDM using a DID approach with median groups for the levy thresholds are shown in Table 6. Consistent with the findings for the group with an increased levy threshold, the SDM with both individual and time fixed effects is the optimal model.
Table 6.
Testing of the Spatial Econometric Model for Median Taxation Rate Groups.
4.2. Results from the Spatial DID Model
Table 7 reports the regression results of the SDM-DID model based on the DID1 up-regulation group. After controlling for the spatial autoregression coefficient (rho) and error variance (sigma2_e), the direct effect coefficients of did1 on pce and ci are −0.062 and −0.074, respectively, both significant at the 1 percent level. These results are highly consistent with the baseline regression results in Table 2, indicating that the direct emission-reduction effect of the policy to raise the levy threshold remains robust even after incorporating spatial dependence. The coefficient of the spatial interaction term W × did1 was 0.316 (significant at the 5 percent level) and 0.394 (significant at the 1 percent level) in the pce and ci models, respectively; both are positive, indicating that raising the environmental protection tax levy standard in this region would significantly increase carbon emission levels in neighbouring regions. This positive spatial spillover implies that the ‘carbon leakage’ effect does indeed exist; carbon emissions reduction achieved in this region through environmental regulation may be partially offset by the relocation of high-carbon industries to neighbouring regions with less stringent regulations, reflecting the practical logic of inter-regional competition in environmental regulation and the spatial reallocation of industries. The spatial autoregression coefficients rho are negative (−0.443 and −0.377, significant at the 5 percent level), indicating a negative correlation in carbon emissions between regions, which may be related to competitive emission reduction strategies or convergent environmental regulations among neighbouring regions.
Table 7.
Results of spatial double-difference regression by group of tax rate increases.
Table 8 shows the results of an SDM-DID regression based on median groups of did2, indicating that the direct effect coefficients of did2 on pce and ci are −0.125 and −0.137 (significant at the 1 percent level), with absolute values significantly greater than the estimates for did1 in Table 7. This difference reaffirms that highly regulated regions with a levy intensity above the median achieve stronger emission reduction effects than regions that have merely implemented standard increases, thereby reinforcing the findings of the baseline regression from a spatial perspective. The coefficient of the spatial interaction term W × did2 is positive (0.347 for pce and 0.365 for ci, significant at the 5 percent level), consistent with Table 7, indicating that the policy spillover effects in high-intensity regulated regions also manifest as positive carbon leakage. The rho coefficients are negative (−0.440 and −0.378, significant at the 5 percent level), further validating the negative spatial correlation of carbon emissions across regions. Taking the results of Table 7 and Table 8 together, regardless of the policy variable settings employed, the SDM-DID model consistently confirms the significant direct emission-reduction effect of the environmental protection tax, whilst also revealing the risk that the policy’s spatial spillovers may undermine overall emission-reduction outcomes. This provides an important warning for the formulation of regional collaborative emission-reduction policies.
Table 8.
Results of spatial double-difference regression by median tax rate groups.
In terms of the spatial spillover effects of the environmental protection tax policy (Table 7 and Table 8), the direct dampening effect of the environmental protection tax on carbon emissions remains highly robust even after taking spatial dependencies into account. Table 7 shows that, whether per capita carbon emissions (pce) or carbon emission intensity (ci) is taken as the dependent variable, the direct effect coefficient of did1 is significantly negative at the 1 percent significance level; in Table 8, the direct effect coefficient of did2 is also significantly negative at the 1 percent significance level, and its absolute value is greater than that of did1, further confirming that regions with higher tax rates achieve stronger direct emission reduction effects. However, the coefficients of the spatial interaction term W × did in both tables are significantly positive at the 5 percent level, indicating that an increase in the environmental protection tax rate in a given region will significantly lead to a rise in carbon emission levels in neighbouring regions. In other words, the ‘carbon leakage’ effect is indeed present, and the carbon emission reductions achieved in a given region through environmental regulation may be partially offset by the relocation of high-carbon industries to surrounding regions with weaker regulatory standards. The above results indicate that the emission reduction effects of the environmental protection tax policy exhibit the characteristic of being ‘effective locally but offset globally’ in spatial terms; policy efforts in a single region may undermine net emission reductions at the national level due to the spatial reallocation of industries. This finding implies that, in the process of optimizing the environmental protection tax system, policymakers must not focus solely on unilateral increases in levy rates across individual provinces; rather, they should coordinate the establishment of regional collaborative emission reduction mechanisms. Through cross-regional coordination and synergy in environmental regulation, they can prevent carbon leakage from undermining the overall achievement of the ‘dual carbon’ targets.
4.3. Decomposition of Spatial Effects in Spatial DID Regression
The regression coefficients of the Spatial Durbin Model (SDM) cannot be directly interpreted as marginal effects. To accurately assess the impact of policy shocks on the local area and its neighbouring areas, a spatial effect decomposition is necessary. The total effect should be decomposed into the direct effect reflecting the actual impact of the policy on the local area and the indirect effect reflecting the spatial spillover effect. The total effect is the sum of the former two. Combining the results of the spatial DID regression, it is particularly important to pay attention to the “pollution refuge” effect revealed by the significant positive indirect effect under the spatial matrix, which is contrary to the theoretical expectation but consistent with the reality of regional imbalance in China’s development. Under the spatial matrix, the direct effect of did1 is significantly negative at the 1% level, and the direct effect after effect decomposition is consistent with the SDM regression coefficient (Table 7). Once again, in the condition of a spatial feedback cycle, the implementation of the environmental protection tax reform and the increase in the tax collection standard have a robust and significant inhibitory effect on carbon emissions in the local area. This effect is the most direct and expected goal of the policy, indicating that the environmental protection tax reform and the increase in the tax collection standard as a market-based carbon emission regulation tool are effective at the local level. The indirect effect of the environmental protection tax reform and the increase in the tax collection standard is estimated to be positive, but its significance and coefficient size vary depending on the spatial matrix.
According to Table 9, the indirect effect of per capita carbon emissions is significantly positive at the 5% level, and the indirect effect of carbon emission intensity is also significantly positive at the 1% level. The indirect effect of the increase in the tax collection standard after the tax reform is positive, indicating that the environmental protection tax reform and the increase in the tax collection standard may generate a “pollution refuge effect” through “carbon leakage” in the neighbouring areas under the spatial matrix. The total indirect effect of the tax collection standard increase after the tax reform in geographical proximity has a positive indirect effect (carbon leakage), which is not only statistically significant but also completely offsets the negative direct effect in economic terms, resulting in the total impact of the policy on national carbon emissions becoming a significant increase. This indicates that if the changes in the tax collection standard of the environmental protection tax reform lack regional synergy effects, the emission reduction effect of the environmental protection tax reform in isolated regions from a national perspective may be ineffective or even harmful, because the increase in the tax collection standard of the environmental protection tax reform only redistributes carbon emissions, but does not truly reduce carbon emissions.
Table 9.
Spatial Effect Decomposition by Grouping of the Increase in Levy Rates.
According to Table 10, under all the spatial matrix settings, the direct effect estimates of did2 were all highly significantly negative at the 1% level, consistent with the conclusion of the group with the increased levy standard. The absolute value of the coefficient was greater than that of the group with the increased levy standard (Table 8). This indicates that the policy impact effect defined by policy intensity (the median group of levy standards) is more intense. In provinces with higher levy standards, the environmental protection tax imposed on polluting enterprises brought stronger cost constraints, effectively stimulating technological innovation or energy efficiency improvement in the region, and generating more significant local emission reduction effects. This once again verifies the effectiveness of the environmental protection tax as a “Pigouvian tax” in this region and that the policy impact effect is positively correlated with policy intensity. The indirect effect of per capita carbon emissions was significantly positive at the 1% level, and the indirect effect of carbon emission intensity was also significantly positive only at the 1% level. The significant positive indirect effect still supports the existence of the “pollution refuge effect”, that is, the strict policies in this region may drive polluting activities to transfer to neighbouring provinces, and compared with the group with the increased levy standard, the range of significance and coefficient values have decreased. The insignificance of the total effect indicates that from the overall national perspective, the more stringent environmental protection tax implemented in regions with greater policy intensity brings significant local carbon emission reduction and relatively weaker negative spatial spillover benefits, which almost completely cancel each other out. It reveals that in the absence of global collaboration, even if a single region increases policy intensity, the global total effect may be offset by regional interactions.
Table 10.
Decomposition of spatial effects by median tax rate groups.
An analysis of the spatial effects of changes in policy and the intensity of the environmental protection tax reform reveals that the impact of this reform on carbon emissions is a complex process involving local emission reductions and inter-regional shifts. Underlying this is the behaviour of carbon emitters who, when faced with varying environmental protection tax costs, make rational choices regarding inter-regional resource allocation to reduce costs by shifting carbon emissions to regions with lower tax burdens. Whilst changes to and the intensity of the environmental protection tax reform policy are effective within a specific region, the resulting spatial carbon leakage may lead to system-wide ineffectiveness or even harm. This finding emphasizes the importance of incorporating the spatial dimension into the framework for formulating and evaluating green tax policies. To achieve the ‘dual carbon’ targets ahead of schedule, a governance approach based on regional coordination and win–win cooperation is essential.
4.4. Robustness of Spatial Weight Matrix
To ensure that our spatial findings are not contingent on the choice of the contiguity matrix, we re-estimate the SDM-DID model using two alternative spatial weight matrices: a pure economic distance matrix and an economic–geographic nested matrix.
4.4.1. Economic Distance Matrix (W2)
To capture spatial dependence arising from economic similarity rather than geographical proximity, we construct a pure economic distance weight matrix based on the inverse of absolute differences in per capita GDP across provinces. Provinces at similar economic levels are more likely to share industrial structures, energy consumption patterns, and environmental regulatory capacities, and thus may influence each other’s carbon emissions through economic linkages, industrial competition, or imitation of environmental policies. The matrix is specified as:
where and denote the average per capita GDP of province i and j over the sample period, respectively. Under this specification, provinces with smaller GDP disparities are assigned larger weights, reflecting the notion that economically similar regions are more closely interconnected in production linkages, trade flows, and competitive dynamics.
4.4.2. Economic–Geographic Nested Matrix (W3)
To more comprehensively characterise the spatial dependence of inter-provincial carbon emissions, this paper constructs a spatial economic–geographic nested weight matrix in addition to the contiguity matrix. This matrix jointly accounts for regional differences in economic development and geographical distance, and is specified as:
where and denote the average per capita GDP of province i and j over the sample period, respectively, and d refers to the distance between the geographical centres of the two regions.
Together, these two alternative matrices serve as complementary robustness checks. The pure economic distance matrix (W2) allows us to isolate the role of economic similarity in shaping spatial dependence. In contrast, the nested matrix (W3) captures the joint effects of economic and geographic proximity. Comparing the results across the contiguity matrix, W2, and W3 enables us to determine whether the estimated spatial spillover effects—particularly the “carbon leakage” phenomenon identified in the preceding sections—are robust artefacts of spatial correlation or sensitive to a particular weighting scheme.
4.4.3. Regression Results with Alternative Spatial Weight Matrices
According to the results in Table 11, under all three spatial weight matrices, the coefficient of did1 is significantly negative at the 1% level. After strictly controlling for spatial dependence and other covariates, raising tax collection standards under environmental protection tax reform has significantly reduced both per capita carbon emissions and carbon emissions intensity in the region, consistent with the baseline DID regression results. This further confirms that environmental protection tax reform has substantial emission-reduction effects, supporting the effectiveness of “Pigouvian taxes” in correcting environmental negative externalities. The coefficients of the spatial lag term (W × did1) are all positive, but their significance and magnitudes vary with the spatial matrix and the dependent variable. The coefficient is significantly positive for per capita carbon emissions under the W1 and W2 matrices, but not under the W3 matrix. For carbon emission intensity, it is significantly positive only under W1 and insignificant under W2 and W3. After a region implements higher tax-collection standards under environmental protection tax reform, neighbouring provinces (W) or economically similar provinces (W2) may experience an increase rather than a decrease in carbon emissions. In such cases, the policy of raising tax standards might trigger a “pollution haven effect” or “carbon leakage,” in which high-polluting, energy-intensive enterprises relocate to nearby regions with relatively lower or more lenient tax standards, resulting in spatial displacement of pollution rather than genuine emission reductions. The rho value is significantly negative under W1, but significantly positive under W2 and W3, once again highlighting the complexity of spatial patterns in carbon emissions. Negative spatial autocorrelation (W) may suggest competitive or substitutive relationships among regions regarding carbon emissions. In contrast, positive spatial autocorrelation (W2/W3) indicates that provinces with similar economic structures are more likely to face common carbon challenges, exhibiting synchronised trends—either both high or both low.
Table 11.
SDM-DID Regression Results under Alternative Spatial Weight Matrices (did1 Group).
According to the results in Table 12, across all three spatial weight matrices, the coefficient of did2 is highly significant and negative at the 1% level, consistent with the findings from Group 1 (Table 11). However, the absolute value is larger than that in Group 1. When defining the treatment group based on the median of environmental protection tax reform standards, the policy shock from the environmental tax reform exhibits a more pronounced and robust effect on local carbon emissions reduction. Provinces with higher collection standards experience stronger policy impacts, resulting in greater constraints on local carbon emissions. The coefficients for the spatial lag term of the environmental tax reform policy (W × did2) are all positive. Still, their significance and magnitude vary with the spatial matrix and the dependent variable, with reduced significance relative to grouping based on upward adjustments or shifts in post-reform tax standards. Per capita carbon emissions are significantly positive under W matrix, insignificant under W2, and significant at the 5% level under W3. Carbon emission intensity is significantly positive under W1, but insignificant under both W2 and W3.
Table 12.
SDM-DID Regression Results under Alternative Spatial Weight Matrices (did2 Group).
Compared with grouping based on upward adjustment or a shift in tax collection standards, grouping by the median collection standard yields lower significance and smaller coefficients for policy spillover effects. Based on policy intensity grouping, the negative spatial spillover (carbon leakage) effect still exists but becomes relatively less certain and weaker. Positive spatial spillovers remain significant and stable under the geographic distance matrix (W), reaffirming that the “pollution haven” effect is more likely to occur among geographically neighbouring provinces. The sign and significance of rho are highly consistent with those in Table 11—significantly negative under W1, and significantly positive under W2 and W3—indicating that both geographical competition and economic coordination coexist in the spatial pattern of carbon emissions.
The spatial autocorrelation structure of carbon emissions varies fundamentally with the choice of spatial weights, thereby forming the spatial statistical foundation for the conditional characteristics of carbon leakage. In the adjacency matrix, rho is significantly negative, indicating a competitive spatial relationship among neighbouring provinces characterised by “this gain, that loss”—precisely the statistical prerequisite for identifying carbon leakage. In contrast, under economic distance and nested matrices, rho is significantly positive, indicating positive spatial autocorrelation, with carbon emissions exhibiting “like attracts like.” Under such patterns, the spatial offset mechanism required to address carbon leakage does not exist, making it impossible to detect the carbon leakage effect effectively. The reversal in the sign of rho further explains, from a spatial-statistics perspective, the underlying mechanism behind the significant differences in carbon leakage across matrix specifications.
The environmental protection tax exerts a robust and credible constraint on local carbon emissions, and increasing its enforcement intensity can yield greater emission-reduction benefits without unduly exacerbating carbon leakage. However, the risk of carbon leakage exists between geographically adjacent regions with significant regulatory disparities, requiring targeted prevention through regional collaborative governance mechanisms rather than attempting to establish a nationwide, uniform, and undifferentiated joint prevention and control system.
Under all spatial matrices, the direct effect of did1 is significantly negative at either the 1% or 5% level (Table 13), and the direction of the decomposed direct effects aligns with the SDM regression coefficients (Table 11). This further confirms that, under spatial feedback loops, implementing higher collection standards for environmental protection tax reform exerts a robust and significant inhibitory effect on local carbon emissions. This effect represents the policy’s most direct and anticipated objective, indicating that increasing tax collection standards as a market-based carbon regulation tool is effective at the regional level. The estimated indirect effects of raising the tax collection standards are all positive, though their significance and magnitude vary across different spatial matrices. The indirect effect on per capita carbon emissions is significant only at the 5% level under the W matrix; it remains positive but insignificant under the W2 and W3 matrices. Similarly, the indirect effect on carbon emission intensity is significantly positive only at the 1% level under the W matrix, while being insignificant under W2 and W3. The positive indirect effect suggests that raising tax-collection standards after tax reform may trigger a “pollution haven effect” in neighbouring regions through “carbon leakage” under certain spatial configurations. Under geographical proximity (W), the total effect of raising the collection standards after tax reform includes a statistically significant positive indirect effect (carbon leakage) that not only offsets the negative direct effect economically but also results in an overall increase in national carbon emissions. This implies that if regional coordination is lacking, the emission-reduction impact of environmental taxes under isolated regional policies could be ineffective or even counterproductive from a national perspective—because raising tax-collection standards merely redistributes carbon emissions rather than genuinely reducing them.
Table 13.
Decomposition of spatial effects (did1 Group).
Across all spatial matrix specifications (Table 14), the direct effect estimate of did2 is highly significant and negative at the 1% level, consistent with the findings for the group with raised collection standards, and the absolute value of the coefficient exceeds that of the raised-standard group (Table 11). This indicates that policy shocks, defined by policy intensity (the median grouping of collection standards), have stronger effects. Provinces with higher collection standards impose stronger cost constraints on polluting enterprises through environmental protection taxes, thereby incentivising local technological innovation or energy-efficiency improvements and generating more pronounced local emission reductions. This further confirms the effectiveness of environmental protection taxes as Pigouvian taxes within regions, and shows a positive correlation between policy impact and policy intensity. The indirect effect of per capita carbon emissions is significantly positive only under the W matrix at the 1% level, while it remains positive but insignificant under the W2 and W3 matrices. Similarly, the indirect effect of carbon emission intensity is significantly positive only under the W matrix at the 1% level, and is insignificant under W2 and W3. The significant positive indirect effect still supports the “pollution haven effect,” meaning that stringent local policies may drive polluting activities to geographically adjacent provinces (W). Compared with the raised-standard group, both the significance range and the coefficient magnitudes are reduced. The insignificance of the total effect suggests that, nationwide, the substantial local carbon reduction achieved in high-intensity policy regions is almost entirely offset by relatively weak negative spatial spillover benefits. This reveals that, in the absence of comprehensive regional coordination, even if individual regions strengthen their policies, the overall net effect may be cancelled out by interregional interactions.
Table 14.
Decomposition of spatial effects (did2 Group).
The spatial effect decomposition of changes in environmental protection tax policies and their intensity reveals that the impact of environmental taxation reform on carbon emissions is a complex interplay between local emission reductions and cross-regional emission transfers. Underlying this process is the rational decision-making of carbon-emitting producers, who, facing varying environmental tax costs, strategically allocate resources across regions to minimise expenses by shifting emissions to areas with lower tax burdens. While such policy adjustments may be effective locally, they can lead to spatial carbon leakage, resulting in overall inefficiency or even adverse outcomes at the national level. This finding underscores the importance of incorporating spatial dimensions into the design and evaluation frameworks of green tax policies. To achieve the “dual carbon” goals ahead of schedule, regional coordination and cooperative governance are essential.
5. Discussion
The results of the regression analysis indicate that the environmental protection tax has a significant negative impact on both per capita carbon emissions and carbon emission intensity. Furthermore, in regions where tax intensity exceeds the median, the emission-reduction effect is approximately twice that observed in regions where only the tax rate has been raised, thereby validating the applicability of the ‘Pigouvian tax’ mechanism in carbon-emission governance. These emission-reduction effects are achieved through three pathways: energy substitution, technological upgrading, and adjustments to the output structure; however, the tax intensity must exceed a certain threshold to effectively trigger substantive behavioural transformation in enterprises, reflecting the theoretical characteristic of an ‘effective threshold’ for environmental tax rates.
The heterogeneity analysis reveals the policy’s non-linear characteristics and institutional synergy effect. There is not a monotonic relationship between levy intensity and carbon emissions reduction outcomes—the marginal benefits of emission reductions tend to decrease as the intensity increases, consistent with the economic logic of an upward-sloping marginal cost curve for emission reductions. At the same time, policy effects are significantly influenced by the existing green tax framework in each region: in regions with a weak tax system, the environmental protection tax constitutes a new constraint, leading to notable emission reduction outcomes; in regions with a well-developed tax system, however, the scope for further reduction is narrowed due to functional overlaps with existing instruments such as resource taxes and consumption taxes. This indicates a complex relationship between various green tax categories, characterised by both synergy and substitution; the contribution of any single tax must therefore be considered within the context of the overall division of functions within the institutional framework.
Spatial econometric analysis indicates that the policy effects of the environmental protection tax exhibit a contrasting pattern of ‘emission reductions locally and increases in neighbouring areas’. Moreover, under the adjacency matrix, rho is significantly negative, indicating a competitive spatial relationship characterised by ‘win–lose’ dynamics among neighbouring provinces, which precisely constitutes the statistical prerequisite for identifying carbon leakage. In contrast, under economic distance and nested matrices, rho is significantly positive, indicating positive spatial autocorrelation, with “like attracts like” clustering of carbon emissions. Under such a pattern, the spatial offset mechanism required for carbon leakage does not exist, making it impossible to effectively detect the carbon leakage effect. The reversal in the sign of rho further explains, from a spatial-statistics perspective, the underlying mechanism behind the significant differences in carbon leakage across matrix specifications.
The theoretical contribution of this study lies in extending the assessment of environmental protection taxes to carbon emissions, revealing the functional interactions among green tax instruments, and identifying carbon leakage effects within a spatial framework. At the policy level, it is recommended that a system of differentiated collection standards be established and a regional collaborative governance mechanism be developed to prevent carbon leakage across jurisdictional boundaries. Carbon leakage risks exist between geographically adjacent regions with significant regulatory disparities, and they should be addressed through targeted regional collaborative governance mechanisms rather than by attempting to establish a nationwide, uniform, undifferentiated joint prevention and control system. The study’s limitations include a failure to distinguish between the dual channels of fiscal revenue and behavioural adjustment, and a lack of a mechanistic decomposition of the transmission pathways of carbon leakage. These issues require further investigation in subsequent research utilising microdata and multi-weight combinations.
6. Conclusions and Recommendations
6.1. Conclusions
The reform of environmental protection levies into a tax, which involves raising or maintaining the levy rates and categorising data into experimental and control groups based on whether the levy rates are above the median, can be understood as grouping data according to the presence or absence of policy changes and the intensity of those changes. The reform of environmental protection taxes and fees, whether accompanied by a policy change or made more stringent, has a significant negative impact on both per capita carbon emissions and carbon emissions intensity, indicating that this policy shock is generally effective in curbing carbon emissions. This result remains robust after controlling for variables and applying fixed effects for individual and time, indicating that the environmental protection tax policy has a clear emissions-reduction effect.
Heterogeneity tests indicate that policy impacts vary across regions with differing levels of “greening” in their tax systems. In areas with higher degrees of tax system greening, the reform of converting environmental fees into taxes has a more pronounced effect on emission reductions, suggesting that the greater the level of tax system greening, the more effective environmental policies become. Spatial econometric results show that most policy shocks and their spatial interaction terms (W × did1 and W × did2) are significant, indicating that the fee-to-tax reform not only reduces local carbon emissions but also generates spatial spillover effects. Decomposition of spatial effects reveals that the direct effect of the tax reform is significantly negative, while the indirect effects are mostly positive under different spatial weight matrices, though significance varies; overall effects also exhibit heterogeneity. This further suggests that although environmental tax reforms can suppress local carbon emissions, they may also lead to carbon leakage into neighbouring regions. Environmental tax policies play a significant role in reducing emissions, but their effectiveness depends on the degree of greenness in regional tax systems and displays clear spatial interdependence. Future efforts should continue to optimise the design of environmental tax systems and strengthen interregional policy coordination to better harness their emission-reduction potential and mitigate carbon leakage.
Further analysis with different spatial weight matrices reveals that carbon leakage primarily reflects firms’ cross-regional reallocation behaviour in response to rising local environmental tax costs. When choosing relocation destinations, firms tend to prioritise geographically adjacent provinces for practical reasons such as transportation costs, supply chain integration, labour mobility, and market reach. The spatial weight matrix W, constructed based on the discrete binary logic of “adjacency implies association,” accurately captures this pattern of “proximity-based relocation,” making carbon leakage most detectable under matrix W. In contrast, matrix W2 assigns weights based on the logic of “economic similarity implies association,” favouring regions with similar per capita GDP levels. However, environmental regulation intensity between such regions typically differs little, resulting in weak incentives for cross-regional relocations. More importantly, the direction of carbon leakage (from high- to low-regulation regions) does not align with W2’s weighting scheme, which emphasises economically similar regions, thereby diluting the observed effect. Although matrix W3 incorporates both economic disparity and geographical distance, its dual constraints result in a more dispersed spatial weight distribution, making it difficult to concentrate weights on the specific “high-regulation–low-regulation adjacent” pairing that is critical to carbon leakage, thereby further weakening the effect.
6.2. Recommendation
Standards for tax collection and administration should be raised to effectively enhance the policy efficacy of the environmental protection tax in controlling pollution and reducing emissions. At present, China’s environmental protection tax has been introduced as a direct transition from the former pollution discharge fee system. Although some progress has been made in standardising collection and administration, prominent issues remain, including a relatively low tax burden and a narrow scope of application. In most regions, the tax rates and collection ratios set are far below the actual costs of pollution control, resulting in a rather limited incentive for emissions reduction. To this end, on the one hand, local governments may, in light of the current status and future trends of pollutant emissions in their respective regions and guided by the actual needs of environmental governance, particularly in areas that have already transitioned from pollution discharge fees to the environmental protection tax, moderately increase the unit tax rate for the environmental protection tax to avoid undermining the practical effectiveness of policy reform due to insufficient tax collection efforts.
On the other hand, efforts should be made to explore expanding the scope of the environmental protection tax to broaden its regulatory coverage. Local authorities could, based on the composition of major pollutants in their areas, build upon the existing taxation of the four traditional pollution sources (air, water, solid waste and noise) to gradually incorporate emerging environmental issues such as biological pollution and soil contamination into the tax system, thereby promoting the dynamic refinement of the tax regime. In the practice of tax collection and administration, it is also necessary to strengthen information sharing and coordination between tax authorities and the competent ecological and environmental authorities, thereby enhancing the efficiency of inter-departmental collaboration and ensuring that the environmental protection tax system can more effectively fulfil its role in constraining and regulating pollutant emissions.
The findings of this study indicate that, whilst the implementation of the environmental protection tax covers a wide range of atmospheric pollutant emissions, it does not directly address carbon emissions. The 18th National Congress of the Communist Party of China incorporated the advancement of an ecological civilisation into China’s ‘Five-in-One’ overall layout for social development. Transforming the intrinsic drivers of economic development requires us to pursue sustainable development, and adopting a ‘low-carbon’ tax system is an inevitable choice. The introduction of a carbon tax is widely recognised as the policy instrument with the lowest cost for reducing carbon dioxide emissions. The implementation of a carbon tax system can exert sustained, stable pressure on economic actors, compelling them to select optimal emission-reduction methods tailored to their specific circumstances. Many countries have already introduced carbon taxes, providing relatively mature models to draw upon for tax system design, tax base selection, tax collection and administration, and tax rate setting. Research into the carbon tax system within China’s academic community has also become increasingly in-depth. A prevailing view is that, in the long term, the introduction of a carbon tax in China will yield a ‘double dividend’. To thoroughly implement the ‘low-carbon’ development philosophy and keep pace with the trend towards a low-carbon economy, it is necessary to add a carbon dioxide tax component to the Environmental Protection Tax at an appropriate time.
The implementation of environmental taxes can correct micro-market failures; this is consistent with the classical analysis of traditional economics and with the role and behaviour of the government in long-term economic growth. In the context of long-term economic growth, the government not only participates in economic activities as an actor to correct market shortcomings, but, more importantly, its actions also play a vital role in ensuring long-term macroeconomic sustainability. Environmental taxes can not only reduce pollution but also facilitate sustained economic development whilst ensuring the effectiveness of these reductions. This is the true purpose behind the formulation and implementation of environmental taxes by countries worldwide, and it is closely linked to ‘green tax reform’. The implementation of environmental taxes not only promotes resource conservation and environmental friendliness but also achieves consistency and coordination between decentralised equilibrium and social-optimal equilibrium, thereby maximising social welfare.
Author Contributions
Conceptualization, X.L. and T.Z.; methodology, X.L. and T.Z.; soft-ware, X.L. and T.Z.; validation, X.L. and T.Z.; formal analysis, X.L. and T.Z.; investigation, X.L. and T.Z.; resources, X.L. and T.Z.; data curation, X.L. and T.Z.; writing—original draft preparation, X.L. and T.Z.; writing—review and editing, X.L. and T.Z.; visualization, X.L. and T.Z.; supervision, X.L. and T.Z.; funding acquisition, X.L. and T.Z. All authors have read and agreed to the published version of the manuscript.
Funding
This research received no external funding.
Informed Consent Statement
Not applicable.
Data Availability Statement
The data presented in this study are available on request from the corresponding author. (The data are not publicly available as they are part of an ongoing larger study and are still being analyzed for future publications).
Conflicts of Interest
The authors declare no conflicts of interest.
References
- Bashir, M. F., Benjiang, M. A., Shahbaz, M., Shahzad, U., & Vo, X. V. (2021). Unveiling the heterogeneous impacts of environmental taxes on energy consumption and energy intensity: Empirical evidence from OECD countries. Energy, 226, 120366. [Google Scholar] [CrossRef] [Scilit]
- Chen, H., Wang, L., Huang, D., & Yang, Z. (2021). Dilemma and countermeasures on environmental tax in China. Environment and Sustainable Development, 46, 18–23. [Google Scholar] [CrossRef]
- Chen, Q., Qi, J., & Yan, G. (2025). Placebo tests for difference-in-differences: A practical guide. Journal of Management World, 41(2), 181–220. [Google Scholar]
- Chen, S., & Li, M. (2023). Fiscal policies for green and low-carbon transition of energy system: Challenges and countermeasures. Fiscal Science, 1, 110–117. [Google Scholar]
- Deng, L., Zhu, Y., & Wang, Z. (2022). Atmospheric environment effect of China’s environmental protection tax: RD empirical research. Review of Economy and Management, 38, 5–16. [Google Scholar] [CrossRef]
- Dogan, E., Hodžić, S., & Šikić, T. F. (2023). Do energy and environmental taxes stimulate or inhibit renewable energy deployment in the European Union? Renewable Energy, 202, 1138–1145. [Google Scholar] [CrossRef] [Scilit]
- Hao, L. N., Umar, M., Khan, Z., & Ali, W. (2021). Green growth and low carbon emission in G7 countries: How critical the network of environmental taxes, renewable energy and human capital is? Science of The Total Environment, 752, 141853. [Google Scholar] [CrossRef] [Scilit] [PubMed]
- Ma, H. (2022). Improve the green taxation system and promote green and low-carbon development. Chinese Taxation, 16–18. [Google Scholar] [CrossRef]
- Wang, J., Zhao, Y., Sun, Q., & Yang, Z. (2023). Impact of higher tax rate on environmental protection in Jiangsu province: Based on dynamic CGE model. Research of Environmental Sciences, 8, 1634–1642. [Google Scholar]
- Wang, P., Huang, S., Yang, Z., & Guo, F. (2022). Research on the impact of the environmental protection tax on the green total factor productivity of the enterprises. Taxation Research, 11, 66–73. [Google Scholar] [CrossRef]
- Wu, H., Chu, X., & Gao, T. (2024). An assessment study on the effectiveness of environmental protection tax in air pollution control. International Taxation, 69–79. [Google Scholar] [CrossRef]
- Yasmeen, R., Zhang, X., Tao, R., & Shah, W. U. H. (2023). The impact of green technology, environmental tax and natural resources on energy efficiency and productivity: Perspective of OECD rule of Law. Energy Reports, 9, 1308–1319. [Google Scholar] [CrossRef] [Scilit]

Disclaimer/Publisher’s Note: The statements, opinions and data contained in all publications are solely those of the individual author(s) and contributor(s) and not of MDPI and/or the editor(s). MDPI and/or the editor(s) disclaim responsibility for any injury to people or property resulting from any ideas, methods, instructions or products referred to in the content. |
© 2026 by the authors. Licensee MDPI, Basel, Switzerland. This article is an open access article distributed under the terms and conditions of the Creative Commons Attribution (CC BY) license.