


Abstract
Background: Progress toward universal health coverage in Central Asia depends on the interaction between public healthcare financing, broader social protection, and the fiscal capacity of the state. The region is analytically important because five post-Soviet health systems share a common institutional legacy while differing markedly in income, informality, migration dependence, and public financing arrangements. Methods: The study examines a country–year panel for Kazakhstan, Kyrgyzstan, Tajikistan, Turkmenistan, and Uzbekistan over 2015–2024. Fixed-effects estimates are treated as the principal benchmark. Two-step System Generalized Method of Moments estimates are retained only as sensitivity evidence because the cross-sectional dimension is very small (N = 5). Out-of-pocket expenditure as a share of current health expenditure represents household financial burden, while changes in general government debt measure macro-fiscal pressure. Results: In the reported models, higher social protection expenditure and higher domestic general government health expenditure are negatively associated with the out-of-pocket share. The fixed-effects coefficients are −1.245 and −3.810, respectively; the corresponding System GMM sensitivity estimates are −1.830 and −4.102. Combined social and health expenditure is positively associated with the debt ratio in the fiscal model. These findings are associations rather than causal effects. An illustrative scenario analysis shows that the estimated financing gap to a 5% of GDP public health benchmark varies substantially across countries and assumptions. Conclusions: The results are consistent with a dual-channel framework in which public financing can shift health risk away from households while creating fiscal pressure when revenue mobilization and expenditure efficiency do not adjust. Policy implications therefore concern the composition, targeting, and financing of expenditure rather than spending expansion alone. The limited sample, incomplete interpolation audit trail, and incomplete archived GMM diagnostics require cautious interpretation and motivate replication with household and subnational data.
1. Introduction
Universal health coverage (UHC) requires both access to needed services and protection from financial hardship. These two dimensions are closely related but are not identical: a country may formally guarantee access while households continue to finance medicines, diagnostics, or hospital care directly. High out-of-pocket (OOP) expenditure therefore signals that part of the financial risk of illness remains with households rather than being pooled through taxation, insurance, or other prepayment mechanisms (Asante et al., 2016).
Healthcare financing is also embedded in the broader social protection system. Income support programmes can reduce the consequences of health shocks, while health financing can prevent illness from becoming an income shock. The interaction matters most where formal employment is incomplete, because contribution-based insurance may collect resources efficiently from formal workers but may not automatically protect informal workers, migrants, or people with unstable earnings. The fiscal challenge is consequently two-sided: governments seek to reduce household exposure to medical costs while maintaining debt sustainability and financing other public priorities.
Central Asia provides a distinctive setting for studying this trade-off. Kazakhstan, Kyrgyzstan, Tajikistan, Turkmenistan, and Uzbekistan inherited centrally planned health systems and broad public entitlements, but their post-transition financing paths diverged. The region now combines tax-financed guarantees, social health insurance arrangements, substantial OOP expenditure in several countries, different levels of remittance dependence, and heterogeneous fiscal capacity. WHO regional assessments emphasize shared reform priorities but also country-specific gaps in public coverage, primary care, medicines, and financial protection (World Health Organization Regional Office for Europe, 2024; European Observatory on Health Systems and Policies, 2024).
Existing research provides strong evidence that financing design affects financial protection and that social protection requires sustainable fiscal space. However, three gaps remain. First, health financing studies often examine OOP expenditure without modelling the fiscal implications of simultaneous social spending. Second, macro-fiscal studies often treat health and social protection as expenditure aggregates without considering the distribution of risk between government and households. Third, Central Asia remains underrepresented in comparative empirical work that combines these two perspectives.
This article develops a joint risk allocation framework. The household channel captures the extent to which public health financing and social protection are associated with a lower private payment burden. The sovereign channel captures the extent to which expenditure expansion is associated with higher public debt when domestic revenue and expenditure efficiency do not adjust. The contribution is not a claim that one estimator identifies a causal effect. Rather, the article combines the two channels in one regional framework and explicitly treats country heterogeneity and small-sample uncertainty as central analytical features.
The study addresses three research questions. RQ1 asks whether higher social protection expenditure and public health financing are associated with lower OOP expenditure. RQ2 asks whether combined social and health expenditure is associated with changes in public debt after controlling for macroeconomic conditions. RQ3 asks how the projected financing gap changes under alternative assumptions about growth and public revenue capacity.
The hypotheses are stated in directional, associational form. H1: higher social protection expenditure is associated with a lower OOP share. H2: higher public health expenditure is associated with a lower OOP share. H3: when expenditure grows faster than sustainable revenue capacity, combined social and health expenditure is associated with greater debt pressure. These hypotheses guide the empirical analysis without implying experimental causality.
The remainder of the article is organized as follows. Section 2 reviews the literature and develops the conceptual framework. Section 3 describes the data, variables, estimation strategy, diagnostics, and scenario assumptions. Section 4 presents country profiles, regression estimates, effect size interpretation, and scenario results. Section 5 discusses the findings, policy implications, limitations, and research agenda. Section 6 concludes.
2. Methodology
2.1. Data Sources and Sample Selection
The empirical analysis covers Kazakhstan, Kyrgyzstan, Tajikistan, Turkmenistan, and Uzbekistan over 2015–2024. The analytical file described in the submitted manuscript contains 50 country–year observations (N = 5, T = 10). The period includes commodity price adjustment, the COVID-19 shock, recovery, and major changes in regional health financing arrangements.
Macroeconomic variables were compiled from the World Bank World Development Indicators and IMF debt databases. Health financing variables were drawn from the WHO Global Health Expenditure Database and the UHC service coverage series. Social protection expenditure was compiled from the ADB Social Protection Indicator database and ILO sources. The use of multiple international databases improves comparability but does not eliminate differences in reporting calendars, revisions, or national definitions.
The original manuscript states that linear interpolation was used for missing observations. The archived materials supplied for revision do not contain a cell-level imputation log, so the exact share of interpolated values cannot be independently verified in this revision. This is treated as a material limitation rather than concealed. The findings should be replicated on the unbalanced, non-interpolated panel before final archival release. No causal claim is based on interpolation.
2.2. Variable Definitions and Econometric Roles
The empirical models rely on two distinct sets of dependent variables corresponding to the dual analytical focus of the study: Health Equity and Fiscal Sustainability.
The first dependent variable, Health Equity (OOPit), is operationalized as Out-of-Pocket expenditure expressed as a percentage of Current Health Expenditure. In health economics, the OOP ratio is the standard proxy for systemic inequity. High OOP ratios signify an elevated risk of catastrophic health expenditures (CHE) and impoverishment, indicating that the health financing system fails to provide adequate financial risk protection.
The second dependent variable, Fiscal Sustainability (ΔDebtit), is measured as the first difference in the General Government Debt-to-GDP ratio. This metric captures the annual accumulation of sovereign liabilities relative to the size of the economy, serving as the primary indicator of whether current public spending trajectories are financed through sustainable revenue mobilization or perilous deficit spending.
The core independent variables designed to test the hypotheses are:
- Social Protection Expenditure (SPit). Total public expenditure on social protection programs as a percentage of GDP. This serves to test the hypothesis that broader social safety nets mitigate health inequalities.
- Public Health Financing (PubHit). Domestic General Government Health Expenditure as a percentage of GDP, capturing direct state investment in healthcare infrastructure and service subsidization.
- UHC Service Coverage Index (UHCit). A scaled index (0–100) acting as a proxy for the structural capacity and quality of the healthcare delivery system.
To isolate the effects of the primary independent variables, a robust vector of macroeconomic and demographic control variables (Xit) is included:
- GDP per capita in constant US dollars (GDPpcit), controlling for overall economic development and purchasing power.
- Annual GDP growth rate (Growthit), capturing business cycle fluctuations.
- Consumer price inflation (Infit), accounting for purchasing power erosion affecting household healthcare affordability.
- Personal Remittances received as a percentage of GDP (Remitit), a critical control for Central Asia given the heavy reliance on external labor migration in countries like Tajikistan and Kyrgyzstan, which directly impacts domestic consumption and poverty levels.
- Unemployment rate (Unempit), reflecting labor market capacity and the degree of informality, which dictates the viability of payroll-tax-based social health insurance schemes.
Table 1 defines each variable and separates its substantive meaning from its econometric role. The classification is explicit because the validity of dynamic panel instruments depends on assumptions about whether a variable is endogenous, predetermined, or strictly exogenous.
Table 1.
Variable definitions and econometric classification.
2.3. Model Specification
Analyzing the dynamic interplay between macroeconomic output, social protection, and health financing poses significant methodological challenges. The primary issues are endogeneity, unobserved country-specific heterogeneity, and reverse causality. For instance, while social protection expenditures are theorized to influence health outcomes, higher societal disease burdens concurrently necessitate elevated health and social spending, creating a bidirectional causal loop. Furthermore, health expenditure variables typically exhibit strong persistence over time due to institutional inertia.
To resolve these econometric complexities, this study employs the two-step System Generalized Method of Moments (System GMM) estimator originally developed by Arellano and Bover (1995) and fully articulated by Blundell and Bond (1998). The System GMM is exceptionally well-suited for dynamic panel data with a small cross-sectional dimension (N = 5) and a moderate time dimension (T = 10). Unlike static Fixed Effects (FE) models, which suffer from Nickell bias when a lagged dependent variable is included, the System GMM constructs a system of two equations—one differenced and one in levels. It instruments the endogenous variables in the differenced equation with their strictly exogenous lagged levels, and instruments the variables in the level equation with their lagged differences.
Model 1: The Health Equity and Social Protection Nexus
To empirically quantify the hypothesis that social protection and public health financing systematically reduce regressive OOP payments, the following dynamic linear equation is specified:
where
- is the out-of-pocket expenditure ratio for country i at time t.
- is the autoregressive term capturing the path dependency and inertia of health financing structures.
- represents the vector of K macroeconomic control variables (GDP per capita, remittances, unemployment, inflation).
- denotes unobserved time-invariant country-specific fixed effects (e.g., enduring political institutions, cultural attitudes toward healthcare).
- represents time fixed effects controlling for regional macroeconomic shocks that affect all countries simultaneously (e.g., the 2020 pandemic economic contraction).
- is the idiosyncratic error term, assumed to be identically and independently distributed.
In this specification, and are treated as endogenous variables. The validity of the GMM instruments relies on the moment conditions E = 0 for s 1.
Model 2: Fiscal Sustainability Dynamics
To assess whether the expansion of health and social protection spending threatens macro-fiscal stability, a fiscal reaction function is estimated. Given the necessity to control for the inherent persistence of debt accumulation, the dynamic System GMM is applied to the following specification:
Here, the coefficient captures the marginal impact of combined social and public health expenditure on the sovereign debt ratio. A statistically significant and positive would indicate that such expenditures are financed through deficit accumulation rather than sustainable revenue mobilization or efficient expenditure reallocation, thereby signaling a structural sustainability gap.
2.4. Estimation Strategy, Diagnostics, and Robustness
To ensure the robustness and statistical validity of the System GMM estimations, several critical diagnostic tests are conducted. The validity of the instrumental variables—ensuring they are uncorrelated with the error term—is tested using the Hansen J-statistic for over-identifying restrictions. The assumption of no second-order serial correlation in the first-differenced idiosyncratic error terms, a fundamental requirement for GMM consistency, is verified using the Arellano–Bond AR(2) test. Furthermore, to provide a baseline for comparison and to demonstrate the direction of endogeneity bias, standard Panel Fixed Effects (FE) estimations are reported alongside the GMM results, utilizing cluster-robust standard errors to correct for potential heteroscedasticity.
A complete replication protocol should include: (i) a restricted lag window; (ii) a collapsed instrument matrix; (iii) an instrument count below the number of cross-sectional units where feasible; (iv) Windmeijer-corrected standard errors; (v) the numerical results of the AR(1), AR(2), and Hansen tests; (vi) estimates based on the unbalanced, non-interpolated panel; (vii) leave-one-country-out estimations; and (viii) a small-sample bias-corrected dynamic fixed effects estimator. These procedures require access to the underlying dataset, estimation code, and original econometric logs and should therefore be treated as mandatory steps for full replication.
The archived System GMM output provides only partial diagnostic information. For the household burden model, the reported AR(2) p-value is 0.315, while for the fiscal model it is 0.512. These results indicate that the null hypothesis of no second-order serial correlation cannot be rejected in either specification. The reported Hansen J-test p-values are 0.420 for the household burden model and 0.388 for the fiscal model. Although these values do not reject the validity of the instruments, their interpretation should remain cautious because the statistical power of the Hansen test may be limited in a panel with only five cross-sectional units.
Several essential diagnostics cannot be recovered from the archived output. In particular, the AR(1) p-values, the total number of instruments, the selected lag window, and the use of a collapsed instrument matrix are not documented. The absence of the instrument count prevents a complete assessment of instrument proliferation, while the lack of information on lag restrictions and instrument collapsing limits the reproducibility of the estimation strategy. Consequently, the System GMM results are retained only as sensitivity evidence rather than as the principal basis for causal or policy conclusions. Full validation requires re-estimation using the original data and complete estimation logs.
In addition to the retrospective econometric analysis, this study executes a forward-looking mathematical projection to quantify the “fiscal sustainability gap” facing Central Asian nations as they attempt to meet SDG 3.8 targets by 2030. Utilizing baseline macroeconomic forecasts from the IMF and World Bank for the 2025–2030 period, the gap is calculated based on the historical income elasticity of public health financing .
The theoretical model defines the required per capita health expenditure growth (Δ) necessary to achieve UHC benchmarks (commonly established at roughly 5% of GDP for developing economies). The projected natural revenue generation capability for health (Δ) is calculated as a function of projected GDP growth (g) and the estimated elasticity ():
The Fiscal Sustainability Gap (FSG) is therefore the difference between the required expenditure and the natural revenue generation, expressed as a percentage of GDP:
This formulation demonstrates that if required health expenditure growth exceeds the natural revenue generation capability, the resulting gap must be bridged by external development assistance, unsustainable debt accumulation, or radical structural tax reform.
Two-step GMM inference also requires finite-sample correction, and excessive instruments can overfit endogenous variables and weaken the Hansen test (Windmeijer, 2005; Roodman, 2009). The submitted tables report AR(2) and Hansen p-values but the archived output does not report AR(1), the total instrument count, the exact lag window, or whether the instrument matrix was collapsed.
A complete replication protocol should include: (i) a restricted lag window; (ii) a collapsed instrument matrix; (iii) an instrument count below the number of cross-sectional units where feasible; (iv) Windmeijer-corrected standard errors; (v) AR(1), AR(2), and Hansen statistics; (vi) estimates on the unbalanced, non-interpolated panel; (vii) leave-one-country-out estimates; and (viii) a small-sample bias-corrected dynamic FE estimator. These checks require the underlying data and estimation logs and are identified as mandatory replication steps.
Diagnostic transparency for the archived System GMM output remains incomplete. For the household burden model, the reported AR(2) p-value is 0.315, while for the fiscal model it is 0.512. These results provide no evidence of second-order serial correlation in the reported estimations. The corresponding Hansen J-test p-values are 0.420 and 0.388, respectively. Although these values do not lead to rejection of the null hypothesis of instrument validity, they should be interpreted cautiously because the power of the Hansen test may be weak in a panel with a very small cross-sectional dimension.
At the same time, several important diagnostic indicators are unavailable in the archived output. The AR(1) p-values are not reported for either model and must therefore be provided during replication. The total number of instruments is also unavailable, which prevents a full assessment of possible instrument proliferation. In addition, the lag window used for instrument construction and the application of a collapsed instrument matrix are not documented. Because these elements cannot be recovered without the original estimation log, the System GMM estimates are retained only as sensitivity evidence. The reported and missing diagnostic information should therefore be clearly distinguished, and full validation requires re-estimation using the original dataset, estimation code, and complete econometric logs.
2.5. Illustrative Fiscal Gap Scenarios
The forward-looking exercise is reframed as a transparent scenario analysis rather than a forecast. The benchmark compares projected public health financing capacity with an illustrative 5% of GDP level discussed in the UHC financing literature (McIntyre et al., 2017). The 5% value is not an SDG requirement and should not be interpreted as a universally optimal spending target.
The baseline scenario reproduces the values in the submitted manuscript. The optimistic scenario assumes that stronger revenue mobilization, prioritization, or efficiency improves public health financing capacity by 0.5 percentage points of GDP by 2030. The adverse scenario assumes a 0.5-point deterioration relative to baseline due to weaker growth or fiscal pressure. These shifts are sensitivity parameters, not econometric estimates.
3. Literature Review
3.1. Healthcare Financing and Financial Protection
Health financing determines how resources are raised, pooled, and used to purchase services. The distributional consequences depend not only on the amount spent but also on who contributes, who is covered, which services are included, and whether patients face charges at the point of use. OOP expenditure is therefore widely used as a system-level indicator of weak financial protection, although it does not by itself measure the incidence of catastrophic or impoverishing expenditure across income groups.
Comparative evidence shows that public financing can improve equity when it substitutes for direct payment and when benefit packages are effectively accessible. Yet aggregate public expenditure may fail to benefit disadvantaged groups if resources are concentrated in urban hospitals, if medicines are excluded, or if informal payments persist. This distinction is important for interpreting macro-level coefficients: a lower national OOP share is compatible with continuing urban–rural, income, gender, or employment status inequalities.
The post-socialist experience also cautions against treating social health insurance as institutionally uniform. Wagstaff and Moreno-Serra (2009) show that the aggregate effects of social health insurance reforms depend on implementation and context. In Central Asia, recent WHO assessments similarly describe different combinations of tax financing, insurance, co-payments, and incomplete benefit packages. The relevant empirical question is thus not whether one financing label is universally superior, but whether the resulting pooling arrangements reduce household payment burdens in each institutional setting.
3.2. Social Protection as a Complement to Health Financing
Social protection affects health-related financial risk through income security, eligibility, and access. Cash transfers, pensions, disability benefits, unemployment protection, and maternity benefits can preserve consumption when illness reduces earnings or creates care responsibilities. Health financing and income protection are therefore complementary: one reduces the price of care, while the other supports the household capacity to meet non-medical costs and income losses.
The literature nevertheless identifies a coverage problem. Social insurance is frequently concentrated among formal-sector workers, while groups with unstable or informal employment rely on tax-financed assistance. ADB’s Social Protection Indicator framework distinguishes social insurance, social assistance, and labour market programmes, making clear that expenditure composition and breadth of coverage matter as much as total spending. The ILO estimates a substantial financing gap for universal social protection floors in low- and middle-income countries, including essential healthcare (Cattaneo et al., 2024).
This literature supports H1 but also limits its interpretation. A negative association between aggregate social protection spending and OOP expenditure may reflect income support, better eligibility administration, or broader public-sector capacity. It does not directly establish which households benefit or whether the distribution is progressive. Household survey data are required for that question.
3.3. Fiscal Sustainability and the Composition of Social Spending
Equity is one of the most important criteria for evaluating healthcare financing. A health system may be fiscally stable but socially inequitable if households finance a large share of services directly. Conversely, a system may increase public expenditure but still fail to reduce inequality if resources are not directed toward the services and groups with the greatest need (Ogujiuba, 2023; Hsu, 2026).
Benefit incidence analysis is especially relevant here. Ogujiuba (2023) shows that public health expenditure can disproportionately benefit better-off groups when service use is unequal across income quintiles. This means that the equity effect of public spending depends on who actually uses publicly financed services. For Central Asia, this is important because rural populations, low-income households, informal workers, and people with chronic diseases may experience different levels of access despite formal public provision.
The gender and vulnerability dimensions of health financing are also important. Ravindran et al. (2024) argue that universal health coverage reforms should not compromise gender equity and should be connected with social protection and cash transfer schemes. This is relevant because women, children, older persons, and persons with disabilities often face both health-related and income-related risks. Healthcare financing and social protection therefore need to operate as complementary systems.
The literature on sustainable governance also supports integrated approaches. Chlomoudis et al. (2026) argue that social sustainability depends on governance mechanisms that protect workers and vulnerable groups within economic agreements. Although their study focuses on port concession agreements, the broader point is applicable to public health financing: social sustainability requires institutional safeguards, not only financial flows.
Recent studies on digital and financial innovation also show that financing systems are becoming more complex. Zahid and Jillani (2023) discuss the role of fintech in supporting Sustainable Development Goals, while (Toumi et al., 2026) examine how Islamic finance and digital innovation can support social sectors such as poverty relief, healthcare, and education. These studies are not directly about Central Asian health systems, but they indicate that future healthcare and social protection financing may increasingly rely on digital identification, targeted transfers, and integrated financial platforms.
Digital identity and administrative data are also relevant for targeting and monitoring. Matthew and Martin (2026) argue that digital identity systems cannot be assessed only through technical robustness because social and institutional factors determine their sustainability. In health financing, this suggests that digital registries can improve targeting only if they are integrated with social protection databases and supported by strong governance.
Despite the growing literature, Central Asia remains underrepresented in comparative studies of healthcare financing and social protection. Existing research often examines health expenditure, social assistance, or fiscal sustainability separately. Fewer studies analyze healthcare financing as a functional component of social protection and evaluate its impact on equity and fiscal sustainability in one framework.
This creates a clear research gap. The region has inherited broad public commitments in healthcare, but several countries continue to rely heavily on out-of-pocket payments. As a result, formal access to healthcare may coexist with weak financial protection. This contradiction requires an integrated analytical approach that connects public financing, household payments, social protection capacity, and fiscal sustainability.
The present study addresses this gap by proposing a comparative framework for Central Asia. It combines health financing indicators with social protection logic and evaluates whether the financial burden of healthcare is carried primarily by the state or by households. This approach contributes to the literature by reframing fiscal sustainability not as simple expenditure restraint, but as the ability of public systems to maintain equitable financial protection over time.
In summary, the reviewed literature suggests that healthcare financing and social protection should be analyzed as interconnected systems. Health financing reduces exposure to medical expenditure shocks, while social protection reduces vulnerability to income loss and poverty. For Central Asia, this relationship is especially important because high household payments may undermine both equity and long-term fiscal sustainability (Cattaneo et al., 2024; Bierbaum & Schmitt, 2022; Hsu, 2026; Karakolias et al., 2026; Prinja, 2026).
Fiscal sustainability is often defined narrowly as the ability to maintain public debt on a stable path. For health and social policy, a broader concept is useful: a system is fiscally sustainable when it can finance an adequate and predictable package of services and protection without transferring excessive risk to households or crowding out other essential expenditure.
Additional spending can be financed through revenue growth, reprioritization, efficiency gains, external assistance, or borrowing. The debt effect is therefore conditional rather than mechanical. In the short run, expenditure expansion may increase deficits; over a longer horizon, effective health and social investment may support human capital and growth. Conversely, poorly targeted or inefficient spending can increase fiscal pressure without improving protection.
The literature on expenditure benchmarks also requires care. A public health spending level near 5% of GDP has been discussed as an aspirational benchmark associated with progress toward UHC, but it is not an official SDG target and cannot substitute for country-specific costing (McIntyre et al., 2017). This study therefore uses 5% only for transparent scenario comparison, not as a universal normative requirement.
3.4. Theoretical Contribution: A Dual Risk Allocation Framework
The conceptual contribution of the article is to connect household financial protection and sovereign fiscal pressure through two linked channels. In the household channel, greater public health financing and social protection can reduce the share of health costs paid directly by households. In the sovereign channel, the same expenditure expansion can increase debt pressure when tax revenue, contribution revenue, or expenditure efficiency do not adjust. The interaction creates four analytically distinct configurations, summarized in Table 2.
Table 2.
Dual risk allocation framework.
This framework clarifies the relationship between the literature review and the hypotheses. H1 and H2 concern the household channel; H3 concerns the sovereign channel. Country institutions, informality, remittances, benefit package design, and public-sector efficiency influence the position and movement of each country within the framework.
4. Results
4.1. Regional Heterogeneity
Table 3 reports the country profiles used in the submitted manuscript. The values combine the latest available observations and 2023–2024 averages, so they are descriptive rather than a single synchronized-year dataset. They illustrate the heterogeneity that motivates country effects and cautious regional interpretation.
Table 3.
Macroeconomic and Health Financing Profiles of Central Asian Republics (Averaged 2023–2024 Data).
Kazakhstan combines the largest economy in the group with the lowest reported OOP share and moderate public debt. Kyrgyzstan and Tajikistan display higher remittance dependence and more constrained public financing profiles. Uzbekistan occupies an intermediate position, combining reform momentum with a high OOP share in the compiled data. Turkmenistan has low reported public debt but a high OOP share and limited public health expenditure in the dataset.
These differences mean that a regional average should not be read as a common policy effect. The same expenditure increase may have different implications depending on revenue structure, benefit package design, administrative capacity, and the extent to which households can access publicly financed services.
4.2. Associations with Out-of-Pocket Expenditure
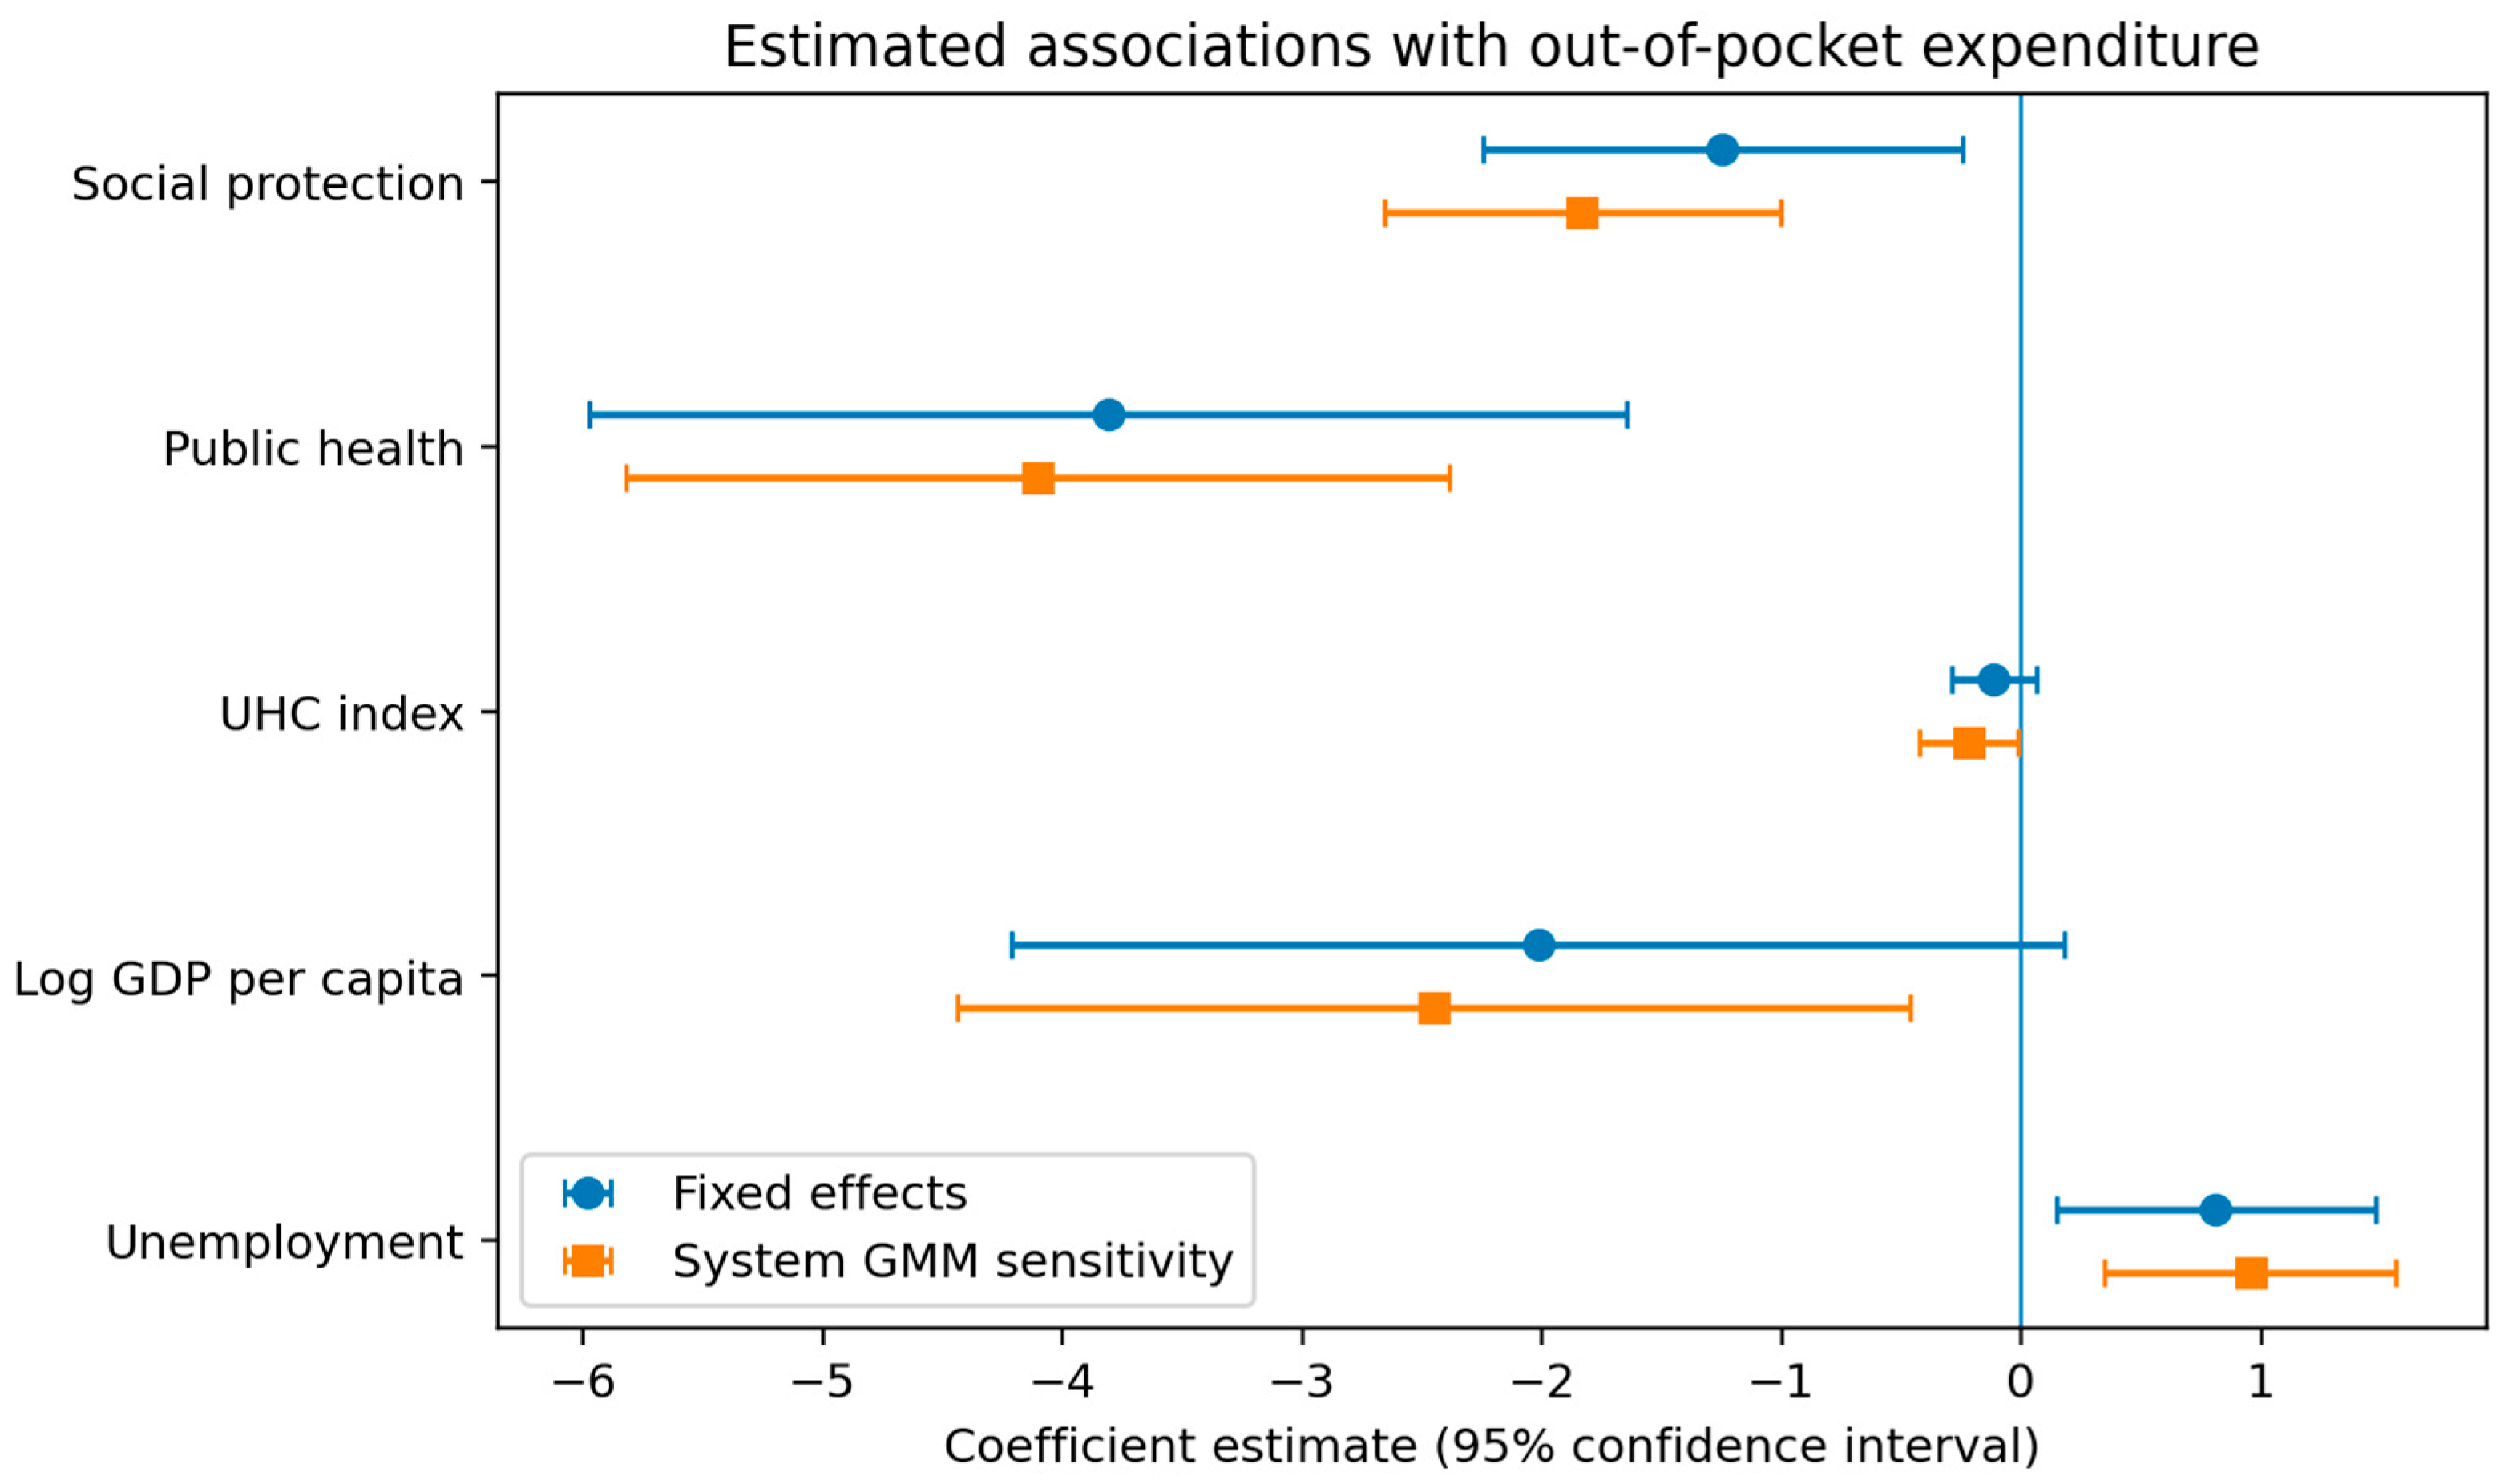
The lagged OOP coefficient is positive in both specifications, indicating persistence in national financing structures. Social protection expenditure and public health expenditure are negatively associated with the OOP share. In the FE benchmark, a one-percentage-point higher SP share of GDP is associated with a 1.245-point lower OOP share, while a one-point higher PubH share is associated with a 3.810-point lower OOP share, conditional on the included controls (Table 4) (Figure 1).
Table 4.
Reported estimates for out-of-pocket expenditure as a share of current health expenditure.
Figure 1.
Fixed effects and System GMM sensitivity coefficients for the household burden model.
4.3. Associations with Public Debt
The debt ratio is highly persistent. The combined SP and PubH variable is positively associated with debt in both specifications. In the FE benchmark, a one-percentage-point higher combined expenditure share is associated with a 1.150-point higher debt ratio, conditional on growth, inflation, remittances, and fixed effects. The corresponding GMM sensitivity estimate is 1.425.
The interpretation is conditional. The coefficient may capture periods in which expenditure expanded faster than revenue, but it cannot distinguish borrowing from weak revenue mobilization, cyclical shocks, or other omitted fiscal decisions. Stronger GDP growth is negatively associated with debt, while the remittance coefficient is negative in the reported model. These results are consistent with H3 but do not establish a universal debt effect of health or social spending (Table 5 and Table 6).
Table 5.
Reported estimates for general government debt dynamics.
Table 6.
Standardized interpretation of reported coefficient directions and magnitudes.
4.4. Illustrative 2030 Scenarios
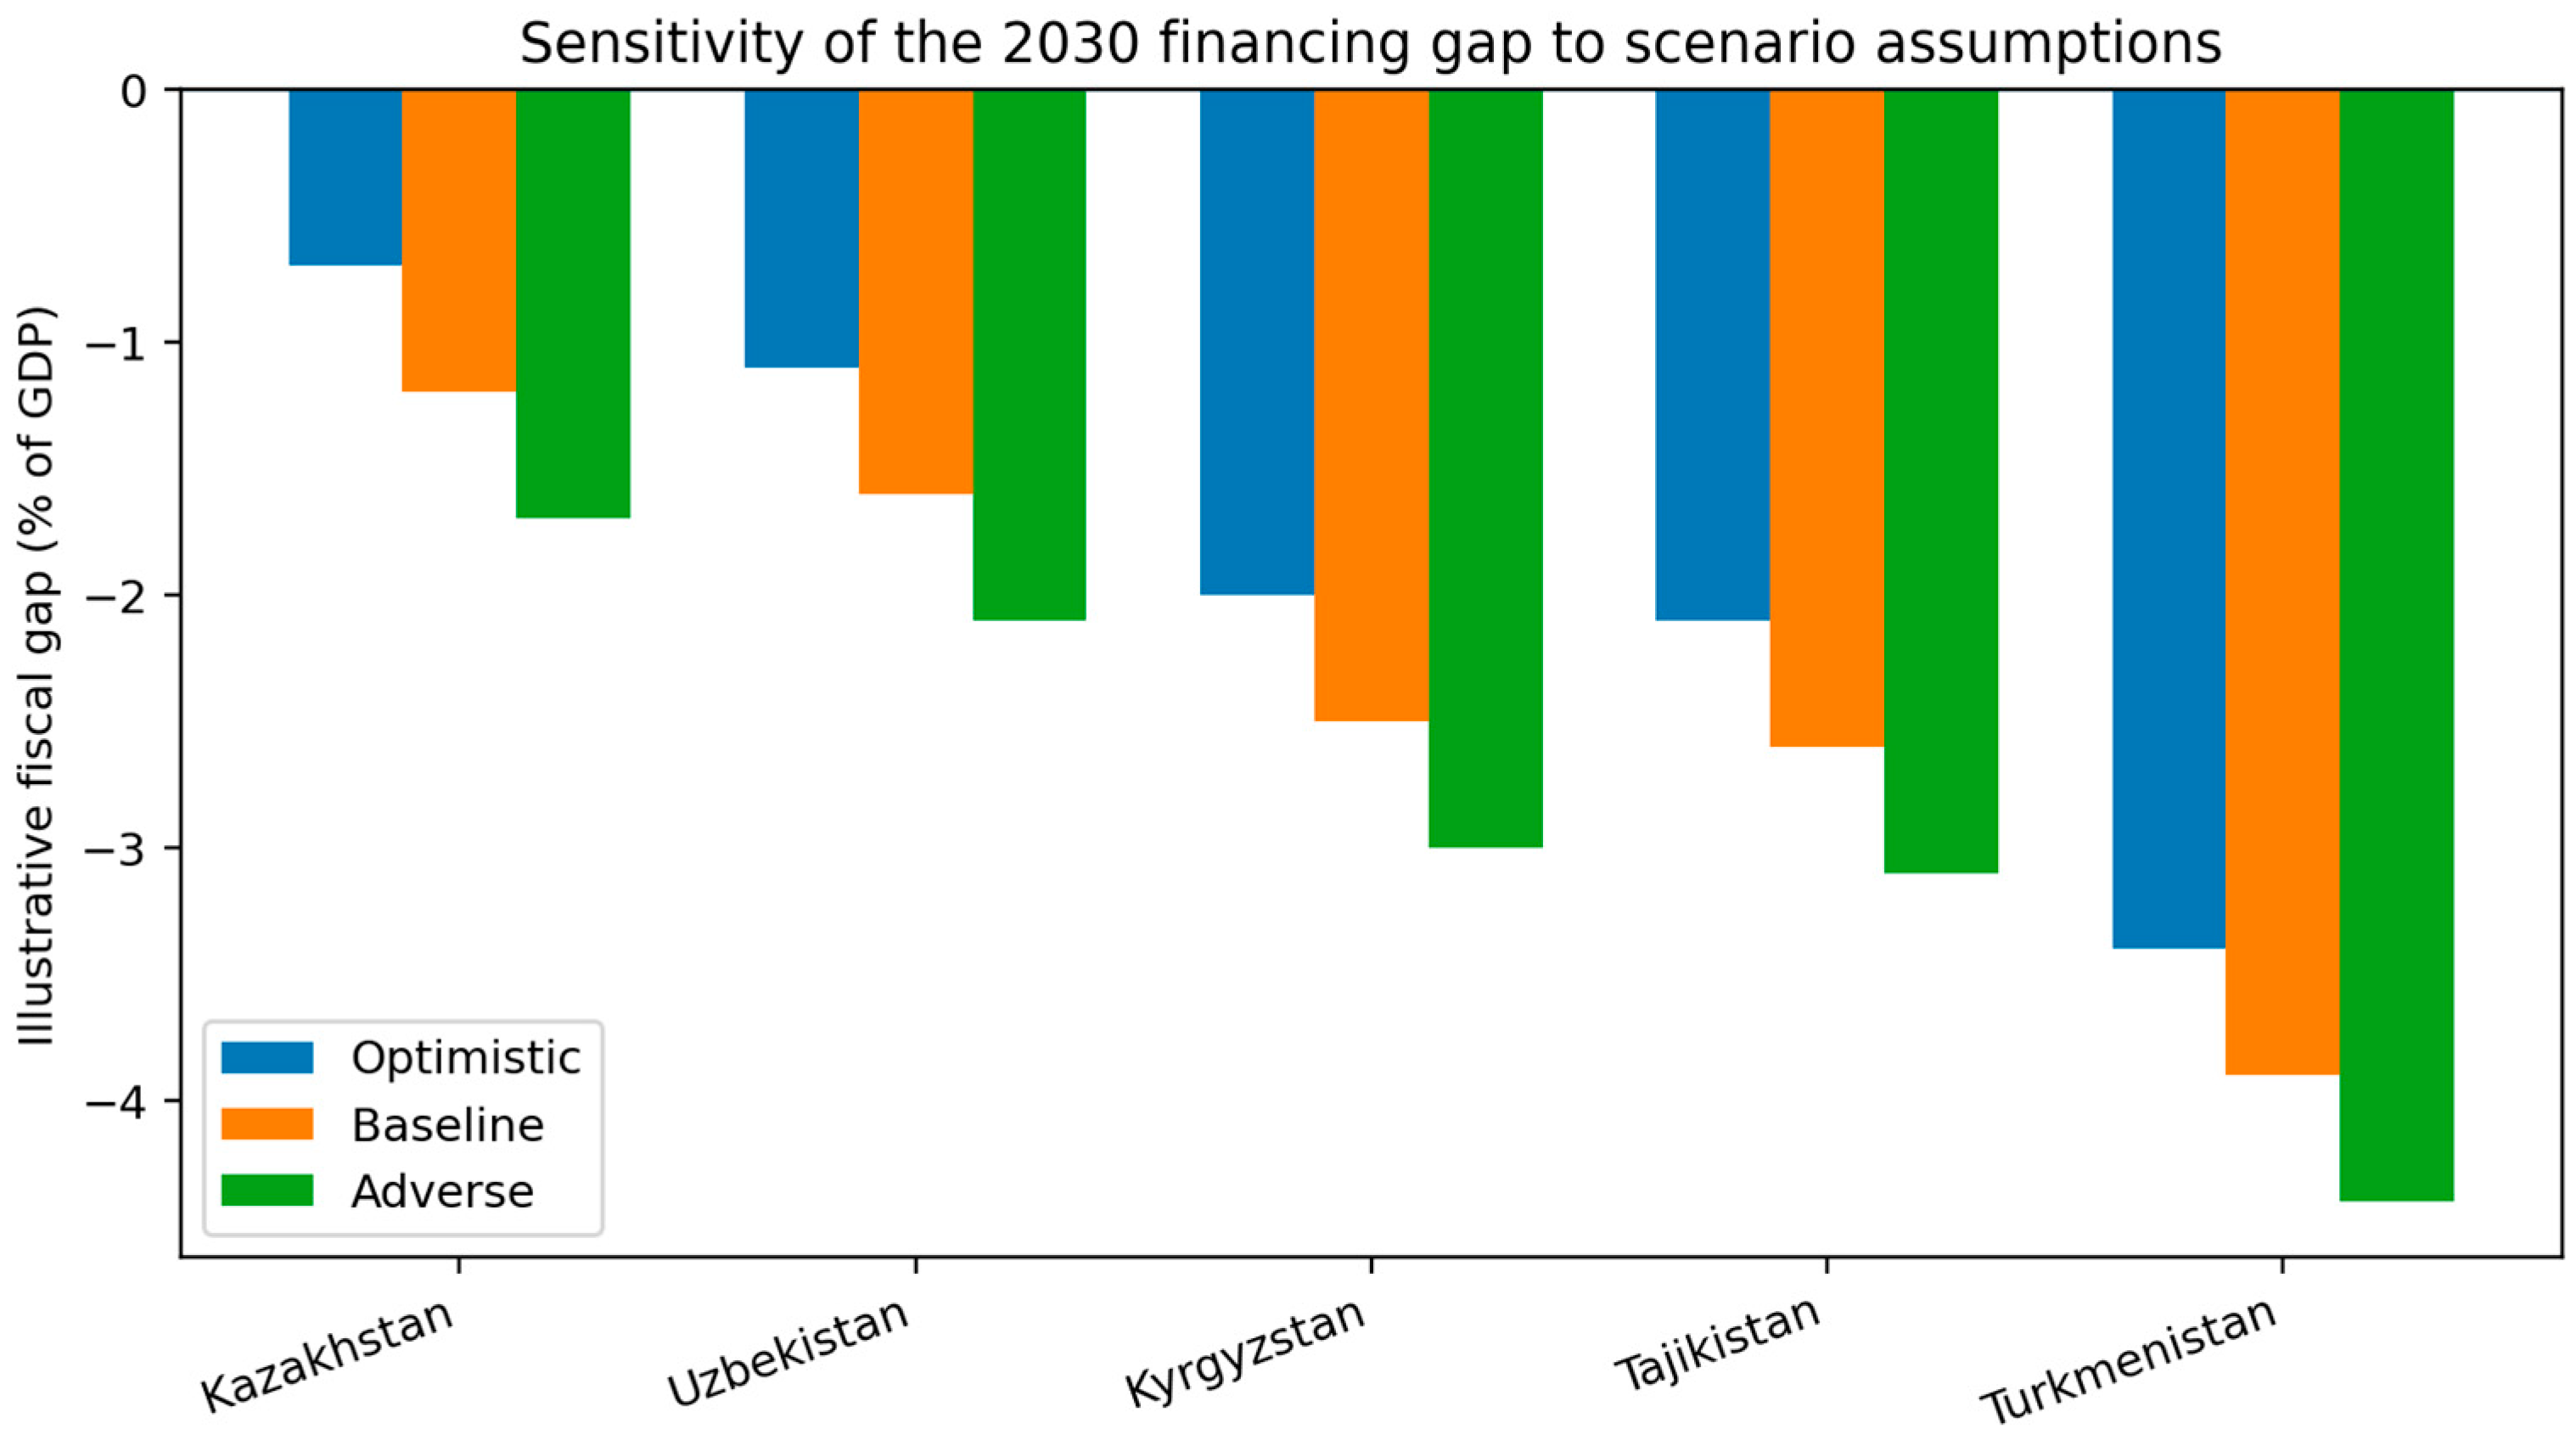
The baseline scenario reproduces the ranking in the submitted manuscript: Kazakhstan and Uzbekistan have smaller illustrative shortfalls than Kyrgyzstan, Tajikistan, and Turkmenistan. Under the optimistic assumption, all gaps narrow by 0.5 percentage points of GDP; under the adverse assumption, they widen by the same amount.
The exercise demonstrates sensitivity rather than precision. It does not justify a single tax reform, expenditure cut, or borrowing strategy. Country-specific fiscal analysis should incorporate revenue structure, expenditure efficiency, demographic trends, debt service costs, and the costed benefit package (Table 7) (Figure 2).
Table 7.
Illustrative public health financing capacity and gap scenarios for 2030 (% of GDP).
Figure 2.
Sensitivity of the illustrative 2030 fiscal gap to alternative assumptions. The scenario chart is descriptive. It visualizes how the gap changes when projected capacity shifts by ±0.5 percentage points of GDP.
The projections reveal diverging and severe fiscal pressures. Given the regional elasticity of public health financing relative to GDP growth, the projected real macroeconomic growth rates are structurally insufficient to meet the per capita government health spending minimums required for SDG 3 by 2030.For Kazakhstan and Uzbekistan, the gap is manageable but will require concerted political will to reallocate existing budgets or marginally increase taxation. However, for Tajikistan and Kyrgyzstan, the model projects a severe financing gap equivalent to 2.5–2.6% of GDP annually. Turkmenistan faces the largest gap relative to its current baseline, though its massive hydrocarbon wealth means this gap is a function of political allocation choices rather than absolute fiscal constraint. Ultimately, unless external Development Assistance for Health (DAH) is drastically scaled up, or radical domestic tax reforms are enacted to broaden the revenue base, attempts to unilaterally force UHC expansion in the lower-income republics will likely trigger sovereign debt distress, crowding out other vital public investments.
5. Discussion
5.1. Main Interpretation
The empirical results are consistent with the dual risk allocation framework. Higher public health financing and broader social protection are associated with a lower OOP share, suggesting that public pooling and income protection can jointly reduce the proportion of health costs borne directly by households. At the same time, combined expenditure is positively associated with public debt in the reported fiscal model, suggesting that protection can become fiscally pressured when revenue and efficiency do not adjust at the same pace.
The findings do not imply that social spending is inherently unsustainable. The debt association is conditional on the model, period, and controls. Public spending may be financed sustainably through stronger revenue mobilization, reprioritization, improved purchasing, lower leakage, or economic growth. Equally, a stable debt ratio is not sufficient evidence of a fair system if fiscal containment is achieved by shifting medical costs to households.
The magnitude and sign stability across FE and GMM sensitivity columns are informative, but the very small cross-section prevents strong claims about estimator reliability. The revised interpretation therefore places FE at the centre, treats GMM as supplementary, and emphasizes the need for replication rather than presenting diagnostic p-values as proof of validity.
5.2. Country Heterogeneity and Within-Country Inequality
Central Asian countries differ substantially in fiscal resources, migration patterns, benefit packages, and health system organization. Kazakhstan’s social health insurance reform, Kyrgyzstan’s co-payment and coverage gaps, Tajikistan’s high OOP burden, and Uzbekistan’s ongoing benefit package reforms illustrate why one regional coefficient cannot prescribe one institutional model. Turkmenistan presents a further data and institutional comparability challenge.
National indicators also conceal important inequalities. Urban–rural access, medicine availability, income, gender, disability, migration status, and informal employment can affect who benefits from public expenditure.
5.3. Policy Implications
The first implication is that health financing and social protection should be coordinated. A health benefit package may fail to protect households if income support, eligibility rules, and enrolment administration leave vulnerable groups outside effective coverage. Conversely, cash benefits cannot substitute for a sufficiently funded and accessible health system.
The second implication is that expenditure composition and purchasing matter. Increasing public health spending is more likely to improve financial protection when resources finance essential medicines, primary care, and effective risk pooling rather than simply expanding high-cost inputs. Country-specific expenditure reviews and strategic purchasing reforms are therefore more directly supported by the findings than broad recommendations to increase spending without conditions.
The third implication is fiscal. The scenario results support regular medium-term fiscal analysis that links health and social commitments to realistic revenue, efficiency, and debt service assumptions. Options such as general taxation, payroll contributions, excise taxation, subsidy reform, or external assistance require separate analysis of distributional effects, political feasibility, and macroeconomic consequences. The article therefore presents these as policy options for further evaluation, not as prescriptions established by the regression.
5.4. Limitations
The panel contains only five countries. System GMM asymptotics and overidentification tests are therefore weak foundations for strong inference.
The archived estimation output does not report AR(1), instrument count, lag windows, collapse status, or the interpolation audit trail. These omissions prevent full replication from the manuscript file alone.
Linear interpolation may introduce artificial smoothness and serial correlation. Results should be replicated on the unbalanced, non-interpolated panel.
National aggregates do not identify household-level catastrophic expenditure, impoverishment, or urban–rural and socioeconomic inequalities.
OOP as a share of current health expenditure is an imperfect proxy for equity. A lower share can reflect higher pooled spending, reduced use, or changes in the composition of care.
The fiscal scenario is illustrative and does not model interest rates, primary balances, demographic change, exchange rate risk, or country-specific revenue functions.
Data quality and comparability are particularly constrained where public reporting is incomplete or revised irregularly.
5.5. Future Research
Future research should combine household expenditure surveys with administrative insurance and social protection registries to estimate catastrophic and impoverishing payments by income, employment status, gender, and location. Subnational analysis is particularly important for geographically large countries and areas with unequal provider availability.
A replication package should publish the country–year dataset, source dates, imputation flags, estimation code, full GMM logs, and leave-one-country-out results. Alternative estimators suitable for very small N and moderate T should be compared with FE and restricted GMM. The fiscal component should be extended to a country-specific medium-term framework that models revenue, primary balances, interest growth differentials, and expenditure efficiency.
6. Conclusions
This study provides robust, quantitatively grounded empirical evidence that the realization of health equity and long-term macro-fiscal sustainability in Central Asia depends entirely on the deliberate, strategic harmonization of healthcare financing and broader social protection policies. The dynamic panel data analysis confirms that expansive, well-funded social protection floors act as a critical, highly effective complementary mechanism to direct public health spending, significantly reducing the regressive and impoverishing burden of out-of-pocket payments across the population.
However, the region’s aggressive, ongoing pivot toward Mandatory Social Health Insurance (SHI) systems presents severe fiscal and equitable risks if deployed in isolation within economies characterized by high informality and labor migration. While SHI mechanisms have demonstrated the theoretical capacity to aggregate funds and lower overall national OOP averages—as evidenced by Kazakhstan’s recent reforms—they structurally exclude the vast informal, agricultural, and self-employed sectors. This exclusion leaves the most vulnerable populations exposed to catastrophic health expenditures and medical impoverishment. Furthermore, the econometric modeling of fiscal sustainability and the subsequent 2030 projections indicate that ambitious, legislated expansions of health and social entitlements, without requisite structural reforms to broaden the underlying tax base, will inevitably precipitate unsustainable sovereign debt accumulation. This risk is particularly acute in remittance-reliant, lower-income nations such as Tajikistan and Kyrgyzstan, where traditional payroll taxation is fundamentally constrained.
To navigate this highly complex nexus and achieve the SDG 3.8 Universal Health Coverage targets by 2030, Central Asian policymakers must pursue a cohesive, tri-fold strategic agenda. First, statutory entitlements to essential health services must be decisively decoupled from formal employment status; SHI schemes require heavy, sustained, and legally mandated subsidization from general government revenues to cover the informal sector comprehensively. Second, to generate the necessary fiscal space without destabilizing national debt trajectories, governments must radically shift away from distortive, narrow payroll taxes toward broad-based progressive general taxation, implementation of health-specific excise taxes, and the politically courageous elimination of regressive fossil fuel subsidies. Third, simultaneous supply-side structural reforms are imperative; reallocating existing health budgets away from resource-intensive, legacy hospital networks toward robust, decentralized Primary Health Care will maximize both systemic operational efficiency and equitable access. Ultimately, treating health financing and social protection not as isolated bureaucratic silos, but as a unified macroeconomic strategy, is not merely a moral imperative, but the only mathematically viable pathway to sustainable, inclusive human development in the region.
The reported evidence is consistent with a relationship in which greater public health financing and broader social protection are associated with lower aggregate OOP expenditure in Central Asia. At the same time, social and health expenditure is positively associated with public debt in the fiscal model. The combined result supports an integrated approach: financial protection should be evaluated together with the revenue and efficiency mechanisms that finance it.
The results are not causal and should not be generalized beyond the five-country, ten-year panel. The small cross-section, incomplete GMM diagnostic record, interpolation uncertainty, and reliance on national aggregates materially limit inference. Policy conclusions are therefore framed as conditional implications and research priorities.
The next stage is to connect macro-fiscal analysis with household and subnational evidence. A reproducible regional dataset, transparent imputation flags, small-sample estimators, and country-specific fiscal scenarios would allow the debate on UHC and social protection in emerging economies to move from aggregate association toward distributional and institutional explanation.
Author Contributions
Conceptualization, A.K. and R.I.; methodology, A.K. and Z.I.; software, R.I.; validation, A.K., R.I. and Z.I.; formal analysis, A.K. and R.I.; investigation, A.K., R.I. and Z.I.; resources, R.I. and Z.I.; data curation, R.I.; writing—original draft preparation, A.K.; writing—review and editing, A.K., R.I. and Z.I.; visualization, R.I.; supervision, Z.I.; project administration, A.K.; funding acquisition, A.K. and Z.I. All authors have read and agreed to the published version of the manuscript.
Funding
This research received no external funding.
Institutional Review Board Statement
Not applicable.
Informed Consent Statement
Not applicable.
Data Availability Statement
The datasets analyzed in this study are openly available and derived from resources in the public domain. Macroeconomic and health financing data were derived from the World Bank World Development Indicators (WDI) and the Global Health Expenditure Database (GHED), accessible via [https://data.worldbank.org/ (accessed on 22 May 2026)]. Social protection statistics were derived from the Asian Development Bank (ADB) Social Protection Indicator (SPI) database, accessible via [https://spi.adb.org/ (accessed on 22 May 2026)]. Sovereign debt data were sourced from the International Monetary Fund (IMF) Global Debt Database, accessible via [https://www.imf.org/external/datamapper/ (accessed on 22 May 2026)].
Conflicts of Interest
The authors declare no conflicts of interest.
Abbreviations
| CHE | Current Health Expenditure |
| GDP | Gross Domestic Product |
| GGHE | General Government Health Expenditure |
| OOP | Out-of-Pocket Expenditure |
| UHC | Universal Health Coverage |
| SDGs | Sustainable Development Goals |
| FPI | Financial Protection Index |
| FSSR | Fiscal Sustainability Stress Ratio |
| SP | Social Protection |
| WHO | World Health Organization |
| FEM | Fixed Effects Model |
| GMM | Generalized Method of Moments |
References
- Arellano, M., & Bover, O. (1995). Another look at the instrumental variable estimation of error-components models. Journal of Econometrics, 68(1), 29–51. [Google Scholar] [CrossRef] [Scilit]
- Asante, A., Price, J., Hayen, A., Jan, S., & Wiseman, V. (2016). Equity in health care financing in low- and middle-income countries: A systematic review of evidence from studies using benefit and financing incidence analyses. PLoS ONE, 11(4), e0152866. [Google Scholar] [CrossRef] [Scilit] [PubMed]
- Bierbaum, M., & Schmitt, V. (2022). Investing more in universal social protection: Filling the financing gap through domestic resource mobilization and international support and coordination (ILO Working Paper No. 44). International Labour Organization. [Google Scholar]
- Blundell, R., & Bond, S. (1998). Initial conditions and moment restrictions in dynamic panel data models. Journal of Econometrics, 87(1), 115–143. [Google Scholar] [CrossRef] [Scilit]
- Cattaneo, U., Schwarzer, H., Razavi, S., & Visentin, A. (2024). Financing gap for universal social protection: Global, regional and national estimates and strategies for creating fiscal space (ILO Working Paper No. 113). International Labour Organization. [Google Scholar]
- Chlomoudis, C., Pallis, P., Platias, C., & Styliadis, T. (2026). Embedding social sustainability in port concession agreements: A structured indicator framework. Sustainability, 18(7), 3347. [Google Scholar] [CrossRef] [Scilit]
- European Observatory on Health Systems and Policies. (2024). Health systems in action 2024: Kazakhstan. World Health Organization. Available online: https://eurohealthobservatory.who.int/publications/i/health-systems-in-action-kazakhstan-2024 (accessed on 11 June 2026).
- Hsu, J. (2026). Financial protection in health: Advancing measurement and system-level evidence for universal health coverage [Doctoral dissertation, London School of Hygiene & Tropical Medicine]. [Google Scholar]
- Karakolias, S., Nektarios, M., Xenos, P., & Polyzos, N. (2026). Reducing private health expenditure in Greece: The case for regulated complementary health insurance. Frontiers in Public Health, 14, 1810695. [Google Scholar] [CrossRef] [Scilit] [PubMed]
- Matthew, C., & Martin, A. (2026). The pervasiveness of digital identity: Surveying themes, trends, and ontological foundations. Information, 17(1), 85. [Google Scholar] [CrossRef] [Scilit]
- McIntyre, D., Meheus, F., & Røttingen, J.-A. (2017). What level of domestic government health expenditure should we aspire to for universal health coverage? Health Economics, Policy and Law, 12(2), 125–137. [Google Scholar] [CrossRef] [Scilit] [PubMed]
- Ogujiuba, K. K. (2023). Which demographic quintile benefits from public health expenditure in Nigeria: A marginal benefit analysis. Economies, 10(10), 253. [Google Scholar] [CrossRef] [Scilit]
- Prinja, S. (Ed.). (2026). Healthcare financing and insurance: A guide for practitioners, professionals, and policymakers. Springer Nature. [Google Scholar]
- Ravindran, T. S., Hebbar, P., Bhushan, A., Nambiar, D., Mishra, S., Mohan, M., & Sivakami, M. (2024). Sex and gender issues in health systems in South Asia: An overview. In Handbook on sex, gender and health: Perspectives from South Asia (pp. 1–46). Springer. [Google Scholar]
- Roodman, D. (2009). How to do xtabond2: An introduction to difference and system GMM in Stata. The Stata Journal, 9(1), 86–136. [Google Scholar] [CrossRef] [Scilit]
- Toumi, K., Hussainey, K., & Khan, T. (2026). Guest editorial: Islamic finance and sustainable development in the Anthropocene era. Sustainability Accounting, Management and Policy Journal, 17(4), 1013–1019. [Google Scholar] [CrossRef] [Scilit]
- Wagstaff, A., & Moreno-Serra, R. (2009). Europe and Central Asia’s great post-communist social health insurance experiment: Aggregate impacts on health sector outcomes. Journal of Health Economics, 28(2), 322–340. [Google Scholar] [CrossRef] [Scilit] [PubMed]
- Windmeijer, F. (2005). A finite sample correction for the variance of linear efficient two-step GMM estimators. Journal of Econometrics, 126(1), 25–51. [Google Scholar] [CrossRef] [Scilit]
- World Health Organization Regional Office for Europe. (2024). Roadmap for health and well-being in Central Asia (2022–2025): Progress and opportunities (60p). World Health Organization Regional Office for Europe. Available online: https://www.who.int/europe/publications/i/item/WHO-EURO-2024-10121-49893-74975 (accessed on 11 June 2026).
- Zahid, H., & Jillani, H. (2023). Has FinTech functioned as a nudge for the SDGs implementation? A systematic review. International Journal of Business and Economic Affairs, 8(4), 68–78. [Google Scholar] [CrossRef] [Scilit]

Disclaimer/Publisher’s Note: The statements, opinions and data contained in all publications are solely those of the individual author(s) and contributor(s) and not of MDPI and/or the editor(s). MDPI and/or the editor(s) disclaim responsibility for any injury to people or property resulting from any ideas, methods, instructions or products referred to in the content. |
© 2026 by the authors. Licensee MDPI, Basel, Switzerland. This article is an open access article distributed under the terms and conditions of the Creative Commons Attribution (CC BY) license.