


Abstract
This study examines the structural evolution of the global banana trade network using a Social Network Analysis (SNA) framework across six observation years (2010, 2015, 2019, 2020, 2021, and 2024), tracing how countries’ structural positions shift throughout the study period while highlighting the contrast between the initial and final network configurations. The results show that the network evolved from a relatively centralized structure in 2010, centered on a small core comprising Ecuador and the United States, to a denser and more multi-centered configuration by 2024. While Ecuador maintained a central role, countries such as Guatemala, Costa Rica, and Honduras strengthened their structural positions, reflected by increased connectivity and higher centrality scores. In particular, Guatemala’s transition from the periphery to the core illustrates the importance of network position in relation to export performance. The findings suggest that trade influence is associated not only with production capacity but also with relational positioning, connectivity, and brokerage roles. While this study employs descriptive network analysis and cannot establish causal mechanisms, the results indicate that network-based approaches provide valuable insights into the structural dynamics of the global banana trade that complement traditional volume-based analyses.
1. Introduction
Bananas represent a strategic agricultural commodity within global trade, serving both as a staple food and as an important source of export revenue for many countries. Although production is geographically concentrated, consumption spans all continents, creating complex interdependencies between producing and importing nations. With cultivation in more than 130 countries and annual trade volumes reaching approximately 20 million tons, the banana market reflects not only agricultural activity but also the distribution of economic influence across regions such as Latin America, the Caribbean, Southeast Asia, and West Africa (Evans & Ballen, 2012; FAO, 2026a). At the same time, the sector remains vulnerable to climatic shocks, biological threats such as Panama disease, rising production costs, and logistical disruptions, all of which create persistent uncertainty for exporters (FAO, 2026b). Recent market reports indicate a recovery in global banana trade; however, differences in production and export performance across countries have widened. This suggests that differences in trade outcomes are increasingly associated with structural and relational factors that extend beyond production volume alone.
Traditional analyses of commodity trade typically focus on supply–demand dynamics, export quantities, or price trends. Yet such approaches often overlook the relational structure underlying trade exchanges—specifically, the patterns and intensities of connections that determine countries’ positions within global trade systems. From a network perspective, global trade can be understood not merely as a flow of goods but as a structured web of interdependencies in which connectivity patterns are associated with differences in market access, export diversification, and competitive positioning. Building on network-based perspectives and the concept of structural embeddedness, this study approaches banana trade as a networked system. In this framework, repeated and diversified trade ties represent structural characteristics associated with export performance, reflecting differences in market integration, concentration risk, and access to multiple markets. Countries located closer to the network core tend to benefit from higher centrality and broader connectivity, whereas peripheral actors remain more exposed to demand-side shocks and face limited opportunities for diversification. Although this study does not directly model financial variables, it interprets network position through an economic lens, emphasizing how structural positioning is related to export stability and long-term competitiveness. Existing research on banana trade has primarily addressed pricing dynamics, demand elasticity, value-chain governance, and production constraints. Comparatively less attention has been paid to how countries’ roles evolve within the architecture of global banana trade, particularly from a longitudinal and structural perspective. Despite the increasing application of network analysis in international trade research, product-specific studies that examine how countries reposition themselves within trade networks over time remain limited. This study addresses this gap by moving beyond traded volumes to focus on how countries are embedded within the trade network and how this embeddedness evolves over time. Using Social Network Analysis (SNA) and UCINET, the study examines the global banana export network across six observation years (2010, 2015, 2019, 2020, 2021, and 2024), tracing how countries’ structural positions evolve throughout the study period while highlighting the contrast between the initial and final network configurations. The analysis specifically investigates how structural positions within the network evolve and whether growth in production capacity translates into stronger trade influence. To capture this dynamic, Türkiye and Guatemala serve as contrasting cases. Türkiye has experienced a substantial increase in banana production—approximately fourfold over the study period—yet its integration into global trade networks remains limited. In contrast, Guatemala has strengthened its network position, accompanied by more diversified trade linkages and closer integration with core actors. This comparison does not imply a one-directional causal relationship between network position and export performance; rather, it highlights how production capacity and trade network integration may evolve differently across countries. This contrast highlights a critical divergence between production capacity and network positioning. It suggests that export dominance in the global banana trade is associated not only with output levels but also with differences in network positioning, connectivity patterns, and the configuration of relational ties. These considerations motivate the research questions that guide this study:
RQ1: How has the structure of the global banana trade network evolved between 2010 and 2024?
RQ2: How have core and peripheral countries been positioned within the global banana trade network during this period?
RQ3: To what extent are differences in countries’ network positions associated with export-oriented roles beyond production capacity?
The remainder of the paper is organized as follows. Section 2 reviews the relevant literature on global banana trade and trade-network analysis. Section 3 describes the data and the structure of global banana production and trade. Section 4 presents the Social Network Analysis (SNA) methodology. Section 5 reports the empirical findings, focusing on changes in centrality measures and overall network structure across the six observation years. Section 6 discusses the policy and strategic implications derived from the observed structural transformations. Finally, Section 7 concludes by summarizing the main findings and outlining policy implications for network-oriented export strategies.
2. Literature Review
Banana production and trade have attracted considerable attention in the literature due to the product’s economic importance and its role in global food systems. Few agricultural commodities illustrate the tension between global market integration and local production vulnerability as clearly as bananas. Although commonly perceived as a tree crop, bananas are herbaceous plants with short production cycles and high sensitivity to environmental conditions, biological characteristics that directly influence production stability and trade continuity. Originating from tropical regions of South and Southeast Asia, bananas gradually became one of the most globally traded fruit products (Rainforest-Alliance, 2016). The increasing commercial importance of bananas since the nineteenth century has positioned them as a strategic commodity for many developing economies, particularly in Latin America, Africa, and Southeast Asia.
2.1. Literature on Banana Markets
Existing studies on banana markets can broadly be grouped into several thematic clusters. The first cluster focuses on demand behavior and pricing dynamics. Research in this area includes econometric analyses of household consumption patterns (Burrel & Henningsen, 2001), comparative analyses of conventional and organic banana prices (Evans & Ballen, 2012), and demand estimation using retail purchase data (Lin et al., 2009). Price transmission, market integration, and spatial relationships have also been analyzed through econometric approaches such as ADF tests, Granger causality, and spatial cointegration methods (Adeyo et al., 2011; Omar et al., 2014).
A second group of studies emphasizes value-chain structures and production systems. Omua and Jagwe (2010) examined value-chain mapping and gross margin structures in Central Africa, while Debebe and Dagne (2018) analyzed socio-economic determinants affecting banana production. Ambisa et al. (2019) investigated production and marketing conditions in Ethiopia, highlighting structural and institutional constraints. Another study analyzed consumer preferences through hedonic pricing methods (Basan, 2017).
In the Turkish context, research has largely followed similar lines, concentrating on demand structures, import dynamics, and domestic market conditions. Hatirli et al. (2003) analyzed banana demand and import structure in Türkiye using econometric methods, while sectoral reports evaluated production and supply–demand conditions.
Taken together, these studies provide valuable insights into pricing behavior, production dynamics, and market performance. However, the dominant emphasis on volume-based or price-based indicators tends to overlook the relational dimension of trade, namely how countries’ positions within a broader network of trading partners may shape market access, influence, and resilience.
2.2. Social Network Analysis in Trade Studies
The literature on global agricultural trade has traditionally relied on aggregate indicators such as output volumes, price trajectories, and macro-level trade flows. While these measures provide useful snapshots of market scale and performance, they often obscure the relational dynamics that underpin actual trading systems. Trade is not merely a sum of independent bilateral transactions; rather, it unfolds through networks of recurring relationships whose structure may influence stability and resilience. In systems where production is geographically concentrated but consumption is globally dispersed, ignoring connectivity patterns may conceal why some exporters maintain stability while others become more vulnerable to external shocks.
Social Network Analysis (SNA) has increasingly emerged as a methodological approach capable of addressing this limitation by conceptualizing trade as a relational system rather than a collection of isolated actors. Studies based on SNA and complex network approaches have examined global trade structures (Jiang et al., 2019; Vidya & Taghizadeh-Hesary, 2021; Yang et al., 2015), as well as regional or country-specific networks including Africa (Zhang & Batinge, 2021), ASEAN countries (Pacini et al., 2021), Latin America (Olvera & Spinola, 2022), and the Shanghai Cooperation Organization (Wang & Sun, 2015).
Beyond aggregate trade structures, SNA has been applied across a wide range of sectors. These include general trade networks (Vidya & Taghizadeh-Hesary, 2021), energy trade (Dong et al., 2021; Fu et al., 2021; Ren et al., 2022; Yang et al., 2015), food and agricultural products (Deng et al., 2021; Hu et al., 2021), textiles and clothing (Angelidis et al., 2021; Choi et al., 2021), and electronic products (Zhu & Liu, 2023). Applications also extend beyond trade to cultural and institutional relations and firm-level supply network performance (Shi et al., 2019). Collectively, this body of research demonstrates that SNA provides not only a technical toolkit but also a relational lens through which economic interaction can be interpreted.
Within the context of banana trade specifically, Solís Rivera et al. (2023) analyzed trade relations between producer and importer countries in the European Union banana market using 2019 trade data and SNA methods. Their findings indicate that countries such as Germany, the Netherlands, Spain, and the United Kingdom occupy central positions in the network and that EU banana trade exhibits a complex, multi-centered, and heterogeneous structure.
2.3. Theoretical Framework: Network Position and Trade Structure
Traditional explanations of agricultural export performance have generally emphasized production capacity, natural resource availability, and comparative advantages. However, network-based perspectives suggest that economic outcomes are also influenced by the structural position of actors within systems of relationships. Granovetter’s (1985) theory of structural embeddedness argues that economic actions are not isolated market transactions but are embedded within ongoing networks of social and economic relations. Similarly, Uzzi (1996) demonstrates that embedded relationships may create economic advantages by facilitating trust, information exchange, and coordination among connected actors.
From this perspective, international trade can be interpreted not only as the movement of commodities between countries but also as a network structure in which countries occupy different positions according to their patterns of connectivity. Freeman (1978) provides the conceptual foundation for centrality analysis by demonstrating that actors can differ systematically according to their location within a network structure. Therefore, centrality measures allow researchers to examine whether certain countries occupy more connected and strategically important positions within global trade systems.
Recent empirical evidence further supports the importance of network position in explaining economic outcomes. Ayadi et al. (2024) show that country-sector trade network centrality contributes additional explanatory power beyond direct global value chain participation, indicating that the connectivity of the surrounding trade environment represents an important dimension of economic performance. This suggests that the structure of trade relationships may provide insights that cannot be captured by production capacity or trade volume alone.
The core–periphery perspective within network analysis provides another framework for examining asymmetric structures in international trade. Borgatti and Everett (2000) conceptualize core actors as those occupying densely connected positions, whereas peripheral actors maintain fewer or weaker connections. Applying this perspective to trade networks enables the identification of dominant exporters and the evaluation of whether emerging countries move toward more central positions over time.
Finally, the global value chain (GVC) literature emphasizes that participation in international markets depends not only on production capabilities but also on relationships, coordination mechanisms, and governance structures within global production systems. Gereffi et al. (2005) argue that differences in transaction complexity, information coordination, and supplier capabilities shape the governance of global value chains and create varying degrees of power asymmetry among participants. This perspective is particularly relevant for agricultural commodities such as bananas, where production locations and influential positions within export networks may not necessarily overlap. In the banana sector, multinational trading firms and large retailers play important roles in coordinating production, logistics, and access to international markets. Therefore, country-level network positions may partly reflect broader integration into global value chains rather than production capacity alone.
Based on these theoretical foundations, this study considers network position as a complementary dimension for understanding export performance. Rather than assuming that production capacity alone explains differences in export positioning, the study examines how structural embeddedness, trade connectivity, and core–periphery dynamics are associated with countries’ roles within the global banana trade network. In this study, structural embeddedness is operationalized through observable network characteristics, including centrality indicators, ego network structures, and core–periphery positions. These measures capture differences in countries’ structural positions within the banana trade network rather than establishing direct causal mechanisms.
2.4. Research Gap and Contribution
Despite the theoretical importance of structural embeddedness, network position, and global value chain integration, empirical research examining how these mechanisms are reflected in commodity-specific trade networks remains relatively limited. Existing SNA-based trade studies have provided important insights into the structural characteristics of international trade systems; however, many studies focus on aggregate trade flows or provide static network representations rather than examining how countries’ positions evolve over time.
In the context of banana trade, this limitation is particularly relevant because production capacity and export-oriented network influence are not necessarily concentrated in the same countries. Major producers may remain weakly connected to global export networks, whereas countries with lower production volumes may achieve more central positions through stronger integration with international markets. Therefore, examining network structure provides a complementary perspective for understanding differences in countries’ roles within global agricultural trade.
This study addresses this gap by adopting a longitudinal network perspective across six observation years between 2010 and 2024. Rather than focusing solely on production capacity, export volumes, or conventional trade indicators, the study examines how countries are embedded within the global banana export network and how their structural positions evolve over time. By applying Social Network Analysis (SNA), including centrality measures, hub–authority analysis, and core–periphery modeling, the study provides a network-based interpretation of strategic positioning in global agricultural trade.
Accordingly, this study contributes to the literature in two principal ways. First, it provides a commodity-specific application of Social Network Analysis to the global banana trade, extending the use of network-based approaches beyond aggregate trade systems. Second, it adopts a longitudinal design spanning six observation years between 2010 and 2024, enabling the structural repositioning of countries within the global banana trade network to be examined over time. Together, these contributions provide new insights into why countries with similar or increasing production capacities may occupy markedly different structural positions within international trade networks, highlighting the importance of relational connectivity and network embeddedness in shaping export-oriented influence.
3. Data Description and Trade Structure
Global banana production and trade are characterized by a clear geographical separation between production centers and consumption markets. While production is mainly concentrated in tropical regions across Asia, Latin America, Africa, and the Caribbean due to climatic conditions, participation in international trade is associated not only with production capacity but also with the ability of countries to establish diversified trade relationships (Debebe & Dagne, 2018).
As with other agricultural commodities, banana trade networks are affected by changes in supply conditions, market demand, climatic risks, and global disruptions. Therefore, production volume alone may not fully explain the strategic position of countries within international markets.
The analysis is based on FAO trade data covering six observation years (2010, 2015, 2019, 2020, 2021, and 2024). It should be noted that the most recent trade data may be subject to subsequent updates due to reporting delays and revisions from national statistical authorities. Therefore, the 2024 results are interpreted considering the provisional nature of the latest available trade information. To maintain consistency, the network was constructed using officially reported trade relationships available in the FAO database, and missing observations were not estimated or interpolated. The inclusion of intermediate years reduces dependence on a simple two-period comparison and provides a broader perspective on structural changes in the banana trade network.
The selection of the 43 countries was based on their structural relevance within the global banana trade system rather than a random sampling approach. The sample includes major banana producers, leading exporters, important import markets, and countries functioning as redistribution hubs, while also considering the availability of consistent trade data throughout the observation period. This approach allows the network to capture different functional roles, including export-oriented producers, production-dominant countries, demand centers, and intermediary trade actors.
The European Union is presented as an aggregated category only in the descriptive statistics to illustrate its overall importance in the global banana market. However, for the Social Network Analysis, EU member states are treated as individual nodes because countries such as Germany, Italy, and the Netherlands maintain distinct trade relationships and perform different roles within the network. This disaggregated approach prevents the loss of country-specific network positions and provides a more accurate representation of bilateral trade structures. Similarly, the United Kingdom was treated as a separate country node throughout the entire observation period (2010–2024) to maintain a consistent network boundary, regardless of its changing institutional relationship with the European Union after 2020.
Table 1 summarizes the main groups of countries included in the network analysis according to their production and trade characteristics. The classification highlights the distinction between export-oriented producers, production-dominant economies, import-dependent markets, and redistribution hubs, which provides the basis for examining structural roles within the global banana trade network.
Table 1.
Country Classification and Expected Network Roles in the Global Banana Trade Network.
The comparison between production and trade roles highlights an important distinction between production capacity and international network positioning. Some countries, such as India and China, represent major banana producers but maintain more limited roles in international trade networks because a substantial share of production is absorbed by domestic markets. In contrast, export-oriented producers such as Ecuador, Guatemala, and Costa Rica are associated with stronger positions in the trade network, reflecting their extensive international trade relationships. Moreover, countries with limited or no banana production may still obtain important network positions through intermediary and redistribution functions. For example, the Netherlands represents a redistribution hub within the European market, demonstrating that network indicators capture functional roles in trade systems rather than production volume alone.
The global banana trade network was constructed using bilateral trade data obtained from the FAO database. In response to the need for a broader representation of the global banana market, the initial country sample was expanded to include major producers, leading exporters, key import markets, and important re-export or redistribution hubs. This approach allows the analysis to capture not only production-based actors but also countries that play strategic intermediary roles within global trade flows.
Unlike conventional production-based assessments, the network sample was defined according to countries’ participation in international banana trade relationships. Therefore, countries with large domestic production but limited exports and countries with relatively lower production but strong trade connectivity were both included. This distinction is important because network influence may arise from trade positioning rather than production volume alone.
To examine the structural evolution of the banana trade network, six observation years were selected: 2010, 2015, 2019, 2020, 2021, and 2024. The inclusion of intermediate years enables a more comprehensive assessment of network dynamics and reduces dependence on a simple two-period comparison. In particular, the selected years allow the analysis to capture pre-pandemic conditions, the period affected by global supply chain disruptions, and the most recent trade structure.
For each year, a country-by-country trade matrix was constructed, where rows represent exporting countries and columns represent importing countries. Accordingly, each network tie represents a directed export relationship from country i to country j. The value of each connection corresponds to the reported banana export volume, resulting in a directed and weighted trade network.
To provide production-related context for the subsequent network analysis, Table 2 reports banana production volumes for the selected countries across the six observation years.
Table 2.
Banana production statistics for selected countries in 2010, 2015, 2019, 2020, 2021 and 2024.
Banana production is heavily concentrated in tropical Asia and Latin America. As of 2024, India is by far the largest producer with approximately 37.6 million tons, followed by China (12.1 million), Indonesia (9.3 million), Ecuador (7.6 million), Brazil (7.0 million), the Philippines (5.6 million), and Guatemala (2.8 million). Four of the seven largest producers are located in Asia and three in Latin America, confirming that global banana production is primarily determined by tropical climatic conditions rather than trade orientation.
Several countries also recorded substantial production growth over the study period. India’s output increased from approximately 29.8 million tons in 2010 to 37.6 million tons in 2024, while China’s production rose from approximately 9.8 million to 12.1 million tons. Türkiye represents one of the most notable cases of expansion, with production increasing from approximately 210,000 tons in 2010 to around 875,000 tons in 2024, representing more than a fourfold increase over fourteen years. By contrast, the Philippines experienced a marked decline in production, while European production remained relatively limited and geographically concentrated in Spain and France due to climatic constraints.
These production patterns provide important context for the subsequent network analysis. As demonstrated in the following sections, high production capacity does not necessarily translate into central positions within the global banana trade network. Countries such as India and China remain relatively peripheral in the trade network despite their dominant production levels, whereas export-oriented economies such as Ecuador and Guatemala occupy much more influential structural positions. The production data therefore provide the contextual foundation for examining the study’s central distinction between production capacity and network position.
4. Methodology
Social Network Analysis (SNA), which is based on graph theory, provides a methodological framework for examining the structural relationships among actors within complex systems. Unlike conventional approaches that focus only on individual attributes or aggregate indicators, SNA emphasizes relational structures and the position of actors within a network (Jackson, 2010). In international trade research, this approach enables the identification of countries occupying strategically important positions that may not be captured by production or trade volume indicators alone.
In this study, SNA is employed to examine the structural evolution of the global banana trade network using bilateral trade data obtained from the FAO database. The analysis covers six observation years: 2010, 2015, 2019, 2020, 2021, and 2024. The inclusion of multiple time points allows a more comprehensive assessment of changes in network structure and reduces the limitations associated with relying only on two endpoint observations.
The banana trade network is represented as a directed and weighted graph, denoted as G = (V,E), where V represents the set of countries (nodes) and E represents bilateral banana trade relationships (edges). Each directed edge corresponds to an export relationship from country i to country j. Accordingly, a country-by-country adjacency matrix A = [aij] was constructed for each year, where aij represents the reported banana export volume from country i to country j. Therefore, the analysis considers both the existence of trade relationships and their relative intensity.
The countries included in the network were selected based on their structural relevance in the global banana market, including major exporting countries, large producers, important import markets, re-export hubs, and countries with continuous data availability during the study period. This approach enables the analysis to capture different functional roles within the global banana trade system and reduces potential network-boundary limitations.
Individual European countries were included as separate nodes in the network analysis rather than treating the European Union as a single aggregated unit. This approach reflects the fact that network indicators are based on bilateral trade relationships and that individual European countries may occupy different structural positions as importers, exporters, or redistribution hubs. Similarly, the United Kingdom was treated as an independent node throughout the entire period to maintain consistency before and after Brexit.
Several complementary network indicators were employed to evaluate countries’ structural positions. Weighted degree centrality (strength centrality) measures the total intensity of trade connections, where weighted out-degree represents export-oriented linkages and weighted in-degree represents import-oriented linkages. Unlike binary degree centrality, this measure captures differences in trade volume across relationships.
Eigenvector centrality evaluates the importance of a country by considering not only the number and strength of its connections but also the importance of its trade partners. Therefore, it captures indirect influence within the network and provides information about structural importance beyond direct trade volumes.
The Hyperlink-Induced Topic Search (HITS) algorithm provides two complementary indicators: hub and authority scores. In the context of the banana trade network, hub scores identify countries with strong outward export connections, while authority scores represent countries receiving important trade flows from influential exporters. Thus, HITS distinguishes between supply-side and demand-side roles in global banana trade (Fracasso et al., 2018).
Ego network analysis was additionally used to examine the immediate trade environment of individual countries by evaluating their direct connections, network size, and density.
Core–periphery analysis was conducted based on the Borgatti and Everett (2000) core–periphery model, which evaluates whether a network structure consists of a densely connected core and a relatively less connected periphery. In this study, a discrete core–periphery approach was applied to classify countries according to their structural positions within the banana trade network. The model compares the observed network structure with an ideal core–periphery pattern, and model fit is assessed using the correlation between the observed adjacency matrix and the idealized core–periphery matrix. Higher correlation values indicate a stronger correspondence between the observed network and the theoretical core–periphery structure.
xi = α Σj Aijyj
Here, α denotes a proportionality constant. In a similar manner, the hub centrality of a given vertex is defined as being proportional to the sum of the authority centralities of the vertices it references.
yi = β Σj Aijxj
Here, β represents an additional proportionality constant. By incorporating the matrix element into the second equation, the hub centrality values of the vertices are obtained. In matrix form, these relationships can be written as follows:
x = α Ay
y = β AT x
The combined form of the above equations is given as follows:
AAT x = λx
ATAy = λy
It can also be written in the following form. Here, . As a result, the authority and hub scores are determined by the eigenvectors of and , respectively.
Finally, core–periphery analysis was applied to identify whether the banana trade network consists of a densely connected core group and a less connected peripheral structure, following the framework developed by Borgatti and Everett (2000).
Following the construction of the weighted and directed trade matrices, all network indicators were calculated separately for each observation year. The analysis was conducted for 2010, 2015, 2019, 2020, 2021, and 2024 in order to evaluate changes in the structural organization of the global banana trade network over time.
The banana trade network was constructed as a directed and weighted network. Exporting countries represent source nodes, while importing countries represent target nodes, and edge weights correspond to reported trade volumes. Therefore, outgoing connections represent export-oriented relationships, whereas incoming connections capture import-oriented relationships. This distinction is particularly important for interpreting hub and authority scores, where hub values reflect supply-side network roles and authority values represent demand-side positions within the trade network.
The adjacency matrices were analyzed using UCINET 6 for Windows, version 6.776 (32-bit), which provides established implementations of Social Network Analysis algorithms widely applied in empirical network research. To improve methodological transparency, all analyses were based on explicitly defined country-by-country adjacency matrices derived from FAO bilateral trade flows, allowing replication using alternative network analysis tools. The same methodological procedure was applied consistently across all years to ensure comparability of the results. The identified core–periphery positions were interpreted according to their correspondence with the ideal core–periphery structure proposed by Borgatti and Everett (2000), considering the distribution of central and peripheral actors together with other network indicators.
5. Findings
The findings are presented across six observation years (2010, 2015, 2019, 2020, 2021, and 2024), allowing the structural evolution of the global banana trade network to be examined over time rather than through a simple endpoint comparison. This broader temporal coverage provides a more comprehensive perspective on changes in countries’ network positions and reduces the limitations associated with relying solely on endpoint observations.
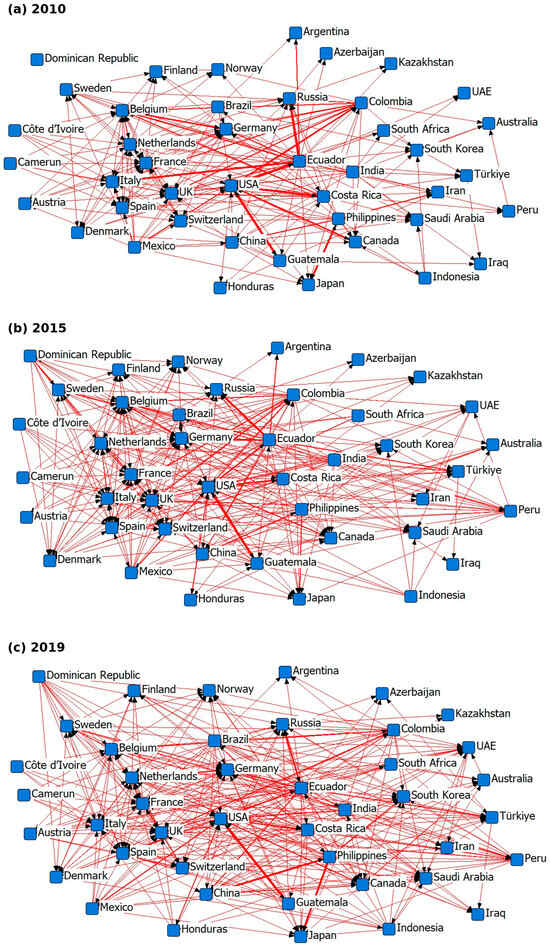
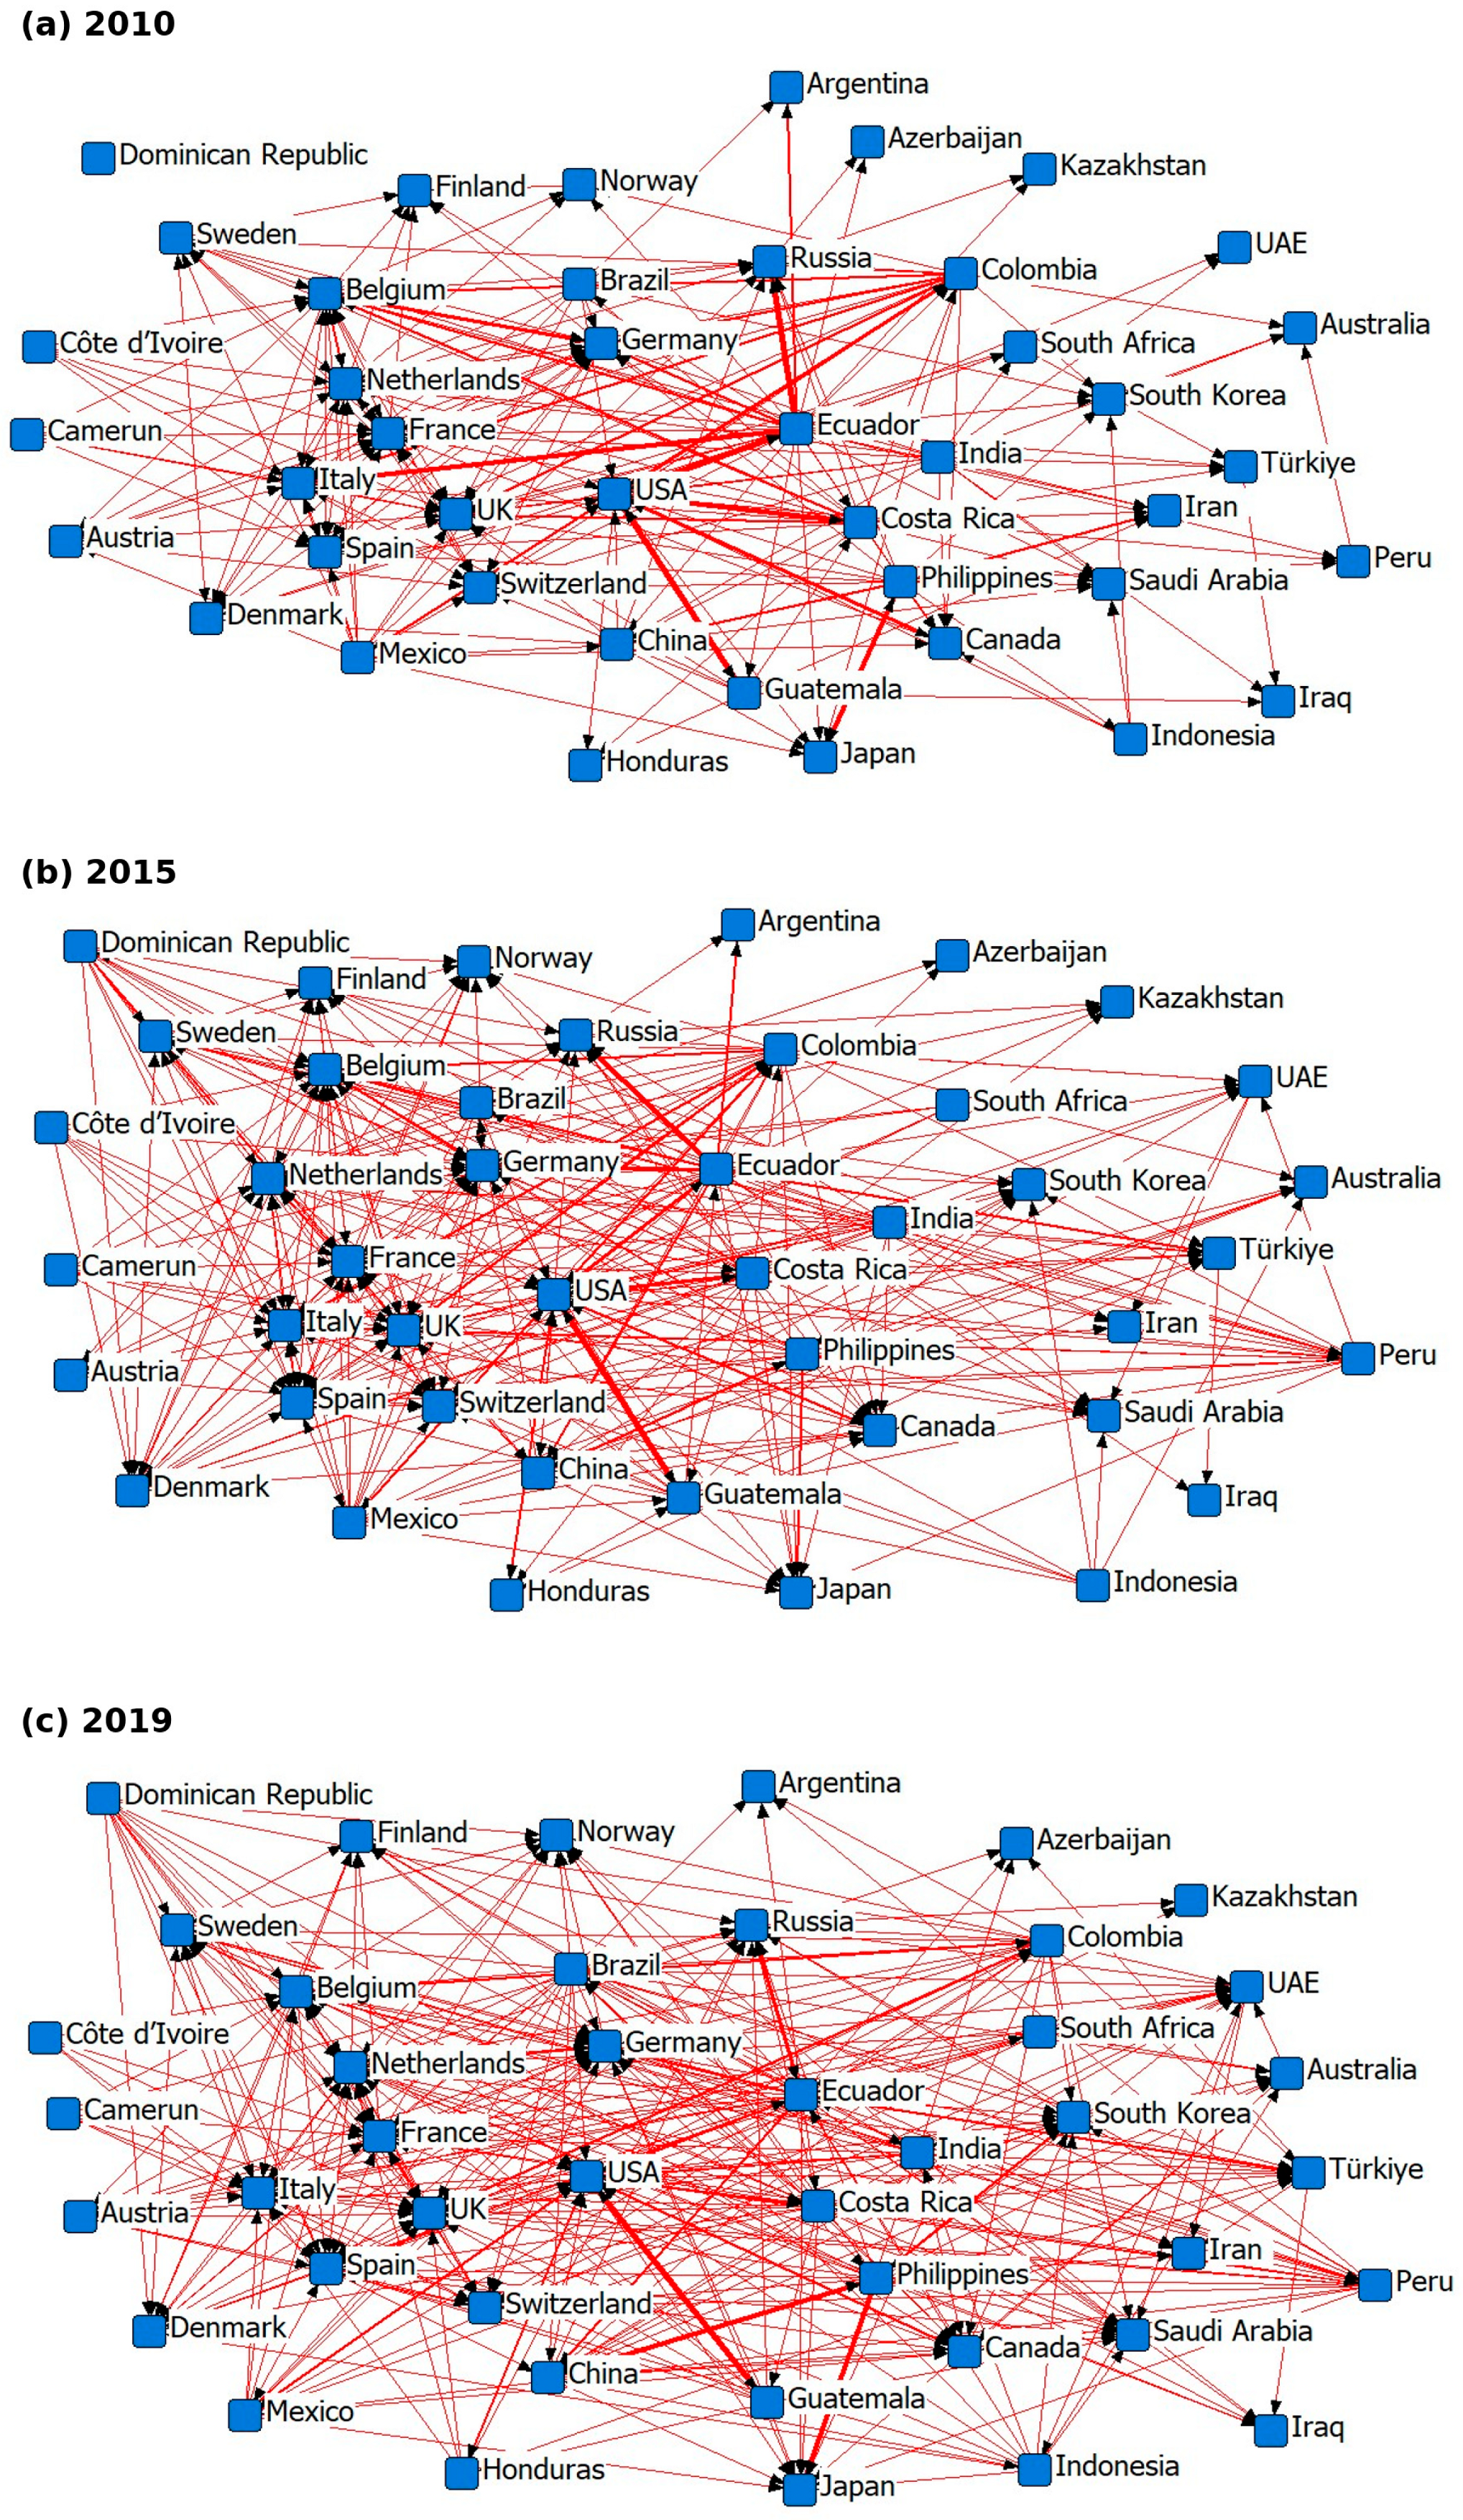
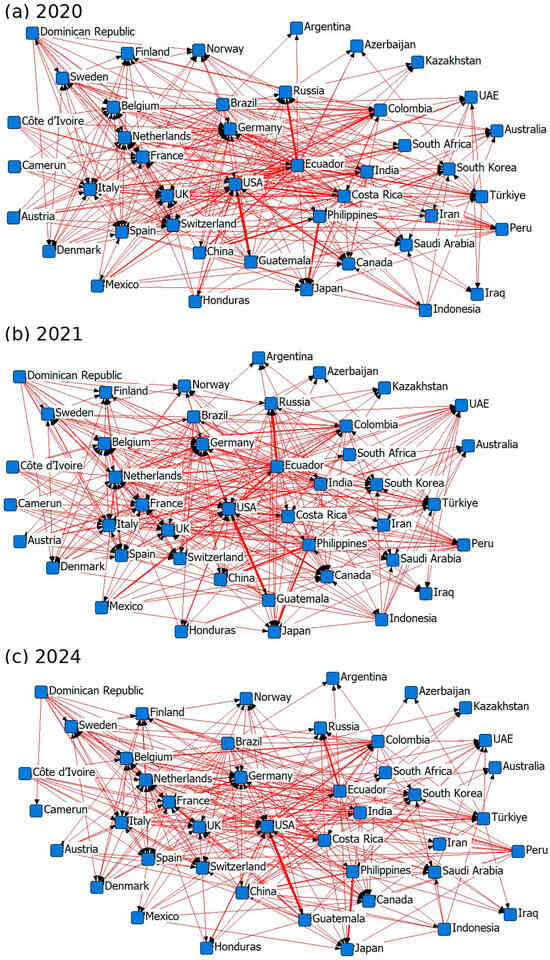
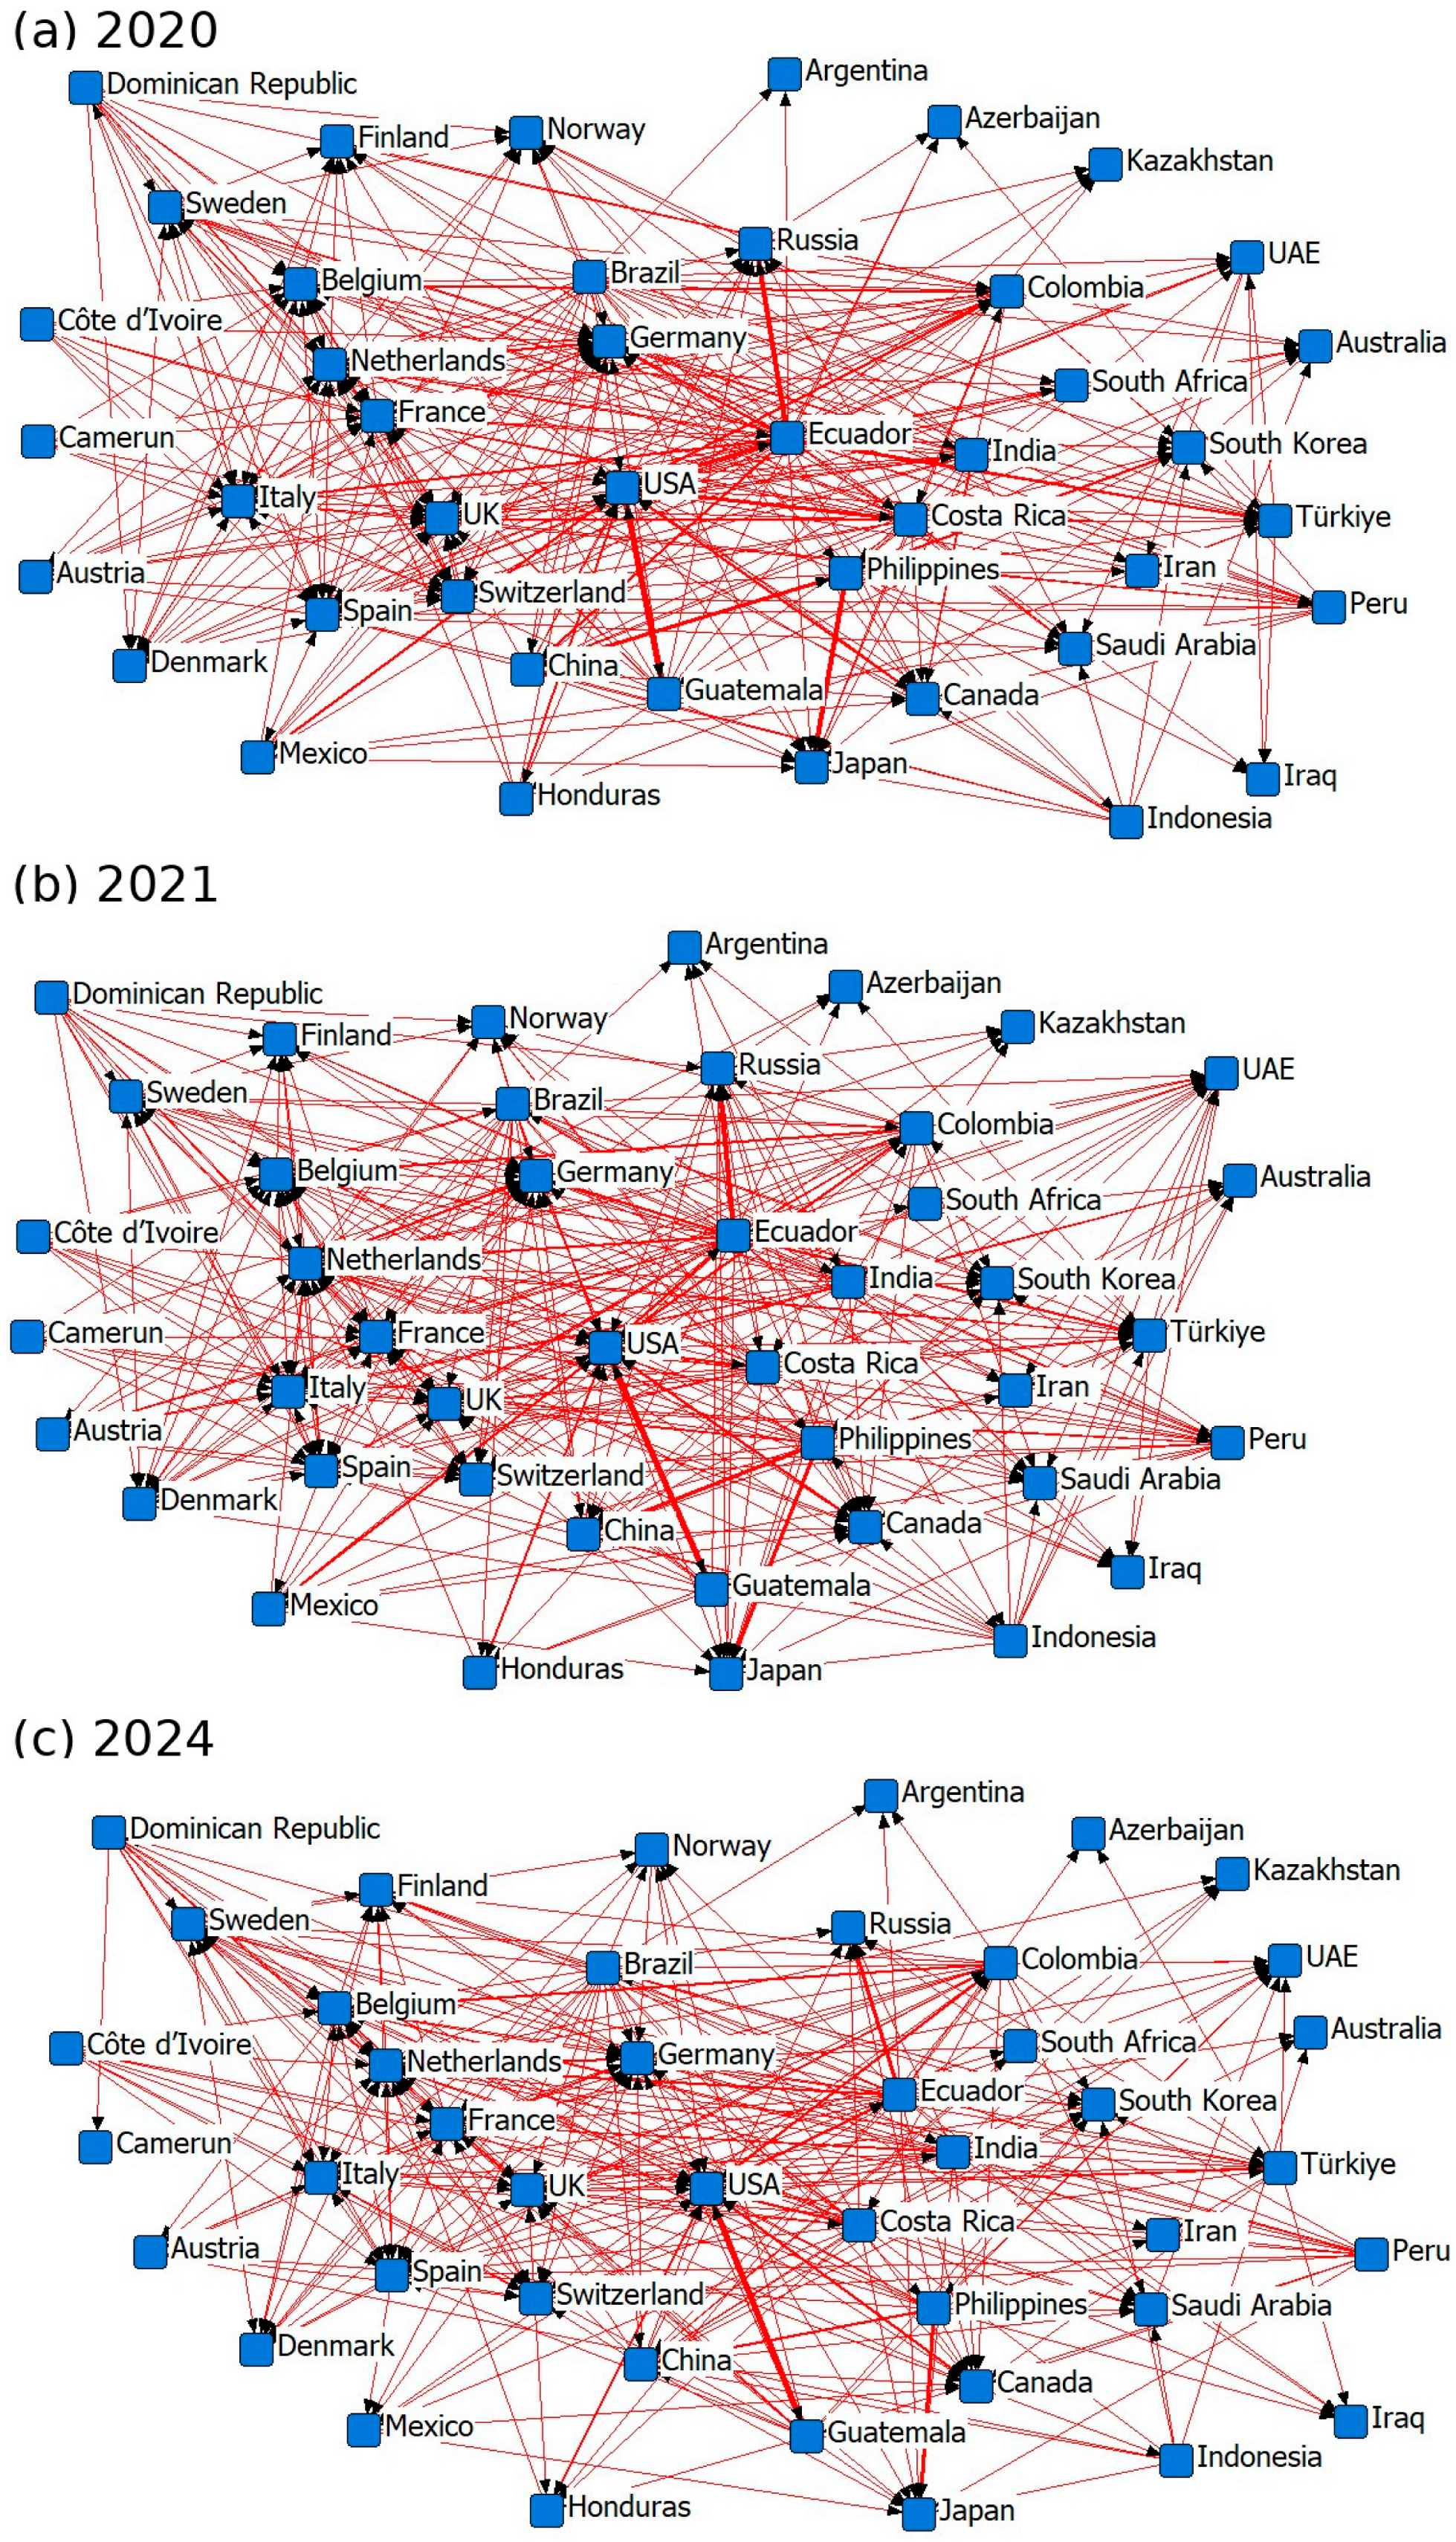
Figure 1 and Figure 2 present the network structures across these six observation years and illustrate changes in trade relationships and the relative positions of countries within the global banana market over time. The results reveal a clear distinction between production capacity and network position. Large producers such as India and China maintain substantial production capacity but do not necessarily occupy the most central positions in the export network due to their stronger orientation toward domestic markets. In contrast, export-oriented countries such as Ecuador, Guatemala, Costa Rica, and Colombia exhibit stronger network positions through more extensive international trade linkages.
Figure 1.
Banana export networks of selected countries in 2010, 2015, and 2019.
Figure 2.
Banana export networks of selected countries in 2020, 2021, and 2024.
A comparison across the six periods indicates a gradual transformation in the structure of the banana trade network. Ecuador occupied a highly influential position at the beginning of the period, reflecting its strong export-oriented structure. However, Guatemala increasingly emerged as a core actor after 2015, suggesting that diversified export relationships and stronger connectivity with major import markets are associated with improved network positioning.
At the same time, major importing and redistribution economies, particularly the United States and European countries such as Germany, the Netherlands, and Belgium, maintained important structural roles within the network. Their positions reflect demand-side influence and intermediary functions rather than direct production capacity, highlighting the importance of distinguishing between export hubs and import authorities in global agricultural trade networks.
Figure 1 illustrates the initial network structure in 2010, which serves as the baseline for evaluating structural changes across the six observation years. Ecuador occupied the dominant export-oriented position, anchoring the supply side of the network, while the United States and several European countries held important demand-side and intermediary positions through extensive import and redistribution linkages. The dense connections among European countries reflect their role as redistribution centers rather than production-based actors.
Overall, the 2010 network demonstrates that structural influence in the global banana trade was associated not only with export volume but also with countries’ ability to establish diversified and strategically connected trade relationships. This baseline provides the foundation for interpreting the subsequent structural repositioning of countries, including the emergence of Guatemala as a more influential export-oriented actor in the later observation years.
Figure 2 illustrates the network structure in 2024, representing the cumulative outcome of the structural changes observed throughout the study period. Compared with the initial network configuration, the network appears more diversified and interconnected, while strong trade linkages between Latin American exporters and major importing regions remain a defining feature of the global banana trade.
Overall, the 2024 network suggests that structural influence depends not only on export volume but also on diversified trade relationships and countries’ positions within the network. The detailed changes in centrality measures and structural roles are examined in the following sections.
Table 3 presents the weighted degree (strength centrality) results for all six observation years (2010, 2015, 2019, 2020, 2021, and 2024). Because the banana trade network was constructed as a directed and weighted network, weighted out-degree represents export-oriented trade connections, whereas weighted in-degree captures import-oriented relationships. Reporting all six observation years enables the analysis to trace changes in countries’ direct trade connectivity and identify structural repositioning over time.
Table 3.
In-Degree and Out-Degree Centrality Results for the Global Banana Trade Network (2010, 2015, 2019, 2020, 2021, and 2024).
The weighted degree results reveal clear differences between export-oriented and import-oriented actors in the banana trade network. Ecuador records the highest weighted out-degree values in both periods, confirming its role as a major export hub. Similarly, Guatemala, Costa Rica, and Colombia display strong outward connections, reflecting their export-oriented positions within the global banana market.
In contrast, countries such as the United States and major European economies show high weighted in-degree values, indicating their roles as major demand centers rather than suppliers. This distinction is particularly important because high network centrality may originate from different structural functions, including export supply, import dependency, or redistribution activities. The increasing outward connectivity of the Netherlands also reflects its intermediary role as a re-export and distribution hub.
The findings further highlight the distinction between production capacity and network position. Large producers such as India and China do not exhibit comparable export centrality despite their dominant production volumes, reflecting their stronger orientation toward domestic markets. Similarly, although Türkiye increased its banana production more than fourfold over the study period, its export-side centrality remained limited. These findings suggest that production growth alone does not necessarily translate into a more central position in international trade networks; rather, stronger network positions appear to be associated with diversified and sustained trade relationships.
Eigenvector centrality measures the importance of a country not only by the number of its trade connections but also by the influence of the countries to which it is connected. Accordingly, countries with high eigenvector centrality occupy strategically important positions by maintaining strong relationships with other influential actors within the global banana trade network.
The eigenvector centrality results presented in Table 4 show that countries’ structural importance depends not only on the number of their trade relationships but also on the quality of those connections. In 2010, the highest eigenvector centrality values were recorded for the USA (564), Ecuador (535), Guatemala (294), Costa Rica (258), Russia (250), Italy (230), and Colombia (192). These countries occupied the most influential positions in the network through their strong connections with other central actors. The prominence of both major exporters (Ecuador, Guatemala, and Costa Rica) and major importers (the USA, Russia, and Italy) demonstrates that structural influence is generated by both supply-side and demand-side roles.
Table 4.
Eigenvector Centrality Results for the Global Banana Trade Network (2010, 2015, 2019, 2020, 2021, and 2024).
Substantial changes in eigenvector centrality occurred over the study period. Guatemala exhibited the most remarkable increase, rising from 294 in 2010 to 592 in 2024, while Honduras, the Netherlands, and Mexico also strengthened their positions within the network. In contrast, Ecuador, Russia, Italy, and Germany experienced gradual declines in their relative influence. Asian countries displayed more volatile patterns: China’s eigenvector centrality increased from 2 in 2010 to 102 in 2019 before declining to 18 in 2024, while the Philippines followed a similar trajectory, peaking at 102 in 2019 before falling to 11 in 2024. By contrast, India—the world’s largest banana producer—maintained consistently low eigenvector centrality values throughout the study period, indicating that dominant production does not necessarily translate into structural influence within the trade network.
By 2024, the USA (687) remained the most influential country in the network, followed by Guatemala (592), Ecuador (255), Costa Rica (188), Honduras (125), and Colombia (106). The continued increase in the USA’s eigenvector centrality confirms its dominant structural position, while Guatemala’s remarkable rise demonstrates its transformation into one of the network’s most influential exporters. These findings are consistent with the core–periphery analysis, which identifies Guatemala as a core member from 2015 onward. Regarding Türkiye, its eigenvector centrality increased from 16 in 2010 to a peak of 93 in 2015 before gradually declining to 30 in 2024. This pattern suggests that although Türkiye temporarily strengthened its connections with influential trading partners, it did not achieve a sustained central position within the global banana trade network.
Overall, the eigenvector centrality results indicate that structural influence in the global banana trade network has been progressively reshaped over time. While the USA consolidated its position as the dominant actor, Guatemala emerged as the principal rising exporter, whereas traditionally influential countries such as Ecuador, Russia, Italy, and Germany experienced relative declines. These findings further demonstrate that network influence depends on the quality of trade relationships rather than production volume alone.
Hub and Authority analysis provides additional insight into the structural asymmetries of the global banana trade network by distinguishing supply-side (hub) and demand-side (authority) roles. While hub scores identify countries that export to influential destination markets, authority scores measure countries that receive trade flows from the most influential exporters. Together, these indicators reveal how structural influence differs between exporting and importing economies.
The results presented in Table 5 reveal substantial changes in the network’s principal supply centers over the study period. In 2010, Ecuador (776), Guatemala (431), Costa Rica (370), Colombia (261), Mexico (56), and Belgium (53) recorded the highest Hub values, confirming the dominant role of Latin American exporters within the global banana trade network. Guatemala exhibited the most remarkable increase in Hub centrality, rising continuously from 431 in 2010 to 855 in 2024 and overtaking Ecuador as the dominant export hub from 2015 onward. Although Ecuador’s Hub value declined from 776 to 370, it remained one of the network’s most influential exporters throughout the study period. Costa Rica and Colombia maintained relatively high Hub values despite a gradual decline in their relative importance, while Mexico and Honduras strengthened their export roles over time.
Table 5.
Hub and Authority Analysis Results for the Banana Export Network of Selected Countries (2010, 2015, 2019, 2020, 2021 and 2024).
The Authority results reveal a more stable demand-side structure. In 2010, the highest Authority values were observed for the USA (803), Russia (373), Italy (337), Belgium (213), Germany (208), and the United Kingdom (75). Throughout the study period, the USA consistently strengthened its position, increasing its Authority value from 803 to 974 and remaining the dominant demand center in the global banana trade network. In contrast, Russia, Italy, and Germany experienced gradual declines in their Authority values. The Netherlands increased its Authority value from 42 in 2010 to 91 in 2024, reinforcing its role as a European redistribution and re-export hub.
Türkiye provides an informative contrast between production growth and network position. Although banana production increased substantially during the study period, Türkiye’s Hub values remained negligible, indicating limited participation as an export-oriented actor. Its Authority value increased from 24 in 2010 to a peak of 139 in 2015 before gradually declining to 44 in 2024, confirming that Türkiye primarily functioned as a demand-side actor connected to major exporters rather than as a central supplier.
Overall, the Hub and Authority analysis confirms the dynamic restructuring of the global banana trade network. Consistent with the degree and eigenvector centrality results, Guatemala replaced Ecuador as the dominant supply-side hub from 2015 onward, while the USA consistently maintained its position as the network’s principal demand-side authority. These findings further demonstrate that structural influence in global agricultural trade is shaped by countries’ functional roles within the network rather than by production capacity or trade volume alone.
The ego network analysis results presented in Table 6 provide additional insight into the local connectivity structure of countries within the global banana trade network. Ego network measures describe the immediate trade environment of each country through network size, the number of direct ties, the number of potential pairs, and local network density. Together, these indicators complement the previous centrality measures by illustrating how extensively countries are embedded in their direct trade relationships.
Table 6.
Ego Network Analysis Results for the Global Banana Trade Network (2010, 2015, 2019, 2020, 2021, and 2024).
Across the six observation years, Ecuador, the Netherlands, Costa Rica, Germany, the United Kingdom, France, and Spain consistently maintained the largest ego networks in terms of Size, Ties, and Pairs, reflecting their extensive direct trade relationships. Guatemala also substantially expanded its local connectivity after 2015, consistent with the increases observed in its degree, eigenvector, and hub centrality measures and with its transition into the network core. Although Ecuador remained one of the largest local networks throughout the study period, Guatemala’s continuous expansion further confirms its emergence as one of the most structurally influential exporters in the global banana trade network.
The density indicator should be interpreted with caution because high density values often occur in relatively small ego networks where a limited number of trade partners are closely interconnected. Accordingly, countries such as Cameroon, Côte d’Ivoire, Austria, and Finland recorded comparatively high density values despite their relatively limited overall positions within the global trade network. By contrast, the major structural actors generally exhibited larger but less densely connected ego networks, reflecting their participation across a broader and more diversified set of international trade relationships.
Overall, the ego network analysis reinforces the conclusions obtained from the degree, eigenvector, hub–authority, and core–periphery analyses. Countries that expanded both the scale and diversity of their direct trade relationships generally strengthened their structural positions within the network. These findings further support the conclusion that the global banana trade network evolved toward a more diversified and increasingly multi-centered structure during the 2010–2024 period.
Core–periphery analysis was performed using the Borgatti and Everett (2000) categorical core–periphery model implemented in UCINET. Countries were assigned to core and periphery groups for each study year, and the model fit (correlation) statistic was used to assess how closely the observed network conforms to the ideal core–periphery configuration.
Table 7 presents the results of the categorical core–periphery analysis, which reveal a clear change in the composition of the network core over the study period. In 2010, the core consisted of the United States and Ecuador. From 2015 onward, Guatemala replaced Ecuador in the core alongside the United States and retained this position throughout the remaining study years. Model fit values ranged from 0.4332 to 0.5353, with the highest correspondence to the ideal core–periphery configuration observed in 2024 (0.5353).
Table 7.
Core and Periphery Analysis Results for Selected Countries in Banana Export (2010, 2015, 2019, 2020, 2021 and 2024).
Notably, this core transition occurred early and abruptly rather than gradually. Guatemala entered the core as early as 2015—well before the pandemic period—and remained there in every subsequent year. This timing, corroborated by the parallel increases in Guatemala’s hub and eigenvector centrality, indicates that the structural reconfiguration of the network preceded rather than followed the disruptions of 2020–2021.
Overall, the core–periphery analysis confirms that the global banana trade network remained highly concentrated around a limited number of structurally dominant actors. The persistent presence of the United States and the replacement of Ecuador by Guatemala from 2015 onward demonstrate that long-term structural influence depends not only on production capacity but also on sustained integration within global trade relationships.
6. Policy and Strategic Implications
6.1. Trade Diversification Strategies
Strengthening trade diversification emerges as a central strategic response to the structural transformation observed in the global banana trade network between 2010 and 2024. As demonstrated by the network analysis, the transition from a highly centralized system toward a more distributed and multi-centered structure reflects a growing need for exporters and importers to reduce dependency on singular trade partners or geographic regions. Diversification, therefore, should not be interpreted solely as an increase in the number of trade links, but rather as the establishment of resilient and strategically positioned connections capable of sustaining trade flows under conditions of uncertainty.
From an exporter’s perspective, the rise in countries such as Guatemala demonstrates that strengthening network position depends not only on increasing export volume but also on expanding the number of trade connections and linking with influential actors within the network. For example, Guatemala strengthened its structural position by diversifying its trade relationships beyond its traditional export partners, thereby reducing dependence on a limited set of destination markets while improving its position within the network. By 2024, Guatemala had shifted from the periphery toward the network core, as reflected in its increasing eigenvector and hub centrality scores. Network metrics indicate that exporters able to connect across multiple trade communities improve their structural resilience by reducing dependence on a single consumption core. This diversification process often requires investments in logistics, cold-chain infrastructure, and compliance with international phytosanitary standards, enabling access to markets characterized by higher entry requirements (Tabasam & Ismail, 2019).
For importing countries, diversification primarily involves sourcing from multiple production clusters and utilizing alternative logistics corridors. The growing integration of Asian, Latin American, and African suppliers into shared consumption markets demonstrates how cross-cluster linkages reduce vulnerability to regional shocks. The increasingly multi-centered structure observed in the centrality and core–periphery results supports this interpretation, indicating stronger interconnections among diversified groups of trading partners (Clemente et al., 2023). Such structural integration increases route redundancy and enhances the ability of importing countries to maintain stable supply under adverse conditions.
Infrastructure development plays a crucial enabling role in diversification strategies. Improvements in port capacity, transport reliability, and cold-chain efficiency contribute directly to higher network centrality by shortening effective trade distances and enabling participation in multiple trade communities (Tabasam & Ismail, 2019). Countries improving their Logistics Performance Index (LPI) scores, particularly in areas such as customs efficiency, shipment tracking, and infrastructure quality, tend to strengthen their ability to maintain stable trade links with distant markets. Network analysis suggests that logistical efficiency can improve structural positioning even without significant increases in production capacity, as reduced uncertainty enhances buyer confidence and long-term contractual stability.
Beyond infrastructure, diversification strategies must also consider the structural role of actors within the network. Increasing the number of trade partners without expanding across different network communities may leave exporters exposed to systemic risks concentrated within a single cluster. Establishing trade relationships with a broader range of international partners allows countries to access wider market opportunities and distribute risk more effectively. Previous studies suggest that multinational distributors can facilitate this process by integrating smaller exporters into diversified supply chains, enabling them to benefit from established logistics networks and market access channels (Tajoli et al., 2021). The findings also indicate that network position should be considered alongside traditional trade indicators when evaluating agricultural competitiveness. Countries with similar production capacities may experience different levels of international integration depending on the diversity and strategic position of their trade relationships. Therefore, policies aimed at strengthening export performance should focus not only on increasing production but also on improving access to multiple markets and developing stable international trade connections.
A key implication of the findings is that diversification strategies should be evaluated not solely through bilateral trade volumes but through countries’ positions within the broader trade network. Exporters dependent on a limited number of connections may remain vulnerable to disruptions affecting specific markets or trade routes. In contrast, actors establishing connections across different parts of the network may achieve greater flexibility and stronger integration into global trade structures. These results suggest that long-term competitiveness in agricultural trade is increasingly associated with network-based positioning rather than simple expansion of export quantities.
6.2. Trade Structure and Network Resilience Implications
Beyond trade diversification, the evolution of the banana trade network provides important insights into how trade structures influence dependence and connectivity patterns among countries. Highly centralized networks, such as the structure observed in 2010 with strong concentration around a limited number of dominant actors, may increase reliance on specific trade relationships. Disruptions affecting highly connected actors, including production shocks, logistical constraints, or changes in market access conditions, may therefore influence broader trade flows.
The transition toward a more multi-centered network structure by 2024 indicates that banana trade relationships have become more distributed across different actors. From a network perspective, countries maintaining broader connections across multiple markets may reduce dependence on a narrow set of partners and may be better positioned to adapt to changing trade conditions. The findings suggest that strategic positioning within the network depends not only on trade volume but also on the diversity and quality of relationships established with other actors.
The findings further suggest that countries maintaining stable relationships with influential trading partners may strengthen their structural positions within international trade networks. This interpretation is consistent with the network perspective adopted in this study, which emphasizes relational structures alongside trade volumes.
For policymakers, these findings suggest that trade strategies should consider network structure in addition to traditional indicators such as production capacity and export volume. Supporting access to diversified markets, improving trade connectivity, and facilitating broader participation in international trade networks may help producers strengthen their positions within global agricultural trade systems. Therefore, the strategic focus should not only be on increasing production capacity but also on improving the structural position of domestic actors within international trade networks.
6.3. Structural Transformation and Global Value Chain Implications
The structural evolution of the global banana trade network also provides implications for understanding how countries become integrated into international value chains. The findings indicate that export performance cannot be explained solely by production capacity, as countries with similar or even larger production volumes may occupy different positions depending on their trade relationships and network embeddedness.
The contrast between Guatemala and Türkiye illustrates this distinction. Guatemala’s transition toward a more central network position reflects stronger integration with international markets and more diversified export relationships. In contrast, Türkiye’s substantial increase in production did not result in a comparable transition toward an export-oriented network position, suggesting that production expansion alone is insufficient without broader participation in international trade structures.
From a global value chain perspective, these findings highlight the importance of stable trade relationships and broader integration into international trade networks. Countries positioned closer to influential actors within the network may benefit from stronger market integration, while countries with limited international connections may remain peripheral despite improvements in domestic production capacity.
Therefore, strengthening participation in global agricultural trade requires attention not only to production efficiency but also to the development of stable trade relationships and integration with international market channels. This perspective emphasizes that structural transformation in agricultural trade depends on both productive capabilities and the ability to establish strategic positions within global value chains.
While the present analysis focuses on the economic structure of the trade network, future research may integrate environmental and social sustainability indicators with trade network analysis to provide a more comprehensive understanding of structural transformation in global agricultural trade.
7. Conclusions
This study examined the structural evolution of the global banana trade network across six observation years between 2010 and 2024 by applying a Social Network Analysis framework. Rather than evaluating trade performance solely through production capacity or export volume, the study investigated how countries’ positions within the network reflect differences in structural embeddedness, connectivity, and integration into global trade relationships.
The findings reveal that the banana trade network has evolved from a relatively concentrated structure toward a more diversified and multi-centered configuration across the six observation years. The core–periphery results indicate a notable transformation in network leadership: while Ecuador and the United States represented the core actors in 2010, Guatemala entered the network core as early as 2015 and remained there throughout the subsequent observation years. This transition demonstrates that network position is not static but evolves through changes in trade relationships and connectivity patterns.
The comparison between Guatemala and Türkiye provides an important illustration of the distinction between production capacity and network positioning. While Guatemala’s increasing centrality was accompanied by broader international trade connections, Türkiye’s substantial production growth was not reflected in a comparable increase in export-oriented network centrality. This contrast suggests that participation in international trade networks represents an additional dimension for understanding trade performance beyond domestic production expansion.
From a broader perspective, the study highlights the value of network-based approaches for understanding agricultural trade structures. Centrality measures, hub–authority analysis, and core–periphery modeling reveal dimensions of trade relationships that cannot be fully captured through conventional volume-based indicators. The findings suggest that structural embeddedness and the quality of trade connections provide additional insights into countries’ roles within global value chains.
The results also offer implications for trade strategy and network resilience. Countries with more diversified and strategically positioned trade relationships may reduce dependence on limited partners and strengthen their integration within global markets. Therefore, agricultural trade strategies should consider not only production capacity but also the development of stable and diversified international connections.
Despite these contributions, the study has certain limitations. First, the analysis applies a descriptive Social Network Analysis framework and therefore identifies structural associations between network position and trade patterns rather than establishing causal relationships. Future studies may combine network indicators with econometric approaches, such as gravity models, to examine the additional explanatory role of network characteristics while controlling for economic size, geographic distance, trade agreements, and other institutional factors.
Second, although the analysis incorporates multiple observation years between 2010 and 2024, the most recent trade data may be subject to future revisions due to reporting delays and updates in international databases. Therefore, future research using finalized data may further validate the observed structural changes.
Finally, this study examines the banana trade network at the country level. However, global banana value chains are also influenced by multinational firms, retailers, and supply-chain governance structures. Future studies incorporating firm-level data could provide additional insights into how corporate actors interact with country-level network positions.
Overall, the findings indicate that competitiveness in the global banana trade is associated not only with production capacity but also with countries’ structural positions within international trade networks. Understanding these relationships provides a complementary perspective for evaluating trade concentration, dependency patterns, and long-term structural adaptation in an evolving global trade environment.
Author Contributions
Conceptualization, H.T.; methodology, H.Ö. and F.B.; software, H.Ö. and F.B.; validation, S.S.; formal analysis, F.B. and U.Ü.; investigation, S.S., F.B., U.Ü., H.Ö. and H.T.; resources, S.S. and H.Ö.; data curation, F.B. and U.Ü.; writing—original draft preparation, S.S., F.B. and U.Ü.; writing—review and editing, U.Ü.; visualization, F.B. and U.Ü.; project administration, U.Ü.; funding acquisition, not applicable. All authors have read and agreed to the published version of the manuscript.
Funding
This research received no external funding.
Institutional Review Board Statement
Not applicable.
Informed Consent Statement
Not applicable.
Data Availability Statement
The data used in this study are publicly available from the Food and Agriculture Organization (FAO) database at https://www.fao.org/faostat/en/#compare (accessed on 8 June 2026). The datasets analyzed during the current study are available from the corresponding author upon reasonable request.
Conflicts of Interest
The authors declare no conflicts of interest.
References
- Adeyo, I. B., Dontsop, P. M., Badmus, M. A., & Amao, I. O. (2011). Price transmission and market integration of banana and plantain in OyoState, Nigeria. ARPN Journal of Agricultural and Biological Science, 6(5), 18–24. [Google Scholar]
- Ambisa, Z., Tesfa, B., Olani, T., & Abdeta, D. (2019). Review on the production and marketing of banana in ethiopia. World Journal of Agriculture and Soil Science, 2(1), 1–9. [Google Scholar] [CrossRef] [Scilit]
- Angelidis, G., Bratsas, C., Makris, G., Ionnadis, E., Varsakelis, N., & Antoniou, I. E. (2021). Global value chains of COVID-19 materials: A weighted directed network. Mathematics, 1(9), 3202. [Google Scholar] [CrossRef] [Scilit]
- Ayadi, R., Giovannetti, G., Marvasi, E., & Zaki, C. (2024). Trade networks and the productivity of MENA firms in global value chains. Structural Change and Economic Dynamics, 69, 10–23. [Google Scholar] [CrossRef] [Scilit]
- Basan, R. J. P. (2017). Consumer preference of table banana quality by income groups in the Philippines: Hedonic price analysis. Asian Journal of Agriculture and Development, 13(2), 21–34. [Google Scholar]
- Borgatti, S. P., & Everett, M. G. (2000). Models of core/periphery structures. Social Networks, 21(4), 375–395. [Google Scholar] [CrossRef] [Scilit]
- Burrel, A., & Henningsen, A. (2001). An empirical investigation of the demand for bananas in Germany. German Journal of Agricultural Economics, 50(4), 242–249. [Google Scholar] [CrossRef] [Scilit]
- Choi, Y. H., Kim, S. E., & Lee, K. H. (2021). Faux fur trade networks using macroscopic data: A social network approach. Sustainability, 13, 1427. [Google Scholar] [CrossRef] [Scilit]
- Clemente, G. P., Cornaro, A., & Della Corte, F. (2023). Unraveling the key drivers of community composition in the agri-food trade network. Scientific Reports, 13(1), 13966. [Google Scholar] [CrossRef] [Scilit] [PubMed]
- Debebe, A. D., & Dagne, D. (2018). Analysis of socio-economic factors affecting banana production: Evidences from lowlands of Uba Debretsehay woreda, Gamo Gofa zone, SNNPRS. Journal of Economics and Sustainable Development, 9(9), 1–7. [Google Scholar] [CrossRef] [Scilit]
- Deng, G., Lu, F., Wu, L., & Xu, C. (2021). Social network analysis of virtual water trade among major countries. Science of the Total Environment, 753, 142043. [Google Scholar] [CrossRef] [Scilit] [PubMed]
- Dong, G., Qing, T., Tian, L., Du, R., & Li, J. (2021). Optimization of crude oil trade structure: A complex network analysis. Complexity, 2021(1), 3480546. [Google Scholar] [CrossRef] [Scilit]
- Evans, E., & Ballen, F. (2012). Banana market. IFAS Extention University of Florida. Available online: https://ask.ifas.ufl.edu/publication/fe901 (accessed on 4 June 2026).
- FAO. (2026a). Banana market review. Preliminary results 2025. Available online: https://openknowledge.fao.org/server/api/core/bitstreams/513cef49-8910-48f2-a0c4-a2812d517aba/content (accessed on 6 June 2026).
- FAO. (2026b). Banana trade and production statistics. Available online: https://www.fao.org/faostat/en/#compare (accessed on 8 June 2026).
- Fracasso, A., Nguyen, H. T., & Schiavo, S. (2018). The evolution of oil trade: A complex network approach. Network Science, 6(4), 545–570. [Google Scholar] [CrossRef] [Scilit]
- Freeman, L. C. (1978). Centrality in social networks conceptual clarification. Social Networks, 1(3), 215–239. [Google Scholar] [CrossRef] [Scilit]
- Fu, Y., Xue, L., Yan, Y., Pan, Y., Wu, X., & Shao, Y. (2021). Energy network embodied in trade along the belt and road: Spatiotemporal evolution and influencing factors. Sustainability, 13(19), 10530. [Google Scholar] [CrossRef] [Scilit]
- Gereffi, G., Humphrey, J., & Sturgeon, T. (2005). The governance of global value chains. Review of International Political Economy, 12(1), 78–104. [Google Scholar] [CrossRef] [Scilit]
- Granovetter, M. (1985). Economic action and social structure: The problem of embeddedness. American Journal of Sociology, 91(3), 481–510. [Google Scholar] [CrossRef] [Scilit]
- Hatirli, S. A., Jones, E., & AKTAŞ, A. R. (2003). Measuring the market power of the banana import market in Turkey. Turkish Journal of Agriculture and Forestry, 27(6), 367–373. [Google Scholar]
- Hu, F., Xi, X., Zhang, Y., & Wu, R. T. (2021). Co-opetition relationships and evolution of the world dairy trade network: Implications for policy-maker psychology. Frontiers in Psychology, 11, 632465. [Google Scholar] [CrossRef] [Scilit] [PubMed]
- Jackson, M. O. (2010). An overview of social networks and economic applications. Available online: https://web.stanford.edu/~jacksonm/socialnetecon-chapter.pdf (accessed on 20 May 2026).
- Jiang, X. R., Yang, Y. C., & Wang, S. L. (2019). Trade network dataset development in 227 countries and regions (1985–2015). Journal of Global Change Data & Discovery, 3(3), 227–233. [Google Scholar] [CrossRef] [Scilit]
- Lin, B. H., Yen, S. T., Huang, C. L., & Smith, T. A. (2009). Us demand for organic and conventional fresh fruits: The roles of income and price. Sustainability, 1(3), 464–478. [Google Scholar] [CrossRef] [Scilit]
- Olvera, B. C., & Spinola, D. (2022). Complexity and productive structure in Latin America: A network analysis of trade patterns. Working Paper. Birmingham City University Business School. [Google Scholar]
- Omar, I., Dewan, F., & Hoq, M. S. (2014). Analysis of price forecasting and spatial co-integration of banana in Bangladesh. European Journal of Business and Management, 6(7), 244–255. [Google Scholar] [CrossRef] [Scilit]
- Omua, E., & Jagwe, J. (2010, September 19–23). Banana value chains in central Africa: Constraints and opportunities. The Joint 3rd African Association of Agricultural Economists (AAAE) and 48th Agricultural Economists Association of South Africa (AEASA) Conference, Cape Town, South Africa. [Google Scholar]
- Pacini, H., Shi, G., Sanches-Pereira, A., & da Silva Filho, A. C. (2021). Network analysis of international trade in plastic scrap. Sustainable Production and Consumption, 27, 203–216. [Google Scholar] [CrossRef] [Scilit]
- Rainforest-Alliance. (2016). Banana. Available online: http://www.rainforest-alliance.org/kids/species-profiles/banana (accessed on 5 February 2026).
- Ren, B., Li, H., Shi, J., Ma, N., & Qi, Y. (2022). Detecting the control and dependence relationships within the global embodied energy trade network. Energy, 238, 121678. [Google Scholar] [CrossRef] [Scilit]
- Shi, J., Yang, J., & Li, Y. (2019). Supply network position and firm performance: Evidence from Chinese listed manufacturing companies. Journal of Business Economics and Management, 20(6), 1258–1277. [Google Scholar] [CrossRef] [Scilit]
- Solís Rivera, L. R., Solórzano Thompson, J., & Paniagua Molina, J. (2023). Banana trade in the European Union: Interaction between suppliers and importers through network analysis. E-Agronegocios, 9(1), e6287. [Google Scholar]
- Tabasam, N., & Ismail, N. W. (2019). Transportation infrastructure of Pakistans agricultural export. Journal of Development and Agricultural Economics, 11, 92–101. [Google Scholar] [CrossRef] [Scilit]
- Tajoli, L., Airoldi, F., & Piccardi, C. (2021). The network of international trade in services. Applied Network Science, 6(1), 68. [Google Scholar] [CrossRef] [Scilit]
- Uzzi, B. (1996). The sources and consequences of embeddedness for the economic performance of organizations: The network effect. American Sociological Review, 61, 674–698. [Google Scholar] [CrossRef] [Scilit]
- Vidya, C. T., & Taghizadeh-Hesary, F. (2021). Does infrastructure facilitate trade connectivity? Evidence from the ASEAN. Asia Europe Journal, 19, 51–75. [Google Scholar] [CrossRef] [Scilit] [PubMed]
- Wang, K., & Sun, D. (2015). An empirical evaluation of the Shanghai Cooperation Organization from social network perspective. Metallurgical and Mining Industry, 6, 412–421. [Google Scholar]
- Yang, Y., Poon, J. P. H., Liu, Y., & Bangci-Sen, S. (2015). Small and flat worlds: A complex network analysis of international trade in crude oil. Energy, 93, 534–543. [Google Scholar] [CrossRef] [Scilit]
- Zhang, O., & Batinge, B. (2021). A social network analysis of the structure and evolution of intra-African trade. African Development Review, 33, 204–217. [Google Scholar] [CrossRef] [Scilit]
- Zhu, X., & Liu, X. (2023). Research on the evolution of global electronics trade network structure since the 21st century from the Chinese perspective. Sustainability, 15(6), 5437. [Google Scholar] [CrossRef] [Scilit]

Disclaimer/Publisher’s Note: The statements, opinions and data contained in all publications are solely those of the individual author(s) and contributor(s) and not of MDPI and/or the editor(s). MDPI and/or the editor(s) disclaim responsibility for any injury to people or property resulting from any ideas, methods, instructions or products referred to in the content. |
© 2026 by the authors. Licensee MDPI, Basel, Switzerland. This article is an open access article distributed under the terms and conditions of the Creative Commons Attribution (CC BY) license.