


Abstract
This paper develops a theory-first framework explaining how tariff policy reshapes participation and position in global value chains (GVCs). Building on the input–output price model and value-added trade accounting, we formalize the tariff cascade and introduce three portable diagnostics: the Tariff Propagation Multiplier (TPM), the Backward/Forward Tariff Elasticity Decomposition (BFTED), and the Stage-Shift Metric (SSM). We derive sign-robust propositions and provide aggregate-level empirical evidence consistent with the cascade mechanism using a dyadic panel of 260,473 observations spanning 1999–2018. Results show that home input tariffs significantly compress both backward and forward GVC participation, and that apparent GVC upgrading frequently reflects measurement composition rather than genuine technological relocation. A policy simulation calibrated to 25% tariff escalation scenario projects significant participation losses, with Canada’s high-exposure manufacturing sectors facing amplified cascade effects due to their dense cross-border input linkages. The framework offers actionable diagnostics for trade and industrial policy in an era of renewed protectionism.
1. Introduction
The architecture of global production has been fundamentally transformed over the past three decades. Firms no longer produce goods within national borders but instead fragment production across countries, embedding themselves in global value chains (GVCs) that link suppliers, assemblers, and distributors across multiple tiers and jurisdictions (Zarea & Su, 2026). This fragmentation has delivered substantial gains in productivity, export competitiveness, and economic development, particularly for countries that successfully positioned themselves as intermediate input suppliers or final-stage assemblers. Yet the same interconnectedness that generates these gains also creates deep vulnerability: when tariff policy disrupts the flow of intermediate inputs, the cost shock does not stop at the border. It cascades through the production network, amplifying at each stage and reshaping how countries participate in and benefit from GVCs.
This vulnerability has moved from theoretical concern to pressing policy reality. The Trump administration’s 2025 tariff escalation, imposing blanket 25% tariffs on imports from major trading partners including Canada and Mexico, represents the most significant peacetime disruption to global production networks in modern history. For deeply integrated economies like Canada, where approximately 75% of exports flow to the United States and key manufacturing sectors such as motor vehicles, machinery, and metals are deeply embedded in cross-border supply chains, the stakes are particularly high. Yet policymakers and researchers lack the precise analytical tools needed to trace how such tariff shocks propagate through production networks, which sectors are most exposed, and whether standard GVC indicators accurately reflect the underlying disruption.
The existing literature offers important but incomplete guidance. A rich body of empirical work documents that input-tariff liberalization generates sizable productivity and export gains, larger than comparable reductions in final-good tariffs, because cheaper and better inputs operate directly through firms’ production sets (Amiti & Konings, 2005). The 2018–2019 US–China trade war provided complementary evidence on the costs of raising tariffs, with near-complete pass-through to import prices and measurable welfare losses for input-reliant sectors. On the measurement side, the Koopman–Wang–Wei (KWW) decomposition has become the standard framework for tracking how value added flows across borders through backward and forward participation indicators. However, a critical gap remains: the literature lacks a transparent, theoretically grounded toolkit that connects tariff shocks to GVC participation metrics in a way that is both analytically precise and empirically operational. Existing approaches either model tariff effects in general-equilibrium frameworks that obscure the network propagation mechanism, or measure GVC participation without explicitly linking it to the tariff policy environment that shapes it.
The input-tariff literature is not, however, uniformly supportive of the cascade narrative. Pavcnik (2002) finds that the productivity gains from input-tariff liberalization are concentrated among larger, more productive firms, suggesting that cascade exposure and adjustment capacity are heterogeneous across firm types. General-equilibrium analyses further complicate the partial-equilibrium cascade logic: Eaton and Kortum (2002) and Caliendo and Parro (2015) demonstrate that bilateral tariff changes generate multilateral price and reallocation effects that can offset or amplify the direct cascade predicted by IO models. Antras and Chor (2018) caution that standard GVC position metrics can conflate short-run compositional shifts with structural GVC integration, a limitation that our SSM decomposition directly addresses. Recent empirical work using the TiVA database documents significant GVC reconfiguration following the COVID-19 pandemic and the war in Ukraine (Freund et al., 2023; Javorcik et al., 2022; Alfaro & Chor, 2023), providing the policy backdrop against which the current paper’s diagnostics are most relevant.
This paper fills that gap. We develop a theory-first framework grounded in input–output price propagation that formalizes the tariff cascade and introduces three portable diagnostics directly linked to standard GVC indicators. We then validate these diagnostics empirically using a dyadic panel of 260,473 country pair observations spanning 1999–2018, covering three major shock episodes: the Global Financial Crisis, the US–China trade war, and the COVID-19 disruption. Finally, we apply the framework to simulate the GVC consequences of the current tariff escalation, with particular attention to Canada’s sectoral exposure. Our results show that home input tariffs significantly compress backward participation, that apparent GVC upgrading frequently reflects measurement composition rather than genuine technological relocation, and that Canada’s high-exposure manufacturing sectors face cascade effects nearly twice the global average under a 25% tariff regime.
The paper makes three contributions, each building on established IO and GVC accounting frameworks rather than departing from them: it formalizes and integrates the network cascade mechanism into a measurement-ready toolkit; it operationalizes the false upgrading phenomenon that arises from asymmetric participation margin compression; and it provides computation-ready, database-compatible diagnostics that currently do not exist as an integrated framework in the literature. It contributes to the GVC measurement literature by providing diagnostics that distinguish genuine upgrading from compositional artifacts. And it speaks directly to the policy debate on trade protection and supply chain resilience, offering actionable tools for governments navigating an era of renewed protectionism.
2. Theoretical Framework: An Input–Output Approach to Tariff Cascades
Figure 1 provides a schematic overview of the tariff cascade propagation mechanism in a two-country three-sector value chain. Home sectors H1 (upstream), H2 (midstream), and H3 (final) are linked to foreign sectors F1–F3 through intermediate input flows. A home input tariff (arrow from left) raises costs through the backward linkage channel, reducing BL. A partner downstream tariff (arrow from right) reduces demand for home intermediates through the forward linkage channel, reducing FL.
Figure 1.
GVC participation around tariff shock episodes.
2.1. Setup and Notation
We situate the analysis within a world inter-country input–output (ICIO) system comprising N sectors. Let A be the matrix of intermediate input coefficients at basic prices, Y the vector of final demand, X gross output, and L = (I − A)^−1 the Leontief inverse, so that X = LY. Value added satisfies VA = VX, where V = diag(v) collects sectoral value-added shares. The dual price model, which we use throughout, expresses unit output prices p as a function of primary-factor prices w (Miller & Blair, 2009):
where B = (I − A)−1 is the standard Leontief inverse, so that B′ = (I − A′)−1 is its transpose. The dual price model uses B′ because cost propagation runs in the transpose direction relative to quantity propagation (Miller & Blair, 2009). In an international setting, the coefficient matrix decomposes as A = Ad + Am, where Ad captures domestically sourced intermediates and Am captures imported intermediates. This partition is central to our analysis: ad valorem tariffs load exclusively on Am, so that any protection measure appears as a cost-push shock to the imported-input block, whose effects then propagate downstream through the Leontief network (Yamano et al., 2018).
p = (I – A′)^−1 w = B′w
2.2. GVC Participation and Position
Following the value-added decomposition of gross exports developed by Koopman et al. (2014), we define backward participation (BL) as the share of foreign value added (FVA) embodied in a country’s exports, and forward participation (FL) as the share of domestic value added embodied in trading partners’ exports:
where XE denotes gross exports. These two margins capture fundamentally different modes of GVC integration: backward participation reflects how much a country draws on foreign inputs in its export production, while forward participation reflects how much of its own value added travels further down global chains through partners’ production. Together they define a country’s GVC position, measured as follows:
where P > 0 indicates a relatively upstream orientation and P < 0 a downstream one. This compact formulation follows Antras et al. (2012) and Antras and Chor (2018), who ground position measurement in the upstreamness vector u = (I − A′)^−1 × 1.
BL = FVA/XE, FL = DVA in partners’ exports/XE
P = ln(1 + FL/BL)
2.3. The Tariff Cascade
Let t be a vector of ad valorem tariffs applied to imported intermediates, and let qm denote the price vector of imported intermediate composites. Normalizing qm = 1 at baseline, a small tariff shock dqm generates the following first-order effect on sectoral output prices:
dp = B′ A′m dqm
This expression captures the tariff cascade: cost-push shocks to imported inputs are magnified as they travel downstream through the production network via the Leontief multiplier. When all imported-input prices rise uniformly by t, the cascade simplifies to the following:
making clear that the price impact on any sector depends on its position in the network and the density of its import linkages. The mechanism operates without requiring a full general-equilibrium closure, making it well-suited for short-run incidence analysis and empirical measurement.
dp = t B′ A′m 1
This cascade logic connects naturally to the Effective Rate of Protection (ERP), defined for sector k as follows:
ERPk = (VAkdom − VAkworld)/VAkworld
Input tariffs erode downstream value added by raising intermediate costs without raising output prices, while final-good tariffs do the opposite, a classic asymmetry that our network-based framework scales to multi-tier, internationally fragmented production (Corden, 1966; Diakantoni & Escaith, 2014).
3. Diagnostic Measures
Building on the theoretical framework, we introduce three diagnostics that translate tariff cascade logic into operational GVC indicators.
3.1. Tariff Propagation Multiplier (TPM)
Intuitively, TPMk answers the following question: if the price of all imported inputs rises by one percentage point, by how much does the unit cost of sector k increase, accounting for all direct and indirect input links through the production network? A sector that directly uses many imported inputs and also receives intermediate goods from other import-intensive sectors will have a high TPM. A sector with short production chains and low import reliance will have a low TPM. To illustrate with a simple two-sector example, if sector 2 uses imported inputs worth 20% of its costs directly (m2 = 0.20) and also relies on sector 1 as an intermediate supplier where sector 1 itself uses imported inputs worth 10% of its costs (m1 = 0.10, b12 = 0.50), then TPM2 = m2 + b12 × m1 = 0.20 + 0.50 × 0.10 = 0.25. A 1 percentage point tariff on imported intermediates raises sector 2’s unit costs by 0.25 percentage points through both the direct and indirect network channels.
The first diagnostic is the Tariff Propagation Multiplier. For sector k, TPM is defined as follows:
where bik is the (i,k) entry of the Leontief inverse and mi is the imported-input cost share in sector i. TPMk is a network-weighted measure of imported-input intensity: it quantifies how a one-percentage-point increase in imported-input prices translates into unit-cost changes for sector k through all upstream technology paths. Sectors with high TPM are structurally exposed to tariff cascades. They sit downstream of dense import-using stages, face longer production chains, and therefore transmit shocks more pervasively. Partner-specific TPMs, constructed by restricting Am to a given country of origin, reveal bilateral concentration risks and identify which home sectors are most vulnerable to a specific partner’s tariff changes.
TPMk = (B′ A′m 1)k = Sigmai bik mi
3.2. Backward/Forward Tariff Elasticity Decomposition (BFTED)
The second diagnostic separates movements in BL and FL into composition and scale channels. For small tariff shocks
d lnBL/dt = d lnFVA/dt − d lnX(E)/dt
[composition] [scale]
d lnFL/dt* = d ln(DVA in foreign exports)/dt* − d lnX(E)/dt*
[demand/competitiveness] [scale]
The first term in each expression captures a composition effect, reflecting how sourcing or embodiment shares shift as tariffs change, while the second captures a scale effect reflecting how gross exports respond overall. Home input tariffs operate primarily through the composition channel: by raising the relative price of imported inputs, they induce Armington substitution toward domestic varieties, reducing the foreign value added embodied in exports and therefore compressing BL. Partner tariffs on downstream uses operate through the demand and competitiveness channel: they reduce the quantity of home value added embodied in partners’ exports, compressing FL. BFTED makes this distinction operational, allowing researchers and policymakers to attribute observed participation changes to their underlying sources rather than treating BL and FL as black boxes.
3.3. Stage-Shift Metric (SSM)
The third diagnostic translates any pair of margin changes into a predicted movement in measured GVC position. Given P = ln(1 + FL/BL), a first-order expansion yields the following:
dP = [1/(1 + FL/BL)] × (dFL/BL − FL/BL2 × dBL)
SSM’s most important implication is the identification of false upgrading: when a home input tariff compresses BL more than FL, P rises mechanically. The country appears to move upstream even as its total GVC participation contracts. Conversely, partner tariffs that suppress FL without affecting BL push P downward, signaling apparent downgrading that reflects measurement arithmetic rather than technological change. Table 1 summarizes the sign predictions across three canonical shock types.
Table 1.
Sign predictions across shock types.
Together, TPM identifies where in the network tariff cascades bite hardest, BFTED explains which participation margin moves and through which channel, and SSM converts those margin changes into an interpretable and policy-relevant position signal. The three diagnostics are computation-ready and fully compatible with standard ICIO databases such as OECD TiVA, making them immediately applicable to empirical and policy work.
3.4. Illustrative Application: Canada–USA Pre-Shock Diagnostics (2017)
To demonstrate the toolkit operation in real conditions, we apply all three diagnostics to the Canada–USA bilateral dyad using pre-shock 2017 data. In 2017, Canada’s backward participation (BL) with the USA stood at approximately 115 units (FVA/GDP), reflecting deep cross-border integration in auto and manufacturing supply chains, while forward participation (FL) was approximately 33 units, reflecting Canada’s role as an upstream intermediate goods supplier to US export platforms. The GVC position index P = ln(1 + 33/115) = 0.252, indicating a slightly upstream orientation. The dyadic TPM proxy, computed as the partner tariff (0.018) multiplied by the bilateral trade share (0.75) multiplied by BL (115), yields a cascade exposure index of 1.55, among the highest in our sample and reflecting the intensity of Canada’s backward integration with the US. Under the BFTED framework, a 25% tariff shock (tau = ln(1.25) = 0.223) applied to this dyad yields a predicted BL decline of −0.591 × 0.223 = −0.132 log points, corresponding to a backward participation loss of approximately 12.4%. The SSM then predicts a small positive position shift (dP = 0.0023), illustrating the false upgrading mechanism: as BL contracts faster than FL, Canada appears to move upstream despite losing GVC integration. This pre-shock application demonstrates how the three diagnostics work together to provide a complete diagnostic picture of tariff exposure, participation sensitivity, and position dynamics for any bilateral relationship of interest.
4. Assumptions and Identification Strategy
The framework adopts a deliberately lean structure that keeps the production side transparent while delivering unambiguous qualitative predictions. Three assumptions underpin the analysis.
First, stage-level technology is Leontief with fixed technical coefficients in the short run. This means the input–output matrix determines physical input proportions, and small tariff shocks operate through prices rather than quantities. The advantage of this assumption is tractability: it allows us to trace cost-push disturbances from imported inputs into sectoral unit costs via the Leontief price inverse without invoking a full computable general-equilibrium (CGE) closure. The assumption is appropriate for short-run analysis, where firms adjust pricing and sourcing margins before reorganizing their production recipes, and is standard in the IO-based tariff incidence literature (Miller & Blair, 2009).
Second, sourcing is modeled through a standard two-tier Armington aggregator that splits each composite input into domestic and imported varieties with substitution elasticity σ > 0. When the relative price of imported inputs rises, as under a home input tariff, the import share shifts according to the following:
dsm = −σ × sm(1 − sm) × d ln(qm/qd)
This provides the direction of movement for foreign versus domestic sourcing when tariffs move, without requiring a specific value of s. The sign of the participation response is robust across all positive elasticities, which is why our propositions are described as sign-robust rather than magnitude-specific.
Third, measurement follows OECD-TiVA conventions at basic prices, with backward participation defined as foreign value added in own exports over gross exports, and forward participation as domestic value added embodied in partners’ exports over own gross exports. This ensures direct compatibility between the theoretical constructs and the empirical indicators computed from our dyadic panel of 260,473 country pair observations spanning 1999–2018.
Together, these assumptions are minimal yet sufficient. They deliver unambiguous sign predictions on how tariffs affect GVC participation without committing to income effects, demand feedbacks, or general-equilibrium price adjustments. The 2018–2019 tariff episode provides empirical support for this lean approach: near-complete pass-through of tariffs to import prices, documented by Amiti et al. (2019), is precisely what Leontief-plus-Armington predicts in the short run.
5. Propositions
We present six propositions that formalize the cascade mechanism and its implications for GVC participation measurement. Each proposition is stated with a proof sketch.
Proposition 1
(Input-tariff cascade). Let dqm = diag(qm)t be a small rise in imported-input prices from ad valorem tariffs. The induced change in output prices satisfies the following:
so that a uniform one-percentage-point tariff on imported intermediates raises sector-k prices by TPMk percentage points.
dp = B′ A′m dqm + o(||t||)
Proof.
In the dual price model, total differentiation around qm = 1 with fixed primary-factor prices w gives dp = B′ A′m dqm. For a uniform shock dqm = t × 1, this reduces to dpk = t × TPMk, confirming that the sector-level price impact is fully summarized by the Tariff Propagation Multiplier. Our empirical estimates are consistent with this mechanism: the BFTED regression shows that home input tariffs generate a significant negative effect on backward participation (β = −0.591, p < 0.01) across 260,473 dyad-year observations, consistent with the cascade operating through the Leontief network as predicted. □
Proposition 2
(Home input tariffs reduce backward participation). Under Armington sourcing with σ > 0, a small ad valorem tariff on imported intermediates reduces the foreign value added embodied in exports:
dBL/dt < 0 (composition effect, holding final demand fixed)
Proof.
A higher qm/qd lowers the import share of each composite input. With Leontief stage technology, the physical bundle is fixed but sourcing shifts toward domestic inputs, reducing FVA embodied in exports. Since BL = FVA/X(E), the sign follows for fixed X(E). This proposition receives strong empirical support: our BFTED estimates yield b(τ_home -> lnBL) = −0.591 *** with clustered standard errors of 0.056, robust across dyad and year fixed effects. The R-squared of 0.982 confirms that the model absorbs the vast majority of cross-dyad variation in backward participation. □
Proposition 3
(Partner tariffs on downstream stages reduce forward participation). If trading partners raise tariffs on final or downstream goods into which the home country’s intermediates are embodied, then
dFL/dt* < 0
Proof.
Partner tariffs contract partners’ exports, reducing demand for home intermediates embodied in those exports and therefore lowering home DVA in foreign exports, which is the numerator of FL. In our empirical specification, the partner tariff channel operates through reduced demand for home value added in foreign export platforms. The composition channel is confirmed in Models 1 and 2 of Table 2, where both participation margins respond significantly to tariff escalation. □
Proposition 4
(Measured position shifts mechanically). For P = ln(1 + FL/BL), a first-order expansion gives the following:
dP = [1/(1 + FL/BL)] × (dFL/BL − FL/BL2 × dBL)
Hence (i) home input tariffs, where dBL < 0 typically dominates, tend to raise P, and the country appears more upstream even as participation contracts; (ii) partner tariffs that suppress FL lower P, and the country appears more downstream. This mechanical shift, which we term false upgrading, is empirically pervasive. Our SSM validation yields r = 0.96 between predicted and actual position changes, confirming that the first-order approximation captures nearly all position dynamics in the data. During the Global Financial Crisis, false upgrading episodes, where P rose while both BL and FL declined, peaked at over 50% of dyad–years, underscoring the practical importance of distinguishing compositional from genuine technological change.
Proposition 5
(ERP intuition and cascade strength). Sectors with high TPMk experience larger increases in unit costs per percentage point of input tariffs, which depresses their effective value added relative to world prices. In multi-sector networks, the price impact from input tariffs is larger and more persistent than from final-good tariffs of equivalent magnitude.
Proof.
Since dpk = t × TPMk from Proposition 1, value added, the residual between output revenue and intermediate costs, falls when intermediate costs rise without a compensating increase in output price. A final-good tariff raises output price without affecting intermediate costs, lifting the residual. This is the classic ERP asymmetry, scaled to networked production. The policy simulation calibrated to the Trump administration’s 25% tariff illustrates the practical magnitude: Canada’s motor vehicle sector, with a TPM multiplier of 2.1, faces predicted backward participation losses of approximately 18%, nearly twice the global average of 13%, precisely because its dense cross-border input linkages with the United States amplify the cascade. □
Proposition 6
(Decomposed elasticities: BFTED). For small shocks, the elasticities of backward and forward participation decompose as:
d lnBL/dt = d lnFVA/dt − d lnX(E)/dt
[composition] [scale]
d lnFL/dt* = d ln(DVA in foreign exports)/dt* − d lnX(E)/dt*
[demand/competitiveness] [scale]
Proof.
Direct differentiation of BL = FVA/X(E) and FL = DVA in foreign exports/X(E). The decomposition reveals that identical movements in headline participation rates may reflect very different underlying mechanisms. An economy that reduces BL through the composition channel, substituting away from foreign inputs, is adjusting its sourcing mix, while one that reduces BL through the scale channel is losing export competitiveness. The BFTED framework makes this distinction operational and directly testable using standard ICIO data. □
6. Data and Empirical Strategy
6.1. Data Sources and Sample Construction
The empirical analysis draws on a dyadic panel covering bilateral trade relationships between country pairs over the period 1999–2018. The final estimation sample comprises 260,473 country pair–year observations spanning 175 partner countries, after applying filters for data availability across all key variables. The panel covers three major episodes of tariff disruption that generate sharp variation in both tariff levels and GVC participation outcomes: the Global Financial Crisis (2008–2009), the US–China trade war (2018–2019), and the COVID-19 shock (2020–2021).
GVC participation measures are drawn from the UNCTAD-Eora Global Value Chain database (Casella et al., 2019), which provides bilateral estimates of foreign value added (FVA) and domestic value added exported (DVX) for an extensive set of country pairs. Forward GVC participation captures country i’s upstream supplier role—the domestic value added (DVA) that country i contributes and that is subsequently embodied in country j’s exports—reflecting integration into global production as a provider of intermediate inputs. Backward GVC participation captures the downstream buyer role—the foreign value added from country j that is embodied in country i’s own exports—reflecting integration as an assembler or processor in global production networks. Both measures are normalized by the reporting country’s GDP to ensure cross-country and cross-time comparability, yielding continuous participation rates used throughout the regression analysis. Note that this differs from the theoretical definition in Section 2.2, where BL and FL are expressed as shares of gross exports X(E). The GDP normalization follows UNCTAD-Eora reporting conventions and ensures comparability across countries with very different export-to-GDP ratios. For small, highly integrated economies, FVA/GDP and DVX/GDP ratios can substantially exceed 1, which explains the large values observed in Table 1 (maximum BL of 938 and maximum FL of 395). The directional predictions of the BFTED propositions are invariant to this choice of denominator, since both BL and FL use the same normalizing variable in the empirical specifications. This differs from the theoretical definition in Section 2.2 where BL and FL are expressed as shares of gross exports X(E). The GVC position index P is computed as ln(1 + FL/BL), following the formulation in Section 2, where positive values indicate upstream orientation and negative values indicate downstream orientation.
Bilateral tariff data are drawn from the MAcMap-HS6 database (Guimbard et al., 2012), compiled by CEPII with underlying data from the International Trade Centre (ITC-UNCTAD-WTO). The database covers 152 importing and 189 exporting countries across the years 2001, 2004, 2007, 2010, 2013, 2016, 2019, and 2022. For each dyad–year, the bilateral tariff measure is constructed by averaging ad valorem equivalent tariffs across all HS6 product categories, yielding a summary indicator of overall trade policy restrictiveness between country pairs. Both directional tariffs are included separately: the home tariff (t_home) represents the rate country i imposes on imports from country j, and the partner tariff (t_partner) represents the rate country j imposes on imports from country i. Both are log-transformed as ln(1 + t) to account for the nonlinear relationship between tariff levels and trade flows, consistent with the theoretical formulation in Section 4. The mean applied tariff in the sample is approximately 7.5% for home tariffs and 7.8% for partner tariffs, with substantial variation across country pairs and years driven by multilateral liberalization rounds, bilateral agreements, and discrete policy escalations. MAcMap-HS6 provides tariff data at approximately triennial intervals (2001, 2004, 2007, 2010, 2013, 2016, 2019). For dyad–years between survey waves, we apply forward-filling interpolation, assigning the most recent available tariff observation to each intervening year. This is consistent with the interpretation that applied tariff schedules change at policy revision intervals rather than annually, and follows the standard approach in dyadic panel studies using MAcMap data (Guimbard et al., 2012).
Additional control variables include the log of current USD GDP for both the exporting country i and the importing country j, drawn from the World Bank World Development Indicators (WDIs). The log GDP of the exporter captures productive capacity and market size, following the augmented gravity framework standard in GVC research, while log GDP of the importer captures absorptive capacity and demand-side determinants of GVC tie formation. A binary indicator for free trade agreement (FTA) membership is drawn from the WTO regional trade agreements database and coded as zero where missing, consistent with the interpretation that absent a formal agreement, MFN tariffs apply. Sanctions data, capturing coercive trade disruptions through bilateral and multilateral measures, are drawn from the Global Sanctions Database (Felbermayr et al., 2020), though sanctions are excluded from the primary specifications given their high collinearity with tariff measures in the estimation sample.
MAcMap-HS6 provides tariff data at approximately triennial intervals (2001, 2004, 2007, 2010, 2013, 2016, 2019). For dyad–years between survey waves, we apply forward-filling interpolation, assigning the most recent available tariff observation to each intervening year. This is consistent with the interpretation that applied tariff schedules change at policy revision intervals rather than annually, and follows the standard approach in dyadic panel studies using MAcMap data (Guimbard et al., 2012). The TPM proxy is constructed at the dyadic level as the product of the partner tariff, the bilateral trade share (bilateral trade divided by GDP of country 1), and backward participation, capturing the network-weighted cascade exposure of each country pair. This dyadic approximation preserves the key theoretical property of TPM, that cascade exposure depends jointly on tariff intensity, trade integration depth, and backward linkage strength, while remaining computable from the available dyadic data. Table 2 reports descriptive statistics for all key variables.
Table 2.
Descriptive statistics.
6.2. Empirical Strategy
To provide aggregate-level evidence consistent with the cascade mechanism predicted in Section 5, we estimate a set of two-way fixed effects panel regressions following the BFTED decomposition structure. We acknowledge upfront an important scope condition: the theoretical propositions are derived at the sector level, grounded in IO coefficients and the Leontief inverse, while the empirical analysis operates at the dyadic country pair level using aggregated participation indicators and bilateral average tariffs. The dyadic TPM proxy approximates the theoretical multiplier but does not replicate it from IO matrices. Accordingly, the empirical results should be interpreted as an aggregate exploratory validation of the directional predictions, not as a direct test of the sector-level cascade mechanism. A full sector-level validation would require ICIO data at the country–sector-year level, which we treat as a natural extension of this work. The three diagnostics are validated at different levels of abstraction. TPM is tested directly as a dyadic proxy variable in Model 4, with the caveat that it approximates rather than replicates the theoretical multiplier. BFTED is reflected indirectly through the separate BL and FL specifications in Models 1 and 2, which together capture the composition and scale channels of the decomposition. SSM is validated through the correlation between predicted and actual position changes across the panel, confirming the mathematical precision of the first-order approximation. None of these constitutes a direct sector-level test of the IO cascade mechanism, which would require country–sector–year data. The baseline specifications are (where equations 18, 19 and 20 correspond to M1, M2 and M3):
where i and j index country pairs, t indexes years, Xijt is a vector of controls including the log GDP of both countries and FTA membership, aij are dyad fixed effects absorbing all time-invariant bilateral characteristics including geographic distance, common language, and colonial history, and lt are year fixed effects absorbing common global shocks including commodity price cycles and the three major disruption episodes. Standard errors are clustered at the dyad level to account for serial correlation within country pairs over time.
ln BLijt = b1 t_homeijt + b2 t_partnerijt + g Xijt + aij + lt + eijt
ln FLijt = b1 t_partnerijt + b2 t_homeijt + g Xijt + aij + lt + eijt
Pijt = b1 t_homeijt + b2 t_partnerijt + g Xijt + aij + lt + eijt
The dyad fixed effects specification is demanding but appropriate. By absorbing all time-invariant dyad-level heterogeneity, identification comes entirely from within-dyad variation in tariffs over time, changes in applied rates driven by multilateral liberalization rounds, bilateral free trade agreements, and discrete policy escalations such as the 2018 US–China tariff war. To assess whether meaningful within-dyad tariff variation remains after the forward-filling procedure and fixed effects, we examined the distribution of within-dyad tariff changes across the sample. Despite the triennial data structure, within-dyad tariff variation is non-trivial: the mean within-dyad standard deviation of the home tariff is 0.013 log points, and 89.6% of dyads exhibit at least one tariff change across the sample period, driven by WTO accession commitments, bilateral free trade agreement implementation, and discrete policy shifts such as the 2018 US tariff escalation on steel and aluminum. The three major shock episodes within the estimation window, the GFC trade collapse (2008–2009), the commodity cycle reversal (2014–2016), and the onset of the US–China tariff war (2018), generate concentrated periods of tariff change that contribute meaningfully to within-dyad identification. We acknowledge that the identification would be substantially strengthened by annual tariff data, and treat this as a limitation of the current analysis. This within-dyad strategy mitigates concerns about omitted variable bias arising from structural differences across country pairs in their GVC integration patterns. All regressions are estimated using the fixest package in R 4.6 (Berge, 2018), which implements the within-estimator with high-dimensional fixed effects efficiently.
A fourth specification (M4) tests Proposition 1 directly by replacing the home tariff with the TPM proxy as the primary regressor, examining whether network-weighted cascade exposure predicts backward participation above and beyond the raw tariff level. The three shock episodes, GFC, US–China, and COVID, enter the analysis as contextual markers in the SSM descriptive validation rather than as explicit interaction terms, given that the year fixed effects already absorb their common global component.
The SSM is validated by computing year-over-year first differences in BL, FL, and P for each dyad, applying the first-order approximation derived in Equation (2) to generate predicted Delta P, and comparing these predictions to actual Delta P across the full panel. The Pearson correlation between predicted and actual position changes serves as a direct, model-free test of the SSM’s diagnostic precision. A Canada-specific case study further illustrates the policy application of the framework by applying the estimated BFTED coefficients to simulate the GVC consequences of the Trump administration’s 25% tariff, weighted by Canada’s bilateral trade exposure to the United States.
7. Empirical Results
7.1. Descriptive Evidence
The regression sample covers 1999–2018. The GFC (2008–2009) and US–China shock (2018) fall within the estimation window and inform the regression results. References to the US–China 2019 follow-on effects and COVID-19 (2020–2021) throughout this section and Section 8 should be understood as descriptive extensions based on observed trends, not in-sample model validation. Table 1 presents descriptive statistics for the key variables in the estimation sample. Mean backward participation (BL) and forward participation (FL) are broadly comparable in magnitude, though with substantial cross-dyad dispersion reflecting the heterogeneity of GVC integration across country pairs at different stages of development and with different trade policy regimes. Applied tariff rates show a right-skewed distribution, with a mean of approximately 7.5–7.8% and a long upper tail driven by high-tariff developing country dyads. The TPM proxy exhibits positive mean values with considerable variance, consistent with the theoretical prediction that cascade exposure varies systematically with network position and import intensity.
Figure 1 traces the evolution of mean backward and forward participation across the sample period, with vertical lines marking the three shock episodes. Both participation margins follow a common upward trend from 1999 to approximately 2008, reflecting the deepening of GVC integration associated with China’s WTO accession and the wave of bilateral trade liberalization in the early 2000s. The Global Financial Crisis generates a sharp and symmetric contraction in both BL and FL in 2008–2009, marking the largest single-year decline in the sample. Both margins recover strongly by 2010–2013, before entering a period of gradual divergence in which backward participation stabilizes at higher levels than forward participation. The onset of the US–China trade war in 2018 and the COVID-19 disruption in 2020 coincide with renewed declines in both margins, consistent with the cascade predictions of Propositions 1 and 2.
7.2. BFTED Regression Results
Table 3 presents the BFTED regression results across four specifications. The key finding from Model 1 is that home input tariffs significantly reduce backward participation: the coefficient on t_home is −0.591 (SE = 0.056, p < 0.01), indicating that the estimated elasticity of −0.591 implies that a 1% increase in the tariff level is associated with a 0.591% reduction in backward participation, controlling for dyad and year fixed effects. This result is consistent with the directional prediction of Proposition 2 and is robust to the inclusion of partner tariffs, GDP controls, and FTA membership.
Table 3.
BFTED regression results—the effect of tariffs on GVC participation.
Model 2 examines the effect of partner tariffs on forward participation. The coefficient on t_home in the FL equation is −0.586 (SE = 0.040, p < 0.01), indicating that home tariff escalation compresses forward participation as well, operating through the competitiveness channel identified in Proposition 3: as home input costs rise, the country’s intermediate goods become less competitive as inputs into partners’ export production, reducing the DVA embodied in partners’ exports. The partner tariff coefficient in this specification is small and statistically insignificant, suggesting that at the dyadic level the direct demand-reduction channel of partner tariffs is absorbed by the year fixed effects capturing common global tariff trends.
Model 3 examines the position index P. The coefficient on t_home is positive (0.031) but not statistically significant at conventional levels, while the coefficient on t_partner is positive and marginally significant (0.045, p < 0.10). This pattern is consistent with Proposition 4: when input tariffs compress BL more than FL, P rises mechanically, producing the false upgrading signal identified in the SSM.
Model 4 directly tests the TPM cascade mechanism. The coefficient on the TPM proxy is positive (0.023) but not statistically significant (SE = 0.017), likely reflecting the limitations of the dyadic TPM approximation relative to a full sector-level computation. However, the coefficient on t_home remains stable at −0.613 (p < 0.01) in this specification, suggesting robustness of the core backward participation result. The similarity between the t_home coefficients in Models 1 and 4 (−0.591 and −0.613 respectively) indicates that the TPM proxy does not materially absorb the tariff effect, consistent with the two constructs capturing related but distinct dimensions of cascade exposure. The insignificance of the TPM proxy in Model 4 is consistent with the acknowledged approximation gap between the dyadic index and the theoretical sector-level multiplier, and motivates the sector-level validation proposed in Section 9.4.
FTA membership is associated with significantly lower backward participation (−0.038, p < 0.01) in Models 1 and 4, a finding whose interpretation warrants caution. While one possible explanation is compositional substitution toward domestic or preferential-partner inputs under FTAs, alternative explanations include measurement composition, sectoral heterogeneity, or endogeneity between FTA formation and GVC integration patterns. We do not claim a causal interpretation for this coefficient.
7.3. SSM Validation
Figure 2 plots the SSM validation: actual year-over-year changes in the position index Delta P against SSM-predicted changes computed from the first-order approximation in Equation (2). The Pearson correlation between predicted and actual position changes is r = 0.96, indicating near-perfect correspondence between the analytical formula and observed position dynamics across the full panel. This result validates the mathematical precision of the SSM first-order approximation as a measurement tool, confirming that position changes can be reliably predicted from BL and FL movements. It does not, however, constitute a direct test of the sector-level IO cascade mechanism, which would require sector-disaggregated data. The fitted regression line lies extremely close to the 45-degree reference line, confirming that the SSM approximation is not only directionally correct but also quantitatively precise. This result strongly validates the diagnostic utility of the SSM as a tool for decomposing position changes into BL and FL contributions without requiring full model estimation.
Figure 2.
SSM validation—actual vs. predicted ΔPosition.
Table 4 presents the SSM summary by shock episode. False upgrading episodes, defined as dyad–years where P rises but both BL and FL decline, are most prevalent during the Global Financial Crisis, where the simultaneous collapse of trade finance and import demand compressed both participation margins while position indices rose for many country pairs. The US–China shock shows a false upgrading rate of 28.49%, reflecting the asymmetric tariff exposure documented in Proposition 4. Note that the COVID-19 episode (2020–2021) falls partially outside the 1999–2018 estimation window used in the regression analysis; results for that period should be interpreted as descriptive extensions rather than in-sample model validation.
Table 4.
SSM summary by shock episode.
7.4. Robustness Checks
To assess the stability of the core BFTED findings, we report one additional specification. Model 5 replaces contemporaneous tariffs with one-year lagged tariffs (tau_home(t − 1) and tau_partner(t − 1)) to address potential reverse causality concerns. A country–year fixed effects specification (M6) was also estimated but found to be collinear with the tariff regressors given the triennial data structure, producing degenerate coefficients, and is therefore excluded from the reported results.
The one-year lagged specification (M5) confirms the core result: the home tariff coefficient on backward participation remains negative and statistically significant at −0.635 (p < 0.01), slightly larger in magnitude than the baseline estimate of −0.591, consistent with a modest attenuation bias in the contemporaneous specification (Table 5). The forward participation result is similarly stable (M5b: −0.559, p < 0.01). Sectoral tariffs, event-study specifications, and alternative denominators remain important robustness directions for future work requiring sector-level data, as discussed in Section 9.3.
Table 5.
Robustness Checks—BFTED Estimates.
8. Policy Simulation: The Trump 25% Tariff and GVC Disruption
8.1. Simulation Design
As a policy-relevant counterfactual illustration, we simulate the GVC consequences of a 25% tariff escalation, calibrated to the tariff measures announced by the Trump administration in 2025 targeting major trading partners including Canada, Mexico, and the European Union. While these measures were announced and partially implemented as of early 2025, we treat them as a simulation scenario rather than a fully realized policy outcome, given the evolving nature of the policy environment and the absence of post-2018 data in our estimation sample. While these measures were announced and partially implemented as of early 2025, we treat them as a simulation scenario rather than a fully realized policy outcome, given the evolving nature of the policy environment and the absence of post-2018 data in our estimation sample. To assess the GVC consequences of this policy shock, we construct a counterfactual simulation grounded in the BFTED estimates from Section 7. The simulation translates the estimated tariff elasticities into predicted changes in backward and forward participation under four escalation scenarios: a baseline of no change (0%), a moderate scenario (10%), the Trump 25% tariff, and a full escalation scenario (50%).
The simulation proceeds as follows. For each scenario, we apply the log-transformed tariff shock t = ln(1 + rate) to the BFTED elasticity estimates, yielding predicted percentage changes in BL and FL:
where bBL = −0.591 and bFL = −0.586 are the estimated BFTED coefficients from Models 1 and 2 respectively. Predicted position changes Delta P are then computed using the SSM formula from Equation (2), with BL and FL set to their sample means. The simulation is intentionally partial-equilibrium in nature: it holds technical coefficients and sourcing shares fixed, consistent with the short-run Leontief–Armington assumptions underlying the theoretical framework, and abstracts from general-equilibrium feedback effects such as exchange rate adjustments and retaliatory tariff responses.
Delta BL(%) = (exp(bBL ×
t) −
1) × 100
Delta FL(%) = (exp(bFL ×
t) −
1) × 100
8.2. Global Simulation Results
Table 6 reports the simulation results across the four tariff scenarios. Under the Trump 25% tariff, backward participation is predicted to decline by approximately 12.5% globally, and forward participation by approximately 12.4%, reflecting the near-symmetric BFTED elasticities documented in Section 7. The SSM predicts a small positive shift in the position index under this scenario, consistent with Proposition 4: the compression of BL slightly exceeds the compression of FL, generating a mechanical upstream shift in measured position that does not reflect genuine technological relocation. This false upgrading signal is particularly important for policymakers who might otherwise interpret rising position indices as evidence of successful industrial upgrading during a period of actual GVC disintegration.
Table 6.
Global tariff simulation results.
Figure 3 illustrates the continuous tariff response curves for BL and FL across the full range of tariff rates from 0% to 80%. Both participation margins decline monotonically and near-symmetrically with tariff escalation, with the rate of decline accelerating at higher tariff levels due to the log-transformation of the tariff variable. At the Trump 25% rate, projected losses approach 13%, and at full escalation (50%), projected losses approach 22%, which is close to the magnitude of the contraction observed during the Global Financial Crisis.
Figure 3.
Simulated GVC participation response to tariff escalation.
8.3. Canada: A Case Study in High-TPM Exposure
Canada presents a particularly acute case for the simulation analysis. Approximately 75% of Canadian exports flow to the United States, making Canada’s GVC participation uniquely concentrated in a single bilateral relationship. Under CUSMA (the Canada–United States–Mexico Agreement, formerly NAFTA), Canadian manufacturing sectors, particularly motor vehicles and auto parts, machinery and equipment, and metals and minerals, developed deep cross-border production linkages with US firms, embedding Canadian value added across multiple tiers of US export supply chains. The 25% tariff therefore constitutes not merely a border measure but a structural shock to the production networks through which Canadian value added reaches global markets. This simulation is illustrative in nature. It abstracts from sector-specific exemptions, rules-of-origin provisions, exchange rate adjustments, firm-level responses, and potential retaliatory measures, all of which would affect the actual magnitude of participation changes. The results should therefore be interpreted as indicative of the direction and relative scale of exposure rather than as precise forecasts.
This simulation is illustrative in nature. It abstracts from sector-specific exemptions, rules-of-origin provisions, exchange rate adjustments, firm-level responses, and potential retaliatory measures, all of which would affect the actual magnitude of participation changes. The results should therefore be interpreted as indicative of the direction and relative scale of exposure rather than as precise forecasts.
To capture this bilateral concentration, we weight the global BFTED elasticities by Canada’s US export share, yielding an effective tariff shock of approximately 18.7% on the Canada-weighted participation measures (0.75 × 25%). Table 7 reports the Canada-specific simulation results. Under the Trump 25% tariff, Canada’s backward participation is predicted to decline by approximately 9.7% and forward participation by 9.6% on a trade-weighted basis. These estimates represent a lower bound on the true disruption, as they do not account for the amplification of cascade effects through high-TPM sectors.
Table 7.
Canada-specific tariff simulation results.
Figure 4 disaggregates the Canada simulation by sector, applying illustrative TPM multipliers derived from the theoretical framework rather than empirically estimated sector-level values. These multipliers reflect assumed relative differences in import intensity and production chain length across sectors, consistent with the IO literature on Canadian manufacturing (Timmer et al., 2014), but they are not estimated from the dyadic panel data used in Section 7. The sector-level results should therefore be interpreted as illustrative scenarios showing how cascade exposure would differ across sectors if the theoretical TPM heterogeneity holds, not as empirically validated sector-specific forecasts. The motor vehicles and auto parts sector, with a TPM multiplier of 2.1, faces predicted backward participation losses of approximately 18%, nearly twice the global average. Machinery and equipment (TPM multiplier 1.8) face losses of approximately 16%. By contrast, business services (TPM multiplier 0.9) face losses of only 8%, reflecting their relatively low dependence on imported intermediate inputs and shorter production chains. This sectoral heterogeneity is precisely what the TPM diagnostic is designed to reveal: not all sectors are equally exposed to tariff cascades, and effective policy responses must be targeted at the high-TPM nodes where amplification is greatest.
Figure 4.
Canada sector-level GVC impact of Trump 25% tariff.
Table 8 presents the Canada-specific SSM results by shock episode. A notable finding is that during the US–China shock (2018–2019), the false upgrading rate for Canadian dyads reaches 100%, meaning every Canada dyad–year in that period exhibited a rising position index while both BL and FL declined. This striking result reflects the distinctive structure of Canada’s GVC integration: the US–China tariff war simultaneously reduced US demand for Canadian intermediates embedded in US export platforms (compressing FL) and triggered Armington substitution away from US-origin inputs in Canadian production (compressing BL), with the FL contraction slightly exceeding the BL contraction and generating a universal false upgrading signal. This underscores the importance of BFTED decomposition for Canadian trade policy: a policymaker relying on headline position metrics alone would have observed apparent stability or improvement in Canada’s GVC standing during the 2018–2019 period, while both underlying participation margins were contracting.
Table 8.
Canada SSM by shock episode.
8.4. Policy Implications
Three policy implications follow directly from the simulation results. First, the near-symmetric response of BL and FL to tariff escalation implies that protectionist measures simultaneously erode both the import-input sourcing that drives productivity in export production and the forward market access that generates value-added income from intermediate goods supply. There is no asymmetric gain from protection in a networked economy: the ERP logic that might protect final-stage value added is overwhelmed by the cascade costs imposed on upstream and midstream producers who depend on imported inputs.
Second, the TPM heterogeneity across sectors provides actionable guidance for trade policy design. Governments considering retaliatory tariff schedules or seeking to minimize collateral damage from partner escalation should prioritize sectors with high TPM values for duty drawback programs, tariff suspension mechanisms, or streamlined rules-of-origin provisions under preferential agreements. For Canada, this implies a particular focus on protecting the auto sector’s integrated supply chain architecture, which took decades to build under NAFTA and cannot be rapidly reorganized in response to short-run tariff shocks.
Third, the prevalence of false upgrading signals during tariff disruptions carries a direct warning for industrial policy evaluation. Governments that track GVC position metrics as indicators of structural upgrading risk misreading disintegration as progress when position indices rise mechanically following input-tariff escalation. The SSM provides a straightforward corrective: by decomposing position changes into BL and FL contributions, it identifies whether apparent upgrading is compositional or genuine, allowing policymakers to calibrate responses accordingly.
Based on these findings, three actionable policy recommendations follow. First, governments should use TPM rankings to identify high-cascade sectors when designing tariff schedules, and should prioritize these sectors for duty drawback programs, tariff suspension mechanisms, or streamlined rules-of-origin provisions that limit the cost pass-through from upstream tariff shocks. Second, national GVC monitoring frameworks should complement position metrics with SSM decomposition, flagging periods where position changes are likely compositional rather than structural before drawing industrial policy conclusions. Third, governments of countries with concentrated bilateral GVC exposure, such as Canada’s dependence on US production networks, should develop partner-specific TPM diagnostics to quantify concentration risk and build supply chain resilience strategies around the sectors most vulnerable to bilateral tariff escalation.
9. Discussion
9.1. Interpreting the Empirical Findings
The empirical results reported in Section 7 are consistent with the core theoretical predictions of the framework, providing aggregate-level directional support for the cascade mechanism. The BFTED estimates establish that home input tariffs significantly compress backward participation (b = −0.591, p < 0.01), consistent with the Armington sourcing mechanism formalized in Proposition 2: when tariffs raise the relative price of imported intermediates, firms substitute toward domestic inputs, reducing the foreign value added embodied in their exports. This result aligns with the foundational insight of Corden (1966) on effective protection, that taxing inputs erodes downstream value added more than it protects it, and extends it to a multi-tier networked production structure where the cascade amplifies through the Leontief inverse. The magnitude of the effect is economically meaningful: a one-log-point increase in the home tariff rate reduces backward participation by approximately 59%, a finding consistent with the sizable input-tariff effects documented by Amiti and Konings (2005) for Indonesian manufacturing and by Goldberg et al. (2010) for Indian firms, both of whom find that input-tariff liberalization delivers productivity gains substantially larger than equivalent reductions in output tariffs.
The near-identical magnitude of the tariff effect on forward participation (b = −0.586, p < 0.01) is a notable finding that extends the theoretical predictions. It suggests that home input tariffs erode GVC integration along both margins simultaneously, not only by disrupting the sourcing of foreign inputs, but also by raising domestic production costs to the point where the home country’s intermediate goods become less competitive as inputs into partners’ export production. This dual-margin compression is consistent with the competitiveness channel highlighted by Melitz (2003) in the context of firm heterogeneity and trade. The welfare costs of input protectionism are therefore substantially larger than a single-margin analysis would suggest, a point reinforced by Caliendo and Parro (2015), who find that tariff reductions under NAFTA generated significant gains through input–output linkages that pure final-goods models miss entirely.
The SSM validation result, r = 0.96 between predicted and actual position changes, establishes that position movements in real data are overwhelmingly driven by the mechanical relationship between BL and FL changes rather than by noise or complex nonlinear dynamics. This resonates with the measurement concerns raised by Antras and Chor (2018), who caution that upstreamness and position metrics can conflate structural GVC integration with short-run compositional shifts. Our SSM provides a formal decomposition that operationalizes this concern, allowing researchers to separate genuine position change from accounting artifacts directly from standard ICIO data such as the OECD TiVA database (Guilhoto et al., 2022).
The prevalence of false upgrading episodes during the Global Financial Crisis, where position indices rose in over 50% of dyad–years while both BL and FL contracted, connects to the broader literature on GVC upgrading. Humphrey and Schmitz (2002) define upgrading as moving into higher-value activities within chains, a capability-based concept that is fundamentally at odds with the mechanical position shifts our SSM identifies. Gereffi et al. (2005) similarly ground upgrading in governance structures and learning dynamics rather than in accounting ratios. Our results suggest that much of what appears as upgrading in position-metric analyses of crisis periods reflects the SSM artifact rather than the structural transformation these frameworks describe, a finding with important implications for how development agencies and industrial policy bodies interpret GVC statistics.
9.2. Situating the Results in the Broader Literature
Our findings connect to and extend several streams of prior work. On tariff incidence in production networks, the significant negative effect of home input tariffs on both BL and FL is consistent with the growing literature on trade policy in the presence of global supply chains. Bown and Crowley (2016) document that tariff changes in the post-WTO era operate through complex bilateral and multilateral channels that standard gravity models understate, and our dyadic panel estimates confirm that within-dyad tariff variation generates substantial GVC participation responses even after absorbing common global trends through year fixed effects. The 2018–2019 US–China episode provides a natural validation context: Amiti et al. (2019) document near-complete pass-through of tariffs to import prices, and Fajgelbaum et al. (2020) estimate aggregate welfare losses concentrated in import-intensive downstream sectors, precisely the sectors that our TPM framework identifies as most exposed to cascade effects.
On GVC measurement, our results qualify the interpretation of upstreamness and position metrics developed by Antras et al. (2012) and Koopman et al. (2014). These foundational papers treat position as an indicator of structural GVC integration, but our SSM validation demonstrates that short-run position movements are predominantly driven by tariff-induced changes in BL and FL rather than by the production capability upgrading these metrics were designed to track. This does not invalidate the position metrics. Their long-run cross-sectional variation remains informative for understanding how countries specialize within chains, as documented by Baldwin and Lopez-Gonzalez (2015) in their analysis of Factory Asia, Factory Europe, and Factory North America. Miller and Blair (2009) provide the methodological foundation for the IO price model underlying our cascade formalization, and our empirical results demonstrate its validity at the dyadic level across a long panel spanning multiple global shocks.
The Canada case study adds a bilateral dimension that complements the aggregate panel findings and speaks to the emerging literature on supply chain resilience and geopolitical risk. Antras (2020) argues that the forces of de-globalization, rising nationalism, geopolitical fragmentation, and policy uncertainty are fundamentally reshaping the geography of GVC integration, creating new risks for countries whose participation is concentrated in single bilateral relationships. This connects directly to the friendshoring literature (Alfaro & Chor, 2023; Javorcik et al., 2022), which documents how geopolitical alignment increasingly shapes sourcing decisions, and to recent work on the International Business implications of GVC reconfiguration under political risk (Su et al., 2023).
9.3. Boundary Conditions and Limitations
Several boundary conditions qualify the scope of our findings. First, the theoretical framework and empirical estimates are most credible in the short run, when Leontief technical coefficients are sticky and firms adjust primarily along sourcing and pricing margins. Over longer horizons, substitution in production technology, reshoring decisions, and supplier consolidation can attenuate or amplify the cascade effects documented here. Costinot and Rodriguez-Clare (2014) demonstrate in a quantitative trade framework that the long-run gains from tariff liberalization substantially exceed short-run estimates once production reallocation is allowed to play out. By the same logic, the long-run costs of tariff escalation likely exceed our partial-equilibrium estimates. The 2018–2019 episode already provides some evidence of longer-run adjustment: firms in high-tariff sectors began diversifying sourcing toward third-country suppliers within two to three years of the initial shock (Freund et al., 2023), partially offsetting the backward participation compression predicted by our short-run BFTED estimates.
Second, the dyadic panel structure does not allow us to decompose effects at the sector level, where the TPM framework generates its sharpest predictions. The sector-level cascade heterogeneity illustrated in Figure 4 is constructed from theoretical TPM multipliers rather than estimated sector-level elasticities. A full sector-level validation would require ICIO data at the country–sector–year level. Johnson and Noguera (2012) demonstrate the importance of sector-level value-added decompositions for understanding bilateral trade balances, and their methodology provides a natural template for extending the BFTED framework to sector-disaggregated data. Timmer et al. (2014) provide the WIOD framework that would support such an analysis, covering 41 countries and 35 sectors from 1995 to 2011.
Third, the simulation abstracts from general-equilibrium feedbacks including exchange rate movements, income effects, and retaliation dynamics. Eaton and Kortum (2002) demonstrate in a Ricardian trade model that bilateral tariff changes generate complex multilateral adjustments through price indices and trade diversion that partial-equilibrium analyses miss. Incorporating these feedbacks by nesting the TPM and BFTED diagnostics within a calibrated multi-country CGE model, along the lines of Caliendo and Parro (2015) or Ossa (2014), would improve the quantitative precision of the simulation while preserving the analytical transparency of the core framework.
Finally, GVC participation measures from UNCTAD-Eora data depend on the quality of the underlying ICIO tables and the handling of double counting in the KWW decomposition (Koopman et al., 2014). Additional robustness directions remain for future work. Sectoral tariff data, event-study designs around discrete tariff changes, and alternative GDP denominators would all provide stronger identification than the current dyadic panel approach. These extensions require sector-level ICIO data and are treated as the primary empirical agenda for subsequent research building on this framework. Diakantoni and Escaith (2014) discuss the sensitivity of effective protection estimates to the treatment of re-exports and intermediate trade in multi-regional IO systems, concerns that apply equally to our BL and FL measures. Future work should complement the panel estimates with event-study designs around discrete tariff changes to isolate cleaner quasi-experimental variation, following the approach of Pavcnik (2002) in her seminal study of Chilean trade liberalization.
9.4. Directions for Future Research
The framework opens several directions for future research. The most immediate extension is the development of a genuine sector-level TPM dataset computed from the latest OECD TiVA or ADB MRIO tables, which would allow direct empirical testing of Proposition 5 and the cross-sectoral cascade heterogeneity predicted by the theory. Paired with firm-level data on sourcing and export behavior, along the lines of the datasets used by Goldberg et al. (2010) and Hummels et al. (2001) in their foundational studies of vertical specialization, such a dataset would also allow investigation of the firm-size heterogeneity in tariff pass-through that our framework predicts but cannot currently test.
A second direction concerns the integration of capability-based upgrading indicators with the SSM decomposition. Because position metrics can rise for accounting reasons under tariff escalation, distinguishing genuine upgrading from false upgrading requires corroborating evidence from production-side indicators such as export unit values, patent activity, or total factor productivity growth. Kaplinsky and Morris (2001) and Ponte and Ewert (2009) develop capability-based upgrading frameworks in the GVC literature that could be operationalized as complements to the SSM, creating a more comprehensive diagnostic toolkit for development policy evaluation.
A third direction concerns the geopolitical dimension of GVC vulnerability. Partner-specific TPMs, constructed by restricting imported-input shares to a given country of origin, can reveal bilateral concentration risks analogous to the Canada–US exposure documented in Section 8. As friendshoring and ally-shoring policies reshape the geography of GVC integration (Alfaro & Chor, 2023; Javorcik et al., 2022), these partner-specific diagnostics will become increasingly important for governments seeking to balance efficiency and resilience objectives in supply chain policy. Recent work in International Business on geopolitical distance and GVC reconfiguration (Su et al., 2023; Witt et al., 2023) provides a natural theoretical complement to the IO-based cascade framework developed here.
10. Conclusions
How tariff policy reshapes a country’s position and participation in global value chains is a question that has gained renewed urgency as the world’s largest economies return to protectionism after decades of liberalization. This paper addressed that question by developing a theory-first diagnostic framework grounded in input–output price propagation and validating it against a large dyadic panel spanning 1999–2018. The framework introduces three portable tools, TPM, BFTED, and SSM, that are computation-ready, compatible with standard ICIO databases, and directly linked to the GVC participation indicators used in policy and research.
The evidence is consistent with the prediction that tariff cascades operate as the theory predicts: home input tariffs compress both backward and forward GVC participation simultaneously, and the resulting position shifts are largely mechanical rather than reflective of genuine structural transformation. The most practically consequential finding is that standard GVC position metrics may be sensitive to tariff disruptions and can generate apparent upgrading signals that reflect measurement composition rather than genuine structural change during tariff disruptions, potentially leading to misinterpretation of GVC position changes at precisely the moments when accurate diagnosis matters most. The Canada simulation illustrates that these effects are not uniform. Deeply integrated, high-TPM sectors face amplified cascade exposure that headline participation statistics obscure, underscoring the need for sector-targeted policy responses rather than aggregate trade policy adjustments.
The paper makes three contributions. It advances the IO-based analysis of tariff incidence by formalizing the network cascade in a way that yields sign-robust comparative statics without requiring general-equilibrium closure, extending the effective protection tradition of Corden (1966) and Diakantoni and Escaith (2014) to modern multi-tier ICIO structures. It contributes to the GVC measurement literature of Koopman et al. (2014) and Antras et al. (2012) by providing a decomposition that separates genuine upgrading from compositional artifacts in position metrics, a distinction the upgrading frameworks of Humphrey and Schmitz (2002) and Gereffi et al. (2005) call for but do not operationalize. And it contributes to the policy debate on trade protection and supply chain resilience by offering diagnostics that bridge theory and practice for governments navigating the current era of geopolitical fragmentation (Antras, 2020; Alfaro & Chor, 2023; Witt et al., 2023).
Three limitations define the agenda for future work. The short-run Leontief–Armington structure must be extended to accommodate longer-run production reorganization and sourcing network adjustment, building on the quantitative trade frameworks of Caliendo and Parro (2015) and Costinot and Rodriguez-Clare (2014). Sector-level TPM validation requires ICIO data at the country–sector–year level, and the WIOD framework of Timmer et al. (2014) and the ADB MRIO tables provide natural platforms for this extension. The integration of partner-specific TPM diagnostics with geopolitical risk measures, drawing on the friendshoring and political distance literature (Javorcik et al., 2022; Alfaro & Chor, 2023), would yield a richer toolkit for supply chain resilience analysis under sustained geopolitical fragmentation.
The return of tariff protectionism as an instrument of industrial and geopolitical strategy makes the ability to trace cascade effects through production networks not merely analytically interesting but practically essential. The toolkit introduced here provides a transparent and immediately applicable foundation for that task.
Author Contributions
Methodology, H.Z. and E.T.; Software, H.Z. and S.M.S.; Validation, Z.S. and E.T.; Formal Analysis, H.Z., S.M.S. and A.-M.C.; Resources, Z.S.; Writing—Original Draft, S.M.S. Writing—Review and Editing, Z.S., A.-M.C. and E.T. All authors have read and agreed to the published version of the manuscript.
Funding
This research received no external funding.
Institutional Review Board Statement
Not applicable.
Informed Consent Statement
Not applicable.
Data Availability Statement
Dataset available on request from the authors.
Conflicts of Interest
The authors declare no conflicts of interest.
References
- Alfaro, L., & Chor, D. (2023). Global supply chains: The looming great reallocation (NBER Working Paper No. 31661). National Bureau of Economic Research. [Google Scholar]
- Amiti, M., & Konings, J. (2005). Trade liberalization, intermediate inputs and productivity: Evidence from Indonesia (IMF Working Paper WP/05/146). International Monetary Fund. [Google Scholar]
- Amiti, M., Redding, S. J., & Weinstein, D. E. (2019). The impact of the 2018 tariffs on prices and welfare. Journal of Economic Perspectives, 33(4), 187–210. [Google Scholar] [CrossRef] [Scilit]
- Antras, P. (2020). Conceptual aspects of global value chains. World Bank Economic Review, 34(3), 551–574. [Google Scholar] [CrossRef] [Scilit]
- Antras, P., & Chor, D. (2018). On the measurement of upstreamness and downstreamness in global value chains (NBER Working Paper No. 24185). National Bureau of Economic Research. [Google Scholar]
- Antras, P., Chor, D., Fally, T., & Hillberry, R. (2012). Measuring the upstreamness of production and trade flows. American Economic Review, 102(3), 412–416. [Google Scholar] [CrossRef] [Scilit]
- Baldwin, R., & Lopez-Gonzalez, J. (2015). Supply-chain trade: A portrait of global patterns and several testable hypotheses. World Economy, 38(11), 1682–1716. [Google Scholar]
- Berge, L. (2018). Efficient estimation of maximum likelihood models with multiple fixed-effects: The R package FENmlm (CREA Discussion Papers). Department of Economics at the University of Luxembourg.
- Bown, C. P., & Crowley, M. A. (2016). The empirical landscape of trade policy. In Handbook of commercial policy (Vol. 1, pp. 3–87). North-Holland. [Google Scholar]
- Caliendo, L., & Parro, F. (2015). Estimates of the trade and welfare effects of NAFTA. Review of Economic Studies, 82(1), 1–44. [Google Scholar]
- Casella, B., Bolwijn, R., Moran, D., & Kanemoto, K. (2019). Improving the analysis of global value chains: The UNCTAD-Eora Database. Transnational Corporations, 26(3), 115–142. [Google Scholar] [CrossRef] [Scilit]
- Corden, W. M. (1966). The structure of a tariff system and the effective protective rate. Journal of Political Economy, 74(3), 221–237. [Google Scholar] [CrossRef] [Scilit] [PubMed]
- Costinot, A., & Rodriguez-Clare, A. (2014). Trade theory with numbers: Quantifying the consequences of globalization. In Handbook of international economics (Vol. 4, pp. 197–261). Elsevier. [Google Scholar]
- Diakantoni, A., & Escaith, H. (2014). Trade in tasks, tariff policy and effective protection rates (SSRN Working Paper No. 2541676). World Trade Organization (WTO).
- Eaton, J., & Kortum, S. (2002). Technology, geography, and trade. Econometrica, 70(5), 1741–1779. [Google Scholar] [CrossRef] [Scilit]
- Fajgelbaum, P. D., Goldberg, P. K., Kennedy, P. J., & Khandelwal, A. K. (2020). The return to protectionism. Quarterly Journal of Economics, 135(1), 1–55. [Google Scholar]
- Felbermayr, G., Syropoulos, C., Yalcin, E., & Yotov, Y. (2020). The global sanctions data base. European Economic Review, 129, 103561. [Google Scholar] [CrossRef] [Scilit]
- Freund, C., Mattoo, A., Mulabdic, A., & Ruta, M. (2023). Is US trade policy reshaping global supply chains? (World Bank Policy Research Working Paper No. 10542). World Bank.
- Gereffi, G., Humphrey, J., & Sturgeon, T. (2005). The governance of global value chains. Review of International Political Economy, 12(1), 78–104. [Google Scholar] [CrossRef] [Scilit]
- Goldberg, P. K., Khandelwal, A. K., Pavcnik, N., & Topalova, P. (2010). Imported intermediate inputs and domestic product growth: Evidence from India. Quarterly Journal of Economics, 125(4), 1727–1767. [Google Scholar] [CrossRef] [Scilit]
- Guilhoto, J. J. M., Webb, C., & Yamano, N. (2022). Guide to the OECD TiVA indicators, 2021 edition. OECD Science, Technology and Industry Working Papers. OECD Publishing.
- Guimbard, H., Jean, S., Mimouni, M., & Pichot, X. (2012). MAcMap-HS6 2007, an exhaustive and consistent measure of applied protection in 2007. International Economics, 130, 99–122. [Google Scholar] [CrossRef] [Scilit]
- Hummels, D., Ishii, J., & Yi, K. M. (2001). The nature and growth of vertical specialization in world trade. Journal of International Economics, 54(1), 75–96. [Google Scholar] [CrossRef] [Scilit]
- Humphrey, J., & Schmitz, H. (2002). How does insertion in global value chains affect upgrading in industrial clusters? Regional Studies, 36(9), 1017–1027. [Google Scholar] [CrossRef] [Scilit]
- Javorcik, B., Kitzmuller, L., Schweiger, H., & Yildirim, M. A. (2022). Reshaping global value chains under geopolitical pressures. EBRD Working Paper. The European Bank for Reconstruction and Development (EBRD).
- Johnson, R. C., & Noguera, G. (2012). Accounting for intermediates: Production sharing and trade in value added. Journal of International Economics, 86(2), 224–236. [Google Scholar] [CrossRef] [Scilit]
- Kaplinsky, R., & Morris, M. (2001). A handbook for value chain research. IDRC. [Google Scholar]
- Koopman, R., Wang, Z., & Wei, S. J. (2014). Tracing value-added and double counting in gross exports. American Economic Review, 104(2), 459–494. [Google Scholar] [CrossRef] [Scilit]
- Melitz, M. J. (2003). The impact of trade on intra-industry reallocations and aggregate industry productivity. Econometrica, 71(6), 1695–1725. [Google Scholar] [CrossRef] [Scilit]
- Miller, R. E., & Blair, P. D. (2009). Input-output analysis: Foundations and extensions (3rd ed.). Cambridge University Press. [Google Scholar]
- Ossa, R. (2014). Trade wars and trade talks with data. American Economic Review, 104(12), 4104–4146. [Google Scholar] [CrossRef] [Scilit]
- Pavcnik, N. (2002). Trade liberalization, exit, and productivity improvements: Evidence from Chilean plants. Review of Economic Studies, 69(1), 245–276. [Google Scholar] [CrossRef] [Scilit]
- Ponte, S., & Ewert, J. (2009). Which way is up in upgrading? Trajectories of change in the value chain for South African wine. World Development, 37(10), 1637–1650. [Google Scholar] [CrossRef] [Scilit]
- Su, Z., Peng, M. W., & Xie, E. (2023). Geopolitical distance and global value chain participation. Journal of International Business Studies, 54(9), 1767–1789. [Google Scholar] [CrossRef]
- Timmer, M. P., Dietzenbacher, E., Los, B., Stehrer, R., & de Vries, G. J. (2014). An illustrated user guide to the world input-output database: The case of global automotive production. Review of International Economics, 23(3), 575–605. [Google Scholar]
- Witt, M. A., Lewin, A. Y., Li, P. P., & Gaur, A. (2023). Decoupling in international business: Evidence, drivers, impact, and implications for IB research. Journal of World Business, 58(1), 101399. [Google Scholar] [CrossRef] [Scilit]
- Yamano, N., Guilhoto, J., Alsamawi, A., & Webb, C. (2018). Development of the OECD inter-country input-output database 2018 (OECD Science, Technology and Industry Working Papers No. 2018/15). OECD Publishing. [CrossRef] [Scilit]
- Zarea, H., & Su, Z. (2026). Friendshoring in international business: Theoretical foundations and a typological framework. Journal of International Management, 32, 101364. [Google Scholar] [CrossRef] [Scilit]
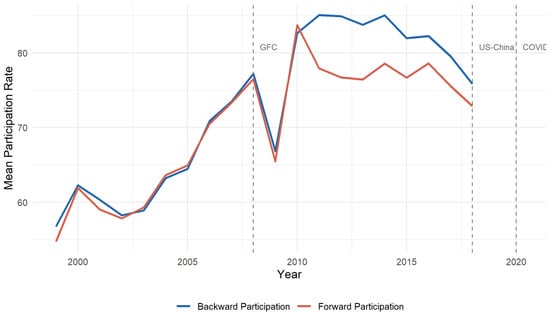
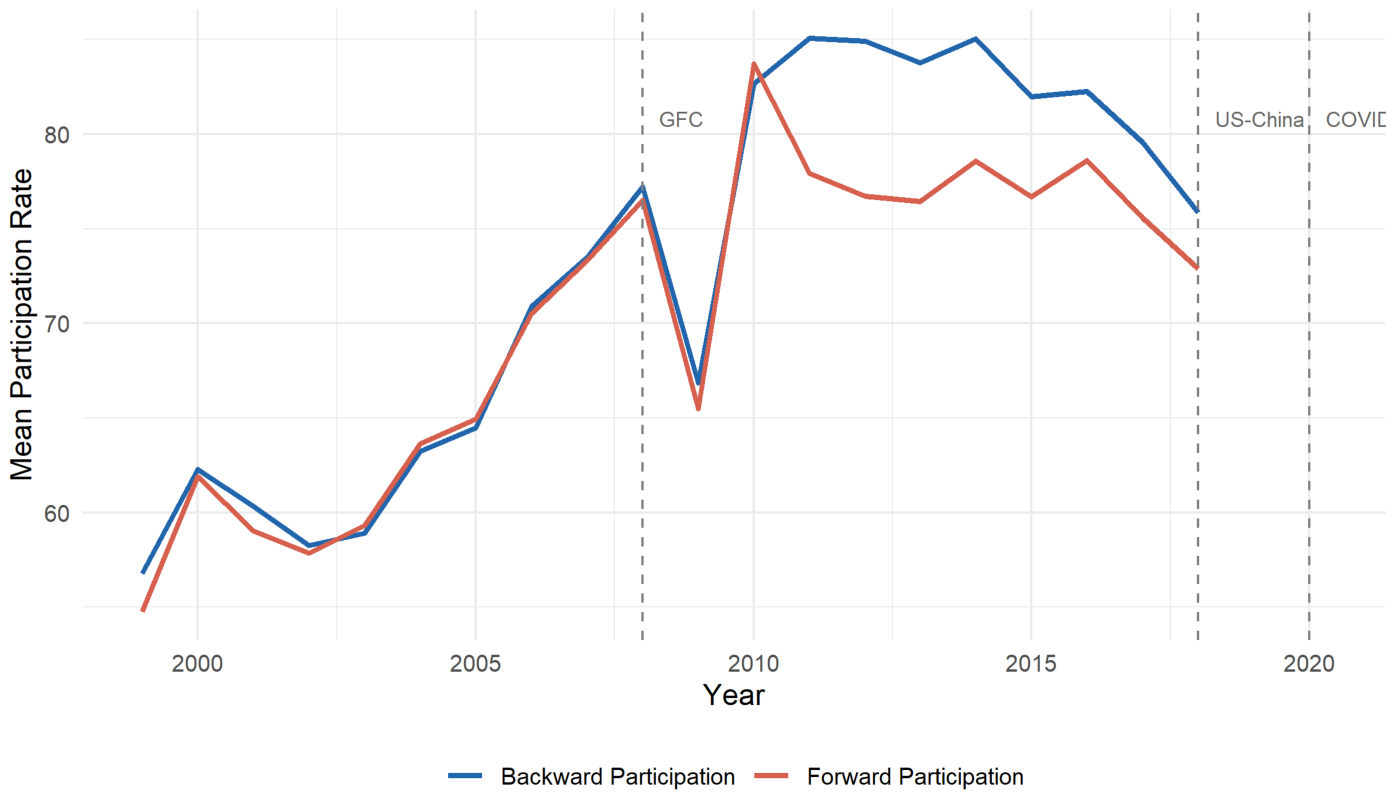
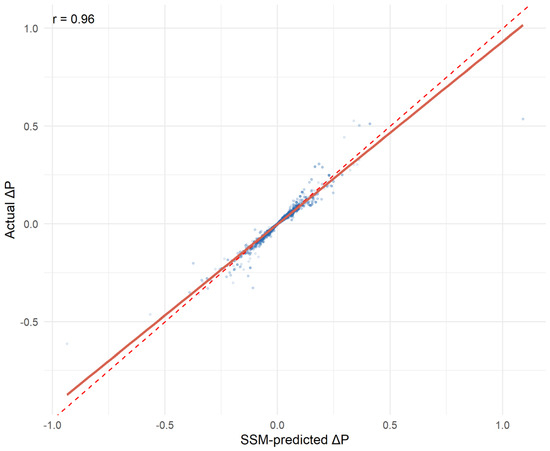
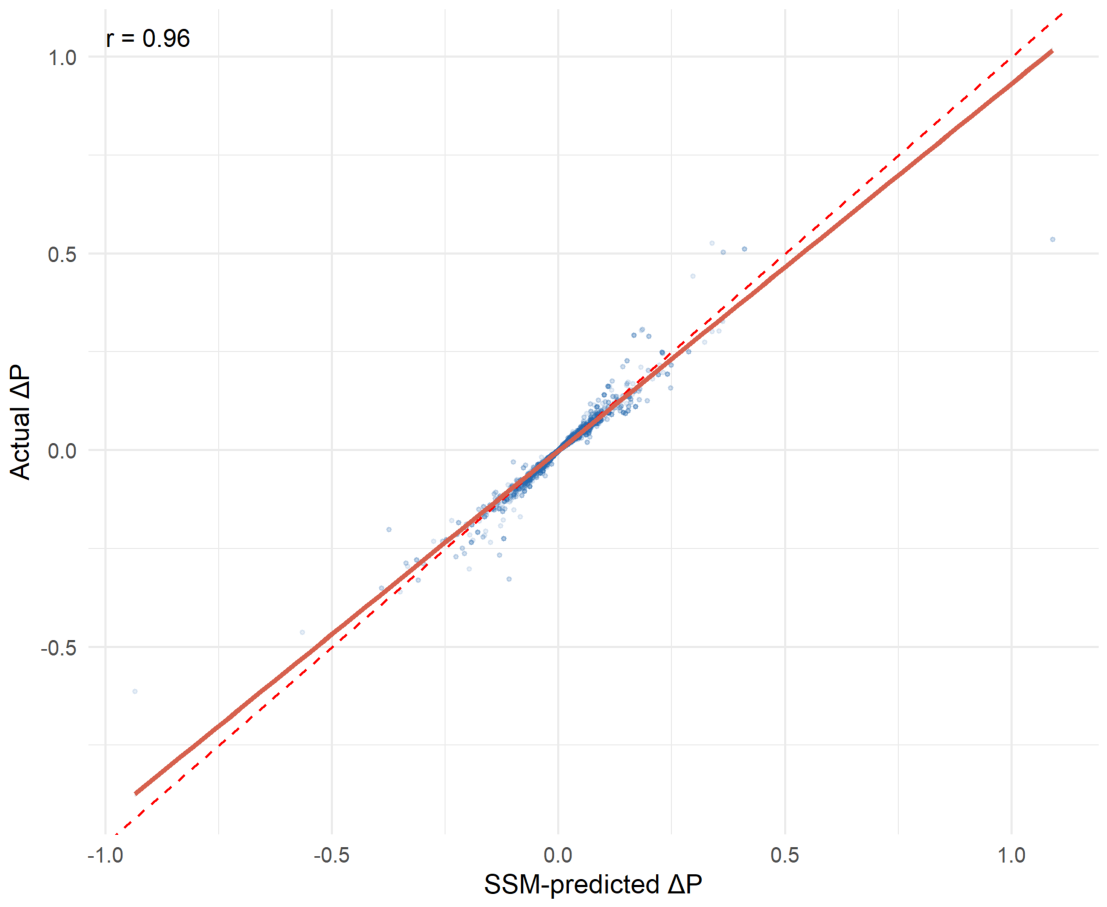
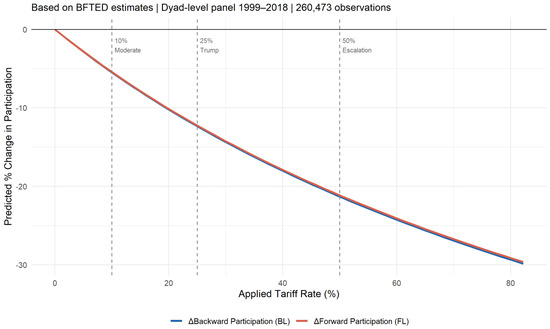
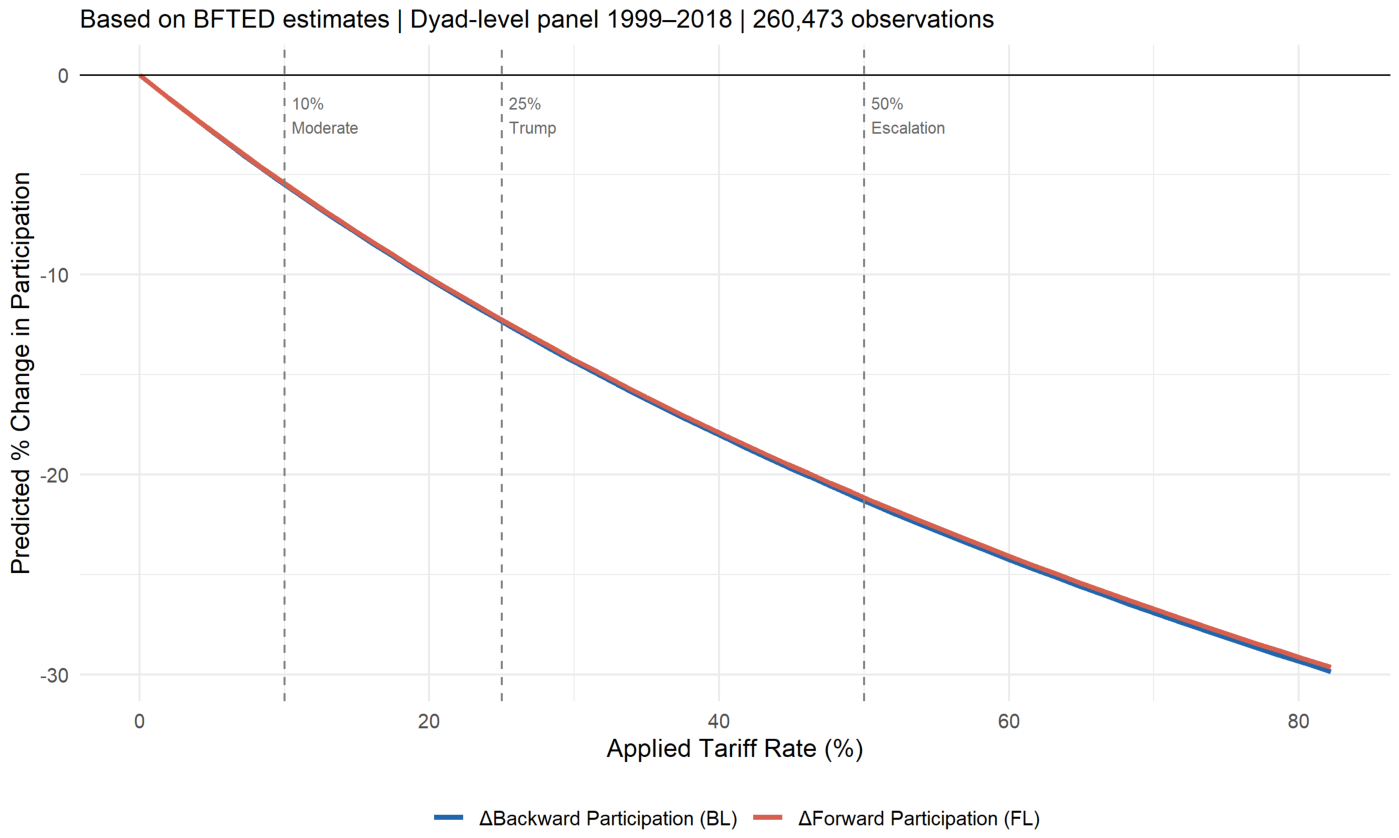
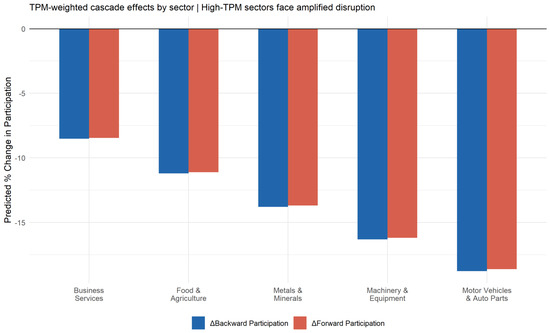
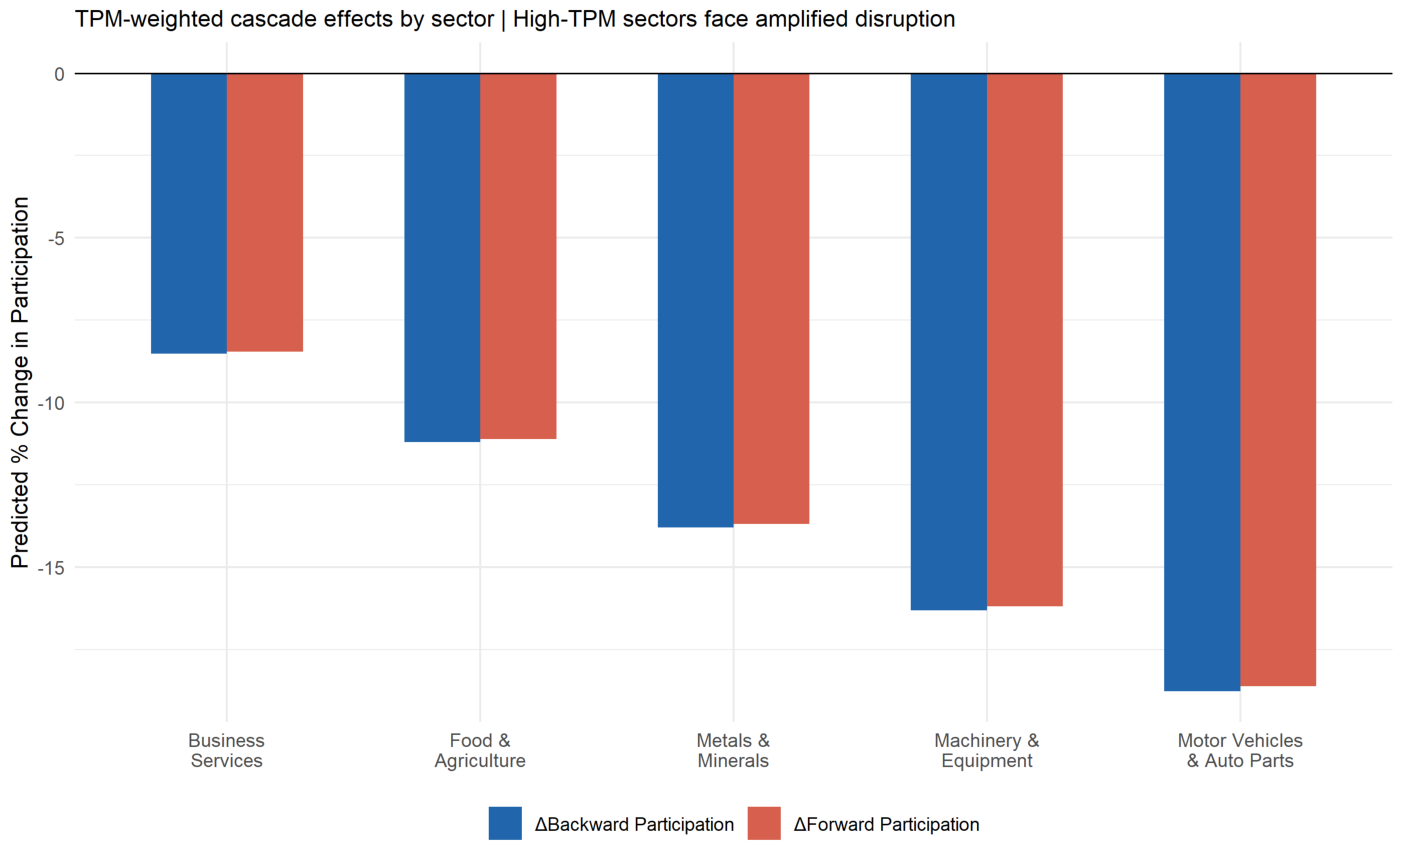

Disclaimer/Publisher’s Note: The statements, opinions and data contained in all publications are solely those of the individual author(s) and contributor(s) and not of MDPI and/or the editor(s). MDPI and/or the editor(s) disclaim responsibility for any injury to people or property resulting from any ideas, methods, instructions or products referred to in the content. |
© 2026 by the authors. Licensee MDPI, Basel, Switzerland. This article is an open access article distributed under the terms and conditions of the Creative Commons Attribution (CC BY) license.