


Abstract
This study applies the bivariate probit model to a panel of Chinese listed advanced manufacturers to investigate the relationship between tax incentives and firms’ decision on export and R&D. Estimations show that VAT refund and income tax deduction are positively related to firms’ decision on exporting and starting R&D, respectively. Regarding firms’ export decisions, VAT refund is associated much greatly with R&D firms’ decisions on becoming exporters than non-R&D firms’ decisions on becoming exporters. However, the relationship between tax deduction and firms’ R&D decisions depends on firm size. For large firms, tax deduction is associated relatively greatly with exporters in starting R&D activity than with domestic firms in starting R&D activity, whereas, for small firms, tax deduction is associated much more greatly with domestic firms in starting R&D activity than with exporters in starting R&D activity. The study suggests that the relationship between tax incentives and firms’ decisions on becoming exporters and R&D firms varies depending on firms’ status and size.
JEL Classification:
C35; F14; H25; O32
1. Introduction
The Chinese economy shifts away from capital-driven economy toward innovation-driven economy based on the high-tech manufacturing industry by promoting firms’ innovation capacity. At the same time, the economy focuses on exporting high-technology products to maintain its export-driven economy. To build a high-technology industry competitive in the world market, the Chinese government provides tax incentives to stimulate firms’ innovation and export activities. Thus, it is important to understand the relationship between tax incentives and a firm’s decision on research and development (R&D) and exports.
Previous studies considered the interaction between firm-level innovation and export behavior as a critical area of economic research with significant policy implications. Many studies reported the interdependent nature of export decisions and innovation activities (for example, Akcigit et al., 2018; Melitz & Redding, 2021; C. H. Yang & Chen, 2012). These studies show that firms’ innovation activity determines their export decisions by enabling them to overcome extra transaction costs required to sell products overseas and compete in the world market. These studies implied that R&D tax incentives can affect export-related technology upgrading and firm selection in the world market.
In this respect, Bloom et al. (2002) provided a benchmark study regarding how tax incentives affect R&D investment. This study reported a significantly positive impact of fiscal incentives on R&D investment, initiating many subsequent studies. Dechezleprêtre et al. (2023) show how a credible eligibility-threshold design can identify the effect of R&D tax relief on R&D, patenting and spillovers. This research suggested that the tax policy enhances R&D and patents significantly, activating positive technology spillovers. Meanwhile, Bustos (2011) investigated how trade exposure and exporting incentives can lead firms to upgrade technology. Mugerman et al. (2024) show that the design and monitoring of incentives can affect firms’ effort in nonlinear ways. These studies suggest that tax incentives boost firms’ R&D investment and export when they are well designed and implemented.
Building on the previous studies, our study empirically investigates the relationship between tax incentives and firms’ decision regarding R&D and export by applying the bivariate probit model to a panel of Chinese advanced firms. The choice model enables us to estimate the relationship between firm behavior and government incentives at the significant margin that transforms firms from non-R&D (domestic) firms to R&D (exporting) firms. The model consists of the system of R&D and export equations to increase estimation efficiency because the error terms of the two equations are correlated due to commonly omitted variables.
Our study focuses on changes in the firm’s decision toward innovation and export by exploring whether incentive policies are related to firms’ transformation from non-R&D (non-exporting) firms to R&D (exporting) firms. This provides a new angle of looking at incentive effects, compared to previous studies that estimated the degree of effect. Further, the study delivers efficient estimates by estimating the R&D and export equations simultaneously. The bivariate probit model utilizes correlation information between R&D and export, improving estimation efficiency because the two variables are significantly associated.
Numerous studies have empirically investigated the influence of policy interventions on R&D activity for the Chinese manufacturing industry. Most studies reported a positive impact of government incentives on firms’ innovation (e.g., Cao et al., 2022; K. Chen et al., 2024; Z. Chen & Zhang, 2019; Dang & Motohashi, 2015; Ding et al., 2021; Y. Li, 2018; S. Liu et al., 2020; Tian & Park, 2024; Y. Wang & Mayburov, 2025; H. Wang et al., 2024; W. Wang et al., 2025; Wu, 2017; Xiao & Zhuang, 2022; J. Xu & Hu, 2024; Z. Yang et al., 2020; Zheng & Zhang, 2021). However, some studies reported that the effectiveness of incentives depends on the incentive magnitude (S. Zhao et al., 2018) and the firm’s ownership structure and characteristics (S. Liu et al., 2020; Tang et al., 2018). Furthermore, a study reported that government grants have a negative influence on the innovation efficiency of high-technology industries (Hong et al., 2016). Some studies also indicated that incentives stimulate low-quality innovations rather than significant innovations (Dang & Motohashi, 2015; Z. Chen & Zhang, 2019; J. Wang et al., 2024) and do not increase a firm’s productivity significantly (Q. Liu et al., 2024).
Previous studies have also investigated the relationship between tax incentives and export (An et al., 2017; Anwar et al., 2019; Barwick et al., 2025; Chandra & Long, 2013; C. H. Chen et al., 2006; Feng et al., 2021; Fu & Zhang, 2026; Hsu & Zhu, 2011; Kalouptsidi, 2018; Kong & Xiong, 2021; C. Li et al., 2024; Liang et al., 2022; Pernet, 2024; Rotunno & Ruta, 2024; L. Wang & Anwar, 2022; C. Xu & Liu, 2023; Zhang, 2019). These studies reported a significantly positive effect of tax incentives on export by applying various estimation methods to different samples for the Chinese manufacturing industry. However, a few studies demonstrated a negative effect of tax incentives on export (Kong & Xiong, 2021; L. Wang & Anwar, 2022). For example, Kong and Xiong (2021) reported that VAT cut reduces product quality significantly, suggesting that export expansion occurs at the cost of output quality. L. Wang and Anwar (2022) indicated that VAT rebate significantly decreases exports for the Chinese mechanical product industry.
Despite the strong literature that has explored the relationship between tax incentives and R&D or tax incentives and export, few studies have empirically explored the relationship between government incentives, innovation and export simultaneously for the Chinese manufacturing sector. This research gap is surprising because the Chinese government implements incentives to promote exports through innovation to keep its manufacturing power to sustain growth and strength.
Against this background, our study attempts to fill the research gap as follows: First, the study investigates whether incentives are related to firms’ decision to start innovation activity. Similarly, it analyzes whether incentives are related to firms’ decision to export their products overseas. The binary choice model can estimate the relationship between incentives and the probability of becoming R&D firms or exporters. Firms’ transformation into R&D firms and exporters provides them with opportunities to innovate and grow, affecting the future trajectory of growth. Also, there is an inertia in firms’ decision that keeps firms maintaining their activity in the future; R&D (exporting) firms are likely to remain as such firms. Thus, marginal effects are much greater than they appear, reaching far and above the current horizon. Despite this significance, there are few studies that have investigated the relationship between incentives and the probability of changing the firm’s R&D and export behavior simultaneously.1
Second, the study estimates the bivariate probit model consisting of two probability equations of R&D and export to improve estimation efficiency. It is well known that firms being exporters is associated with firms’ innovation capacity; exporters are likely to be R&D firms. Error terms of the two equations are correlated by common variables not included as regressors. The bivariate choice model produces more efficient estimates by using additional information about the correlation in estimation, compared to a single equation model.2
Third, our study investigates whether the relationship between tax incentives and firms’ decision to export and innovate depends on firm size. The government can design or implement a better incentive policy if it understands more about the mechanisms through which tax incentives are related to firms’ decisions that vary across firm size. To see policy heterogeneity in firm size, the study classifies the sample into three subsamples consisting of large firms, medium firms and small firms. By applying the panel bivariate probit model to the subsamples, the study can provide some perspectives about the relationship between tax policy and innovation and export at deeper and more specific levels.
With this approach, our study estimates the relationship denoted as changes in firms’ actions toward R&D and export, not as changes in the degree of involvement. This study sheds some light on the relationship between government incentives and changes in firms’ behavior.
Estimation results suggest that VAT refund and R&D deduction are positively related to a firm’s decisions on exporting and starting R&D activity, respectively. The relationship between VAT refund and firms’ decision on becoming exporters is much greater for R&D firms than for non-R&D firms. Regarding heterogeneity in firm size, for large firms, the relationship between income tax deduction and firms’ decision on starting R&D activity is much greater for exporters than for domestic firms, whereas, for small firms, the relationship is much greater for domestic firms than for exporters. The study suggests that the relationship between tax incentives and firms’ decisions on becoming exporters and R&D firms varies depending on firms’ status and size.
2. Methodology
To consider the correlation between exports and R&D, our paper adopts an analytical model consisting of simultaneous equations to investigate the relationship between incentive programs and firms’ decisions that affect exports and R&D. The sample firms are classified into export firms that sell output in foreign markets and domestic firms that serve only the domestic market. This is to see if government policy influences the probability of participating in export markets. Our model enables us to measure the probability of a firm becoming an exporter conditional on industrial policy. Likewise, the firms are categorized into R&D firms that are engaged in R&D activity and non-R&D firms. Again, this grouping makes us estimate the impact of government industrial policy intended to promote R&D.
The model enables us to estimate the effectiveness of the policy at the margin; what is the proportion or probability of firms that become R&D firms due to industrial policy? Exporters competing in the foreign market produce quality products that require R&D activity. Thus, two binary equations are considered simultaneously to improve the efficiency of estimation.
Drawing on Greene (2018) and Greene and Hensher (2010), the bivariate probit model comprising two simultaneous binary choice equations can be formulated as follows:
In the equation system, Exp and R&D denote export and R&D, respectively, in which the value of Exp and R&D is equal to 1 for exporters and R&D firms, respectively. And [ and ] represent [ and ] vectors of explanatory variables, [ and ] are corresponding vectors of coefficients, [ and ] denote fixed effects of industry heterogeneity, and [ and ] are idiosyncratic errors. It is assumed that (j = 1, 2) are jointly distributed with mean vector zero and covariance matrix as:
where is the coefficient of correlation between the two error terms, which is defined in the [−1, 1] interval. The bivariate probit model accounts for the joint correlation between the error terms of two univariate probit equations. The simultaneity in this model is captured not through contemporaneous cross-equation regressors, but through the correlated error structure across the two equations, where ρ reflects common unobserved factors jointly affecting both export and R&D decisions. Note that errors are not accurately estimated when the correlation is ignored, which affects the statistical significance of the estimated coefficients.
Coefficient estimates do not provide direct economic interpretations in the probit model, and thus the marginal effects of explanatory variables should be estimated. Although this study is interested in and in the structural equations, the focus is on policy variables, including VAT refund and corporate income tax deduction, provided to support innovation and export activities. The study is also interested in the effects of other explanatory variables on and . The mechanisms through which explanatory variables influence and depend on which equation they belong to, or . The variables have a direct impact on the dependent variable to which they belong, but they have an indirect effect through the other independent variable and the error term correlation. That is, a change in has a direct effect on E(Exp), but a change in has an indirect effect on E(Exp).
The probability that a firm will become an exporter is different depending on whether a firm is an R&D firm or not. It may be easier for an R&D firm to start exporting than for non-R&D firms. Thus, the probability to become an exporter, . When it is normally distributed, the probability becomes . The marginal effect can be obtained by taking the derivative of with respect to its own regressors , which is called the direct effect.
Notice that the sign of the marginal effect is equal to that of the coefficient estimate because all the terms in the curly bracket represent either probability density function or cumulative distribution function (. The indirect effect is obtainable by its derivative with respect to regressors in R&D equation .
The sign of the marginal effect is equal to that of the coefficient estimate if is greater than 0. This is because the sign of the difference between the two cumulative distribution functions in the curly bracket is determined by the sign of , given that is a monotonically increasing function.
For discrete variables like ownership dummy, the marginal effect can be defined as the differences in probabilities as and for direct effects and indirect effects, respectively.
3. Empirical Application
3.1. Data and Variables
This study utilizes a dataset comprising publicly traded enterprises in China’s advanced manufacturing sector, drawing upon the strategic framework outlined in Made in China 2025. The data is compiled from the China Stock Market and Accounting Research Database (CSMAR) and the Wind Economic Database (EDB) for the firms in the 15 advanced manufacturing sectors listed at any point during the sampling period.
The sample includes all the firms that entered the panel upon their initial public offering (IPO) on the Shanghai or Shenzhen Stock Exchange during the 2004–2023 sampling period. Meanwhile, firms exit from the sample upon delisting, which occurs for several reasons: (i) voluntary delisting or merger/acquisition; (ii) regulatory delisting after being placed under special treatment (ST) status for two consecutive years of loss, or *ST status for three consecutive years of loss, which typically leads to delisting; and (iii) transfer to the National Equities Exchange and Quotations (NEEQ/New Third Board). We exclude ST and *ST firms from the estimation sample for the years in which they hold that status, which is to eliminate outliers.
In accordance with the National Bureau of Statistics, the sample is divided into three categories, such as small firms, medium firms and large firms, by operating revenue, which are 3 million~20 million yuan, 20 million~400 million yuan and above 400 million yuan for small firms, medium firms and large firms, respectively.
The data consists of an unbalanced panel of 1748 Chinese advanced manufacturing companies from 2004 to 2023, yielding a total of 14,971 observations. The number of firms represents the fifteen industries as follows: aircraft and aerospace (38 firms), software development (154 firms), biological pharmaceuticals (228 firms), integrated circuit and semiconductors (237 firms), robot (53 firms), display device (92 firms), electronic specialty materials (144 firms), medical instruments (89 firms), new energy vehicles (188 firms), battery and motor (97 firms), high-grade CNC machine tool (77 firms), ship and railway (36 firms), communication equipment (93 firms), photovoltaic and power equipment (156 firms), and agricultural equipment industries (66 firms). The data is compiled from the Wind Economic Database (EDB) and the China Stock Market and Accounting Research Database (CSMAR). All the nominal variables are deflated into 2020 constant prices with the gross domestic product deflator constructed by the World Bank.3
Regarding dependent variables, this study uses two binary variables associated with exports () and R&D expenditures (), which are equal to 1 if a firm exports and spends R&D expenditures, respectively. For policy variables, the study employs two types of government tax incentives that include VAT refund (VAT) and corporate income tax deduction for R&D expense (Deduction). Among the two, VAT refund is to support export and R&D activities for the advanced manufacturing firms, consisting of export tax rebates and VAT rebates for technological research activity. However, the income tax deduction is to promote innovative activities for the advanced manufacturers by deducting technological research-related expenditure from corporate income tax. Thus, VAT refund is included both in the export and R&D equations, while income tax deduction is included only in the R&D equation.
Note that VAT refund consists of two distinct components: export rebate and R&D investment refund. In our data source, both components are recorded under the consolidated category of government subsidy of VAT tax refund at the firm level. Separate measurements of the two components would require access to detailed customs-level export declarations matched to firm-level R&D expenditure records, which are not publicly accessible. Thus, coefficient estimates of VAT refund should be interpreted as the association between total VAT-related fiscal relief and the respective outcome, rather than the effect of a single, cleanly defined instrument.
This study uses lagged tax incentives as policy variables. This design is clearly linked to actual exports and R&D activity and prevents the reverse causality running from a firm’s decision to the receipt of payment, which causes endogeneity. To receive an export VAT refund, firms must submit their refund application within three months after customs declaration, and the State Taxation Administration typically completes the refund within three months after the application. Thus, VAT refund received in year t − 1 corresponds to export transactions completed in year t − 1 or earlier, given the processing lag. A lagged VAT refund reflects export transactions executed in year t − 1 or earlier, not year t. Thus, the causality runs from prior export activity and refund to current export decision, not in reverse. This institutional arrangement prevents the reverse causality running from the current year’s export decision (our dependent variable) to the lagged VAT refund variable (our independent variable).
Meanwhile, income tax deduction measures the monetary amount of the additional R&D deduction claimed, distinct from the VAT tax saving. China has implemented a large-scale tax deduction policy for R&D expenses since 1993. This regulates that 100% of firms’ R&D expenses can be deducted from corporate income tax (CIT) for all manufacturing firms. To receive deductions, firms are required to submit their R&D project plans ex-ante to the local Science and Technology Bureau and the local tax bureau to obtain prior approval of R&D expenditure. Then, firms must report on their actual R&D expenses at the end of the accounting year. The deduction amount, therefore, reflects the qualifying R&D expenditure incurred during the fiscal year, which is claimed retrospectively through the annual CIT filing. Again, the institutional arrangement of income tax deduction prevents the reverse causality running from the current year’s R&D decision (our dependent variable) to the lagged income tax deduction (our independent variable).
Regarding control variables, the study includes the factors that affect a firm’s innovation and export activities, such as firm age (Age), capital-labor ratio (K/L), firm size (Size), total factor productivity (TFP), and a firm’s market share within the industry (Market Power). Total factor productivity is estimated as residual growth after estimating output elasticities by using a GMM method to deal with endogeneity.4 Also included are two dummy variables representing state ownership (State Ownership) and foreign ownership (Foreign Ownership), which capture the impact of ownership structure on R&D or export decisions. In addition, and are put into Equations (1) and (2), respectively, to examine the bidirectional relationship between and . Table 1 presents the definitions and construction of the variables used in estimation.
Table 1.
Variables and Descriptive Statistics.
Basic statistics show that export and R&D firms account for a large share of the total sample firms, with an average value of 72% and 88%, respectively. The high shares reflect the composition of our dataset—publicly listed firms in China’s advanced manufacturing sectors, which are systematically larger, more productive, and more internationally and R&D oriented than overall Chinese manufacturers. This is a feature of listed manufacturing firms, and our sample cannot be considered to represent the whole Chinese manufacturing firms. However, the statistics show that there is heterogeneity in being exporters and R&D firms, as they vary significantly across firm sizes. Furthermore, there is considerably more variation in the extensive margin of changing firms’ status across sample firms over the sampling years.
Table 2 presents a transition matrix of firms’ export and R&D status over the sampling period. Panel A reports export status transitions, and Panel B reports R&D status transitions. Rows show current-year status, and columns show lagged (prior-year) status. The matrix shows that many firms changed their export and R&D decision over the years. Approximately 9.1% (=351/3842) of non-exporters became exporters, and approximately 2.1% (=200/9381) of exporters became non-exporters. Meanwhile, approximately 18.7% (=337/1795) of non-R&D firms became R&D firms, and approximately 0.2% (=22/11,428) of R&D firms became non-R&D firms.
Table 2.
Export and R&D Status Transition Matrix (2005–2023).
The transitions vary significantly across firm sizes. Table 3 presents the transition of firms’ status across firm sizes. Small firms stick with their decision on export and R&D in 25.1% and 49.7% of observations, respectively, suggesting that they change their decision frequently. Status changes are much less frequent as firm size increases, as large firms keep exporting and doing R&D with the greatest staying rates of 72% and 80%, respectively. Furthermore, the transitions vary significantly across industry sectors (See Table A1 in Appendix A).
Table 3.
Summary of Export and R&D Status Transitions by Firm Size.
In sum, transition analysis shows not only that firms change their export and R&D decisions frequently but also that the frequency of these changes varies across firm sizes. Based on this observation, this study investigates the relationship between tax incentives and the firms’ transitions by using a bivariate probit model, focusing on firm size heterogeneity.
3.2. Estimation Results for the Total Sample
When the correlation between the dependent variables is checked, firm size, TFP, and market power are highly correlated. Thus, they are separately included in regression to avoid multicollinearity, producing three estimation models (See Table A2 in Appendix A for the correlation table).
In estimation, firm fixed effects are not included to avoid the incidental parameters problem, as our data consist of 1748 firms for 20 years. With 1748 additional parameters of firm fixed dummies, the problem is too pronounced. Thus, we include industry fixed effects instead.5 Furthermore, when year dummy is added in the estimation, the R&D function fails to converge as the likelihood function becomes non-concave.
Because two variables of and are associated, R&D (t − 1) is included in the export equation, and Export (t − 1) is included in the R&D equation. All the regressors are lagged to avoid possible endogeneity problems, except age and ownership dummy variables. Table 4 presents coefficient estimates of the bivariate model regarding Exp (Export) and R&D equations for the total sample of the Chinese advanced manufacturing firms.
Table 4.
Estimation Results of the Bivariate Probit Model (Total Sample).
Error terms of the two probit equations are significantly correlated at the 1% significance level, suggesting that Exp and R&D have common factors not included in the estimation. Therefore, they should be estimated simultaneously in a bivariate model. In addition, positive signs of the correlation coefficient suggest a positive correlation between being exporters and R&D firms. Coefficient estimates of R&D (t − 1) are positively significant in the export equation, whereas those of Export (t − 1) are negative but insignificant in the R&D equation, except Model 2 with significance at 10% level. These results suggest that R&D enables firms to export, but exporting is not necessarily associated with R&D activity. This might reflect the fact that there are numerous non-R&D firms supplying their products to the world supply chain or selling them to foreign importers. These firms produce parts and components manufactured according to the specifications required by the buyers, or they produce final products at a low price to beat the competition. For these firms, production does not necessarily require innovation, although firms consider quality important. Note that estimations are determined by the large number of non-R&D exporters rather than by the relatively small number of R&D exporters. There are numerous high-technology firms doing exports and R&D simultaneously, but relatively more firms are exporting without doing R&D. These results might explain why the Chinese government provides incentives to induce firms to engage more with innovation activity.
Regarding tax incentives, VAT refund (VAT) and income tax deduction (Deduction) for R&D activity are significant and positively associated with the probability of exporting and undertaking R&D, respectively. An increase in both tax incentives is related to an increase in the likelihood of becoming exporters and R&D firms. However, VAT refund is primarily associated with the export decision, while income tax deduction is primarily associated with the R&D decision. Estimations implies that tax incentives are related to firms becoming exporters and R&D firms as the Chinese government intends. However, marginal effects should be estimated to see the relative strength of impacts between policy incentives.
Coefficient estimates of control variables show that exporters are more capital-intensive, larger, more productive, have greater market power, and are more likely to be R&D firms. Foreign-owned firms are more likely to be exporters, whereas state-owned firms are less likely to be exporters. This is consistent with the usual characteristics of export firms, as well established in the literature. However, young firms are more likely to be exporters than old firms, suggesting that startups account greatly for exporters among the Chinese high-technology firms. Regarding R&D firms, they are more productive, less capital-intensive, and have less market power. This suggests that innovation is more active in small-sized and human capital-oriented venture firms than in established firms with great market share. Again, this suggests that there are numerous large firms that do not engage in innovative activity because they just assemble final products in the world supply value chain. However, being a R&D firm is not associated with ownership structure, firm size, and firm age, suggesting that innovation is implemented regardless of those characteristics.
Regarding industry dummy, medical instruments industry exhibits the highest export propensity, followed by high-grade CNC machine tool, electronic specialty materials, and agricultural equipment industries. Meanwhile, medical instruments industry displays the highest R&D participation, followed by robot, electronic specialty materials, and aircraft and aerospace industries.
Table 5 presents estimated marginal effects, which are the summation of direct and indirect effects. All the probabilities are derived from coefficient estimates of Model 1 in the previous table, except the probabilities of TFP (t − 1) and Market Power (t − 1) derived from those of Model 2 and Model 3, respectively.
Table 5.
Marginal Effects (Total Sample).
Because this study estimates the bivariate probit model, there are four conditional probabilities resulting from binary outcomes. Marginal effects denote marginal changes in conditional probability corresponding to a percentage change (a unit change) for continuous variables (variables in shares and ratios), whereas they represent marginal changes in conditional probability corresponding to a change in status for dummy variables. Note also that the signs of coefficient estimates are not directly related to those of marginal effects because there are four different conditional probabilities depending on export and R&D status.
Total marginal effects are the sum of direct effects derived from coefficient estimates of its own equation and indirect effects derived from those of the other equation, which affect marginal probability through error term correlation. Estimated contribution of indirect effects on total marginal effects is very small, with less than 1%. That is, estimated direct effects account for the total marginal effects in practical sense.
Positive marginal effects of VAT refund on and show that VAT refund is related to the probability of firms becoming exporters regardless of R&D activity, although it is more related to the probability of R&D firms becoming exporters. Similarly, positive marginal effects of income tax deduction on and show that tax deduction is related to the probability of firms becoming R&D firms regardless of exporting activity, although it is more associated with the probability of exporters becoming R&D firms.
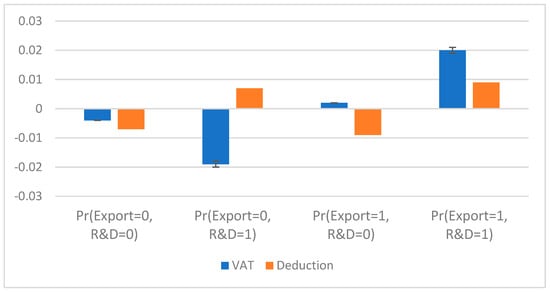
There are two marginal probabilities that represent a firm’s inertia to maintain its activity in the future. That is, domestic non-R&D firms keep their status, [], and exporting R&D firms keep their status, []. Tax incentives attempt to break the former and boost the latter. First, regarding marginal effects of [], both VAT refund and tax deduction are associated with a decrease in the probability of firms remaining as domestic non-R&D firms, although tax deduction is more significant than VAT refund (−0.007 vs. −0.004). Second, regarding marginal effects of [], both VAT refund and tax deduction are associated with an increase in the probability of firms maintaining export and R&D activities, although VAT refund is more significant than tax deduction (0.02 vs. 0.009). These results suggest that it is relatively easier for firms to start R&D activity than exports. It seems like export is more difficult and has more lasting power than R&D for the Chinese advanced manufacturing firms.
To visualize, Figure 1 illustrates marginal effects of VAT refund and income tax deduction across conditional probability categories. The last two bar sets concerning show that VAT refund (in blue bars) is positively associated with the probability of firms becoming exporters regardless of their R&D activity, although it is associated much more with the probability of R&D firms becoming exporters than with the probability of non-R&D firms becoming exporters. However, the second and fourth bar sets concerning and show that income tax deduction (in orange bars) is positively associated with the probability of firms becoming R&D firms, regardless of their exporting activity, although it is associated more with the probability of exporters becoming R&D firms than with the probability of non-exporters becoming R&D firms.
Figure 1.
Marginal Effects by Four Conditional Probability Categories (Total Sample).
To provide numerical examples, marginal effects are evaluated at the mean values of sample firms. Mean marginal effects of and show that firms’ probability of becoming exporters increases by 2% and 20% for non-R&D firms and R&D firms, respectively, when VAT refund increases by 3.4 million yuan. Thus, the probability increases by 22% for the total firms when VAT refund increases by 3.4 million yuan. However, firms’ probability of becoming exporters does not change significantly when income tax deduction increases by 1.5 million yuan, as two conditional marginal effects offset each other (See the last two orange bars in Figure 1).
Regarding mean marginal effects of and , firms’ probability of becoming R&D firms increases by 7% and 9% for non-exporting firms and exporting firms, respectively, when income tax deduction increases by 1.5 million yuan. Thus, the probability increases by 16% for the total firms when tax deduction increases by 1.5 million yuan. However, firms’ probability of becoming R&D firms increases only by 1% when VAT increases by 3.4 million yuan (See the second and last blue bars in Figure 1).
Mean marginal effects of [] show that firms’ probability of becoming domestic non-R&D firms decreases by 4% when VAT refund increases by 3.4 million yuan, whereas the probability decreases by 7% when income tax deduction increases by 1.5 million yuan. Mean marginal effects of [] show that firms’ probability of becoming exporting R&D firms increases by 20% when VAT refund increases by 3.4 million yuan, whereas the probability increases by 9% when income tax deduction increases by 1.5 million yuan.
These results suggest that VAT refund and R&D deduction are positively associated with firms’ becoming exporters and R&D firms, respectively. Note that VAT refund is provided both for exports and R&D activities, but it is more related to promoting export activity. Especially, negative marginal effects of VAT refund on show that VAT refund is not associated with firms’ becoming R&D firms for non-exporters. This might represent the fact that R&D activity is only a small portion of a firm’s economic activity that incurs VAT payment.
3.3. Heterogeneity in Firm Size
To see firm heterogeneity, the panel bivariate probit model is estimated on subsamples classified by firm size. Again, estimation is done in three models to include firm size, TFP and market power separately to avoid multicollinearity between them.6 Table 6 summarizes estimated marginal effects focusing on policy variables by firm size. Hypothesis tests for the null hypothesis that marginal effects are the same between a pair of size groups are implemented by utilizing the t-tests. The null hypothesis is rejected at the 1% significance level for every pair of firm size groups, suggesting marginal effects are significantly different across firm size groups.
Table 6.
Marginal Effects across Firm Size.
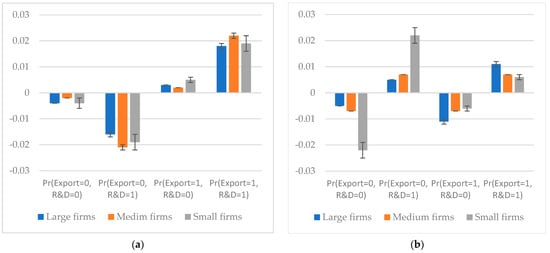
Figure 2 illustrates marginal effects of VAT refund and income tax deduction across firm sizes. There are no changes in signs and significance of estimated marginal effects across the subsamples. Marginal effects of VAT refund on and are positively significant (See the last two sets of bars in Figure 2a), and those of income tax deduction on and are positively significant too (See the second and last sets of bars in Figure 2b). Regardless of firm size, VAT refund is associated with the probability of firms becoming exporters, and tax deduction is associated with the probability of firms becoming R&D firms. However, there are differences in the magnitude of marginal effects across firm sizes, especially for income tax deduction (See Figure 2b).
Figure 2.
Marginal Effects of VAT Refund and Income Tax Deduction across Firm Size. (a) VAR Refund. (b) Income Tax Deduction.
Estimations show that VAT refund is associated much more with R&D firms’ becoming exporters (0.018~0.022) than with non-R&D firms’ becoming exporters (0.002~0.005). This suggests that VAT refund is effective when targeted at R&D firms. Meanwhile, the relative association of income tax deduction varies across firm sizes. For large firms, tax deduction is associated much more with exporters than with domestic firms (0.011 vs. 0.005). Contrastingly, for small firms, tax deduction is associated much more with domestic firms than with exporters (0.022 vs. 0.006). However, there is no difference in their association regarding medium-sized firms. When marginal effects of policy incentives on [] are examined for small firms, tax deduction has a much greater association with reducing the probability than VAT refund (−0.022 vs. −0.004).
To provide numerical examples, marginal effects are evaluated at the mean values of sample firms. Regarding mean marginal effects of becoming exporters [=], for small firms, firms’ probability of becoming exporters increases by 24% when VAT refund increases by 0.33 million yuan, whereas the probability does not change when income tax deduction increases by 0.18 million yuan. For medium firms, firms’ probability of becoming exporters increases by 24% when VAT refund increases by 0.45 million yuan, whereas the probability does not change when income tax deduction increases by 0.32 million yuan. For large firms, firms’ probability of becoming exporters increases by 21% when VAT refund increases by 5.92 million yuan, whereas the probability does not change when income tax deduction increases by 2.48 million yuan.
Regarding mean marginal effects of becoming R&D firms [=], for small firms, firms’ probability of becoming R&D firms increases by 28% when income tax deduction increases by 0.18 million yuan, whereas the probability does not change when VAT refund increases by 0.33 million yuan. For medium firms, firms’ probability of becoming R&D firms increases by 14% when income tax deduction increases by 0.32 million yuan, whereas the probability increases by 1% when VAT refund increases by 0.45 million yuan. For large firms, firms’ probability of becoming R&D firms increases by 16% when income tax deduction increases by 2.48 million yuan, whereas the probability increases by 2% when VAT refund increases by 5.92 million yuan.
4. Conclusions
There are no other studies that empirically investigate the relationship between government tax incentives and firms’ decision on export and innovation by applying the bivariate probit model to the Chinese advanced manufacturing firms. In this respect, our study examines whether tax incentives are associated with changes in firms’ decisions regarding previously non-R&D firms starting R&D activity or previously domestic firms exporting their products.
Estimation results suggest that VAT refund and income tax deduction are positively associated with firms’ decision on export and R&D, respectively. For domestic non-R&D firms, firms’ decisions on becoming either exporters or R&D firms are associated more with income tax deduction than with VAT refund. For exporting R&D firms, firms’ decisions on maintaining their export and R&D behavior are associated more with VAT refund than with income tax deduction. The VAT refund association with firms’ decision on becoming exporters is much greater for R&D firms than for non-R&D firms, whereas the tax deduction association with firms’ decision on becoming R&D firms does not depend on the firm’s export status.
Regarding heterogeneity in firm size, for large firms, the association between income tax deduction and firms’ becoming R&D firms is much greater for exporters than for domestic firms, whereas, for small firms, the association is much greater for domestic firms than for exporters. However, the association between VAT refund and firms’ decision on becoming exporters is much greater for R&D firms, regardless of firm size. Meanwhile, income tax deduction is associated most greatly with non-exporting small firms when firms’ decision on R&D is considered, whereas VAT refund is associated most greatly with medium R&D firms when firms’ decision on export is considered. These results suggest that the relationship between tax incentives and firms’ decisions on becoming exporters and R&D firms varies depending on firms’ status and size.
Our results show the positive relationship between tax incentives and firms’ probability of becoming exporters and R&D firms. Caveats should be applied in interpreting the results. First, our results are not based on the methodology that treats endogeneity directly like the 2SLS method, although we used lagged dependent variables to avoid it. So, our results should be considered as representing the relationship between the variables rather than their causality. Second, our results are derived from the listed firms and cannot be considered as a universal phenomenon for all Chinese firms. Third, we cannot include firm fixed effects in our model to deal with firm heterogeneity due to the incidental parameters problem. Fourth, while the findings suggest that tax incentives are related to promoting innovation and export participation, the findings do not directly address whether this translates into sustainable firm competitiveness. If firms’ decisions are solely motivated to receive financial incentives without continuous efforts, their moves would be temporary and unsustainable. Fifth, the total welfare effects of the industrial policies should consider government revenues required to support the policies, which will increase tax burden for consumers and other industries not supported by the policies. This requires a general equilibrium analysis, which is beyond the scope of this research.
This study could be extended in several ways. First, future studies could employ the 2SLS method to deal with endogeneity rather than using lagged independent variables in estimation. Second, the studies could employ the bivariate probit random effects model to deal with firm heterogeneity. This provides an alternative to the fixed effects model that cannot be estimated due to the incidental parameters problem. Third, the studies could also consider various other empirical designs. This includes investigating policy changes such as eligibility thresholds, sectoral rules, regional variation or changes in deduction rates.
Author Contributions
Conceptualization, S.K. and Z.L.; methodology, S.K.; software, Z.L.; validation, S.K. and Z.L.; formal analysis, S.K. and Z.L.; investigation, S.K. and Z.L.; resources, Z.L.; data curation, Z.L.; writing—original draft preparation, S.K.; writing—review and editing, S.K. and Z.L.; visualization, S.K.; supervision, S.K.; project administration, S.K. All authors have read and agreed to the published version of the manuscript.
Funding
This research received no external funding.
Institutional Review Board Statement
Not applicable.
Informed Consent Statement
Not applicable.
Data Availability Statement
Dataset is available on request from the authors.
Acknowledgments
The authors would like to thank three anonymous referees for their helpful comments and suggestions. Usual disclaimer applies.
Conflicts of Interest
The authors declare no conflict of interest.
Appendix A
Table A1.
Transitions of Firms’ Status on Export and R&D across Industries (2005–2023).
Table A2.
Correlation Coefficients between the Variables.
Notes
| 1 | In this regard, H. Zhao and Li (1997) empirically investigated the relationship between R&D and export simultaneously for Chinese manufacturers without involving tax incentives. |
| 2 | There are many studies that investigated the relationship between R&D and export in a single equation model for Chinese manufacturers, suggesting that the two variables are closely correlated (for a summary, see Dong et al., 2022). These studies investigate the relationship without incorporating tax incentives in a single equation model. |
| 3 | The World Bank compiled the GDP deflators based on various government official statistics, including Country official statistics, National Statistical Organizations and/or Central Banks, National Accounts data files, and Organization for Economic Co-operation and Development (OECD). |
| 4 | To derive TFP growth, a Cobb–Douglas production function was estimated by using a two-way fixed effects model. The GMM method was applied to address an endogeneity in capital stock, which was instrumented with its lagged variable. Then, TFP growth was estimated as a residual growth of output growth unexplained by input growth by using estimated coefficients. However, our results remained the same without any discernible changes in coefficient estimates when residuals of the production function are used as TFP measure. |
| 5 | Another way of dealing with firm heterogeneity is using a random effects model. However, firm effects are correlated with explanatory variables, violating an assumption required for the random effects model. |
| 6 | Estimation results are obtainable from the authors upon request. |
References
- Akcigit, U., Ates, S., & Impullitti, G. (2018). Innovation and trade policy in a globalized world (NBER Working Paper No. 24543). NBER. [Google Scholar]
- An, L., Hu, C., & Tan, Y. (2017). Regional effects of export tax rebate on exporting firms: Evidence from China. Review of International Economics, 25, 774–798. [Google Scholar] [CrossRef] [Scilit]
- Anwar, S., Jin, Y., Wang, K., & Hu, B. (2019). China’s export tax rebate and the duration of firm export spells. Review of Development Economics, 23, 376–394. [Google Scholar]
- Barwick, P. J., Kalouptsidi, M., & Zahur, N. B. (2025). Industrial policy implementation: Empirical evidence from China’s shipbuilding industry. The Review of Economic Studies, 92, 3611–3648. [Google Scholar] [CrossRef] [Scilit]
- Bloom, N., Griffith, R., & Van Reenen, J. (2002). Do R&D tax credits work? Evidence from a panel of countries 1979–1997. Journal of Public Economics, 85, 1–31. [Google Scholar] [CrossRef] [Scilit]
- Bustos, P. (2011). Trade liberalization, exports, and technology upgrading: Evidence on the impact of MERCOSUR on argentinian firms. American Economic Review, 101, 304–340. [Google Scholar] [CrossRef] [Scilit]
- Cao, Q., Wang, H., & Cao, L. (2022). “Business tax to value-added tax” and enterprise innovation output: Evidence from listed companies in China. Emerging Markets Finance and Trade, 58, 301–310. [Google Scholar]
- Chandra, P., & Long, C. (2013). VAT rebates and export performance in China: Firm-level evidence. Journal of Public Economics, 102, 13–22. [Google Scholar] [CrossRef] [Scilit]
- Chen, C. H., Mai, C. C., & Yu, H. C. (2006). The effect of export tax rebates on export performance: Theory and evidence from China. China Economic Review, 17, 226–235. [Google Scholar] [CrossRef] [Scilit]
- Chen, K., Meng, Q., Sun, Y., & Wan, Q. (2024). How does industrial policy experimentation influence innovation performance? A case of made in China 2025. Humanities and Social Sciences Communications, 11, 40. [Google Scholar] [CrossRef] [Scilit]
- Chen, Z., & Zhang, J. (2019). Types of patents and driving forces behind the patent growth in China. Economic Modelling, 80, 294–302. [Google Scholar] [CrossRef] [Scilit]
- Dang, J., & Motohashi, K. (2015). Patent statistics: A good indicator for innovation in China? Patent subsidy program impacts on patent quality. China Economic Review, 35, 137–155. [Google Scholar] [CrossRef] [Scilit]
- Dechezleprêtre, A., Einiö, E., Martin, R., Nguyen, K.-T., & Van Reenen, J. (2023). Do tax incentives increase firm innovation? An RD design for R&D, patents, and spillovers. American Economic Journal: Economic Policy, 15, 486–521. [Google Scholar] [CrossRef] [Scilit]
- Ding, K., Xu, H., & Yang, R. (2021). Taxation and enterprise innovation: Evidence from China’s value-added tax reform. Sustainability, 13, 5700. [Google Scholar]
- Dong, G., Kokko, A., & Zhou, H. (2022). Innovation and export performance of emerging market enterprises: The roles of state and foreign ownership in China. International Business Review, 31, 1020–1025. [Google Scholar] [CrossRef] [Scilit]
- Feng, C., Shi, B., Yan, H., Yang, S., & Bai, C. (2021). Sustainable export innovation behavior of firms under fiscal incentive. Frontiers in Psychology, 12, 769795. [Google Scholar] [CrossRef] [Scilit] [PubMed]
- Fu, Q., & Zhang, D. (2026). Tax incentives and export diversification: Evidence from China’s replacing business tax with value-added tax reform. Economies, 14, 35. [Google Scholar]
- Greene, W. H. (2018). Econometric analysis. Pearson. [Google Scholar]
- Greene, W. H., & Hensher, D. A. (2010). Modeling ordered choices: A primer. Cambridge University Press. [Google Scholar]
- Hong, J., Feng, B., Wu, Y., & Wang, L. (2016). Do government grants promote innovation efficiency in China’s high-tech industries? Technovation, 57–58, 4–13. [Google Scholar] [CrossRef] [Scilit]
- Hsu, V. N., & Zhu, K. (2011). Tax-effective supply chain decisions under China’s export-oriented tax policies. Manufacturing & Service Operations Management, 13, 163–179. [Google Scholar]
- Kalouptsidi, M. (2018). Detection and impact of industrial subsidies: The case of Chinese shipbuilding. The Review of Economic Studies, 85, 1111–1158. [Google Scholar]
- Kong, D., & Xiong, M. (2021). Unintended consequences of tax incentives on export product quality: Evidence from a natural experiment in China. Review of International Economics, 29, 802–837. [Google Scholar]
- Li, C., Chen, H., Xie, W., & Wang, P. (2024). Tax incentives for human capital accumulation and enterprise innovation quality: Evidence of a quasi-natural experiment in China. Finance Research Letters, 70, 106342. [Google Scholar] [CrossRef] [Scilit]
- Li, Y. (2018). Preferential tax policy and innovation efficiency of the high-tech industry. Journal of Quantitative and Technical Economics, 35, 60–76. [Google Scholar]
- Liang, Y., Dang, J., & Chen, S. (2022). The effect of export tax rebates on product quality: Evidence from China’s agricultural product processing industry. China Agricultural Economic Review, 14, 315–330. [Google Scholar]
- Liu, Q., Qiu, L. D., Wei, X., & Zhan, C. (2024). The (dis)connection between R&D and productivity in China: Policy implications of R&D tax credits. Journal of Comparative Economics, 52, 297–320. [Google Scholar]
- Liu, S., Lin, Z., & Leng, Z. (2020). Whether tax incentives stimulate corporate innovation: Empirical evidence based on corporate life cycle theory. Economic Research Journal, 55, 105–121. [Google Scholar] [CrossRef] [Scilit]
- Melitz, M. J., & Redding, S. J. (2021). Trade and innovation (NBER Working Paper No. 28945). NBER. [Google Scholar]
- Mugerman, Y., Winter, E., & Yafeh, T. (2024). Performance monitoring and the incentives for exertion of effort. Quarterly Journal of Finance, 14, 2440005. [Google Scholar] [CrossRef] [Scilit]
- Pernet, T. (2024). Value-added export tax policy, credit constraints, and quality: Evidence from China. Review of Development Economics, 28, 499–526. [Google Scholar]
- Rotunno, L., & Ruta, M. (2024). Trade implications of China’s subsidies (IMF Working Paper Strategy, Policy & Review, WP/24/180). International Monetary Fund (IMF). [Google Scholar]
- Tang, M., Walsh, G., Lerner, D., Fitza, M. A., & Li, Q. (2018). Green innovation, managerial concern and firm performance: An empirical study. Business Strategy and the Environment, 27, 39–51. [Google Scholar]
- Tian, E., & Park, S. O. (2024). Environmental protection tax (EPT) and its influence on firms’ financial health and innovation capabilities: Evidence from Chinese listed companies. Sustainability, 16, 10585. [Google Scholar] [CrossRef] [Scilit]
- Wang, H., Yang, J., & Zhu, N. (2024). Does tax incentives matter to enterprises’ green technology innovation? The mediating role on R&D investment. Sustainability, 16, 5902. [Google Scholar] [CrossRef] [Scilit]
- Wang, J., Liu, C., Xie, Z., & Shen, G. (2024). Tax incentives and corporate innovation: Evidence from China’s value-added tax reform. Contemporary Economic Policy, 42, 183–202. [Google Scholar]
- Wang, L., & Anwar, S. (2022). VAT rebate policy and export performance: A case study of China’s mechanical goods industry. Emerging Markets Finance and Trade, 58, 180–194. [Google Scholar]
- Wang, W., Meng, F., & Gao, S. (2025). The interaction effects of income tax incentives and environmental tax levies on corporate ESG performance: Evidence from China. Sustainability, 17, 5354. [Google Scholar] [CrossRef] [Scilit]
- Wang, Y., & Mayburov, I. A. (2025). Can tax incentives drive green sustainability in China’s firms? Evidence on the mediating role of innovation investment. Sustainability, 17, 10816. [Google Scholar] [CrossRef] [Scilit]
- Wu, A. (2017). The signal effect of government R&D subsidies in China: Does ownership matter? Technological Forecasting & Social Change, 117, 339–345. [Google Scholar] [CrossRef] [Scilit]
- Xiao, C., & Zhuang, Z. (2022). Do R&D tax credits incentivize radical or incremental innovation? Evidence from China. Sustainability, 14, 8238. [Google Scholar] [CrossRef] [Scilit]
- Xu, C., & Liu, H. (2023). Export tax rebates and enterprise export resilience in China. The Journal of International Trade & Economic Development, 32, 953–972. [Google Scholar]
- Xu, J., & Hu, W. (2024). How do external resources influence a firm’s green innovation? A study based on absorptive capacity. Economic Modelling, 133, 106660. [Google Scholar] [CrossRef] [Scilit]
- Yang, C. H., & Chen, Y. H. (2012). R&D, productivity, and exports: Plant-level evidence from Indonesia. Economic Modelling, 29(2), 208–216. [Google Scholar]
- Yang, Z., Shao, S., Li, C., & Yang, L. (2020). Alleviating the misallocation of R&D inputs in China’s manufacturing sector: From the perspectives of factor-biased technological innovation and substitution elasticity. Technological Forecasting and Social Change, 151, 119878. [Google Scholar] [CrossRef] [Scilit]
- Zhang, D. (2019). Can export tax rebate alleviate financial constraint to increase firm productivity? Evidence from China. International Review of Economics & Finance, 64, 529–540. [Google Scholar] [CrossRef] [Scilit]
- Zhao, H., & Li, H. (1997). R&D and export: An empirical analysis of Chinese manufacturing firms. The Journal of High Technology Management Research, 8, 89–105. [Google Scholar] [CrossRef] [Scilit]
- Zhao, S., Xua, B., & Zhang, W. (2018). Government R&D subsidy policy in China: An empirical examination of effect, priority, and specifics. Technological Forecasting & Social Change, 135, 75–82. [Google Scholar] [CrossRef] [Scilit]
- Zheng, W., & Zhang, J. (2021). Does tax reduction spur innovation? Firm-level evidence from China. Finance Research Letters, 39, 101575. [Google Scholar] [CrossRef] [Scilit]

Disclaimer/Publisher’s Note: The statements, opinions and data contained in all publications are solely those of the individual author(s) and contributor(s) and not of MDPI and/or the editor(s). MDPI and/or the editor(s) disclaim responsibility for any injury to people or property resulting from any ideas, methods, instructions or products referred to in the content. |
© 2026 by the authors. Licensee MDPI, Basel, Switzerland. This article is an open access article distributed under the terms and conditions of the Creative Commons Attribution (CC BY) license.