


Abstract
This article examines how the redistributive design of crisis-time fiscal policy shaped Belgian federal public debt trajectories from 1912 to 2024. Drawing on a reconstructed debt-to-GDP series and historical–institutional analysis, it identifies a secular transformation in the distributive logic of fiscal adjustment. From 1912 to the late 1970s, broadly speaking, debt surges were addressed through explicitly progressive instruments grounded in the ability-to-pay principle, and on the view that capital should be taxed at least as heavily as labour. From the 1980s onward, this paradigm gave way to a competitiveness-oriented model that eroded tax progressivity, detached capital from the global tax base, and shifted the fiscal burden onto consumption and labour—disproportionately affecting middle-income earners. The evidence presented in this article points to three plausible determinants of this transformation: the role of mass warfare in legitimising progressive taxation; the ideological shift from Keynesian interventionism to supply-side orthodoxy; and the twin constraints of internal federalisation and external Europeanisation. Furthermore, the timing and modalities of these adjustments appear to have been significantly shaped by linguistic party fragmentation and the recurrent use of emergency executive powers—a pattern that was increasingly mirrored in the European Union’s own governance. Ultimately, since 2020, crisis management has relied almost exclusively on debt-financed expenditure. While the EU has temporarily acted as a redistributive counterweight to domestic fiscal paralysis, these ad hoc supranational interventions have left Belgium’s underlying debt trajectory unchanged.
1. Introduction
Public debt crises are recurring features of modern fiscal history, yet the policy responses they elicit are far from uniform. Periods of high indebtedness have historically been associated with a wide array of debt reduction mechanisms—from outright default and restructuring to the subtler channels of financial repression, inflation, and fiscal adjustment (Reinhart & Rogoff, 2009; Reinhart & Sbrancia, 2015). Fiscal responses to debt surges are not distributionally neutral: the balance between expenditure-based and revenue-based consolidation, the design of tax instruments, and the allocation of austerity across social groups all have far-reaching implications for inequality (Ball et al., 2013).
Since Barro’s (1979) tax-smoothing framework and its extensions (Aiyagari et al., 2002), a large body of research has examined the distortions that drive departures from optimal debt policy, including common-pool problems in fragmented legislatures, strategic debt accumulation by incumbents, and delayed stabilisations rooted in distributional conflict (Alesina & Drazen, 1991; Alesina & Passalacqua, 2015; Roubini et al., 1989). A parallel strand shows that spending-based adjustments tend to be more durable and less recessionary than tax-based ones (Alesina & Ardagna, 2013; Alesina et al., 2017), while recent work assesses fiscal policy’s long-run growth effects through total factor productivity (Everaert et al., 2015) and the implications of expenditure-based consolidations for debt levels and risk profiles (Frangiamore et al., 2025).
While the literature extensively evaluates the macroeconomic efficiency of fiscal consolidations, the question of who bears their redistributive burden remains peripheral. Broad cross-country studies establish that consolidations generally increase income inequality (Ball et al., 2013; Cournède et al., 2013). Subsequent panel analyses refine this finding by demonstrating that the distributive impact is systematically shaped by both the composition of the adjustment—with spending cuts widening inequality and progressive tax hikes compressing it (Agnello & Sousa, 2014; Woo et al., 2013). At the same time, institutional assessments emphasise that profit shifting and tax competition have eroded the corporate tax base and shifted the effective tax burden toward immobile bases such as labour income and consumption (OECD, 2013). Although these empirical observations resonate with broader macro-historical debates on wealth concentration (Piketty, 2014), compensatory taxation (Scheve & Stasavage, 2016), and the transition toward a capital-shielding “consolidation state” (Streeck, 2015; Swank, 2006), these cross-national approaches remain fundamentally agnostic regarding the underlying political mechanisms driving these outcomes. Consequently, large-N cross-country studies are structurally limited in their ability to trace the within-country institutional and historical dynamics that determine how the burden of debt reduction is allocated. Within these broad frameworks, Belgium is typically relegated to a mere observation, relegating the domestic political choices that shaped its specific fiscal responses across distinct high-debt episodes to a largely under-examined status.
Yet, as Alesina and Passalacqua (2015) emphasise, the inherent endogeneity of fiscal institutions demands country-specific studies capable of tracing how institutional architectures interact with political incentives to produce particular debt trajectories. This article answers that call by examining how the Belgian federal state has managed successive public debt surges from 1912 to 2024, with a particular focus on the redistributive dimension of fiscal adjustment. It asks two interrelated questions. First, how have the instruments of fiscal consolidation distributed the burden of adjustment across income groups and between labour, capital, and consumption? Second, which institutional and ideological factors may account for the observed variations in this distributive orientation over time?
Belgium provides a singularly instructive case for examining these dynamics. Over the past century, the Belgian federal state has experienced seven major episodes of rapidly escalating public debt, triggered by two world wars, the Great Depression, the oil crises, the global financial crisis, and the COVID-19 and energy crises. In each instance, policymakers faced structurally comparable challenges—financing extraordinary expenditures, servicing accumulated liabilities, and restoring fiscal sustainability—yet the fiscal instruments deployed, and their distributional incidence, have varied dramatically across periods. This variation cannot be explained by macroeconomic conditions alone; the evidence suggests it reflects the interplay of shifting ideological paradigms, evolving institutional architectures, and changing configurations of political power. Since 1970, Belgium has moved from a centralised unitary state to a complex federal polity, while simultaneously integrating into successive stages of European economic and monetary union. These twin processes have profoundly reshaped both the locus and the constraints of fiscal decision-making. Existing studies (Bisciari et al., 2015; Buyst, 2018; Cassiers et al., 1996; Watteyne, 2023; Wong, 2023) have documented selected episodes but generally restrict their scope to the late twentieth and early twenty-first centuries and devote limited attention to the distributive consequences of consolidation over the long run.
This article addresses these gaps by adopting a historical–institutionalist approach to examine how the Belgian federal state has managed successive episodes of elevated public debt since 1912 and, for each crisis period, how the resulting fiscal choices have shaped both the distribution of the debt burden and the underlying political objectives of consolidation. To this end, it reconstructs a long-run federal debt-to-GDP series for 1912–2024, which serves as the empirical backbone for the analysis.
The central argument developed in this article is that the orientation of Belgian crisis-time fiscal policy has undergone a profound transformation over the century under study. From 1919 to the late 1970s, fiscal responses were, in schematic terms, explicitly redistributive. The institutionalisation of the ability-to-pay principle, its gradual predominance over earlier degressive rate schedules, the repeated use of wartime excess-profits taxes, and the stated ambition to tax capital more heavily than labour income all contributed to shifting the burden of debt adjustment onto wealth holders and capital income. From the 1980s onward, this paradigm was progressively reversed under an explicitly competitiveness-oriented rationale: successive consolidation episodes eroded the progressivity of personal income taxation, detached capital income from the global tax base, and increasingly relied on regressive indirect taxes and cuts to social expenditure.
This transformation reflects a deeper interaction between shifting ideological paradigms and evolving institutional configurations, structured around three analytically distinct, though interconnected, mechanisms. First, the Belgian record both confirms and qualifies Scheve and Stasavage’s (2016) ‘conscription of wealth’ framework, according to which mass warfare created unique windows for progressive taxation. Second, the ideological arc from interwar monetary orthodoxy through Keynesian interventionism to supply-side consolidation fundamentally reoriented fiscal redistribution. This trajectory mirrors both Piketty’s (2014) U-curve of inequality and the macro-institutional shift identified by Streeck (2015), wherein the post-war ‘tax state’ gradually gave way to a ‘consolidation state’ that structurally insulates capital and prioritises market confidence over distributive equity. Third, the twin processes of internal federalisation and external Europeanisation have reconfigured the constraints on debt-reducing fiscal policy, with the EU paradoxically assuming a proactive redistributive role through mandated solidarity contributions when domestic action proved politically impossible. This emerging EU redistributive function marks a shift from “negative” to “positive” fiscal integration (Dermine, 2020). It represents a structural departure from the conventional pattern whereby the EU constrains national fiscal sovereignty through rules without providing compensatory fiscal capacity (Genschel & Jachtenfuchs, 2016). Crucially, these three mechanisms are not independent: the ideological shift from Keynesian interventionism to supply-side orthodoxy provided the intellectual justification for the competitiveness-oriented policies that federalisation and Europeanisation subsequently locked in as structural constraints, while the fading of wartime mobilisation removed the political conditions under which progressive taxation had been legitimised.
Beyond these substantive determinants, the article also examines the institutional conditions of fiscal decision-making. Over the long run, the primary constraint on fiscal consensus does not seem to be the number of coalition parties (Alesina & Drazen, 1991; Roubini et al., 1989) but the progressive division of parties along linguistic lines. Conversely, to ensure rapid action, policymakers have systematically relied on emergency executive powers—special powers decrees—since 1926, enhancing the reactivity of consolidation at the cost of ordinary democratic deliberation. This trade-off, the article shows, extends to the European Union’s own crisis governance.
This article makes three interrelated contributions to this literature. First, it provides the first comprehensive long-run reconstruction of the Belgian federal debt-to-GDP ratio spanning 1912–2024—a historical depth that goes beyond the episode-level scope of existing Belgian studies (Bisciari et al., 2015; Davin, 1954; Delvaux, 1994) and complements both the multi-country debt datasets assembled by Reinhart and Rogoff (2009) and the long-run GDP estimates from the Maddison Project Database (Bolt & van Zanden, 2024) with country-specific institutional granularity. Second, through the systematic application of the augmented statutory approach developed in Section 2.3, it traces the redistributive orientation of crisis-time fiscal choices across a century-long timeframe within a single country—going beyond Belgian studies that focus on specific consolidation episodes (Bisciari et al., 2015; Buyst, 2018; Cassiers et al., 1996; Watteyne, 2023; Wong, 2023) and offering a degree of institutional specificity that cross-national panels on fiscal consolidation and inequality (Agnello & Sousa, 2014; Ball et al., 2013; Woo et al., 2013) are, by construction, unable to provide. Third, it advances an integrated interpretive framework that links three strands of explanation—the compensatory logic of wartime mass mobilisation (Scheve & Stasavage, 2016), the succession of dominant tax and fiscal paradigms (Piketty, 2014; Streeck, 2015; Swank, 2006), and the twin processes of internal federalisation and external Europeanisation of fiscal authority—and uses this combined lens to interpret a century of Belgian fiscal consolidation and redistribution, rather than relying on any single-mechanism account.
The article is structured as follows: Section 2 outlines the methodological framework, grounded in historical institutionalism. Section 3, the core of the article, offers an empirical analysis of seven episodes of public debt surges and the corresponding fiscal policy responses, from the aftermath of World War I to the post-energy-crisis period, with particular attention to their redistributive impact. Section 4 discusses the transversal findings: it first examines the plausible substantive determinants that have shaped the long-term redistributive orientation of Belgian fiscal policy, before turning to the institutional conditions of fiscal decision-making.
2. Methodology
2.1. Research Design and Analytical Framework
This article adopts a qualitative historical–institutionalist approach combined with quantitative fiscal analysis to examine Belgian fiscal responses to periods of elevated public indebtedness, with a particular emphasis on redistribution in the context of fiscal consolidation. It also investigates the plausible institutional determinants and underlying political conceptions that guide policymakers’ choices at different phases of consolidation, clarifying whether adjustment is conceived primarily as a project of redistribution, a competitiveness strategy, or a programme of strict fiscal consolidation. The historical–institutionalist approach adopted here is designed to capture the long-run interaction between institutional configurations, ideological paradigms, and political agency—dimensions that purely macroeconomic or quantitative approaches, while powerful for testing specific hypotheses, are less well equipped to trace over a century-long timeframe.
The research design is a longitudinal single-country case study. Belgium is particularly suitable given its pronounced debt cycles, evolving federal architecture, position at the intersection of successive European economic regimes, and the depth of its parliamentary and fiscal archives. This design enables the identification of recurrent patterns and structural ruptures in the distributive orientation of fiscal adjustment, while holding constant institutional features that would confound cross-national comparisons (George & Bennett, 2005), and systematically re-situating fiscal decisions within the evolving configuration of governing coalitions, federalism, and European integration.
Empirically, the study encompasses seven distinct episodes of high public debt—broadly corresponding to the aftermath of World War I, the interwar floating-debt crisis, the Great Depression, the post-World War II reconstruction, the debt crisis of 1973–1996, the post-2008 consolidation cycle, and the COVID-19 and energy crises of 2020–2024. These episodes are selected on the basis of substantial and sustained increases in the debt-to-GDP ratio, reflecting periods in which fiscal pressures prompted significant political and institutional responses.
For each episode, the study identifies the specific fiscal instruments deployed—whether revenue-based (tax reforms, exceptional levies, social contributions) or expenditure-based (spending cuts, benefit restrictions, indexation modifications)—and assesses their distributive orientation. In parallel, it analyses the justificatory discourse and strategic framing adopted by policymakers, tracing whether policy actors foreground objectives of redistribution, competitiveness, or pure consolidation, and how these stated aims evolve across phases of the adjustment process. The distributive assessment draws on the distinction, central to Musgrave and Musgrave (1989), between progressive instruments (whose burden rises proportionally with income or wealth) and regressive instruments (whose burden falls disproportionately on lower-income groups).
The study adopts a qualitative historical–institutionalist design, suitable for process tracing and interpretive explanation, but not for the formal causal testing characteristic of experimental or large-N approaches; its claims should therefore be read as historically grounded interpretations rather than definitive causal findings. Concretely, for each episode, the study identifies the specific fiscal instruments deployed and assesses their distributive orientation on the basis of the progressive/regressive distinction (Fullerton & Metcalf, 2002; Kaplow, 2007; Musgrave & Musgrave, 1989), while simultaneously analysing the justificatory discourse and strategic framing adopted by policymakers—tracing whether policy actors foreground objectives of redistribution, competitiveness, or pure consolidation. The proposed mechanisms are then evaluated by examining whether the observed pattern of instrument choice, distributive orientation, and political framing is consistent with the institutional or ideological factor in question, and whether shifts in these factors coincide with observable changes in the redistributive character of fiscal adjustment. Rival explanations—such as purely macroeconomic drivers, partisan competition, or external shocks—are considered where the evidence permits, but the single-country design inherently limits the scope for systematic elimination of alternatives. Where the evidence is ambiguous or incomplete, this is noted explicitly.
It should also be acknowledged that the three mechanisms foregrounded in this study—mass warfare, ideological paradigm shifts, and the twin processes of federalisation and Europeanisation—do not exhaust the range of plausible explanations for the observed transformation. In particular, globalisation and the increasing mobility of capital since the 1980s may have independently constrained governments’ capacity to impose progressive taxation, as the threat of capital flight raised the perceived cost of taxing mobile factors (Ganghof, 2006; Swank, 2006). Similarly, demographic ageing and the expansion of the welfare state generated structural expenditure pressures that may have redirected fiscal policy toward consumption-based revenue sources regardless of ideological orientation. While the single-country design does not permit the systematic isolation of these factors from the mechanisms examined here, the historical analysis in Section 3 engages with them where the evidence permits—for instance, the discussion of capital mobility constraints in the post-1980s period and the role of social security expenditure pressures in driving the competitiveness turn. The proposed framework is not advanced as an exhaustive causal account but rather as a historically grounded interpretation that foregrounds the institutional and ideological dimensions most directly observable in Belgium.
The analytical framework set out above rests on two distinct empirical foundations: first, a long-run quantitative series capturing the trajectory of public indebtedness that triggers the fiscal reactions under study; and second, disaggregated fiscal data capable of revealing the redistributive incidence of the adjustment instruments deployed during each episode. The following two subsections describe how these data were constructed.
2.2. Data Sources for the Reconstruction of the Debt-to-GDP Ratio
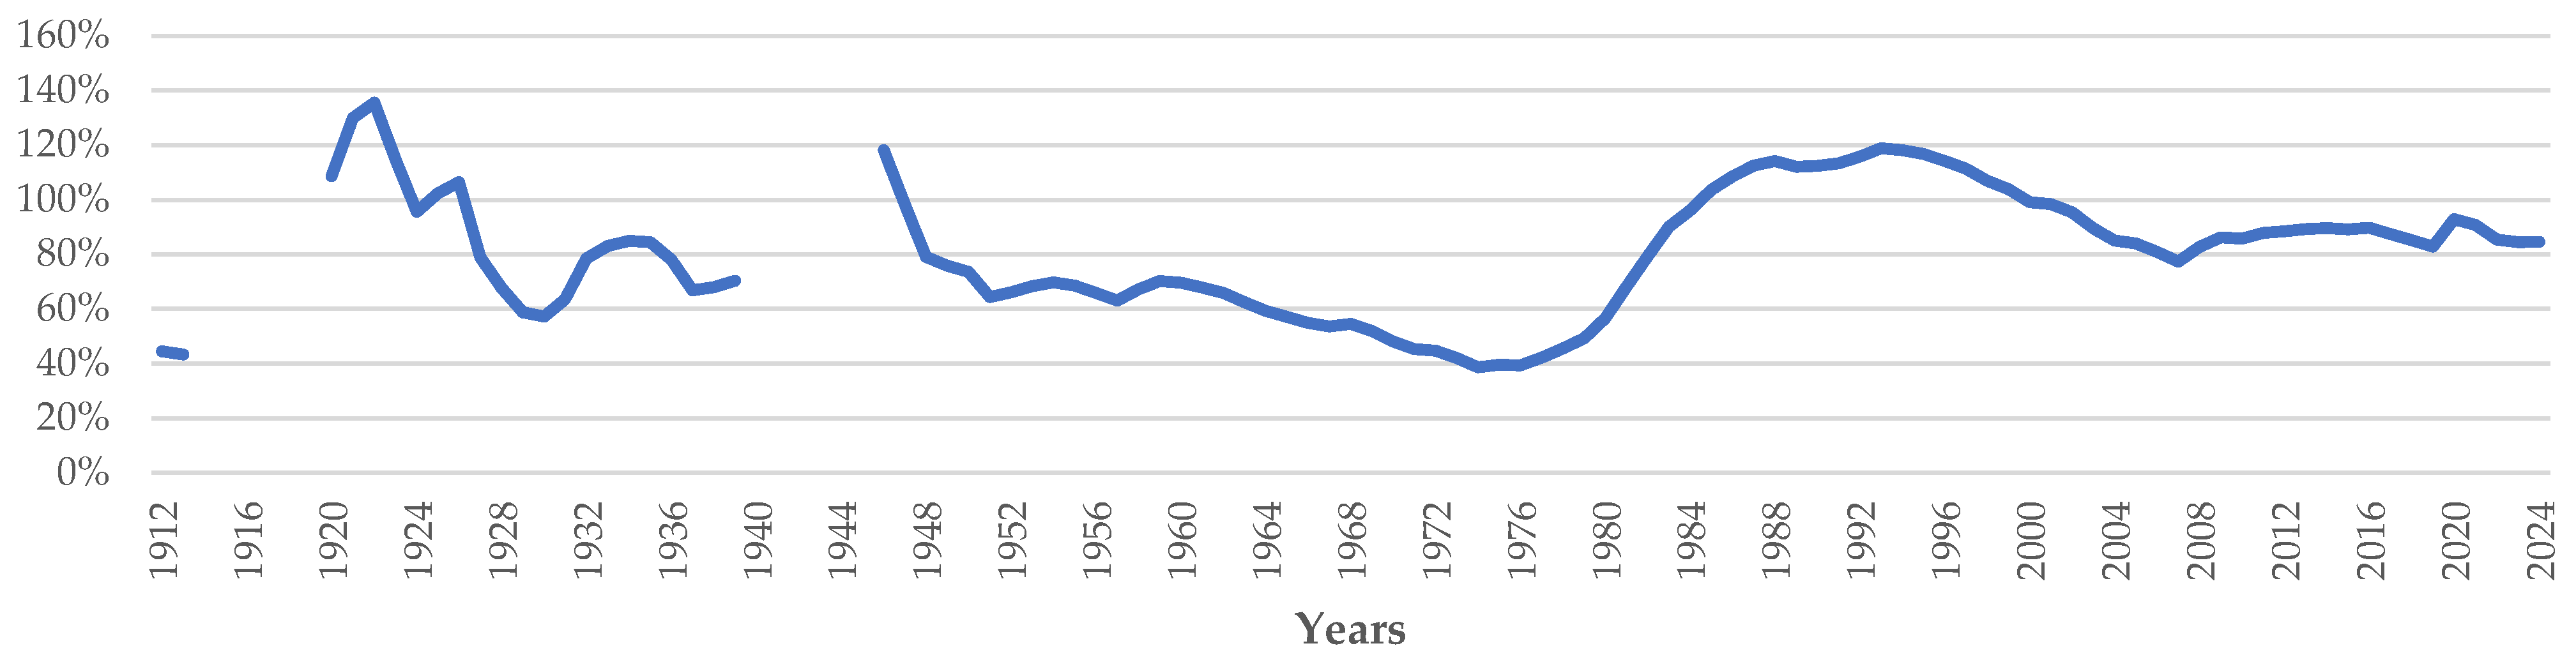
The empirical backbone of the analysis is a reconstructed series of the Belgian government’s debt-to-GDP ratio covering the period from 1912 to 2024 (Figure 1). Data collection follows three distinct phases:
First, from 1912 to 1979, the ratio was manually reconstructed by dividing the nominal debt stock by the reconstructed GDP.
Debt data for this period are derived from historical parliamentary documents. For the years 1912 and 1913, the data are drawn from statements delivered by the Minister of Finance before the Chamber of Representatives on the financial situation of the public treasury (Belgian Chamber of Representatives, 1913, 1914). From 1919 to 1979, the analysis relies on the annual budget bills formally introduced by the Belgian government, which report retrospective information on the evolution of public debt. The debt figures used in this study are therefore based on the most recent observed debt levels available at the time of reporting, rather than on forward-looking (Belgian Chamber of Representatives, Budget documents, various years).
GDP data for 1912–1979 are derived from the Maddison Project Database updated in 2023, which harmonises historical national statistics using sectoral value added to align with contemporary territorial production definitions (Bolt & van Zanden, 2024; Buyst et al., 1995; J. P. Smits et al., 2009). This study prioritises the Maddison Project’s reconstructed GDP to ensure consistency with modern European System of Accounts standards (ESA 2010, Regulation, 2013) given that Belgian historical accounts for this period relied on GNP rather than GDP.
The debt-to-GDP ratio is calculated using the nominal stock of debt and GDP in current prices. This ensures that numerator and denominator are expressed in the same monetary units, capturing the impact of price level fluctuations and inflation on the debt burden. Accordingly, all data are expressed in Belgian Francs (BEF) until 1994. From 1995 onwards, data are expressed in Euros (EUR), following the official series provided by Eurostat.
Second, from 1980 to 1994, the analysis utilises ratios provided retrospectively by the Belgian government in budget documents, which harmonised debt levels with updated GDP estimates (Belgian Chamber of Representatives, 1993).
Third, from 1995 to 2024, data are sourced directly from Eurostat (Eurostat, 2025). This period corresponds to the implementation of the European System of Accounts (ESA). The transition to ESA 95 and later ESA 2010 established the current definition of consolidated gross debt at face value, shifting the framework to a macroeconomic accounting framework. Importantly, the adoption of these European standards led to the ‘re-budgetisation’ of various previously off-budget funds, bringing formerly hidden liabilities into the official debt perimeter. Given the heterogeneity of sources and definitions across these three periods, Appendix A (Table A1) provides a detailed year-by-year documentation of the data sources, variable definitions, debt and GDP concepts, and breaks in comparability, so as to make the limitations of cross-period comparison fully transparent.
Figure 1.
Debt-to-GDP Ratio from 1912 to 2024.
2.3. Assessing Redistributive Trajectories: Theoretical Parameters and Empirical Strategy
This section sets out the methodology used to evaluate whether the fiscal policies adopted during high-debt episodes in Belgium followed a redistributive trajectory. Rather than seeking to measure actual redistributive incidence with exact precision, the analysis aims to identify broad structural tendencies in crisis-time fiscal responses. The analysis proceeds in three steps: it first justifies the choice of an augmented statutory approach given the constraints of longitudinal analysis (Section 2.3.1); it then develops a typology of fiscal instruments that serves as the analytical grid for assessing concrete legislative choices in Section 3 (Section 2.3.2); and finally it details the sources and methods employed to trace these properties empirically across high-debt episodes (Section 2.3.3).
2.3.1. Methodological Constraints and the Choice of an Augmented Statutory Approach
The literature distinguishes two analytically established poles of fiscal distributive analysis: statutory incidence, which concerns the formal rate structure as enacted in law, and economic incidence, which captures “the changes in economic welfare in society arising from a tax” (Fullerton & Metcalf, 2002). A full economic-incidence analysis, covering both the tax and expenditure sides of the budget, is not feasible within the framework of this study. Several constraints motivate this choice. First, data availability is uneven across the century examined: disaggregated distributional data—such as effective tax rates by income decile—are sparse or absent for much of the pre-1970 period and remain relatively infrequent thereafter, except for the personal income tax. Second, cross-temporal comparability is limited by shifting tax nomenclature, institutional reorganisations, and the absence of harmonised fiscal statistics prior to the 1990s. Third, the analytical tools of modern distributional analysis cannot be applied over such an extended historical timeframe. These limitations are even more acute on the expenditure side: while classifying consolidation measures by broad spending headings provides some indication of how redistribution is affected, it does not allow for a precise assessment of their distributive impact over a very long period. Furthermore, under Belgian budgetary law, state revenues are governed by the principle of non-affectation and cannot be earmarked for specific expenditures, precluding any analysis that ties particular tax changes to the direct financing of specific outlays. This study therefore does not claim to measure economic incidence comprehensively.
Importantly, this study assesses the redistributive orientation of crisis-time fiscal policies, not the causal attribution of debt reduction itself. As Section 3 demonstrates, nominal GDP growth and inflation frequently drove declines in the debt-ratio more powerfully than fiscal measures per se. The redistributive analysis therefore concerns the political choices made in designing fiscal responses, irrespective of their relative macroeconomic contribution to debt reduction.
Given the methodological constraints outlined above, the analysis adopts what may be termed an augmented statutory approach. Rather than confining itself to the formal rate structure alone, it classifies fiscal instruments according to their theoretical redistributive properties—grounded in the ability-to-pay principle—and supplements this classification, where data permit, with indicators of effective incidence. The approach combines four complementary layers: (i) the stated legislative intent as documented in parliamentary proceedings; (ii) indicative measures of the budgetary weight of specific tax and expenditure measures; (iii) the evolving share of personal income tax relative to indirect taxes in total federal revenue; and (iv) where data permit, effective tax rates by income decile for PIT.
These analytical layers require, however, a prior theoretical foundation: a systematic classification of fiscal instruments according to their structural redistributive properties. The following section develops this typology, which constitutes the evaluative grid applied to the concrete legislative choices examined in Section 3.
2.3.2. Redistributive Properties of Fiscal Instruments: An Analytical Grid
Table 1 provides the analytical grid through which the fiscal policy choices examined in Section 3 are assessed. It does not catalogue the instruments historically deployed by the Belgian state, but rather establishes a typology of the principal budgetary instruments available to manage crisis-time fiscal policy, each positioned along a redistributive gradient (++ = strongly progressive, + = moderately progressive, ± = ambiguous, − = regressive, −− = strongly regressive, ○ = indeterminate) according to the ability-to-pay principle. Therefore, an instrument is structurally progressive if its burden rises more than proportionately with taxpaying capacity, and regressive if it falls more heavily on lower capacities (Auerbach, 2010; Musgrave & Musgrave, 1989). For each instrument, the table identifies the theoretical redistributive rationale and the principal limitations in assessing its actual economic incidence. This typology thus serves a dual function: it defines the normative benchmark against which concrete legislative choices are evaluated in Section 3, and it transparently delineates the boundaries of the redistributive assessment that can be performed given the methodological constraints outlined in Section 2.3.1. Concretely, when the historical analysis in Section 3 identifies, for instance, Belgium’s shift from a schedular to a global income tax (1962), the dismantling of progressive rate structures (1985–1988), or the increasing reliance on indirect taxation for consolidation purposes, the table provides the theoretical basis for characterising these shifts as progressive or regressive in orientation. Equally, the grid enables the identification of instruments that were not activated—such as the absence of an exceptional capital levy after the COVID-19 crisis, in contrast to the levies imposed in 1919 and 1945—thereby revealing the contours of the politically feasible within each episode. The remainder of this section discusses each category of the typology in turn.
Within income taxation, the ability-to-pay principle is most effectively realised under a global income tax, wherein all income sources—labour, capital, and property—are aggregated into a single, unified base. Such aggregation is a necessary precondition for assessing ability-to-pay, as it enables the tax system to accurately reflect the taxpayer’s total contributory capacity (Musgrave & Musgrave, 1989; Piketty, 2014). In contrast, schedular taxation—which taxes different income sources separately at differentiated rates—does not inherently align with the ability-to-pay principle, since the taxpayer’s overall financial situation is never evaluated holistically. Its redistributive impact depends entirely on the specific rates applied to each schedule and the distribution of these income sources across the population. An intermediate design, the dual income tax, preserves base aggregation for labour income under a progressive schedule while detaching capital income from the global base and subjecting the latter to a proportional withholding tax. Proponents argue that this model preserves a broader capital tax base in the presence of high capital mobility. Its actual incidence relies heavily on capital flight elasticity and administrative capacity (Genser, 2006; Sørensen, 2007).
The choice of rate structure constitutes the second determinant of an instrument’s redistributive orientation. A progressive bracket structure—where marginal rates rise with the tax base—serves as the paradigmatic expression of the ability-to-pay principle by imposing a more than proportionate burden on higher incomes. In contrast, a flat (proportional) rate is formally neutral, applying a constant average rate irrespective of income level. Substantively, however, it fails to fully satisfy the ability-to-pay principle: given the declining marginal utility of income, exacting a uniform fraction imposes a disproportionately heavier welfare sacrifice on lower-income taxpayers (Kaplow, 2007; Musgrave & Musgrave, 1989).
Crucially, there are design modalities that can reinforce or attenuate the redistributive orientation of any rate structure. Zero-rate brackets that exempt low incomes or personal and family allowances that account for specific financial burdens (notably dependent children) can reinforce the ability to pay principle (Auerbach, 2010). Moreover, combining a flat-rate tax with a substantial tax-free allowance generates rising average rates, effectively approximating progressive outcomes (Kaplow, 2007). Conversely, imposing a contribution ceiling on a nominally progressive schedule renders it regressive at the top: once income exceeds the cap, the wealthiest taxpayers see their proportional contribution steadily decrease. An instrument’s net redistributive impact thus emerges strictly from the interaction of these three dimensions—base, rate schedule, and design modalities.
Two particular instrument categories warrant additional comment. First, social security contributions operate structurally as a schedular tax on earned professional income. Typically levied at proportional rates, their direct redistributive impact is inherently limited; their degree of progressivity depends on specific design modalities such as contribution ceilings or floors exempting low earners (see Table 1). A comprehensive assessment of their actual distributive impact would require disaggregating the shares borne by employees and employers and isolating the effects of the numerous targeted reductions and sector-specific exemptions that have progressively fragmented their architecture. Second, corporate income taxation is mildly progressive when incidence falls on capital owners concentrated in higher deciles, but its effective base remains vulnerable to erosion through financial engineering and competitiveness-driven preferential regimes (Fullerton & Metcalf, 2002; Devereux et al., 2002). Such regimes—including tax holidays, special deductions, and coordination-centre arrangements—systematically displace the fiscal base from capital onto less mobile factors, generating competitive dynamics conducive to a ‘race to the bottom’ in corporate taxation (Devereux et al., 2002; Clausing et al., 2020). More fundamentally, capital mobility complicates the redistributive assessment itself: absent international fiscal coordination, a rate increase may erode the taxable base sufficiently to reduce rather than increase state revenues, rendering the net distributive effect indeterminate (see Table 1).
Exceptional and crisis levies occupy a distinctive position in the typology. Wartime excess-profits taxes are progressive insofar as they target exceptional enrichment generated by crisis conditions, grounded in compensatory demands for taxation of the wealthy (Hebous et al., 2022; Scheve & Stasavage, 2016). One-off capital levies can be progressive when exemptions shield lower-wealth households or when tiered rate schedules are applied, though their one-shot nature limits their long-term redistributive effects (Eichengreen, 1990; O’Donovan, 2021). Finally, levies on enemy transactions are primarily moral and punitive in purpose; any redistributive effect is incidental to their sanctioning function, and difficult to measure. Table 1 details the incidence limitations of each sub-category.
The theoretical foundation for analysing indirect taxation is provided by the Atkinson & Stiglitz (1976) theorem, which establishes that, under conditions of weak separability between leisure and consumption, an optimal non-linear income tax alone suffices to achieve redistributive objectives. In practice, these conditions rarely hold, and their administrative simplicity and high yield at low compliance costs further account for their persistent weight in consolidation strategies. Broad-based consumption and production taxes are generally regressive because lower-income households devote a larger share of their income to consumption (Auerbach, 2010; Cournède et al., 2013; Kaplow, 2007). This regressivity also operates at the aggregate level: a compositional shift from personal income taxation toward indirect taxation reduces the overall redistributive profile of the fiscal system (Piketty, 2014). Rate differentiation—reduced rates on essential goods and surcharges on luxury items—can partially offset this structural regressivity, though the net effect requires microsimulation to assess accurately (Auerbach, 2010).
Expenditure-based consolidation measures carry significant distributional implications. Cuts to operational spending are distributively indeterminate, as their impact depends on the specific expenditure lines reduced. In contrast, cuts to social transfers, benefit restrictions, and indexation freezes are structurally regressive: they disproportionately affect lower-income beneficiaries who depend more heavily on transfer income (Ball et al., 2013; Cournède et al., 2013). Assessing their actual distributive impact requires detailed disaggregation of the programmes targeted—a level of analysis that is not always possible given available data (see Table 1).
Balance-sheet operations—debt conversions, forced consolidations, and asset divestitures—do not constitute fiscal instruments in the strict sense. They are nonetheless included because Section 3 reveals their recurrent deployment across Belgian high-debt episodes. Their redistributive significance is indirect: by modifying fiscal space, they condition subsequent tax and expenditure choices whose orientation determines the distributive trajectory (see Table 1 for details).
Having established the analytical grid for assessing the redistributive orientation of fiscal instruments, the analysis now turns to the specific sources and methods used to apply this grid to Belgium’s high-debt episodes.
Table 1.
Analytical grid for assessing the redistributive orientation of crisis-time fiscal instruments: theoretical properties and incidence limitations.
2.3.3. Empirical Approach, Sources, and Methods
As the general methodological limitations involved in constructing a consistent long-run historical series have been discussed (Section 2.2 and Section 2.3.1), and as the evidence assembled in Table 2 illustrates, tracing the evolution of the redistributive impact of fiscal policies over such an extended timeframe remains particularly challenging. Moreover, comprehensive national accounting in Belgium only began in 1963, and the first ESA framework was introduced in 1970. In addition, the Belgian statistical office only started publishing fiscal statistics on personal income—including decile-based tables with total net taxable income, total tax, and an average tax rate—from income year 1976, so no official information on effective tax rates by income decile is available for earlier years.
Before detailing the sources and methods, two delimitations of scope should be noted. First, the focus on PIT and taxes on goods and services is motivated by the fact that, alongside social contributions, they constitute the most productive sources of state revenue, while PIT embodies the core instrument for implementing the ability-to-pay principle and taxes on goods and services are typically associated with regressive taxation. Second, social security contributions are excluded from systematic empirical treatment. Their proportional rate structure has remained fundamentally stable since 1945; the main structural shift dates from 1981, when the ceiling used to calculate contributions was abolished, reinforcing their progressivity. Beyond this change, the redistributive design of social contributions has evolved primarily through a multitude of special or targeted reductions. Given their large number, constant revision, and sector- or wage-specific nature, these measures cannot be systematically assessed within the scope of this study. A comprehensive analysis would require disaggregating the respective shares borne by employees and employers and isolating the distributional effects of each special contribution—an exercise that would require a dedicated investigation. This exclusion is a notable limitation, particularly for the post-1980 period, during which social contributions became central to the discourse on the shifting fiscal burden onto labour. The evolution and potential redistributive effects of these targeted adjustments have already been outlined by Docquier (2023) and Rigaux (2026), and they deserve further systematic study.
In light of the methodological limitations discussed, for the pre-1970 period, this article relies on the extensive historical reconstructions conducted by the Belgian Institute of Public Finance, notably the foundational studies by Coppée (1954), Davin (1954), and Masoin (1954). Furthermore, the long-term comparative analysis between personal income taxes and taxes on goods and services (see Figure 3 and Figure 4—Section 3.2 and Section 3.4) is derived from Pirard (1999), who systematically aggregated and reclassified central state revenues and expenditures. Where macroeconomic data were unavailable in these secondary sources, this study adopts a legal-historical approach by analysing parliamentary proceedings. Consequently, certain data points—such as the expected yields of various income taxes between 1920 and 1940 (see Figure 2—Section 3.2)—reflect ex ante budget estimates rather than ex post collected revenues. While this constitutes a statistical limitation, these prospective estimates retain high analytical value, as they accurately capture the structural trends and the explicit political intent driving fiscal policy design at the time.
For the post-1970 period, data collection relies on official public institutional sources, primarily reports from the Belgian Court of Audit, in order to obtain precise estimates of the budgetary impact of enacted measures. OECD datasets are used to track the comparative evolution of income taxes and taxes on goods and services (Figure 5, Figure 6 and Figure 7). For highly specific and less accessible information, such as the exact financial impact of targeted expenditure cuts, parliamentary records are cross-referenced with specialised economic literature and reports from public institutions. To quantify the erosion of tax progressivity (Table 2 and Figure 8), this article utilises tax return decile and top percentile data based on total net taxable income, as provided by the Belgian statistical office (Statbel, n.d., 2023) since 1976. Figure 6 illustrates the evolution of these average effective tax rates through the major tax reforms, categorised for each decile and the top percentile based on their total net taxable income. Table 2 quantifies both the nominal and relative (proportional) tax gains achieved between fiscal year 1979 and 2022 for each decile. To avoid distortions caused by inflation and structural shifts in income distribution, the methodology does not compare absolute income levels across time. Instead, the analysis computes a counterfactual tax burden by applying the 1979 average effective tax rate to the 2022 decile structure. The difference between this counterfactual and the actual 2022 tax liability measures the cumulative mechanical effect of legislative reforms on the tax burden borne by each segment of the income distribution. Therefore, the comparison captures the change in statutory progressivity applied to the same relative position within the income hierarchy. This dual approach is analytically crucial: while the proportional gain highlights the individual benefit for taxpayers in each bracket, the nominal gain provides a clearer assessment of the macroeconomic impact of these reforms on public finances. Indeed, an identical percentage point tax reduction generates a significantly larger nominal revenue loss for the State when applied to the top percentiles compared to the lowest deciles.
Armed with this analytical apparatus—the redistributive typology (Table 1), the augmented statutory indicators, and the long-run data series—Section 3 traces the concrete fiscal policy choices made by the Belgian state during each high-debt episode, assessing whether these choices followed a progressive or regressive redistributive trajectory.
2.4. Spatial and Temporal Perimeters
To maintain longitudinal consistency, the analysis focuses exclusively on the federal central Government (ESA 2010: S.1311). This choice is justified by three factors. First, during successive state reforms, the historical public debt inherited from the unitary era has remained essentially at the federal level (Van Esbroeck & Buyst, 2025). Second, by isolating the S.1311 perimeter, the study ensures a stable historical comparison, as the Federal Government remains the primary vehicle for redistribution, crisis management, and debt reduction: it controls the most potent macro-fiscal levers (taxes on labour, corporate income, and capital) and legally absorbs any structural deficits of the Social Security system (S.1314) to maintain its neutral balance (Pacolet, 2019). Third, integrating the federated entities would require extensive historical digressions on the country’s federalisation and produce a highly fragmented analysis. The complex asymmetry between Belgium’s three Communities and three Regions—which possess divergent fiscal competencies and lack adequate institutional incentives for financial accountability—would severely obscure the long-term trends. Consequently, this study excludes regional consolidation measures and intergovernmental fiscal cooperation, a choice that narrows the empirical basis for broader distributive conclusions about Belgium’s fiscal model as a whole. However, this does not preclude analysing the impact of federalism on the federal debt (Bayenet et al., 2019; Cornille et al., 2022; Van Esbroeck & Buyst, 2025).
During both World Wars, suspended parliamentary activity and a paralysed statistical apparatus precluded the collection of reliable debt and GDP data (Buyst et al., 1995). Consequently, overall wartime debt accumulation must be inferred from the debt-to-GDP ratios of the immediate post-war years (1919 and 1946).
3. Public Debt Surges and Fiscal Policy Responses
3.1. The Aftermath of World War I (1919–1921): The Emergence of Redistributive Taxation
Belgium incurred considerable debt to foreign countries in order to finance its war effort during WWI (NBB, 1944). By December 1918, damages were estimated at nearly half of the nation’s pre-war GDP (Baudhuin, 1946; Buyst, 2018). While the prevailing political mantra suggested that Germany would pay the war damages, it quickly became evident that its reparations would be insufficient to reimburse the debt and to cover the immediate and massive costs of reconstruction (Baudhuin, 1954). In this context, the National Bank of Belgium (NBB) advanced the funds needed to redeem German marks at 1.25 Belgian francs per mark—double the market rate. Grounded in a spirit of national solidarity to protect Belgian holders from exchange losses, this operation nonetheless attracted marks held by non-Belgian citizens, further deepening the State’s indebtedness to the central bank (Luyten, 2014). As a result, the debt-to-GDP ratio of the country rocketed from 43.3% (1913), to 108.7% in 1920 and continued to rise to 135.6% until 1922.
Thus, in the immediate aftermath of the war, three major fiscal initiatives were launched by a unity government (Catholics, Liberals, and Socialists): a comprehensive reform of income taxation, the enactment of exceptional taxes, and the establishment of new indirect taxes designed for administrative simplicity and immediate productivity (Masoin, 1954).
The most extensive fiscal overhaul in the immediate post-war period concerned the reform of direct income taxation. Prior to the conflict, the Belgian tax system relied on a presumptive model, where incomes were estimated through proxy indicators of wealth—such as the number of doors and windows, or household furniture. This archaic system, however, proved fundamentally incapable of meeting sufficient tax justice the massive financial requirements of post-war reconstruction and the ballooning debt service. In response to this fiscal gap, the 1919 tax reform marked a paradigm shift by taxing actual, declared income. The new framework introduced schedular taxes, which categorised and taxed income differently based on its source (land, capital, or labour). To ensure a redistributive effect, the law supplemented these categories with a progressive tax known as the ‘supertax’. This progressive layer was specifically designed to enforce the ‘ability-to-pay’ principle, ensuring that every taxpayer contributed according to their actual financial capacity (Belgian Chamber of Representatives, 1919b).
A special tax on wartime profits applied progressive rates from 20% to a maximum of 80% on profits above 600,000 BEF. The legislator explicitly framed this levy not as a punitive measure but as a redistributive instrument grounded in ‘justice, equity, and solidarity,’ channelling revenues from war profiteers to those who had suffered (Belgian Chamber of Representatives, 1919c). Although initially enacted for a single year, the tax was extended twice at more moderate rates (Rigaux, 2026).
Between 1919 and 1921, Belgium also reformed capital and transaction taxes. Inheritance duties were restructured along the ability-to-pay principle (Belgian Chamber of Representatives, 1919d; Schoysman, 1974). The 1921 reforms introduced a transmission tax (exempting essential goods), a 5% wealth tax on movable property with a tax-exempt threshold, and a luxury tax on high-end goods—collectively targeting ‘acquired fortune and fortune in motion’ to rebalance the fiscal burden across social strata (Belgian Chamber of Representatives, 1921).
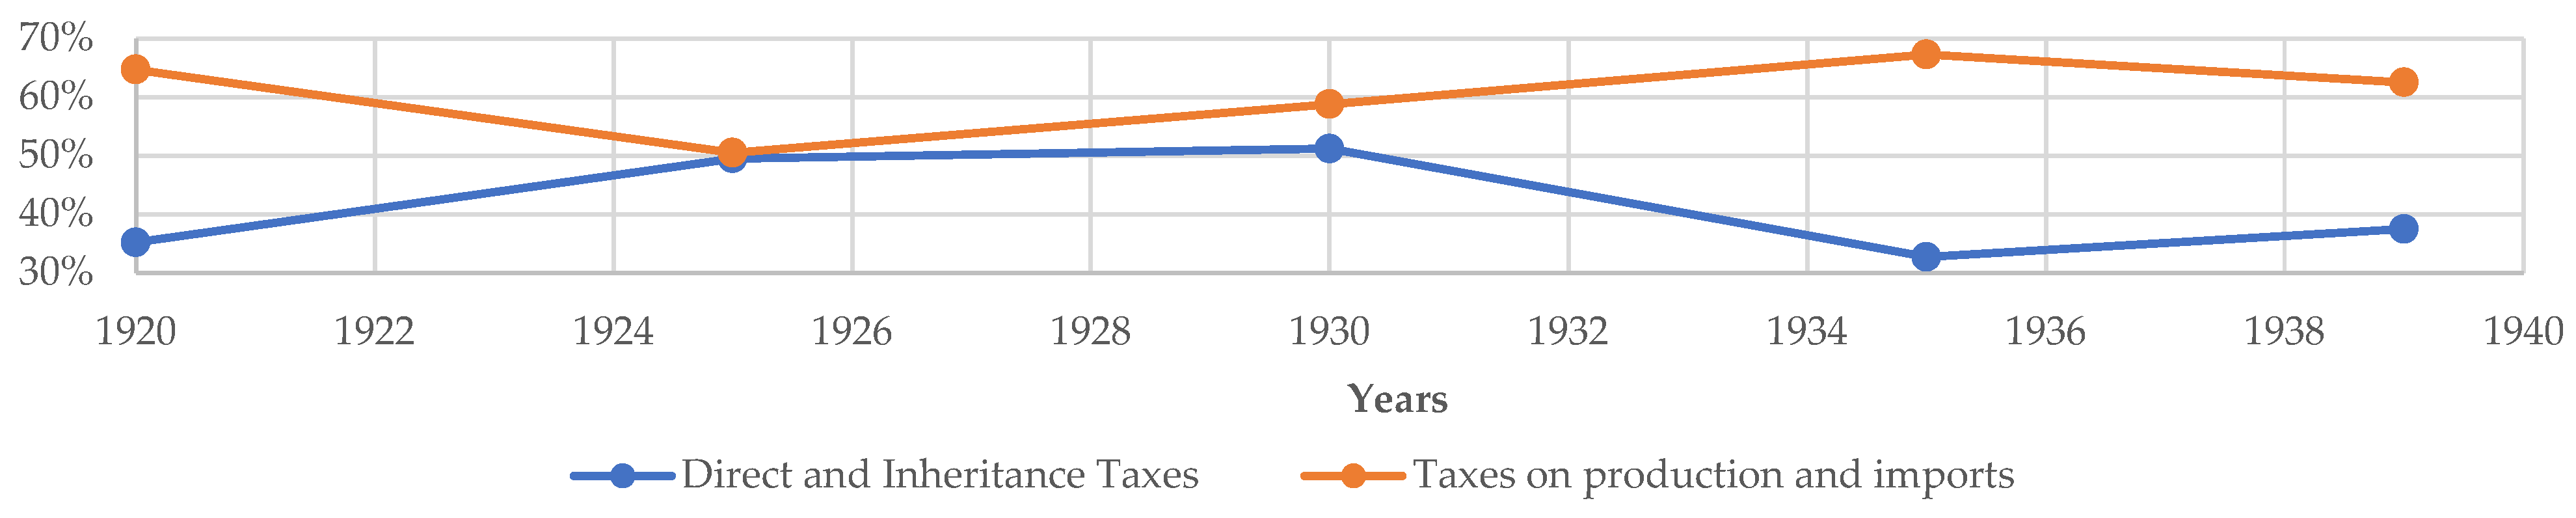
The 1919–1921 fiscal reforms revolutionised the Belgian tax landscape by shifting the burden from regressive consumption duties to progressive taxation on actual income, inheritance, and wartime profits. Grounded in the concept of marginal utility, this shift sought to ensure ‘equality of sacrifice,’ aligning the reconstruction effort with citizens’ financial capacity (Belgian Chamber of Representatives, 1919a; Hardewyn, 1997; Jevons, 1888; Walras, 1896; Musgrave & Musgrave, 1989). Consequently, the direct tax burden surged: between 1920 and 1925, revenues from income and capital taxes grew twelvefold and tenfold respectively, far outpacing the 56.8% rise in nominal GDP (Belgian Chamber of Representatives, 1926). Although administrative challenges and delayed German reparations slowed the full realisation of these revenues (Belgian Chamber of Representatives, 1921; Masoin, 1954; Maes, 2010), this unprecedented tax mobilisation, combined with inflation-driven debt erosion, successfully reduced the debt-to-GDP ratio from 135.6% to 95.6% between 1922 and 1924 (Pensieroso, 2007). As Figure 3 confirms, this structural reorientation is reflected in the rising share of direct taxes relative to taxes on production and imports throughout the 1920s, providing quantitative corroboration of the legislative shift documented above.
3.2. The Floating Debt Crisis and the ‘Government of Bankers’ (1925–1929): Stabilisation at the Expense of Progressivity
Although the early 1920s saw a partial reduction in the debt-to-GDP ratio through inflation and tax reform, public liabilities remained structurally fragile, with a large share of short-term floating debt and growing dependence on foreign creditors (Pensieroso, 2007). Between 1924 and 1926, the ratio rose from 95.6% to 106.5%, as public debt grew by 44.6% against a GDP increase of only 29.8%. The Catholic–Socialist coalition formed after the 1925 elections inherited a deteriorating situation—franc depreciation, mounting floating debt, and looming deficits—and sought foreign loans contingent on fiscal consolidation (Davin, 1954). These efforts were, however, systematically obstructed by the Ligue d’intérêt public, a powerful lobby of financial and industrial interests that mobilised against the government’s fiscal policies, in particular the ‘supertax’. The resulting climate of distrust, compounded by capital flight facilitated by Belgian banks, culminated in a ‘Black Monday’ on 15 March 1926, when the Brussels Stock Exchange collapsed and the government resigned in May 1926 (Maes, 2010; Vanthemsche, 1978; Watteyne, 2023).
The successor ‘National Union’ government, a coalition of Catholics, Liberals, and Socialists, was heavily aligned with financial interests, earning the nickname ‘government of bankers’ (Maes, 2010; Watteyne, 2023). For the first time in Belgian history, Parliament granted the government ‘special powers’ to restore public finances. Through a flexible interpretation of the Constitution, this mechanism allowed the legislature to temporarily delegate its legislative prerogatives to the executive branch, subject to a posteriori parliamentary oversight. To tackle the pressing floating debt, the government executed a major balance-sheet operation, converting 11 billion BEF of short-term Treasury liabilities (18.7% of public debt) into shares of the newly created National Railway Company of Belgium (SNCB), with the State retaining majority ownership (Yernault, 2013). Simultaneously, the cabinet raised transmission and customs duties (Belgian Chamber of Representatives, 1926; Watteyne, 2023). To stabilise the franc and signal a return to orthodox monetary management, the government also secured a foreign loan mediated by the NBB (Davin, 1954; Van der Wee & Tavernier, 1975). Buoyed by the favourable economic climate and ensuing budget surpluses, the new Catholic–Liberal coalition capitalised on this conjuncture to implement substantial, pro-cyclical tax reductions. In 1930, it replaced the progressive supertax with a less productive levy based on presumptive indicators, deliberately excluding wealth-based presumptions on capital income. Aimed at establishing a less intrusive tax design to attract capital (Belgian Chamber of Representatives, 1929), this reform was accompanied by unprecedented tax relief totalling 1.6 billion BEF, representing approximately 18.3% of estimated revenue for 1931.
Between 1926 and 1930, Belgium’s debt-to-GDP ratio underwent a remarkable contraction from 106.5% to 57.3%, driven primarily by a 64.1% nominal GDP surge alongside an 11.6% decrease in public debt. This favourable macroeconomic climate was aided by the policies of the ‘government of bankers’, which effectively restored market confidence and consolidated the 1926 monetary stabilisation (NBB, 1928; Pensieroso, 2007; Watteyne, 2023). This debt reduction was further bolstered by substantial treasury inflows from delayed post-war tax arrears (Davin, 1954). Crucially, the structural conversion of State floating debt into SNCB equity functioned as a major one-off balance-sheet operation.
Viewed through a distributive lens, by transferring part of the debt service from the general budget to the SNCB, this one-shot operation provided immediate financial relief, creating the fiscal space to dismantle the supertax. Figure 2 highlights this shift: the yield of the supertax halved between 1926 and 1932, underscoring the deliberate weakening of Belgium’s primary progressive instrument. Conversely, the surge in the movable property tax until 1929 suggests that while these liberal policies successfully retained capital during the boom years, they did so precisely by decoupling financial returns from the progressive tax scale. Beyond the SNCB operation, this stabilisation marks a broader shift in the burden of fiscal adjustment away from income and onto consumption. As Figure 3 illustrates, the 1919 reforms had increased the direct tax share—from 35% in 1919 to 47% by 1925—a trend abruptly halted after March 1926. Consequently, state financing increasingly relied on the ‘blind’ yield of indirect levies, which remained the dominant pillar of the Treasury throughout the 1930s.
Figure 2.
Revenues from the various schedular income taxes and the supertax in millions of BEF (1920–1939) (Belgian Chamber of Representatives, Budget documents, various years).
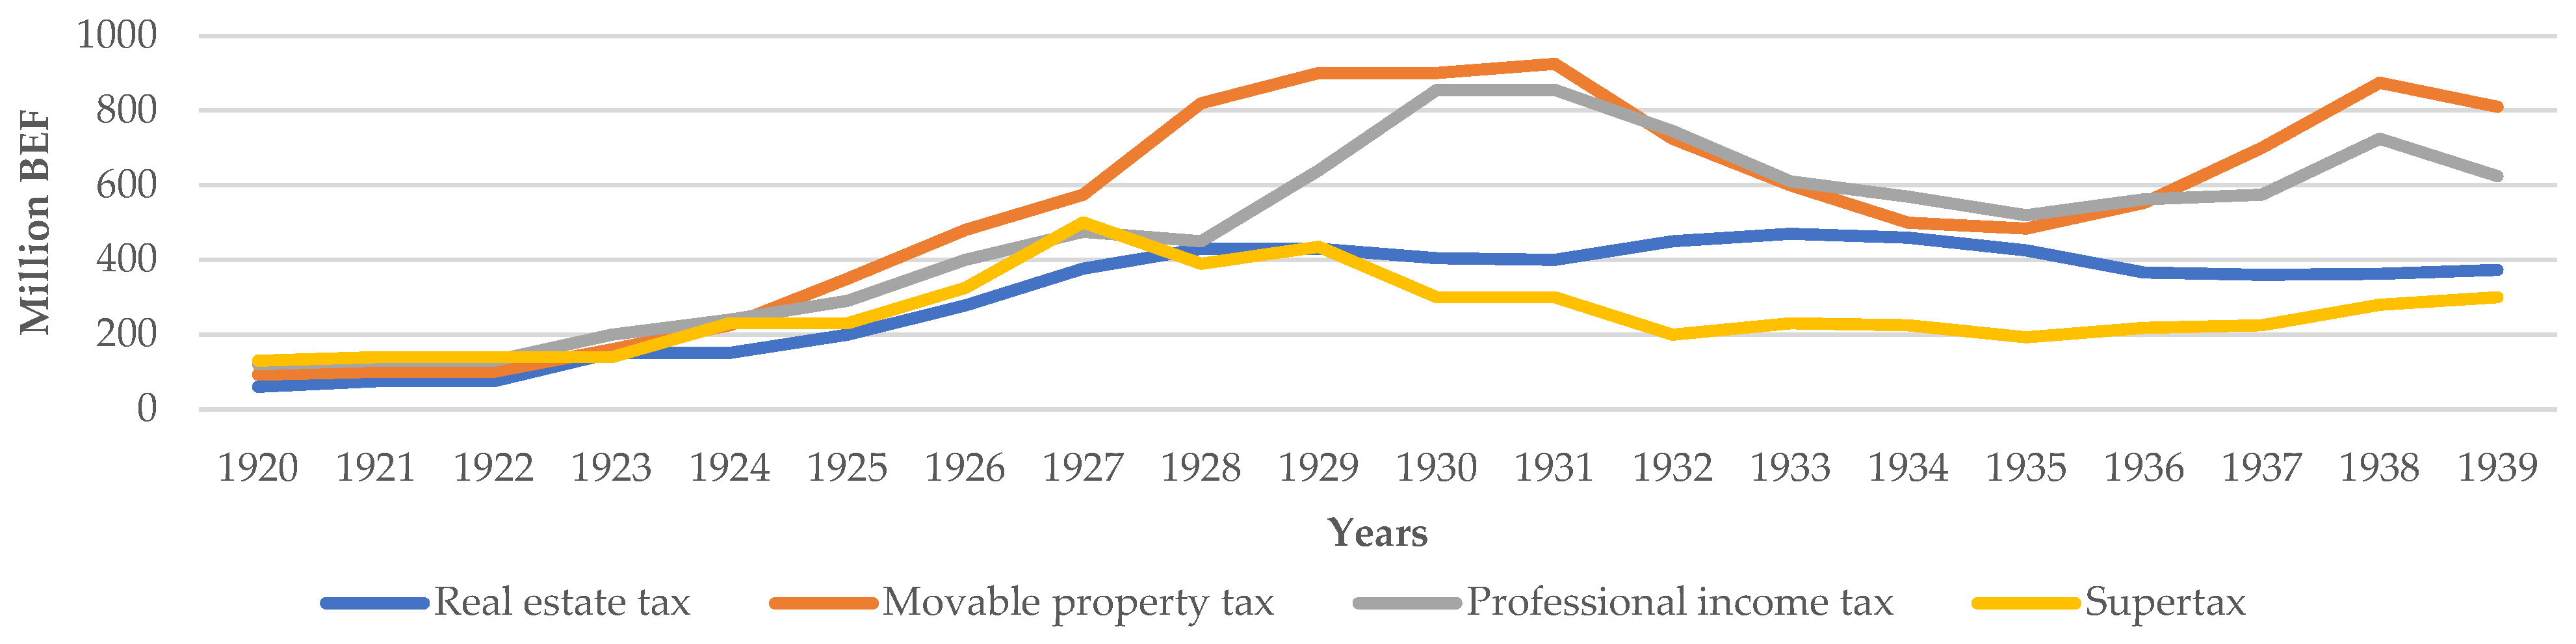
Figure 3.
Proportions of direct vs. taxes on production and imports in total fiscal revenue (1919–1939) (Pirard, 1999).
3.3. The Great Depression (1931–1939): Predominance of Monetary Policy
The substantial tax cuts implemented during the economic rebound proved costly when the Great Depression struck in the early 1930s. As a small open economy, Belgium was particularly vulnerable to the worldwide collapse in foreign demand, which devastated its export industry, triggered widespread bankruptcies, and consequently pushed unemployment to record highs (Cassiers, 1989; Mommen, 1994). The resulting corporate defaults forced several medium-sized banks to suspend payments, further undermining systemic financial stability (Maes & Buyst, 2009). Ultimately, the ensuing deep recession caused tax revenues to plummet (Cassiers, 1989; Masoin, 1954). Consequently, the debt-to-GDP ratio rocketed from 57.3% in 1930 to 85.1% in 1934. However, this surge was primarily driven by the severe economic contraction—with nominal GDP shrinking by 26.4% during this period—rather than by the growth of the public debt stock itself, which increased by a more moderate 9.7%.
As early as 1931, the Catholic–Liberal coalition attempted to rebalance the budget by reversing the fiscal trajectory of the preceding prosperity. This fiscal tightening relied primarily on consumption taxes, whereas the tax rate on movable property was paradoxically reduced in 1932 to allegedly ‘foster business recovery’ (Belgian Chamber of Representatives, 1931).
However, as the crisis overwhelmed the country by late 1932, Parliament granted the government special powers to restore budgetary stability. Empowered by this mandate, the government pursued a strict deflationary strategy—combining severe expenditure cuts with increased taxation—driven by the political choice to keep the Belgian franc pegged to gold even after the United Kingdom abandoned the gold standard in 1931 (Maes, 2010; Mommen, 1994).
The Catholic–Liberal coalitions severely slashed operating costs through a hiring freeze, civil service wage reductions, and streamlined administrative outlays, further reinforced by significant cuts to pensions and social spending (Coppée, 1954; Mommen, 1994; Pirard, 1999). Remarkably, despite an explosion in unemployment benefits during this period, these interventions yielded approximately 2.7 billion francs in savings between 1930 and 1933, representing a substantial 19.3% contraction in total expenditures (Cassiers, 1989; Mommen, 1994).
To bolster revenues, the government increased registration, inheritance, and customs duties, while introducing two exceptional levies: a national crisis contribution (a progressive tax on workers at 1–4%, exempting low earners) and a 60% tax on exceptional import/export profits. For 1933, these measures were expected to generate 1.3 billion BEF—roughly 12.8% of total budgeted revenue—primarily from customs duties and the crisis contribution (Belgian Chamber of Representatives, 1933). Crucially, income from movable property was explicitly spared (Belgian Chamber of Representatives, 1932a, 1932b).
A brief fiscal relaxation in 1934—exempting goods from the luxury tax, reducing schedular taxes, and abolishing the top supertax bracket—was abruptly halted by a renewed deflationary spiral and an impending banking crisis (Mommen, 1994; Rigaux, 2026; Watteyne, 2023). The succeeding Catholic–Liberal coalition, dubbed the second ‘Government of Bankers,’ pledged rigid commitment to the gold standard and pursued a deflationary agenda (Belgian Chamber of Representatives, 1935b). Its two key fiscal measures—prolonging the national crisis contribution until 1937 and replacing the supertax with a less burdensome ‘personal complementary tax’—had only marginal budgetary impact (Rigaux, 2026).
Ultimately, the government’s monetary inertia precipitated its downfall. As the economic situation deteriorated, the Belgian franc faced relentless speculative attacks and intensified capital flight. Refusing to devalue, the government instead implemented capital controls, which in turn triggered massive bank runs. This systemic failure forced the coalition to resign in March 1935 (Coppée, 1954; Mommen, 1994; Watteyne, 2023).
In March 1935, a tripartite coalition propelled a generation of policymakers receptive to Keynesian-inspired ideas into power (Bismans, 1992; Buyst, 2012). This ideological shift was mirrored within the NBB, where Vice-Governor Paul van Zeeland—an advocate for devaluation—was appointed Prime Minister (Maes, 2010; Van der Wee & Tavernier, 1975). The van Zeeland government immediately devalued the chronically overvalued franc (Cassiers, 1989; Mommen, 1994) and, endowed with special powers, reformed the financial system by asserting that banking fulfilled a mission of public interest—a structurally interventionist turn that would fully materialise with the Gutt Operation in 1944 (Maes, 2010). Concurrently, it enacted tax relief on real estate, consumption, and the national crisis contribution, absorbing the revenue shortfall through growth expectations and devaluation windfalls redirected towards repaying floating debt. Domestic debt conversion generated an additional 611 million francs in savings, equal to 5.9% of 1936 revenues (Belgian Chamber of Representatives, 1935a; Davin, 1954; Watteyne, 2023).
Consequently, 1935 was a decisive fiscal turning point. The debt-to-GDP ratio, having peaked at 85% in 1934, fell to 66.9% by 1937. This deleverage was driven by post-devaluation economic recovery: nominal GDP surged by 28.8% while nominal debt increased by merely 1%. Following this stabilisation, the late 1930s saw no major fiscal reforms. However, the downward trajectory of the debt ratio proved short-lived, as public borrowing climbed again in 1938 to finance rearmament and war preparations.
While it remains difficult to isolate the precise impact of domestic policy from the broader recovery in global demand, Belgium’s interwar trajectory suggests that debt management was fundamentally a corollary of monetary strategy, with fiscal policy serving as the primary instrument for distributing its social costs or attracting capital. Prior to 1935, the orthodox defence of the overvalued franc necessitated a regressive redistributive framework: stabilisation was achieved through drastic spending cuts and labour-focused levies while capital income remained largely shielded to preserve financial confidence. In this regime, fiscal policy functioned as the brutal adjustment variable for a rigid monetary peg, burdening employees and social transfer recipients through deflation. This paradigm was upended in 1935 by the return of Socialists to government and a profound ideological and political shift. Influenced by emerging interventionist theories, a new generation gained traction within both the government and the NBB, an institution previously dominated by private banking interests (Van der Wee & Tavernier, 1975), and broke the monopoly of liberal–orthodox policymaking, enabling a framework that prioritised domestic reflation over wage compression.
3.4. The Aftermath of World War II (1944–1950): Redistributive Policy to Address the Debt Surge
At the end of World War II, the NBB estimated war damages at 55 billion BEF (NBB, 1945). Between 1939 and 1946, nominal public debt more than quadrupled, driving the debt-to-GDP ratio from 70.4% to 118.2%. To finance reconstruction, Belgium initially relied on borrowing alongside a drastic monetary and financial consolidation—known as the Gutt Operation—before subsequently shifting towards taxation.
Enacted via decree-laws by the national unity government (Catholics, Liberals, Socialists and Communists) in the absence of a sitting Parliament, the Gutt Operation aimed primarily to avert the hyperinflation threatened by excessive wartime money creation (De Ridder, 1947; Van der Wee & Verbreyt, 2009). It included a currency devaluation, but its core mechanism was a severe contraction of the money supply. High-value banknotes (exceeding 100 BEF) were demonetised and required to be deposited. Citizens received new currency capped at 2000 BEF per household member. The surplus was converted into frozen securities, while a mandatory declaration of all assets was instituted. To prevent evasion, foreign exchange markets were suspended for several months (Van der Wee & Verbreyt, 2009; Van Praag, 1996). The government justified these stringent measures on grounds of social equity, explicitly stating that the resulting financial registry would underpin targeted taxation of war profiteers (Report to the Regent, 1944).
Although the October 1944 Gutt Operation did not mechanically reduce nominal public debt, it decisively restructured it by converting inflationary floating liabilities into long-term consolidated debt, establishing the monetary stability necessary for recovery. Building on this foundation, authorities imposed strict cover ratios on banks in February 1946 to enforce this consolidation and prevent renewed inflation. By creating this captive market, the State secured low-cost financing for reconstruction without triggering an inflationary spiral (De Ridder, 1947). Crucially, the comprehensive financial registry established in 1944 paved the way for unprecedented, targeted fiscal measures for subsequent debt amortisation (Buyst, 2012; De Ridder, 1947).
In October 1945, three exceptional taxes—designed by Gaston Eyskens, an economics professor receptive to Keynesian theory (Buyst, 2012; Rigaux, 2026)—were enacted as acts of national solidarity aimed at ‘distributive justice’ (Belgian Chamber of Representatives, 1945; Belgian Senate, 1945). The centrepiece was an exceptional 5% tax on the total global capital of all citizens and legal entities, made feasible by the wealth cadastre established during the Gutt Operation (De Ridder, 1947; Deschrijver, 2023). Though formally flat-rated, significant exemptions—40,000 francs per individual, doubled for couples—effectively shielded the working class, whose average annual earnings did not exceed 24,000 francs in 1944 (Cassiers & Scholliers, 1995), ensuring that the effective burden rose with the size of taxable wealth. The second measure was an exceptional progressive tax on wartime profits at rates of 70–95%, significantly more burdensome than its 1919 predecessor. Lastly, a confiscatory 100% tax targeted profits from transactions with the enemy (Belgian Senate, 1945). Together, these three levies yielded 48.2 billion BEF—approximately 19% of the 1946 debt stock—with the capital tax providing the bulk (67.5%), followed by the wartime profits tax (27.6%) (De Rijk, 1988; Eyskens, 1955).
Between 1946 and 1948, Belgium’s debt-to-GDP ratio fell precipitously from 118.2% to 79.2%. While post-war exceptional taxes contributed to this decline, it was primarily driven by the rapid economic growth of the ‘Belgian economic miracle’ (Van der Wee & Verbreyt, 2009). While nominal debt rose by merely 3.1%, nominal GDP surged by 53.9%. This downward trajectory continued until 1974, reaching a historic low of 38.7%. Although the nominal debt stock increased fivefold over these three decades, exceptional economic growth absorbed this expansion, with GDP multiplying by 6.6. Throughout the Golden Age, policymakers actively pursued a highly distributive fiscal agenda. Key reforms included episodically indexing tax brackets exclusively for low- and middle-income earners, and the landmark 1962 reform that globalized income, effectively abolishing the outdated schedular tax system. Successive governments consistently sought to tax capital more heavily than labour, and structurally strengthened the progressivity of corporate and, above all, personal income taxes. Ultimately, public finances were reinforced by the fight against tax evasion (Rigaux, 2026; Watteyne, 2023). This financial repression—characterised by nominal interest rates kept below growth rates and strict reserve requirements on private banks until the mid-sixties (Maes, 2010)—enabled the Belgian state to reduce its debt burden at the expense of savers, whose purchasing power nonetheless remained robust during this ‘Golden Age.’
The precipitous post-war decline in the debt-to-GDP ratio resulted not only from the ‘Belgian economic miracle,’ but also from a deliberate strategy of shifting the fiscal adjustment burden from labour onto capital and wartime wealth. Beyond monetary stabilisation, the Gutt Operation acted as a pivotal redistributive mechanism. This trajectory was further institutionalised by the 1962 fiscal reform, which broadened the tax base while imposing steep progressivity on high incomes rather than mass consumption. As Figure 4 illustrates, this distributive shift profoundly altered the structure of tax revenues. While European economic integration structurally eroded indirect taxation—with customs duties declining before vanishing in 1979 in favour of the VAT—direct taxes steadily expanded their share of total levies. Empirically, between 1970 and 1980, the share of income and inheritance taxes surged from 29.5% to 39.8% of total fiscal and parafiscal revenues, while the proportion derived from production and import taxes fell reciprocally from 37.7% to 28.7%. This redistributive reorientation is quantitatively visible in Figure 4, which shows the sustained predominance of income and inheritance tax revenues over indirect tax revenues throughout the post-war decades.
Figure 4.
Evolution of shares of income and inheritance taxes vs. taxes on production and imports in total tax revenues in Belgium 1945–1980 (Pirard, 1999).

3.5. The Debt Crisis (1973–1996): The Shift from Redistributive Taxation to Competitiveness-Driven Consolidation
The 1973 and 1979 oil shocks precipitated a profound structural crisis. Belgium experienced severe industrial decline characterised by low growth, mass unemployment, elevated inflation, and rising long-term interest rates. Public finances destabilised rapidly, driven primarily by soaring social security expenditures—themselves the product of extended coverage, rising life expectancy, and mass unemployment, which simultaneously expanded the beneficiary base while eroding contribution revenues (Bisciari et al., 2015; Cassiers et al., 1996; Deffet, 1997; Festjens, 1993; Starke et al., 2013). Although the economy recovered in the 1990s, the ‘snowball effect’ of high interest rates on an already massive debt stock continued to drive the ratio upward (Bisciari et al., 2015; IMF, 2011). After hitting a trough of 38.4% in 1974, the debt-to-GDP ratio rose almost continuously, peaking at 118.9% in 1993, with nominal public debt expanding eleven-fold while nominal GDP only tripled.
Belgium’s fiscal response evolved through four phases. In the first (1974–1981), highly fragmented coalitions—whose instability was exacerbated by the linguistic scission of traditional unitary parties into separate Flemish and Francophone wings—largely neglected consolidation until a rapid debt surge forced action in 1981. The second phase (1982–1987) saw a Christian Democrat–Liberal coalition enact severe austerity. The third (1988–1991), under a Socialist–Christian Democrat–Flemish nationalist coalition, pivoted towards a competitiveness-oriented strategy through a targeted tax shift. Finally, the fourth phase (1993–1999), led by Christian Democrat–Socialist coalitions, shifted the consolidation burden to the revenue side to satisfy the Maastricht convergence criteria, with government deficits at 3% of GDP and public debt to 60% of GDP (Bisciari et al., 2015).
During the first phase (1974–1981), governments prioritised combating stagflation over fiscal consolidation, implementing targeted cuts in social benefits and the civil service while freezing wages, rents, and dividends. Simultaneously, they attempted to sustain employment through private-sector subsidies and investment tax relief (Belgian Chamber of Representatives, 1975; Pirard, 1999; Starke et al., 2013). Fiscal reforms steepened income tax progressivity—with the top marginal rate rising from 55% to 72% between 1973 and 1977—but no structural measures curbed the mounting deficit (Cassiers et al., 1996). The first decisive act came in 1981, when a Christian Democrat–Socialist coalition abolished the ceiling on social security contributions (Rigaux, 2026).
Genuine consolidation was implemented between 1982 and 1987 by a Christian Democrat–Liberal coalition. Following an 8.5% devaluation of the Belgian franc within the European Monetary System (Maes, 2010; Verplaetse, 2000), the government enacted a far-reaching austerity programme through special powers decrees. On the expenditure side, it cut public employment, family allowances, and healthcare reimbursements, froze social benefit indexation, and narrowed minimum and maximum pension levels (Cassiers et al., 1996; Festjens, 1993; Starke et al., 2013). On the revenue side, the strategy explicitly pivoted towards competitiveness and capital attraction: preferential regimes for multinationals (coordination centres), separation of capital income from the global tax base with favourable flat rates, and targeted reductions in employers’ social contributions (Bisciari et al., 2015; Styczen, 2010). In 1985, income tax progressivity was weakened, with rate cuts concentrated at the top (Rigaux, 2026). To offset these concessions, the state shifted the fiscal burden onto labour and consumption through higher workers’ social contributions, special levies, and increased VAT and excise duties. Furthermore, the federal government clawed back inheritance tax revenues from the federated entities, and transferred private-sector wage savings from indexation freezes into the social security budget (Bisciari et al., 2015; Festjens, 1993; Rigaux, 2026). Collectively, these measures reduced primary expenditure by nearly 7 percentage points of GDP (Bisciari et al., 2015).
In the late 1980s, the Socialist–Christian Democrat–Flemish nationalist coalition prioritised state reforms, advancing the federalisation process initiated in 1970. The primary economic measure was a tax reform designed to shift the burden from labour to indirect taxation, aiming to stimulate growth while ensuring budgetary neutrality (Belgian Senate, 1988). The number of tax brackets was reduced from thirteen to seven; most notably, the three highest marginal rates (ranging from 61.6% to 70.4%) were consolidated into a single top rate of 55% (Assal & Verbist, 2024; Frank, 1989; Gérard & Valenduc, 1993).
In parallel, the successive state reforms institutionalised fiscal federalism, fundamentally reshaping the federal government’s consolidation capacity. The financing regime was institutionalised by the Special Financing Law of 1989 (SFL), which devolved immobile tax bases—inheritance and real property transfer duties—to the Regions, while retaining mobile and competitiveness-sensitive taxes (VAT, personal and corporate income tax) at the federal level (Bayenet & Pagano, 2011; Rigaux, 2026). To prevent unilateral federal encroachment on federated entities’ resources—as had occurred in 1984, when inheritance duties were repatriated via an ordinary law—the SFL requires a special parliamentary majority: a two-thirds vote in both legislative chambers, complemented by a majority within each linguistic group. Crucially, the historical national debt remained almost entirely at the federal level. To compensate, between 1989 and 1999, the federal government imposed a mandatory withholding on transfers to federated entities, enlisting them in consolidation without formally dividing the debt stock (Bayenet et al., 2019). The net effect was a structural mismatch: the federal state retained the main tax instruments but ceded part of its fiscal capacity, while still bearing the bulk of historical debt.
In the 1990s, the Christian Democrat–Socialist coalition pursued the ‘Global Plan for Employment, Competitiveness, and Social Security’ to meet the Maastricht accession criteria (Arcq, 1993). Expenditure was curtailed through annual growth norms on social security, contained benefit indexation, restricted unemployment access, a postponed retirement age, and higher healthcare co-payments (Dumont, 2012; Pirard, 1999; Bisciari et al., 2015). However, the most significant consolidation occurred on the revenue side. Responding to declining competitiveness, the government expanded targeted reductions in employer social contributions, offsetting this shortfall mainly through a 3% crisis surcharge on personal and corporate income taxes, de-indexed tax brackets, and increased VAT and excise duties (Bisciari et al., 2015; Decoster et al., 2015; Rigaux, 2026). Special contributions proliferated, targeting diverse bases from pharmaceutical turnover to early retirees. Concurrently, the State intensified anti-fraud measures (Malherbe, 2011) and deleveraged the debt by divesting assets—gold reserves, public credit institutions, and state-owned telecommunications (Bisciari et al., 2015; Yernault, 2013). Between 1992 and 1998, state revenues increased by 5 percentage points of GDP (Bisciari et al., 2015).
These consolidation policies yielded substantial budgetary effects. Although public debt did not immediately decrease in the 1980s, the State achieved a primary surplus as early as 1983. After peaking at 118.9% in 1993, the debt-to-GDP ratio steadily declined to 77.4% by 2007—nominal debt growing by merely 18% while nominal GDP surged by 81.2%. Crucially, Eurozone integration secured a structural reduction in the interest burden from 1993 onwards (Bisciari et al., 2015).
Distributively, this era marked a profound paradigm shift. Following the 1981 abolition of the social security contribution ceiling—the last significantly progressive measure until the late 1990s—policy then radically pivoted towards restoring competitiveness and attracting capital, subordinating redistributive equity. Expenditure cuts contracted domestic demand and shifted social security towards a residual model (Cassiers et al., 1996; Hemerijck & Marx, 2010; Marx & Van Cant, 2020). Concurrently, the State definitively abandoned the ‘Golden Age’ consensus that capital should be taxed at least as heavily as labour, compensating for revenue shortfalls through a heterogeneous array of special contributions lacking coherent redistributive logic (Assal & Verbist, 2024; Frank, 1989; Rigaux, 2026). This paradigm shift is quantitatively captured in Figure 5, which documents the progressive convergence—and eventual inversion—of PIT and indirect tax revenue shares from the mid-1980s onward.
This structural erosion of tax progressivity was achieved by slashing tax brackets, reducing top rates, decoupling capital income from the global tax base, and increasingly relying on regressive indirect taxation (Festjens, 1993; Rigaux, 2026). As Figure 5 illustrates, personal income tax revenues initially surpassed consumption taxes in 1974 (30.1% vs. 29.3%), widening to an 11.2 percentage point gap by 1984 (36.5% vs. 25.4%). However, the structural effects of the 1985 and 1988 PIT reforms, compounded by the 1993 consolidation measures, deliberately curtailed PIT’s relative weight—dropping from 35.6% in 1985 to 31.6% in 1996—while stabilising consumption taxes. Crucially, this structural shift significantly diminished the Belgian tax system’s overall redistributive capacity by reducing direct taxation’s equalising effect and exacerbating indirect taxes’ regressivity (Decoster & Van Camp, 2000). This convergence trajectory was further consolidated by the 2001 PIT reform, which operated within the same paradigm by lowering the overall fiscal burden—notably for both the lowest and highest income earners—and reducing the number of tax brackets (Orsini, 2005; Rigaux, 2026). Ultimately, the differential between these two revenue streams continued to contract until 2007, narrowing to 27.8% for PIT and 25.9% for taxes on goods and services.
Finally, urgent liquidity requirements imposed by European convergence criteria drove the State to privatise public assets. While these fire sales provided short-term budgetary relief, their long-term efficiency remains highly questionable, exemplified by the 2001 sale and subsequent leaseback of the Finance Tower (Belgian Court of Audit, 2006; Bisciari et al., 2015; Yernault, 2013).
Figure 5.
Proportions of PIT vs. taxes on goods and services revenue 1965–2007 (OECD, 2026).
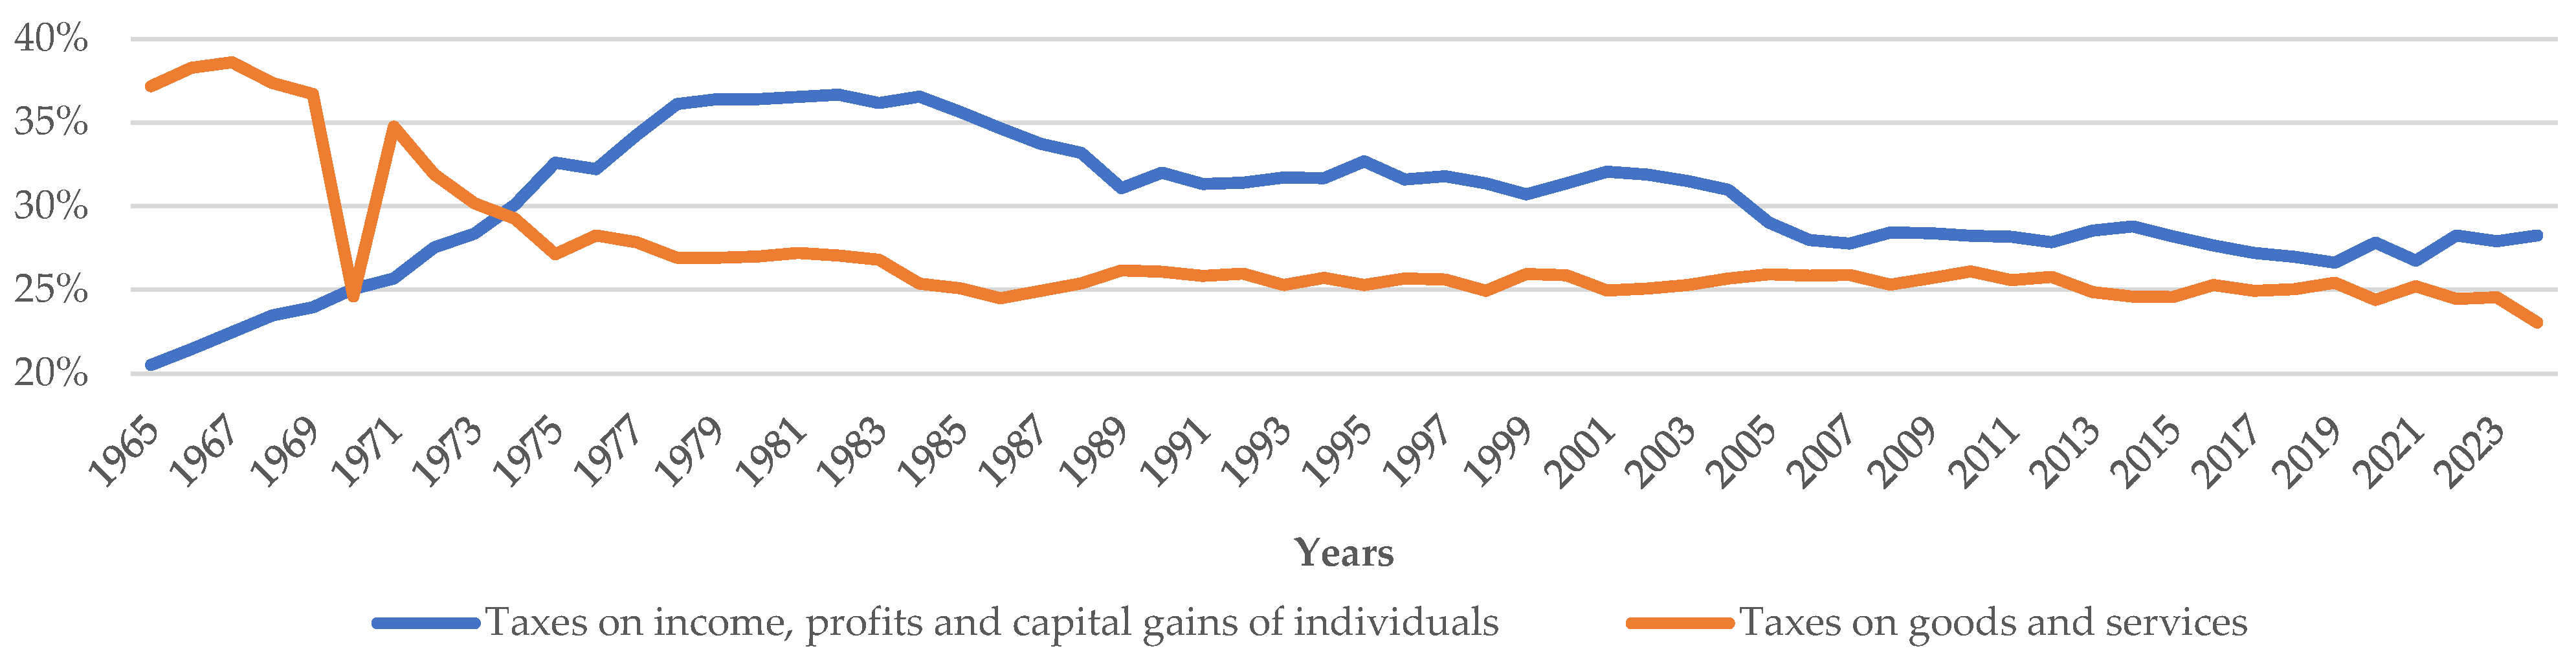
3.6. The Post-2008 Consolidation Cycle (2008–2016): European Pressure, State Reform, and a Transient Redistributive Surge
Catalysed by the September 2008 Lehman Brothers collapse, the global recession triggered severe economic and social crises (OECD, 2009; Starke et al., 2013). Belgium’s five-party coalition (Christian Democrats, Liberals, and French-speaking Socialists) stabilised the financial sector via guarantees and recapitalizations of banking and insurance institutions, costing approximately €27.4 billion (Belgian Court of Audit, 2018; Kickert, 2012; OECD, 2009; Yernault, 2013). Simultaneously, stimulus packages supported businesses, employment, and lower-income purchasing power (Canazza et al., 2012; Lee, 2021; Starke et al., 2013), utilising €2.4 billion—2.3% of budgeted recurrent expenditure—over 2009–2010 (OECD, 2009). Combined with a 1.2% GDP contraction, these outlays expanded borrowing needs, pushing federal public debt from 77.4% of GDP in 2007 to 86.2% in 2010.
Belgium commenced fiscal consolidation in late 2011 under an EU excessive deficit procedure (Bayenet et al., 2017; Canazza et al., 2012; Heipertz & Verdun, 2010). Budgetary adjustments were initially delayed by the economy’s short-term resilience (Kickert, 2012; Marx & Schuerman, 2016) and severe political paralysis following the June 2010 elections. It was only in December 2011 that a new administration secured the parliamentary majority required to enact economic reforms and the Sixth State Reform (double majorities). The consolidation unfolded in two distinct phases: the first, concentrating concrete measures between 2012 and 2014, was conducted by a centrist coalition of six parties (Socialists, Christian Democrats, and Liberals from both linguistic communities), while the second phase between 2014 and 2016 was led by a right-wing coalition of four parties comprising Flemish nationalists, Flemish Christian Democrats, and both liberal parties.
Economically, the centrist coalition enacted a multi-year consolidation plan totalling €11.3 billion in 2012, €12.6 billion in 2013, and €15.3 billion in 2014—representing a substantial proportion of the €40.5 to 49.1 billion budgeted annual primary expenditures (Belgian Chamber of Representatives, 2011, 2013). Although formally categorised into expenditure cuts (42–53%), revenue increases (28–34%), and miscellaneous measures (20–24%), the consolidation was in practice structurally balanced, since ‘miscellaneous’ items (tax regularizations, anti-fraud initiatives, nuclear sector contributions) predominantly yielded revenue. Politically, EU deficit compliance mandates provided the critical narrative legitimizing these measures (Kickert, 2012; Piron, 2013).
Expenditure savings targeted administrative operations via frozen endowments, public services (notably defense and rail), and core social security frameworks, including healthcare, unemployment insurance, and pensions (Baukens, 2015; Bisciari et al., 2015; Ghailani & Vanhercke, 2015; Morsa, 2015; Piron, 2013; Starke et al., 2013).
Conversely, revenue strategies aimed to shield labour by extracting ‘a better contribution from capital income’ and penalizing speculative externalities (Federal Government of Belgium, 2011). The flagship measure curtailed the notional interest deduction (€1.5 billion)—a 2002 provision to replace EU-criticised coordination centers allowing companies to file fictitious equity-based deductions. Capital taxation was further intensified through progressive hikes in the movable income withholding tax (from 15% to 25%) and a 30% increase in the stock exchange transaction tax (Belgian Chamber of Representatives, 2011; Piron, 2013; Rigaux, 2026). To address corporate tax optimization and financial speculation, the government imposed a €251 million bank ‘stability contribution’ and a €140 million ‘Fairness Tax’ (a 5% levy on large firms’ distributed dividends exceeding taxable income), though the latter was subsequently annulled by the Constitutional Court in 2018. Finally, additional revenues were generated by elevating excise duties and extending VAT to previously exempt professions, such as legal services (Belgian Chamber of Representatives, 2011; Bisciari et al., 2015; Piron, 2013; Rigaux, 2026).
Concurrently, the Sixth State Reform (2012–2014) leveraged fiscal consolidation to structurally enlist federated entities in federal debt reduction. Three mechanisms were introduced: accountability contributions requiring sub-national governments to internalise pension costs that their hiring decisions generate but that the federal authority funds; reduced endowments; and capped transfer indexation designed to shift ageing-related expenditure downward. For the latter two mechanisms, each entity’s consolidation effort is proportional to what it receives from federal transfers—a method that, while formally neutral, is not inherently redistributive, since the solidarity grant compensating fiscally weaker Regions is itself eroded by the consolidation effort, and Communities contribute without regard to the differential ageing-related expenditure needs they face (Bayenet et al., 2017; Rigaux, 2026).
Post-2014, a newly formed right-wing coalition pursued a more limited consolidation (€10.9 billion cumulated between 2015–2018), relying predominantly (70%) on expenditure cuts targeting state operations, public services, and healthcare. Revenue measures included increased tobacco excise duties, broader VAT application, and the subjection of intercommunal associations to corporate income tax (Belgian Chamber of Representatives, 2014; Bisciari et al., 2015). Crucially, a 2015 ‘tax shift’ sought to stimulate competitiveness by reducing labour taxes, particularly for low-wage earners, through curtailed social security contributions and, for PIT, extended professional expense deductions and tax-free allowance, as well as the abolition of one PIT bracket, which, unlike in previous reforms, was not the top bracket (Belgian Chamber of Representatives, 2015). To offset these labour reliefs, the government increased consumption taxes (raising electricity VAT from 6% to 21%), elevated the movable income withholding tax (from 25% to 27%), and introduced a transparency tax on offshore legal constructions (Rigaux, 2026; Simar, 2016). While its tax shift successfully stimulated employment, its equity outcomes were highly mixed: pro-labour PIT reliefs were overshadowed by reduced tax progressivity and regressive consumption levies (Decoster et al., 2019; Simar, 2016; Valenduc, 2019). Paradoxically, despite long-term supply-side benefits, the tax shift failed to achieve budgetary neutrality, ultimately worsening the debt-to-GDP ratio by 0.9% (IMF, 2019; NBB, 2017).
Despite the adverse budgetary impact of the tax shift, the federal debt-to-GDP ratio decreased from 89.8% to 82.9% between 2016 and 2019. Beyond fiscal consolidation, this reduction was structurally driven by declining interest rates: in 2015, nominal GDP growth exceeded the implicit debt interest rate, triggering a favourable ‘snowball effect’ (Belgian Debt Agency, 2017, 2020; European Commission, Directorate-General for Economic and Financial Affairs, 2019). Additionally, the initial 2008 financial sector bailouts became net-profitable by 2018, as cumulative inflows surpassed rescue outlays, further eroding the debt stock (Belgian Court of Audit, 2018).
Ultimately, the 2008 financial crisis provoked a temporary redistributive reversal in Belgian fiscal policy. Breaking with the post-1980s paradigm of capital leniency, the 2011–2014 centrist coalition shifted the consolidation burden onto capital via financial transaction taxes and restricted notional interest deductions. This resurgence of redistributive focus is clearly visible in the evolution of tax yields (Figure 6): between 2012 and 2014, the share of the PIT in total State revenues rebounded from 27.8% to 28.8%, while the proportion of taxes on goods and services simultaneously dropped from 25.8% to 24.6%. However, this progressive inflection was short-lived. The subsequent 2014–2018 right-wing administration not only decelerated consolidation but fundamentally altered the redistributive logic. Most notably, the implementation of the 2015 ‘Tax Shift’ deliberately reduced the PIT’s yield within State revenues while inversely increasing receipts from indirect consumption taxes. This structural policy choice reversed the post-crisis consolidation trajectory and further weakened the redistributive capacity of the Belgian fiscal model, definitively eroding the equalising effects that had briefly resurfaced (Decoster et al., 2019; Simar, 2016; Valenduc, 2019).
Figure 6.
Proportions of PIT vs. taxes on goods and services revenue 2001–2019 (OECD, 2026).

3.7. The COVID-19 and Energy Crises (2020–2024): From Federal Deadlock to Supranational Fiscal Solidarity
When COVID-19 struck Belgium in March 2020, the federal state was still governed by a minority caretaker coalition of three parties (Liberals and Flemish-speaking Christian Democrats) following the inconclusive May 2019 elections. The severity of the health emergency temporarily dissolved partisan deadlock: a broad parliamentary consensus granted the caretaker government both a vote of confidence and special powers, an exceptional arrangement that persisted until October 2020, when a full majority coalition of seven parties—comprising Liberals, Socialists, Ecologists, and Flemish Christian Democrats—was officially formed. Both governments prioritised population protection and socio-economic stabilisation, generating substantial public expenditure: between 2020 and April 2022, federal crisis-related costs totalled €26.8 billion (including social security), distributed across public health protection (27.6%), household support—notably through suspension of unemployment benefit degressivity and relaxed self-employment insurance conditions (51.5%)—and business assistance via tax relief and financial bonuses (21.3%) (Belgian High Council of Finance, Section Public Sector Borrowing Requirement, 2022). The resulting contraction in economic activity simultaneously compressed tax and social security revenues, driving federal public debt from 82.9% of GDP in 2019 to 92.9% in 2020, before a marginal decline to 90.9% in 2021.
Shortly thereafter, Belgium faced a severe energy crisis (2021–2023), as skyrocketing natural gas prices destabilised electricity markets: between August 2021 and October 2022, electricity prices doubled while natural gas prices nearly tripled (BFCEGR, 2021, 2022). The same government overseeing the pandemic’s final phase deployed, from early 2022 to March 2023, a two-pronged response combining direct exceptional expenditures with revenue-reducing tax measures. On the spending side, the social tariff was extended to vulnerable households and energy subsidies—covering heating, gas, and electricity premiums—were distributed universally, irrespective of income. Concurrently, VAT on electricity, gas, and reconstruction was reduced, and fuel excise duties were cut. The cumulative budgetary impact reached €6.2 billion in 2022 and €4.1 billion for January–March 2023 alone (Belgian Court of Audit, 2023; Rigaux, 2026). A rapid post-pandemic recovery combined with elevated inflation reduced the debt-to-GDP ratio from 90.9% in 2021 to 85.5% in 2022; nonetheless, public debt and structural deficits remain at elevated levels (European Commission, 2023; IMF, 2023).
To manage the crises, the successive federal governments relied predominantly on borrowing and EU assistance. At the domestic level, the federal government has repeatedly failed to agree on meaningful crisis-related levies and has largely avoided structural spending or tax reforms. Between 2021 and 2024, expenditure-based fiscal consolidation efforts were routinely offset by the budgetary impact of new policy measures, with 2024 standing out as the only year in which primary expenditure savings approached €1.8 billion. On the revenue side, massive crisis expenditures were never offset by significant autonomous federal taxes. Excluding EU-mandated levies (see below) and frozen Russian asset revenues, the largest domestic tax initiative was a modest €379 million securities account tax (Belgian Court of Audit, 2022, 2023, 2024, 2025).
This debt-financed strategy was facilitated by the European institutional framework. The European Central Bank’s (ECB) swift expansionary monetary policy enabled Member States to finance emergency spending through massive, low-cost borrowing (Benigno et al., 2022). Additionally, national fiscal expansion was legitimized by the unprecedented activation of the general escape clause (Art. 3 TSCG). This provision permitted temporary deviations from EU budgetary rules during an ‘unusual event outside the control’ of the state causing severe economic downturns or major fiscal impacts (Dermine, 2020; Ferreiro & Serrano, 2021).
Afterwards, the EU directly assisted Member States through market-borrowed loans and grants—a course of action formally precluded by the principle of budgetary balance (Art. 310 TFEU). Because the pandemic’s urgency precluded any Treaty revision, the EU circumvented this restriction by creatively invoking emergency solidarity mechanisms (Art. 122 TFEU) and classifying borrowed funds as ‘external assigned revenues,’ thereby marginalising the European Parliament’s ex ante budgetary oversight in favour of executive bodies (Dermine, 2020). Through the SURE instrument (Council Regulation, 2020), Belgium received an €8.2 billion loan for worker protection (Leonardi & Mazzotti, 2021; European Commission, 2025). More ambitiously, the NextGenerationEU recovery plan (Council Decision, 2020; Regulation, 2021)—potentially laying the groundwork for permanent EU financial solidarity (Dermine, 2020; Martucci, 2020)—authorised €750 billion in borrowing, allocating Belgium €5 billion in grants and €264 million in loans for green and digital transitions (European Commission, n.d.).
During the energy crisis, federal indecision was similarly resolved by top-down EU intervention. (Council Regulation, 2022) controversially rooted in Article 122 TFEU and adopted without the unanimity ordinarily required for fiscal matters (Englisch, 2025; Storr & Wallner, 2023), unprecedentedly mandated Member States to tax excess profits generated by energy companies during the crisis. Complying in December 2022, Belgium enacted a solidarity contribution on fossil fuel companies and a cap on inframarginal electricity producers’ surplus revenues. For congestion rents, however, Belgium departed from the EU regulation’s focus on electricity transmission operators and instead targeted the gas transmission system operator. Together, these three levies generated €1.6 billion in 2023—2.5% of expected federal revenues (Belgian Court of Audit, 2024).
Belgium’s fiscal response to the early 2020s crises highlights a structural paradox in managing its high public debt: an unprecedented reliance on European intervention to offset domestic fiscal paralysis. Despite massive public expenditure to shield the economy, successive federal governments failed to activate autonomous domestic tax solidarity, notably sparing sectors that generated exceptional pandemic profits (such as pharmaceuticals or large retail) from targeted national taxes. Instead, the Federal state relied on the European Union to prevent a debt spiral via subsidies, loans, and mandated windfall taxes. This dynamic elevates fiscal solidarity to the supranational level: the Union compelled the Belgian State to act, enforcing a top-down approach designed to redistribute exceptional crisis rents to vulnerable consumers—a fundamentally social policy (Englisch, 2025)—while harmonising Member State actions to prevent unfair tax competition. Ultimately, this Europeanized budgetary architecture facilitated a massive redistributive effort that Belgium was politically incapable of undertaking alone. However, this heavy reliance on temporary supranational mechanisms leaves Belgium’s underlying structural vulnerabilities unresolved, and the State’s fiscal fragility persists unabated. As the Federal state faced structural revenue weaknesses and the withdrawal of European emergency support, its debt-to-GDP ratio reached 84.7% in 2024, remaining starkly higher than its pre-crisis level (82.9%). Together with a federal government net borrowing of 3.2% of GDP in 2023 (S.1311) and a persistent general government deficit above the 3% reference value (S.13), these developments prompted the European Commission to initiate an excessive deficit procedure against Belgium (Eurostat, 2025).
Regarding domestic redistribution, the situation has not fundamentally improved since the COVID-19 crisis. Figure 7 does show a slight, temporary increase in the share of PIT relative to taxes on goods and services starting in 2023. This can be explained by the structural reduction in the VAT rate on electricity and gas from 21% to 6%.
Figure 7.
Proportions of PIT vs. Taxes on goods and services revenue 2019–2024 (OECD, 2026).

Viewed in historical perspective, successive fiscal consolidations since 1979 have systematically eroded the PIT’s redistributive capacity, notably by reducing tax brackets from thirteen to four and cutting the top marginal rate from 72% to 50%. Figure 8 and Table 2 document the cumulative distributional effects of these reforms on effective tax rates across net taxable income deciles between 1979 and 2022, utilizing reference years aligned with key legislative shifts. As detailed in Section 2.3.3, the “% decrease” column in Table 2 reports the proportional change in the average effective rate between fiscal years 1979 and 2022, computed using a counterfactual methodology that applies the 1979 average rate to the 2022 income structure to isolate the mechanical effects of statutory rate changes. The “nominal change” column in Table 2 shows the absolute amount of fiscal relief per taxpayer, expressed in euros. The results reveal a fundamentally regressive pattern in nominal terms: tax cuts overwhelmingly benefited the poorest and, above all, the wealthiest taxpayers. Consequently, the middle class (the 4th to 6th deciles) experienced the least relief. These intermediate deciles effectively subsidised the tax reductions for the poorest—a mechanism consistent with progressive alignment—while simultaneously bearing the cost of massive tax relief for the wealthiest, which directly contradicts core redistributive principles. This trend poses severe challenges for public finance sustainability. The data demonstrate that while the poorest decile secured the largest proportional gain (−900%, or €−707.5), the top decile generated the greatest absolute revenue loss for the State (−22.3%, or €−106,597), a shortfall driven particularly by the top percentile (−37.2%, or €−560,841). Two technical clarifications regarding Table 2 are warranted. First, the negative effective tax rates observed in the lowest two deciles stem from the introduction of refundable tax credits in 2001. From the 2002 income year onward, taxpayers in these income groups benefited from credits exceeding their gross tax liability, yielding negative average rates. Second, the recorded −900.0% change for the first decile arises from a near-zero baseline (0.3% in 1979): even a small absolute decline therefore translates into a very large proportional variation, indicating the direction of fiscal relief rather than its nominal magnitude (€707.5 per taxpayer), which remains 11.7 times smaller than the gain recorded for the second decile and 150.7 times smaller than for the tenth.
Figure 8.
Evolution of average effective tax rates by deciles and top percentiles of declared net taxable base between fiscal years 1979 and 2022 (Statbel, n.d.).
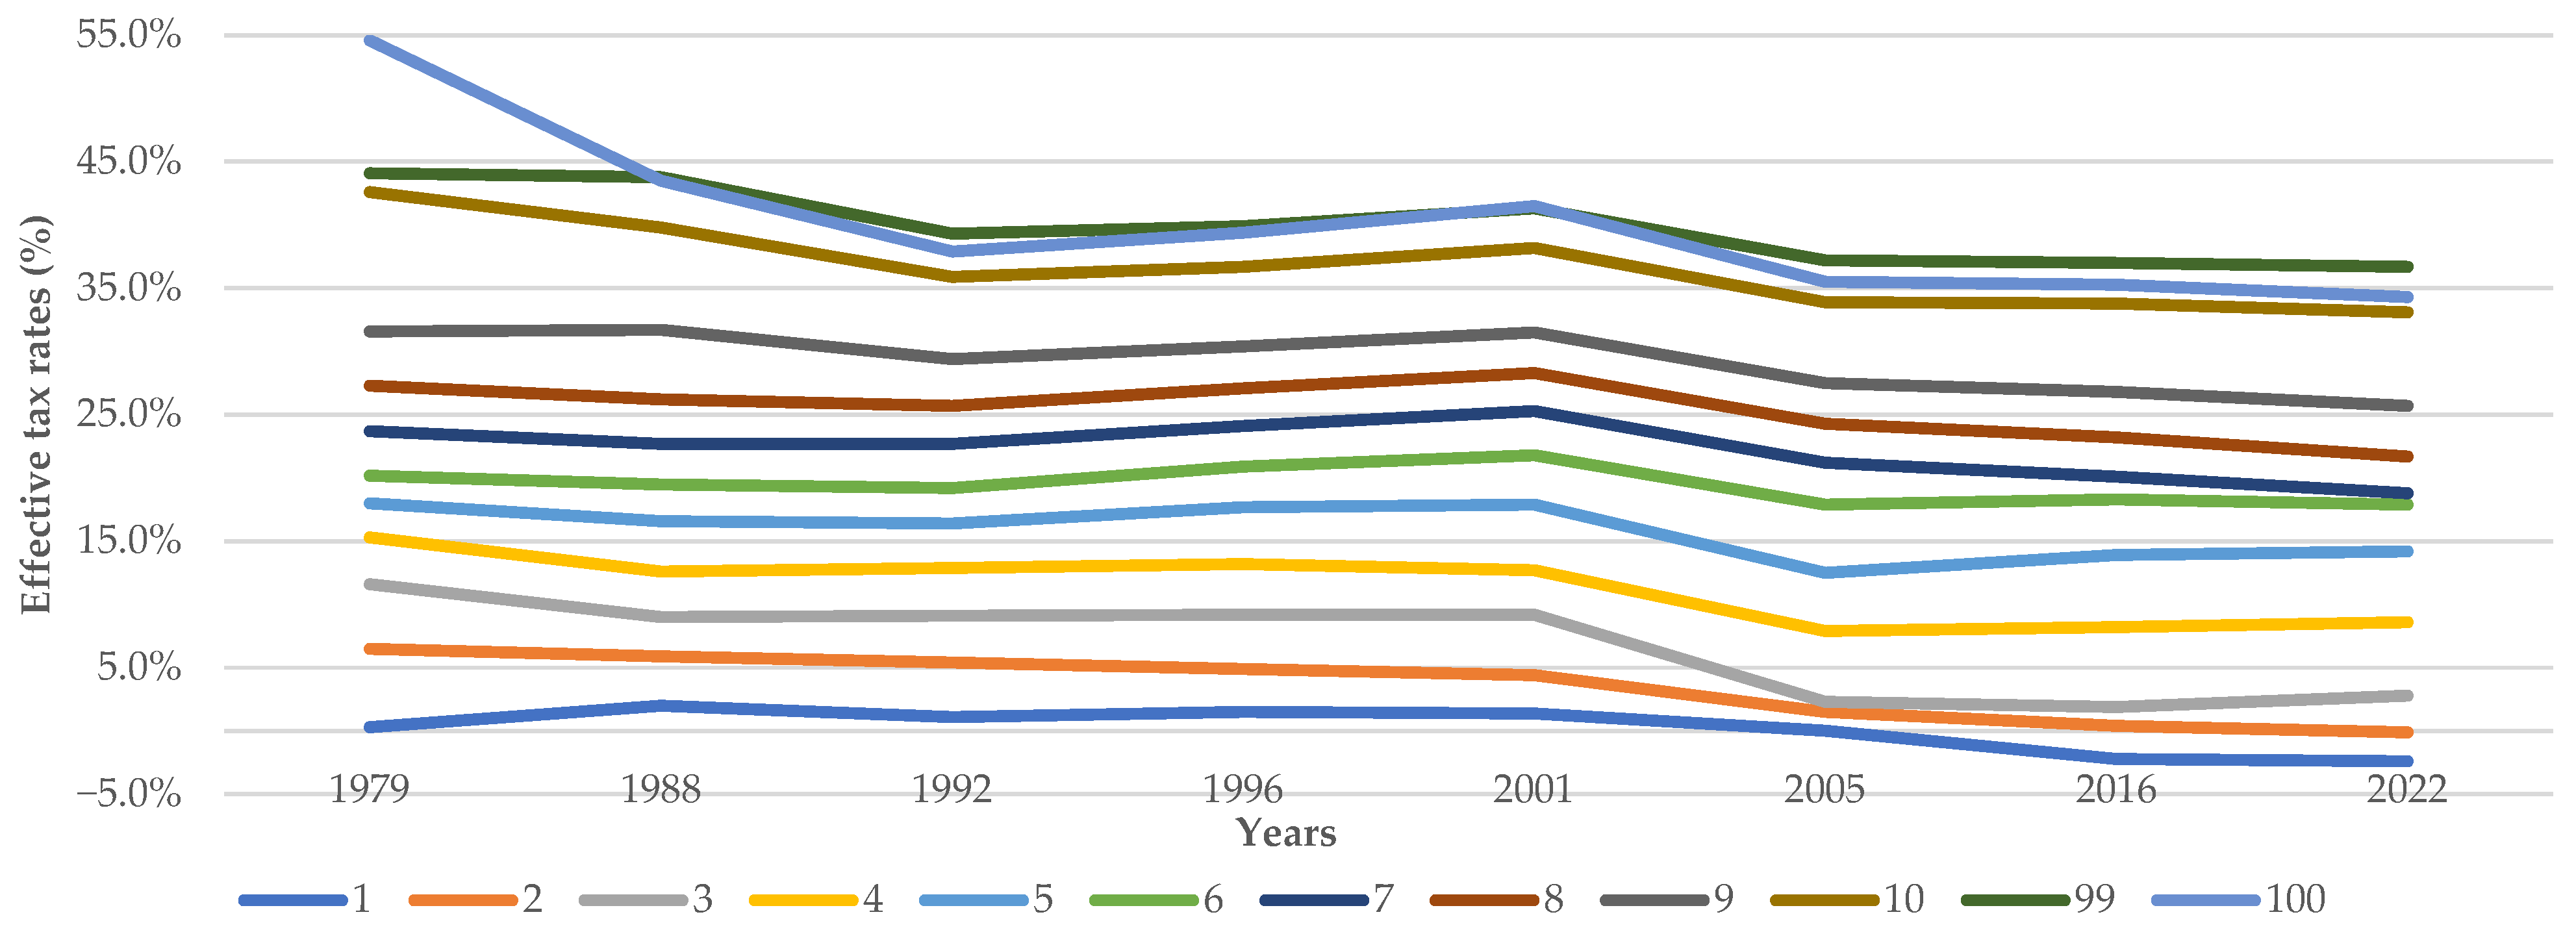
Table 2.
Reduction in the tax burden by deciles and top percentiles of declared net taxable base between fiscal years 1979 and 2022 (Statbel, 2023, n.d.).
4. Discussion: From Distributive Justice to Competitive Adjustment
Before proceeding to the transversal analysis, Table 3 provides an integrative summary of the seven episodes examined in Section 3, systematising the key characteristics of each debt surge and the corresponding fiscal response along comparable dimensions. For each episode, the table reports the debt shock (lowest to highest debt-to-GDP ratio) and the main policy instruments deployed, each annotated with a redistributive orientation symbol from Table 1 (++ = strongly progressive; to −− = strongly regressive). The assigned orientation is evaluated relative to the pre-existing fiscal configuration. These symbolic ratings are indicative rather than exact: they summarise the direction and broad magnitude of the expected distributive effect but do not capture fine-grained variation in incidence across individual measures within each episode. The table also shows whether each policy mix leans towards spending or revenue measures, clarifying the fiscal lever behind the redistributive stance. The Oil Crises episode (1973–1996) is further disaggregated into three sub-periods that reflect the progressive-to-regressive transition identified in the narrative analysis. The instruments listed in Table 3 instantiate the conceptual categories set out in Table 1, allowing readers to trace how the general redistributive gradient mapped in the methodology translates into concrete policy choices across successive debt episodes. Finally, the last column (Political Rationale & Main Determinant(s)) briefly summarises the dominant ideological framing and the principal political, institutional, or economic determinants that drove the adoption of the main instruments within each episode. The main evidence base for each episode is set out in the corresponding sub-sections of Section 3, while Section 2.3.3 provides the overarching methodological discussion of the sources employed, and this information is therefore not tabulated separately in order to preserve the readability of Table 3.
Table 3.
Integrative summary of debt surges and fiscal policy responses (1912–2024).
Read in conjunction, the narrative evidence in Section 3 and the synthetic patterns in Table 3 point to a secular transformation in the redistributive logic of Belgian fiscal adjustment, structured around two broad periods separated by a decisive break in the early 1980s. From 1919 to the late 1970s, fiscal responses to debt surges were broadly progressive: successive governments mobilised wartime excess-profits taxes, capital levies, and an increasingly global personal income tax grounded in the ability-to-pay principle, generally shifting the burden of adjustment onto wealth holders and capital income, notwithstanding some temporary reversals in the interwar period. Notably, the most substantial debt reductions of the century—following both world wars—were achieved through these revenue-based instruments, a pattern that qualifies, at least for Belgium over the long run, the dominant finding that expenditure-based adjustments are generally more durable (Alesina & Ardagna, 2013; Alesina et al., 2017). From the 1980s onward, this paradigm was progressively reversed under an explicitly competitiveness-oriented rationale that eroded PIT progressivity, detached capital income from the global tax base, and shifted the fiscal burden onto consumption and labour—disproportionately affecting middle-income earners. The quantitative indicators presented in Section 3—notably the debt-to-GDP trajectories (Figure 1), the evolving revenue composition (Figure 3, Figure 4, Figure 5, Figure 6 and Figure 7), and the effective tax rate analysis (Figure 8 and Table 2)—provide the empirical foundation for the interpretive claims developed below.
The evidence is consistent with three interrelated mechanisms underlying this secular transformation: the role of mass warfare in legitimising progressive taxation; shifting ideological paradigms and their interaction with monetary and institutional constraints; and the twin processes of internal federalisation and external Europeanisation (Section 4.1, Section 4.2 and Section 4.3). Beyond these substantive mechanisms, a distinct set of institutional dynamics—linguistic party fragmentation and the recurrent use of emergency executive powers—conditioned the pace and procedural form of fiscal adjustments across the period under study (Section 4.4).
Analytically, these mechanisms operate at distinct levels. Mass warfare and macroeconomic shocks constitute the exogenous triggers that created windows for fiscal restructuring, while ideological paradigms mediated the translation of these shocks into specific policy choices—reflecting the role of political agency in selecting among feasible instruments. Federalisation and Europeanisation, in contrast, function as structural constraints that progressively narrowed the institutional space within which such agency could be exercised. This layered architecture explains why structurally similar debt shocks produced markedly different redistributive outcomes across periods, and why the post-2020 crisis response could partially reopen redistributive avenues at the supranational level—a development examined in Section 4.3.
4.1. Mass Warfare and the Conscription of Wealth: Belgian Evidence and Its Limits
The first determinant is the role of mass warfare in generating the political conditions for highly progressive taxation. Scheve and Stasavage (2016) argue that mass military mobilisation—rather than wealth inequality or suffrage extension—creates compensatory demands for a ‘conscription of wealth,’ generating unique windows of political legitimacy for progressive taxation. Their cross-country evidence shows that war-mobilisation countries systematically adopted higher top marginal rates and exceptional levies than non-mobilisation countries, contemporaneously with or shortly after mobilisation.
The Belgian case provides strong confirmatory evidence. After both world wars, fiscal responses to debt surges were explicitly framed in principles of ‘justice,’ ‘equality of sacrifice,’ and ‘national solidarity,’ targeting war profiteers and wealth holders through progressive surtaxes, levies on war profits, and exceptional capital taxes. Crucially, in both episodes these reforms preceded full democratisation—universal male suffrage was introduced in November 1919, after the adoption of the income tax reform and war profits levy, and the post-1945 exceptional taxes were enacted before the 1948 formalisation of universal suffrage including women. This temporal sequence—mass mobilisation, debt surge, progressive tax adoption, and suffrage extension—aligns precisely with Scheve and Stasavage’s model: the experience of shared wartime sacrifice generated normative claims for a symmetrical ‘conscription of wealth,’ legitimising exceptional taxation of capital that would have been politically infeasible in peacetime (Scheve & Stasavage, 2016).
Yet the Belgian trajectory also qualifies aspects of their thesis in three respects. First, the durability of wartime progressive innovations varied significantly: the supertaxe introduced in 1919 was progressively weakened and abolished by 1930, suggesting that post-war redistributive windows can close rapidly absent sustained political coalitions or reinforcing institutions. Second, some of the most ambitious progressive measures were adopted well outside wartime contexts—the 1962 reform consolidating schedular taxes into a global personal income tax was explicitly motivated by a call for fairness and effectiveness, aiming to eliminate unjustified differences in the taxation of various forms of income and to broaden progressive personal taxation (Possoz et al., 2019), while subsequent increases in top marginal rates during the 1960s–1970s reflected the quest to better take into account the ability-to-pay principle, irrespective of any compensatory logic of mass mobilisation (Rigaux, 2026). Third, the three major crises of the twenty-first century—the 2008 financial crisis, the COVID-19 pandemic, and the energy crisis—did not produce any structural shift in the redistributive orientation of fiscal consolidation. Although the Belgian state consented to substantial emergency expenditure in each episode, none of these shocks—which, unlike the world wars, did not entail mass military mobilisation—triggered the kind of fundamental fiscal reform that had followed the two post-war settlements. This absence of structural change lends further support to the centrality of mass warfare in Scheve and Stasavage’s model, while simultaneously underscoring its limits: in the contemporary period, even severe crises generating large debt surges prove insufficient to reopen the redistributive windows that wartime mobilisation once created.
4.2. The Ideological Arc of Fiscal Redistribution: From Interwar Orthodoxy to the Competitiveness Paradigm and Supranational Responses
A second critical determinant is the evolution of economic ideas and policy paradigms within governments and key institutions, particularly the NBB. The interplay between dominant economic doctrines, the institutional positioning of the central bank, and the influence of organized lobbies appears to have shaped the distributive choices embedded in fiscal consolidations.
Following the March 1926 stock market crash, classical and neoclassical monetary orthodoxy formed the dominant intellectual framework of the interwar period. Both the government and the NBB—closely tied to private banking interests—consistently defended the gold standard and prioritised franc stability over domestic reflation (Maes, 2010; Van der Wee & Tavernier, 1975; Vanthemsche, 1978; Watteyne, 2023). This doctrinal commitment translated directly into regressive fiscal outcomes: the progressive surtax was dismantled in favour of debt restructuring, tax relief for capital, and higher indirect taxes. The defence of the gold standard during the Depression further reinforced this pattern, with deflationary adjustments falling disproportionately on wages and social expenditure while shielding mobile capital. These episodes show that even within the broadly progressive first period, conservative monetary orthodoxy—supported by the lobbying power of the Ligue d’intérêt public—could temporarily redirect the burden of adjustment away from capital.
A decisive intellectual shift occurred in the mid-1930s with the gradual diffusion of Keynesian and proto-Keynesian ideas within Belgian policy circles, particularly among economists associated with Louvain. Although full Keynesian policy frameworks were adopted later in Belgium than in many Anglo-Saxon or Scandinavian countries (Buyst, 2012), this intellectual opening nonetheless prefigured the post-1945 institutionalisation of interventionist macroeconomic management and redistributive fiscal policy. After World War II, key policymakers embedded redistributive logics into fiscal design, treating progressive taxation and financial repression as instruments to support reconstruction, sustain aggregate demand, and uphold social cohesion (Buyst, 2012; Maes, 2010; Rigaux, 2026; Watteyne, 2023).
From the late 1970s onward, the Keynesian consensus gave way to a supply-side, competitiveness-oriented paradigm. The 1982 devaluation and accompanying stabilisation measures were conceived not as demand stimulus but as structural adjustment (Maes, 2010; Verplaetse, 2000). Fiscally, the new orientation prioritised reducing the tax burden on mobile capital and internationally exposed firms, while shifting it onto less mobile factors labour and consumption. Politically, socialist participation in government no longer translated into greater tax progressivity, as it arguably had before the 1970s. The PIT reforms of 1988 and 2001—both enacted under coalitions including socialist parties—suggest that reducing the overall tax burden had become electorally more rewarding than strengthening the ability-to-pay principle.
This ideological trajectory closely mirrors both Piketty’s (2014) ‘U-curve’ of wealth inequality and Streeck’s (2015) diagnosis of the transition from the ‘tax state’ to the ‘consolidation state.’ The post-1919 and post-1945 redistributive settlements compressed returns on capital relative to labour, precisely in line with Piketty’s characterisation of the ‘social state’ era. Conversely, the post-1980s erosion of tax progressivity constitutes a country-level illustration of the structural conditions enabling the resurgence of patrimonial capitalism, whereby the rate of return on capital structurally exceeds the rate of economic growth. By prioritising market confidence and competitiveness over domestic redistributive demands, the Belgian state effectively insulated capital from the burden of debt reduction. This shift is corroborated by Swank’s (2006) cross-national data: Belgium’s statutory corporate rate fell from 48% to 40% between 1981 and 1998, and investment incentives were entirely eliminated—part of a systemic transformation in which “the basic goals of tax policy have seemingly shifted from redistribution and interventionism toward efficiency.” Swank attributes this convergence in part to the competitive pressure generated by the 1986 US Tax Reform Act, which drove capital tax cuts across OECD coordinated market economies toward a neoliberal tax structure over the long term.
Following the recent health and energy crises, however, this trajectory shows signs of inflection. The European Union has demonstrated unprecedented legal creativity, enabling Member States to sustain significant expenditure policies while simultaneously securing new revenue streams through mandated solidarity contributions (see Section 4.3).
4.3. Federalism and Europeanisation: The Institutional Reconfiguration of Debt-Reducing Fiscal Policy
The third determinant shaping Belgium’s redistributive trajectory is the twin process of internal federalisation and external Europeanisation, which have jointly reshaped both the locus and the constraints of fiscal policymaking.
Six successive rounds of state reform (1970, 1980, 1988, 1993, 2001, 2014) progressively transferred expenditure responsibilities and revenue powers to the Regions (Flanders, Wallonia, Brussels) and Communities (Flemish, French, German-speaking). The federal government retained competences over social security and taxes directly affecting prices and competitiveness—PIT, corporate income tax, and VAT. Crucially, the federal level continues to bear the bulk of historical public debt, amounting to 81.6% of consolidated debt in 2024 (Eurostat, 2025).
Two principal constraints flow from this federal architecture. First, the asymmetric allocation of fiscal instruments structurally weakens the federal government’s crisis-management capacity. In recessions, the federal authority bears the heaviest fiscal burden—financing social transfers while its principal revenue bases (PIT and VAT) contract—yet it has no access to less mobile tax bases (inheritance and real property duties), which were devolved to the Regions. Second, the constitutionalisation of intergovernmental fiscal arrangements in 1989 compounded this rigidity: the federal government can no longer unilaterally reallocate federated entities’ resources, as it did in 1984 when it repatriated inheritance duties. In this respect, it operates as the inverse of the special powers mechanism: while the latter concentrates executive authority to accelerate crisis response at the expense of ordinary democratic deliberation, the former disperses veto power to safeguard the fiscal autonomy of federated entities, thereby prioritising consensual democratic guarantees over swift budgetary action.
These constraints weigh upon the federal authority, which remains solely accountable before the European Union for limiting deficits and debt. This dynamic prompted, during the Sixth State Reform, the enlistment of federated entities in bearing the costs of historically accumulated and future federal liabilities. Since 2014 in particular, mechanisms have been introduced to hold federated entities financially accountable. Some of these mechanisms are specific. This is the case of the participation in pension costs, whereby federated entities are required to internalize costs that their policy choices partially externalise onto the federal authority. Others are more general in nature, requiring federated entities to contribute to challenges for which the federal state remains legally responsible but in which federated entities play a functional role.
However, these mechanisms produce asymmetric burdens. For Communities, the capping of transfer indexation below economic growth is designed to address ageing-related expenditure, yet it penalises disproportionately those with a larger share of elderly residents—precisely the Communities facing greater demand for care. For Regions, consolidation contributions are proportional to their PIT tax yield, ostensibly aligning the burden with fiscal capacity. Yet the solidarity grant—designed to compensate Regions with lower per capita PIT yields—is itself reduced by the consolidation effort, partially undermining the redistributive logic it was meant to serve.
Paradoxically, Belgium’s internal fragmentation contrasts sharply with the external constraints imposed by European governance. From the 1990s onward, successive layers of EU rules progressively subordinated domestic fiscal sovereignty to supranational coordination: the Treaty on European Union (1992) signed at Maastricht established the 3% deficit and 60% debt reference values that structured Belgium’s consolidation efforts; the Stability and Growth Pact of 1997 (Resolution, 1997; Council Regulation, 1997a, 1997b), reinforced in 2005, tightened surveillance through preventive and corrective arms, structural balance targets and expenditure benchmarks; and, after 2008, the Six-Pack, Two-Pack and the Treaty on Stability, Coordination and Governance (2012) entrenched oversight via sanctions and medium-term budgetary frameworks. As Genschel and Jachtenfuchs show, this dense web of fiscal regulation has developed in a context where the EU still lacks the key action resources of a modern fiscal state—it has no taxing power, cannot issue debt and operates a comparatively small budget—so that what it cannot do through centralised spending, it pursues by constraining national fiscal policies through increasingly intrusive rules, in a pattern they aptly summarise as “more integration, less federation”. Dermine (2020), for his part, reconstructs this pre-COVID configuration as one of predominantly “negative” fiscal integration, in which national budgetary policies are coordinated via EU supervision and surveillance, while “positive fiscal integration, i.e., solidarity through funding, assistance through transfers, remained clearly under-developed, with redistribution and risk-sharing across the Union kept at its lowest”.
For Belgium, these mechanisms simultaneously provided a powerful external justification for domestic austerity—prompting the creation of the Office for Debt Management to minimise borrowing costs under Maastricht criteria and a reorientation of the NBB as the ECB assumed monetary policy—while exposing a structural paradox: a persistently high-debt country placed under continuous pressure to consolidate, yet increasingly unable, due to federal fragmentation, to forge the domestic consensus required to comply.
This fiscal–monetary dynamic shifted dramatically during the COVID-19 pandemic. Extensive ECB bond-purchasing programmes, combined with the activation of the EU’s general escape clause, temporarily dissolved historic fiscal constraints, allowing Member States to finance massive crisis expenditures at unprecedentedly low interest rates. By alleviating the urgency of fiscal adjustment, monetary accommodation removed the political pressure to design redistributive revenue instruments. Governing coalitions were thus able to finance crisis spending entirely through debt accumulation, evading the distributional conflicts that earlier crises had forced onto the political agenda. Ultimately, the dominant paradigm of tax competition and competitiveness had rendered progressive revenue mobilisation politically unthinkable, leaving the federal state incapable of activating autonomous redistributive solidarity. In many respects, this debt-financed crisis management aligns with Streeck’s ‘consolidation state’ model, wherein policy primarily seeks to pacify financial markets while deferring distributional conflicts.
However, the subsequent policy responses to the energy crisis and global tax evasion offer a striking counter-narrative to Streeck’s framework. Indeed, new redistributive and market-correcting impulses have recently emerged not from the domestic arena, but from the supranational level. The EU’s 2022 regulation on the energy crisis mandated solidarity contributions on excess profits, compelling the taxation of crisis rents to support highly indebted public finances. Similarly, Council Directive (2022) implementing the OECD/G20 Pillar Two agreement, imposes a 15% global minimum tax on large multinational enterprises, actively constraining the scope for tax competition. While the pandemic response largely insulated capital and reassured the markets, these recent European mandates explicitly pursue redistributive goals and combat unfair tax competition, forcing reluctant Member States to tax corporate wealth. Moreover, this supranational intervention directly contradicts the trajectory of Belgian federalisation. While the EU attempts to curb unfair tax competition, the transfer of inheritance and estate registration duties to the Belgian Regions has triggered a classic race to the bottom, with federated entities structurally lowering rates to attract the wealthiest tax bases.
The idea that the EU has begun to function as a redistributive counterweight to domestic fiscal paralysis rests on two distinct mechanisms observed in the Belgian case. First, supranational instruments have directly substituted for the federal government’s limited ability to mobilise crisis revenues under conditions of political fragmentation, as shown by the fiscal space created through NGEU grants and loans and by the EU-mandated solidarity contribution on excess energy profits (Dermine, 2020; Fabbrini, 2022). Second, structural tax measures such as the Anti-Tax Avoidance Directive (Council Directive, 2016) and the implementation of Pillar Two tighten supranational constraints on corporate tax competition and slightly expand the room for redistribution at the EU level. In Genschel and Jachtenfuchs’s analysis (2016), they exemplify the gradual integration of core fiscal state powers through EU regulation: the Union increasingly sets binding rules on how Member States may tax and spend without becoming a full-fledged fiscal federation. Read against Beramendi’s analysis of territorially fragmented solidarity, these developments suggest an incipient relocation of redistributive fiscal agency from the national to the supranational level (Beramendi, 2007), but, as Dermine (2020) underscores for SURE and NGEU and as Woźniakowski et al. (2023) emphasise for the post-pandemic EU, they remain embedded in a predominantly regulatory, “negative” model of fiscal integration, leaving unresolved the underlying tension between strong EU constraints on national budgets and weak autonomous EU fiscal capacity.
This evolution seems to prefigure a striking historical inversion. Whereas the post-1919 and post-1945 periods were defined by national progressive fiscal innovations in response to debt crises, the contemporary era sees supranational institutions imposing anti-avoidance and redistributive measures on reluctant Member States constrained by capital mobility. Belgium’s inability to enact autonomous windfall profit taxation illustrates the structural limits to national redistributive capacity in a financially integrated and internally fragmented state.
4.4. Fiscal Decision-Making: Linguistic Fragmentation and the Rise of Emergency Powers
While the preceding sections have identified plausible substantive mechanisms behind Belgium’s redistributive transformation, the timing and procedural form of fiscal adjustments have been shaped by a distinct set of institutional dynamics. This section examines how coalition structures, linguistic fragmentation, and the recurrent use of emergency executive powers have conditioned the pace and modality of fiscal consolidation, without themselves determining its redistributive orientation.
Alesina and Drazen’s (1991) war-of-attrition model predicts that fragmented coalition governments should experience longer delays in fiscal stabilisation, and Roubini et al. (1989) show that multi-party coalition governments accumulated higher deficits during the 1970s and 1980s. The Belgian case, examined over the long run, challenges this prediction on two fronts. First, broad national-union governments proved remarkably proactive during the crises of 1919–1921, 1926, and 1944–1946, suggesting that ideological convergence on the urgency of adjustment can overcome coalition fragmentation. Second, the true constraint on fiscal consensus has been the progressive linguistic division of the Belgian party system, rather than the mere number of parties. The electoral breakthrough of regionalist parties in 1965 (Volksunie, FDF, and RW) weakened the traditional unitary parties (Christian Democrats, Socialists, and Liberals), precipitating their complete split into separate Flemish and Francophone wings by the 1970s (Delwit, 2010; Mabille, 2005). This territorial fragmentation overlaid traditional socio-economic cleavages with deep linguistic ones, while the constitutional requirement of a special parliamentary double majority for state reforms diverted political attention away from fiscal stabilisation. By contrasting the 2010–2011 and 2014–2018 periods, the overriding impact of territorial disputes on fiscal policy becomes evident. The 2010–2011 crisis caused a 541-day deadlock, yet the resulting six-party coalition ultimately delivered a major state reform and more substantial fiscal consolidation than the subsequent five-party government, which lacked any institutional agenda. This demonstrates that linguistic fragmentation, rather than coalition size, is the primary constraint on fiscal capacity—a distinction that is impossible to make when studying only the 1970s–1980s, a period in which both factors intensified simultaneously.
A second institutional regularity is the systematic recourse to executive emergency powers—special powers decrees (1926, 1930s, 1982–1987, 1996, 2020), decree-laws (1944), and framework laws (1990s)—that temporarily concentrated legislative authority in the executive to accelerate stabilisation. As Alesina and Drazen (1991) observe, such delegation enhanced policy coherence but systematically bypassed parliamentary deliberation, producing what J. Smits (1983) termed ‘less democracy for a better economy.’ A striking parallel has emerged at the EU level: during the pandemic and energy crises, the Council and Commission invoked emergency solidarity mechanisms, marginalising the European Parliament and—in the case of energy levies—bypassing the unanimity rule ordinarily governing fiscal matters (Dermine, 2020; Storr & Wallner, 2023; Englisch, 2025). This supranational executive dominance notably departs from Streeck’s (2015) thesis that EU technocratic governance inherently locks in austerity: in this instance, emergency powers were paradoxically deployed to enforce redistributive taxation against corporate interests.
5. Conclusions
This article has traced the redistributive dimension of Belgian crisis-time fiscal policy over more than a century, revealing a fundamental transformation in how successive governments have allocated the burden of debt adjustment. The central finding is a secular shift from explicitly progressive, revenue-based consolidation to a competitiveness-driven model that structurally insulates capital from the costs of fiscal adjustment. Between 1919 and the late 1970s, exceptional debt surges triggered by the two World Wars, the Great Depression, and the oil shocks were mainly met with fiscal instruments explicitly grounded in the ability-to-pay principle: wartime excess-profits taxes, capital levies, progressive income taxation, and financial repression. These measures achieved substantial debt reductions—most notably after 1945. From the early 1980s onward, this paradigm was progressively reversed. Successive consolidations eroded PIT progressivity, detached capital income from the global tax base, and shifted the fiscal burden onto labour and consumption, subordinating redistributive equity to cost competitiveness and capital attraction.
This trajectory is fully consistent with, and helps to unpack, the cross-national evidence surveyed in the introduction. Large-N panel studies show that fiscal consolidations tend to increase inequality, particularly when they rely on spending cuts and the erosion of progressive direct taxation, while progressive, revenue-based packages have more equalising effects. In parallel, institutional assessments point to a structural shift in the effective tax burden away from mobile capital and onto immobile bases such as labour income and consumption, which the Belgian case exemplifies. Yet these contributions, by design, remain agnostic about the political and institutional mechanisms that generate such patterns. By reconstructing a century of crisis-time fiscal choices in a single country, this article has shown how the Belgian trajectory reproduces the inequality-enhancing configuration identified by cross-country panels, while revealing the specific institutional and ideological pathways through which this outcome emerged.
Three mechanisms, examined in turn in Section 4.1, Section 4.2 and Section 4.3, plausibly account for this trajectory. First, mass warfare created unique political windows for progressive taxation—windows that contemporary crises, however severe, have failed to reopen. Second, the ideological arc from interwar monetary orthodoxy through Keynesian interventionism to supply-side consolidation fundamentally reoriented the distributive incidence of fiscal adjustment. Third, internal federalisation constrained the federal government’s autonomous fiscal capacity by transferring immobile tax bases to the Regions and constitutionally protecting intergovernmental fiscal arrangements, even as the federal level retained the bulk of historical debt. Beyond these substantive mechanisms, the timing and procedural form of fiscal adjustments were conditioned by the linguistic fragmentation of the party system—which proved a more consequential obstacle to fiscal consensus than coalition size per se—and the recurrent use of emergency executive powers, which enabled rapid stabilisation at the cost of democratic deliberation. This procedural trade-off, the article has shown, extends to the European Union’s own crisis governance.
Since the COVID-19 and energy crises, a structural paradox has crystallised. Massive crisis expenditures were financed almost entirely through borrowing, with successive federal governments unable or unwilling to mobilise autonomous redistributive revenues. In this context, the European Union assumed a more proactive fiscal role—providing financial assistance, mandating solidarity contributions on energy companies’ windfall profits, and beginning to constrain unfair tax competition through minimum corporate taxation. From the perspective of the core state powers literature, these measures mark a limited shift from purely regulatory to partially capacity-building integration in the fiscal domain. However, the temporary and conditional nature of NGEU, the contested legal basis of the solidarity contribution, and the persistent structural resistance to fiscal centralisation among net-contributor Member States all constrain the durability of this reconfiguration. These supranational interventions represent a notable departure from the conventional view of European integration as an engine of austerity, yet they have not fundamentally altered Belgium’s debt trajectory: at 84.7% of GDP in 2024, federal debt remains above its pre-crisis level, and the country now faces an excessive deficit procedure.
While Belgium constitutes a single-country case, its trajectory resonates with broader patterns identified in the comparative political economy literature. The secular shift from progressive to regressive fiscal adjustment documented here parallels the OECD-wide trend toward flattened income tax structures, broadened consumption tax bases, and reduced top marginal rates that Piketty (2014) and Streeck (2015) have diagnosed at a systemic level and that Swank (2006) has empirically tracked across sixteen OECD democracies as a process of competitive diffusion. Belgium’s experience is particularly instructive because it concentrates, within a single polity, the key structural forces that shaped fiscal redistribution across advanced economies: the fading of wartime egalitarian imperatives, the ascendancy of supply-side economics, the constraints of monetary integration, and the institutional complexities of multi-level governance. The finding that the EU has recently assumed redistributive functions previously exercised at the national level—through mandated solidarity contributions, anti-avoidance directive, and global minimum taxation—contributes to emerging debates on whether supranational institutions can compensate for the erosion of national fiscal sovereignty in an era of capital mobility. These findings suggest that the Belgian case, rather than being sui generis, may serve as a paradigmatic illustration of how the interaction between domestic institutional fragmentation and supranational integration reshapes the distributive capacity of the fiscal state.
Ultimately, this study demonstrates that Belgium’s fiscal model has progressively lost its capacity for autonomous redistributive adjustment. Whether the recent European turn towards mandated solidarity and minimum taxation marks a durable reassertion of progressive fiscal principles—or a transient, crisis-driven deviation—will depend on the evolving balance between market-making and market-correcting logics within EU governance.
Funding
This research received no external funding but was conducted within the framework of a postdoctoral fellowship financed by the Université libre de Bruxelles.
Institutional Review Board Statement
Not applicable.
Informed Consent Statement
Not applicable.
Data Availability Statement
The reconstructed debt-to-GDP series underlying Figure 1 was compiled by the author from multiple historical and institutional sources detailed in Section 2.2 and Appendix A. The underlying dataset is available from the corresponding author upon reasonable request. All other data used in this article are derived from publicly accessible sources—including Eurostat, the Maddison Project Database, Statbel, and OECD—which are cited in full in the reference list.
Acknowledgments
The author wishes to express his gratitude to Daniel Dumont (ULB), Julie Ringelheim (UCL), Dimitri Yernault (ULB), Benoît Bayenet (ULB), Marc Bourgeois (ULiège), Dirk Luyten (Archives de l’Etat), and Cédric Jénart (Universiteit Antwerpen) for the advice they provided during the preparation of the doctoral thesis from which this work is derived.
Conflicts of Interest
The funders had no role in the design of the study; in the collection, analyses, or interpretation of data; in the writing of the manuscript; or in the decision to publish the results.
Abbreviations
The following abbreviations are used in this manuscript:
| BEF | Belgian Franc |
| BFCEGR | Belgian Federal Commission for Electricity and Gas Regulation |
| ECB | European Central Bank |
| ESA | European System of Accounts |
| EU | European Union |
| EUR | Euro |
| FDF | Front Démocratique des Francophones |
| GDP | Gross Domestic Product |
| GNP | Gross National Product |
| IMF | International Monetary Fund |
| NBB | National Bank of Belgium |
| NGEU | NextGenerationEU |
| OECD | Organisation for Economic Co-operation and Development |
| PIT | Personal Income Tax |
| RW | Rassemblement Wallon |
| SFL | Special Financing Law |
| SNCB | National Railway Company of Belgium |
| SURE | Support to mitigate Unemployment Risks in an Emergency |
| TFEU | Treaty on the Functioning of the European Union |
| TSCG | Treaty on Stability, Coordination and Governance |
| TSO | Transmission System Operator |
| VAT | Value Added Tax |
| WWI | World War I |
| WWII | World War II |
Appendix A. Data Sources, Definitions, and Comparability Across Periods
The table below documents the data sources, variable definitions, and breaks in comparability for the reconstructed debt-to-GDP series used throughout this article. Given that the series spans more than a century, it necessarily draws on heterogeneous sources and accounting frameworks. The main breaks occur at two junctures: (i) the shift from parliamentary budget documents and Maddison-reconstructed GDP to government-harmonised retrospective ratios in 1980; and (ii) the adoption of the European System of Accounts (ESA 95, later ESA 2010) from 1995, which redefined the debt perimeter and introduced the consolidated gross debt at face value concept. Given the century-long scope of the series, a period-by-period table capturing the main source regimes and breaks was preferred to an exhaustive year-by-year listing, which would be extremely long without providing proportionate analytical insight. It should be noted that there is no overlap or bridge between source regimes, in the sense that no pair of regimes yields independently constructed debt-to-GDP ratios for the same years. In the absence of such parallel series, direct cross-regime comparison and bridge validation are not used.
Table A1.
Data sources, variable definitions, and comparability for the reconstructed debt-to-GDP series (1912–2024).
References
- Agnello, L., & Sousa, R. M. (2014). How does fiscal consolidation impact on income inequality? Review of Income and Wealth, 60(4), 702–726. [Google Scholar] [CrossRef] [Scilit]
- Aiyagari, S. R., Marcet, A., Sargent, T. J., & Seppälä, J. (2002). Optimal taxation without state-contingent debt. Journal of Political Economy, 110(6), 1220–1254. [Google Scholar] [CrossRef] [Scilit]
- Alesina, A., & Ardagna, S. (2013). The design of fiscal adjustments. Tax Policy and the Economy, 27, 19–67. [Google Scholar] [CrossRef] [Scilit]
- Alesina, A., Barbiero, O., Favero, C., Giavazzi, F., & Paradisi, M. (2017). The effects of fiscal consolidations: Theory and evidence [NBER Working Paper 23385]. NBER. [Google Scholar] [CrossRef] [Scilit]
- Alesina, A., & Drazen, A. (1991). Why are stabilizations delayed? The American Economic Review, 81(5), 1170–1188. [Google Scholar]
- Alesina, A., & Passalacqua, A. (2015). The political economy of government debt [NBER Working Paper 21821]. NBER. [Google Scholar] [CrossRef] [Scilit]
- Arcq, E. (1993). Du pacte social au plan global. Courrier Hebdomadaire du CRISP, 1420–1421(35), 1–61. [Google Scholar] [CrossRef] [Scilit]
- Assal, E.-M., & Verbist, G. (2024). L’importance des changements politiques. In Inégalités en Belgique. Un paradoxe? (A. Decoster, K. Decancq, B. De Rock, & P. Gobbi , Dir.; pp. 94–113). Racine. [Google Scholar]
- Atkinson, A. B., & Stiglitz, J. E. (1976). The design of tax structure: Direct versus indirect taxation. Journal of Public Economics, 6(1–2), 55–75. [Google Scholar] [CrossRef] [Scilit]
- Auerbach, A. J. (2010). Public finance in practice and theory. CESifo Economic Studies, 56(1), 1–20. [Google Scholar] [CrossRef] [Scilit]
- Ball, L., Furceri, D., Leigh, D., & Loungani, P. (2013). The distributional effects of fiscal consolidation [IMF Working Paper 151]. International Monetary Fund. [Google Scholar] [CrossRef] [Scilit]
- Barro, R. J. (1979). On the determination of the public debt. Journal of Political Economy, 87(5), 940–971. [Google Scholar] [CrossRef] [Scilit]
- Baudhuin, F. (1946). Histoire économique de la Belgique, 1914–1939. Bruylant. [Google Scholar]
- Baudhuin, F. (1954). Les conditions générales de l’évolution des finances publiques durant l’entre-deux-guerres. In Institut belge des finances publiques, histoire des finances publiques en Belgique (pp. 35–75). Bruylant-Sirey. [Google Scholar]
- Baukens, M. (2015). Le secteur de l’assurance-chômage et des politiques de l’emploi. In P. Gosseries, & M. Morsa (Eds.), L’impact de la crise sur la sécurité sociale: Droit belge (pp. 167–192). Larcier. [Google Scholar]
- Bayenet, B., Bourgeois, M., & Darte, M. (2017). Les finances et l’autonomie fiscale des entités fédérées après la sixième réforme de l’état. Précis des nouvelles règles de financement des communautés et des régions. Larcier. [Google Scholar]
- Bayenet, B., Bourgeois, M., & Piron, D. (2019). Dette publique et fédéralisme: Le cas de la Belgique. In J.-F. Boudet, & C. Lequesne Roth (Eds.), Les administrations publiques à l’épreuve de leur dette (pp. 109–133). Mare & Martin. [Google Scholar]
- Bayenet, B., & Pagano, G. (2011). Le financement des entités fédérées: Un système en voie de transformation. CRISP. [Google Scholar]
- Belgian Chamber of Representatives. (1913). Situation générale du Trésor public au 1er janvier 1913 (Report submitted by the Minister of Finance, Session of 7 March 1913, n°179). Hayez, Printer of the Chamber of Representatives. [Google Scholar]
- Belgian Chamber of Representatives. (1914). Situation générale du Trésor public au 1er janvier 1914 (Report submitted by the Minister of Finance, Session of 11 March 1914, n°165). Hayez, Printer of the Chamber of Representatives. [Google Scholar]
- Belgian Chamber of Representatives. (1919a). Rapport du Projet de loi établissant un impôt sur le revenu global (Session 1918–1919, n°39). Belgian Chamber of Representatives. [Google Scholar]
- Belgian Chamber of Representatives. (1919b). Projet de loi établissant un impôt sur le revenu global (Full Parliamentary Record. Sitting of 9 October 1919). Belgian Chamber of Representatives. [Google Scholar]
- Belgian Chamber of Representatives. (1919c). Projet de loi établissant un impôt spécial et extraordinaire sur les bénéfices de guerre (Session 1918–1919, n°32). Belgian Chamber of Representatives. [Google Scholar]
- Belgian Chamber of Representatives. (1919d). Projet de loi apportant des modifications aux lois sur les droits de succession, d’enregistrement et de transcription (Session 1918–1919, n°109). Belgian Chamber of Representatives.
- Belgian Chamber of Representatives. (1921). Projet de loi portant création de nouvelles ressources fiscales (Full Parliamentary Record. Sitting of 29 July 1921). Belgian Chamber of Representatives. [Google Scholar]
- Belgian Chamber of Representatives. (1926). Budget des recettes et des dépenses pour l’exercice 1926: Exposé général (Session 1925–1926, n°4). Belgian Chamber of Representatives. [Google Scholar]
- Belgian Chamber of Representatives. (1929). Projet de loi modifiant la législation en matière d’impôts directs (Session 1929–1930, n°13). Belgian Chamber of Representatives. [Google Scholar]
- Belgian Chamber of Representatives. (1931). Projet de loi modifiant les lois coordonnées relatives aux impôts sur les revenus (Session 1931–1932, n°89). Belgian Chamber of Representatives. [Google Scholar]
- Belgian Chamber of Representatives. (1932a). Projet de loi décrétant diverses mesures destinées à assurer l’équilibre du budget et le fonctionnement du service des recettes et des dépenses octroie les pouvoirs spéciaux au gouvernement (Session 1932–1933, n°8). Belgian Chamber of Representatives. [Google Scholar]
- Belgian Chamber of Representatives. (1932b). Projet de loi décrétant diverses mesures destinées à assurer l’équilibre du budget et le fonctionnement du service des recettes et des dépenses (Full Parliamentary Record. Sitting of 27 December 1932). Belgian Chamber of Representatives. [Google Scholar]
- Belgian Chamber of Representatives. (1933). Budget des recettes et des dépenses pour l’exercice 1933: Exposé général (Session 1932–1933, n°4). Belgian Chamber of Representatives. [Google Scholar]
- Belgian Chamber of Representatives. (1935a). Budget des recettes et des dépenses pour l’exercice 1935: Exposé général (Session 1934–1935, n°4). Belgian Chamber of Representatives. [Google Scholar]
- Belgian Chamber of Representatives. (1935b). Projet de loi portant prorogation des lois du 31 juillet et du 7 décembre 1934, attribuant au Roi certains pouvoirs en vue du redressement économique et financier et de l’abaissement des charges publiques (Session 1934–1935, n°83). Belgian Chamber of Representatives. [Google Scholar]
- Belgian Chamber of Representatives. (1945). Projet de loi établissant un impôt sur le capital (Full Parliamentary Record. Sitting of 12 October 1945). Belgian Chamber of Representatives. [Google Scholar]
- Belgian Chamber of Representatives. (1975). Projet de loi relatif aux mesures de redressement économique (Session 1975–1976, n°738/1). Belgian Chamber of Representatives. [Google Scholar]
- Belgian Chamber of Representatives. (1993). Budget des recettes et des dépenses pour l’année budgétaire 1994: Exposé général (Session 1992–1993, n°1177/1). Belgian Chamber of Representatives. [Google Scholar]
- Belgian Chamber of Representatives. (1994). Budget des recettes et des dépenses pour l’année budgétaire 1995: Exposé général (Session 1993–1994, n°1546/1). Belgian Chamber of Representatives. [Google Scholar]
- Belgian Chamber of Representatives. (2011). Budget des recettes et des dépenses pour l’année budgétaire 2012: Exposé général (Session 2011–2012, n°1942/1). Belgian Chamber of Representatives. [Google Scholar]
- Belgian Chamber of Representatives. (2013). Budget des recettes et des dépenses pour l’année budgétaire 2014: Exposé général (Session 2013–2014, n°3069/1). Belgian Chamber of Representatives. [Google Scholar]
- Belgian Chamber of Representatives. (2014). Budget des recettes et des dépenses pour l’année budgétaire 2015: Exposé général (Session 2014–2015, n°494/1). Belgian Chamber of Representatives. [Google Scholar]
- Belgian Chamber of Representatives. (2015). Budget des recettes et des dépenses pour l’année budgétaire 2016: Exposé général (Session 2015–2016, n°1350/1). Belgian Chamber of Representatives. [Google Scholar]
- Belgian Court of Audit. (2006). La vente de patrimoine immobilier par la Régie des bâtiments. Rapport de la cour des comptes transmis à la Chambre des représentants. Available online: https://www.ccrek.be/sites/default/files/Docs/2006_22_RegieDesBatiments.pdf (accessed on 19 February 2026).
- Belgian Court of Audit. (2018). 175e Cahier de la Cour des comptes. Observations et documents soumis à la Chambre des représentants. Volume I—Commentaires. Available online: https://www.ccrek.be/sites/default/files/Docs/175e_c_obs_fed.pdf (accessed on 20 February 2026).
- Belgian Court of Audit. (2022). 179e Cahier—Partie III: Politique budgétaire de l’Etat fédéral. Available online: https://www.ccrek.be/sites/default/files/Docs/179e_c_obs_fed_PartieIII.pdf (accessed on 27 February 2026).
- Belgian Court of Audit. (2023). 180e Cahier—Partie III: Politique budgétaire de l’Etat fédéral. Available online: https://www.ccrek.be/sites/default/files/Docs/180e_c_obs_fed_PartieIII.pdf (accessed on 27 February 2026).
- Belgian Court of Audit. (2024). 181e Cahier—Partie III: Politique budgétaire de l’Etat fédéral. Available online: https://www.ccrek.be/sites/default/files/Docs/181e_c_obs_fed_PartieIII.pdf (accessed on 27 February 2026).
- Belgian Court of Audit. (2025). 182e Cahier—Partie III: Politique budgétaire de l’Etat fédéral. Available online: https://www.ccrek.be/sites/default/files/Docs/2025_43_182e_c_III_PolBud.pdf (accessed on 27 February 2026).
- Belgian Debt Agency. (2017). Annual report 2016. Available online: https://www.debtagency.be/sites/default/files/content/download/files/rpt2016en.pdf (accessed on 24 February 2026).
- Belgian Debt Agency. (2020). Annual report 2019. Available online: https://www.debtagency.be/sites/default/files/content/download/files/rpt2019en.pdf (accessed on 24 February 2026).
- Belgian Federal Commission for Electricity and Gas Regulation (BFCEGR). (2021). Study on the increase in electricity and gas prices in Belgium. Available online: https://www.creg.be/sites/default/files/assets/Publications/Studies/F2289EN.pdf (accessed on 27 February 2026).
- Belgian Federal Commission for Electricity and Gas Regulation (BFCEGR). (2022). Rapport. Évolution des prix en octobre 2022 des différents produits sur le marché de détail par rapport au prix de gros. Available online: https://www.creg.be/sites/default/files/assets/Publications/Reports/RA2305-10FR.pdf (accessed on 6 January 2023).
- Belgian High Council of Finance, Section Public Sector Borrowing Requirement. (2022). Avis en préparation du programme de stabilité 2022–2025. Available online: https://conseilsuperieurdesfinances.be/sites/default/files/publications/csf_fin_avis_2022_04.pdf (accessed on 25 February 2026).
- Belgian Senate. (1945). Projets de loi 1° relatifs aux avoirs monétaires bloqués ou temporairement indisponibles; 2°établissant un impôt spécial sur les bénéfices résultant de fournitures et de prestations à l’ennemi; 3°établissant un impôt extraordinaire sur les revenus, bénéfices et profits exceptionnels réalisés en période de guerre; 4°relatif à l’amnistie fiscale; 5° établissant un impôt sur le capital (Full Parliamentary Record. Sitting of 26 September 1945). Belgian Senate. [Google Scholar]
- Belgian Senate. (1988). Projet de loi portant réforme de l’impôt sur les revenus et modification des taxes assimilées aux timbres (Session 1988–1988, n°440/1). Belgian Senate.
- Benigno, P., Canofari, P., Di Bartolomeo, G., & Messori, M. (2022). The European monetary policy responses during the pandemic crisis. Open Economies Review, 33, 657–675. [Google Scholar] [CrossRef] [Scilit]
- Beramendi, P. (2007). Inequality and the territorial fragmentation of solidarity. International Organization, 61(4), 783–820. [Google Scholar] [CrossRef] [Scilit]
- Bisciari, P., Eugène, B., Melyn, W., Schoonackers, R., Stinglhamber, P., Van Meensel, L., & Van Parys, S. (2015). Analysis of policies for restoring sound Belgian public finances. NBB Economic Review, 71–94. Available online: https://www.nbb.be/doc/ts/publications/economicreview/2015/ecorevi2015_h4.pdf (accessed on 18 February 2026).
- Bismans, F. (1992). Croissance et régulation. La Belgique 1944–1974. In P. Lebrun (Ed.), L’histoire quantitative et développement de la Belgique et de ses régions (2nd Series, Vol. 10, pp. 453–457). Palais des Académies. [Google Scholar]
- Bolt, J., & van Zanden, J. L. (2024). Maddison-style estimates of the evolution of the world economy: A new 2023 update. Journal of Economic Surveys, 39(2), 631–671. [Google Scholar] [CrossRef] [Scilit]
- Buyst, E. (2012). Why was Belgium so late in adopting Keynesian ideas and devising regional development policies? [VIVES Discussion Paper No. 27]. KU Leuven. Available online: https://feb.kuleuven.be/VIVES/publications/discussion_papers/DP2012/discussion-paper-27.pdf (accessed on 16 February 2026).
- Buyst, E. (2018). Le bilan économique de la Première Guerre mondiale. In P. Lierneux, & N. Peeters (Eds.), Au-delà de la grande guerre (pp. 107–114). Racine. [Google Scholar]
- Buyst, E., Smits, J. P. H., & van Zanden, J. L. (1995). National accounts for the low countries, 1800–1990. Scandinavian Economic History Review, 43(1), 53–76. [Google Scholar] [CrossRef] [Scilit]
- Canazza, C., Veille, P., Van Gehuchten, P.-P., & Dorssemont, F. (2012). Belgique/Belgium. In M.-C. Varniol, S. Laulom, E. Mazuyer, & P. Veille (Eds.), Quel droit social dans une Europe en crise? (pp. 107–131). Larcier. [Google Scholar]
- Cassiers, I. (1989). Croissance, crise et régulation en économie ouverte: La Belgique entre les deux guerres. De Boeck. [Google Scholar]
- Cassiers, I., De Villé, P., & Solar, P. (1996). Economic growth in post-war Belgium. In N. Crafts, & G. Toniolo (Eds.), Economic growth in Europe since 1945 (pp. 173–209). Cambridge University Press. [Google Scholar]
- Cassiers, I., & Scholliers, P. (1995). Le pacte social belge de 1944, les salaires et la croissance économique en perspective internationale. In D. Luyten, & G. Vanthemsche (Eds.), Het sociaal pact van 1944. Oorsprong, betekenis en gevolgen. Acta van het historisch luik van het colloquium ‘50 jaar Sociaal Pact’ (pp. 153–177). VUBPress. [Google Scholar]
- Clausing, K. A., Saez, E., & Zucman, G. (2020). Ending corporate tax avoidance and tax competition: A plan to collect the tax deficit of multinationals [SSRN Working Paper]. SSRN. [Google Scholar] [CrossRef] [Scilit]
- Coppée, G. (1954). Évolution des dépenses publiques de 1919 à 1939. In Institut belge des finances publiques, Histoire des finances publiques en Belgique, Tome II (pp. 179–268). Bruylant-Sirey. [Google Scholar]
- Cornille, D., Deroose, M., Godefroid, H., Melyn, W., Stinglhamber, P., & Van Parys, S. (2022). How sustainable are the finances of the federal government, the regions and the communities in Belgium? NBB Economic Review. Available online: https://www.nbb.be/en/media/21387 (accessed on 5 March 2026).
- Council Decision (EU, Euratom) 2020/2053 of 14 December 2020 on the system of own resources of the European Union and repealing decision 2014/335/EU, Euratom. (2020). Available online: https://eur-lex.europa.eu/eli/dec/2020/2053/oj/eng (accessed on 5 March 2026).
- Council Directive (EU) 2016/1164 of 12 July 2016 laying down rules against tax avoidance practices that directly affect the functioning of the internal market. (2016). Available online: https://eur-lex.europa.eu/legal-content/EN/TXT/?uri=CELEX%3A32016L1164&qid=1778119413201 (accessed on 5 March 2026).
- Council Directive (EU) 2022/2523 of 14 December 2022 on ensuring a global minimum level of taxation for multinational enterprise groups and large-scale domestic groups in the Union. (2022). Available online: https://eur-lex.europa.eu/legal-content/EN/TXT/?uri=CELEX%3A32022L2523&qid=1778119465353 (accessed on 5 March 2026).
- Council Regulation (EC) 1466/97 of 7 July 1997 on the strengthening of the surveillance of budgetary positions and the surveillance and coordination of economic policies. (1997a). Available online: https://eur-lex.europa.eu/legal-content/EN/TXT/?uri=celex%3A31997R1466 (accessed on 5 March 2026).
- Council Regulation (EC) 1467/97 of 7 July 1997 on speeding up and clarifying the implementation of the excessive deficit procedure. (1997b). Available online: https://eur-lex.europa.eu/LexUriServ/LexUriServ.do?uri=CONSLEG:1997R1466:20111213:EN:PDF (accessed on 5 March 2026).
- Council Regulation (EU) 2020/672 of 19 May 2020 on the establishment of a European instrument for temporary support to mitigate unemployment risks in an emergency (SURE) following the COVID-19 outbreak. (2020). Available online: https://eur-lex.europa.eu/legal-content/EN/TXT/?uri=CELEX%3A32020R0672&qid=1778119492869 (accessed on 5 March 2026).
- Council Regulation (EU) 2022/1854 of 6 October 2022 on an emergency intervention to address high energy prices. (2022). Available online: https://eur-lex.europa.eu/legal-content/EN/TXT/?uri=CELEX%3A32022R1854&qid=1778119530173 (accessed on 5 March 2026).
- Cournède, B., Goujard, A., & Pina, Á. (2013). How to achieve growth- and equity-friendly fiscal consolidation? A proposed methodology for instrument choice with an illustrative application to OECD countries [OECD Economics Department Working Papers 1088]. OECD. [Google Scholar] [CrossRef]
- Davin, L. (1954). La politique de la dette publique en Belgique de 1919 à 1939. In Institut belge des finances publiques, histoire des finances publiques, Tome II (pp. 291–375). Bruylant-Sirey. [Google Scholar]
- Decoster, A., Perelman, S., Vandelannoote, D., Vanheukelom, T., & Verbist, G. (2015). A bird’s eye view on 20 years of tax-benefit reforms in Belgium [EUROMOD Working Paper 10]. University of Essex, Institute for Social and Economic Research (ISER). Available online: https://www.econstor.eu/handle/10419/113343 (accessed on 19 February 2026).
- Decoster, A., Perelman, S., Vandelannoote, D., Vanheukelom, T., & Verbist, G. (2019). Which way the pendulum swings? Equity and efficiency of three decades of tax-benefit reforms in Belgium [CSB Working Paper 19(07)]. KU Leuven. Available online: https://medialibrary.uantwerpen.be/oldcontent/container2453/files/CSB%20WP%202019/CSBWorkingPaper1907.pdf (accessed on 5 March 2026).
- Decoster, A., & Van Camp, G. (2000). Redistributive effects of the shift from personal income taxes to indirect taxes: Belgium 1988–93 [CES Discussion Paper 00(07)]. KU Leuven. Available online: http://www.andredecoster.be/wp-content/uploads/2000-Decoster-Van-Camp-CES-DP-00.07-Redistributive-Effects-Personal-to-Indirect-taxes.pdf (accessed on 10 March 2026).
- Deffet, M. (1997). Aperçu historique. In Le financement de la sécurité sociale des travailleurs. Revue belge de Sécurité Sociale, 39(2), 287–328. [Google Scholar]
- Delvaux, Y. (1994). La dette publique: Evolution depuis 1989. Courrier Hebdomadaire du CRISP, 1429(4), 1–44. [Google Scholar] [CrossRef] [Scilit]
- Delwit, P. (2010). La vie politique en Belgique de 1830 à nos jours. Éditions de l’Université de Bruxelles. [Google Scholar]
- De Ridder, V. (1947). The Belgian monetary reform. Review of Economic Studies, 38, 51–69. [Google Scholar] [CrossRef] [Scilit]
- De Rijk, L. (1988). Rijksontvangsten. In Histoire des finances publiques en Belgique. 1950–1980, Tome IV-1 (M. Frank, Coord.; pp. 321–403). Bruylant. [Google Scholar]
- Dermine, P. (2020). The EU’s response to the COVID-19 crisis and the trajectory of fiscal integration in Europe: Between continuity and rupture. Legal Issues of Economic Integration, 47(4), 337–358. [Google Scholar] [CrossRef] [Scilit]
- Deschrijver, D. (2023). De wet van 17 oktober 1945 tot de invoering van een belasting op het kapitaal en het vennootschapsrecht. In Gouvernance et responsabilité. Mélanges à la mémoire de Didier Willermain (pp. 407–424). Larcier. [Google Scholar]
- Devereux, M. P., Griffith, R., & Klemm, A. (2002). Corporate income tax reforms and international tax competition. Economic Policy, 17(35), 449–495. [Google Scholar] [CrossRef] [Scilit]
- Docquier, N. (2023). Rémunérations alternatives et réductions de cotisations sociales: Effets sur le financement, la solidarité et l’équité du régime de sécurité sociale des travailleurs salariés. Revue de Droit Social, (2), 245–310. Available online: https://matheo.uliege.be/handle/2268.2/15518 (accessed on 2 April 2026).
- Dumont, D. (2012). La responsabilisation des personnes sans emploi en question. Une étude critique de la contractualisation des prestations sociales en droit belge de l’assurance chômage et de l’aide sociale. La Charte. [Google Scholar]
- Eichengreen, B. (1990). The capital levy in theory and practice [NBER Working Paper 3096]. NBER. Available online: https://www.nber.org/papers/w3096 (accessed on 2 April 2026).
- Englisch, J. (2025). EU excess profits tax ultra vires?: On the limits of article 122 TFEU in EU tax policy. EC Tax Review, 34(3), 88–102. [Google Scholar] [CrossRef] [Scilit]
- European Commission. (n.d.). Belgium’s recovery and resilience plan. Available online: https://reforms-investments.ec.europa.eu/belgiums-recovery-and-resilience-plan_en?prefLang=fr (accessed on 25 February 2026).
- European Commission. (2023). Country report—Belgium [Institutional Paper 225]. Publications Office of the European Union. Available online: https://economy-finance.ec.europa.eu/system/files/2023-06/ip225_en.pdf (accessed on 27 February 2026).
- European Commission. (2025). SURE. Available online: https://economy-finance.ec.europa.eu/eu-financial-assistance/sure_en (accessed on 25 February 2026).
- European Commission, Directorate-General for Economic and Financial Affairs. (2019). Assessment of the 2019 stability programme for Belgium. Available online: https://economy-finance.ec.europa.eu/system/files/2019-06/01_be_sp_assessment_0.pdf (accessed on 24 February 2026).
- Eurostat. (2025). Government consolidated gross debt (ESA 2010). S1311 Central government. Dataset gov_10dd_edpt1. Available online: https://ec.europa.eu/eurostat/databrowser/view/gov_10dd_edpt1__custom_18485679/default/table (accessed on 24 February 2026).
- Everaert, G., Heylen, F., & Schoonackers, R. (2015). Fiscal policy and TFP in the OECD: Measuring direct and indirect effects. Empirical Economics, 49(2), 605–640. [Google Scholar] [CrossRef] [Scilit]
- Eyskens, G. (1955). Les finances publiques belges depuis la libération. In Institut belge des finances publiques, histoire des finances publiques en Belgique, Tome III (pp. 357–460). Bruylant-Sirey. [Google Scholar]
- Fabbrini, F. (2022). The legal architecture of the economic responses to COVID-19: EMU beyond the pandemic. Journal of Common Market Studies, 60(1), 186–203. [Google Scholar] [CrossRef] [Scilit]
- Federal Government of Belgium. (2011). Accord de gouvernement. Available online: https://www.lachambre.be/kvvcr/pdf_sections/searchlist/Accord_de_Gouvernement_1er_decembre_2011.pdf (accessed on 20 February 2026).
- Ferreiro, J., & Serrano, F. (2021). The COVID health crisis and the fiscal and monetary policies in the euro area. International Journal of Political Economy, 50(3), 212–225. [Google Scholar] [CrossRef] [Scilit]
- Festjens, M. J. (1993). De ontwikkeling van de sociale zekerheid 1980–1990. In Institut belge des finances publiques, histoire des finances publiques en Belgique. Tome V: La période 1980–1990 (pp. 223–358). Academia Press. [Google Scholar]
- Frangiamore, F., Furceri, D., Giannone, D., Kisat, F., & Pizzuto, P. (2025). The effects of fiscal consolidations on the debt distribution [IMF Working Paper 201]. International Monetary Fund. [Google Scholar]
- Frank, M. (1989). La réforme de l’impôt sur le revenu. Problèmes d’équité. Courrier Hebdomadaire du CRISP, 1236(11), 1–47. [Google Scholar] [CrossRef] [Scilit]
- Fullerton, D., & Metcalf, G. E. (2002). Tax incidence. In A. Auerbach, & M. Feldstein (Eds.), Handbook of public economics (Vol. 4, pp. 1787–1872). Elsevier. [Google Scholar] [CrossRef] [Scilit]
- Ganghof, S. (2006). The politics of income taxation: A comparative analysis. ECPR Press. [Google Scholar]
- Genschel, P., & Jachtenfuchs, M. (2016). More integration, less federation: The European integration of core state powers. Journal of European Public Policy, 23(1), 42–59. [Google Scholar] [CrossRef] [Scilit]
- Genser, B. (2006). The dual income tax: Implementation and experience in European countries [International Studies Program Working Paper No. 06-25]. Andrew Young School of Policy Studies, Georgia State University. Available online: https://ideas.repec.org/p/ays/ispwps/paper0625.html (accessed on 31 March 2026).
- George, A. L., & Bennett, A. (2005). Case studies and theory development in the social sciences. MIT Press. [Google Scholar]
- Gérard, M., & Valenduc, C. (1993). Les recettes fiscales au cours des années 80. In Institut belge des finances publiques, histoire des finances publiques en Belgique. Tome V: La période 1980–1990 (pp. 115–192). Academia Press. [Google Scholar]
- Ghailani, D., & Vanhercke, B. (2015). The impact of the crisis on fundamental rights across member states of the EU, country report on Belgium. Policy Department of European Parliament. Available online: https://www.europarl.europa.eu/RegData/etudes/STUD/2015/510015/IPOL_STU(2015)510015_EN.pdf (accessed on 20 February 2026).
- Hardewyn, A. (1997). De invoering en de evolutie van de progressieve inkomstenbelasting in België (1919–1930). Revue Belge de Philologie et d’Histoire, 75(4), 1085–1122. [Google Scholar] [CrossRef] [Scilit]
- Hebous, S., Prihardini, D., & Vernon, N. (2022). Excess profit taxes: Historical perspective and contemporary relevance [IMF Working Paper 2022/187]. International Monetary Fund. [Google Scholar] [CrossRef] [Scilit]
- Heipertz, M., & Verdun, A. (2010). Ruling Europe: The politics of the stability and growth pact. Cambridge University Press. [Google Scholar]
- Hemerijck, A., & Marx, I. (2010). Continental welfare at a crossroads: The choice between activation and minimum income protection in Belgium and the Netherlands. In B. Palier (Ed.), A long goodbye to bismarck? The politics of welfare reforms in continental Europe (pp. 129–156). Amsterdam University Press. [Google Scholar]
- International Monetary Fund. (2011). Belgium: Selected issues [IMF Country Report 82]. International Monetary Fund. [Google Scholar] [CrossRef] [Scilit]
- International Monetary Fund. (2019). Belgium: 2019 [IMF country report 74]. International Monetary Fund. [Google Scholar] [CrossRef] [Scilit]
- International Monetary Fund. (2023). Belgium: 2022 [IMF country report 94]. International Monetary Fund. [Google Scholar] [CrossRef] [Scilit]
- Jevons, W. S. (1888). The theory of political economy (3rd ed.). MacMillan. [Google Scholar]
- Kaplow, L. (2007). Taxation. In A. M. Polinsky, & S. Shavell (Eds.), Handbook of law and economics (Vol. 1, pp. 647–755). Elsevier. [Google Scholar]
- Kickert, W. (2012). State responses to the fiscal crisis: Belgium. Public Money & Management, 32(4), 303–310. [Google Scholar] [CrossRef] [Scilit]
- Lee, Y. (2021). Averting the fallouts of the great recession in Belgium and the Netherlands: A research note. Public Organization Review, 21(3), 409–418. [Google Scholar] [CrossRef] [Scilit]
- Leonardi, M., & Mazzotti, F. (2021). SURE. A European success story in the pandemic. Rivista Internazionale di Scienze Sociali, 129(1), 37–44. [Google Scholar] [CrossRef] [Scilit]
- Luyten, D. (2014). Post-war economies (Belgium). In 1914–1918-online: International encyclopedia of the First World War. Freie Universität Berlin. Available online: https://encyclopedia.1914-1918-online.net/article/post-war-economies-belgium/ (accessed on 3 March 2026).
- Mabille, X. (2005). Le parti socialiste. Évolution 1978–2005. Courrier Hebdomadaire du CRISP, 1867–1868(2), 5–65. [Google Scholar] [CrossRef] [Scilit]
- Maes, I. (2010). A century of macroeconomic and monetary thought at the National Bank of Belgium. National Bank of Belgium. [Google Scholar] [CrossRef] [Scilit]
- Maes, I., & Buyst, E. (2009). Financial crisis and regulation: An overview of the Belgian experience. In A. Gigliobianco, & G. Toniolo (Eds.), Financial market regulation in the wake of financial crises: The historical experience (pp. 95–117). Banca d’Italia. [Google Scholar]
- Malherbe, J. (2011). La fraude fiscale et sa sanction en Belgique: État des lieux et propositions de réforme. Studi Tributari Europei, 3(1), 1–13. [Google Scholar] [CrossRef] [Scilit]
- Martucci, F. (2020). «Ce n’est pas de la dette, c’est de l’investissement»: Des coronabonds aux obligations du plan de relance. Revue des Affaires Européennes, 303(2), 299–313. [Google Scholar]
- Marx, I., & Schuerman, N. (2016). Belgium, or how inertia can have unexpected benefits in times of crisis. In K. Schubert, P. de Villota, & J. Kuhlmann (Eds.), Challenges to European welfare systems (pp. 281–303). Springer. [Google Scholar]
- Marx, I., & Van Cant, L. (2020). Belgium’s welfare system: Still lagging after all these years. In S. Blum, J. Kuhlmann, & K. Schubert (Eds.), The Routledge handbook of European welfare systems (2nd ed., pp. 38–56). Routledge. [Google Scholar] [CrossRef] [Scilit]
- Masoin, M. (1954). Les recettes publiques de 1919 à 1939. In Institut belge des finances publiques. Histoire des Finances Publiques en Belgique, Tome II (pp. 117–177). Bruylant-Sirey. [Google Scholar]
- Mommen, A. (1994). The Belgian economy in the twentieth century. Routledge. [Google Scholar]
- Morsa, M. (2015). Le régime des pensions. In P. Gosseries, & M. Morsa (Eds.), L’impact de la crise sur la sécurité sociale: Droit belge (pp. 245–279). Larcier. [Google Scholar]
- Musgrave, R., & Musgrave, P. (1989). Public finance in theory and practice (5th ed.). McGraw Hill. [Google Scholar]
- National Bank of Belgium. (1928). Rapport annuel sur les opérations de 1927. National Bank of Belgium. Available online: https://www.nbb.be/doc/ts/publications/nbbreport/archives/bnb1927ra.ihqc.pdf (accessed on 10 February 2026).
- National Bank of Belgium. (1944). Aperçu de la situation économique de la Belgique au début de septembre 1944. Bulletin d’information et de documentation de la Banque Nationale de Belgique, XIX(1), 5–20. [Google Scholar]
- National Bank of Belgium. (1945). Exposé général de la situation financière. Bulletin d’information et de documentation de la Banque Nationale de Belgique, 1(6), 301–409. [Google Scholar]
- National Bank of Belgium. (2017). Incidence macroéconomique et budgétaire du scénario de tax shift révisé par le cabinet du ministre des finances et comparaison avec l’exercice de novembre 2015. Available online: https://www.nbb.be/doc/ts/publications/other/ds1707320fr.pdf (accessed on 24 February 2026).
- O’Donovan, N. (2021). One-off wealth taxes: Theory and evidence. Fiscal Studies, 42(3–4), 565–597. [Google Scholar] [CrossRef] [Scilit]
- OECD. (2009). OECD economic surveys: Belgium 2009. OECD Publishing. [Google Scholar] [CrossRef] [Scilit]
- OECD. (2013). Addressing base erosion and profit shifting. OECD Publishing. [Google Scholar] [CrossRef] [Scilit]
- OECD. (2026). Revenue Statistics in OECD member countries—Comparative tax revenues. Belgium. S13 general government. Dataset DSD_REV_COMP_OECD. Available online: https://data-explorer.oecd.org/?lc=en (accessed on 5 March 2026).
- Orsini, K. (2005). The 2001 Belgian tax reform: Equity and efficiency [Center for Economic Studies Discussion Paper 05.04]. SSRN. [Google Scholar] [CrossRef] [Scilit]
- Pacolet, J. (2019). ESPN thematic report on financing social protection: Belgium. European Commission. Available online: https://hiva.kuleuven.be/nl/nieuws/docs/espn-be-financing-social-protection-2019.pdf (accessed on 6 February 2026).
- Pensieroso, L. (2007). The great depression in Belgium from a neoclassical perspective [Discussion Paper 2007-25 of Département des Sciences économiques de l’Université catholique de Louvain]. Available online: https://sites.uclouvain.be/econ/DP/IRES/2007-25.pdf (accessed on 12 February 2026).
- Piketty, T. (2014). Capital in the twenty-first century. Harvard University Press. [Google Scholar]
- Pirard, J. (1999). L’extension du rôle de l’État en Belgique aux XIXe et XXe siècles. Palais des Académies. [Google Scholar]
- Piron, D. (2013). Le cadre institutionnel de l’assainissement des finances publiques en Belgique. Bulletin de Documentation du SPF Finances, 73(3), 139–176. [Google Scholar]
- Possoz, M., Buytaert, B., & Traversa, E. (2019). The 100th anniversary of the Belgian income tax. Intertax, 47(12), 1103–1107. [Google Scholar] [CrossRef] [Scilit]
- Regulation (EU) 2021/241 of the European parliament and of the council of 12 February 2021 establishing the recovery and resilience facility. (2021). Available online: https://eur-lex.europa.eu/legal-content/EN/TXT/?uri=CELEX%3A32021R0241&qid=1613653807673 (accessed on 5 March 2026).
- Regulation (EU) 549/2013 of the European parliament and of the council of 21 May 2013 on the European system of national and regional accounts in the European Union. (2013). Available online: https://www.legislation.gov.uk/eur/2013/549/body/2013-05-21 (accessed on 5 March 2026).
- Reinhart, C. M., & Rogoff, K. S. (2009). This time is different: Eight centuries of financial folly. Princeton University Press. [Google Scholar]
- Reinhart, C. M., & Sbrancia, M. B. (2015). The liquidation of government debt [IMF Working Paper 15(7)]. International Monetary Fund. [Google Scholar] [CrossRef] [Scilit]
- Report to the Regent. (1944, October 7). Decree-law relatif aux billets de la Banque nationale de Belgique et aux dépôts d’argent en monnaie nationale of 6 October 1944. Belgian Official Gazette. [Google Scholar]
- Resolution of the European council on the stability and growth pact Amsterdam. (1997, June 17). Available online: https://eur-lex.europa.eu/legal-content/EN/ALL/?uri=LEGISSUM:l25021 (accessed on 5 March 2026).
- Rigaux, L. (2026). La solidarité en Belgique. Histoire des mécanismes juridiques de redistribution entre personnes et entre territoires (1830–2024). Anthémis. [Google Scholar]
- Roubini, N., Sachs, J., Honkapohja, S., & Cohen, S. (1989). Government spending and budget deficits in industrial countries. Economic Policy, 4(8), 100–132. [Google Scholar] [CrossRef] [Scilit]
- Scheve, K., & Stasavage, D. (2016). Taxing the rich: A history of fiscal fairness in the United States and Europe. Princeton University Press. [Google Scholar]
- Schoysman, J. (1974). L’évolution de l’idée de la progressivité dans l’impôt en Belgique et son reflet dans la politique belge (1830–1919). In M.-A. Arnould, G. Despy, & D. Ghéret (Eds.), Recherches sur l’histoire des finances publiques en Belgique, volume II (pp. 341–392). Éditions de l’Université de Bruxelles. [Google Scholar]
- Simar, L. (2016). Le «tax shift» ou glissement fiscal. Courrier Hebdomadaire du CRISP, 2319–2320(34–35), 1–64. [Google Scholar] [CrossRef] [Scilit]
- Smits, J. (1983). Belgian politics in 1982: Less democracy for a better economy. Res Publica, 25(2–3), 181–217. [Google Scholar] [CrossRef] [Scilit]
- Smits, J. P., Woltjer, P. J., & Ma, D. (2009). A dataset on comparative historical national accounts: A time-series perspective. Belgium 1835–1990 (Groningen Growth and Development Centre Research Memorandum GD-107). University of Groningen. Available online: https://www.rug.nl/ggdc/historicaldevelopment/na/?lang=en (accessed on 6 February 2026).
- Starke, P., Kaasch, A., & Hooren, F. (2013). The welfare state as crisis manager: Explaining the diversity of policy responses to economic crisis. Palgrave Macmillan. [Google Scholar] [CrossRef] [Scilit]
- Statbel. (n.d.). Table B.1: Répartition par fractions interdéciles du revenu total net imposable, de l’impôt et du taux moyen d’imposition. Available online: https://statbel.fgov.be/fr/themes/menages/revenus-fiscaux/plus (accessed on 4 March 2026).
- Statbel. (2023). Statistique fiscale des revenus soumis à l’impôt des personnes physiques et à l’impôt des non-résidents. Available online: https://wiki.statbel.fgov.be/wiki/S321.A1_fr (accessed on 4 March 2026).
- Storr, S., & Wallner, J. (2023). EU emergency measures in energy law. Prawo, 337, 163–183. [Google Scholar] [CrossRef] [Scilit]
- Streeck, W. (2015). The rise of the European consolidation state [MPIfG Discussion Paper 15(1)]. Available online: https://www.econstor.eu/bitstream/10419/107091/1/81811505X.pdf (accessed on 15 February 2026).
- Styczen, M. P. (2010). Financial centers in Belgium. A comprehensive case study of multinationals’ financial centers in Belgium [SNF Working Paper 31]. Available online: https://snf.no/media/n1hhc2gj/an31_10.pdf (accessed on 19 February 2026).
- Swank, D. (2006). Tax policy in an era of internationalization: Explaining the spread of neoliberalism. International Organization, 60(4), 847–882. [Google Scholar] [CrossRef] [Scilit]
- Sørensen, P. B. (2007). The Nordic dual income tax: Principles, practices, and relevance for Canada. Canadian Tax Journal/Revue Fiscale Canadienne, 55(3), 557–602. [Google Scholar]
- Treaty on European Union, signed at Maastricht on 7 February 1992. (1992, July 29). Official Journal of the European Communities. C191.
- Treaty on stability, coordination and governance in the economic and monetary union. (2012). Available online: https://eur-lex.europa.eu/legal-content/EN/TXT/?uri=legissum:1403_3 (accessed on 19 February 2026).
- Valenduc, C. (2019). La politique fiscale: De nouvelles orientations. Reflets et Perspectives de la vie Économique, LVIII(1), 39–67. [Google Scholar] [CrossRef] [Scilit]
- Van der Wee, H., & Tavernier, K. (1975). La Banque Nationale de Belgique et l’histoire monétaire entre les deux guerres mondiales. Banque Nationale de Belgique. [Google Scholar]
- Van der Wee, H., & Verbreyt, M. (2009). A small nation in the turmoil of the Second World War: Money, finance and occupation (Belgium, its enemies, its friends, 1939–1945). Leuven University Press. [Google Scholar]
- Van Esbroeck, D., & Buyst, E. (2025). Public debt in a federal state: Warnings from Belgium. Kyklos, 78(3), 1105–1123. [Google Scholar] [CrossRef] [Scilit]
- Van Praag, H. (1996). L’assainissement monétaire au lendemain de la seconde guerre mondiale: L’opération Gutt en Belgique—La politique du Général de Gaulle en France. Revue de la Banque—Supplément Historique, 3–37. Available online: https://bib.kuleuven.be/rbib/collectie/archieven/bankfin/1996-feb-supp.pdf (accessed on 4 March 2026).
- Vanthemsche, G. (1978). De val van de regering Poullet-Vandervelde: Een ‘samenzwering der bankiers’? Belgisch Tijdschrift voor Nieuwste Geschiedenis, 9(1–2), 165–214. [Google Scholar]
- Verplaetse, A. (2000). Van devaluatie tot euro: Het economische en meer bepaald het monetaire beleid van België 1980–2000. Res Publica, 42(1), 3–21. [Google Scholar] [CrossRef] [Scilit]
- Walras, L. (1896). Études d’économie sociale. Théorie de la répartition de la richesse sociale. Rouge-Pichon. [Google Scholar]
- Watteyne, S. (2023). Lever l’impôt en Belgique. Une histoire de combats politiques (1830–1962). CRISP. [Google Scholar]
- Wong, Y.-C. (2023). Fiscal consolidation in Belgium: How much and by what means? [IMF Selected Issues Paper 064]. International Monetary Fund. [Google Scholar]
- Woo, J., Bova, E., Kinda, T., & Zhang, Y. S. (2013). Distributional consequences of fiscal consolidation and the role of fiscal policy: What do the data say? [IMF Working Paper 13(195)]. International Monetary Fund. [Google Scholar] [CrossRef] [Scilit]
- Woźniakowski, T. P., Zgaga, T., & Fabbrini, S. (2023). Comparative fiscal federalism and the post-Covid EU: Between debt rules and borrowing power. Politics and Governance, 11(4), 1–5. [Google Scholar] [CrossRef] [Scilit]
- Yernault, D. (2013). L’état et la propriété. Le droit public économique par son histoire (1830–2012). Larcier. [Google Scholar]

Disclaimer/Publisher’s Note: The statements, opinions and data contained in all publications are solely those of the individual author(s) and contributor(s) and not of MDPI and/or the editor(s). MDPI and/or the editor(s) disclaim responsibility for any injury to people or property resulting from any ideas, methods, instructions or products referred to in the content. |
© 2026 by the author. Licensee MDPI, Basel, Switzerland. This article is an open access article distributed under the terms and conditions of the Creative Commons Attribution (CC BY) license.