


Abstract
The creative economy has become an important driver of innovation and sustainable economic growth, yet evidence on its economy-wide and regional effects remains limited. This study evaluates Thailand’s 2009 Creative Economy Policy by integrating a Bayesian Difference-in-Differences (B-DID) model with a Dynamic Computable General Equilibrium (Dynamic CGE) model. The B-DID model estimates a posterior mean treatment effect of approximately 7.22% on GDP; however, the 95% Bayesian credible interval includes zero, indicating inconclusive statistical evidence. The Dynamic CGE model uses a 7.224% Total Factor Productivity (TFP) shock as a benchmark calibration scenario rather than a direct conversion of GDP growth. National simulations indicate increases in GDP, household income, government revenue, investment, capital stock, sectoral output, and consumption, while trade patterns remain broadly unchanged. Regional simulations reveal different responses under TFP shocks ranging from 0% to 11%, with Southern Thailand showing the strongest and most sustained responses, followed by Central, Northern, and Northeastern Thailand, respectively. These findings highlight the importance of regional economic structures and support place-based strategies alongside national creative economy policies. Overall, this study demonstrates the value of integrating empirical policy estimation with Dynamic CGE simulations to assess economy-wide and regional policy effects.
1. Introduction
Over the past two decades, the foundations of economic growth have undergone a profound transformation. While natural resources, industrial production, and physical capital remain important drivers of development, they are no longer sufficient to sustain long-term economic competitiveness in an increasingly knowledge-based global economy. Instead, economic value is increasingly created through innovation, creativity, knowledge, and digital technologies, giving rise to the creative economy as a new engine of sustainable growth. Creative industries generate value by transforming intellectual capital, cultural assets, and technological innovation into high-value goods and services, thereby promoting productivity, employment, entrepreneurship, and international competitiveness (Boix-Domènech & Rausell-Köster, 2018; Innocenti & Lazzeretti, 2019; Manioudis & Angelakis, 2023). Consequently, many countries have incorporated creative economy strategies into their national development agendas to foster innovation-led and sustainable economic growth. Thailand has followed the global transition towards a knowledge-based economy by incorporating creativity and innovation into its national development agenda. The Creative Economy Policy announced in 2009 identified four broad areas of intervention: creative infrastructure; creative education and human-resource development; creative society and inspiration; and creative business development and investment. These areas reflected the government’s intention to strengthen the enabling environment for creative industries, develop human capabilities, encourage creative activities, and support creative businesses. Thailand’s creative-economy agenda subsequently evolved alongside broader development strategies, including Thailand 4.0 and the Bio-Circular-Green (BCG) Economy Model, which emphasize innovation, digital transformation, higher-value-added production, and resource efficiency (Chaiboonsri, 2024). Moreover, the Thai government has continuously played a significant role in supporting the creative economy policy by establishing the Creative Economy Agency (Public Organization) in 2018. Afterward, the government expanded this agency into many areas across Thailand, such as CEA branches in Chiang Mai, Khon Kaen, and Songkhla, respectively.
Importantly, evidence from the period immediately preceding the 2009 policy provides a useful quantitative baseline for assessing the subsequent development of Thailand’s creative economy. Based on 2008 data, the Fiscal Policy Research Institute and Kenan Institute Asia (2009) estimated that nine selected creative industries generated approximately THB 1.068 trillion in economic contribution, equivalent to 9.53% of GDP under the study’s contribution measure, while their value added represented approximately 2.86% of GDP. These industries employed approximately 875,500 workers, corresponding to 2.42% of Thailand’s workforce. In addition, exports of selected creative industries amounted to approximately THB 429.7 billion, or 7.34% of total exports. These figures indicate that creative activities already represented a substantial component of Thailand’s economy before the introduction of the national Creative Economy Policy in 2009, providing an important pre-policy benchmark for evaluating subsequent economic effects (Fiscal Policy Research Institute & Kenan Institute Asia, 2009).
Despite the growing policy emphasis on the creative economy, its economy-wide and regional effects in Thailand remain insufficiently established empirically. Previous studies have examined the relationships between creativity, innovation, tourism, cultural industries, and economic performance, but have often focused on specific industries or relied on descriptive analyses (Boğa & Topcu, 2020; Rodríguez-Insuasti et al., 2022). Consequently, limited evidence is available on how creative-economy policies influence aggregate economic performance, sectoral production, investment, household welfare, and regional development over time. A related methodological gap is that econometric and Computable General Equilibrium (CGE) approaches are often applied separately. Econometric methods, particularly Difference-in-Differences (DID), can estimate policy effects using observed data (Bertrand et al., 2004; Angrist & Pischke, 2009; Callaway & Sant’Anna, 2021; Goodman-Bacon, 2021; Roth et al., 2023), whereas CGE models capture intersectoral linkages and economy-wide adjustments under specified policy scenarios (Hosoe et al., 2010; Dixon & Jorgenson, 2013a; Dixon & Rimmer, 2010; Cicowiez & Lofgren, 2017; Britz & Roson, 2019).
Integrating these approaches provides an opportunity to connect empirical policy evaluation with the simulation of broader economic consequences. This study therefore combines Bayesian Difference-in-Differences (B-DID) estimation with a Dynamic CGE model to examine the potential macroeconomic, sectoral, and regional implications of Thailand’s 2009 Creative Economy Policy.
To address these research gaps, this study develops a hybrid analytical framework that integrates Bayesian Difference-in-Differences (DID) estimation with a Dynamic Computable General Equilibrium (Dynamic CGE) model. First, the B-DID model estimates the causal effect of Thailand’s 2009 creative economy policy using observed data. The estimated treatment effect is subsequently used to inform a benchmark policy scenario in the Dynamic CGE model, allowing the analysis to move beyond causal policy evaluation toward economy-wide simulation of macroeconomic, sectoral, household, trade, and regional outcomes. Unlike previous studies that rely exclusively on either econometric analysis or CGE modeling, this integrated framework combines empirical policy estimation with structural economic simulation, providing a more comprehensive assessment of both the direct and indirect effects of Thailand’s creative economy policy. In addition, the study examines regional heterogeneity by comparing policy impacts across Thailand’s major regions, thereby generating policy-relevant evidence to support more balanced and inclusive regional development.
2. Literature Review
2.1. Evolution and Conceptual Foundations of the Creative Economy
The creative economy has emerged as a defining feature of knowledge-based economic development, where economic value is increasingly generated through creativity, innovation, knowledge, and intellectual capital rather than merely through natural resources or physical capital. It encompasses a broad range of activities, including cultural industries, design media, software, digital technologies, and creative services in which ideas and intellectual property become key drivers of production, value creation, and competitiveness (Boix-Domènech & Rausell-Köster, 2018; Innocenti & Lazzeretti, 2019; Manioudis & Angelakis, 2023). The concept gained international recognition during the late 1990s as governments began to acknowledge that creative and cultural industries could contribute not only to preserving cultural heritage but also to generating employment, innovation, exports, and economic growth (Boğa & Topcu, 2020). Since then, the creative economy has expanded beyond traditional cultural sectors to include a wider range of knowledge-intensive industries supported by digital technologies, innovation, and entrepreneurship (Chang et al., 2021; Dellisanti, 2023). International organizations, particularly UNCTAD and UNESCO, further emphasize that the creative economy promotes economic growth while fostering social inclusion, cultural diversity, entrepreneurship, and technological advancement. The growing importance of the creative economy is closely linked to the global transition towards knowledge-based economies. Advances in digital technologies, artificial intelligence, and information and communication technologies have transformed how economic value is created, shifting production towards intangible assets such as knowledge, innovation, intellectual property, and digital content.
This revolution has enabled countries to diversify their economies, improve productivity, strengthen international competitiveness, and generate high-value employment opportunities (Comunian et al., 2021; Chang et al., 2021; Cunningham & McCutcheon, 2023). More recently, the creative economy has been recognized as an important contributor to sustainable development. By encouraging innovation, entrepreneurship, productive employment, and inclusive industrialization, creative industries support several Sustainable Development Goals (SDGs) while strengthening local economies and promoting long-term economic resilience (Manioudis & Angelakis, 2023; Dellisanti, 2025).
Consequently, many governments have incorporated creative economy strategies into their national development agendas through investments in innovation systems, digital infrastructure, education, entrepreneurship, and intellectual property protection. As literature has evolved, scholarly attention has shifted from defining the creative economy to understanding the mechanisms through which creative industries influence productivity, innovation, entrepreneurship, and structural transformation. This shift provides the theoretical foundation for examining the creative economy as a driver of sustainable economic growth, which is discussed in the following section.
2.2. The Creative Economy as a Driver of Economic Growth
The creative economy has increasingly been recognized as an important source of economic growth, extending its role beyond cultural preservation and artistic expression. Unlike conventional industries that depend primarily on physical resources and standardized production processes, creative industries generate value through knowledge, innovation, intellectual capital, technological advancement, and human creativity. These characteristics enable them to produce high-value goods and services while promoting productivity, competitiveness, and sustainable economic development (Boix-Domènech & Rausell-Köster, 2018; Innocenti & Lazzeretti, 2019; Chang et al., 2021; Manioudis & Angelakis, 2023). The relationship between the creative economy and economic growth is strongly supported by endogenous growth theory, which identifies knowledge, innovation, human capital, and technological progress as fundamental drivers of long-term productivity growth. Within this framework, creative industries stimulate broader economic development by generating new ideas, encouraging entrepreneurship, accelerating technological diffusion, and improving production processes. As knowledge spreads across industries, innovation spillovers enhance productivity, strengthen industrial competitiveness, and facilitate structural transformation throughout the economy (Acemoglu et al., 2018; Furman et al., 2002; Nelson, 2004; Malerba & McKelvey, 2020). Empirical research further demonstrates that regions characterized by stronger innovation ecosystems and higher concentrations of creative industries generally exhibit greater productivity, resilience, and long-term economic performance (Feldman, 1999, 2014; Audretsch & Feldman, 2004; Boschma, 2004). Creative spillovers occur when knowledge, technologies, skills, and innovative practices generated within creative industries are transferred to other sectors of the economy. These spillovers can operate through knowledge exchange, worker mobility, collaboration among firms, digital technologies, product innovation, and inter-sectoral linkages (Romer, 1990; Cohen & Levinthal, 1990). For example, innovations in design, digital content, branding, and information technology can improve productivity in manufacturing, tourism, agriculture, retail, and business services. However, the ability of regions to benefit from external knowledge depends on their absorptive capacity, human capital, innovation systems, and institutional environment (Cohen & Levinthal, 1990; Miguélez & Moreno, 2015). Consequently, regions with stronger human capital, digital infrastructure, innovation networks, and linkages with creative industries are more likely to convert creative-sector knowledge into productivity gains, whereas regions with weaker absorptive capacity may experience smaller effects from the same national productivity shock (Miguélez & Moreno, 2015; Wen et al., 2023). This provides a theoretical basis for expecting heterogeneous regional responses to a common creative-economy policy shock. Beyond innovation, the creative economy contributes directly to employment generation and entrepreneurship. These industries rely heavily on skilled labor and create opportunities for designers, engineers, software developers, digital content creators, architects, artists, and other knowledge-intensive professionals. Their expansion also stimulates indirect employment through tourism, hospitality, retail, education, and business services, generating substantial multiplier effects across the wider economy (Comunian et al., 2021; Chang et al., 2021; Cunningham & McCutcheon, 2023). At the same time, the sector is characterized by a high concentration of small and medium-sized enterprises (SMEs) and start-ups, which introduce innovative products, services, and business models that strengthen competition, attract investment, and accelerate technology commercialization. These innovation spillovers frequently extend beyond creative industries, supporting productivity improvements in manufacturing, agriculture, services, healthcare, and education (Chang et al., 2021; Malerba & McKelvey, 2020; Dellisanti, 2025). The economic influence of the creative economy extends beyond domestic markets to international trade.
The rapid growth of digital platforms has expanded global markets for creative goods and services, including software, digital media, architecture, cultural products, fashion, and design, creating new export opportunities and facilitating knowledge exchange, foreign direct investment, and technology transfer (Boix-Domènech & Rausell-Köster, 2018; Dellisanti, 2025). Furthermore, creative industries frequently complement tourism by enhancing cultural experiences, increasing visitor expenditure, and strengthening local value chains. These interactions generate multiplier effects across accommodation, transport, hospitality, and retail while supporting entrepreneurship and regional economic development (Manioudis & Angelakis, 2023; Dellisanti, 2023). By diversifying economic activity and reducing dependence on traditional industries, the creative economy also enhances resilience against external shocks and contributes to more balanced long-term development (Scott & Storper, 2003; Capello, 2011; Pike et al., 2017). Overall, empirical evidence consistently demonstrates a positive association between the development of creative industries and key economic indicators, including gross domestic product, labor productivity, employment, exports, innovation capacity, and regional competitiveness (Boix-Domènech & Rausell-Köster, 2018; Innocenti & Lazzeretti, 2019; Manioudis & Angelakis, 2023; Chaiboonsri, 2024). Nevertheless, important research gaps remain. Most existing studies focus on individual creative industries or specific economic outcomes, providing limited insight into how creative economy policies influence the broader economic system. Moreover, previous research has generally relied on either econometric analysis or simulation modeling independently, limiting the ability to combine causal policy evaluation with economy-wide structural analysis. Addressing this methodological gap requires an integrated analytical framework that links empirical policy estimation to dynamic economic simulation. This study addresses that need by combining Difference-in-Differences (DiD) estimation with a Dynamic Computable General Equilibrium (Dynamic CGE) model to evaluate the short- and long-term impacts of Thailand’s creative economy policy.
2.3. Creative Economy Development and Policy Evolution in Thailand
Thailand’s transition towards a creative economy reflects a broader shift from a resource- and manufacturing-based economy to one driven by innovation, knowledge, and creativity. Although agriculture, manufacturing, exports, and tourism have long supported the country’s economic growth, increasing global competition, technological change, and evolving market demands have exposed the limitations of this traditional growth model. In response, the Thai government has increasingly recognized creativity, innovation, and intellectual capital as strategic resources for enhancing productivity, competitiveness, and long-term economic development (Chaiboonsri, 2024; Dellisanti, 2025; Manioudis & Angelakis, 2023). A major milestone in this transition was the introduction of the Creative Economy Policy in 2009, which positioned culture, creativity, technology, and innovation as engines of economic growth rather than solely as cultural assets. The policy aimed to stimulate employment, investment, tourism, and industrial competitiveness while encouraging stronger collaboration among government agencies, universities, businesses, and local communities to develop creative industries (Chaiboonsri, 2024). To support this agenda, Thailand strengthened institutional capacity through the Creative Economy Agency (CEA), formerly the Thailand Creative and Design Center (TCDC), which promotes entrepreneurship, design, innovation, knowledge transfer, and international collaboration while supporting creative districts and community-based economic development (Chaiboonsri, 2024).
The creative economy has since become closely integrated into Thailand’s broader national development strategies. The Thailand 4.0 initiative promotes innovation, digital transformation, research and development, entrepreneurship, and high-value industries as key drivers of future economic growth, while the Bio-Circular-Green (BCG) Economy Model extends these objectives by integrating innovation with resource efficiency and environmental sustainability (Chaiboonsri, 2024; Dellisanti, 2025). Despite these policy initiatives, systematic evidence regarding their economy-wide effectiveness remains limited. Most existing studies focus on individual industries or local case studies rather than evaluating the aggregate economic and regional consequences of the national creative economy policy. Together, these strategies demonstrate the government’s commitment to transforming Thailand into a competitive knowledge-based economy. Thailand’s creative economy now encompasses a diverse range of industries, including design, architecture, digital content, software, film, animation, advertising, fashion, handicrafts, performing arts, gastronomy, publishing, and cultural tourism. These industries generate direct economic value while creating important linkages with manufacturing, agriculture, education, hospitality, and digital technologies through innovation, branding, and product diversification (Boix-Domènech & Rausell-Köster, 2018; Innocenti & Lazzeretti, 2019; Chang et al., 2021). At the same time, policymakers have increasingly adopted place-based development strategies that promote creative cities, local entrepreneurship, cultural heritage, and creative tourism to strengthen regional competitiveness. Cities such as Chiang Mai illustrate how creative industries can support local economic development by combining cultural assets with education, tourism, and the digital economy (Boschma, 2004; Pike et al., 2017; Capello, 2011). Despite these policy achievements, several challenges continue to constrain the development of Thailand’s creative economy. Regional disparities in infrastructure, innovation capacity, access to finance, digital readiness, and human capital limit the ability of many creative enterprises to expand and compete internationally. In addition, the cross-sectoral nature of creative industries makes their overall economic contribution difficult to measure using conventional analytical approaches (Chaiboonsri, 2024; Dellisanti, 2023). Existing studies have largely focused on individual industries or specific economic indicators, providing limited evidence on the broader economy-wide and regional impacts of Thailand’s creative economy policy. Moreover, few studies combine rigorous causal policy evaluation with structural economic analysis. This study addresses these limitations by integrating Difference-in-Differences (DID) estimation with a Dynamic Computable General Equilibrium (Dynamic CGE) model to provide a comprehensive assessment of the national and regional economic impacts of Thailand’s creative economy policy.
2.4. Empirical Evidence and Research Gaps
Growing interest in the creative economy has generated an expanding body of empirical research examining its effects on economic growth, innovation, tourism, regional development, employment, and international competitiveness. Prior studies have applied a wide range of systematic approaches, including econometric models, panel data analysis, regional analysis, input–output techniques, and Computable General Equilibrium (CGE) models. While the discoveries consistently suggest that creative industries contribute positively to economic performance, considerable variation remains regarding the magnitude of these effects, the transmission mechanisms involved, and the effectiveness of policy interventions across countries and regions (Boix-Domènech & Rausell-Köster, 2018; Innocenti & Lazzeretti, 2019; Rodríguez-Insuasti et al., 2022; Manioudis & Angelakis, 2023).
Although empirical evidence generally supports a positive relationship between creative industries and economic performance, important differences remain regarding the magnitude of these effects, their transmission mechanisms, and the contexts in which they occur. Studies have also shown positive effects on export performance, employment creation, industrial competitiveness, and regional resilience, particularly in economies with strong innovation systems and supportive institutional environments (Boix-Domènech & Rausell-Köster, 2018; Chang et al., 2021; Comunian et al., 2021; Cunningham & McCutcheon, 2023; Dellisanti, 2023). Beyond their direct contribution, creative industries generate knowledge spillovers that promote technological upgrading and productivity improvements across manufacturing, services, tourism, agriculture, and other sectors of the economy (Feldman, 1999, 2014; Audretsch & Feldman, 2004; Malerba & McKelvey, 2020). Furthermore, studies on creative cities and regional innovation validate that integrating creative industries with local entrepreneurship, cultural heritage, and tourism can reinforce regional competitiveness and support more inclusive economic development (Rodríguez-Insuasti et al., 2022; Dellisanti, 2023; Boschma, 2004; Pike et al., 2017). Despite these positive findings, several limitations remain in the existing literature. First, most studies focus on individual creative industries or selected economic outcomes, providing limited understanding of the broader economy-wide effects of creative economy policies (Boix-Domènech & Rausell-Köster, 2018; Innocenti & Lazzeretti, 2019). Second, conventional econometric approaches are effective for identifying causal relationships but provide limited insight into how policy impacts are transmitted across sectors or evolve (Bertrand et al., 2004; Angrist & Pischke, 2009; Callaway & Sant’Anna, 2021; Goodman-Bacon, 2021; Roth et al., 2023). In contrast, CGE models capture economy-wide interactions and long-term structural adjustments but commonly rely on assumed policy shocks rather than empirically estimated policy effects, reducing their capacity to reflect actual policy outcomes (Hosoe et al., 2010; Dixon & Jorgenson, 2013a; Britz & Roson, 2019; Cicowiez & Lofgren, 2017). The same important limitation concerns geographical coverage. Much of the empirical evidence has been generated in Europe, North America, and a limited number of East Asian economies, while comprehensive evaluations in developing countries remain relatively scarce. In Thailand, existing research has largely concentrated on tourism, cultural enterprises, handicrafts, or digital innovation, with relatively little attention given to the economy-wide and regional impacts of the national creative economy policy. Moreover, differences in regional industrial structures, innovation capacity, and economic development have received limited empirical attention (Chaiboonsri, 2024). Taken together, the literature highlights four major research gaps. First, evidence on the economy-wide impacts of creative economy policies remains limited. Second, econometric and CGE approaches have largely been applied independently, restricting the ability to combine rigorous causal policy evaluation with structural economic analysis. Third, regional heterogeneity has received insufficient attention, particularly in developing economies such as Thailand. Finally, few studies integrate empirical policy estimation with dynamic economy-wide simulation to evaluate both observed policy effects and their long-term economic implications. This study addresses these gaps by combining Difference-in-Differences (DID) estimation with a Dynamic Computable General Equilibrium (Dynamic CGE) model, providing a comprehensive assessment of Thailand’s creative economy policy at both the national and regional levels. Collectively, these gaps indicate that existing research has not yet provided an integrated framework capable of simultaneously estimating the causal effects of creative economy policy and evaluating its economy-wide and regional consequences. Addressing this limitation requires combining rigorous econometric identification with structural economic modeling.
The present study responds to this need by integrating Bayesian Difference-in-Differences estimation with a Dynamic Computable General Equilibrium model to provide a comprehensive evaluation of Thailand’s creative economy policy.
Although endogenous growth theory, knowledge spillovers, and absorptive capacity provide the theoretical foundation for understanding the creative economy, these mechanisms are not explicitly modeled as endogenous processes in the present CGE framework. Instead, the model represents potential productivity improvements through an exogenous total factor productivity (TFP) shock. The simulations therefore examine the economy-wide and regional implications of an assumed productivity improvement rather than directly estimating knowledge diffusion, R&D accumulation, or human capital development. These theoretical mechanisms provide the motivation for the policy scenario, while their explicit modeling is beyond the scope of the current framework.
However, a limitation of the Dynamic CGE model used in this research is that it does not directly incorporate the concepts of endogenous growth theory, which emphasizes knowledge spillovers, innovation, and absorptive capacity (Romer, 1990; Audretsch & Belitski, 2023). Therefore, the estimated Bayesian DID effect is used to evaluate the impacts of Thailand’s government policies promoting the creative economy, including support for firms launching their businesses through creative knowledge spillovers, innovation, and absorptive capacity. The estimated policy effect is then incorporated into the Dynamic CGE model to assess economy-wide impacts (Ziesmer et al., 2023).
However, the Bayesian DID estimate in this research study serves as an empirical reference for assessing GDP improvements associated with Thailand’s creative economy policy, which is empirically supported by evidence consistent with endogenous growth theory for long-run economic growth (Romer, 1990; Homsombat et al., 2025). For the initial values of the TFP sensitivity scenarios ranging from 0% to 11% (including 7.22%, which represents the estimated GDP response to the creative economy policy shock from the Bayesian DID model), these values are used to explain the linkage between endogenous growth theory and exogenous productivity shocks through simulation using the Dynamic CGE model to assess economy-wide impacts (Romer, 1990; Ziesmer et al., 2023).
3. The Conceptual Framework and Methodology
The conceptual framework and methodology of this research study attempt to adopt a hybrid economic modeling framework that integrates causal policy evaluation with economy-wide simulation to examine the role of Thailand’s creative economy in promoting sustainable economic growth (see Figure 1). However, Thailand’s economy had already benefited from the creative economy before the creative economy policy was officially promoted in 2009. This study attempts to point out how the Thai economy responded after the Thai government began officially promoting the creative economy policy in 2009, particularly in terms of accelerating economic growth beyond the pre-policy baseline trend.
Figure 1.
The conceptual framework and research methodology of this study.
The methodological framework consists of three sequential stages. First, a Difference-in-Differences (DID) model is employed to estimate the causal effect of Thailand’s creative economy policy introduced in 2009. The DID model compares changes in economic performance before and after policy implementation between treatment and control groups, allowing the net policy effect to be identified while controlling for common macroeconomic trends and unobserved time-invariant heterogeneity (Bertrand et al., 2004; Angrist & Pischke, 2009; Callaway & Sant’Anna, 2021; Goodman-Bacon, 2021; Roth et al., 2023). Second, the posterior-mean treatment effect estimated from the B-DID model is used to inform a benchmark policy scenario in the Dynamic CGE model. The policy scenario is implemented as a 7.224% increase in Total Factor Productivity (TFP), while GDP and other macroeconomic outcomes remain endogenous within the CGE model. Unlike conventional CGE simulations that rely on hypothetical assumptions, this study calibrates the policy shock using empirical evidence obtained from the DID model, thereby strengthening the realism and policy relevance of the simulation results. Dynamic CGE models have been widely employed to analyze economy-wide interactions, sectoral linkages, investment dynamics, and long-term structural adjustments arising from policy interventions (Hosoe et al., 2010; Dixon & Jorgenson, 2013a; Britz & Roson, 2019; Cicowiez & Lofgren, 2017). Finally, the Dynamic CGE model is used to evaluate both national and regional economic responses under two alternative scenarios: (i) a baseline scenario without creative economy policy intervention and (ii) a policy scenario incorporating the estimated policy impact. The comparison between these scenarios enables the assessment of changes in macroeconomic indicators, sectoral production, household income, government revenue, investment, consumption, trade, and regional economic development. The integration of DID estimation with Dynamic CGE modeling provides a comprehensive framework for evaluating both the observed causal effects of policy implementation and the broader structural adjustments that occur throughout the economy over time (Dixon & Jorgenson, 2013b; Hosoe et al., 2010; Britz & Roson, 2019). The overall research framework is illustrated in Figure 1.
As illustrated in Figure 1, the study follows a sequential hybrid modeling framework consisting of five stages. Stage 1 collects macroeconomic data, including the Input–Output (I–O) table and Social Accounting Matrix (SAM), together with policy information on Thailand’s creative economy. Stage 2 estimates the causal impact of the 2009 Creative Economy Policy using the Bayesian Difference-in-Differences (DID) model. Stage 3 incorporates the estimated Bayesian DID effect as an exogenous policy shock into the Dynamic Computable General Equilibrium (Dynamic CGE) model. Stage 4 simulates economic performance under both baseline and policy scenarios. Finally, Stage 5 compares regional economic responses across Northern, Northeastern, Central, and Southern Thailand to evaluate policy effectiveness. This framework integrates empirical causal estimation with economy-wide simulation, thereby enhancing the robustness and policy relevance of the analysis.
3.1. Difference-in-Differences (DID) Model
The Difference-in-Differences (DID) approach is employed to estimate the causal effect of Thailand’s creative economy policy introduced in 2009. However, this DID approach is a widely used quasi-experimental econometric method for evaluating public policy interventions by comparing changes in economic outcomes between treatment and control groups before and after policy implementation. By exploiting temporal and cross-sectional variation, the DID estimator isolates the average treatment effect while controlling for common time trends and unobserved time-invariant heterogeneity between groups (Bertrand et al., 2004; Angrist & Pischke, 2009; Callaway & Sant’Anna, 2021; Goodman-Bacon, 2021; Sun & Abraham, 2021; Roth et al., 2023). The baseline DID specification is expressed as Equation (1)
where
- denotes the economic outcome variable (GDP);
- represents both the treatment group (dummy = 1) (2000–2024) and control group (dummy = 0) (2000–2024);
- indicates the post-policy period (2009–2024);
- is the interaction term measuring the causal policy effect;
- represents the average treatment effect of the creative economy policy.
Because of the limited sample size and data availability, Bayesian inference was carried out to estimate the DID model (Equation (1)). The prior specified by the researcher is a normal prior because the researcher has sufficient prior information. An informative normal prior is commonly adopted when prior knowledge is available or when the sample size is limited, as is often the case in macroeconomic studies (Gelman et al., 2021; McElreath, 2020; Pressé & Sgouralis, 2023). Normally, Bayesian inference is based on Bayes’ theorem, as defined in Equation (2), then presented as:
Based on Bayes’ theorem, the DID model (Equation (1)) can be estimated by defining the likelihood function in Equation (3) and combining it with the prior distribution in Equation (4) (joint prior). The resulting posterior distribution is presented in Equations (5) and (5a), which provides the posterior estimates of all parameters in the DID model.
For Equation (4), informative Normal priors were specified for all regression coefficients, while a non-informative Inverse-Gamma prior was specified for the error variance.
The posterior distribution of captures the causal contribution of Thailand’s creative economy policy to economic growth after controlling for common macroeconomic trends affecting both the treatment and control groups. Based on the posterior distribution of , it represents the causal effect of the creative economy policy on Thailand’s gross domestic product (GDP).
This estimated treatment effect was subsequently used to inform the benchmark policy scenario in the Dynamic Computable General Equilibrium (Dynamic CGE) model, thereby linking empirical policy evaluation with economy-wide simulation and enhancing the realism of the policy analysis.
Regarding the treatment group (dummy = 1) and control group (dummy = 0), these groups are defined based on Thailand’s GDP data in this research study. The control group is constructed using Thailand’s GDP data from 2000 to 2008, and the Bayesian AR-based model is used to predict and construct counterfactual GDP, which represents Thailand’s GDP without the influence of the creative economy policy promoted during 2009–2024. Regarding the estimated policy effect, it is obtained by computing the difference between observed GDP and counterfactual GDP using the Bayesian DID model (see Equation (1)).
3.2. Dynamic Computable General Equilibrium (Dynamic CGE) Model
To examine the economy-wide consequences of Thailand’s creative economy policy, this study employs a Dynamic Computable General Equilibrium (Dynamic CGE) model. CGE models provide a comprehensive analytical framework for representing the interactions among producers, households, government, investors, and the rest of the world within an integrated economic system. Unlike partial equilibrium models, Dynamic CGE models simultaneously capture inter-sectoral linkages, market equilibrium conditions, factor allocation, production, consumption, investment, and international trade while incorporating capital accumulation and dynamic adjustment over time (Hosoe et al., 2010; Dixon & Jorgenson, 2013b; Britz & Roson, 2019; Cicowiez & Lofgren, 2017).
The dynamic CGE model used in this study comprises six main components for analyzing the economic impacts under creative economy policy scenarios. For the overall mathematical economic model, the Dynamic CGE model is described by Equations (6)–(16).
Equation (6) represents the value-added function of the production function, where is the value added generated by sector , and is the total output of sector . The parameter is the fixed value-added coefficient. When production increases, value added also increases proportionally. Equation (7) represents the Cobb–Douglas value-added function, which is modified from Equation (6). Here, denotes total factor productivity (technology level), represents the input of production factor (e.g., labor and capital), and is the output elasticity of each production factor. Equation (7) implies that a higher level of technology and greater use of productive inputs increase value added.
Equations (8)–(11) represent the value-added unit cost, household income, private savings, and government revenue, respectively. Equation (8) is used to calculate the value-added unit cost for sector . Higher productivity reduces production costs, whereas higher factor prices increase the unit cost of production in sector . Equation (9) indicates that total household income is generated from supplying production factors, such as labor and capital. It is calculated by summing , where is the factor price and is the amount of factor supplied. Equation (10) represents private savings , where is the marginal propensity to save and is the household income tax rate.
Equation (11) shows the calculation of total government revenue. The term represents direct taxes on household income, while represents indirect taxes on production or output across all sectors.
Equations (12)–(14) represent the price system of the Dynamic CGE model. In Equation (12), () denotes the composite commodity price, () represents the domestic commodity price, () is the import share, and () denotes the exchange rate. Equation (13) defines the producer price, (), while () represents the export share. Equation (14) represents the producer price equation in the Dynamic CGE model, which is constructed under the assumption of perfectly competitive markets, where total revenue equals total production cost. Accordingly, this equation must satisfy the zero-profit condition. The producer price, , is determined by the indirect tax factor, , multiplied by the total unit production cost, consisting of intermediate input costs and value-added costs, (). Therefore, firms in the Dynamic CGE model earn zero economic profit in equilibrium because the selling price exactly equals the total unit production cost, including indirect taxes.
Equations (15) and (16) represent the market-equilibrium conditions of the Dynamic CGE model. Equation (15) represents the factor market equilibrium, in which total factor demand, () is equal to the total factor supply, (). Equation (16) represents the commodity market equilibrium, in which total commodity supply, is equal to the sum of intermediate demand, (), household consumption, (), government consumption, (), and investment demand, (). The main objective of the Dynamic CGE model is to compute an economy-wide equilibrium in which all commodity markets simultaneously satisfy the supply-and-demand equilibrium condition.
In this study, it brings the creative policy causal treatment effect from the Bayesian DID model to construct the scenario metadata for exploring the policy effects on the whole country and Thailand’s regional areas, including Northern Thailand, Northeastern Thailand, Central Thailand, and Southern Thailand, respectively. This research study uses the initial value of the causal treatment effect in Total Factor Productivity (TFP), which is an exogenous policy parameter representing the degree of impact of Thailand’s creative economy policy through the Dynamic CGE model for impact prediction.
Suppose that Thailand successfully promotes the creative economy policy and achieves an approximately 7.224% increase in Total Factor Productivity (TFP). This 7.224% increase in TFP is specified as a hypothetical benchmark policy scenario for the Dynamic CGE simulation and does not represent a direct mathematical conversion of the 7.224% GDP effect estimated from the B-DID model. In other words, the same numerical magnitude is used as a benchmark scenario assumption rather than assuming a one-to-one theoretical relationship between GDP growth and TFP growth. The impact of this productivity improvement on the Thai economy is then explored using the Dynamic CGE model. In the mechanism of this model, the policy is represented by an increase in Total Factor Productivity (TFP) equal to 7.224% (see Equation (18)).
Equations (17)–(21) are used to calculate the policy impact on the economy of Thailand by the government’s attempt to promote a creative policy economy sustainable engine for long-term economic growth sustainability in the future of Thailand’s economy. Equation (20). The denotes total factor productivity (technology level) growth increasing from this policy by approximately 7.224%. This TFP shock is treated as an exogenously specified benchmark scenario, while the resulting change in GDP is determined endogenously within the Dynamic CGE model and is not assumed to be equal to 7.224%. Equation (21) represents the policy shock impact on sectoral productivity and value added by 7.224% for the creative economy policy over time. Moreover, in this research study, Appendix A presents Table A1, which summarizes the SAM structure, standard endogenous and exogenous parameters, and elasticity values used in the Dynamic CGE model.
Regarding the conceptual framework, the linkage between the national and regional CGE models relies on a top-down regional CGE approach, which has been applied in many previous research studies. These studies examine how national-level policy shocks affect regional economies through top-down CGE and Dynamic CGE modeling approaches (Giesecke & Madden, 2013; Horridge & Wittwer, 2017; Ghaith et al., 2021; He et al., 2024). However, this research study applies the Dynamic CGE model as a powerful analytical tool to measure the impacts of the creative economy promotion policy on both the national and regional economies of Thailand.
These economic agents interact simultaneously through commodity, factor, and international markets, where equilibrium is achieved by balancing production, consumption, investment, government expenditure, and international trade. Dynamic behavior is introduced through capital accumulation, enabling the economy to adjust gradually over time following policy interventions and changes in economic conditions (Dixon & Jorgenson, 2013b; Hosoe et al., 2010).
The simulation period is divided into:
- Short run (T1–T3);
- Long run (T4–T10).
This allows both immediate and long-term policy impacts to be evaluated.
This temporal structure enables the Dynamic CGE model to evaluate both the short-term adjustment effects and the longer-term structural impacts of Thailand’s creative economy policy on macroeconomic performance, sectoral production, household welfare, investment, trade, and regional economic development (Britz & Roson, 2019; Dixon & Jorgenson, 2013b).
3.3. Policy Scenario Design
In this study, two policy scenarios are structured to evaluate the effectiveness of Thailand’s creative economy.
- a.
- Scenario 1: Baseline Scenario
The baseline scenario represents the economy in the absence of the creative economy policy intervention. Economic variables develop under existing structural conditions without additional policy stimulation.
- b.
- Scenario 2: Creative Economy Policy Scenario
The second scenario uses a 7.224% Total Factor Productivity (TFP) increase as a benchmark policy shock informed by the posterior-mean treatment effect estimated from the Bayesian Difference-in-Differences (B-DID) model. This TFP shock represents a hypothetical implementation scenario for Thailand’s creative economy policy rather than a direct conversion of the estimated GDP effect into TFP. The Dynamic CGE model then determines the resulting endogenous changes in economic activity, including production, household income, investment, consumption, trade, and capital accumulation.
- c.
- Regional CGE Analysis
To examine regional differences in policy impacts, the Dynamic CGE model is extended to analyze four major regions of Thailand:
- Northern Thailand;
- Northeastern Thailand;
- Central Thailand;
- Southern Thailand.
Each regional simulation evaluates changes in macroeconomic performance, sectoral production, household welfare, and trade under the creative economy policy scenario. Comparing regional outcomes enables the identification of heterogeneous policy responses and provides policy-relevant evidence to support the design of more balanced regional development strategies.
4. Results
4.1. Difference-in-Differences (DID) Estimation of Thailand’s Creative Economy Policy
Table 1 presents the Difference-in-Differences (DID) estimation results evaluating the causal effect of Thailand’s creative economy policy, introduced in 2009. The interaction term (Treat × Post), which captures the average treatment effect of the policy, is estimated at 0.0698, indicating an approximate 7.22% increase in GDP following policy implementation. This positive estimate suggests that the creative economy policy may have contributed to improved economic performance beyond the general macroeconomic changes observed during the study period. However, because its 95% Bayesian credible interval includes zero, the estimated positive effect remains statistically uncertain.
Table 1.
Bayesian Difference-in-Differences (DID) model for estimating the causal effect of Thailand’s creative economy policy.
Because the Bayesian credible interval includes zero for the estimated 7.22% increase in GDP reflected by Thailand’s creative economy policy, introduced in 2009, the positive policy effect remains statistically inconclusive. Therefore, this study uses this value only as a reference scenario for the simulation study of the policy’s promoted effects by providing more scenarios ranging from 0% to 11% in cooperation with the Dynamic CGE model to evaluate the effects of the creative economy policy on Thailand’s sustainable economic growth.
The 95% Bayesian credible interval of the interaction coefficient corresponds to an approximate percentage-change interval of −22.12% to 49.82%. Although the estimated policy effect is positive, the 95% Bayesian credible interval ranges from −0.25 to 0.4044, indicating uncertainty in the precision of the estimate. Therefore, the DID results should be interpreted as evidence suggesting a positive average policy effect rather than conclusive statistical proof of its magnitude. The positive posterior mean indicates that the center of the estimated posterior distribution lies above zero, although the credible interval shows that both negative and positive effects remain plausible. Nevertheless, the estimated coefficient provides an empirically derived measure of the policy impact that is used as an exploratory central benchmark in subsequent economic simulation. Rather than examining only the direct policy effect, this study uses the percentage change derived from the posterior mean to define the central benchmark policy scenario in the Dynamic Computable General Equilibrium (Dynamic CGE) model. Accordingly, the resulting Dynamic CGE estimates should be interpreted as conditional simulation outcomes under the assumed benchmark scenario rather than as conclusive forecasts of the policy effect.
According to the standard DID diagnostic checks, this research study employs a Bayesian AR-based model to predict and construct counterfactual GDP (control group), which represents Thailand’s GDP without the influence of the creative economy policy promoted during 2009–2024. Therefore, it is necessary to confirm that this method performs with sufficiently high accuracy in predicting and constructing counterfactual GDP by reporting the RMSE, MAE, and MAPE, respectively. The predictive performance of this model shows high accuracy, with an RMSE of 9.655592, an MAE of 8.638108, and a MAPE of 4.852430% for the in-sample prediction period (2001–2008), respectively (see Appendix A, Figure A1). In terms of model evaluation for the out-of-sample period (2006–2008), the predictive performance also shows high accuracy, with a MAPE of 4.828% (see Appendix A, Figure A2). Therefore, it is reasonable to use this model to predict and construct counterfactual GDP for the period 2009–2024 and compare it with Thailand’s actual GDP, which reflects economic performance during the period when the creative economy policy was promoted (see Appendix A, Figure A3).
4.2. Dynamic CGE Analysis Under the Baseline Scenario (Without Creative Economy Policy)
4.2.1. Macroeconomic, Sectoral Output, and Consumption Results
Table 2 presents the baseline Dynamic CGE simulation representing Thailand’s economy in the absence of creative economy policy intervention. The results provide a benchmark against which the policy scenario is evaluated. At the macroeconomic level, GDP, household income, government revenue, and total investment remain largely unchanged between the short-run (T1–T3) and long-run (T4–T10) simulation periods, indicating that the economy maintains a stable equilibrium under the baseline conditions.
Table 2.
Baseline Dynamic CGE simulation results for Thailand without creative economy policy intervention.
The only notable change is the continued increase in the capital stock, reflecting the accumulation of productive assets over time. However, this increase does not generate corresponding improvements in overall economic output or income, suggesting that capital accumulation alone is insufficient to stimulate stronger economic growth without additional policy support. A similar pattern is observed across the production sectors. Agricultural, light manufacturing, heavy manufacturing, and service outputs remain stable throughout the simulation period, indicating limited structural adjustment in the absence of creative economy stimulation.
Likewise, household consumption exhibits minimal variation across all sectors, implying that domestic demand remains relatively constant under the baseline scenario. Overall, the baseline simulation suggests that Thailand’s economy follows a stable but slow-growth path without creative economy intervention. While the existing economic structure maintains equilibrium, it generates little structural transformation or productivity enhancement, highlighting the need for policy measures that can stimulate innovation, value creation, and long-term economic development.
4.2.2. Trade Performance
The trade simulation indicates (Table 3) that all sectors maintain a trade surplus throughout the simulation period, with exports consistently exceeding imports in both the short and long run. The persistence of these trade balances suggests that Thailand remains internationally competitive under the baseline scenario.
Table 3.
Trade performance under the baseline Dynamic CGE scenario.
However, the absence of changes in export and import patterns indicates that trade performance remains largely static, reflecting limited structural adjustment in the absence of creative economy policy. Taken together, the baseline CGE results describe an economy that is stable but exhibits limited dynamism. Without policy intervention, macroeconomic performance, sectoral production, household consumption, and trade remain largely unchanged, providing a useful benchmark against which the effects of the creative economy policy can be evaluated.
4.3. Dynamic CGE Analysis Under the Creative Economy Policy Scenario
4.3.1. Macroeconomic, Sectoral Output, and Consumption Results
Table 4 presents the Dynamic CGE simulation results under the creative economy policy benchmark scenario, in which a 7.224% Total Factor Productivity (TFP) increase is imposed as the policy shock. The resulting changes in GDP and other macroeconomic indicators are determined endogenously by the Dynamic CGE model. Compared to the baseline scenario, the policy intervention generates consistent improvements across the major macroeconomic indicators while maintaining overall economic stability throughout the simulation period. At the macroeconomic level, GDP increases from 26.99 billion under the baseline scenario to 28.88 billion, representing a clear expansion in national economic output.
Table 4.
Dynamic CGE simulation results under the creative economy policy scenario (+7.22% TFP Shock).
Household income, government revenue, and total investment also improve under the policy scenario, indicating that the benefits of the creative economy extend beyond production to strengthen domestic income generation, public finances, and capital formation. Although the capital stock continues to increase over time in both scenarios, the policy scenario achieves a higher level of capital accumulation, reflecting stronger investment-driven economic growth. The positive impacts are similarly observed across all production sectors.
Agricultural, light manufacturing, heavy manufacturing, and service sectors’ outputs all increase relative to the baseline simulation, demonstrating that the creative economy policy stimulates broad-based production rather than benefiting only selected industries. Household consumption also rises across all sectors, suggesting that higher incomes generated by the policy translate into stronger domestic demand and improved household welfare. The simultaneous expansion of production and consumption indicates the presence of positive multiplier effects that reinforce economic activity throughout the production system. Overall, the policy simulation demonstrates that Thailand’s creative economy policy promotes higher levels of economic output, investment, production, and household consumption while preserving macroeconomic stability. These findings suggest that the creative economy functions as an important catalyst for economy-wide growth by strengthening productive capacity, stimulating domestic demand, and enhancing long-term economic performance.
4.3.2. Trade Performance Under the Creative Economy Policy Scenario
Table 5 presents the simulated trade performance under the creative economy policy scenario. The results show that all sectors maintain positive trade balances in both the short run (T1–T3) and long run (T4–T10), with exports consistently exceeding imports. Heavy manufacturing records the highest export value, followed by light manufacturing, highlighting the continued importance of manufacturing in Thailand’s external trade, while the service and agricultural sectors also sustain trade surpluses.
Table 5.
Trade simulation results for Thailand under the creative economy policy scenario.
Notably, trade outcomes remain unchanged across the simulation periods, indicating that the creative economy policy strengthens overall economic activity without fundamentally altering Thailand’s trade structure. These findings suggest that the policy primarily generates a scale effect, supporting domestic production and export competitiveness while maintaining stable external trade balances.
Table 5 presents the trade performance of Thailand under the creative economy policy scenario. The results indicate that all sectors, including agriculture (AGR), light manufacturing (LMN), heavy manufacturing (HMN), and services (SRV), continue to maintain trade surpluses, with exports consistently exceeding imports in both the short-run (T1–T3) and long-run (T4–T10) simulation periods. This suggests that Thailand retains its export-oriented structure and international competitiveness following the implementation of the creative economy policy. Despite the positive effects of the policy on domestic economic growth, export and import levels remain unchanged relative to the baseline scenario, and the trade surplus is maintained throughout the simulation period. This indicates that the creative economy policy does not substantially alter Thailand’s trade structure or external trade dynamics. Instead, the economic benefits of the policy are primarily reflected in domestic economic activities, including higher production, household income, investment, and consumption, rather than changes in international trade performance. Overall, the findings suggest that while the creative economy policy supports stronger domestic economic growth, its influence on external trade remains limited, thereby preserving Thailand’s existing trade balance and sectoral trade patterns over both the short and long run. Taken together, the results indicate that the simulated policy primarily expands economic activity without substantially changing the existing sectoral and trade structure. Although the findings show improvements in several economic indicators, they do not establish that structural transformation has occurred. Assessing such transformation would require additional evidence on changes in sectoral shares, employment composition, and intersectoral linkages. The results should therefore be interpreted as evidence of potential economic expansion rather than conclusive evidence of structural transformation.
4.4. Comparative Analysis Between the Baseline and Creative Economy Policy Scenarios
Table 6 compares the Dynamic CGE simulation results under the baseline and creative economy policy scenarios, providing an integrated assessment of the economy-wide effects of Thailand’s creative economy policy. The introduction of the creative economy policy produces consistent improvements across all macroeconomic indicators, sectoral outputs, and household consumption, demonstrating that the policy generates a broad-based expansion of economic activity. Rather than altering the underlying structure of the economy, the policy primarily increases the level of economic performance across all sectors, indicating a scale expansion effect rather than structural transformation.
Table 6.
Comparison of Dynamic CGE simulation results between the baseline and creative economy policy scenarios.
At the macroeconomic level, the policy increases GDP from 26.99 billion to 28.88 billion, reflecting an overall economic expansion of approximately 7% (TFP shock). Household income, government revenue, total investment, and capital stock also increase relative to the baseline scenario, suggesting that the policy strengthens domestic income generation, investment capacity, and capital accumulation. These improvements indicate that the creative economy stimulates aggregate demand while simultaneously enhancing the productive capacity of the economy. The agriculture, manufacturing, and services sectors. Agricultural production expands in response to stronger domestic demand, while the service sector records a similar improvement, reflecting the close relationship between creative economy activities and service-based industries. Although both manufacturing sectors experience higher production, their underlying growth mechanisms differ. Light manufacturing expands primarily through increased household consumption and market demand, representing a demand-driven response to higher economic activity. In contrast, heavy manufacturing is supported by greater capital accumulation and investment, indicating a supply-side expansion associated with higher productive capacity. These differences highlight the complementary roles of consumption and investment in transmitting the economic benefits of the creative economy throughout the production system.
Household consumption also increases across all sectors, further reinforcing the positive multiplier effects generated by the policy. Rising household income stimulates domestic demand, which in turn supports higher production and investment, creating a reinforcing cycle of economic expansion. The simultaneous improvement in production, consumption, and investment demonstrates that the creative economy contributes to broad-based economic growth rather than benefiting only a limited number of industries. Despite these improvements, the overall structure of the Thai economy remains largely unchanged. The proportional increases observed across macroeconomic variables and sectoral outputs suggest that the policy raises the overall scale of economic activity without significantly altering the relative composition of production or consumption. This finding indicates that the creative economy policy functions primarily as a growth-enhancing instrument that strengthens existing economic activities rather than fundamentally restructuring the economy. Overall, the comparative analysis demonstrates that Thailand’s creative economy policy promotes sustainable economic expansion through higher income, stronger investment, increased production, and greater household consumption. Although the policy does not substantially alter the structural composition of the economy, it generates broad-based improvements across key economic indicators, highlighting its potential as an effective strategy for supporting long-term economic growth and development.
According to the creative economy policy promoted since 2009, its economic impact was examined using TFP shocks, which are the main input for the dynamic CGE model’s sensitivity analysis of economic impacts in Thailand. This study found that the B-DID model, using data from 2000–2009 (before the policy launch) and 2010–2024 (after the policy launch), estimated that the policy contributed approximately 7.224% to Thailand’s GDP.
The TFP shock-based scenarios ranging from 0% to 11%, including 7.222%, are used as initial calibration values for the analysis using the Dynamic CGE model to explore the effects of the government’s promotion of the creative economy on the Thai economy. The TFP shocks are applied uniformly across all sectors as a modeling assumption in this research study, because this study emphasizes that creative economy policy reflects the role of intangible capital, such as innovation, information technology (IT), research and development (R&D), software, and knowledge, which are significant in improving productivity (Corrado et al., 2022, 2025). Intangible capital can also promote long-term sustainable economic growth. Therefore, all sectors, such as agriculture, industry, and services, may gain benefits from this policy. However, this research study has limitations in estimating the effects of the creative economy in detail in each of the important sectors, but it attempts to highlight that the overall economic sectors of Thailand might gain benefits from intangible capital, which plays an important role in substantially driving long-term sustainable economic growth (Bontadini et al., 2024).
However, for a better understanding of the mechanism linked between the B-DID model and Dynamic CGE modeling analysis, Table 7 is presented to show the sensitivity of Dynamic CGE modeling analysis for the economic impact contributing to GDP, based on a comparison between TFP shocks (promoted policy) and no TFP shock (non-promoted policy) during the short-run period, for example, between 2022–2023. From this table, it was found that whenever the TFP shocks (promoted policy) increased from 1% to 11%, they contributed to an increase in GDP in 2022, compared with no TFP shock (non-promoted policy), from approximately 0.53% to 5.7%. Under the same conditions, they also contributed to an increase in GDP in 2023, from approximately 0.61% to 5.6%. However, if this research study has a target GDP contribution from the promoted creative economy policy of approximately 7.22%, then it needs to increase the TFP shocks (promoted policy) to approximately more than 11%. This significantly confirms that the public and private sectors need to further develop and promote the creative economy policy as a driving engine of Thailand’s economy for substantial and sustainable economic growth in the future.
Table 7.
Sensitivity of modeled GDP to TFP shocks: policy–baseline differences, 2022–2023 (Unit: billion THB).
4.5. Regional Dynamic CGE Analysis of Thailand’s Creative Economy
4.5.1. Northern Thailand
Table 8 compares the economic performance of Northern Thailand under the baseline and creative economy policy scenarios. The results show that the creative economy policy strengthens the region’s investment capacity and household welfare. In the short run, capital stock, household income, government revenue, and total investment all increase, although GRP growth declines compared with the baseline scenario, suggesting that the policy generates mixed effects across different macroeconomic indicators.
Table 8.
Dynamic CGE simulation results for Northern Thailand under creative economy promotion.
A similar pattern is observed in the long run, with continued gains in capital accumulation, household income, fiscal revenue, and investment, despite lower GRP growth relative to the baseline scenario. These results indicate that the policy scenario generates mixed outcomes for Northern Thailand, with improvements in several economic indicators but no corresponding increase in GRP growth. A more detailed examination of regional economic structures and sectoral adjustments is therefore needed to explain this divergence. Furthermore, sensitivity analysis of the TFP shock would benefit from a region-specific Social Accounting Matrix (SAM) that reflects the economic structure and intersectoral linkages of Northern Thailand. Developing such a regional SAM from Thailand’s national SAM, using an appropriate regionalization method such as RAS and region-specific data where available, could provide a stronger basis for evaluating the regional effects of creative economy policies.
Table 9 presents the sensitivity analysis of the Regional Dynamic CGE model contributing to the GRP (gross regional product) of Northern Thailand, based on both TFP shocks (creative policy promoted) and no TFP shock (no creative policy promoted), for example, during the period 2022–2023.
Table 9.
Sensitivity of modeled Northern Thailand’s GRP to TFP shocks: policy–baseline. Differences 2022–2023 (Unit: million THB).
The results from this study confirm that whenever the private sector and public sector in the Northern region promote the creative policy by increasing TFP from 1% to 11%, the Northern Thailand economy will consistently achieve substantial and sustainable economic growth. If the baseline of creative policy promotion generating income to Thailand’s GDP of 7.22% (from the B-DID model estimation) is the target, then pushing TFP to greater than 7% will lead the GRP of the Northern Thailand economy to grow sustainably.
4.5.2. Northeastern Thailand
Table 10 compares the economic performance of Northeastern Thailand under the baseline and creative economy policy scenarios. The results indicate that the creative economy policy generates positive short-run effects, with improvements in gross regional product (GRP), the capital stock, household income, government revenue, and total investment. These findings suggest that the policy initially stimulates economic activity by strengthening investment, improving household welfare, and enhancing fiscal capacity.
Table 10.
Dynamic CGE simulation results for Northeastern Thailand under creative economy promotion.
However, these gains are not sustained in the long run. GRP declines slightly, while household income, government revenue, and investment fall below the baseline scenario, and capital stock remains broadly unchanged. This suggests that the initial benefits of the policy gradually diminish over time, indicating that the region may require complementary investments in innovation, infrastructure, and human capital to sustain long-term economic growth.
According to the sensitivity analysis, the impact of the TFP shock (creative policy promoted) on the Northeastern Thailand economy is measured. Which it needs to modified the Thailand’s SAM (Social Accounting Matrix by rascal into regional SAMs based on region-specific economic structures and data.
From Table 11, it presents the sensitivity analysis of the Regional Dynamic CGE model contributing to the GRP (gross regional product) of Northeastern Thailand, based on both TFP shocks (creative policy promoted) and no TFP shock (no creative policy promoted), for example, during the period 2022–2023.
Table 11.
Sensitivity of modeled GRP in Northeastern Thailand to TFP shocks: policy–baseline differences, 2022–2023 (Unit: million THB).
The results from this study confirm that whenever the private sector and public sector in the Northeastern region promote the creative policy by increasing TFP from 1% to 11%, the Northeastern Thailand economy will tend to consistently achieve substantial and sustainable economic growth. If the baseline of creative policy promotion generating income to Thailand’s GDP of 7.22% (from the B-DID model estimation) is the target, then pushing TFP to approximately 7% will lead the GRP of the Northeastern Thailand economy to grow sustainably.
4.5.3. Southern Thailand
Table 12 compares the economic performance of Southern Thailand under the baseline and creative economy policy scenarios. The results reveal differences between the two scenarios in both the short and long run. Gross regional product (GRP), capital stock, household income, government income, and total investment also change in a positive direction in both scenarios. Meanwhile, gross regional product (GRP), capital stock, household income, government income, and total investment show positive changes, with differences due to the policy. These findings suggest that the creative economy policy has a relatively positive impact on the region’s economic performance during the simulation period.
Table 12.
Dynamic CGE simulation results for Southern Thailand under creative economy promotion.
The positive policy response reflects the region’s existing economic structure, which is largely supported by established sectors such as tourism, agriculture, fisheries, and international trade. Overall, the results indicate that Southern Thailand is positively responsive to the creative economy policy, highlighting the need for complementary region-specific measures to enhance the short-run and long-term economic benefits.
Regarding the sensitivity analysis to measure the impact of TFP shocks (creative policy promotion) on the Southern Thailand economy, it is necessary to modify Thailand’s SAM (Social Accounting Matrix) by rescaling it into a regional SAM based on region-specific economic structures and data.
Table 13 presents the sensitivity analysis of the Regional Dynamic CGE model contributing to the GRP (gross regional product) of Southern Thailand, based on both TFP shocks (creative policy promoted) and no TFP shock (no creative policy promoted), for example, during the period 2022–2023.
Table 13.
Sensitivity of modeled GRP in Southern Thailand to TFP shocks: policy–baseline differences, 2022–2023 (Unit: million THB).
The results from this study confirm that whenever the private sector and public sector in the Southern region promote the creative policy by increasing TFP from 1% to 11%, the Southern Thailand economy will tend to consistently achieve substantial and sustainable economic growth. If the baseline of creative policy promotion generating income to Thailand’s GDP of 7.22% (from the B-DID model estimation) is the target, then pushing TFP to approximately 7% will lead the GRP of the Southern Thailand economy to grow sustainably, reaching 0.573% higher than the target.
4.5.4. Central Thailand
Table 14 compares the economic performance of Central Thailand under the baseline and creative economy policy scenarios. The results indicate that the creative economy policy has a relatively positive impact on most macroeconomic indicators. In both the short and long run, gross regional product (GRP), the capital stock, household income, government revenue, and total investment show positive changes. These findings suggest that the creative economy policy has a relatively positive impact on the region’s economic performance during the simulation period.
Table 14.
Dynamic CGE simulation results for Central Thailand under creative economy promotion.
These findings imply that creative economy policy promotion strengthens the region’s economic development, especially Central Thailand’s economy under the Creative Economy Promotion policy. For short-term and long-term economic development, the promotion of the creative economy policy should continue in the central area of Thailand. This policy can serve as a powerful engine to drive and magnify economic development in the central region of Thailand.
Regarding the sensitivity analysis to measure the impact of TFP shocks (creative policy promotion) on the Central Thailand economy, it is necessary to modify Thailand’s SAM (Social Accounting Matrix) by rescaling it into a regional SAM based on region-specific economic structures and data.
Table 15 presents the sensitivity analysis of the Regional Dynamic CGE model in terms of its contribution to the GRP (gross regional product) of Central Thailand, based on both TFP shocks (creative policy promoted) and no TFP shock (no creative policy promoted), for example, during the period 2022–2023.
Table 15.
Sensitivity of modeled GRP in Central Thailand to TFP shocks: policy–baseline differences, 2022–2023 (Unit: million THB).
The results from this study confirm that whenever the private sector and public sector in the Central region promote the creative policy by increasing TFP from 1% to 11%, the Central Thailand economy will tend to consistently achieve substantial and sustainable economic growth. If the baseline of creative policy promotion generating income to Thailand’s GDP of 7.22% (from the B-DID model estimation) is the target, then pushing TFP to approximately more than 9% will lead the GRP of the Central Thailand economy to grow sustainably.
5. Conclusions
This study evaluated the economic implications of Thailand’s creative economy policy by integrating Bayesian Difference-in-Differences (B-DID) estimation with a Dynamic Computable General Equilibrium (Dynamic CGE) framework. The analysis provides evidence on both the economy-wide and regional dimensions of the policy. At the national level, the results indicate positive effects on GDP, household income, government revenue, investment, sectoral output, and household consumption. The Dynamic CGE results further suggest that these effects stem primarily from an expansion in overall economic activity rather than major changes in the underlying production and trade structure. This broad economy-wide response is broadly consistent with previous CGE-based evidence for Thailand, which found that promoting creative economy sectors can generate positive economic effects at both the national and provincial levels (Chaiboonsri, 2024).
The regional analysis indicates that the creative economy policy’s effects are not uniform across Thailand (Homsombat et al., 2025).
Based on the sensitivity of modeled GRP, there are no significant differences among the regions in their responses to the creative economy policy promoted by the Thai government. However, each region still shows some differences in its response to this policy. Southern Thailand shows the strongest and most sustained responses across several simulation periods, with TFP shocks ranging from 0% to 11%, especially when the TFP shock exceeds 7% as a result of creative economy policy promotion. The second-ranked region in terms of the strongest and most sustained responses across several simulation periods, with TFP shocks ranging from 0% to 11%, especially above 7%, is Central Thailand. The third-ranked region is Northern Thailand, which responds to the TFP shocks associated with the creative economy policy promoted by the Thai government. Finally, Northeastern Thailand ranks fourth in its response to this policy but still performs well under the policy.
These differences suggest that the effectiveness of creative economy policies depends partly on regional economic structures, productive capacity, human capital, infrastructure, and the ability of local economies to benefit from creative-sector activities (Barca et al., 2012; Homsombat et al., 2025). Overall, the findings suggest that a national creative economy strategy can support economic expansion, but a uniform policy approach may not generate similar benefits across all regions. The main policy implication is therefore the need to combine national support for the creative economy with place-based strategies that reflect each region’s specific economic characteristics and development capacity (Barca et al., 2012).
6. Policy Recommendations
The findings suggest that Thailand should maintain a national framework for creative-economy development while strengthening region-specific implementation. Rather than applying identical interventions across the country, policy support should be aligned with regional economic structures, existing creative capabilities, and local development opportunities (Barca et al., 2012; Homsombat et al., 2025). For Northern Thailand, which the simulations indicate is the third-ranked region, policymakers should focus on consolidating existing strengths by supporting creative clusters, cultural and creative tourism, digital-content industries, design, and entrepreneurship (Chaiboonsri, 2024; Homsombat et al., 2025). Strengthening links among universities, creative firms, tourism businesses, and local governments can help convert existing creative capacity into longer-term productivity and investment. For Northeastern Thailand (the last-ranked region), where the positive effects are stronger in the short run but weaken over time, policies should focus on improving the persistence of creative-sector activity. Targeted support for skills development, digital infrastructure, access to finance, business incubation, and commercialization can help creative enterprises move from short-term expansion toward sustainable growth (Malerba & McKelvey, 2020; Cunningham & McCutcheon, 2023). Greater integration of creative activities with local agriculture, handicrafts, tourism, and small and medium-sized enterprises could also strengthen regional spillovers. Moreover, policymakers should prioritize measures that strengthen the foundations required for creative-sector development. These may include improved digital connectivity, specialized skills training, access to finance for creative enterprises, innovation support, and stronger collaboration among universities, industry, and government (Audretsch & Feldman, 2004; Feldman, 2014; Cunningham & McCutcheon, 2023).
For Southern and Central Thailand, which the current simulations indicate are the first-ranked and second-ranked regions of Thailand, respectively, policymakers should let other regions learn from their successful cases. However, these regions need to continue to be promoted and supported by the public and private sectors to go further and achieve more than they have achieved so far. For example, in the Southern region, creative-economy initiatives could also be linked more closely with cultural assets, tourism, local products, and community-based enterprises. For Central Thailand, greater integration of creative activities with manufacturing, services, digital businesses, and urban economic networks could help strengthen inter-sectoral linkages. Across all regions, policy implementation should be accompanied by measurable indicators of employment, firm creation, productivity, investment, exports, and regional value added. Regular monitoring would allow policymakers to identify which interventions generate sustained economic benefits and to adjust programs according to regional performance. Such an approach would make Thailand’s creative-economy policy more targeted, evidence-based, and responsive to regional differences.
For more effective implementation of policy recommendations, this research study emphasizes three points that need to be prioritized and launched as soon as possible.
First, the overall macroeconomic impact is over 3% (see Table 7) from creative economy policy promotion when this policy is able to raise TFP by 7.224%, based on the simulation analysis for the specific study period (2022–2023). To make sure that this will happen, Thailand’s creative economy policy needs to develop the agricultural sector, industrial sector, and service sector by emphasizing both technological upgrading and innovation support to cover all three sectors in the future (Barca et al., 2012; Homsombat et al., 2025).
The second point that needs to be launched as soon as possible is the policy focusing on upskilling employment effects through intangible human capital upskilling. The increase in upskilling training is represented by the simulation scenarios of 0–11% TFP shocks. It can be implied that these are not direct impacts from the Dynamic CGE model. If the creative economy policy in the future emphasizes increasing the scale of human capital training, such as upskilling in creative thinking, adapting to and adopting innovation, information technology, and AI-based software for future skills, this could be significant for improving productivity (Corrado et al., 2022, 2025). These are the outcomes and ultimate outcomes of promoting long-term sustainable economic growth in Thailand.
Lastly, household income effects need more focus, especially on income equality, which must be improved by promoting the creative economy policy in Thailand (UNCTAD, 2024; Asian Development Bank, 2025). Regarding the Dynamic CGE model estimation from this study, the results confirm that overall household income in Thailand increases (see Table 6).
7. Limitations and Future Research
Despite providing a comprehensive assessment of Thailand’s creative economy policy, this study has several limitations. The Dynamic CGE model relies on aggregated sectoral and regional data and therefore does not explicitly capture firm-level behavior, technological heterogeneity, or household-level distributional effects. In addition, the analysis focuses primarily on economic outcomes and does not explicitly incorporate environmental or social sustainability indicators. Future research could extend this framework by incorporating disaggregated creative industry data, firm-level microdata, labor market dynamics, environmental indicators, and alternative policy scenarios. Comparative studies across ASEAN countries would also provide valuable insights into how creative economy policies contribute to sustainable and inclusive economic development under different institutional and economic contexts. Such extensions would further strengthen the evidence base for designing effective creative economy policies at both the national and regional levels.
Author Contributions
Conceptualization, C.C. and S.C.; methodology, C.C. and S.C.; software, C.C. and S.C.; validation, C.C., C.I. and N.P.; formal analysis, C.C. and S.C.; investigation, C.C., C.I. and N.P.; resources, C.I. and B.T.; data curation, C.I., N.P. and B.T.; writing—original draft preparation, C.C. and S.C.; writing review and editing, C.C., C.I., N.P., S.C. and B.T.; visualization, C.C. and S.C.; supervision, C.C.; project administration, C.C. and B.T.; funding acquisition, C.C. All authors have read and agreed to the published version of the manuscript.
Funding
This research was supported by the CMU Mid-Career Research Fellowship Program, Chiang Mai University, Thailand (Grant No. R69IN00156).
Institutional Review Board Statement
Not applicable.
Informed Consent Statement
Not applicable.
Data Availability Statement
The data supporting the findings of this study were obtained from publicly available secondary sources and analyzed using Bayesian Difference-in-Differences (DID) and Computable General Equilibrium (CGE) models. The datasets used and generated during this study are available from the corresponding author upon reasonable request.
Conflicts of Interest
The authors declare no conflicts of interest.
Appendix A
Table A1.
Baseline SAM structure, model parameters, and elasticity values.
Figure A1.
Comparison between actual GDP and GDP predicted by the Bayesian AR-based model for the period 2001–2008 (in-sample prediction). The blue-shaded area represents the 95% Bayesian credible interval.
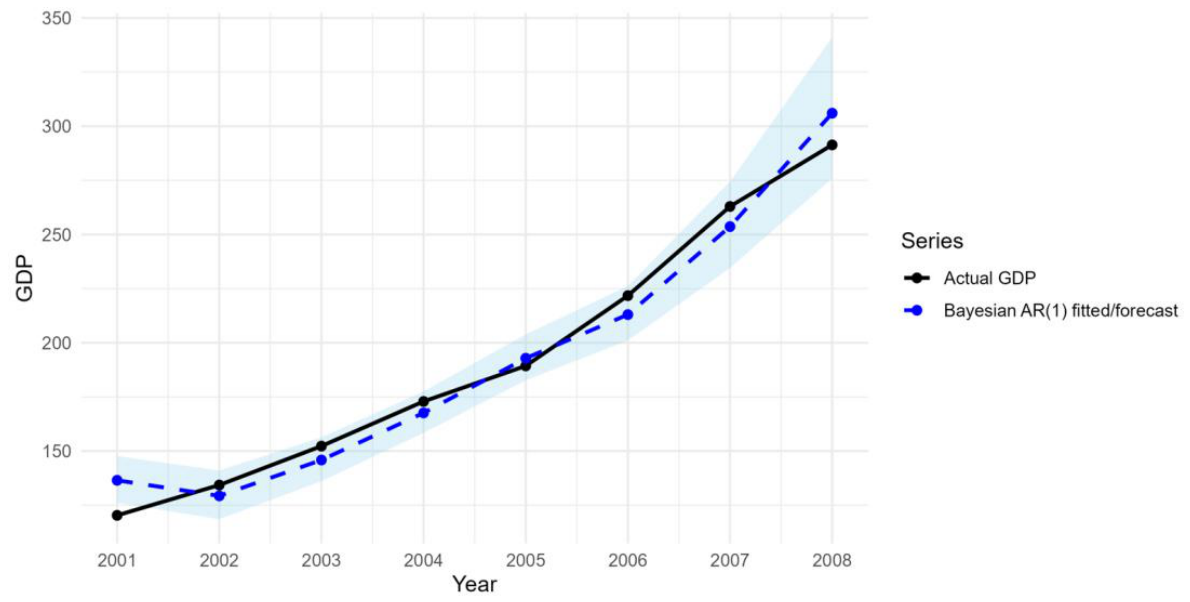
Figure A2.
Comparison between actual GDP and GDP predicted by the Bayesian AR-based model for the period 2006–2008 (out-of-sample prediction for pre-intervention forecast validation). The blue-shaded area represents the 95% Bayesian credible interval.
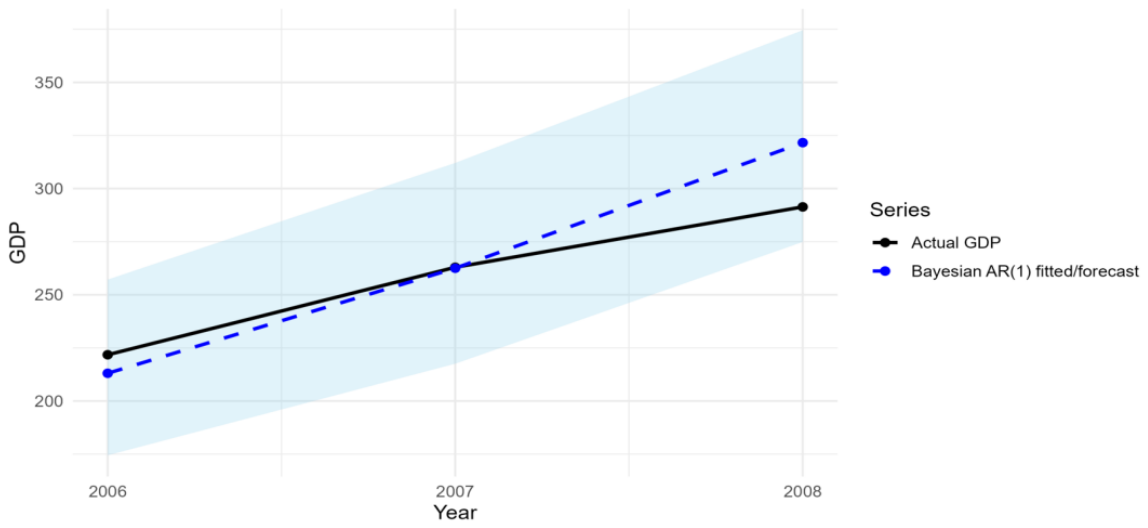
Figure A3.
Comparison between the treatment group (actual GDP) and the control group (counterfactual GDP) before and after the promotion of Thailand’s creative economy policy over the period 2000–2024, with policy promotion beginning in 2009 and the COVID-19 pandemic affecting economic activities during 2020–2023. The vertical dashed line indicates the policy intervention year (2009).
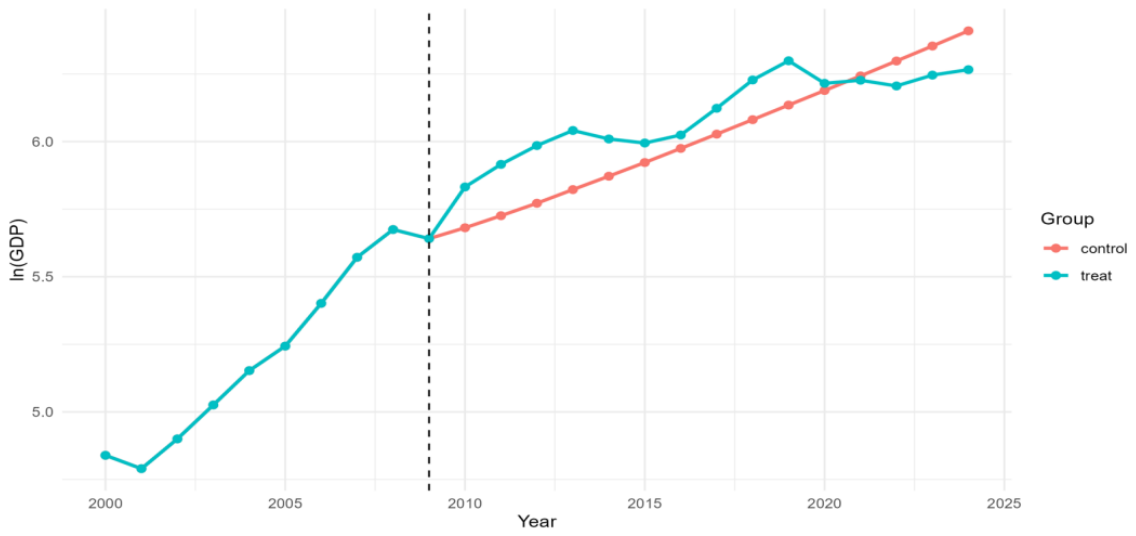
References
- Acemoglu, D., Akcigit, U., Alp, H., Bloom, N., & Kerr, W. (2018). Innovation, reallocation, and growth. American Economic Review, 108(11), 3450–3491. [Google Scholar] [CrossRef] [Scilit]
- Angrist, J. D., & Pischke, J. S. (2009). Mostly harmless econometrics: An empiricist’s companion. Princeton University Press. [Google Scholar]
- Asian Development Bank. (2025). Harnessing the creative economy to accelerate the sustainability transformation in Asia and the pacific. ADBI Publications. [Google Scholar] [CrossRef] [Scilit]
- Audretsch, D. B., & Belitski, M. (2023). Knowledge collaboration, firm productivity and innovation: A critical assessment. Journal of Business Research, 172, 114412. [Google Scholar] [CrossRef] [Scilit]
- Audretsch, D. B., & Feldman, M. P. (2004). Knowledge spillovers and the geography of innovation. In Handbook of regional and urban economics (Vol. 4, pp. 2713–2739). Elsevier. [Google Scholar]
- Barca, F., McCann, P., & Rodríguez-Pose, A. (2012). The case for regional development intervention: Place-based versus place-neutral approaches. Journal of Regional Science, 52(1), 134–152. [Google Scholar] [CrossRef] [Scilit]
- Bertrand, M., Duflo, E., & Mullainathan, S. (2004). How much should we trust differences-in-differences estimates? The Quarterly Journal of Economics, 119(1), 249–275. [Google Scholar] [CrossRef] [Scilit]
- Boğa, S., & Topcu, M. (2020). Creative economy: A literature review on relational dimensions, challanges, and policy implications. Economics, 8(2), 149–169. [Google Scholar] [CrossRef] [Scilit]
- Boix-Domènech, R., & Rausell-Köster, P. (2018). The economic impact of the creative industry in the European Union. In Drones and the creative industry: Innovative strategies for European SMEs (pp. 19–36). Springer International Publishing. [Google Scholar]
- Bontadini, F., Corrado, C., Haskel, J., Iommi, M., Jona-Lasinio, C., & Miyagawa, T. (2024). Intangible capital, TFP growth and green shoots in new productivity data. International Productivity Monitor, 46, 3–37. [Google Scholar]
- Boschma, R. (2004). Competitiveness of regions from an evolutionary perspective. Regional Studies, 38(9), 1001–1014. [Google Scholar] [CrossRef] [Scilit]
- Britz, W., & Roson, R. (2019). G-RDEM: A GTAP-based recursive dynamic CGE model for long-term baseline generation and analysis. Journal of Global Economic Analysis, 4(1), 50–96. [Google Scholar] [CrossRef] [Scilit]
- Callaway, B., & Sant’Anna, P. H. (2021). Difference-in-differences with multiple time periods. Journal of Econometrics, 225(2), 200–230. [Google Scholar] [CrossRef] [Scilit]
- Capello, R. (2011). Location, regional growth and local development theories. Aestimum, 58(1), 1–25. [Google Scholar] [CrossRef] [Scilit]
- Chaiboonsri, C. (2024). The potential analytical impact of significant sectoral creative economy on Thailand’s economy: A case study of the IRS-CGE model vs. the CRS-CGE model for both the national and provincial economies. Economies, 12(2), 44. [Google Scholar] [CrossRef] [Scilit]
- Chang, Y. Y., Potts, J., & Shih, H. Y. (2021). The market for meaning: A new entrepreneurial approach to creative industries dynamics. Journal of Cultural Economics, 45(3), 491–511. [Google Scholar] [CrossRef] [Scilit]
- Cicowiez, M., & Lofgren, H. (2017). A GEM for streamlined dynamic CGE analysis: Structure, interface, data, and macro application (World Bank Policy Research Working Paper No. 8272). World Bank. [Google Scholar]
- Cohen, W. M., & Levinthal, D. A. (1990). Absorptive capacity: A new perspective on learning and innovation. Administrative Science Quarterly, 35, 128–152. [Google Scholar] [CrossRef] [Scilit]
- Comunian, R., England, L., Faggian, A., & Mellander, C. (2021). The economics of talent: Human capital, precarity and the creative economy. Springer Nature. [Google Scholar]
- Corrado, C., Haskel, J., Iommi, M., Jona-Lasinio, C., & Bontadini, F. (2025). Data, intangible capital, and productivity. In S. Basu, L. Eldridge, J. Haltiwanger, & E. Strassner (Eds.), Technology, productivity, and economic growth (pp. 193–243). University of Chicago Press. [Google Scholar]
- Corrado, C., Haskel, J., Jona-Lasinio, C., & Iommi, M. (2022). Intangible capital and modern economies. Journal of Economic Perspectives, 36(3), 3–28. [Google Scholar] [CrossRef] [Scilit]
- Cunningham, S., & McCutcheon, M. (2023). Rearticulating the creative industries-STEM relationship: The case of innovation precincts in South Australia. Creative Industries Journal, 16(1), 22–41. [Google Scholar] [CrossRef] [Scilit]
- Dellisanti, R. (2023). Cultural and creative industries and regional development. Springer International Publishing. [Google Scholar] [CrossRef] [Scilit]
- Dellisanti, R. (2025). Cultural and creative industries and local economic growth: Exploring the urban channel. Spatial Economic Analysis, 20(3), 457–483. [Google Scholar] [CrossRef] [Scilit]
- Dixon, P. B., & Jorgenson, D. (2013a). An introduction to CGE modeling. In Handbook of computable general equilibrium modeling (pp. 1–22). Elsevier. [Google Scholar] [CrossRef] [Scilit]
- Dixon, P. B., & Jorgenson, D. (Eds.). (2013b). Handbook of computable general equilibrium modeling. Newnes. [Google Scholar]
- Dixon, P. B., & Rimmer, M. T. (2010). Validating a detailed, dynamic CGE model of the USA. Economic Record, 86, 22–34. [Google Scholar] [CrossRef] [Scilit]
- Feldman, M. P. (1999). The new economics of innovation, spillovers and agglomeration: A review of empirical studies. Economics of Innovation and New Technology, 8(1–2), 5–25. [Google Scholar] [CrossRef] [Scilit]
- Feldman, M. P. (2014). The character of innovative places: Entrepreneurial strategy, economic development, and prosperity. Small Business Economics, 43(1), 9–20. [Google Scholar] [CrossRef] [Scilit]
- Fiscal Policy Research Institute & Kenan Institute Asia. (2009). Economic contributions of Thailand’s creative industries: Final report. Thailand Creative & Design Center. [Google Scholar]
- Furman, J. L., Porter, M. E., & Stern, S. (2002). The determinants of national innovative capacity. Research Policy, 31(6), 899–933. [Google Scholar] [CrossRef] [Scilit]
- Gelman, A., Carlin, J. B., Stern, H. S., Dunson, D. B., Vehtari, A., & Rubin, D. B. (2021). Bayesian data analysis (4th ed.). Chapman & Hall/CRC. [Google Scholar]
- Ghaith, Z., Kulshreshtha, S., Natcher, D., & Cameron, B. T. (2021). Regional computable general equilibrium models: A review. Journal of Policy Modeling, 43(3), 710–724. [Google Scholar] [CrossRef] [Scilit]
- Giesecke, J. A., & Madden, J. R. (2013). Regional computable general equilibrium modeling. In Handbook of computable general equilibrium modeling (Vol. 1A, pp. 379–475). Elsevier. [Google Scholar]
- Goodman-Bacon, A. (2021). Difference-in-differences with variation in treatment timing. Journal of Econometrics, 225(2), 254–277. [Google Scholar] [CrossRef] [Scilit]
- He, L., Li, X., Cui, Q., Guan, B., Li, M., & Chen, H. (2024). Decarbonization pathways to subregional carbon neutrality in China based on the top-down multi-regional CGE model: A study of Guangxi. Energy, 294, 130846. [Google Scholar] [CrossRef] [Scilit]
- Homsombat, W., Wrasai, P., & Benjabutr, N. (2025). Measuring the impact of creative city attributes on regional economic development in Thailand. Asia-Pacific Journal of Regional Science, 9(2), 357–385. [Google Scholar] [CrossRef] [Scilit]
- Horridge, J. M., & Wittwer, G. (2017). Top-down extensions to represent counties and congressional districts and moving to bottom-up. In Multi-regional dynamic general equilibrium modeling of the U.S. economy (pp. 173–192). Springer. [Google Scholar]
- Hosoe, N., Gasawa, K., & Hashimoto, H. (2010). Textbook of computable general equilibrium modeling: Programming and simulations. Springer. [Google Scholar]
- Innocenti, N., & Lazzeretti, L. (2019). Do the creative industries support growth and innovation in the wider economy? Industry relatedness and employment growth in Italy. Industry and Innovation, 26(10), 1152–1173. [Google Scholar] [CrossRef] [Scilit]
- Malerba, F., & McKelvey, M. (2020). Knowledge-intensive innovative entrepreneurship integrating Schumpeter, evolutionary economics, and innovation systems. Small Business Economics, 54(2), 503–522. [Google Scholar] [CrossRef] [Scilit]
- Manioudis, M., & Angelakis, A. (2023). Creative economy and sustainable regional growth: Lessons from the implementation of entrepreneurial discovery process at the regional level. Sustainability, 15(9), 7681. [Google Scholar] [CrossRef] [Scilit]
- McElreath, R. (2020). Statistical rethinking: A Bayesian course with examples in R and stan (2nd ed.). CRC Press. [Google Scholar]
- Miguélez, E., & Moreno, R. (2015). Knowledge flows and the absorptive capacity of regions. Research Policy, 44(4), 833–848. [Google Scholar] [CrossRef] [Scilit]
- Nelson, R. R. (2004). The market economy, and the scientific commons. Research Policy, 33(3), 455–471. [Google Scholar] [CrossRef] [Scilit]
- Office of the National Economic and Social Development Council [NESDC]. (2025). Input–output table of Thailand 2021. Office of the Prime Minister, Bangkok, Thailand. Available online: https://www.nesdc.go.th/wordpress/wp-content/uploads/2025/06/article_file_20250611081007.pdf (accessed on 8 August 2026).
- Pike, A., Rodríguez-Pose, A., & Tomaney, J. (2017). Shifting horizons in local and regional development. Regional Studies, 51(1), 46–57. [Google Scholar] [CrossRef] [Scilit]
- Pressé, S., & Sgouralis, I. (2023). Bayesian inference. In Data modeling for the sciences. Cambridge University Press. [Google Scholar]
- Rodríguez-Insuasti, H., Montalván-Burbano, N., Suárez-Rodríguez, O., Yonfá-Medranda, M., & Parrales-Guerrero, K. (2022). Creative economy: A worldwide research in business, management and accounting. Sustainability, 14(23), 16010. [Google Scholar] [CrossRef] [Scilit]
- Romer, P. M. (1990). Endogenous technological change. Journal of Political Economy, 98(5), S71–S102. [Google Scholar] [CrossRef] [Scilit] [PubMed]
- Roth, J., Sant’Anna, P. H., Bilinski, A., & Poe, J. (2023). What’s trending in difference-in-differences? A synthesis of the recent econometrics literature. Journal of Econometrics, 235(2), 2218–2244. [Google Scholar] [CrossRef] [Scilit]
- Scott, A., & Storper, M. (2003). Regions, globalization, development. Regional Studies, 37(6–7), 579–593. [Google Scholar] [CrossRef] [Scilit]
- Sun, L., & Abraham, S. (2021). Estimating dynamic treatment effects in event studies with heterogeneous treatment effects. Journal of Econometrics, 225(2), 175–199. [Google Scholar] [CrossRef] [Scilit]
- UNCTAD. (2024). Creative economy outlook 2024. United Nations. Available online: https://unctad.org/publication/creative-economy-outlook-2024 (accessed on 8 August 2026).
- Wen, F., Yang, S., & Huang, D. (2023). Heterogeneous human capital, spatial spillovers and regional innovation: Evidence from the Yangtze River Economic Belt, China. Humanities and Social Sciences Communications, 10(1), 365. [Google Scholar] [CrossRef] [Scilit]
- Ziesmer, J., Jin, D., Thube, S. D., & Henning, C. (2023). A dynamic baseline calibration procedure for CGE models. Computational Economics, 61, 1331–1368. [Google Scholar] [CrossRef] [Scilit]
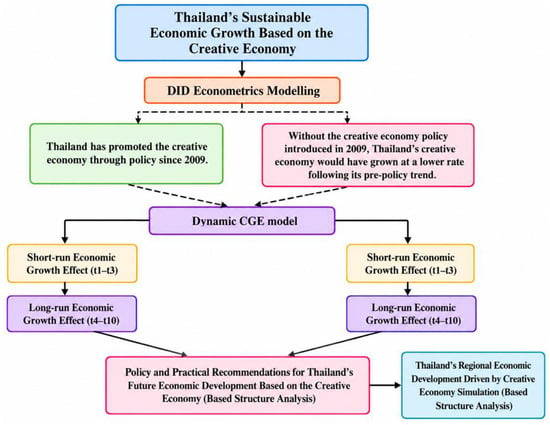
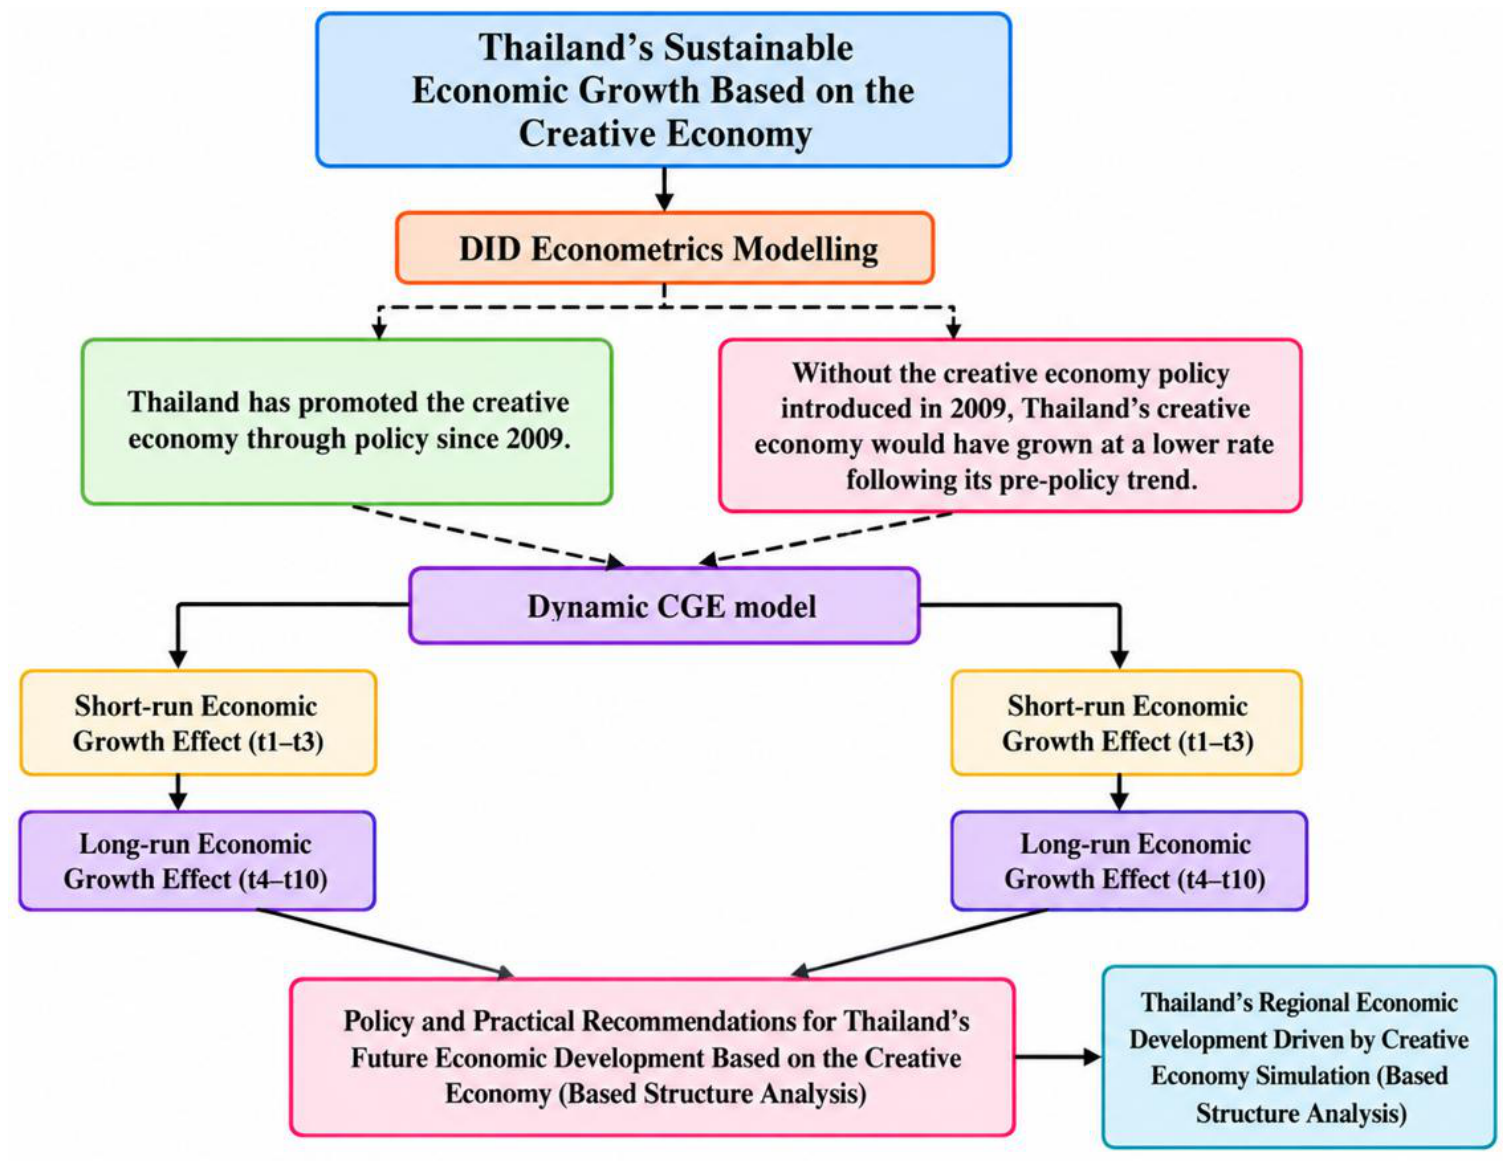

Disclaimer/Publisher’s Note: The statements, opinions and data contained in all publications are solely those of the individual author(s) and contributor(s) and not of MDPI and/or the editor(s). MDPI and/or the editor(s) disclaim responsibility for any injury to people or property resulting from any ideas, methods, instructions or products referred to in the content. |
© 2026 by the authors. Licensee MDPI, Basel, Switzerland. This article is an open access article distributed under the terms and conditions of the Creative Commons Attribution (CC BY) license.