


Abstract
Using global soybean trade data from 2011 to 2023, this study examines how China’s 2018 retaliatory tariff on U.S. soybeans altered the geographical and product composition of its agricultural imports. We employ difference-in-differences models to compare changes in directly exposed U.S. soybean imports with changes in imports from alternative source countries and substitute products. The results show that the tariff significantly reduced the relative import share of U.S. soybeans and redirected demand toward Brazil, Argentina, and several smaller suppliers. However, the expansion of alternative sourcing channels did not produce a sustained decline in aggregate import concentration, because Brazil absorbed a substantial share of the displaced demand. At the product level, the contemporaneous substitution effect is statistically insignificant, whereas the lagged effect is significant, indicating that product adjustment is constrained by technological, contractual, and infrastructural rigidities. The tariff therefore induced source-country reallocation relatively quickly, while relative-price-induced product substitution emerged only after an adjustment period. These findings clarify how trade-policy shocks reshape agricultural import relationships and provide implications for reducing supplier concentration, strengthening substitution capacity, and improving the resilience of China’s soybean import system.
Keywords:
retaliatory tariffs; soybean imports; source-country reallocation; product substitution; supply chain resilience JEL Classification:
F13; F14; Q17; Q18
1. Introduction
Cross-border cooperation is a fundamental driving force behind the formation and evolution of the global agricultural trade network. China and the United States are two of the world’s largest merchandise-trading economies. According to World Trade Organization statistics, their combined merchandise exports and imports accounted for approximately 23.2% of world merchandise trade by value in 2023. In this study, merchandise trade refers to trade in goods measured in current U.S. dollars, and the reported share is calculated from the combined merchandise exports and imports of the two countries relative to the corresponding world totals; commercial services trade is excluded (World Trade Organization, 2024). However, since 2018, escalating trade frictions between the two countries have evolved into a full-scale trade dispute (Li, 2026), substantially reshaping grain trade patterns not only between China and the United States but also across the global market (Tam, 2020). As one of the most strategically important agricultural commodities, soybeans play a critical role in national food security and exhibit a high degree of import dependence in China. The soybean supply chain spans multiple stages, including breeding, cultivation, processing, logistics, and distribution, forming a highly integrated global production network. The U.S.–China trade dispute significantly increased China’s soybean import costs, exposing domestic firms to rising risks of supply chain disruptions and forcing them to restructure their import supply networks (Sun et al., 2026).
As the world’s largest soybean importer, China relies heavily on international markets to satisfy its domestic demand. Figure 1 visualizes China’s bilateral soybean import flows by source country in 2023. The thickness of each flow is proportional to the physical volume of China’s soybean imports from the corresponding source country, measured in million metric tons; it does not represent import value or import share. Thicker flows therefore indicate larger quantities of soybeans supplied to China. As shown in the figure, China’s soybean imports remained highly concentrated among a small number of major suppliers, with Brazil and the United States accounting for the largest import volumes, followed by Argentina, Canada, Uruguay, Russia, Ukraine, Kazakhstan, and several smaller suppliers in Africa. Although the number of active source countries expanded beyond the traditional suppliers in the Americas, the overall sourcing structure remained highly concentrated. Such dependence on a limited number of major suppliers exposes China’s soybean import system to trade-policy uncertainty, geopolitical conflict, and climate-related supply disruptions.
Figure 1.
China’s Soybean Import Flows by Source Country, 2023. Flow thickness is proportional to import volume, measured in million metric tons. Source: Authors’ visualization based on UN Comtrade bilateral soybean import quantity data (https://comtradeplus.un.org/, accessed on 15 July 2026).
As the world’s largest soybean consumer and producer, respectively, China and the United States play pivotal roles in the global soybean market (Wilson & Bullock, 2025). Substantial changes in bilateral tariff policies can undermine the stability of supply chain networks in both countries and more broadly, disrupt the functioning of the global soybean supply chain, thereby triggering supply chain reconfiguration. In July 2018, China imposed retaliatory tariffs on a range of U.S. products, including soybeans. In the same year, China’s total soybean imports declined to 88.04 million tons, representing a year-on-year decrease of 7.84%. Among China’s three largest soybean suppliers, imports from Brazil increased to 66.08 million tons, up 29.76% from the previous year, while imports from the United States fell sharply to 16.64 million tons, a decline of 49.35%, and imports from Argentina decreased to 1.46 million tons, down 77.76% (these figures are calculated by the authors based on UN Comtrade data). The decline in imports from Argentina should not be interpreted as a consequence of the tariff shock alone. Argentina experienced a severe drought during the 2017/2018 production season, which reduced soybean output and export availability. Moreover, a substantial share of Argentina’s soybeans is absorbed by its domestic crushing industry and exported in processed forms. These supply-side constraints limited Argentina’s immediate capacity to replace U.S. soybeans in the Chinese market.
This policy shock not only disrupted the existing equilibrium in global soybean trade but also fundamentally reshaped China’s soybean import structure (Gao & Andrei, 2026). On the one hand, higher import costs for U.S. soybeans prompted China to increase imports from alternative exporting countries to mitigate supply risks. On the other hand, importers and trading firms actively reconfigured their global sourcing networks by diversifying procurement channels, adjusting sourcing strategies, and strengthening domestic substitution capacity. This adjustment process reflects the resilience and adaptive capacity of agricultural supply chains in response to external shocks. Understanding the patterns and mechanisms of soybean supply chain reconfiguration under trade policy shocks is therefore essential for enhancing supply chain resilience. Against the backdrop of profound changes in the global trading system and intensifying great-power competition, China’s agricultural supply chain faces unprecedented external challenges. In this context, understanding how U.S.–China trade policy shocks have reshaped China’s soybean import supply chain and identifying the underlying mechanisms are of considerable importance for developing effective strategies to enhance supply chain resilience, safeguard national food security, and promote the sustainable development of China’s soybean industry.
The literature related to this study can be broadly classified into three strands. The first strand examines the macroeconomic consequences of trade policy shocks, with particular attention to their effects on prices, welfare, trade flows, and the spatial organization of production. Early studies primarily focused on the welfare and trade effects of the U.S.–China trade war. For example, P. D. Fajgelbaum and Khandelwal (2022) show that tariff increases generated substantial welfare losses and distorted bilateral trade patterns, while Benguria (2023) highlights their implications for firms’ production and sourcing decisions. Building on this literature, subsequent studies document that trade policy shocks have also generated significant trade diversion and trade creation effects (Zheng et al., 2023) and accelerated the reorganization of global value chains and production networks (Freund et al., 2024; P. Fajgelbaum et al., 2024). A related stream shifts the focus from realized policy shocks to trade policy uncertainty. Existing evidence suggests that heightened uncertainty adversely affects financial markets (He et al., 2021), disrupts agricultural trade (Nong, 2021), and discourages broader international economic activities (Yu et al., 2023). Although this literature provides important insights into the aggregate consequences of trade policy shocks, considerably less attention has been paid to how such shocks reshape cross-border supply chain relationships, particularly through product-level adjustments.
The second strand of literature focuses on agricultural supply chain resilience. Existing studies generally conceptualize resilience as the ability of supply chains to anticipate, absorb, and recover from external disruptions, emphasizing the importance of digital transformation, network coordination, organizational capabilities, and technological innovation (Hamidu et al., 2022; Ali et al., 2023). More recent studies extend this perspective by examining how agricultural supply chains respond to major external disruptions, including climate change, natural disasters, and the COVID-19 pandemic (Zhong et al., 2024; Zhao et al., 2024; Zhou et al., 2026). Collectively, these studies substantially improve our understanding of resilience-building strategies. Nevertheless, the existing literature concentrates predominantly on non-policy shocks, leaving the mechanisms through which trade policy interventions reshape agricultural supply chains largely unexplored.
The third strand examines the observable reconfiguration of supply chains after an external shock has occurred. This strand is analytically distinct from the preceding literature on agricultural supply chain resilience. Whereas the second strand focuses primarily on the organizational, technological, and coordination capabilities that enable a supply chain to anticipate, absorb, and recover from disruptions, the third strand investigates the specific adjustment decisions through which these capabilities are translated into changes in supply chain structure. Such decisions include switching suppliers, reallocating procurement across countries, developing alternative sourcing relationships, substituting inputs, and reorganizing production and distribution networks (Akram et al., 2024; Alabi & Ngwenyama, 2023; Das et al., 2023). This literature therefore conceptualizes resilience not merely as a set of pre-existing capabilities, but as a dynamic process of adaptation following a realized shock. However, existing studies generally examine individual adjustment strategies or treat sourcing diversification, technological adjustment, and input substitution as separate responses. Less attention has been paid to the sequence in which different adjustment margins emerge or to whether geographical reallocation and product-level substitution occur at the same speed. Moreover, the dynamic reconfiguration of agricultural import relationships following a targeted trade-policy shock remains insufficiently examined. This study addresses this gap by jointly investigating source-country reallocation and product-level substitution and by distinguishing their contemporaneous and lagged responses to China’s 2018 retaliatory tariff.
Compared to existing literature, the marginal contribution of this study is as follows: First, it employs a difference-in-differences framework to identify the relative reallocation of China’s soybean imports following the 2018 retaliatory tariff. Rather than relying solely on descriptive trends or equilibrium simulations, the analysis compares changes in directly exposed U.S. soybean imports with changes in imports from alternative source countries and substitute products. Second, it integrates source-country reallocation and product-level substitution within a unified framework, thereby distinguishing changes in suppliers from changes in the composition of imported agricultural products. Third, it identifies temporal heterogeneity in the adjustment process. The results show that source-country reallocation emerged relatively quickly, whereas product substitution became statistically evident only after an adjustment period, highlighting the role of technological, contractual, and infrastructural rigidities in agricultural supply-chain reconfiguration.
2. Research Hypothesis
Under the U.S.–China trade policy shock, China’s soybean supply chain faces substantial disruptions in its relationships with major exporting countries. According to comparative advantage theory, international trade patterns are shaped by cross-country differences in relative production costs, productivity, resource endowments, and export capacity (Dornbusch et al., 1977). In the soybean market, the pre-tariff sourcing structure reflected the comparative advantages of major exporters such as the United States, Brazil, and Argentina in terms of land availability, production scale, export infrastructure, seasonal supply, and established trading relationships. From the importer’s perspective, sourcing decisions depend not only on production costs but also on the landed cost of soybeans, which incorporates the export price, tariffs, transportation costs, and other bilateral trade costs (Anderson & van Wincoop, 2003).
Moreover, soybeans supplied by different countries should not be treated as perfectly homogeneous. Under the Armington framework, otherwise similar products are differentiated by their country of origin and are therefore imperfect substitutes (Armington, 1969). This framework is relevant to the soybean market because soybeans from different origins may differ in quality, protein and oil content, harvesting season, transportation distance, delivery reliability, and contractual arrangements. China’s retaliatory tariff selectively increased the landed cost of U.S. soybeans without imposing the same additional tariff on soybeans supplied by other countries. It therefore weakened the relative price competitiveness of U.S. soybeans and increased the attractiveness of alternative suppliers.
The expected sourcing response depends on both relative prices and the ability of alternative exporters to expand supply. Established suppliers such as Brazil and Argentina could respond relatively quickly because they already possessed substantial production capacity, export infrastructure, and trading relationships with China. By contrast, smaller suppliers faced greater capacity, logistics, and market-entry constraints and were therefore more likely to expand their exports gradually. Accordingly, the tariff was expected to redirect part of China’s soybean import demand away from the United States, initially toward established exporters and subsequently toward a broader range of alternative source countries.
Beyond source-country reallocation, the tariff shock may also induce product-level adjustment. This mechanism can be explained by standard production theory. A cost-minimizing firm determines its combination of inputs according to their relative prices, marginal productivity, and technological substitutability. When the price of one input rises relative to the prices of other inputs, the firm has an incentive to reduce its use of the relatively expensive input and increase its use of technically feasible alternatives. The magnitude of this response depends on the elasticity of substitution between inputs (Arrow et al., 1961; Chambers, 1988).
In the present context, China’s retaliatory tariff increased the relative import cost of U.S. soybeans and may also have raised the cost of the broader soybean input composite when imports from alternative source countries could not fully offset the reduction in U.S. supply. Downstream crushing, food-processing, and livestock-feed firms therefore had incentives to reconsider their input combinations. However, the selected products are not homogeneous or one-to-one substitutes for soybeans. Alternative oilseeds may replace part of the oil-bearing input supplied by soybeans; vegetable oils may substitute for part of the oil output obtained from domestic soybean crushing; soybean meal and peanut meal may supplement protein-feed inputs; and corn may partially replace the energy component of livestock-feed formulations. These products should therefore be understood as functionally related and partial substitutes.
Production theory also explains why product-level adjustment may occur more slowly than source-country reallocation. Changing the source country allows importers to continue purchasing the same commodity, whereas replacing soybeans with other products may require adjustments in processing technologies, feed formulations, storage facilities, quality standards, logistics systems, and supply contracts. These technological, contractual, and infrastructural adjustment costs constrain firms’ immediate responses to relative-price changes. Consequently, the tariff-induced product-substitution effect may not appear contemporaneously but may become more evident after firms have had sufficient time to modify their production and procurement arrangements.
Taken together, although trade policy shocks initially disrupt existing supply chains, they also induce adaptive adjustments through geographical diversification and product substitution. These adjustments facilitate the reconfiguration of China’s soybean import supply chain and strengthen its long-run resilience. Therefore, we propose the following hypothesis.
H1.
Following China’s 2018 retaliatory tariff on U.S. soybeans, source-country reallocation occurs more rapidly than product-level substitution, with the former emerging in the year of implementation and the latter becoming more evident after an adjustment period.
China’s retaliatory tariffs on U.S. soybeans also generate significant trade diversion and trade creation effects. Prior to the tariff increase, the United States accounted for a substantial share of China’s soybean imports because of its strong price competitiveness. Once tariffs increased the relative price of U.S. soybeans, Chinese importers shifted procurement toward traditional suppliers such as Brazil and Argentina, generating a trade diversion effect (Song et al., 2025). At the same time, higher tariffs increased the maximum acceptable import price in the Chinese market, making previously uncompetitive suppliers including Ukraine, Russia, and Canada viable alternatives, thus creating a trade creation effect (Chen et al., 2024). As these emerging suppliers entered China’s import market, the geographical distribution of soybean imports became more diversified, expanding the participation of previously marginal suppliers in China’s soybean import market.
Accordingly, trade policy shocks reshape China’s import sourcing structure through both trade diversion and trade creation mechanisms. We therefore propose the following hypothesis.
H2.
Following the 2018 tariff shock, the relative share of U.S. soybeans in China’s soybean imports decreases, while the import shares of alternative suppliers increase, indicating a source-country reallocation away from the United States.
China’s retaliatory tariff on U.S. soybeans constitutes an external relative-price shock that selectively increases the import cost of U.S. soybeans. The resulting change in relative prices reduces the competitiveness of U.S. soybeans and creates incentives for downstream firms to adjust their input combinations. We refer to this mechanism as relative-price-induced product substitution. It describes the reallocation of import demand from soybeans toward functionally related products following a tariff-induced change in relative prices, rather than a separate regulatory intervention. Trade policy shocks may also trigger product substitution through changes in relative prices. China’s retaliatory tariffs on U.S. soybeans constitute an exogenous price shock that selectively increases the import cost of U.S. soybeans (Han et al., 2025). Soybeans are an important source of vegetable oil and protein feed, but they are not irreplaceable in downstream production (Parrini et al., 2023). Standard production theory suggests that firms substitute away from relatively expensive inputs toward cheaper alternatives, with the extent of substitution depending on input substitutability. As soybean prices increase, downstream processors are expected to reduce soybean imports while increasing imports of alternative agricultural products, including rapeseed, peanuts, soybean meal, and vegetable oils (Zhang et al., 2025). At the aggregate level, these firm-level adjustments result in a shift in China’s import basket from soybeans toward substitute products. This represents not merely a short-run response to price changes but also a strategic adjustment that enhances supply chain resilience by reducing dependence on a single commodity. Through this mechanism, trade policy shocks reshape China’s import structure at the product level. Accordingly, we propose the following hypothesis.
H3.
China’s retaliatory tariff on U.S. soybeans reduces the relative import share of soybeans compared with selected functionally related substitute products; because product substitution involves technological, contractual, and infrastructural adjustment costs, this negative effect is expected to become statistically evident after a time lag rather than immediately.
3. China’s Soybean Import Current Status and Structural Evolution
3.1. Current Status of China’s Soybean Import Sources
Overall, China’s soybean imports have exhibited a clear upward trend over the sample period. As shown in Figure 2, total soybean imports increased from 52.45 million tons in 2011 to 87.39 million tons in 2023, representing an increase of 34.93 million tons. China’s soybean imports are also highly concentrated, with the United States, Brazil, and Argentina consistently serving as its three major suppliers. In 2023, soybean imports from these countries reached 22.43, 59.67, and 1.99 million tons, respectively.
Figure 2.
Soybean Imports from China’s Major Source Countries, 2011–2023. Source: Authors’ calculations based on UN Comtrade data (https://comtradeplus.un.org/, accessed on 15 July 2026).
Brazil surpassed the United States as China’s largest soybean supplier in 2013, accounting for 50.19% of China’s total soybean imports that year. A notable structural shift occurred in 2018 following the U.S.–China trade dispute. Imports from the United States declined sharply by 49.35% compared with the previous year, while imports from Brazil increased by 29.76%, reflecting a substantial reallocation of China’s soybean import sources. Although China also imports soybeans from countries such as Canada, Uruguay, and Russia, their combined market share accounted for only 3.68% in 2023. Imports from other suppliers—including Ukraine, Chile, and Ethiopia—remain negligible and have little influence on the overall import structure.
Figure 3 shows that Brazil, the United States, and Argentina consistently rank among the top three sources of soybean imports. Since 2013, Brazil has maintained the largest share, accounting for approximately 50–75%. The United States follows, with a share of around 20–40%; however, its share has exhibited a declining trend in recent years, reaching 21.07% in 2023, which represents a decrease of 21.31 percentage points relative to 2011. The largest annual decline occurred in 2018, with a drop of 15.49 percentage points.
Figure 3.
Share of China’s Soybean Imports by Source Country, 2011–2023. Source: Authors’ calculations based on UN Comtrade data (https://comtradeplus.un.org/, accessed on 15 July 2026).
In contrast, the shares of Brazil, Canada, Uruguay, and other countries have increased. In particular, Brazil’s share reached 71.07% in 2023, an increase of 31.75 percentage points compared with 2011. The most pronounced annual increase also occurred in 2018, rising by 21.76 percentage points.
3.2. The Structure and Evolution of China’s Soybean Import Sources
To precisely evaluate the structural composition of China’s soybean import market by origin, this study employs the CR4 (Concentration Ratio) and HHI (Herfindahl–Hirschman Index)—two standard metrics from industrial organization to measure market concentration. The CR4 index measures the concentration of China’s soybean import sources by summing the import shares of the four largest source countries. In this study, it represents the combined share of China’s total soybean imports supplied by its four largest foreign suppliers in a given year. In this study, we utilize CR4 as a representative metric, which signifies the aggregate share of China’s total soybean imports accounted for by the top four exporting nations. The calculation formula is as follows:
where represents the import volume from the i-th largest country of origin for China’s soybean imports, and N is the total number of countries from which China imports soybeans.
The HHI, or Herfindahl–Hirschman Index, is employed to capture relative market concentration. Its calculation formula is as follows:
where represents the total import volume of China’s soybean market; denotes the import volume from the i-th largest country of origin for China’s soybean imports; represents the market share of the i-th largest soybean exporting nation; and N is the total number of countries from which China imports soybeans. The calculated concentration ratios and HHI values are presented in Table 1.
Table 1.
China’s Soybean Import CR4 and HHI Indices.
As indicated in Table 1, the CR4 index for China’s soybean import market consistently exceeds 0.96. According to Bain’s market structure classification standards, an index value of CR4 > 75% categorizes the soybean import market as a highly concentrated oligopoly, a finding that aligns with the existing consensus in the literature. Regarding the HHI, the market yields an average index value of 0.4469, classifying it as a Type-I highly concentrated oligopoly, with concentration levels exhibiting an upward trend in recent years.
These empirical results underscore the critical issues of excessive market concentration and formidable seller market power within China’s soybean imports. Against the backdrop of global trade liberalization, while imports can temporarily buffer domestic demand, the highly homogenized import channels and profound reliance on a few primary nations of origin leave the country inherently vulnerable to trade frictions. Dismantling this monopolistic market structure will require prolonged, strategic efforts, as diversifying soybean import sources continues to pose substantial challenges.
Figure 4 illustrates substantial changes in the geographical composition of China’s soybean imports between 2011 and 2023. Following the imposition of retaliatory tariffs in 2018, imports from the United States declined sharply, while Brazil absorbed a large share of the displaced demand. China also expanded imports from several smaller suppliers. However, the entry or expansion of these suppliers did not produce a sustained decline in aggregate import concentration. The HHI increased to 0.5332 in 2023, the second-highest value during the sample period, while the CR4 remained above 0.96. These patterns indicate source-country reallocation rather than an unambiguous transition toward a less concentrated structure. Reduced reliance on the United States was accompanied by increased reliance on Brazil.
Figure 4.
Evolution of China’s Soybean Import Pattern, 2011–2023. Source: Authors’ visualization based on UN Comtrade soybean import data (https://comtradeplus.un.org/, accessed on 15 July 2026).
3.3. Current Status of China’s Imports of Soybeans and Substitutes
China’s imports of US soybeans are highly concentrated in fulfilling two core domestic demands: edible oil consumption and protein feed for livestock and poultry. On the oil extraction side, alternative oilseed crops—such as peanuts, sunflower seeds, and rapeseed—as well as the direct import of various vegetable oils (e.g., soybean oil, peanut oil, and rapeseed oil) serve as viable substitutes. On the feed side, substitution may occur through two channels. First, corn may partially substitute for the energy component of soybean-based feed formulations. Second, selected oilseed meals—specifically soybean meal and peanut meal—may supplement the protein-feed component. Soybean meal and peanut meal are treated as distinct products in the empirical analysis and are not used interchangeably with the broader category of oilseed meals. Therefore, the product-level analysis includes 12 product categories: soybeans and 11 functionally related substitute products. The substitute products comprise corn, peanuts, flaxseed, rapeseed, sunflower seeds, other oilseeds (HS 1207), soybean oil, peanut oil, rapeseed oil, soybean meal, and peanut meal.
The current status and import structure of China’s imports of US soybeans and their primary substitutes are detailed below. As reported in Figure 5, the import volume of US soybeans initially rises and subsequently declines over the 2011–2023 period, whereas the import volume of its substitutes demonstrated a steady upward trajectory. Among these substitutes, corn and rapeseed registered the highest import volumes, reaching 26.23 million metric tons and 5.49 million metric tons in 2023, respectively. Conversely, imports of soybean meal and peanut meal were the lowest; soybean meal imports stood at a mere 38,000 metric tons in 2023, while peanut meal imports amounted to just 1.38 metric tons—a negligible volume that can be effectively discounted.
Figure 5.
China’s Imports of Soybeans and Substitute Products, 2011–2023. Source: Authors’ calculations based on UN Comtrade data (https://comtradeplus.un.org/, accessed on 15 July 2026).
Soybeans provide two economically distinct outputs after crushing: vegetable oil and protein meal. The selected substitute products therefore operate through different functional channels and should not be regarded as homogeneous or perfect substitutes. Alternative oilseeds, including rapeseed, peanuts, sunflower seeds, flaxseed, and other oilseeds (HS 1207), may substitute for soybeans as oil-bearing raw materials. Direct imports of vegetable oils may replace part of the oil output otherwise obtained from domestic soybean crushing. Oilseed meals may substitute for the protein-feed component of soybean processing. Corn primarily supplies dietary energy rather than protein and is therefore treated only as an indirect and partial substitute within livestock-feed formulations. On this basis, the selected products are classified into unprocessed oilseeds, energy-feed substitutes, vegetable oils, and protein meals. Their product definitions, HS codes, processing stages, and substitution functions are reported in Appendix A Table A1.
3.4. China’s Import Structure of Soybeans and Substitutes
Figure 6 shows that the share of soybeans in the combined imports of soybeans and selected substitutes followed an inverted-U pattern. Soybeans have historically maintained a dominant position within the composition of China’s global imports of soybeans and their substitutes. The import share of soybeans exhibited a steady upward trajectory starting in 2011, reaching a historical peak of approximately 90% of total imports in 2017. However, beginning in 2018, this share commenced a gradual decline, reverting to approximately 69% by 2023. Conversely, the aggregate import share of soybean substitutes experienced consecutive years of robust growth, expanding to 31% in 2023. This shift reflects China’s strategic policy adjustments aimed at diversifying its soybean import sources and protein feed supply channels.
Figure 6.
China’s Imports: Soybeans versus Substitute Products, 2011–2023. Source: Authors’ calculations based on UN Comtrade data (https://comtradeplus.un.org/, accessed on 15 July 2026).
4. Materials and Methods
4.1. Model Construction
In July 2018, China implemented retaliatory tariffs on a range of commodities, including U.S. soybeans, which precipitated a restructuring of China’s soybean import supply chain. However, the precise nature of this restructuring remains an empirical question. To investigate the structural realignment of the soybean import supply chain following this trade policy shock, we draw on Greenland et al. (2019), who exploit differential exposure to a trade policy shock to examine relative post-policy adjustments, as well as the general difference-in-differences framework of Callaway and Sant’Anna (2021). Accordingly, we construct the following two DID-style models to examine the relative reallocation of China’s soybean imports across source countries and product categories:
In Model (3), the dependent variable is the logarithm of the market share of China’s soybean imports from each country. The core explanatory variable is the interaction term Post Treat. where Post is a time dummy variable indicating the implementation of the tariffs, taking the value of 0 before 2018 and 1 from 2018 onward. Treat is an indicator of direct exposure to the tariff shock. It equals 1 if source country jt is the United States, whose soybeans were directly subject to the additional tariff, and 0 for the other source countries, which constitute the comparison group and 0 otherwise (the control group). denotes a vector of country-level control variables, while , and represent country fixed effects, year fixed effects, and the idiosyncratic error term, respectively. Countries other than the United States may themselves respond to the tariff by absorbing part of the import demand displaced from the United States. Therefore, the comparison countries in Model (3) should not be interpreted as completely unaffected by the policy. Instead, the coefficient β1 captures the differential post-2018 change in the U.S. import share relative to the average change in the shares of alternative source countries. Accordingly, Model (3) estimates a relative source-country reallocation effect rather than identifying the absolute causal effect of the tariff on the total volume of U.S. soybean imports. Because the United States is the only directly exposed country, the coefficient should be interpreted cautiously as a relative compositional change associated with the 2018 tariff shock.
In Model (4), the dependent variable is the logarithm of the share of each product in China’s combined imports of soybeans and the selected functionally related substitute products. The product-level sample comprises soybeans and 11 functionally related comparison products. The core explanatory variable is the interaction term Postt × Impacti, where Impacti equals one for soybeans and zero for the remaining 11 products. Soybeans therefore constitute the single treated product in Model (4). represents a vector of product-level control variables, while , and denote product fixed effects, year fixed effects, and the idiosyncratic error term, respectively. The coefficient β1 captures the differential post-2018 change in the import share of soybeans relative to the average change in the shares of the selected comparison products. Accordingly, Model (4) is interpreted as estimating relative product-level reallocation rather than one-to-one technical substitution between soybeans and each comparison product.
4.2. Variables
4.2.1. Dependent Variables
To capture the geographic realignment and product substitution within China’s soybean import supply chain over the sample period, this study utilizes changes in the market shares of China’s soybean imports across different countries of origin, as well as changes in the import shares of global soybeans and various soybean substitutes. The underlying data are sourced from the United Nations Commodity Trade Statistics (UN Comtrade) database.
4.2.2. Core Treatment Variables
The policy shock timing is set to the year 2018. is a dummy variable denoting the tariff shock, which takes the value of 0 prior to 2018 and 1 from 2018 onward. signifies a country-level dummy variable, taking the value of 1 if the country of origin is the United States and 0 for all other nations. Similarly, Similarly, Impacti is a product-level indicator that equals one for soybeans and zero for the 11 selected comparison products. This classification identifies soybeans as the treated product in Model (4) and does not imply that the comparison products were unaffected by indirect trade-policy effects. The core explanatory variable is the interaction terms: Post Treat represents the interaction between the policy timing and the country-level treatment, while is Post Impact captures the interaction between the policy timing and the product-level treatment.
4.2.3. Control Variables
Following the structural gravity, agricultural-trade, and export-competitiveness literature, we include a set of country- and product-level controls that may simultaneously affect China’s import sourcing decisions and the composition of its agricultural imports (Anderson & van Wincoop, 2003; Cho et al., 2002; Grant & Lambert, 2008; Yotov et al., 2016).
In the country-level model, exporter GDP controls for the economic size and potential supply capacity of source country j, as larger economies generally possess greater production and export capabilities (Anderson & van Wincoop, 2003; Yotov et al., 2016). The real effective exchange rate (RATE) captures changes in the external price competitiveness of the exporting country because exchange-rate movements affect the relative prices faced by agricultural importers (Cho et al., 2002). The Global Innovation Index (GII) controls for time-varying differences in national innovation capacity, infrastructure, human capital, and business sophistication. These factors may affect agricultural productivity, quality control, logistics efficiency, traceability, and the ability of exporting countries to provide stable supplies that meet import-market standards. National innovation capacity has been linked to export performance and agricultural export capacity in previous research (DiPietro & Anoruo, 2006; Kang, 2017). GII is therefore used as a broad measure of the exporting country’s innovation and supply-chain capability rather than as an indicator limited to the competitiveness of its technology sector.
The RTA dummy equals one if a regional trade agreement between China and source country j is in force in year t and zero otherwise. Regional trade agreements may increase agricultural trade by reducing tariff, non-tariff, and institutional trade costs (Baier & Bergstrand, 2007; Grant & Lambert, 2008). Exporter-country inflation (INFL) controls for country-specific price and cost pressures that are not fully captured by country or year fixed effects. Higher inflation may increase domestic production, labor, storage, and transportation costs and thereby affect the international price competitiveness of agricultural exports (Goldstein & Khan, 1985; Head & Mayer, 2014). RATE and INFL capture related but distinct factors: RATE reflects external relative-price competitiveness, whereas INFL captures domestic price pressure within the exporting country.
Country-level import cost (COSTCountry) is measured as the value of China’s soybean imports from source country j divided by the corresponding import quantity. It captures source-specific differences in unit import values, product quality, and trade costs that may influence import sourcing under origin-differentiated demand (Armington, 1969; Wilson & Bullock, 2025).
In the product-level model, domestic production (Production) controls for changes in China’s domestic supply that may affect its demand for imported soybeans and functionally related products. Domestic supply and international and domestic prices are important determinants of China’s soybean import demand (Zhang et al., 2025). Product-level import cost (COSTProduct), calculated as import value divided by import quantity, controls for differences in relative import prices, quality, and processing stages across soybeans and the selected substitute products. Relative prices are central to the allocation of import demand across differentiated products (Armington, 1969; Goldstein & Khan, 1985).
Trade values, quantities, and unit import costs are obtained from UN Comtrade. Exporter GDP and inflation are obtained from the World Bank’s World Development Indicators. GII is obtained from the World Intellectual Property Organization. RATE is obtained from World Bank World Development Indicators, RTA status is obtained from WTO Regional Trade Agreements Database, and domestic production is obtained from FAOSTAT. Missing values are imputed using linear interpolation.
Descriptive statistics of the main variables are reported in Table 2.
Table 2.
Descriptive Statistics of Variables.
5. Results
5.1. Baseline Findings
The baseline estimation results for Models (3) and (4) are reported in Table 3. Column (1) presents the estimated association between the U.S.–China trade policy shock and the geographical reallocation of China’s soybean imports. The coefficient on the interaction term is negative and statistically significant. Given that the dependent variable is expressed in logarithmic form, the estimated coefficient of −0.099 implies that China’s soybean import share from the United States decreased by approximately 9.9% relative to that from other source countries following the tariff shock. This result provides evidence consistent with a substantial reallocation of China’s soybean imports away from the United States and toward alternative suppliers.
Table 3.
Baseline findings.
Column (2) replaces the contemporaneous policy interaction with its one-period lag to account for possible delays in importers’ sourcing adjustments. The estimated coefficient remains negative and statistically significant. This finding indicates that the reduction in China’s relative reliance on U.S. soybeans persisted beyond the initial year of tariff implementation.
Column (3) reports the estimation results for product-level reallocation. The contemporaneous coefficient is negative but statistically insignificant, suggesting that there is insufficient evidence of an immediate reallocation of imports from soybeans toward substitute products in the initial period following the tariff shock. Column (4) replaces the contemporaneous policy interaction with its one-period lag. The lagged coefficient is negative and statistically significant, indicating that the relative decline in soybean imports became more evident after allowing for a one-year adjustment period. This result is consistent with a delayed product-substitution response to the trade policy shock.
The delayed response may reflect the higher adjustment costs associated with product-level reallocation. Existing logistics networks, storage facilities, and soybean-processing infrastructure are highly asset-specific and therefore cannot be reconfigured immediately. Firms also incur substantial search, verification, and switching costs when identifying alternative inputs, establishing new trading relationships, and modifying production technologies or feed formulations. Moreover, uncertainty regarding the duration of the tariff policy may have initially discouraged firms from undertaking costly and potentially irreversible adjustments. As the policy persisted and market expectations became more stable, firms had stronger incentives to substitute alternative agricultural products for imported soybeans.
Overall, the results reported in Table 3 provide strong evidence of a geographical reallocation of China’s soybean imports following the U.S.–China tariff shock. The results also suggest that product-level reallocation did not occur immediately but became statistically evident after a one-year adjustment period. Taken together, these findings provide qualified support for Hypothesis 1.
5.2. Sensitivity Checks
5.2.1. Parallel Trends Test
Following Greenland et al. (2019), we test the validity of the parallel-trends assumption by examining whether the treatment and control groups followed similar trends prior to the U.S.–China trade policy shock. The empirical specification is as follows:
We consider an event window spanning three periods before and four periods after the implementation of the trade policy, with the relative event time defined as P = (−3, −2, −1, 0, +1, +2, +3, +4). Here, P = 0 denotes the period in which the policy shock occurred, P = +1 represents the first post-treatment period, and subsequent values are defined analogously. The period P = −1 is omitted as the reference period. All other variables are defined in the same way as in Equations (3) and (4).
The regression includes the full set of control variables as well as country and time fixed effects. The coefficients on the relative-time indicators are used to assess whether the treatment and control groups satisfy the parallel trends assumption.
The estimation results are presented in Figure 7. Prior to the imposition of retaliatory tariffs on U.S. soybeans, the estimated coefficients are statistically insignificant, indicating that the treatment and control groups followed parallel pre-treatment trends. Following the implementation of the tariff policy, the estimated coefficients become statistically significant, suggesting that the trade policy shock had a significant impact on China’s soybean import supply chain. These findings support the validity of the parallel trends assumption and are consistent with the baseline regression results.
Figure 7.
Parallel Trends Test. Notes: The dots represent the estimated coefficients, and the vertical bars indicate 95% confidence intervals. A coefficient is statistically significant at the 5% level when its confidence interval does not include zero. The horizontal dashed line denotes zero, and the vertical dashed line indicates the implementation of the retaliatory tariff in 2018.
5.2.2. Placebo Test
We conduct separate placebo assignment exercises for the source-country and product-level specifications. For Model (3), the estimation sample contains 15 source countries and 193 country-year observations over 2011–2023. In each of 500 iterations, one source country is randomly selected with equal probability as the pseudo-treated country, while the remaining 14 countries form the pseudo-comparison group. The assignment is fixed at the country level across years, and the post-policy indicator retains the original cutoff of 2018.
For Model (4), the estimation sample contains 12 products and 155 product-year observations. In each of 500 iterations, one product is randomly selected with equal probability as the pseudo-treated product, while the remaining 11 products form the pseudo-comparison group. This design preserves the single-treated-product structure of the baseline specification.
In both exercises, the pseudo-treatment interaction is reconstructed from the reassigned unit indicator and the original post-policy indicator. The outcome, controls, estimation sample, and unit and year fixed effects are identical to those in the corresponding actual-assignment regression. Assignments are drawn with replacement, and the actual treated unit is eligible for selection. The exercises are implemented in Python 3.13.5 using NumPy’s default_rng with a seed of 123.
Figure 8 illustrates the distributions of the placebo interaction coefficients obtained from 500 random reassignment exercises for Models (3) and (4), with the dashed vertical lines indicating the corresponding actual estimates.
Figure 8.
Placebo Test. The solid curves represent the estimated density distributions of placebo coefficients from 500 random reassignment exercises. The short vertical lines along the horizontal axis (rug marks) indicate individual placebo coefficient estimates, while the red dashed vertical lines represent the actual estimated coefficients.
Table 4 reports numerical summaries of the reassignment estimates. For Model (3), the actual coefficient is −0.099357, compared with a placebo mean of 0.000183 and a standard deviation of 0.042028. The actual coefficient is the most negative among the 15 possible single-country assignments, indicating that the decline associated with assigning treatment to the United States is pronounced relative to alternative country assignments.
Table 4.
Summary Statistics of Placebo Assignment Estimates.
For Model (4), the actual coefficient is −0.004007, compared with a placebo mean of −0.001529 and a standard deviation of 0.032237. The actual coefficient lies near the center of the reassignment distribution and is not unusually extreme relative to alternative product assignments. This exercise therefore provides no additional support for a distinctive contemporaneous product-level response. Because each draw designates only one pseudo-treated unit, there are 15 distinct country assignments and 12 distinct product assignments. The 500 draws repeatedly sample from these finite sets rather than generating 500 distinct assignments. We therefore also report the coefficients from all possible single-unit assignments in Table 4. These exercises assess sensitivity to the identity of the treated unit. Given the non-random nature of actual policy exposure and the heterogeneity of countries and products, they should not be interpreted as eliminating omitted-variable concerns or providing definitive randomization-based causal inference.
5.2.3. Winsorization Test
To mitigate the potential influence of outliers on the estimation results, we conduct a winsorization test as an additional robustness check. Specifically, all variables except the dependent variable are winsorized at the 1st and 99th percentiles, with observations below the 1st percentile and above the 99th percentile replaced by the corresponding threshold values. The baseline regressions are then re-estimated using the winsorized data.
The results, reported in Column (1) and Column (2) of Table 4, remain statistically significant and are consistent with the baseline estimates, indicating that the main findings are robust to the treatment of extreme observations.
5.2.4. Excluding the Potential Confounding Effects of the COVID-19 Pandemic
The fourth round of U.S. trade policy measures was introduced in September 2019, immediately preceding the outbreak of the COVID-19 pandemic. Because the pandemic generated substantial disruptions to international trade and global supply chains, the baseline estimates may be contaminated by concurrent pandemic-related shocks. To isolate the effect of the trade policy, we truncate the sample at the end of 2019 and re-estimate the baseline model. As reported in Column (3) and Column (4) of Table 5, the estimated coefficients remain statistically significant and economically similar to the baseline estimates, suggesting that our main findings are not driven by the COVID-19 pandemic.
Table 5.
Robustness Tests.
5.3. Channel Analysis
As discussed above, China’s retaliatory tariffs on U.S. soybeans reduced soybean imports from the United States through two main channels. First, part of the decline was driven by the reallocation of soybean imports from the United States to other countries and regions. Second, part of the decline reflected substitution from U.S. soybeans toward alternative products.
This study examines these mechanisms from the perspectives of source-country reallocation and relative-price-induced product substitution. The tariff directly increased the relative import cost of U.S. soybeans, encouraging China to shift soybean imports toward alternative suppliers. It also reduced the relative price competitiveness of soybeans and thereby created incentives to adjust the composition of imported agricultural products. Specifically, the tariffs directly increased the import cost of U.S. soybeans, generating trade diversion and trade creation effects that encouraged China to shift soybean imports from the United States to alternative suppliers. In addition, the tariffs weakened the product competitiveness of U.S. soybeans, thereby inducing substitution from U.S. soybeans toward other substitute products. To test these mechanisms, we specify the following empirical model:
where captures the mechanism variables underlying regional reallocation, including the third-country import share index () and the import source diversification index (). captures the mechanism variable underlying product reallocation, measured by the revealed comparative advantage index (). The definitions of all other variables are identical to those in Equations (3) and (4).
5.3.1. Trade Diversion and Trade Creation Effects
Following Shen and Wang (2024), we employ the third-country import share index () to capture the extent to which China’s soybean imports are reallocated to alternative source countries and regions, and the import source diversification index () to measure the degree of diversification in import sourcing. These variables are used to examine the mechanisms of trade diversion and trade creation. Following Shen and Wang (2024), we construct the third-country import share index (IMTSI) and the import-source diversification index (IMDIV) as follows:
Here, denotes China’s imports of product ii from source country j in year t, denotes China’s imports of product ii from the United States, and N denotes the total number of source countries. measures the share of China’s imports supplied by countries other than the United States. A higher indicates a greater reallocation of imports toward third-country suppliers. is calculated as one minus the Herfindahl–Hirschman Index of source-country import shares. A higher indicates a more geographically diversified import-source structure. Both indices range from zero to one.
Column (1) of Table 6 reports a significantly positive coefficient, indicating that the U.S.–China trade policy shock generated both trade diversion and trade creation effects. In response to the tariff increase, China restructured its soybean import supply chain by expanding imports from alternative suppliers, thereby reducing its reliance on U.S. soybeans. In other words, the tariff barrier induced a reallocation of China’s soybean import supply chain, leading to a regional shift in import sources away from the United States.
Table 6.
Mechanism Tests.
Column (2) of Table 6 further shows that China responded to the increased risks associated with soybean imports by diversifying its import sources. This enhanced diversification reduced China’s dependence on U.S. soybean imports, providing further evidence that the tariff policy generated trade diversion and trade creation effects, which promoted the reallocation of soybean imports toward other exporting countries and regions. These findings provide empirical support for Hypothesis 2, namely that the U.S.–China trade policy shock induced regional reallocation of China’s soybean imports through the trade diversion and trade creation effects.
5.3.2. Relative-Price-Induced Product Substitution
To examine the product-substitution channel induced by the tariff-related relative-price change, we use the revealed import advantage index () as a proxy for the relative competitiveness of soybeans and the selected comparison products.
As reported in Column (3) of Table 6, the coefficient on the interaction term is significantly negative, indicating that the tariff shock reduced the relative import competitiveness of soybeans compared with the selected functionally related products. This result is consistent with a reallocation of China’s import basket from soybeans toward alternative oilseeds, vegetable oils, energy-feed products, and protein meals. The finding supports Hypothesis 3 and suggests that the tariff-related change in relative prices contributed to product-level reallocation.
5.4. Heterogeneity Analysis
5.4.1. Heterogeneity Across Source Countries
To further investigate the reallocation of China’s soybean imports across different source countries following the U.S.–China trade policy shock, we divide the treatment group into two categories. In the first specification, Brazil and Argentina are defined as the treatment group, while the United States serves as the control group. In the second specification, all other soybean-exporting countries are treated as the treatment group, with the United States again serving as the control group. The import shares of soybeans from the United States and the corresponding treatment countries are used as the dependent variables, and Equations (3) and (4) are re-estimated accordingly.
The results indicate substantial regional heterogeneity in the reallocation of China’s soybean imports after the trade policy shock. Column (1) of Table 7 shows that China’s soybean imports from Brazil and Argentina increased by 20.3% relative to imports from the United States. However, Column (2) indicates that the effect of China’s retaliatory tariffs on the import shares of Brazil and Argentina gradually weakened over time and eventually became statistically insignificant. One possible explanation is that the trade diversion effect induced by the tariff shock diminished over time. Major soybean exporters such as Brazil and Argentina face capacity constraints and rigid export infrastructure, limiting their ability to continuously and fully replace U.S. soybean exports. Meanwhile, U.S. soybeans partially circumvented tariff barriers through indirect channels, such as re-exporting and processing trade, thereby weakening the marginal impact of the tariff policy over time. As market participants gradually adjusted to the new trade environment, the influence of the tariffs on South American export shares became less pronounced.
Table 7.
Heterogeneity across source countries.
Column (3) shows that soybean imports from countries other than Brazil and Argentina increased by approximately 10% relative to imports from the United States. Column (4) further indicates that although the trade diversion effect toward these non-traditional suppliers also weakened over time, their relative importance continued to increase compared with Brazil and Argentina. This finding may reflect the growing supply constraints and logistics bottlenecks faced by Brazil and Argentina, which reduced their supply elasticity and increased export premiums. At the same time, in an effort to reduce excessive dependence on a limited number of suppliers and supported by initiatives such as the Belt and Road Initiative, China actively expanded soybean imports from emerging exporters, including Russia, Uruguay, and countries in the Black Sea region. Consequently, these emerging suppliers accounted for an increasingly larger share of China’s diversified soybean import portfolio.
5.4.2. Heterogeneity Across Product Categories
To further examine the reallocation of China’s soybean imports across different product categories following the U.S.–China trade policy shock, unprocessed soybean substitutes and processed soybean substitutes are separately defined as the treatment groups, while soybeans serve as the control group. The import shares of soybeans and the corresponding substitute products are used as the dependent variables, and Equations (3) and (4) are re-estimated accordingly.
The results reveal substantial heterogeneity in the product-level reallocation of China’s imports following the trade policy shock. As reported in Column (1) of Table 8, imports of unprocessed soybean substitutes increased by 2.3% relative to soybeans, although the estimated effect is statistically insignificant. Column (2), however, shows that the effect of China’s retaliatory tariffs on the import shares of unprocessed substitutes strengthened over time and became statistically significant.
Table 8.
Heterogeneity across Product Categories.
Similarly, Column (3) indicates that the impact on processed soybean substitutes is initially insignificant, whereas Column (4) shows that the reallocation effect becomes progressively stronger and statistically significant over time.
A plausible explanation is that the adjustment of agricultural supply chains is subject to substantial path dependence during the initial stage following the policy shock. Existing trade relationships exhibit considerable inertia, while supplier-specific investments, information frictions, and contractual rigidities between importers and incumbent suppliers delay the adjustment process, thereby limiting the immediate substitution effect. As the tariff policy remained in place, market participants gradually formed stable expectations regarding the policy environment and initiated structural adjustments. To adapt to the new relative price system, domestic downstream industries accelerated technological innovation in feed formulation and upgraded processing technologies, thereby expanding the application of alternative agricultural inputs such as rapeseed and sunflower seeds. Consequently, the initial adaptive responses gradually evolved into a long-term strategic restructuring process, resulting in an increasingly stronger reallocation of China’s imports toward soybean substitute products over time.
6. Discussion and Conclusions
6.1. Discussion
The results show that China’s 2018 retaliatory tariff was followed by a significant decline in the relative share of U.S. soybeans and a reallocation of imports toward alternative suppliers. This finding is consistent with previous evidence that the tariff weakened the competitiveness of U.S. soybeans and redirected trade toward other countries (Adjemian et al., 2021; Zheng et al., 2023), as well as broader research documenting global trade reallocation following the U.S.–China trade conflict (P. Fajgelbaum et al., 2024). Brazil and Argentina responded relatively quickly because they already possessed large-scale production capacity, export infrastructure, and established trading relationships with China, which reduced the cost of switching suppliers (Wilson & Bullock, 2025). However, geographical expansion did not produce a sustained reduction in import concentration. The CR4 ratio remained above 0.96 throughout the sample period, while the HHI reached 0.5332 in 2023. Thus, part of China’s dependence shifted from the United States toward Brazil rather than being evenly distributed across alternative suppliers.
The product-level results reveal a slower adjustment pattern. The contemporaneous decline in the relative soybean import share is statistically insignificant, whereas the lagged effect is negative and significant. Changing suppliers allows importers to continue purchasing the same commodity, while product substitution requires adjustments in processing technologies, feed formulations, storage facilities, logistics systems, and contractual arrangements. Moreover, the selected products perform different functions and occupy different stages of the value chain. Alternative oilseeds, vegetable oils, protein meals, and corn should therefore be regarded as functionally related and partial substitutes rather than as homogeneous replacements for soybeans. This interpretation is consistent with research showing that replacing soybean-based inputs requires adjustments in production systems and input combinations (Parrini et al., 2023).
The study extends the existing literature in three respects. First, it examines source-country reallocation and product-level substitution within a unified empirical framework. Second, it identifies different temporal patterns across these two adjustment margins: geographical sourcing adjusted relatively quickly, whereas product substitution emerged only after an adjustment period. Third, it distinguishes an expansion in the range of source countries from a genuine decline in market concentration. These findings suggest that supply-chain reconfiguration is a sequential process and that an increase in the number of suppliers does not necessarily reduce dependence on dominant exporters.
The implications for supply-chain resilience should nevertheless be interpreted cautiously. Changes in import shares and sourcing patterns provide evidence of adaptability, but they do not directly measure the ability of the entire soybean supply chain to absorb shocks, maintain essential functions, or recover from disruptions. In particular, increased reliance on Brazil may represent a change in the geographical location of dependence rather than an overall reduction in supply risk. The results therefore demonstrate adaptive reallocation within China’s soybean import system, rather than directly establishing that the resilience of the entire supply chain improved.
6.2. Limitations and Future Research
This study has several limitations. First, the country-level analysis contains only one directly treated country, the United States, while alternative source countries may also have been affected by the reallocation of China’s import demand. The estimates should therefore be interpreted as relative changes in import shares rather than unconditional causal effects on absolute trade volumes. Second, the selected substitute products perform different economic functions and occupy different stages of the value chain. The product-level results consequently capture a broad adjustment in China’s import basket rather than one-to-one technical substitution for soybeans. Third, annual aggregate trade data cannot directly identify firm-level changes in sourcing contracts, processing technologies, or feed formulations, nor do they directly measure the resilience of the entire soybean supply chain. Future research could use firm-level customs data, higher-frequency trade data, and more direct indicators of supply-chain recovery and adaptability.
6.3. Conclusions and Policy Implications
Using country- and product-level trade data from 2011 to 2023, this study examines how China’s 2018 retaliatory tariff on U.S. soybeans was associated with changes in the geographical and product composition of its agricultural imports. The results show a clear relative reallocation away from U.S. soybeans and toward alternative source countries. This geographical response emerged relatively quickly, with Brazil and Argentina absorbing a substantial share of the initially displaced demand. The estimates also indicate a relative reallocation toward other source countries, although these countries continued to account for substantially smaller absolute import shares than Brazil.
The product-level response followed a slower pattern. The contemporaneous product-substitution effect is statistically insignificant, whereas the lagged effect is negative and statistically significant. This result indicates that the adjustment of the import basket required time, consistent with the technological, contractual, and infrastructural rigidities involved in substituting away from soybeans. Taken together, the findings show that source-country reallocation and product-level substitution constitute distinct adjustment margins with different temporal dynamics.
The results have several policy implications. First, expanding the number of soybean suppliers should not be treated as equivalent to reducing import concentration. China should evaluate both the range of active suppliers and the distribution of imports across those suppliers. Developing commercially viable relationships with smaller exporters may help reduce excessive dependence on any single country, but such diversification requires attention to supply capacity, transport costs, logistics infrastructure, product quality, and long-term contractual stability.
Second, policies aimed at product substitution should recognize the adjustment costs faced by downstream firms. Improvements in processing flexibility, feed-formulation technologies, storage facilities, and quality standards may increase firms’ capacity to use alternative oilseeds, vegetable oils, and protein-feed inputs when soybean supply is disrupted. Product substitution should nevertheless be evaluated according to nutritional content, processing requirements, price competitiveness, and the specific function of each product in the value chain.
Finally, China should strengthen the monitoring of concentration risks within its soybean import system. Reduced reliance on the United States accompanied by increased reliance on Brazil represents a change in the location of dependence rather than the elimination of dependence. Policies intended to improve the adaptability of the import system should therefore combine supplier development, domestic production support, improved information and risk-monitoring systems, and greater technological flexibility in downstream processing. These measures may strengthen the capacity of China’s soybean import system to respond to external shocks, although the resilience of the entire supply chain requires more direct measurement in future research.
Author Contributions
Writing—original draft, Y.L.; writing—review and editing, Y.L., X.C. and B.C.; supervision, B.C. All authors have read and agreed to the published version of the manuscript.
Funding
This research was supported by the National Social Science Fund of China (Grant No. 20AZD116).
Institutional Review Board Statement
Not applicable.
Informed Consent Statement
Not applicable.
Data Availability Statement
The data used in this study are publicly available from the UN Comtrade Database, the World Bank, and the other public databases identified in the manuscript. The processed data are available from the corresponding author upon reasonable request.
Conflicts of Interest
The authors declare no conflicts of interest.
Appendix A
Table A1.
Classification of Soybeans and Related Comparison Products by Functional Group, Value-Chain Stage, and Substitution Function.
References
- Adjemian, M. K., Smith, A., & He, W. (2021). Estimating the market effect of a trade war: The case of soybean tariffs. Food Policy, 105, 102152. [Google Scholar] [CrossRef] [Scilit]
- Akram, M. W., Akram, N., Shahzad, F., Rehman, K. U., & Andleeb, S. (2024). Blockchain technology in a crisis: Advantages, challenges, and lessons learned for enhancing food supply chains during the COVID-19 pandemic. Journal of Cleaner Production, 434, 140034. [Google Scholar] [CrossRef] [Scilit]
- Alabi, M. O., & Ngwenyama, O. (2023). Food security and disruptions of the global food supply chains during COVID-19: Building smarter food supply chains for the post-COVID-19 era. British Food Journal, 125(1), 167–185. [Google Scholar] [CrossRef] [Scilit]
- Ali, I., Arslan, A., Tarba, S., & Mainela, T. (2023). Supply chain resilience to climate change-inflicted extreme events in the agri-food industry: The role of social capital and network complexity. International Journal of Production Economics, 264, 108968. [Google Scholar] [CrossRef] [Scilit]
- Anderson, J. E., & van Wincoop, E. (2003). Gravity with gravitas: A solution to the border puzzle. American Economic Review, 93, 170–192. [Google Scholar] [CrossRef] [Scilit]
- Armington, P. S. (1969). A theory of demand for products distinguished by place of production. IMF Staff Papers, 16, 159–178. [Google Scholar] [CrossRef] [Scilit]
- Arrow, K. J., Chenery, H. B., Minhas, B. S., & Solow, R. M. (1961). Capital-labor substitution and economic efficiency. Review of Economics and Statistics, 43, 225–250. [Google Scholar] [CrossRef] [Scilit]
- Baier, S. L., & Bergstrand, J. H. (2007). Do free trade agreements actually increase members’ international trade? Journal of International Economics, 71, 72–95. [Google Scholar] [CrossRef] [Scilit]
- Benguria, F. (2023). The global impact of the US–China trade war: Firm-level evidence. Review of World Economics, 159(4), 827–851. [Google Scholar] [CrossRef] [Scilit]
- Callaway, B., & Sant’Anna, P. H. C. (2021). Difference-in-differences with multiple time periods. Journal of Econometrics, 225(2), 200–230. [Google Scholar] [CrossRef] [Scilit]
- Chambers, R. G. (1988). Applied production analysis: A dual approach. Cambridge University Press. [Google Scholar]
- Chen, J., Yang, B., & Wu, M. (2024). The impact of free-trade zones on total factor productivity: Evidence from China. Journal of the Knowledge Economy, 15(4), 17649–17675. [Google Scholar] [CrossRef] [Scilit]
- Cho, G., Sheldon, I. M., & McCorriston, S. (2002). Exchange rate uncertainty and agricultural trade. American Journal of Agricultural Economics, 84, 931–942. [Google Scholar] [CrossRef] [Scilit]
- Das, S., Myla, A. Y., Barve, A., Kumar, A., Sahu, N. C., Muduli, K., & Luthra, S. (2023). A systematic assessment of multidimensional risk factors for sustainable development in food grain supply chains: A business strategic perspective. Business Strategy and the Environment, 32(8), 5536–5562. [Google Scholar] [CrossRef] [Scilit]
- DiPietro, W. R., & Anoruo, E. (2006). Creativity, innovation, and export performance. Journal of Policy Modeling, 28, 133–139. [Google Scholar] [CrossRef] [Scilit]
- Dornbusch, R., Fischer, S., & Samuelson, P. A. (1977). Comparative advantage, trade, and payments in a ricardian model with a continuum of goods. American Economic Review, 67, 823–839. [Google Scholar]
- Fajgelbaum, P., Goldberg, P., Kennedy, P., Khandelwal, A., & Taglioni, D. (2024). The US–China trade war and global reallocations. American Economic Review: Insights, 6(2), 295–312. [Google Scholar] [CrossRef] [Scilit]
- Fajgelbaum, P. D., & Khandelwal, A. K. (2022). The economic impacts of the US–China trade war. Annual Review of Economics, 14(1), 205–228. [Google Scholar] [CrossRef] [Scilit]
- Freund, C., Mattoo, A., Mulabdic, A., & Ruta, M. (2024). Is US trade policy reshaping global supply chains? Journal of International Economics, 152, 104011. [Google Scholar] [CrossRef] [Scilit]
- Gao, T., & Andrei, J. V. (2026). Trade war bites: How China is securing its food supply. In International trade and economic development in BRICS: Challenges and opportunities (pp. 231–258). Springer Nature. [Google Scholar]
- Goldstein, M., & Khan, M. S. (1985). Income and price effects in foreign trade. In R. W. Jones, & P. B. Kenen (Eds.), Handbook of international economics (Vol. 2, pp. 1041–1105). Elsevier. [Google Scholar]
- Grant, J. H., & Lambert, D. M. (2008). Do regional trade agreements increase members’ agricultural trade? American Journal of Agricultural Economics, 90, 765–782. [Google Scholar] [CrossRef] [Scilit]
- Greenland, A., Lopresti, J., & McHenry, P. (2019). Import competition and internal migration. Review of Economics and Statistics, 101, 44–59. [Google Scholar] [CrossRef] [Scilit]
- Hamidu, Z., Oppong, P. B., Asafo-Adjei, E., & Adam, A. M. (2022). On the agricultural commodities supply chain resilience to disruption: Insights from financial analysis. Mathematical Problems in Engineering, 2022, 9897765. [Google Scholar]
- Han, D., Wu, Y., & Chen, S.-S. (2025). Trade war and grain import resilience: Evidence from China’s response to US tariffs. Frontiers in Sustainable Food Systems, 9, 1593613. [Google Scholar] [CrossRef] [Scilit]
- He, F., Lucey, B., & Wang, Z. (2021). Trade policy uncertainty and its impact on the stock market: Evidence from the China–US trade conflict. Finance Research Letters, 40, 101753. [Google Scholar] [CrossRef] [Scilit]
- Head, K., & Mayer, T. (2014). Gravity equations: Workhorse, toolkit, and cookbook. In Handbook of international economics (Vol. 4, pp. 131–195). Elsevier. [Google Scholar]
- Kang, H.-S. (2017). Agricultural total factor productivity and agricultural exports: Based on the major agricultural exporting countries. Journal of International Trade & Commerce, 13, 239–255. [Google Scholar] [CrossRef] [Scilit]
- Li, J. (2026). Trump’s tariff offensive and the rise of strategic regionalism: Toward decentralized globalization. Fudan Journal of the Humanities and Social Sciences. in press. [Google Scholar] [CrossRef] [Scilit]
- Nong, H. (2021). Have cross-category spillovers of economic policy uncertainty changed during the US–China trade war? Journal of Asian Economics, 74, 101312. [Google Scholar] [CrossRef] [Scilit]
- Parrini, S., Aquilani, C., Pugliese, C., Bozzi, R., & Sirtori, F. (2023). Soybean replacement by alternative protein sources in pig nutrition and its effect on meat quality. Animals, 13(3), 494. [Google Scholar] [CrossRef] [Scilit] [PubMed]
- Shen, G., & Wang, Y. (2024). Supply chain reshaping in the US and the resilience of China’s foreign trade supply chains. Journal of East China Normal University (Philosophy and Social Sciences), 56(4), 155–169. (In Chinese) [Google Scholar]
- Song, W., Chi, L., Wu, J., Zhu, M., & Shen, C. (2025). Disrupting path dependence: Tariff-induced import substitution in China’s soybean market. Agriculture, 15(21), 2312. [Google Scholar] [CrossRef] [Scilit]
- Sun, Z., Li, X., Yang, X., & Zhao, L. (2026). Research progress on the impact of geopolitical risks on the resilience of China’s transnational food supply chains. Journal of Economic Surveys. in press. [Google Scholar] [CrossRef] [Scilit]
- Tam, P. S. (2020). Global impacts of China–US trade tensions. The Journal of International Trade & Economic Development, 29(5), 510–545. [Google Scholar] [CrossRef] [Scilit]
- Wilson, W., & Bullock, D. W. (2025). Non-tariff and tariff impediments affecting spatial competition between the United States and Brazil for soybean shipments to China. China Agricultural Economic Review, 17(1), 212–232. [Google Scholar] [CrossRef] [Scilit]
- World Trade Organization. (2024). Global trade outlook and statistics. World Trade Organization. [Google Scholar]
- Yotov, Y. V., Piermartini, R., Monteiro, J.-A., & Larch, M. (2016). An advanced guide to trade policy analysis: The structural gravity model. World Trade Organization. [Google Scholar]
- Yu, M., Fan, J., Wang, H., & Wang, J. (2023). US trade policy uncertainty on Chinese agricultural imports and exports: An aggregate and product-level analysis. International Review of Economics & Finance, 84, 70–83. [Google Scholar] [CrossRef] [Scilit]
- Zhang, Y., Xiong, H., & Zhang, J. (2025). Determinants of China’s soybean import trade. Public Organization Review, 25(3), 1683–1703. [Google Scholar]
- Zhao, G., Vazquez-Noguerol, M., Liu, S., & Prado-Prado, J. C. (2024). Agri-food supply chain resilience strategies for preparing, responding, recovering, and adapting to unexpected crises: A cross-country comparative analysis from the COVID-19 pandemic. Journal of Business Logistics, 45(1), e12361. [Google Scholar] [CrossRef] [Scilit]
- Zheng, J., Zhou, S., Li, X., Padula, A. D., & Martin, W. (2023). Effects of eliminating the US–China trade dispute tariffs. World Trade Review, 22(2), 212–231. [Google Scholar] [CrossRef] [Scilit]
- Zhong, J., Cheng, H., & Jia, F. (2024). Supply chain resilience capability factors in agri-food supply chains. Operations Management Research, 17(3), 850–868. [Google Scholar] [CrossRef] [Scilit]
- Zhou, Y., He, W., Tang, H., & Liu, Y. (2026). From complexity to strength: How digital transformation and innovation enhance agricultural supply chain resilience. Journal of Innovation & Knowledge, 15, 100985. [Google Scholar] [CrossRef] [Scilit]
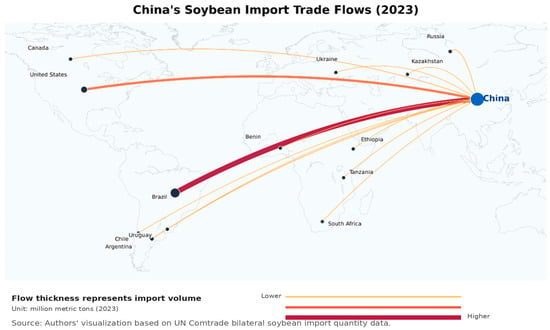
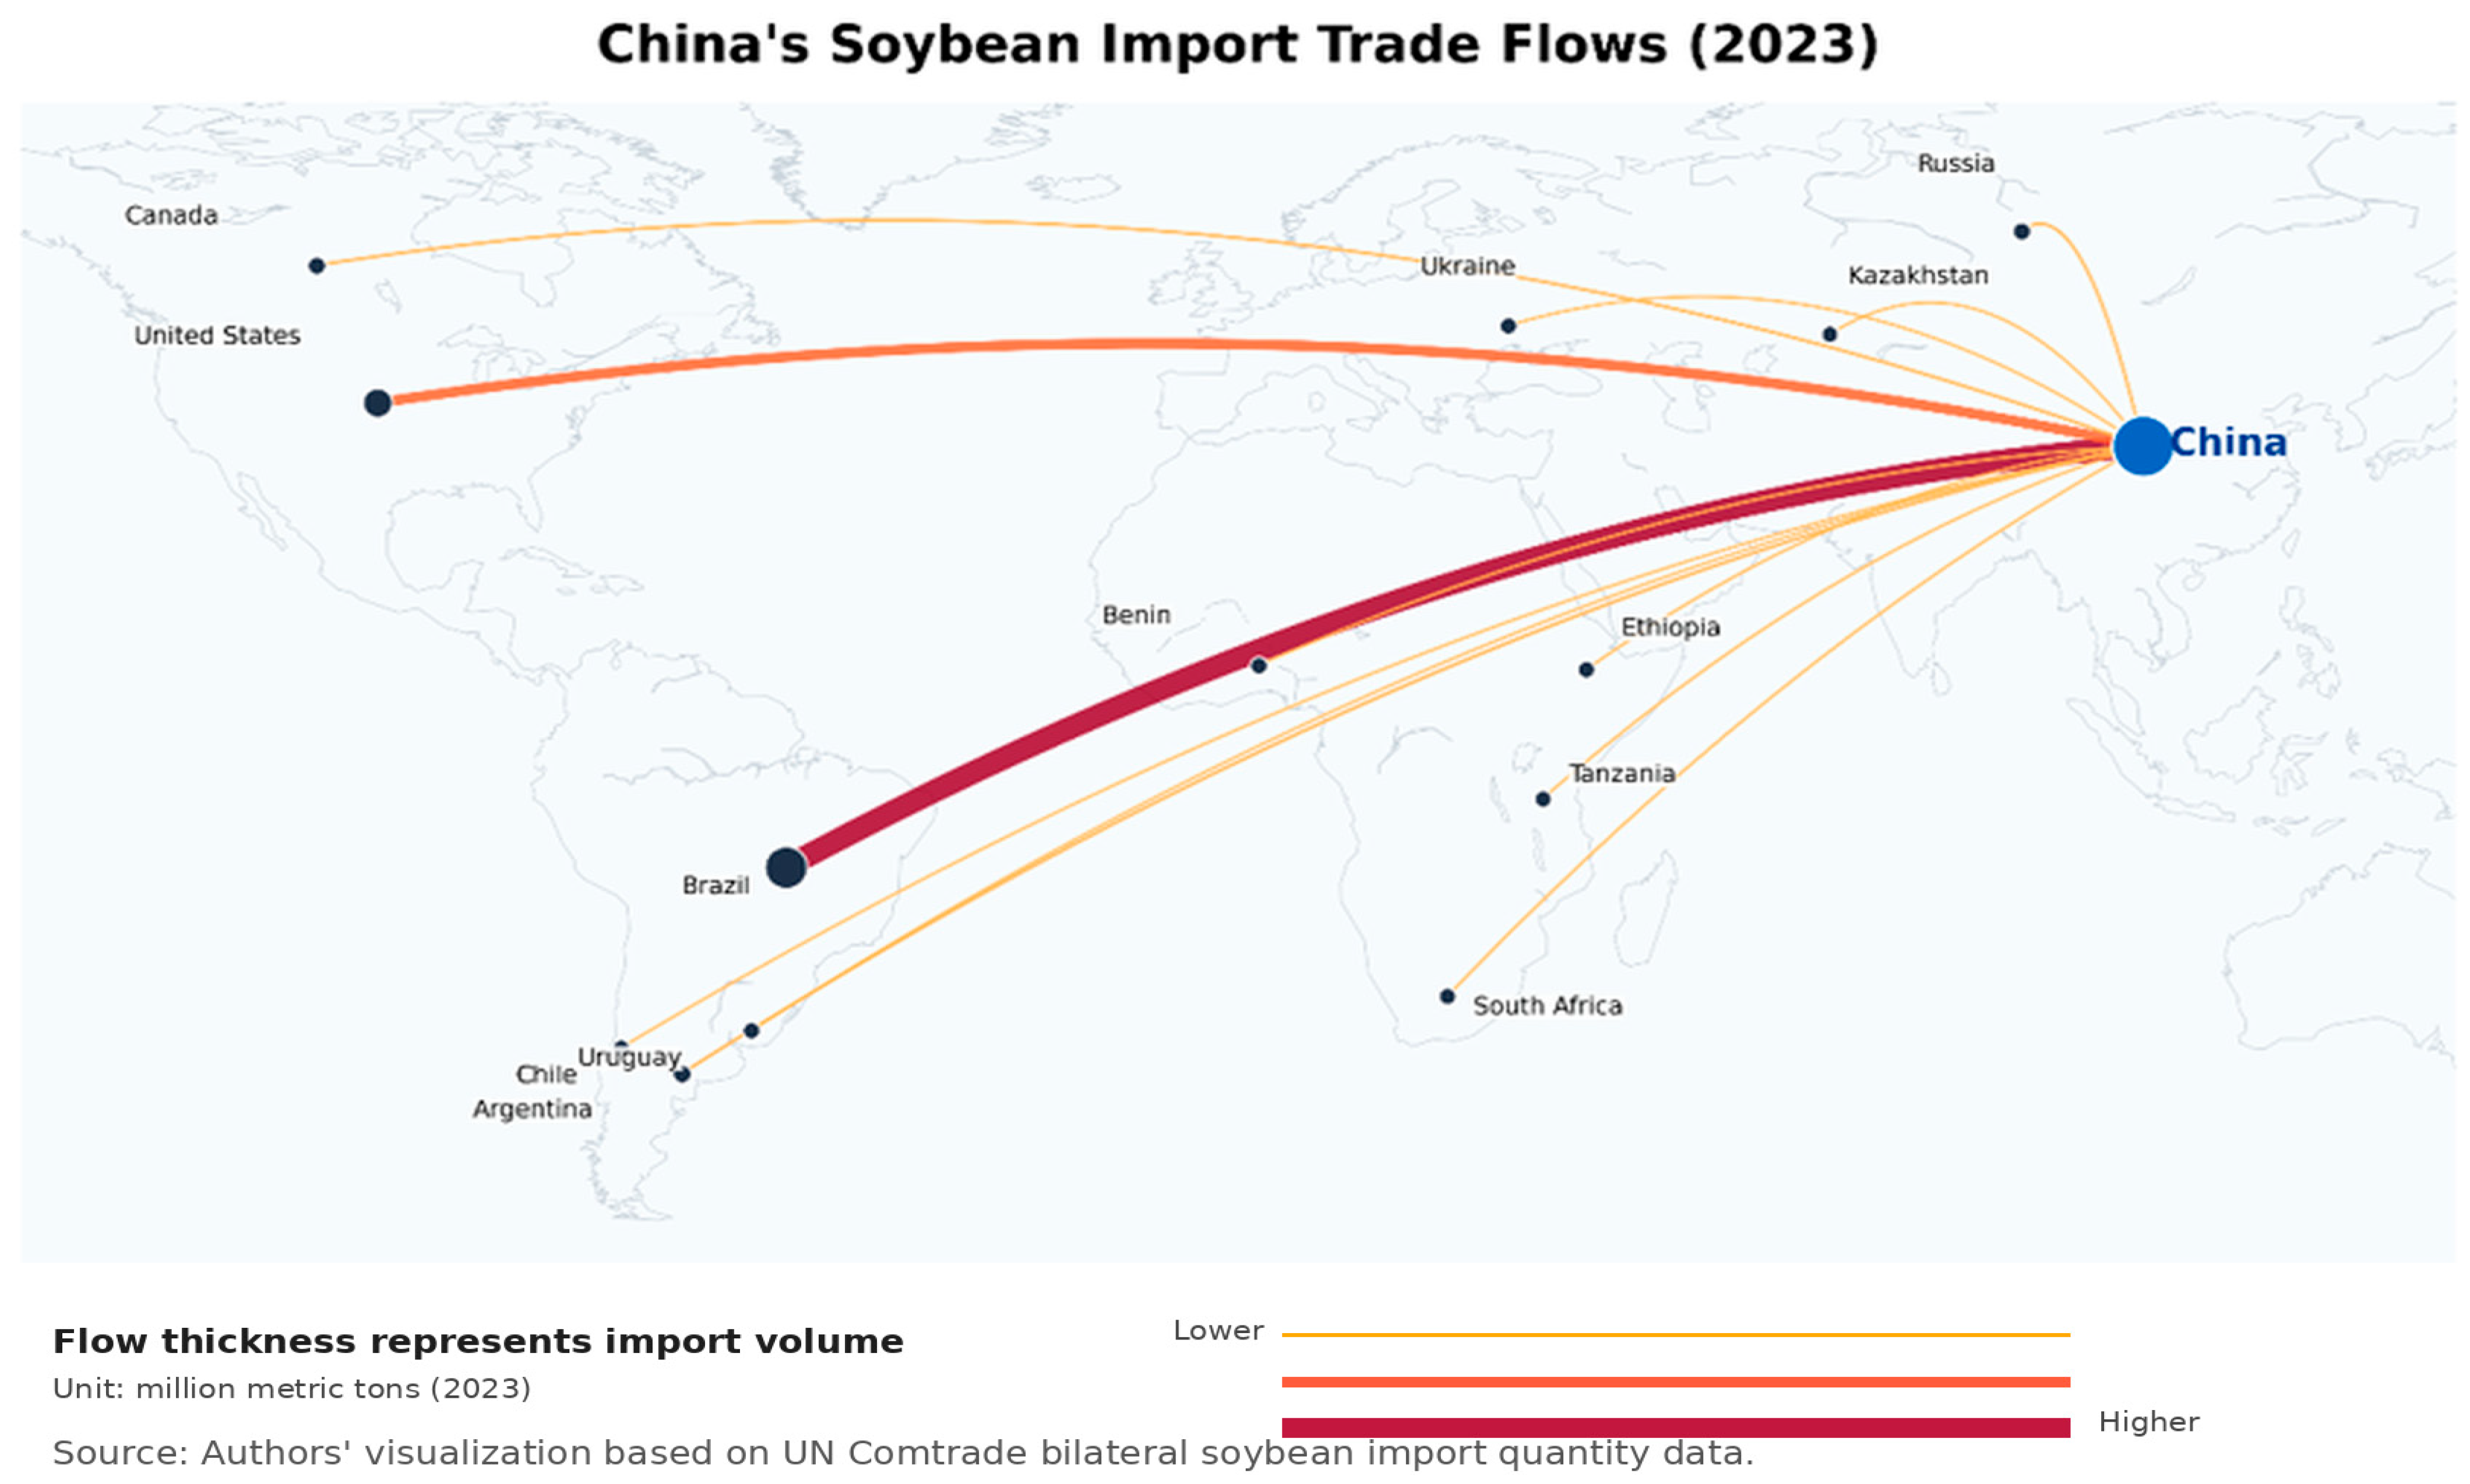
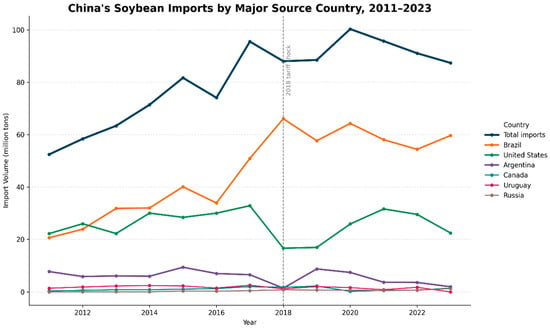
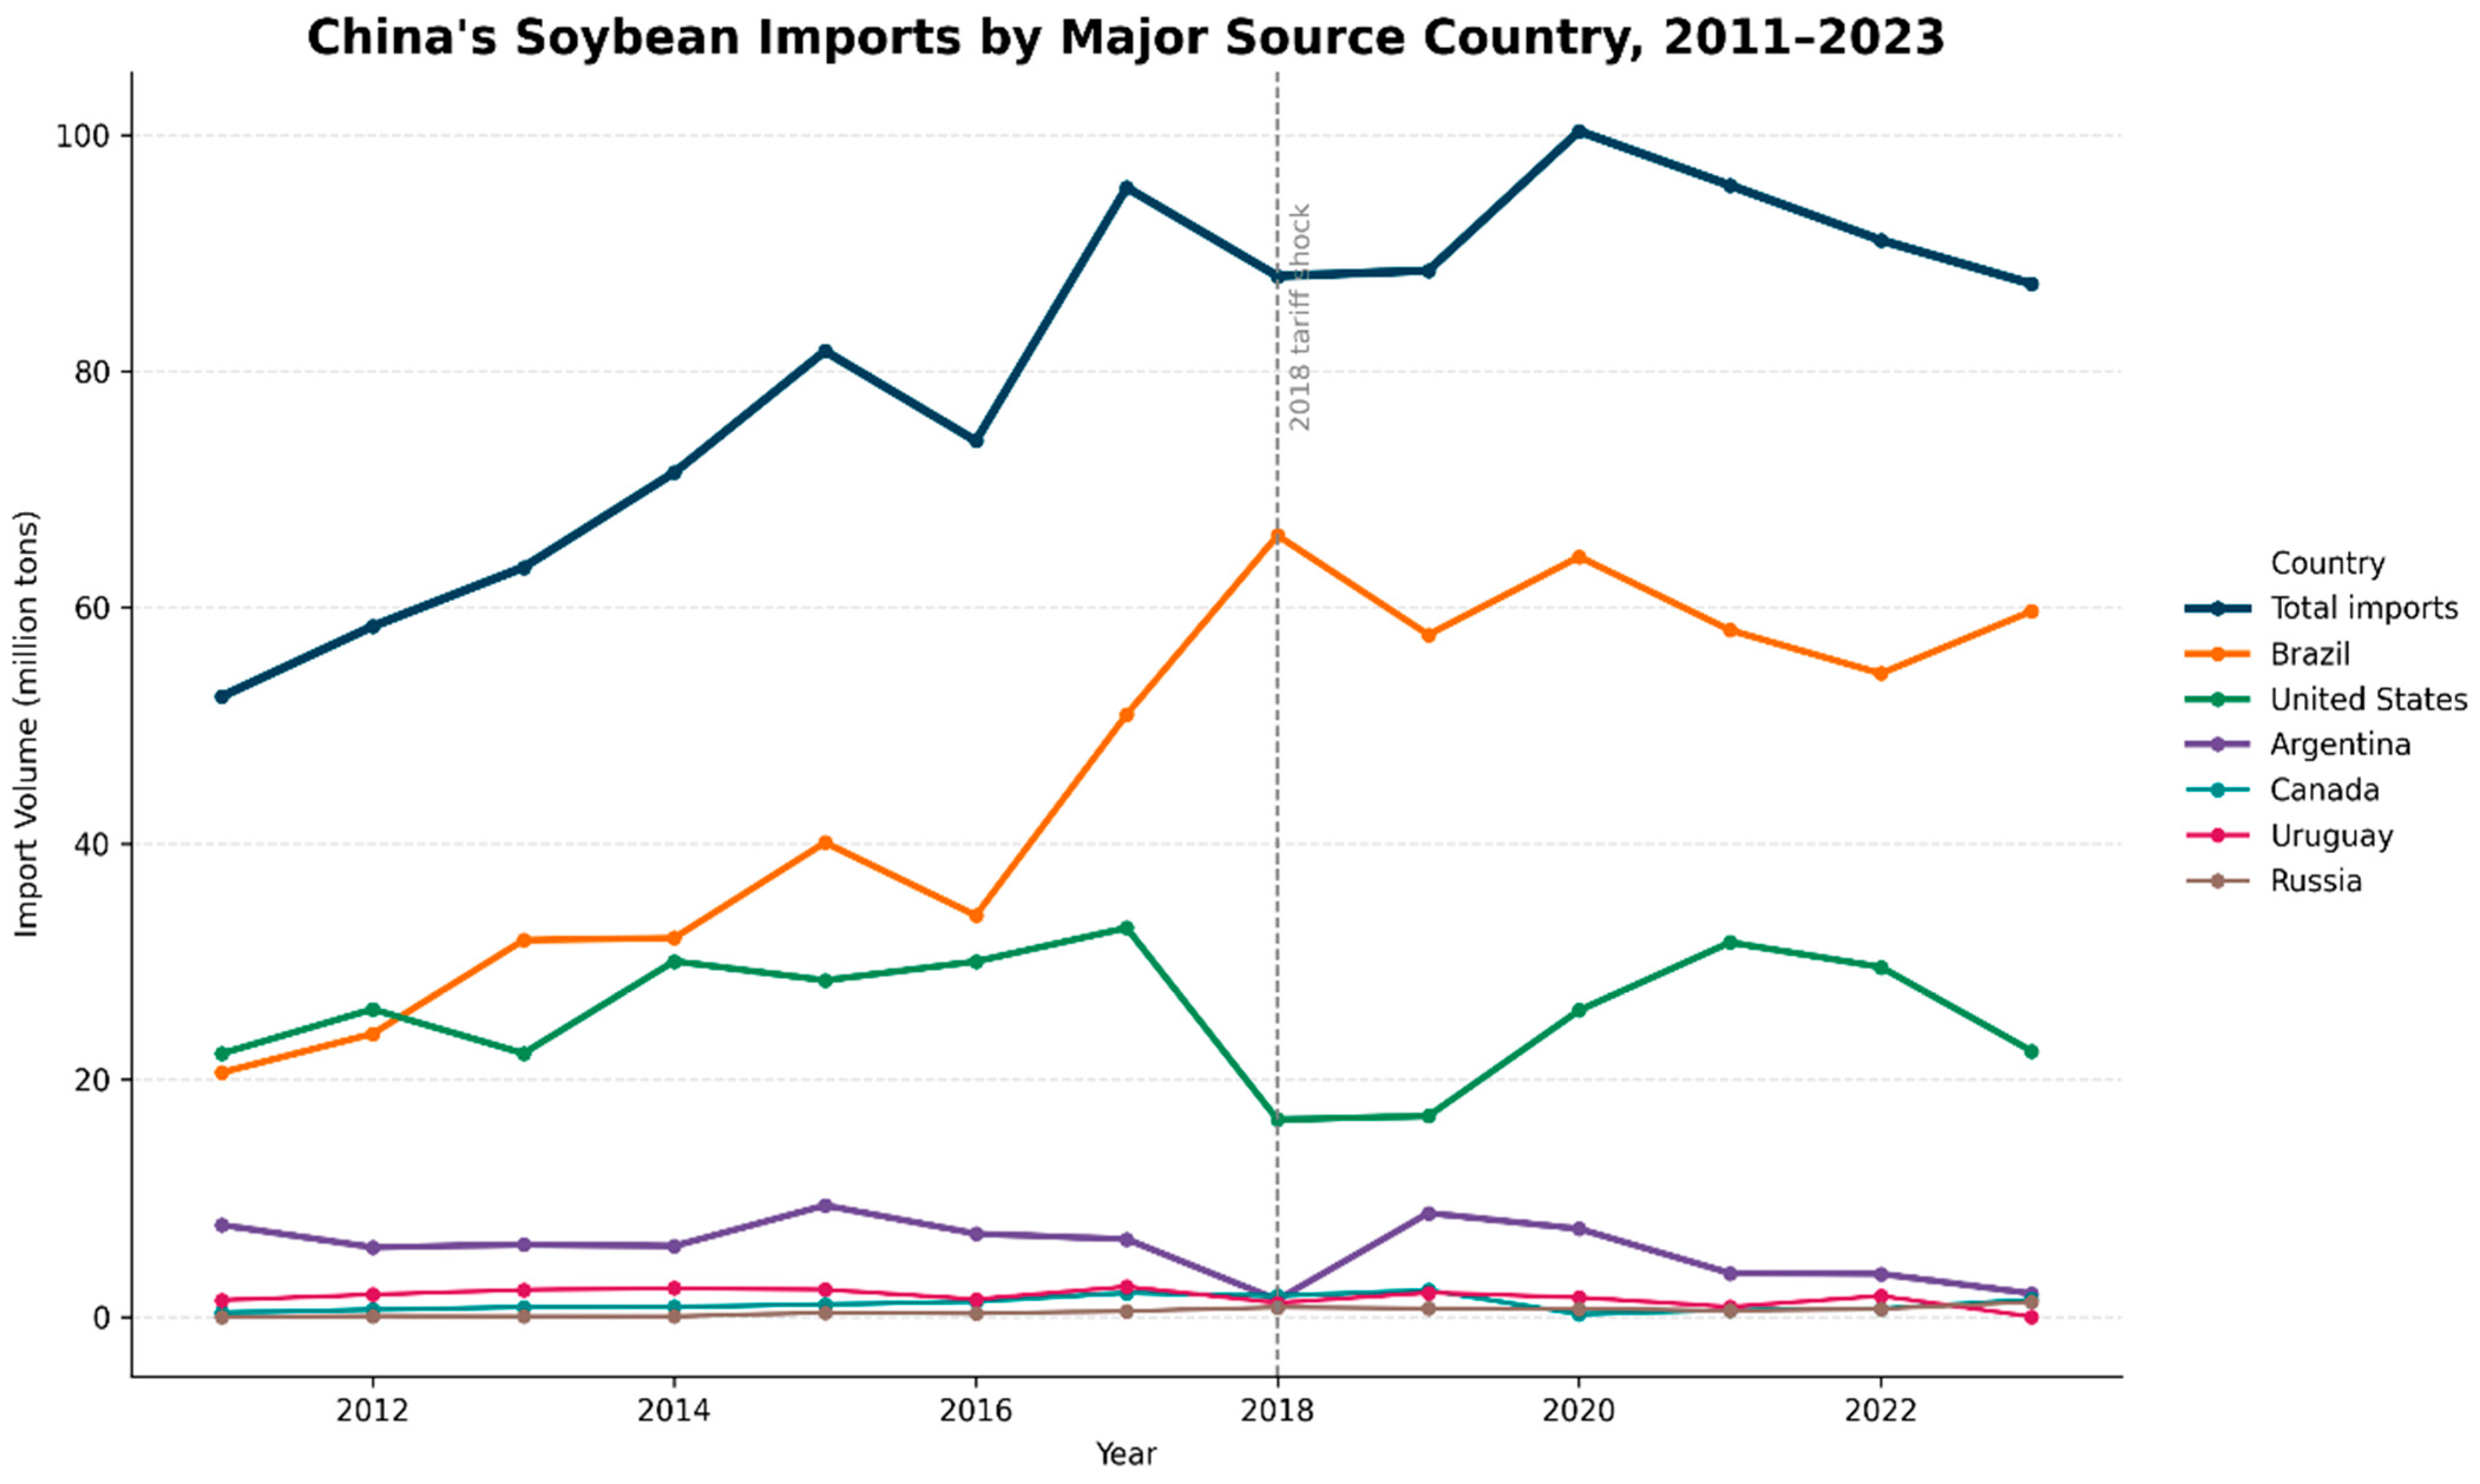
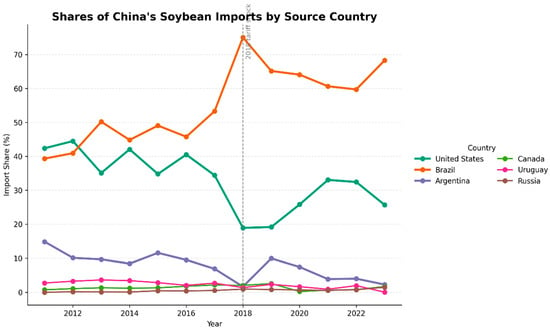
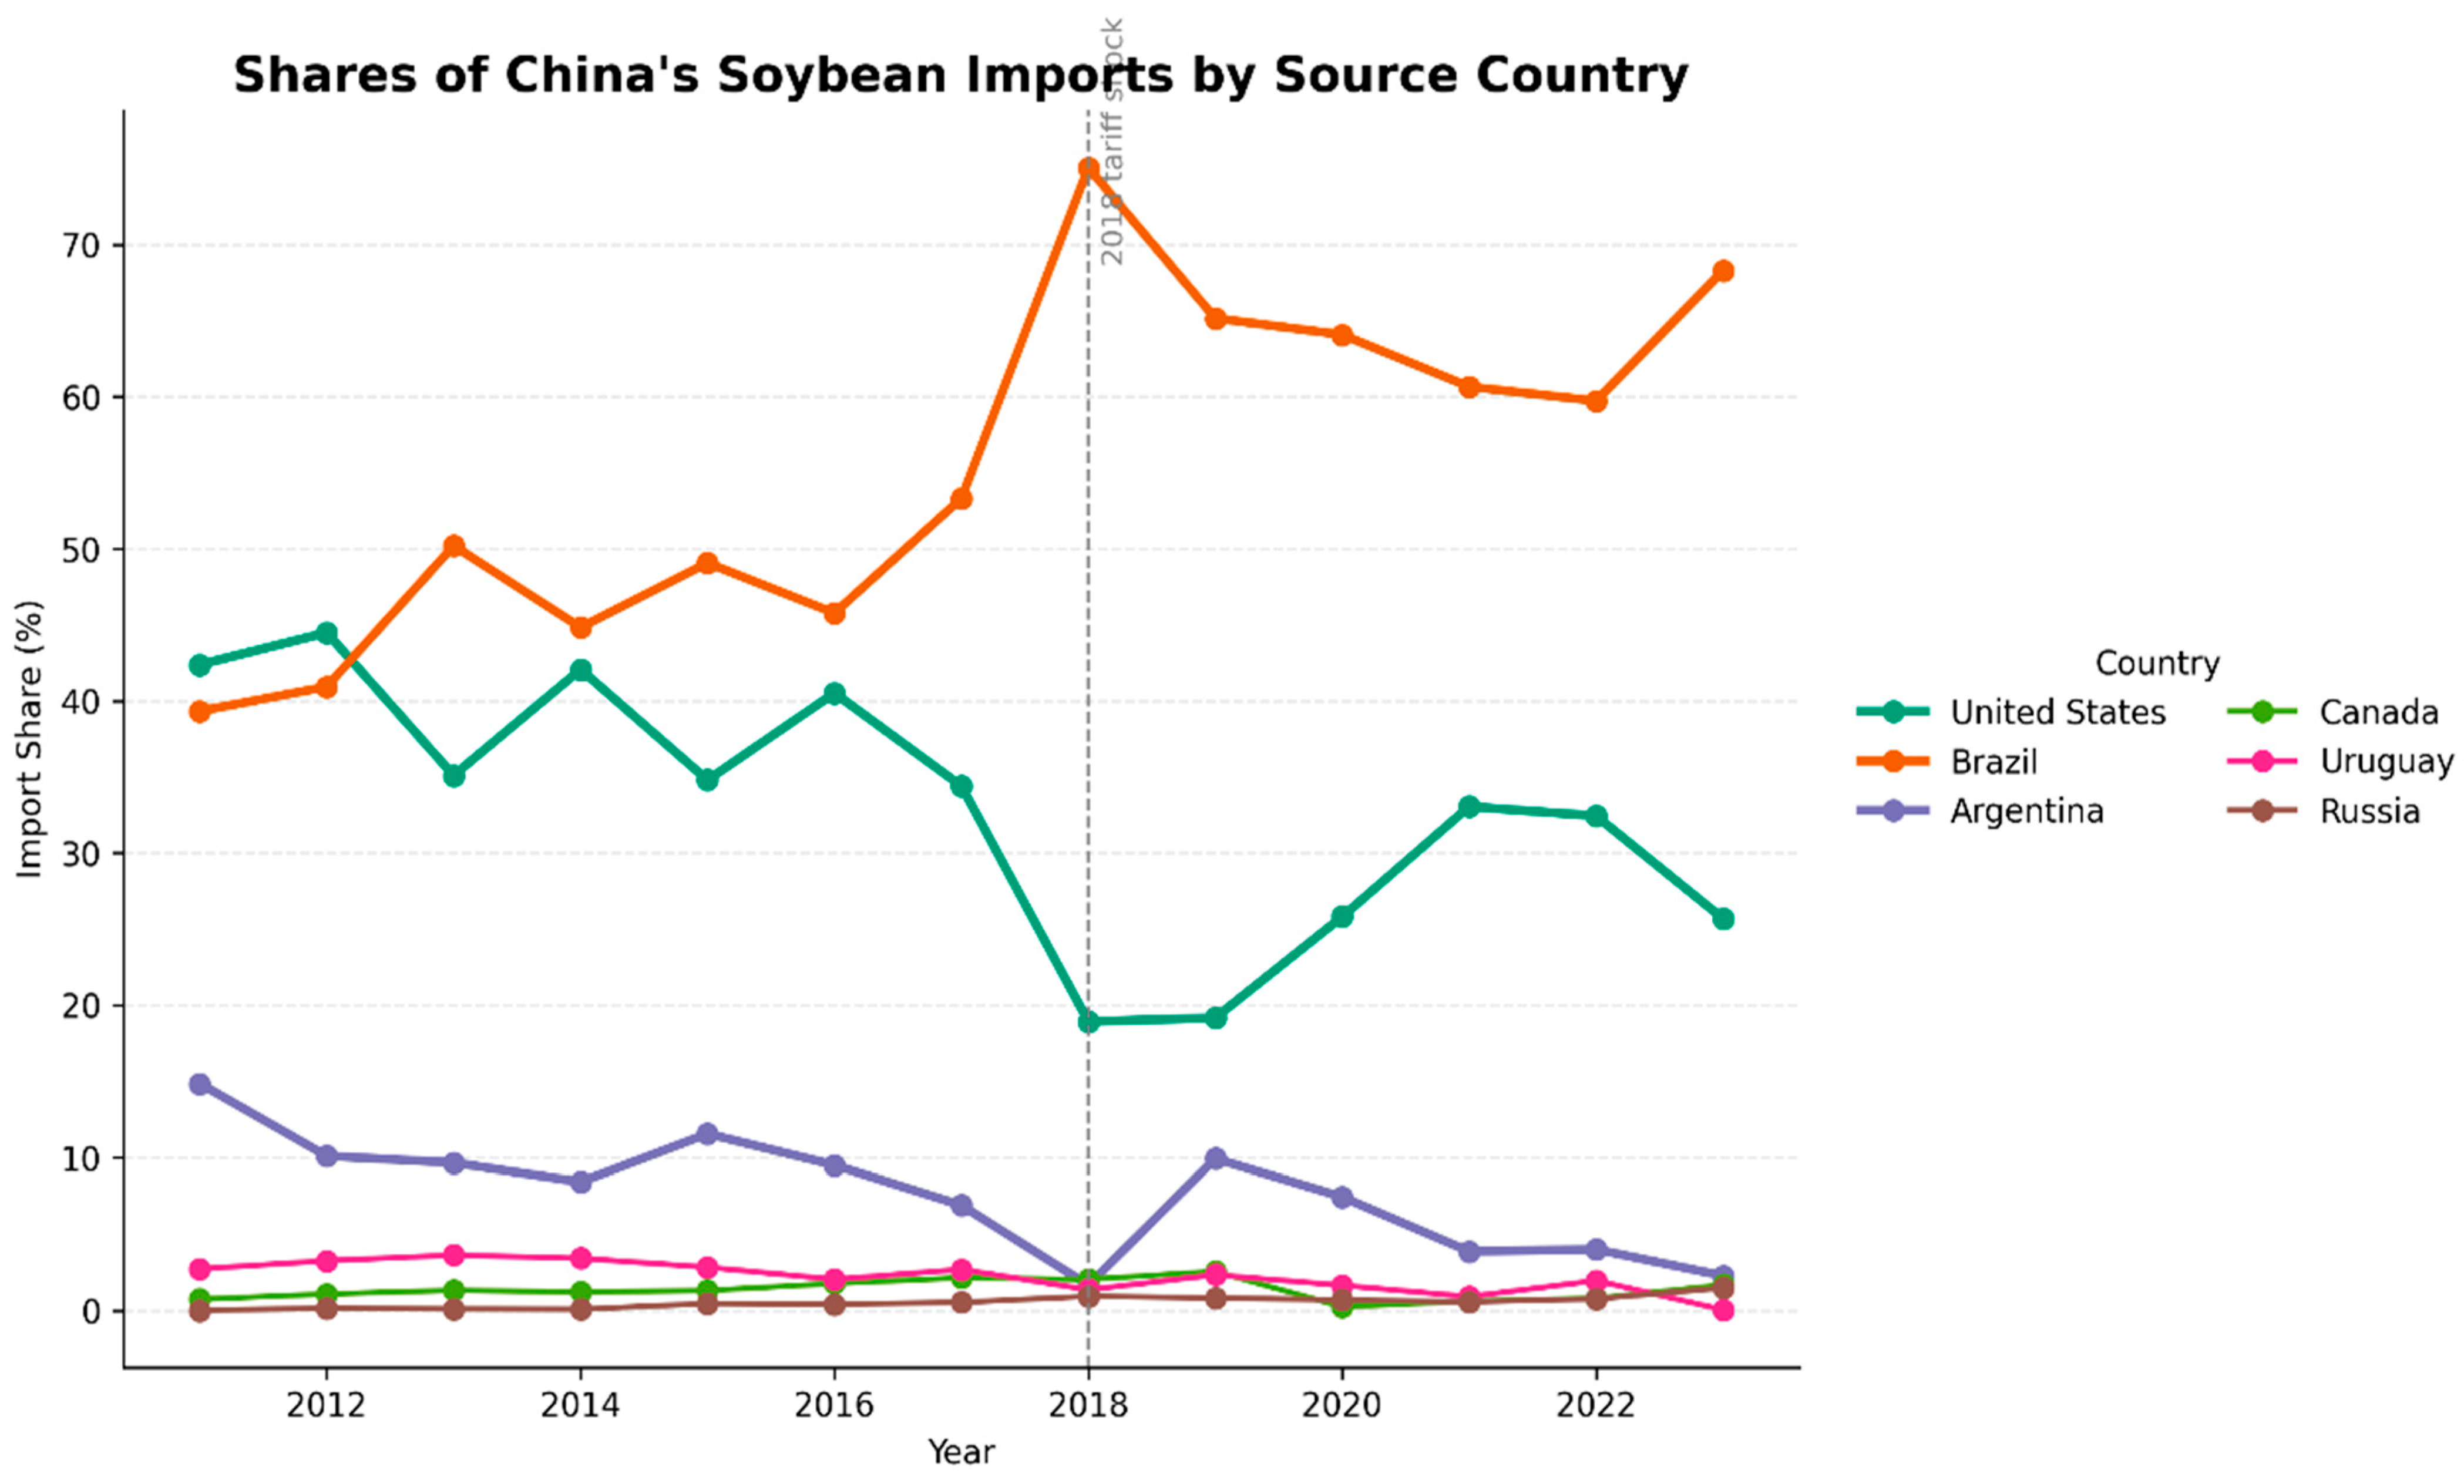
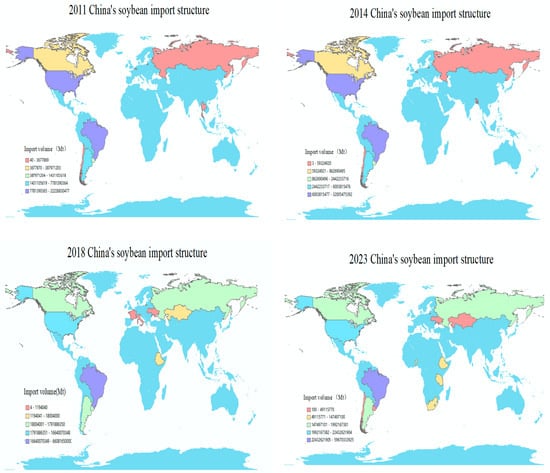
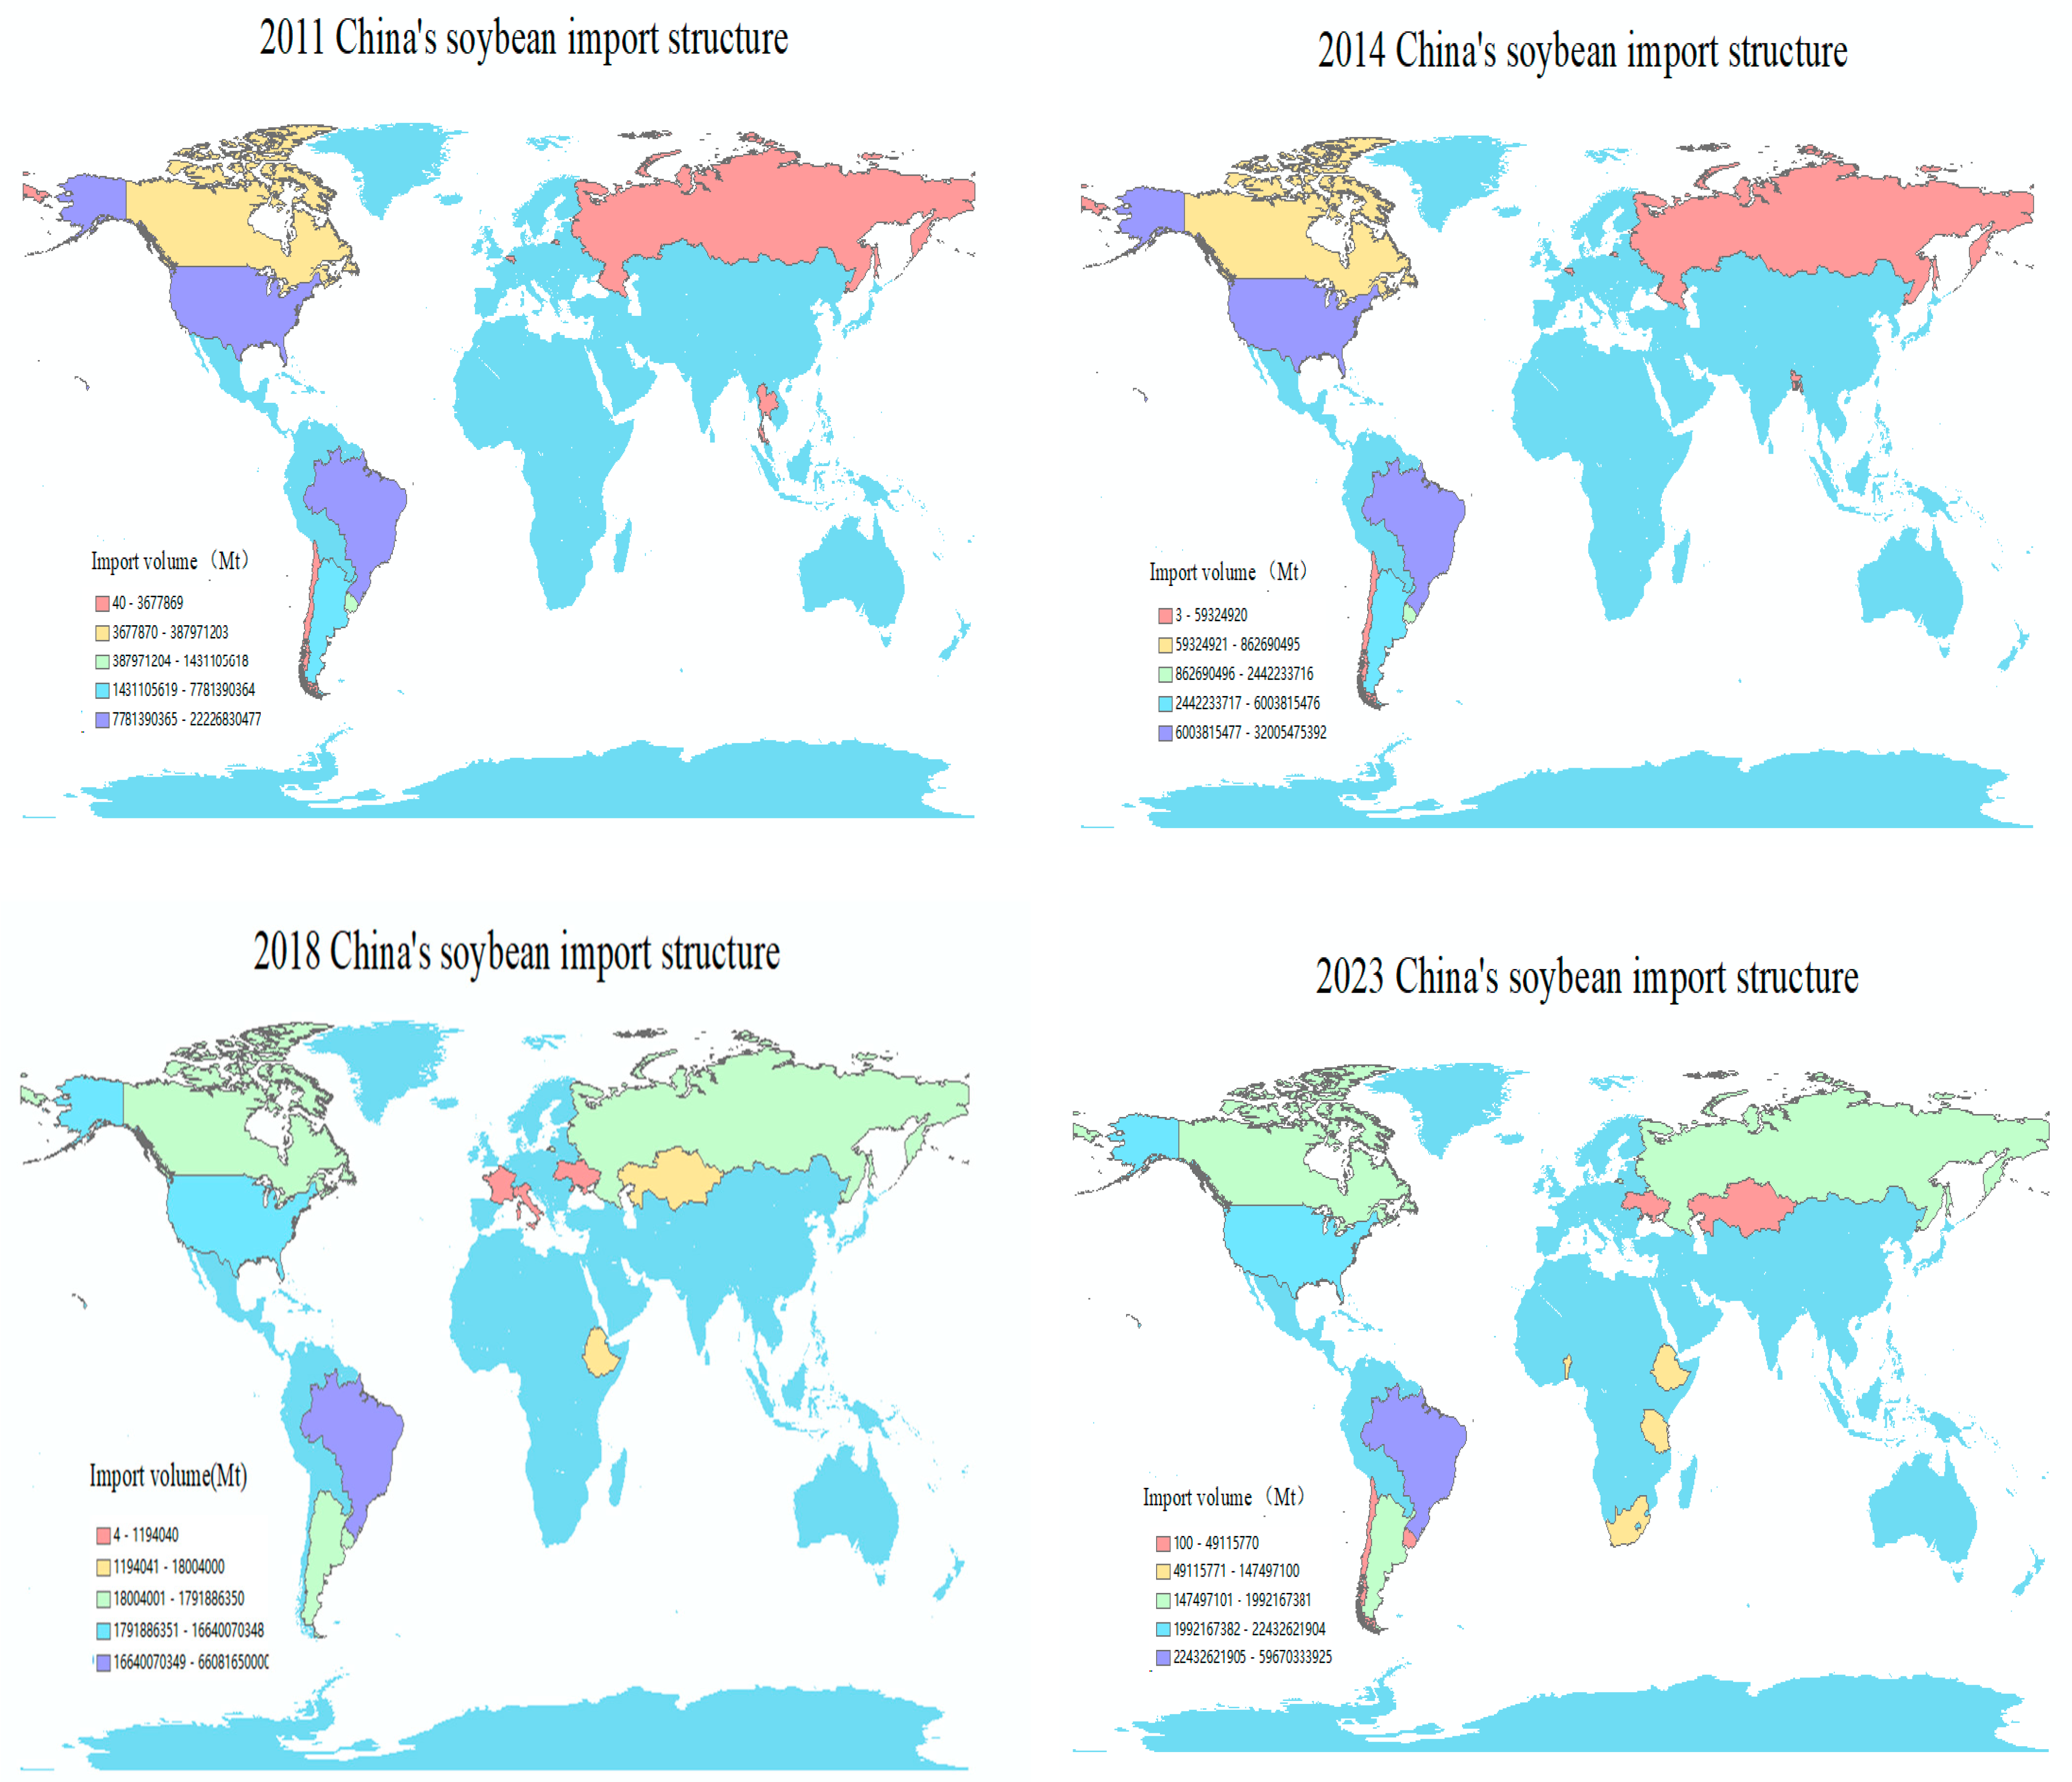
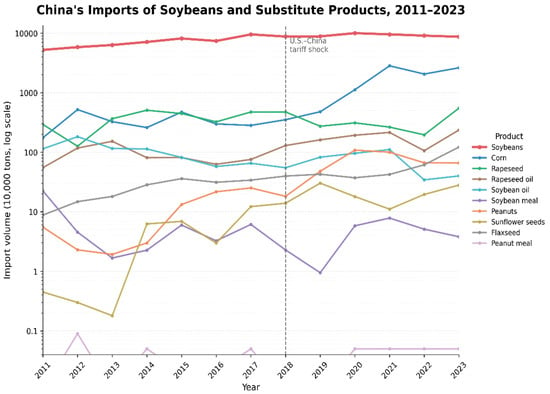
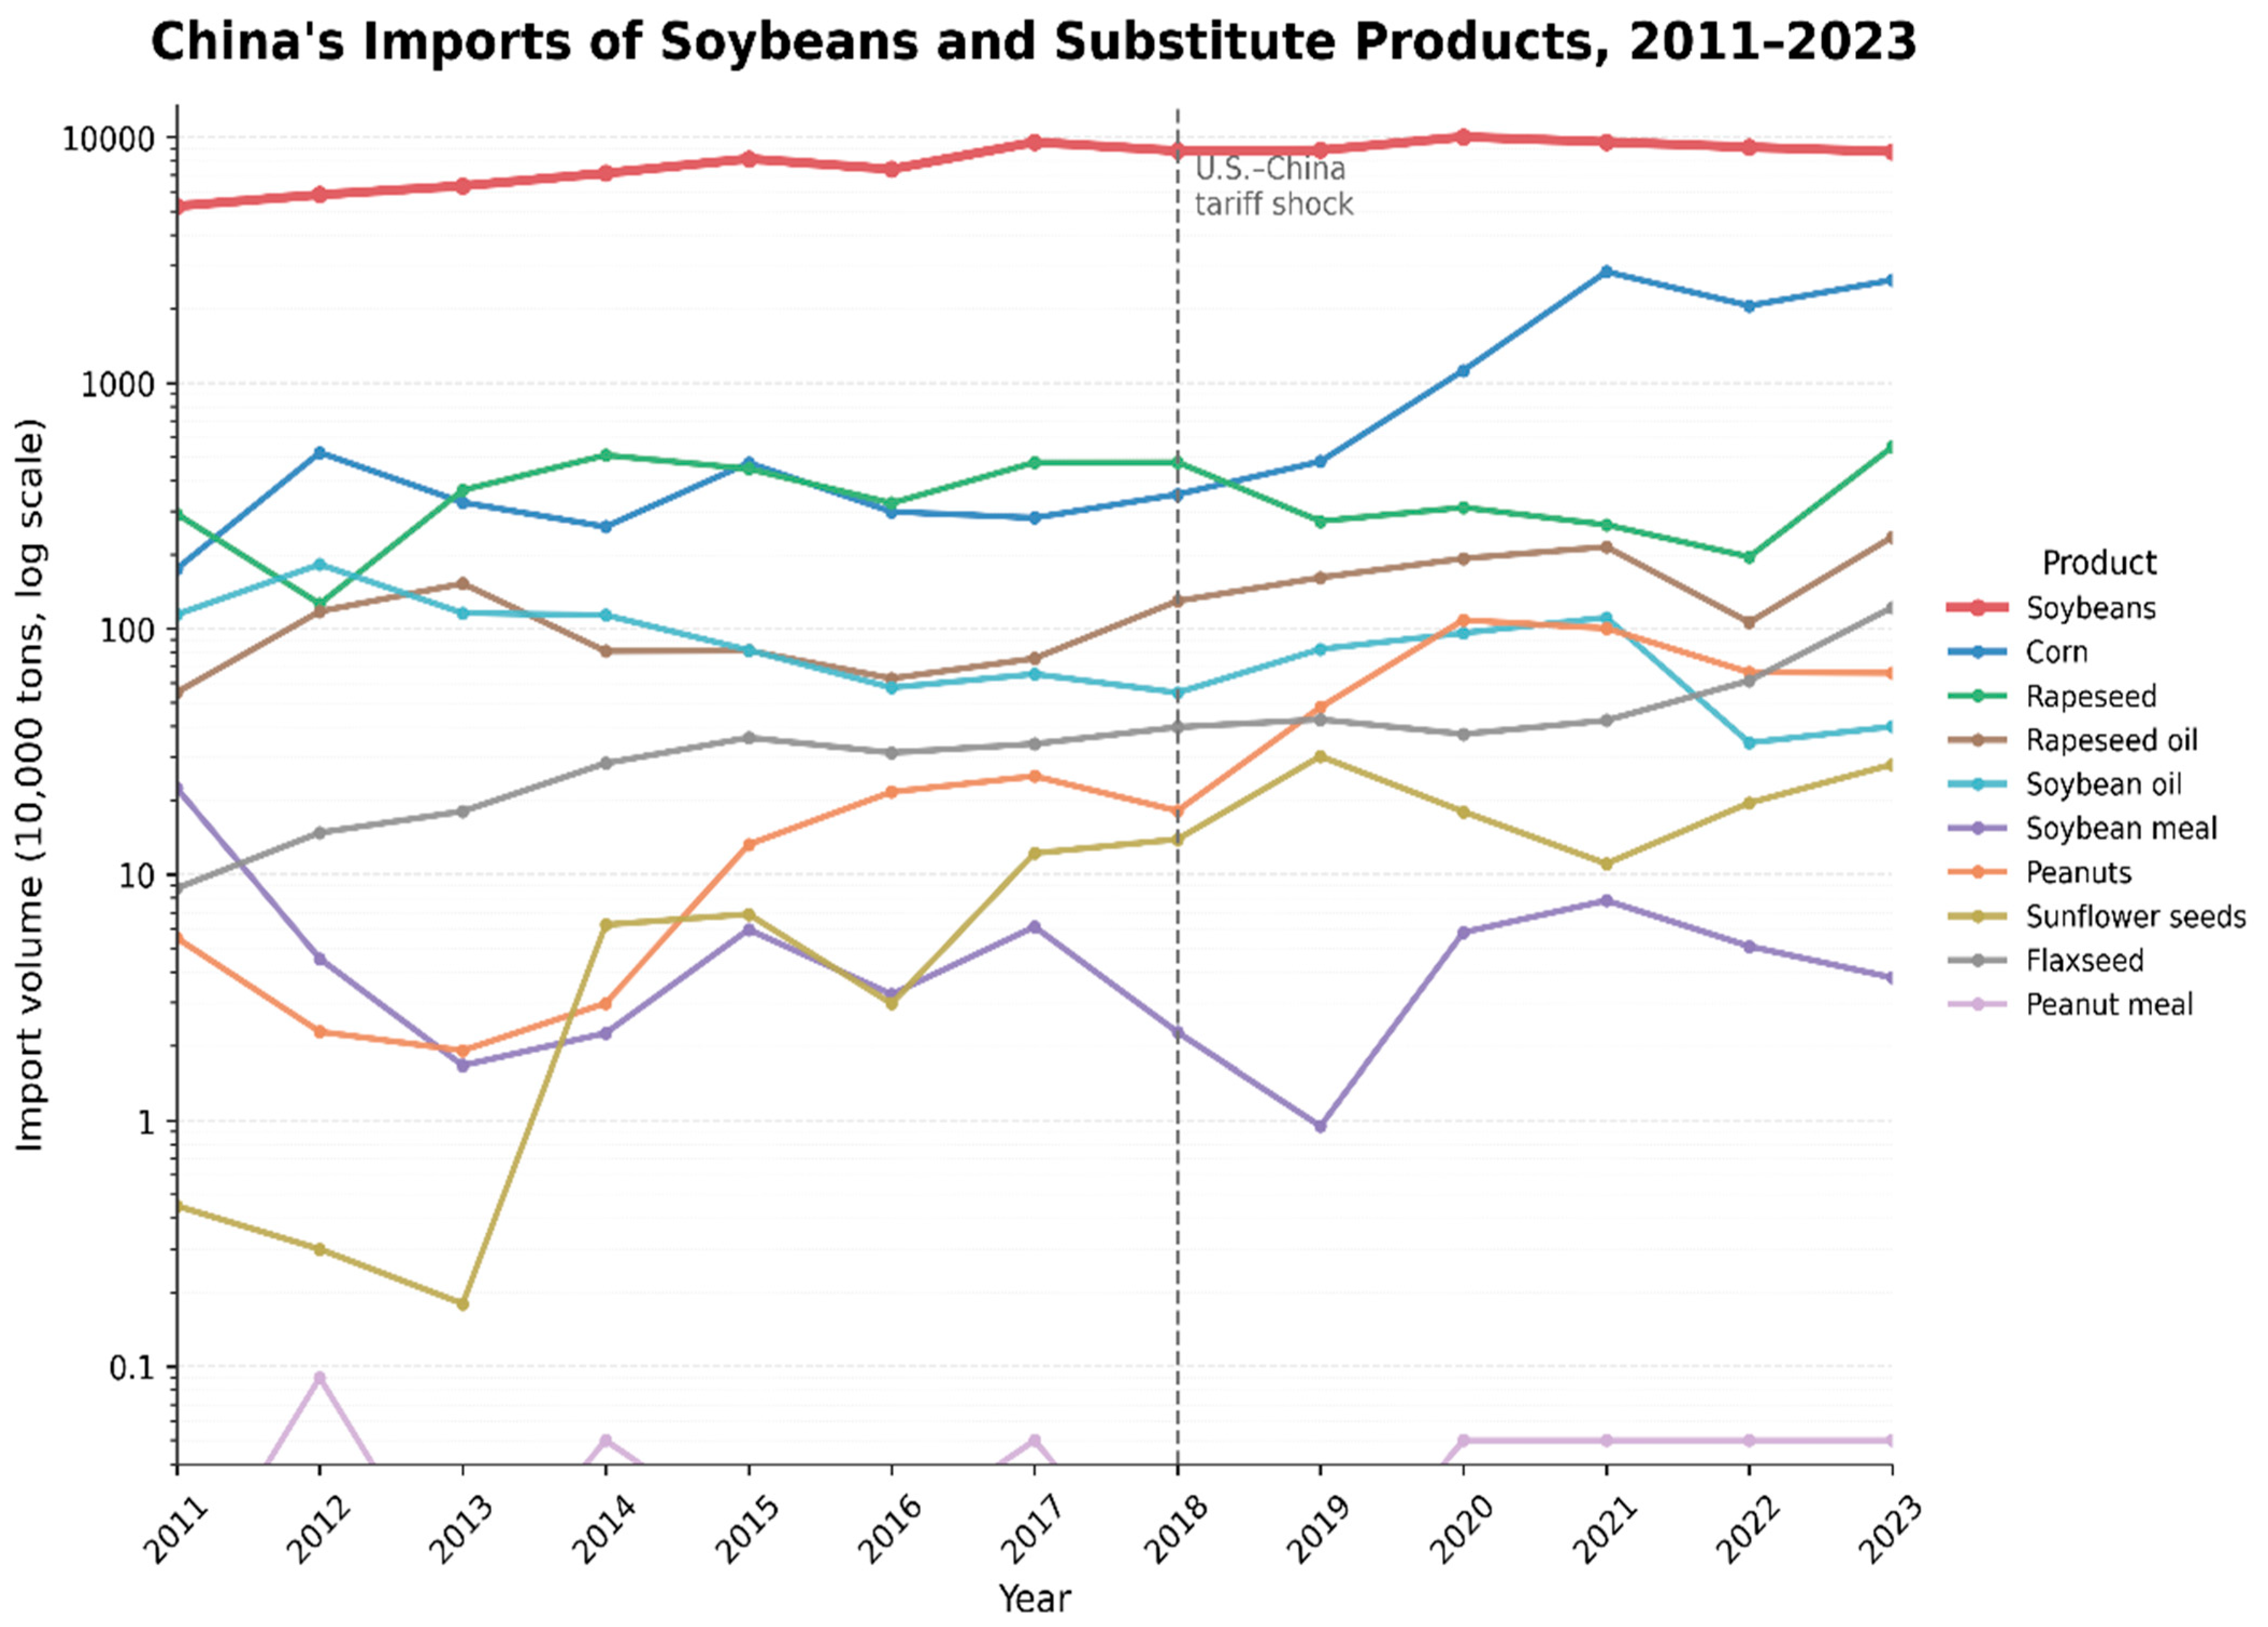
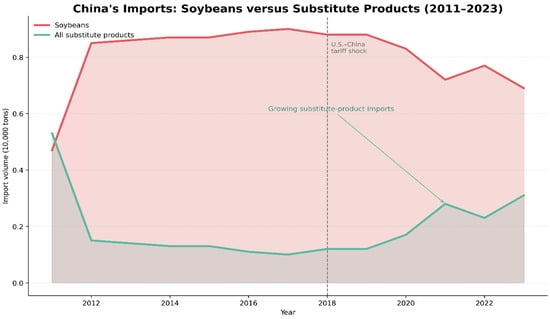
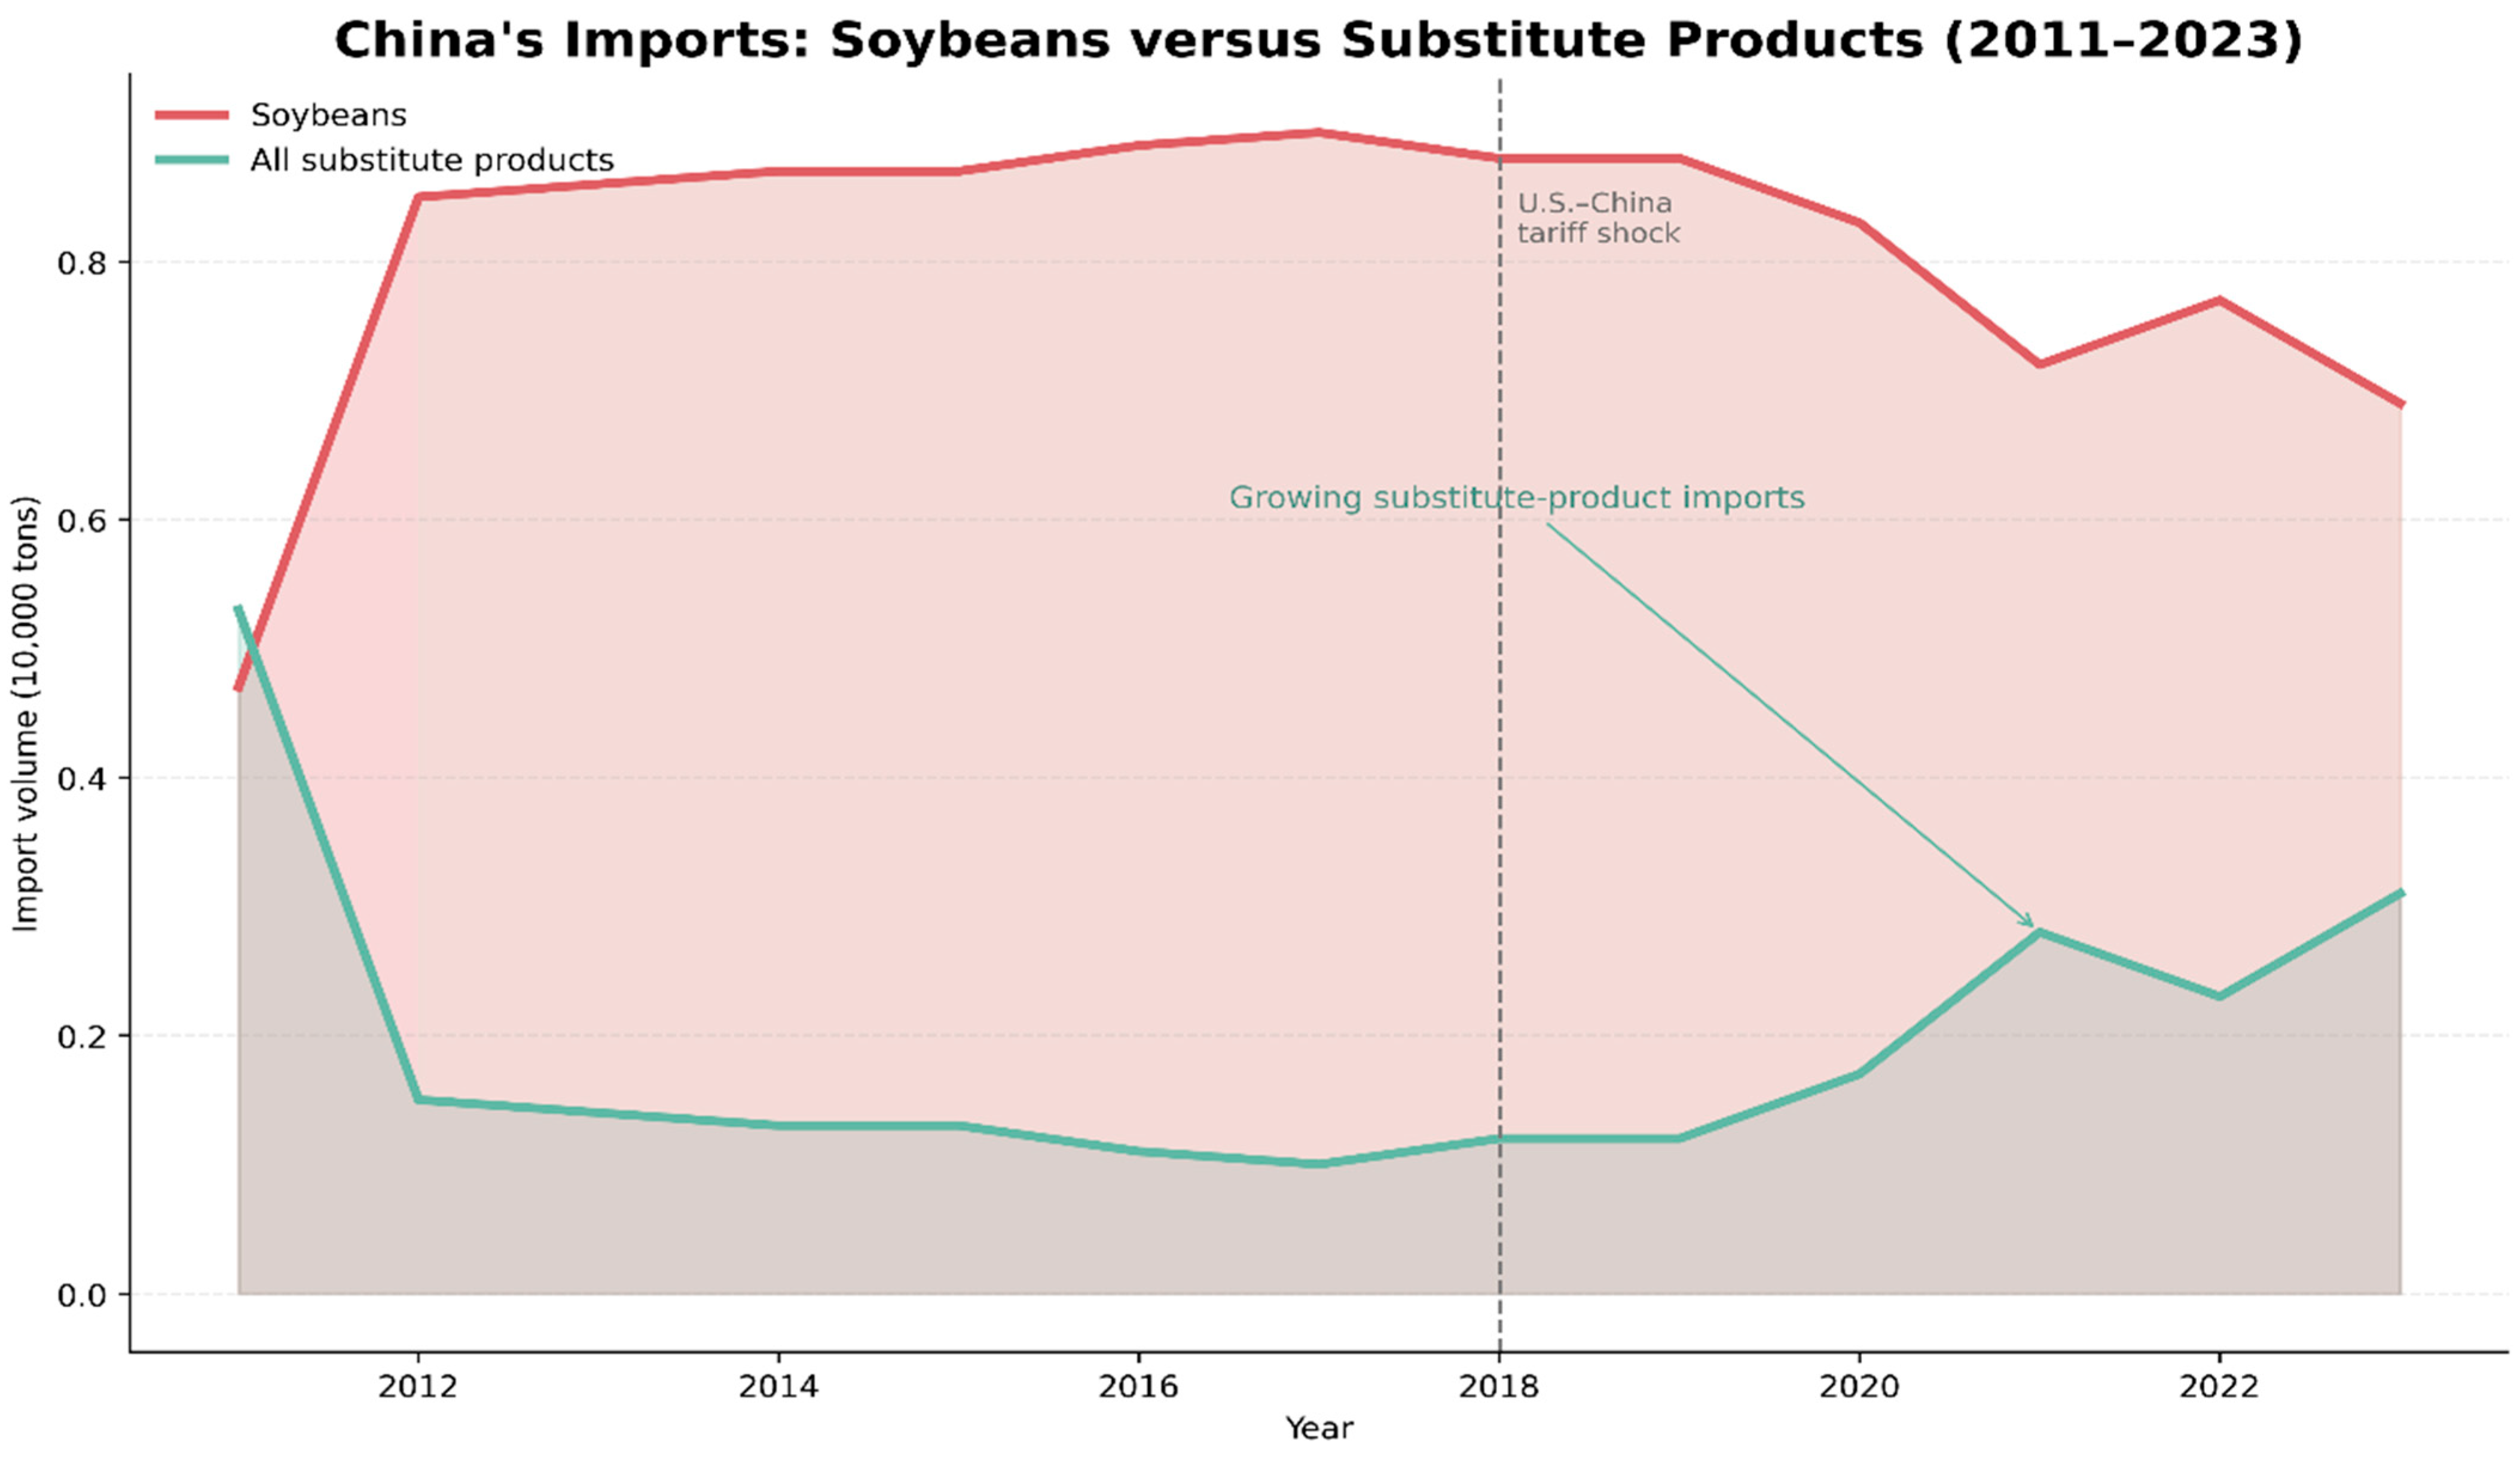
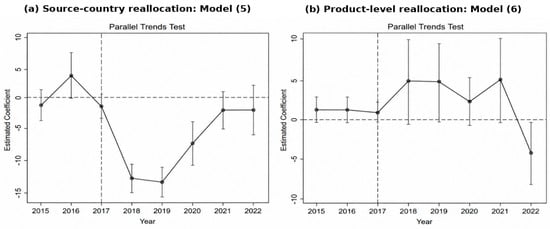
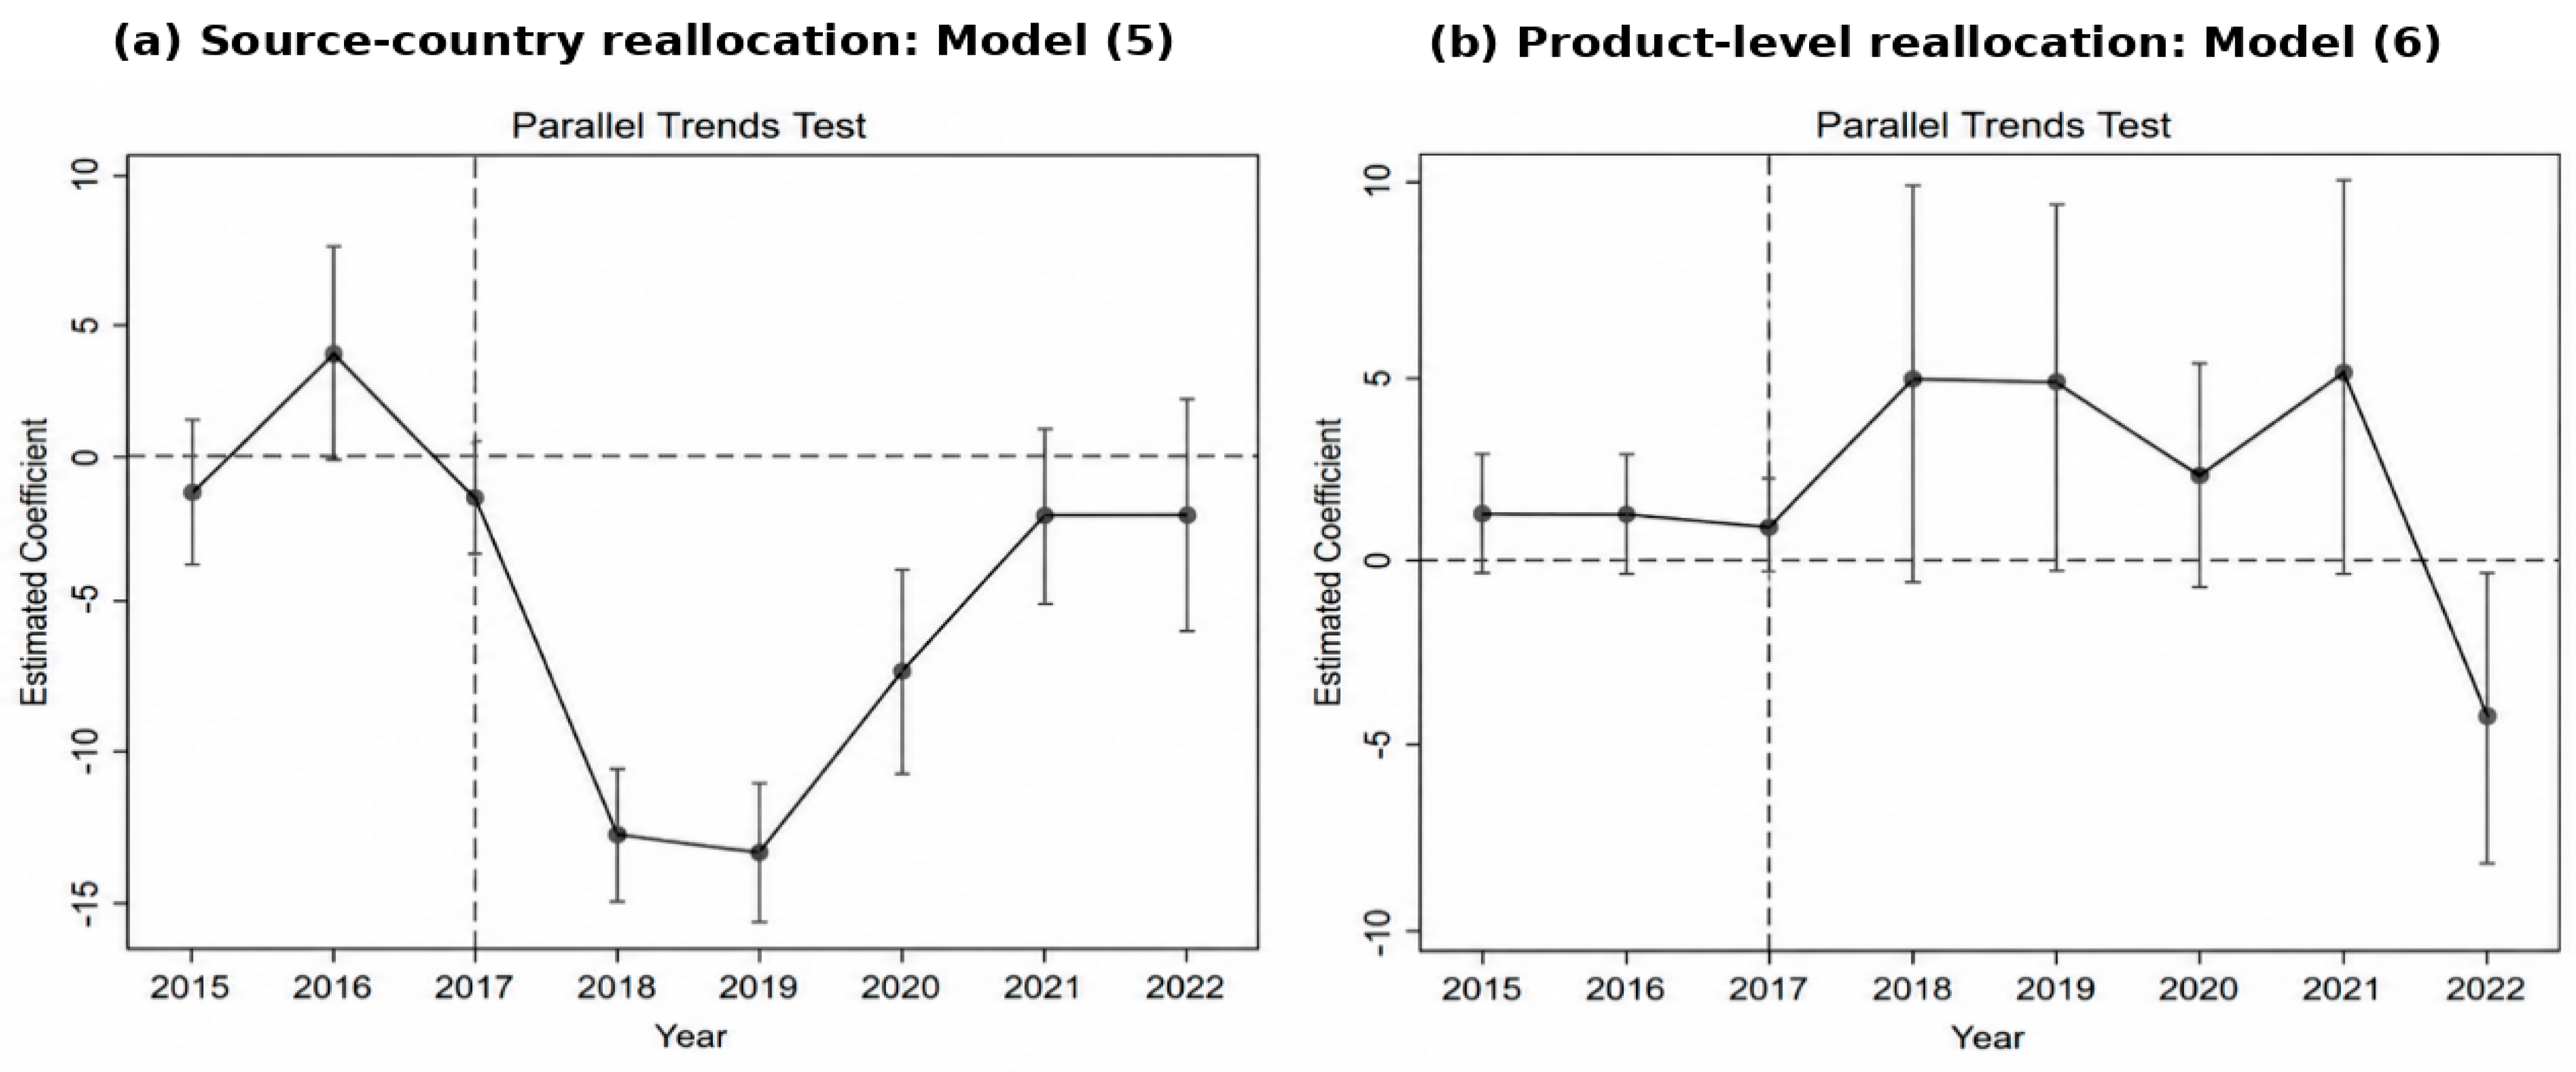
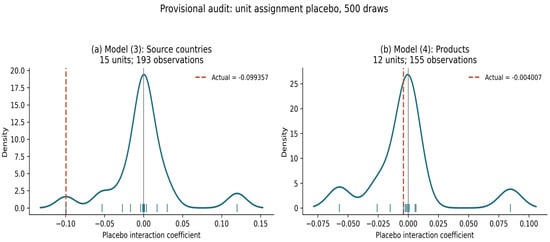
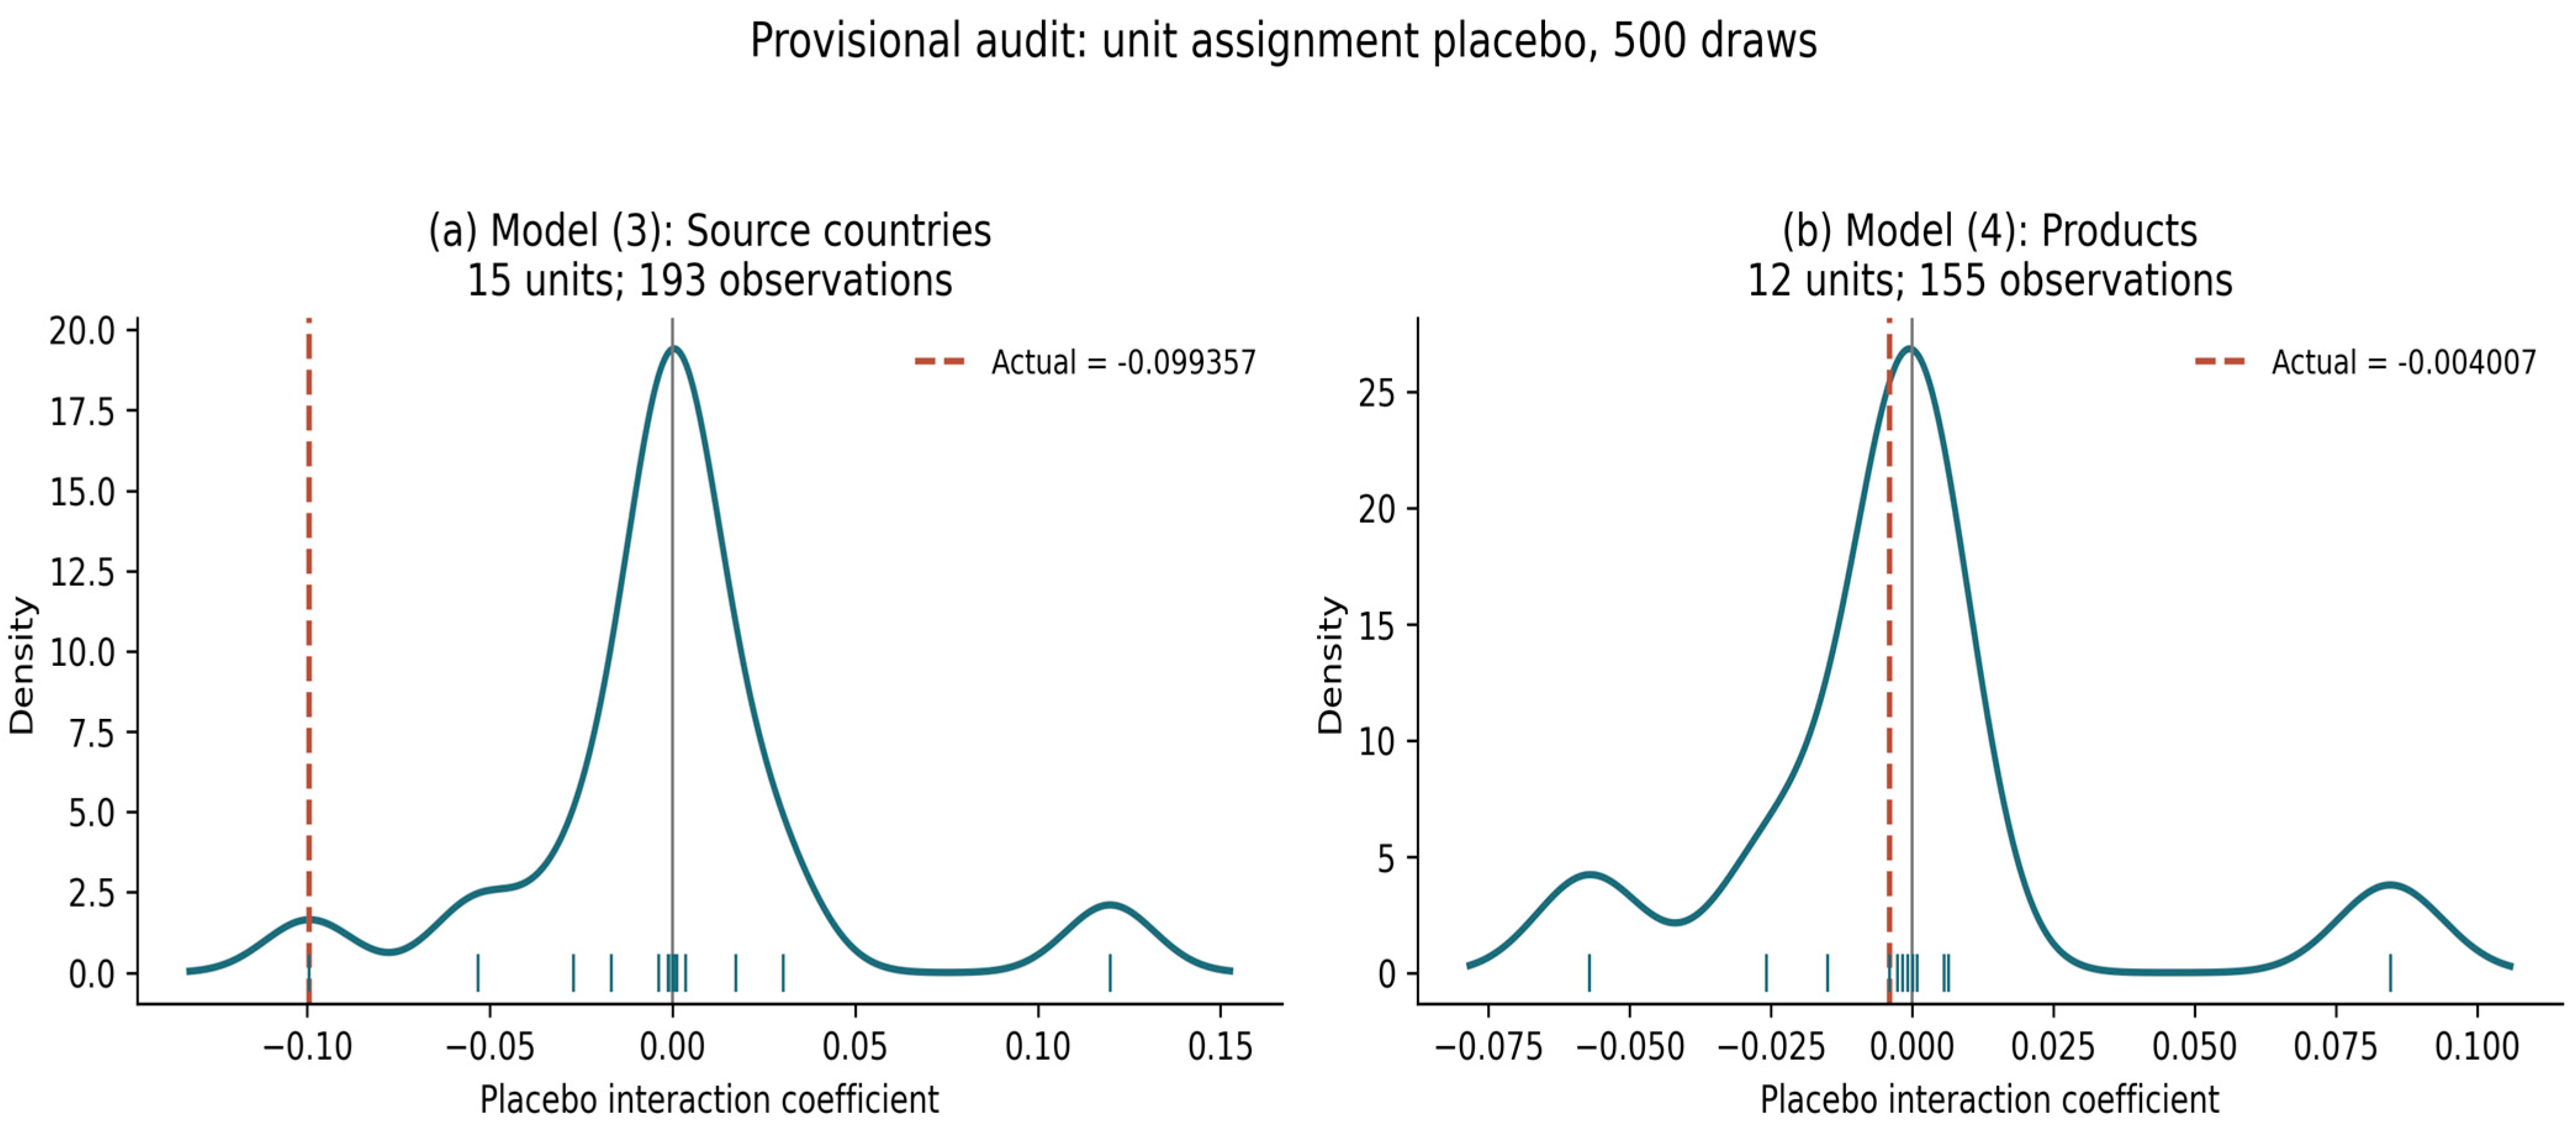

Disclaimer/Publisher’s Note: The statements, opinions and data contained in all publications are solely those of the individual author(s) and contributor(s) and not of MDPI and/or the editor(s). MDPI and/or the editor(s) disclaim responsibility for any injury to people or property resulting from any ideas, methods, instructions or products referred to in the content. |
© 2026 by the authors. Licensee MDPI, Basel, Switzerland. This article is an open access article distributed under the terms and conditions of the Creative Commons Attribution (CC BY) license.