


Abstract
This paper examines the association between government artificial intelligence (AI) readiness and labor productivity in 14 post-Soviet and comparator economies of the Caucasus, Central Asia, and Central and Eastern Europe over 2021–2024 (56 country-year observations) and asks whether the association differs with resource dependence and institutional quality. We estimate two-way fixed-effects models on World Bank and Oxford Insights data, base inference on a null-imposed wild cluster bootstrap, and assess robustness with leave-one-country-out estimation. Within countries, a one-point increase in the Government AI Readiness Index is associated with 0.32 percent lower labor productivity at the sample-mean oil rent (bootstrap p = 0.013) and 0.40 percent lower productivity at zero oil rents (p = 0.014). The zero-rent association is significant at the 10 percent level in all 14 leave-one-out samples, and the readiness association also holds in the 2021–2023 subsample. The interaction with pre-period (2021) oil rents has a positive point estimate but is only weakly significant (p = 0.085), depends on Azerbaijan and Kazakhstan, and is not robust. We find no significant variation with government effectiveness. The estimates are associations with government readiness, not causal effects of AI use; they are consistent with, but do not test, an implementation-lag reading of general-purpose technologies.
1. Introduction
Two macroeconomic developments are simultaneously reshaping the growth prospects of resource-dependent economies in Eurasia. The first is the diffusion of artificial intelligence (AI) and adjacent automation technologies, now widely recognized as a general-purpose technology whose macroeconomic impacts—through productivity, structural transformation, and the labor market—may rival those of earlier information and communication technology (ICT) waves (Acemoglu & Restrepo, 2020, 2022; Brynjolfsson et al., 2021; Guliyev et al., 2023). The second is the persistent dependence of several Commonwealth of Independent States (CIS) and post-Soviet economies on hydrocarbon and mineral rents (Destek & Destek, 2026; Humbatova et al., 2019; Sachs & Warner, 1995; Sun & Hasi, 2024). How these two forces interact—that is, whether AI-readiness gains are associated with productivity differently across resource-dependence gradients—is a policy-relevant question that the empirical literature has not resolved.
This paper addresses that question using a balanced panel of 14 economies over 2021–2024. We report our results as associations rather than as causal identifications, and we adopt three interpretive constraints throughout. First, the panel window is short (four years); we cannot identify long-run general-purpose-technology dynamics, and we frame our findings as consistent with, rather than demonstrated by, alternative theoretical mechanisms. Second, the sample is small (14 cross-sectional units, 56 observations); we base inference on a null-imposed wild cluster bootstrap (Cameron et al., 2008; MacKinnon & Webb, 2018; Roodman et al., 2019), which improves small-cluster inference but does not create identifying variation. Because oil rents are material in only two economies, inference on the oil-rent interaction is especially fragile (MacKinnon & Webb, 2018). Third, the Oxford Insights Government AI Readiness Index is a composite indicator whose construct validity has been questioned in recent work (Ben Brik, 2026; Mandon, 2025) and whose indicator set changes between annual editions; we treat it as an ecosystem diagnostic rather than as a pure measure of AI capability. The index measures how ready governments are to use AI—national strategy, governance, public-sector digital capacity, the technology sector, and data infrastructure—not the actual adoption or use of AI by firms or workers. A negative coefficient on readiness is therefore not evidence that greater AI use reduces productivity.
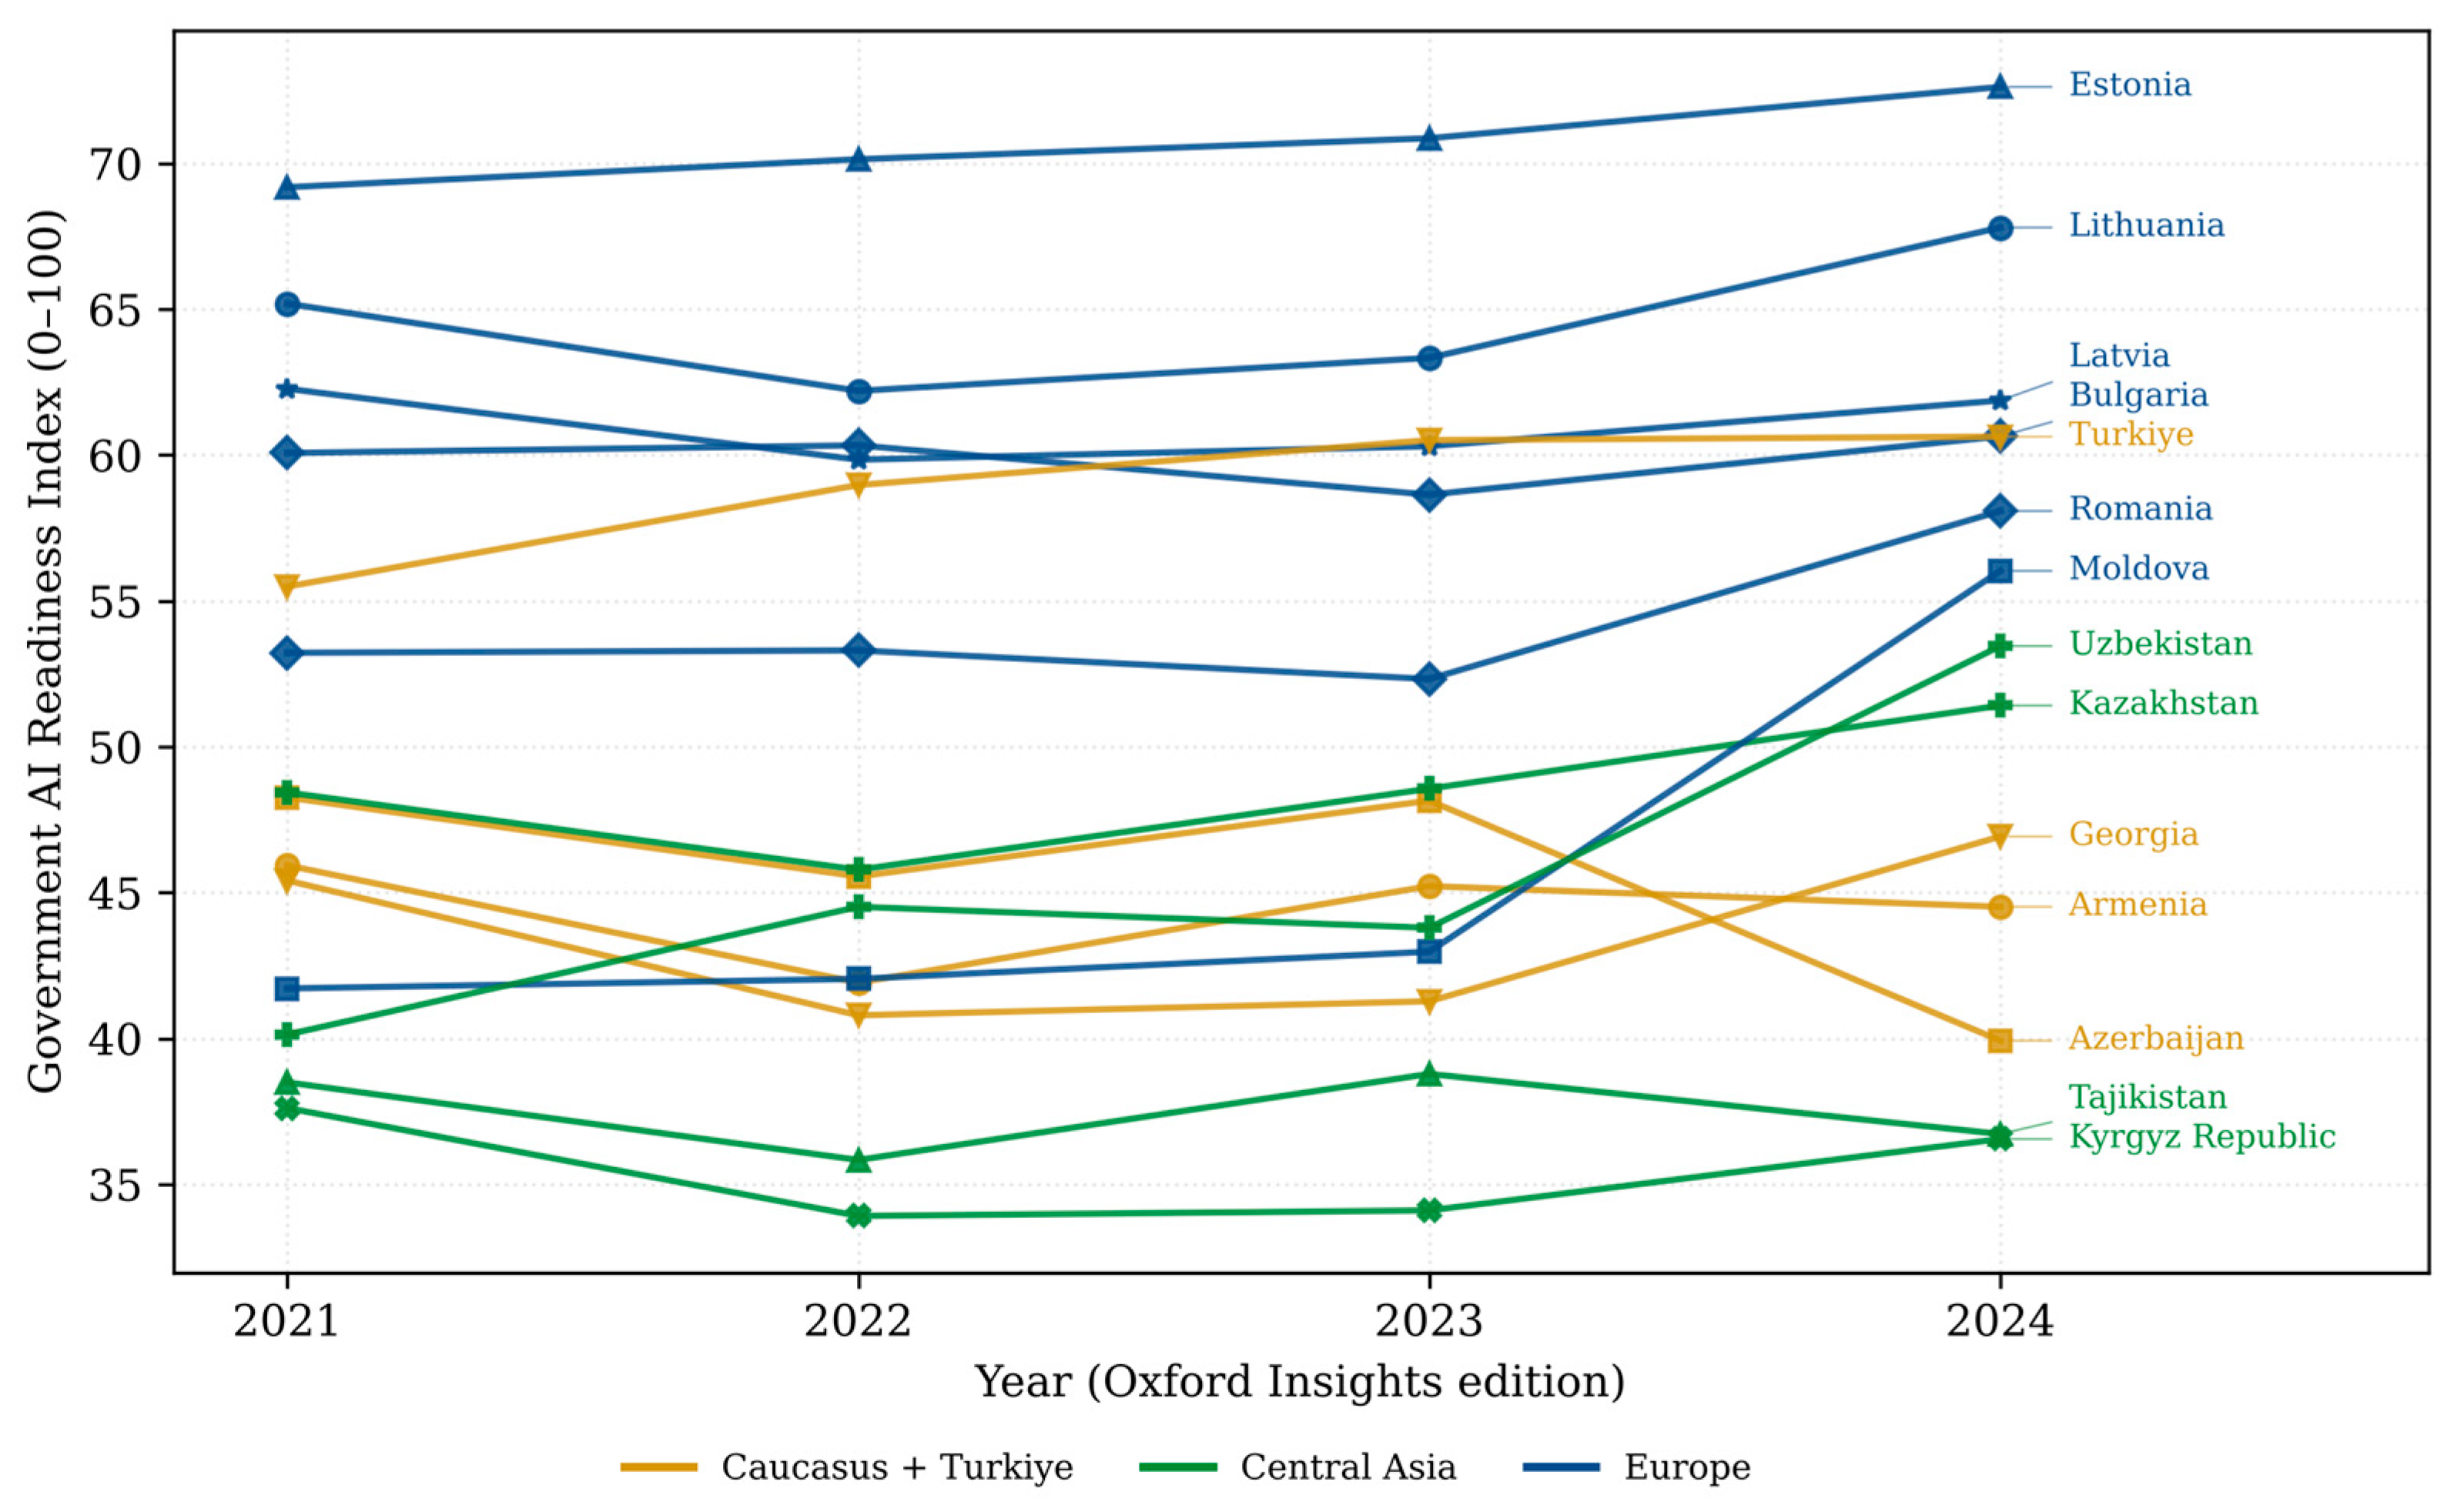
The sample is organized into three regional groupings: (i) Caucasus and Turkiye—Azerbaijan, Georgia, Armenia, Turkiye; (ii) Central Asia—Kazakhstan, Uzbekistan, Kyrgyz Republic, Tajikistan; and (iii) Europe—Latvia, Lithuania, Estonia, Moldova, Romania, Bulgaria. The groupings do not share a common institutional legacy. Eleven of the fourteen economies are former Soviet republics (Armenia, Azerbaijan, Georgia, the four Central Asian economies, the three Baltic states, and Moldova); Bulgaria and Romania are former socialist economies that were not part of the Soviet Union; and Turkiye has no state-socialist legacy. These three serve as comparators. The economies differ substantially in resource dependence—in 2021, oil rents amounted to 21.0 percent of gross domestic product (GDP) in Azerbaijan and 14.8 percent in Kazakhstan but to at most 0.96 percent in the other twelve economies—and in AI readiness, from 33.9 (Kyrgyz Republic in 2022) to 72.6 (Estonia in 2024).
Three findings structure the analysis. First, within countries, higher AI readiness is associated with lower measured labor productivity. In the two-way fixed-effects specification, a one-point increase in the index is associated with 0.32 percent lower labor productivity at the sample-mean oil rent (β = −0.0032; wild cluster bootstrap p = 0.013) and with 0.40 percent lower productivity at zero oil rents (β = −0.0040; p = 0.014), the level that describes twelve of the fourteen economies. The zero-rent association is negative in all fourteen leave-one-country-out samples, significant at the 5 percent level in twelve of them; the readiness association also holds when the 2024 observations are excluded.
Second, the interaction between AI readiness and pre-period (2021) oil rents has a positive point estimate (β = +0.00031) but is only weakly significant (wild cluster bootstrap p = 0.085). It loses significance when either Azerbaijan or Kazakhstan is excluded and in several alternative specifications. We therefore describe it as a descriptive pattern concentrated in these two economies, not as evidence that oil rents moderate the association.
Third, we find no statistically significant variation of the association with government effectiveness (AI × government effectiveness: β = −0.0036; p = 0.189). We label this analysis “conditional effects” (moderation) rather than “mediation” in the strict statistical sense.
We interpret these findings through theoretical lenses that we frame as consistent with the data pattern rather than tested by it. The negative within-country association is consistent with the implementation-lag phase of general-purpose-technology diffusion (Brynjolfsson et al., 2021; Syverson, 2017). Neither this mechanism nor a rent-financed digital-transformation channel, which could account for the positive point estimate of the oil-rent interaction, is directly identified in our data.
The rest of the paper proceeds as follows. Section 2 sets out the conceptual framework, the hypothesis, and the research questions. Section 3 describes the data and their preparation. Section 4 outlines the empirical strategy. Section 5 presents the baseline, marginal-association, conditional-effects, and robustness results. Section 6 discusses the findings, Section 7 draws cautious policy implications, and Section 8 concludes. Appendix A reports secondary outcomes and additional robustness checks; Appendix B reports exploratory instrumental-variable and threshold analyses.
Contribution. This study adds to the literature in three ways. First, it provides country-year panel evidence on the within-country association between government AI readiness and labor productivity for the Caucasus and Central Asia alongside European Union (EU) comparators—economies that are largely absent from cross-country studies of AI and macroeconomic outcomes, which have concentrated on Organisation for Economic Co-operation and Development (OECD), EU, and Group of Seven (G7) samples (Drago et al., 2025; Guliyev et al., 2023). Second, it brings resource dependence into the analysis of the AI–productivity link and shows that an apparent positive moderating role of oil rents is weak, rests on two economies, and is not robust under small-cluster inference—a cautionary result for future work that conditions AI effects on resource rents in small samples. Third, it documents transparently how conclusions from a small panel depend on inference that accounts for few clusters and few treated clusters, and it releases the country-year dataset, built entirely from official sources, together with the analysis code so that every table and figure can be reproduced. For the economics of technological change, the results show that in the short run, gains in government-level AI readiness are not accompanied by higher output per worker or faster output growth (Section 5; Table A1), which is in line with the emphasis that the general-purpose-technology and skill-biased technological change literatures place on complementary investment in skills and organization (Section 2.1).
2. Conceptual Framework and Literature Review
2.1. Three Theoretical Lenses
Our framework draws on three complementary bodies of theory. The endogenous growth and general-purpose technology (GPT) literature (Acemoglu & Restrepo, 2020, 2022; Bresnahan & Trajtenberg, 1995; Brynjolfsson et al., 2021) treats AI as a GPT whose productivity effects operate through capital deepening, task automation, and complementary intangible investment. Crucially, this literature emphasizes that GPT-driven productivity gains typically materialize with implementation lags: the initial phase often exhibits a productivity J-curve in which resources devoted to complementary organizational, human-capital, and business-process investment depress measured productivity before gains appear (Brynjolfsson et al., 2021; Syverson, 2017). Our four-year panel is too short to identify the timing or magnitude of these lags directly, but the J-curve logic implies a directional prediction for the early diffusion phase, which we state in Section 2.3.
The resource-curse literature (Destek & Destek, 2026; Humbatova et al., 2019; Sachs & Warner, 1995; Sun & Hasi, 2024; Y. Zhao et al., 2024) provides a competing lens on the role of rents. Fossil-fuel and mineral rents can weaken incentives for knowledge-intensive investment, distort structural transformation via Dutch disease, and generate volatility-driven cycles that impede sustained productivity growth. Applied to AI, this logic predicts a weaker (or more negative) AI–productivity association at higher rents. A rent-financed digital-transformation logic, in which hydrocarbon revenues fund public-sector digital programs in economies with thin private digital ecosystems, predicts the opposite: a stronger association at higher rents. Because the two mechanisms imply opposite signs, theory does not yield a single directional prediction for the oil-rent gradient, and we formulate it as a research question.
The third lens is the institutional readiness and construct validity literature (Alderete, 2026; Ben Brik, 2026; Mandon, 2025; Nasution et al., 2024). Ben Brik (2026) shows empirically that AI readiness indices are heavily income- and wealth-saturated and warns that failure to acknowledge this saturation leads to overstated causal claims. Institutional quality could condition the AI–productivity association in either direction: complementarity arguments imply that effective governments convert AI capacity into productivity more readily (a positive gradient), whereas the J-curve logic implies that high-capacity states, which invest most heavily in complementary intangibles during the early phase, may show a more negative short-run association (a negative gradient). We therefore also treat this gradient as a research question.
A related body of work, the skill-biased technological change (SBTC) literature, studies technological change through its effects on the demand for skills, wage differentials, and labor-market inequality (Acemoglu & Autor, 2011). Its central point for our purposes is that the productivity and distributional consequences of a new technology depend on complementarities with skills and human capital, not on the availability of the technology alone. Cross-country evidence for OECD economies, for example, links skill-biased technological change to gender inequality in the labor market within a simultaneous-equations framework (Nogueira & Madaleno, 2023). We do not treat SBTC as a separate lens to be tested, because our country-level data contain no information on skill demand, wages, or the skill composition of employment. It does, however, mark the boundary of our analysis: technological readiness without complementary human capital need not raise measured productivity, and a readiness index captures neither the skills nor the wage responses through which the SBTC literature traces the effects of technology. Specification A7 in Appendix A adds tertiary enrollment as a rough proxy for human capital.
2.2. Empirical Strategies in the Recent Literature
The recent literature on AI, digitalization, and macro outcomes has converged on triangulated panel-data strategies combining fixed effects, dynamic instrumentation, and various robustness checks (Assanova et al., 2025; Drago et al., 2025; Guliyev, 2023; Guliyev et al., 2023; Li et al., 2025; Ma et al., 2025; Touitou & Yacine, 2025; P. Zhao et al., 2022). Related studies extend these strategies to green-technology, energy, and structural-change outcomes (Akram et al., 2024; Al Fadhel et al., 2026; Alnafrah, 2025; Anakpo & Kollamparambil, 2022; Işık et al., 2026; Yong et al., 2024) and to resource-dependent settings specifically (Beşer et al., 2025; Dai & Du, 2023; Liu et al., 2024). Region-specific studies focused on post-Soviet economies use adjacent digital-economy frames (Baghirova et al., 2025; Gazanfarli, 2025; Hasanova & Najafova, 2025; Huseynova et al., 2026; M. Ismayilov, 2025; N. Ismayilov & Tumpach, 2026; Rahimov, 2025; Sitnicka et al., 2025; Spivakovskyy et al., 2026; Varavin et al., 2026; Yuzbashiyeva et al., 2024). Methodologically, recent work refines dynamic panel and panel-VAR toolkits (Canova & Ciccarelli, 2013; Herwartz & Wang, 2024; Love & Zicchino, 2006; Sigmund & Ferstl, 2021; Yang et al., 2023); textbook treatments are provided by Baltagi (2013) and Wooldridge (2010). Cross-country empirical strategies for AI readiness specifically have used sample sizes ranging from seven to twenty-six economies (Alderete, 2026; Nasution et al., 2024).
Given our sample of 14 economies, we keep the empirical strategy deliberately focused. The core consists of two-way fixed-effects (TWFE) estimation, inference from a wild cluster bootstrap that imposes the null hypothesis (Cameron et al., 2008; MacKinnon et al., 2023; Roodman et al., 2019), and leave-one-country-out analysis. Conditional-effects specifications address the two research questions. An instrumental-variable exercise based on national AI-strategy adoption and a grid-search threshold specification (Hansen, 1999; Usman et al., 2026) are reported only as exploratory analyses in Appendix B and do not inform our conclusions.
2.3. Hypothesis and Research Questions
Following the framework above, we state one directional hypothesis and two research questions.
H1.
Over 2021–2024, which falls within the early diffusion phase of AI in the sample economies, within-country increases in government AI readiness are negatively associated with measured labor productivity (implementation-lag/J-curve prediction).
RQ1.
Does the AI readiness–productivity association differ systematically with resource dependence? The resource-curse lens predicts a weaker association at higher rents; the rent-financed digital-transformation lens predicts a stronger one.
RQ2.
Does the association differ systematically with government effectiveness? Complementarity arguments predict a positive gradient; the implementation-lag lens predicts a negative short-run gradient.
The exploratory analyses in Appendix B are not used to evaluate H1, RQ1, or RQ2.
3. Data
3.1. Sample and Sources
The sample is a balanced panel of 14 economies over 2021–2024, for 56 country-year observations. Country selection reflects three criteria: comparability of statistical apparatus (all are covered by the World Bank databases and by every Oxford Insights edition in the window); heterogeneity in resource dependence; and availability of a Government AI Readiness Index score in each of the 2021–2024 editions. The sample is therefore a data-availability panel rather than a random or population-representative sample of CIS/Eastern Europe, Caucasus, and Central Asia (EECCA) economies; readers should interpret parameter estimates with this selection in mind. The sample is organized into three regional groupings for heterogeneity analysis:
- Caucasus and Turkiye: Azerbaijan, Georgia, Armenia, Turkiye
- Central Asia: Kazakhstan, Uzbekistan, Kyrgyz Republic, Tajikistan
- Europe: Latvia, Lithuania, Estonia, Moldova, Romania, Bulgaria
Turkiye is grouped with the Caucasus economies on geographic grounds; unlike the other economies in the sample, it has neither a Soviet nor a state-socialist institutional legacy and serves as a comparator. Section 5.4 shows that the main results are robust to excluding Turkiye. We exclude Turkmenistan because the 2021 Oxford AI Readiness Index does not include it, its governance indicators are extreme outliers, it does not report research and development (R&D) statistics, and it has no adopted national AI strategy.
The Government AI Readiness Index is taken from the Oxford Insights annual reports for 2021 through 2024 (Oxford Insights, 2021, 2022, 2023, 2024). All macroeconomic indicators are taken from the World Bank World Development Indicators (WDI) and government effectiveness from the Worldwide Governance Indicators (WGI) (World Bank, 2026a, 2026b), using the series identifiers listed in Table 1.
Table 1.
Variable dictionary and sources.
3.2. Data Preparation
Extraction. Oxford Insights scores were transcribed on 8 August 2026 from the official PDF reports of the 2021, 2022, 2023, and 2024 editions of the Government AI Readiness Index (Oxford Insights, 2021, 2022, 2023, 2024) and checked against the global ranking tables in each report (2021: pp. 62–65; 2022: pp. 53–57; 2023: pp. 47–51; 2024: pp. 43–50); each edition is assigned to its publication year. World Bank series were taken unchanged from the WDI bulk files (database last updated 13 July 2026; downloaded 3–4 October 2026) and from the WGI 2026 release (governance estimates), using the series identifiers in Table 1.
Resource rents. In the current WDI vintage, oil rents and total natural resource rents are published only through 2021. We therefore measure resource dependence by its 2021 level. This pre-period measure is predetermined with respect to the 2021–2024 changes in readiness and productivity, and it does not rely on extrapolated values. Because it is time-invariant within countries, its main effect is absorbed by the country fixed effects, and only its interaction with readiness is estimated. In 2021, oil rents were 20.98 percent of GDP in Azerbaijan and 14.84 percent in Kazakhstan and did not exceed 0.96 percent (Estonia) elsewhere.
Missing values. The outcome, AI readiness, resource rents, and the four baseline controls are complete for all 56 country-years, so the baseline estimation sample is balanced. Three series have gaps in WDI: tertiary enrollment (Georgia, Romania, and Turkiye in 2024), consumer price index (CPI) inflation (Tajikistan, all years), and high-technology exports (Tajikistan in 2024). No value is imputed. Tertiary enrollment and inflation are therefore not part of the baseline control set; Appendix A (specification A7) adds them on the complete-case sample, and Table A1 uses the complete-case sample for high-technology exports.
Transformations. Labor productivity and trade openness enter in natural logarithms. AI readiness, 2021 oil rents, 2021 total natural resource rents, and government effectiveness are mean-centered at their full-sample means (51.12 index points, 2.76 percent of GDP, 8.04 percent of GDP, and 0.10, respectively) before interactions are formed. Leave-one-out and subsample estimates keep the full-sample centering, so that the AI readiness coefficient always refers to the same oil-rent level (2.76 percent of GDP).
Comparability of Oxford Insights scores across editions. The indicator set and country coverage of the Government AI Readiness Index change between annual editions; for example, four new indicators were added in 2021 (Oxford Insights, 2021, p. 17), and the 2024 edition imputes missing indicator values using peer-group means (Oxford Insights, 2024, p. 40). Scores from different editions are therefore not strictly comparable on a common scale. We address this in three ways. First, year fixed effects absorb any edition-specific shift in the cross-country mean score. Second, Appendix A (specification A5) replaces the raw score by an edition-standardized score (the z-score within each edition across the 14 economies), which removes edition-specific differences in both mean and dispersion. Third, Appendix A (specification A6) re-estimates the model on 2021–2023 only, because some of the largest year-on-year changes occur between the 2023 and 2024 editions (Moldova +13.06, Uzbekistan +9.66, Azerbaijan −8.23 points).
Supplementary Materials. The country-year dataset with a codebook (File S1) and the Python (version 3.13) code that reproduces every table and figure from that dataset (File S2) are provided as Supplementary Materials.
3.3. Descriptive Statistics
Table 2 reports summary statistics. Labor productivity averages USD 58,313 (constant 2021 PPP), ranging from USD 15,295 (Kyrgyz Republic in 2021) to USD 98,713 (Romania in 2024). AI readiness averages 51.1 index points. Resource dependence is extremely skewed: Azerbaijan and Kazakhstan are the only economies with material oil rents, so variation in resource dependence comes almost entirely from these two countries.
Table 2.
Summary statistics.
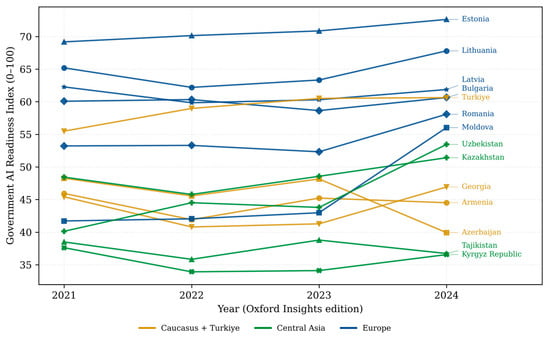
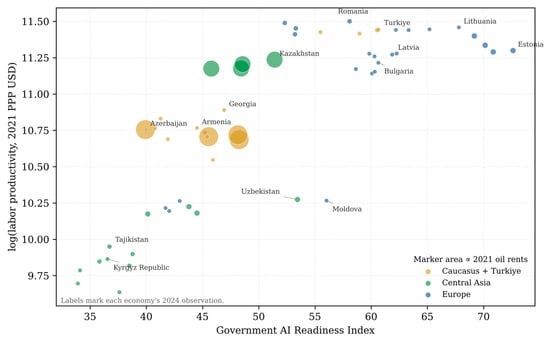
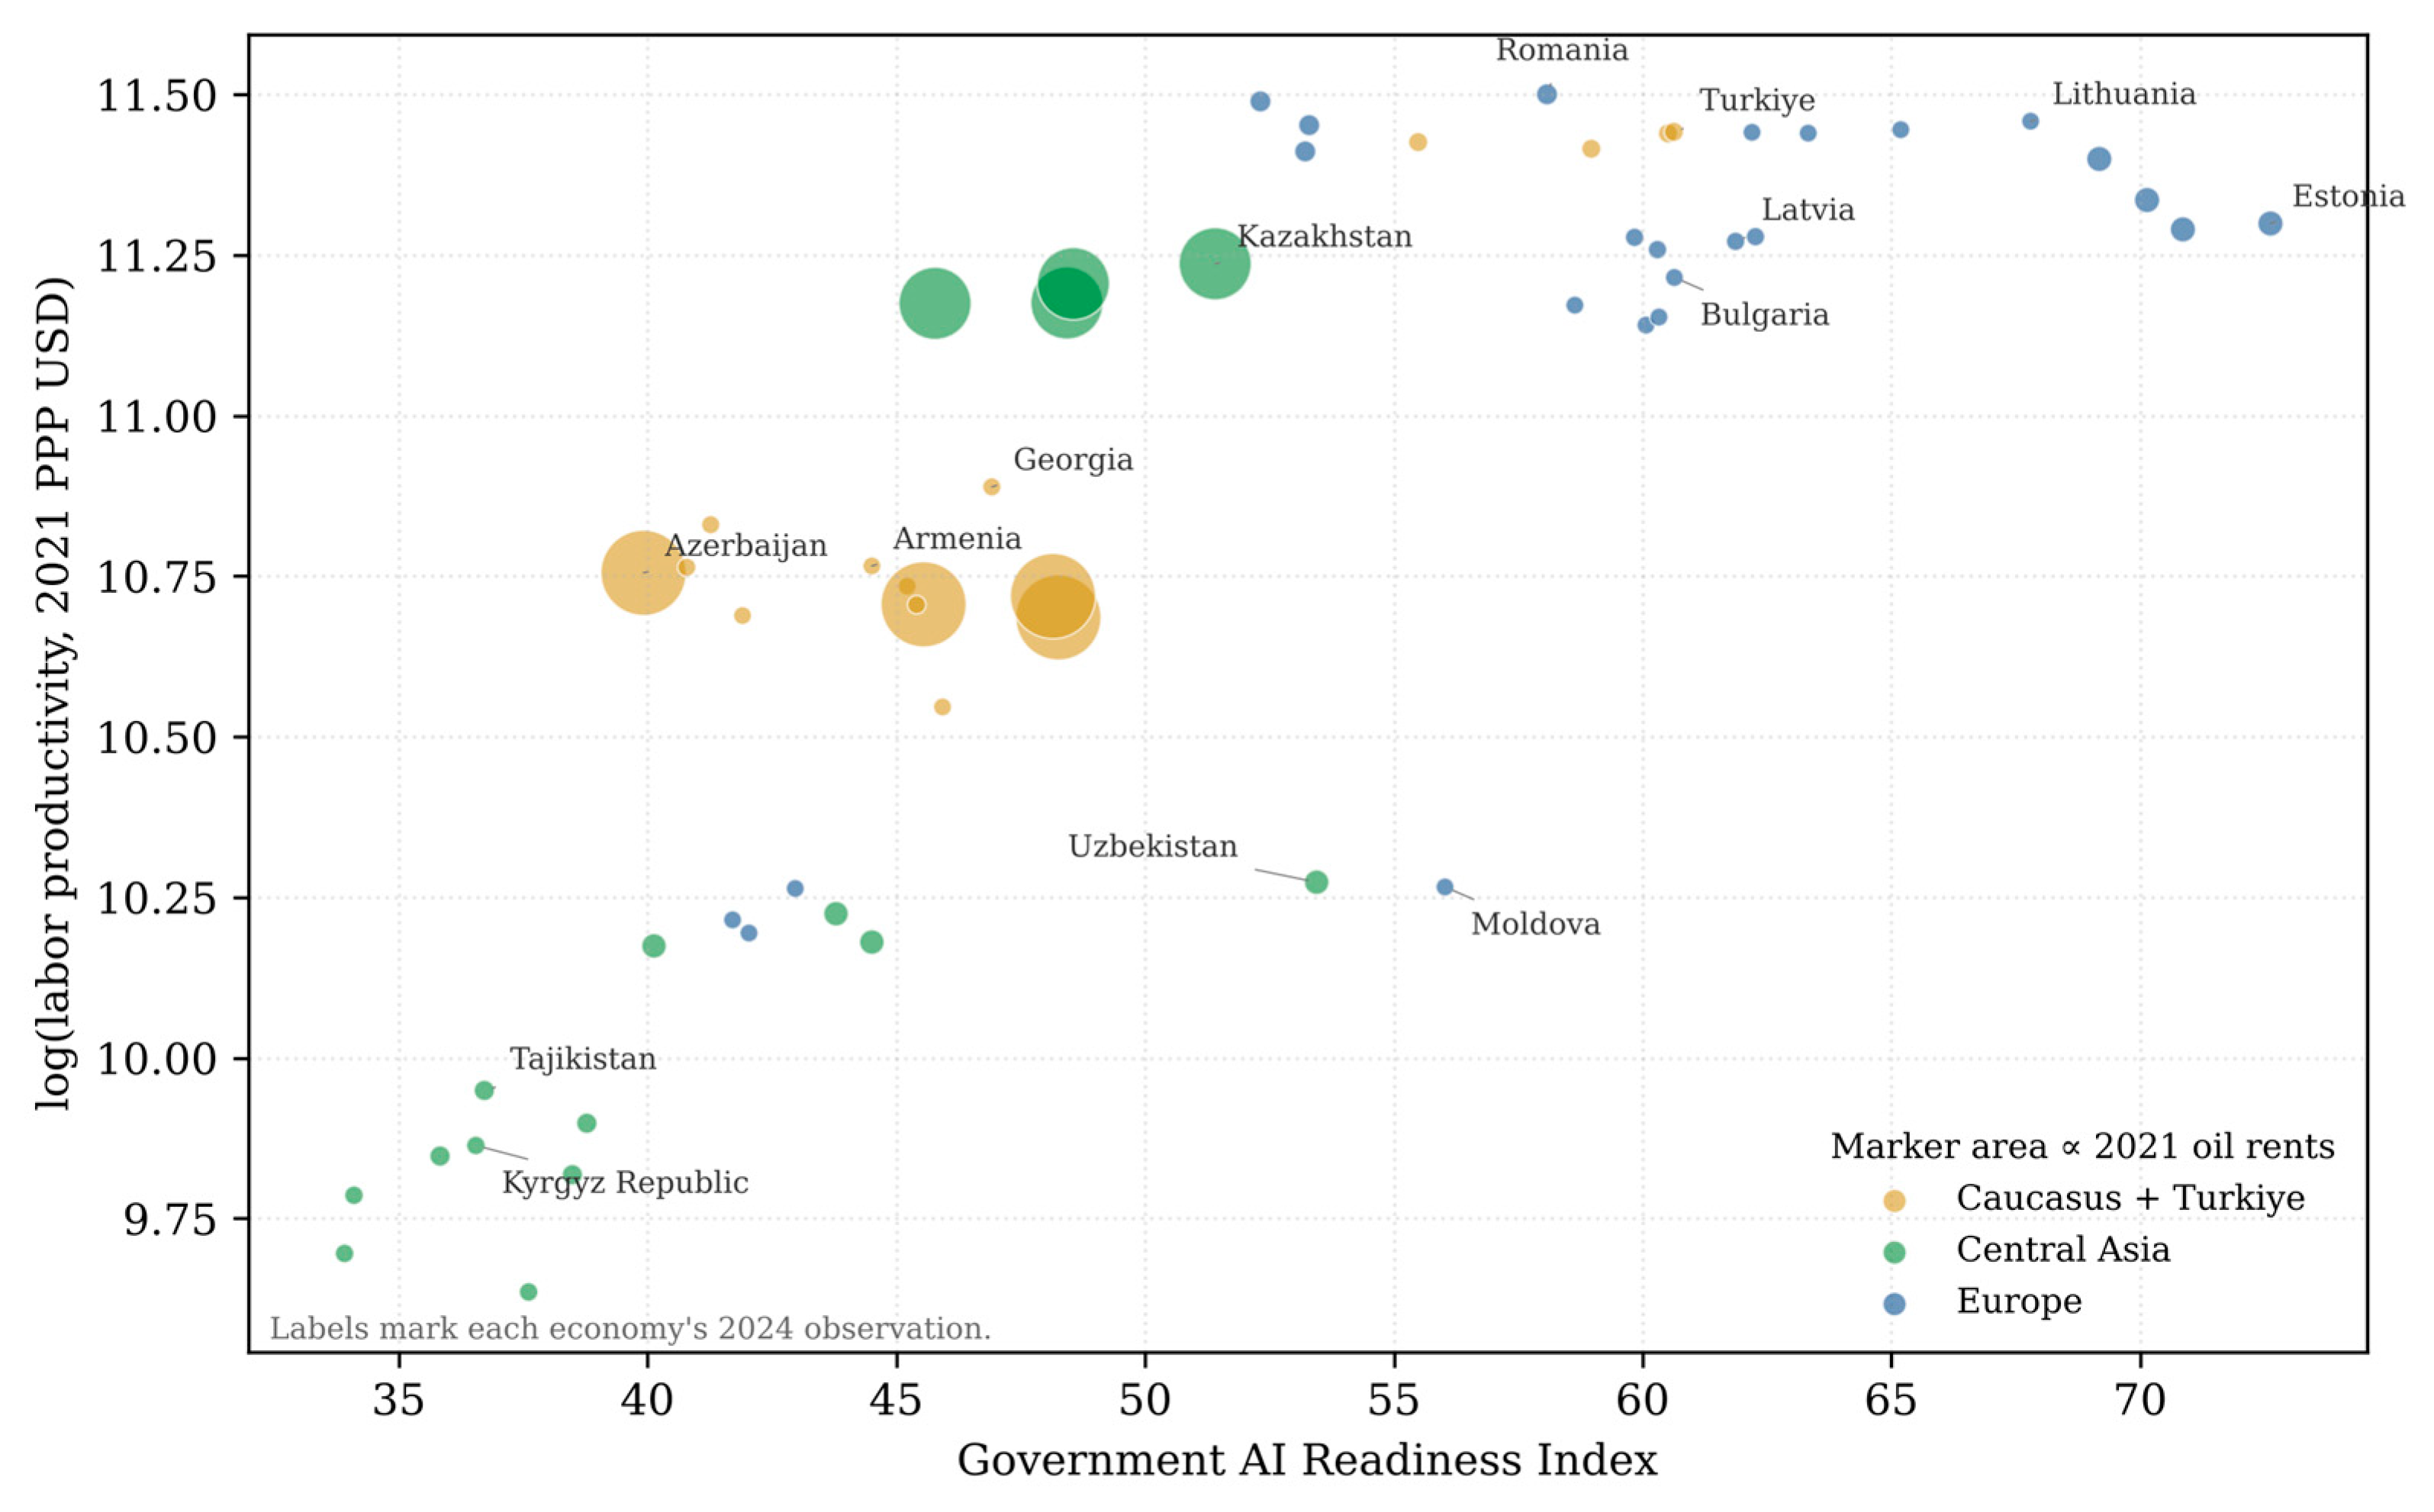
Figure 1 plots AI readiness trajectories for all 14 economies over 2021–2024 by region. Figure 2 shows the bivariate association between AI readiness and log labor productivity, with marker area proportional to 2021 oil rents. The positive cross-sectional relationship in Figure 2 is absorbed by country fixed effects in the estimates that follow, which use only within-country variation.
Figure 1.
Government AI Readiness Index trajectories, 2021–2024. Colors denote regional groups; the year axis refers to the Oxford Insights edition.
Figure 2.
AI readiness and log labor productivity, 2021–2024 (56 country-years). Marker area is proportional to 2021 oil rents (% of GDP); labels mark each economy’s 2024 observation.
4. Empirical Methodology
4.1. Baseline Two-Way Fixed-Effects Specification
The baseline specification (Model A) is a two-way fixed-effects panel regression with a centered interaction term:
where AIc is AI readiness minus its sample mean, Oilci,2021 is the 2021 oil-rent share minus its sample mean, X contains the time-varying controls (government effectiveness, log trade openness, urbanization, and internet use), μi and λt are country and year fixed effects, and εit is the idiosyncratic error. The main effect of 2021 oil rents is absorbed by μi. Centering permits interpretation of β1 as the association at the sample-mean oil rent (2.76 percent of GDP); the association at oil-rent level O is β1 + β2 (O − 2.76) (Section 4.3). Because oil rents are material in only two economies, β2 is identified almost entirely by the difference between the within-country readiness–productivity slopes of Azerbaijan and Kazakhstan and those of the other economies.
log(LabProd)it = β1·AIcit + β2·(AIcit × Oilci,2021) + γ′Xit + μi + λt + εit
We report the two-way within R2: the R2 of the regression of the outcome on the regressors after both have been residualized on country and year dummies. This measure lies between 0 and 1 by construction.
4.2. Inference: Wild Cluster Restricted Bootstrap
With 14 clusters, conventional cluster-robust standard errors are unreliable (Cameron et al., 2008; MacKinnon et al., 2023). We therefore base all inference in the main text and Appendix A on the wild cluster restricted (WCR) bootstrap with the null hypothesis imposed (Cameron et al., 2008; Roodman et al., 2019). For each coefficient βk, we proceed as follows. (i) We estimate the restricted model that imposes H0: βk = 0 and retain its fitted values and residuals. (ii) We form bootstrap samples y* = ŷR + vg·ûR, where vg ∈ {−1, +1} is a Rademacher weight drawn once per country cluster g. (iii) On each bootstrap sample, we re-estimate the unrestricted model, including the country and year dummies, and compute the cluster-robust t-statistic t*k using the cluster-robust variance estimator with small-sample correction (CR1) with small-sample factor [G/(G − 1)]·[(N − 1)/(N − K)]. (iv) The p-value is the symmetric two-sided share p = (1/B)·#{|t*k| ≥ |t̂k|}, where t̂k is the CR1 t-statistic in the original sample.
Because there are only 214 = 16,384 distinct Rademacher sign vectors, we enumerate all of them rather than drawing a random subset (B = 16,384 for 14 clusters, 8192 for 13, and 4096 for 12). The resulting p-values therefore contain no simulation error and do not depend on a random seed. Since a sign vector and its negative produce the same |t*|, the smallest attainable p-value is 2/16,384 ≈ 0.0001. The bootstrap is implemented in Python (NumPy) by the authors (File S2); we verified it against an independent brute-force implementation that re-estimates each bootstrap sample with statsmodels, which reproduced the p-values within simulation error.
When the regressor of interest varies in only a few clusters—as the AI × oil rents interaction does—the restricted bootstrap tends to over-state, and the unrestricted bootstrap (WCU) to under-state, p-values (MacKinnon & Webb, 2018). For the oil–rent interaction, we therefore also report the WCU p-value, computed with the same weights and enumeration but with bootstrap samples generated from the unrestricted model and t-statistics centered at the original estimate. The two p-values bracket the plausible range; we regard the interaction as statistically supported only if both are small.
4.3. Marginal Associations and Confidence Bands
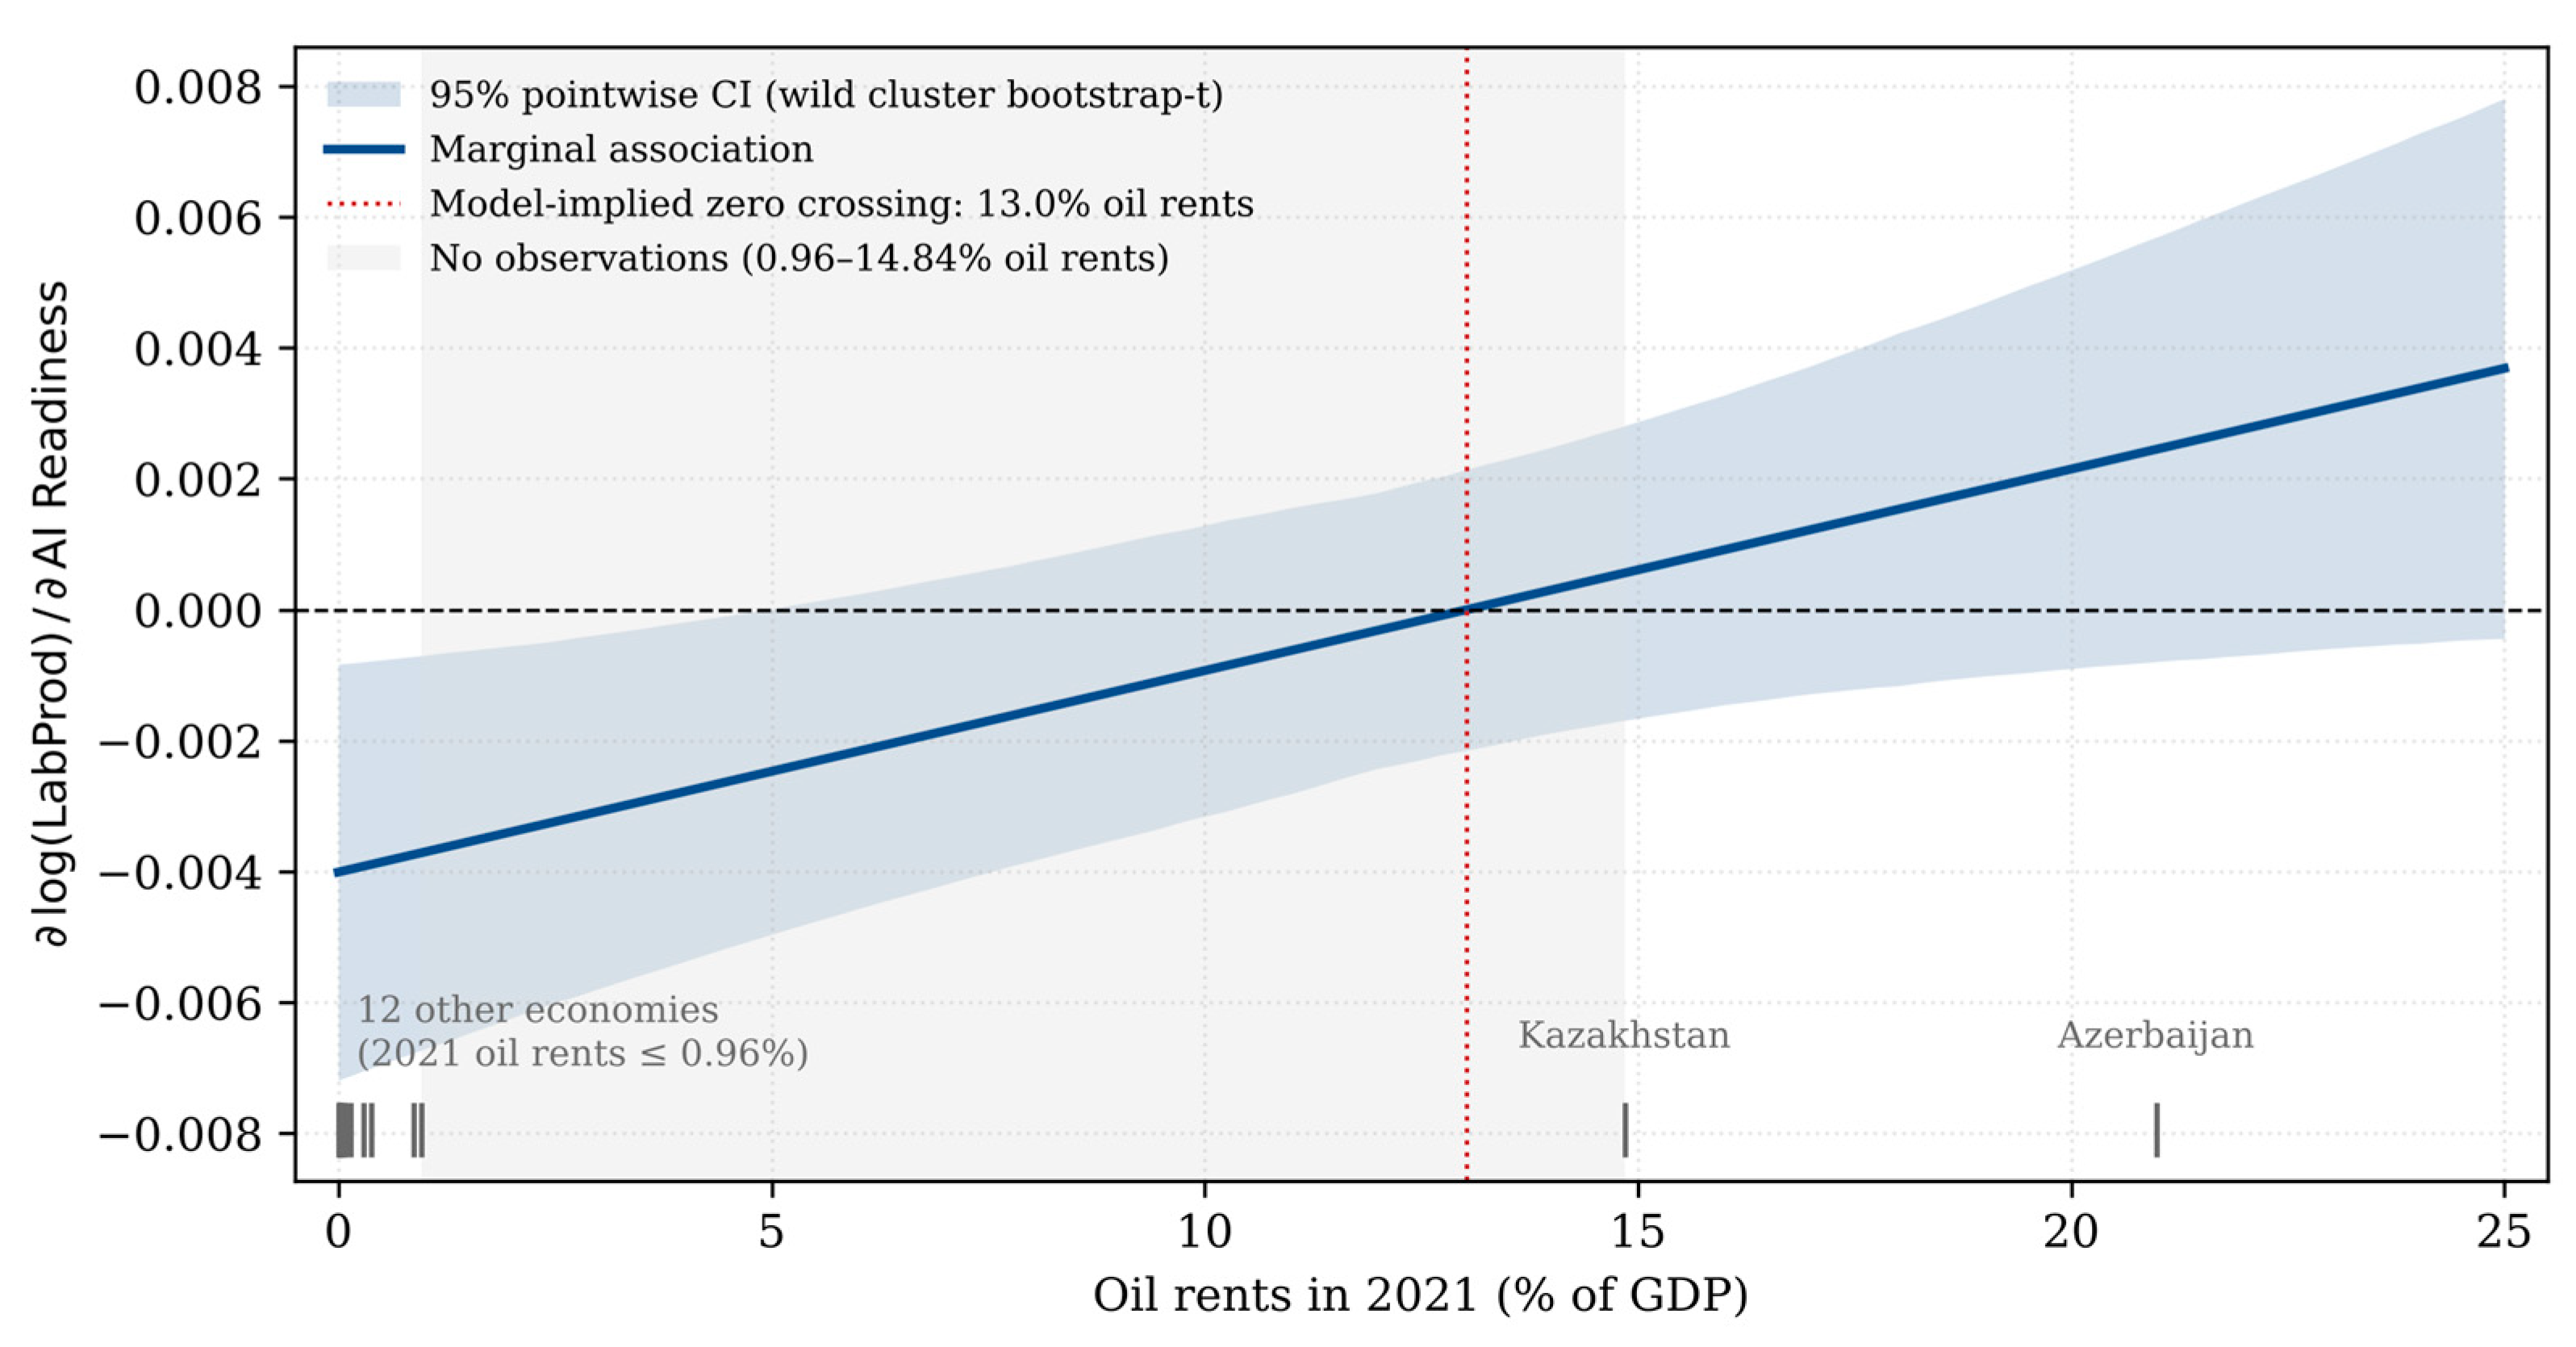
The marginal association of AI readiness with log labor productivity at oil-rent level O is the marginal effect (ME), ME(O) = β1 + β2(O − 2.76), computed from unrounded coefficients. For selected levels of O, we obtain the WCR p-value of ME(O) by re-centering oil rents at O, so that ME(O) becomes the coefficient on AI readiness, and applying the procedure in Section 4.2. The 95 percent confidence band in Figure 3 is a pointwise wild cluster bootstrap-t band: at each O, ME(O) ± q·SECR1(O), where q is the 95th percentile of |t*| across the 16,384 unrestricted bootstrap samples. We translate coefficients into the percentage change in labor productivity associated with a 10-point increase in readiness, as 100·[exp(10·ME) − 1].
Figure 3.
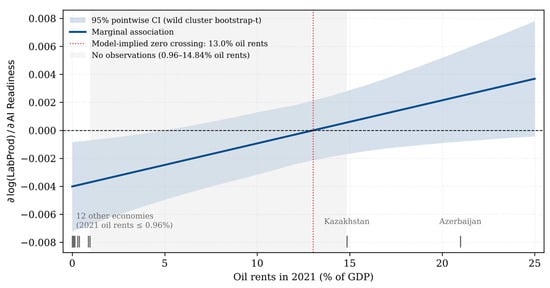
Marginal association of AI readiness with log labor productivity by 2021 oil rents (Model A). The shaded area is a pointwise 95 percent wild cluster bootstrap-t confidence band (unrestricted bootstrap, Rademacher weights, all 16,384 sign vectors; Section 4.3). Tick marks on the horizontal axis show the 2021 oil rents of the 14 economies. The light-gray range (0.96–14.84 percent) contains no observations; the dotted vertical line marks the model-implied zero crossing, which lies within this range and is not an empirically identified threshold.
4.4. Conditional-Effects Analysis
To address RQ2, and RQ1 jointly with RQ2, we estimate the following:
log(LabProd)it = β1·AIcit + β2·(AIc × GovEffc)it + β3·(AIcit × Oilci,2021) + γ′Xit + μi + λt + εit
Model 1 omits the oil–rent interaction; Model 2 includes both interactions. We label this “conditional-effects analysis” (moderation) rather than “mediation analysis” because it identifies systematic variation in the strength of the association across gradients, not a mediation pathway in the sense of Imai et al. (2010). Because government effectiveness varies mainly between countries, β2 largely compares within-country slopes across economies with different levels of government effectiveness.
4.5. Multicollinearity Diagnostics and Robustness Architecture
We report variance inflation factors (VIFs) for the Model A predictors, computed on the pooled design that includes the oil-rent main effect. Because VIF is invariant to rescaling, the mean-centered and z-score standardized specifications produce identical values; we report a single set. Following Allison (2012), we interpret the interaction-term VIF in the context of the substantive model rather than treating any single threshold value as decisive.
Section 5.4 reports the robustness analysis, which addresses the central concern that the results may be driven by a small number of countries. We implement leave-one-country-out estimation (reporting the AI readiness association at the sample-mean oil rent and at zero oil rents and the interaction) and targeted exclusions of Azerbaijan, Kazakhstan, both, and Turkiye. Appendix A reports secondary outcomes and further checks: 2021 total natural resource rents instead of oil rents, lagged AI readiness, a parsimonious control set, edition-standardized readiness scores, the 2021–2023 subsample, an extended control set that adds tertiary enrollment and inflation, and two decompositions of the readiness index by pillar. All use WCR inference.
4.6. Exploratory Analyses
Two additional exercises are reported in Appendix B strictly as exploratory analyses: a two-stage least squares (2SLS) specification that uses national AI-strategy adoption as an instrument for readiness and a grid-search threshold specification in 2021 oil rents. For the reasons set out in Appendix B, neither supports causal or threshold inference, and neither informs our conclusions.
5. Results
Log labor productivity (Model A) is the main outcome because it is the outcome to which the GPT, implementation-lag, and resource-curse frameworks speak most directly and the outcome named in our hypothesis and research questions. The choice does not rest on model fit; estimates for GDP growth, unemployment, and high-technology exports are reported in Appendix A (Table A1).
5.1. Baseline Fixed-Effects Estimates
Table 3 reports Model A. At the sample-mean oil rent, a one-point increase in AI readiness is associated with 0.32 percent lower labor productivity (β = −0.0032; CR1 SE = 0.0016; WCR p = 0.013), consistent with H1. The AI × 2021 oil rents interaction is positive (β = +0.00031; CR1 SE = 0.00015) and significant only at the 10 percent level under the restricted bootstrap (WCR p = 0.085); the unrestricted bootstrap gives WCU p = 0.007. Given that the interaction is identified by two clusters, for which the restricted bootstrap is conservative and the unrestricted bootstrap liberal, we treat this as weak evidence. Because 2021 oil rents are at most 0.96 percent of the GDP in twelve economies and 14.8 and 21.0 percent in Kazakhstan and Azerbaijan, the interaction in effect contrasts the readiness slope of these two economies with that of the other twelve; it should not be read as evidence of a continuous resource-dependence gradient. Among the controls, log trade openness (WCR p = 0.001) and internet use (WCR p = 0.035) are positively associated with productivity.
Table 3.
Baseline two-way fixed-effects estimates for log labor productivity (Model A).
5.2. Marginal Association by Oil-Rent Level
Table 4 and Figure 3 report the marginal association ME(O) computed from the unrounded coefficients of Model A. At zero oil rents, ME = −0.0040 (WCR p = 0.014), so a 10-point increase in readiness is associated with −3.9 percent lower labor productivity; at the sample mean (2.76 percent), the corresponding figure is −3.1 percent. At the 2021 rent levels of Kazakhstan (14.8 percent) and Azerbaijan (21.0 percent), the point estimates are +0.6 and +2.5 percent, and neither is statistically distinguishable from zero (WCR p = 0.528 and p = 0.213).
Table 4.
Marginal association of AI readiness with log labor productivity at selected 2021 oil-rent levels.
The point estimate of ME(O) crosses zero at 13.0 percent oil rents. This is a model-implied crossing, not an empirically identified threshold: no economy in the sample has 2021 oil rents between 0.96 and 14.84 percent of GDP (the shaded range in Figure 3), so its location follows from the linear functional form and from the two high-rent economies rather than from observations near 13 percent. The pointwise 95 percent band excludes zero only for oil rents below 4.8 percent and never lies entirely above zero. The data are therefore consistent with a negative association in low-rent economies but do not establish a positive association at the rent levels of Kazakhstan or Azerbaijan. These are associations produced by the model at each oil-rent level, not causal effects.
5.3. Conditional-Effects Analysis and Multicollinearity Diagnostics
Table 5 reports the conditional-effects specifications. The AI × government effectiveness interaction is negative but not statistically significant, either on its own (Model 1: β = −0.0036; WCR p = 0.189) or jointly with the oil–rent interaction (Model 2: β = −0.0038; WCR p = 0.165). In answer to RQ2, the data therefore provide no evidence that the association varies with government effectiveness. In Model 2, the AI readiness coefficient remains negative (WCR p = 0.014), and the AI × oil rents interaction remains only weakly significant (WCR p = 0.092; WCU p = 0.009). The results describe systematic variation in the association, not identified mediation pathways.
Table 5.
Conditional-effects analysis (log labor productivity).
Table 6 reports VIFs for the Model A predictors. All values lie between 1.75 and 5.71; the AI × oil interaction has a VIF of 3.41. Multicollinearity is therefore not a primary concern.
Table 6.
Variance inflation factors for Model A predictors (pooled design).
5.4. Robustness Analysis
This section addresses the concern that the results may be driven by a small number of high-leverage countries. We report leave-one-country-out and targeted-exclusion results in the main text; additional checks are reported in Appendix A.
5.4.1. Leave-One-Country-Out
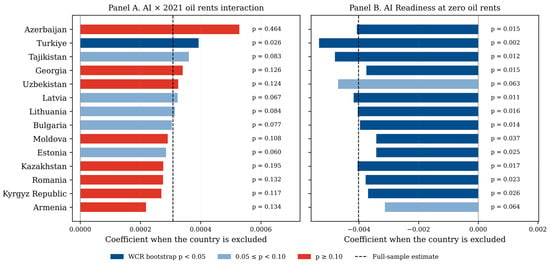
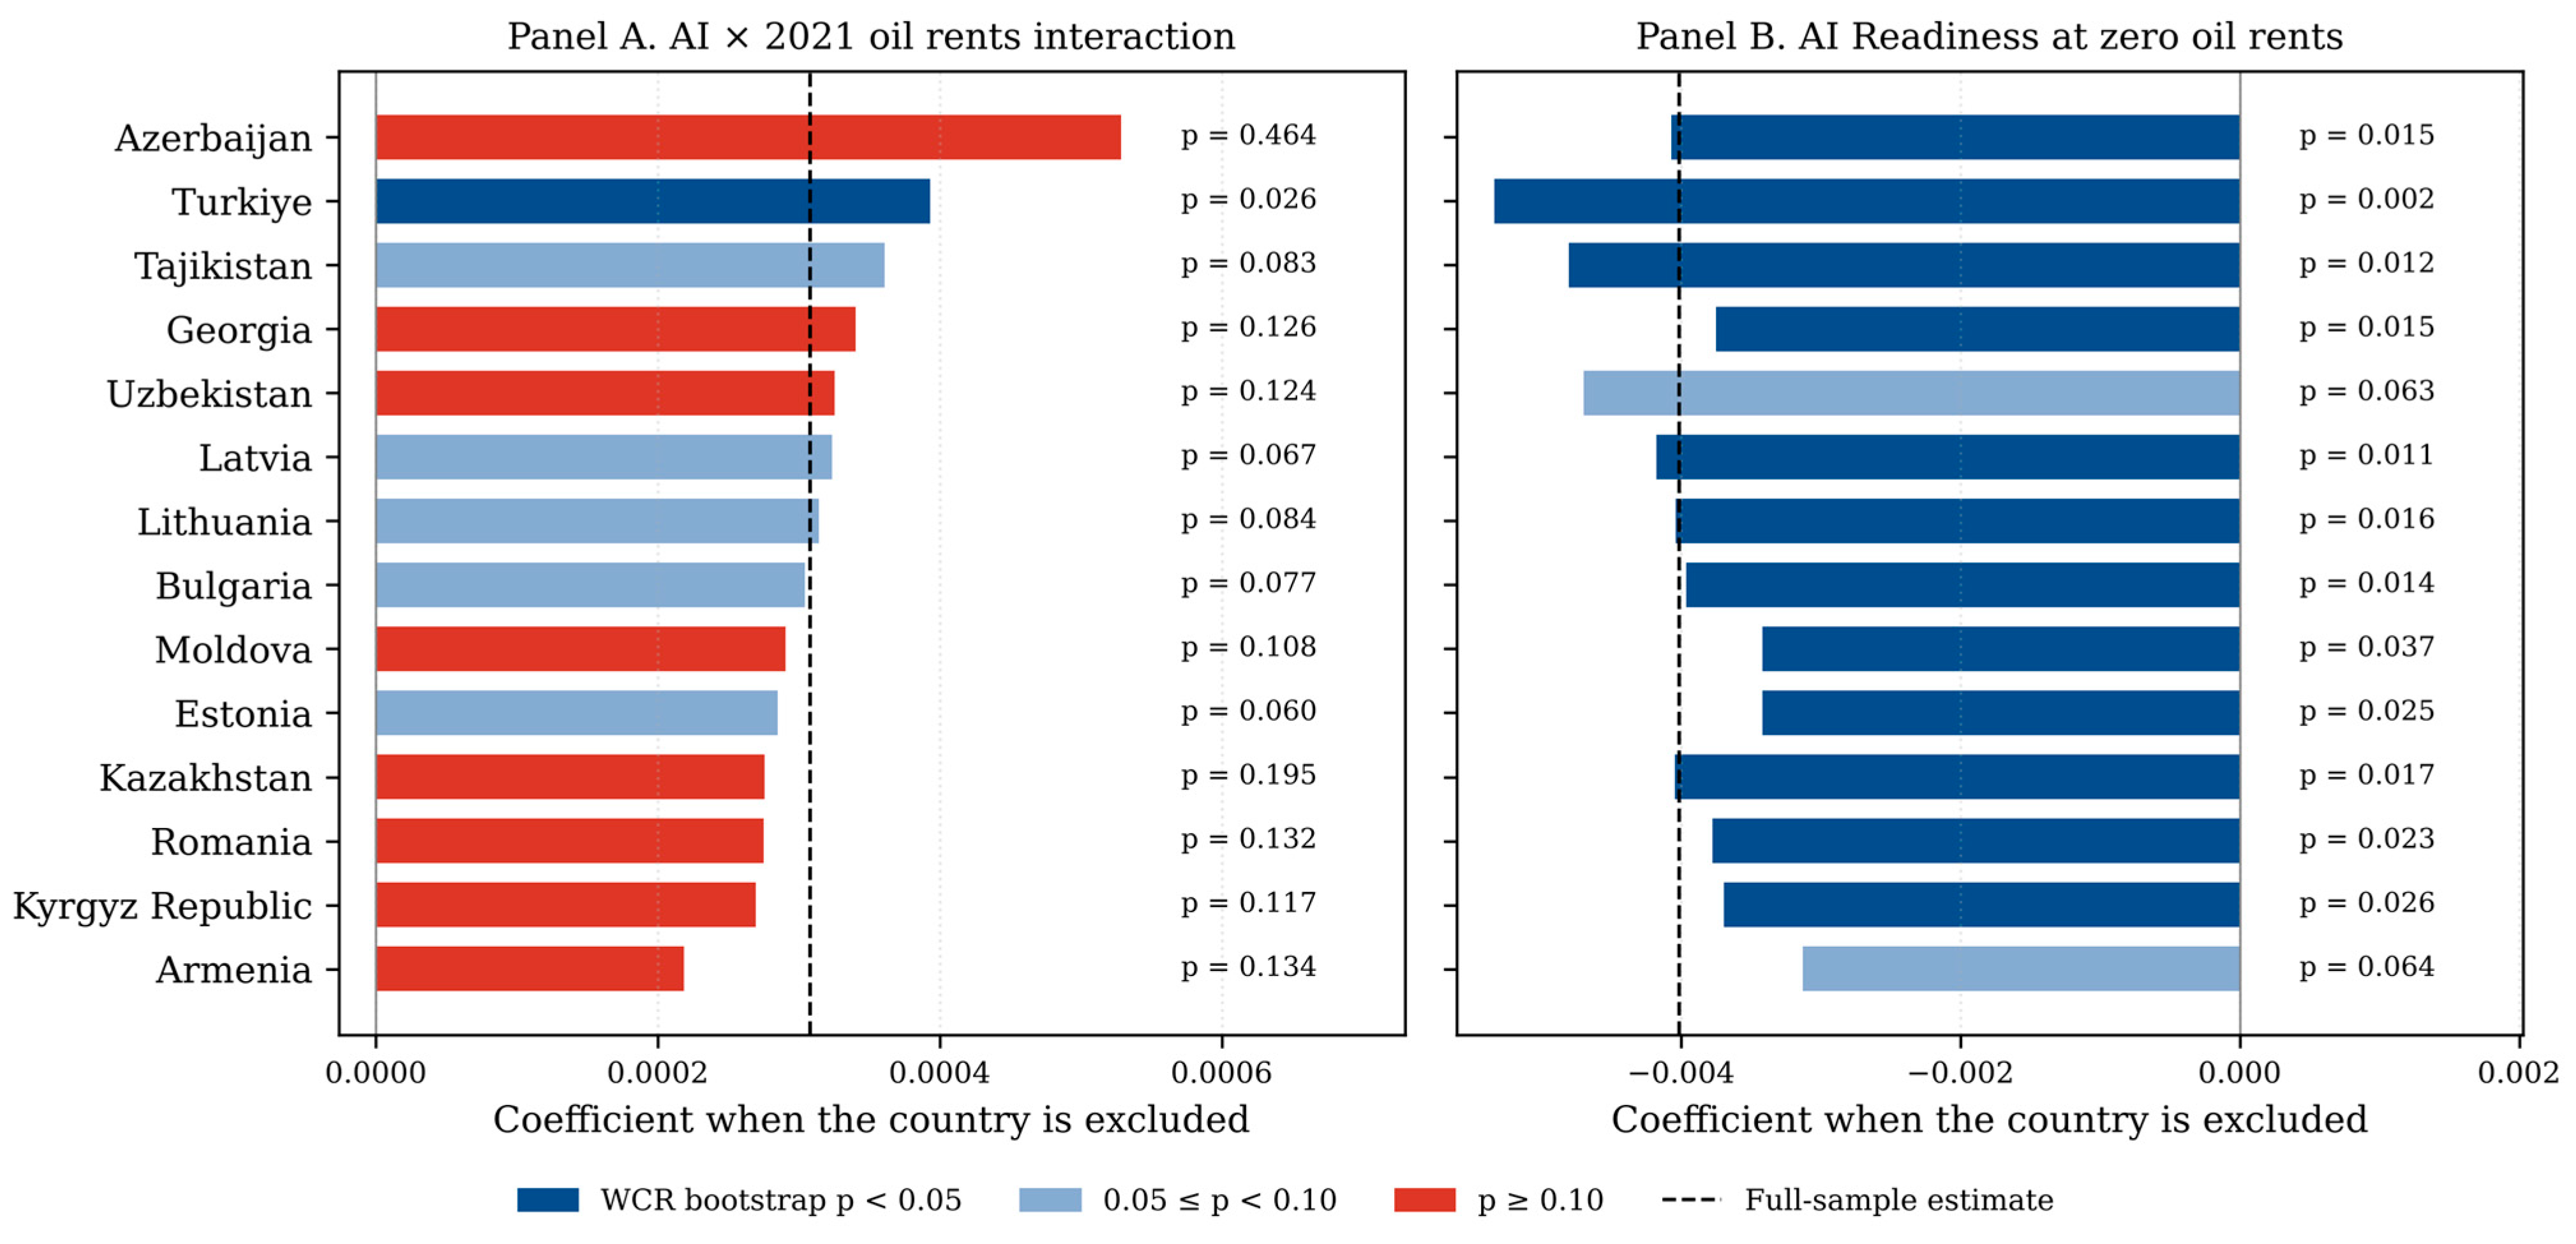
We re-estimate Model A, dropping each of the 14 countries in turn (Table 7 and Figure 4). The AI × oil interaction is positive in all fourteen samples, significant at the 10 percent level in six and at the 5 percent level in one of them (WCR). Its significance depends on the two oil exporters: excluding Azerbaijan gives +0.00053 (WCR p = 0.464), because the slope is then estimated from Kazakhstan alone, and excluding Kazakhstan gives +0.00028 (WCR p = 0.195).
Table 7.
Leave-one-country-out estimates for Model A (N = 52, 13 countries in each sample).
Figure 4.
Leave-one-country-out sensitivity of Model A. Panel (A): AI × 2021 oil rents interaction. Panel (B): association of AI readiness with log labor productivity at zero oil rents. Colors indicate the WCR bootstrap p-value; dashed lines mark the full-sample estimates.
The AI readiness association is considerably more stable. At the full-sample mean oil rent, it is negative in all fourteen samples and significant at the 5 percent level in twelve of them. At zero oil rents, the level that applies to twelve of the fourteen economies, it is negative in all fourteen samples (between −0.0031 and −0.0053), significant at the 5 percent level in twelve, and significant at the 10 percent level in all fourteen.
5.4.2. Targeted Exclusions
Table 8 reports Model A under targeted exclusions. When both Azerbaijan and Kazakhstan are excluded, 2021 oil rents do not exceed 0.96 percent of GDP, so the interaction is dropped; in the remaining twelve economies, the AI readiness coefficient is −0.0041 (WCR p = 0.013). The negative association is therefore not produced by the two oil exporters. Excluding Turkiye strengthens the AI readiness association (−0.0043; WCR p = 0.001) and the interaction (+0.00039; WCR p = 0.026; WCU p = 0.001). The two-way within R2 ranges from 0.58 to 0.61 across these samples.
Table 8.
Model A under targeted exclusions.
5.4.3. Additional Robustness Checks
Appendix A reports further checks (Table A2). With 2021 total natural resource rents in place of oil rents, the AI readiness coefficient is −0.0036 (WCR p = 0.059) and the interaction +0.00021 (WCR p = 0.087). With edition-standardized readiness, a one-standard-deviation increase is associated with 3.0 percent lower productivity (WCR p = 0.037). Restricting the sample to 2021–2023 (N = 42) gives −0.0075 (WCR p = 0.015). The readiness coefficient is negative but not significant with lagged readiness (−0.0021; WCR p = 0.288; N = 42), with a parsimonious control set (−0.0016; WCR p = 0.153), and with the extended control set on the complete-case sample (−0.0038; WCR p = 0.109; N = 49, 13 countries). The oil–rent interaction is not significant at the 10 percent level in any of these alternative specifications except the natural-resource-rents version. Finally, we decompose the index (specifications A8 and A9 in Table A2). A strategy-free measure, the mean of the Technology Sector and Data & Infrastructure pillars, which excludes the Government pillar and hence the national-strategy indicator, has a negative but imprecise coefficient (−0.0014; WCR p = 0.454). The Government pillar alone has a negative coefficient (−0.0019; WCR p = 0.005), and its interaction with oil rents is positive (+0.00016; WCR p = 0.044). The negative readiness association therefore runs mainly through the Government pillar, which records national strategy, governance and ethics, public-sector digital capacity, and adaptability, rather than through the technology-sector and data-infrastructure components.
Two conclusions follow. First, the AI readiness coefficient is negative in every specification and significant in the baseline, edition-standardized, and 2021–2023 specifications, but it loses precision when lagged, with fewer controls, on the smaller complete-case sample, or when the Government pillar is excluded; we therefore regard H1 as supported by the panel but not as an established regularity. Second, evidence for an oil–rent interaction is weak and specification-dependent; where it is significant, it continues to rest on Azerbaijan and Kazakhstan.
6. Discussion
6.1. What the Evidence Supports
The evidence supports three statements. First, consistent with H1, within-country increases in government AI readiness over 2021–2024 are associated with lower measured labor productivity, most clearly in the twelve low-rent economies (Table 4 and Table 8). Second, in answer to RQ1, the data provide at most weak support for a moderating role of resource dependence: the interaction with 2021 oil rents has a positive point estimate, is significant only at the 10 percent level under the restricted bootstrap, is identified almost entirely by two countries, and is not robust across specifications. Third, in answer to RQ2, we find no significant variation of the association with government effectiveness. In terms of wider economic outcomes, readiness is also negatively associated with GDP growth within countries (Table A1), but not with unemployment or high-technology exports, so the evidence concerns aggregate output per worker and output growth rather than labor-market adjustment or export upgrading. The decomposition in Appendix A indicates that the negative association runs mainly through the Government pillar of the index.
6.2. Interpreting the Oil-Rent Pattern
The positive point estimate of the AI × oil rents interaction is a descriptive feature of Azerbaijan and Kazakhstan, whose within-country readiness–productivity slopes are less negative than those of the other economies. At least two readings are consistent with it. Under a rent-financed digital-transformation reading, hydrocarbon revenues fund public-sector digital programs whose effects appear in measured productivity relatively quickly in economies where the state plays a large economic role. Under a coincidence reading, commodity-price movements during 2021–2024 shifted measured output per worker in both economies at the same time as their readiness scores moved for unrelated reasons, including methodological changes in the index. Our data cannot discriminate between these readings, and neither the Dutch-disease dynamics emphasized by the resource-curse literature (Sachs & Warner, 1995; Humbatova et al., 2019), which unfold over decades, nor the rent-financed channel is identified in a four-year panel. Both are theoretical interpretations that require future testing with longer panels and disaggregated public-investment data.
6.3. The Implementation-Lag Reading
The negative within-country association is consistent with the early phase of the productivity J-curve (Brynjolfsson et al., 2021; Syverson, 2017): economies and public agencies that build AI-related capacity fastest may first divert resources into complementary intangible investment that measured productivity does not yet reflect. This reading is tentative. The panel covers four years, and our data contain no direct measures of complementary intangible investment, organizational restructuring, or firm-level AI adoption, so the mechanism is not tested. Alternative explanations are also consistent with the pattern, including measurement changes in the composite index, short-run cyclical shocks that move readiness and productivity in opposite directions, and the income saturation of readiness indices documented by Ben Brik (2026). We therefore do not attach a time horizon to any future productivity gains. It is also important to keep government AI readiness distinct from actual AI adoption. The Oxford Insights index measures the institutional, technological, and infrastructural preconditions for government use of AI, not the use of AI by firms or workers, and our negative coefficient should not be read as evidence that greater AI use reduces productivity. Because the association runs mainly through the Government pillar (Appendix A), it is more readily read as reflecting public-sector strategy and capacity building—or changes in how such capacity is scored—than as an effect of AI use in production.
6.4. Limitations
Seven limitations warrant explicit acknowledgment. First, the panel is short. Second, the number of cross-sectional units is small, and resource dependence is material in only two clusters; the wild cluster bootstrap improves small-cluster inference but cannot create identifying variation, and inference on the oil–rent interaction remains fragile (MacKinnon & Webb, 2018). Third, resource rents are available in WDI only through 2021, so resource dependence is measured by its 2021 level, and changes in rents during 2022–2024 cannot be studied. Fourth, edition comparability of Oxford Insights scores is a limitation that our edition-standardized robustness check mitigates but does not remove, and the readiness association loses precision in some specifications. Fifth, neither the implementation-lag nor the rent-financed mechanism is directly identified; we lack firm-level data, measures of complementary intangible investment, and disaggregated public-investment statistics, and the pillar decomposition of the readiness index in Appendix A is descriptive (Ben Brik, 2026; Mandon, 2025; Nasution et al., 2024). Sixth, the index measures government readiness, not the adoption or use of AI by firms or workers, so the results do not speak to the productivity effects of AI use. Seventh, the estimates are associations; the exploratory instrumental-variable analysis in Appendix B does not overcome endogeneity.
7. Policy Implications
Because the evidence is associational and comes from a short panel, the implications below are policy considerations informed by the broader literature, not direct findings of this study or recommendations identified by our estimates.
First, improvements in readiness indicators should not be expected to show up quickly in measured labor productivity. The GPT literature identifies complementary investment in skills, organizational change, and data infrastructure as a condition for productivity gains; monitoring frameworks could track these complements alongside readiness scores rather than treating readiness itself as an outcome.
Second, for resource-rich economies such as Azerbaijan and Kazakhstan, our data provide no robust statistical basis for assuming that hydrocarbon revenues amplify the productivity returns to AI readiness. Whether rent-financed digital programs raise productivity is an open empirical question that requires program-level evaluation.
Third, readiness rankings should not be read as evidence of near-term economic performance, and cross-country benchmarking exercises that equate the two risk overstating what readiness indices measure.
8. Conclusions
This paper has examined the association between government AI readiness and labor productivity in a balanced panel of 14 post-Soviet and comparator economies over 2021–2024, using official World Bank and Oxford Insights data. Using two-way fixed-effects estimation with wild cluster restricted bootstrap inference and leave-one-country-out analysis, we find that within-country increases in readiness are associated with lower measured labor productivity, most clearly in low-rent economies (−3.9 percent for a 10-point increase at zero oil rents). The interaction between readiness and 2021 oil rents has a positive point estimate but is only weakly significant, rests on Azerbaijan and Kazakhstan, and is not robust; we therefore do not interpret it as evidence that resource rents moderate the AI–productivity association. We find no significant variation with government effectiveness.
We interpret the negative association as consistent with, but not demonstrated by, an implementation-lag reading of general-purpose technologies. Both this reading and the rent-financed reading of the oil-rent pattern generate testable predictions for future research with longer panels, edition-consistent readiness measures, and firm- and program-level data. The dataset and code released with this paper are intended to facilitate such work.
Supplementary Materials
The following supporting information can be downloaded at https://www.mdpi.com/article/10.3390/economies14110494/s1: File S1: Country-year dataset (panel_data.csv) and codebook (codebook.csv); File S2: Python analysis code (analysis.py) that reproduces all tables and figures.
Author Contributions
A.O.: conceptualization, methodology, formal analysis, writing—original draft, writing—review and editing. E.I.: conceptualization, data curation, writing—review and editing. A.I.: investigation, data curation, writing—review and editing. Y.A.: formal analysis, software, validation. I.M.: data curation, writing—review and editing. U.R.: investigation, resources, writing—review and editing. S.B.: validation, writing—review and editing. All authors have read and agreed to the published version of the manuscript.
Funding
This research received no external funding.
Institutional Review Board Statement
Not applicable. This study did not involve humans or animals; it uses publicly available macroeconomic and governance indicators at the country-year level.
Informed Consent Statement
Not applicable.
Data Availability Statement
The panel data are compiled from publicly available sources (Oxford Insights Government AI Readiness Index reports, 2021–2024 editions (Oxford Insights, 2021, 2022, 2023, 2024); World Bank World Development Indicators, database updated 13 July 2026 (World Bank, 2026a); Worldwide Governance Indicators, 2026 release (World Bank, 2026b)). The analytical country-year dataset, its codebook, and the Python analysis code are provided as Supplementary Materials (Files S1 and S2).
Acknowledgments
During the preparation of this study, the authors used Claude (Anthropic) 5.5 for language editing, for assistance in compiling the country-year dataset from the official sources cited in Section 3, and for writing and checking the analysis code. The authors have reviewed and edited the output and take full responsibility for the content of this publication.
Conflicts of Interest
The authors declare no conflicts of interest.
Abbreviations
The following abbreviations are used in this manuscript:
| Abbreviation | Definition |
| 2SLS | two-stage least squares |
| AI | artificial intelligence |
| CIS | Commonwealth of Independent States |
| CPI | Consumer Price Index |
| CR1 | cluster-robust variance estimator with small-sample correction |
| FE | fixed effects |
| GDP | gross domestic product |
| GPT | general-purpose technology |
| ICT | information and communication technology |
| IV | instrumental variable |
| ME | marginal effect (marginal association) |
| NRR | total natural resource rents |
| PPP | purchasing power parity |
| RQ | research question |
| SSR | sum of squared residuals |
| TWFE | two-way fixed effects |
| VIF | variance inflation factor |
| WCR | wild cluster restricted (bootstrap, null imposed) |
| WCU | wild cluster unrestricted (bootstrap) |
| WDI | World Development Indicators |
| WGI | Worldwide Governance Indicators |
Appendix A. Secondary Outcomes and Additional Robustness Checks
Appendix A.1. Secondary Outcomes
Table A1 reports the Model A specification with GDP growth, unemployment, and high-technology exports as outcomes. AI readiness is negatively associated with GDP growth (β = −0.256 percentage points per index point; WCR p = 0.011) and is not significantly associated with unemployment or high-technology exports; the oil–rent interaction is not significant for any secondary outcome. The GDP-growth result is consistent in sign with the productivity result but should be read with the same caution.
Table A1.
Model A specification with secondary outcomes.
Appendix A.2. Alternative Specifications
Table A2 reports eight alternative specifications of Model A: (A2) 2021 total natural resource rents instead of 2021 oil rents; (A3) AI readiness lagged one year, which reduces the sample to 2022–2024; (A4) a parsimonious control set (log trade openness and internet use only); (A5) edition-standardized AI readiness (z-score within each Oxford Insights edition), whose coefficient is per one within-edition standard deviation; (A6) the 2021–2023 subsample; (A7) the baseline controls plus tertiary enrollment and inflation, estimated on the complete-case sample; (A8) a strategy-free readiness measure, the mean of the Technology Sector and Data & Infrastructure pillars of the Oxford Insights index, which excludes the Government pillar and therefore the national-strategy indicator; and (A9) the Government pillar alone. The overall index equals the mean of the three pillars, up to rounding of the published scores, in every edition and country-year of our sample (verified against the pillar scores in the annex tables of each report).
Table A2.
Alternative specifications of Model A.
Appendix B. Exploratory Analyses
Appendix B.1. Exploratory Two-Stage Least Squares
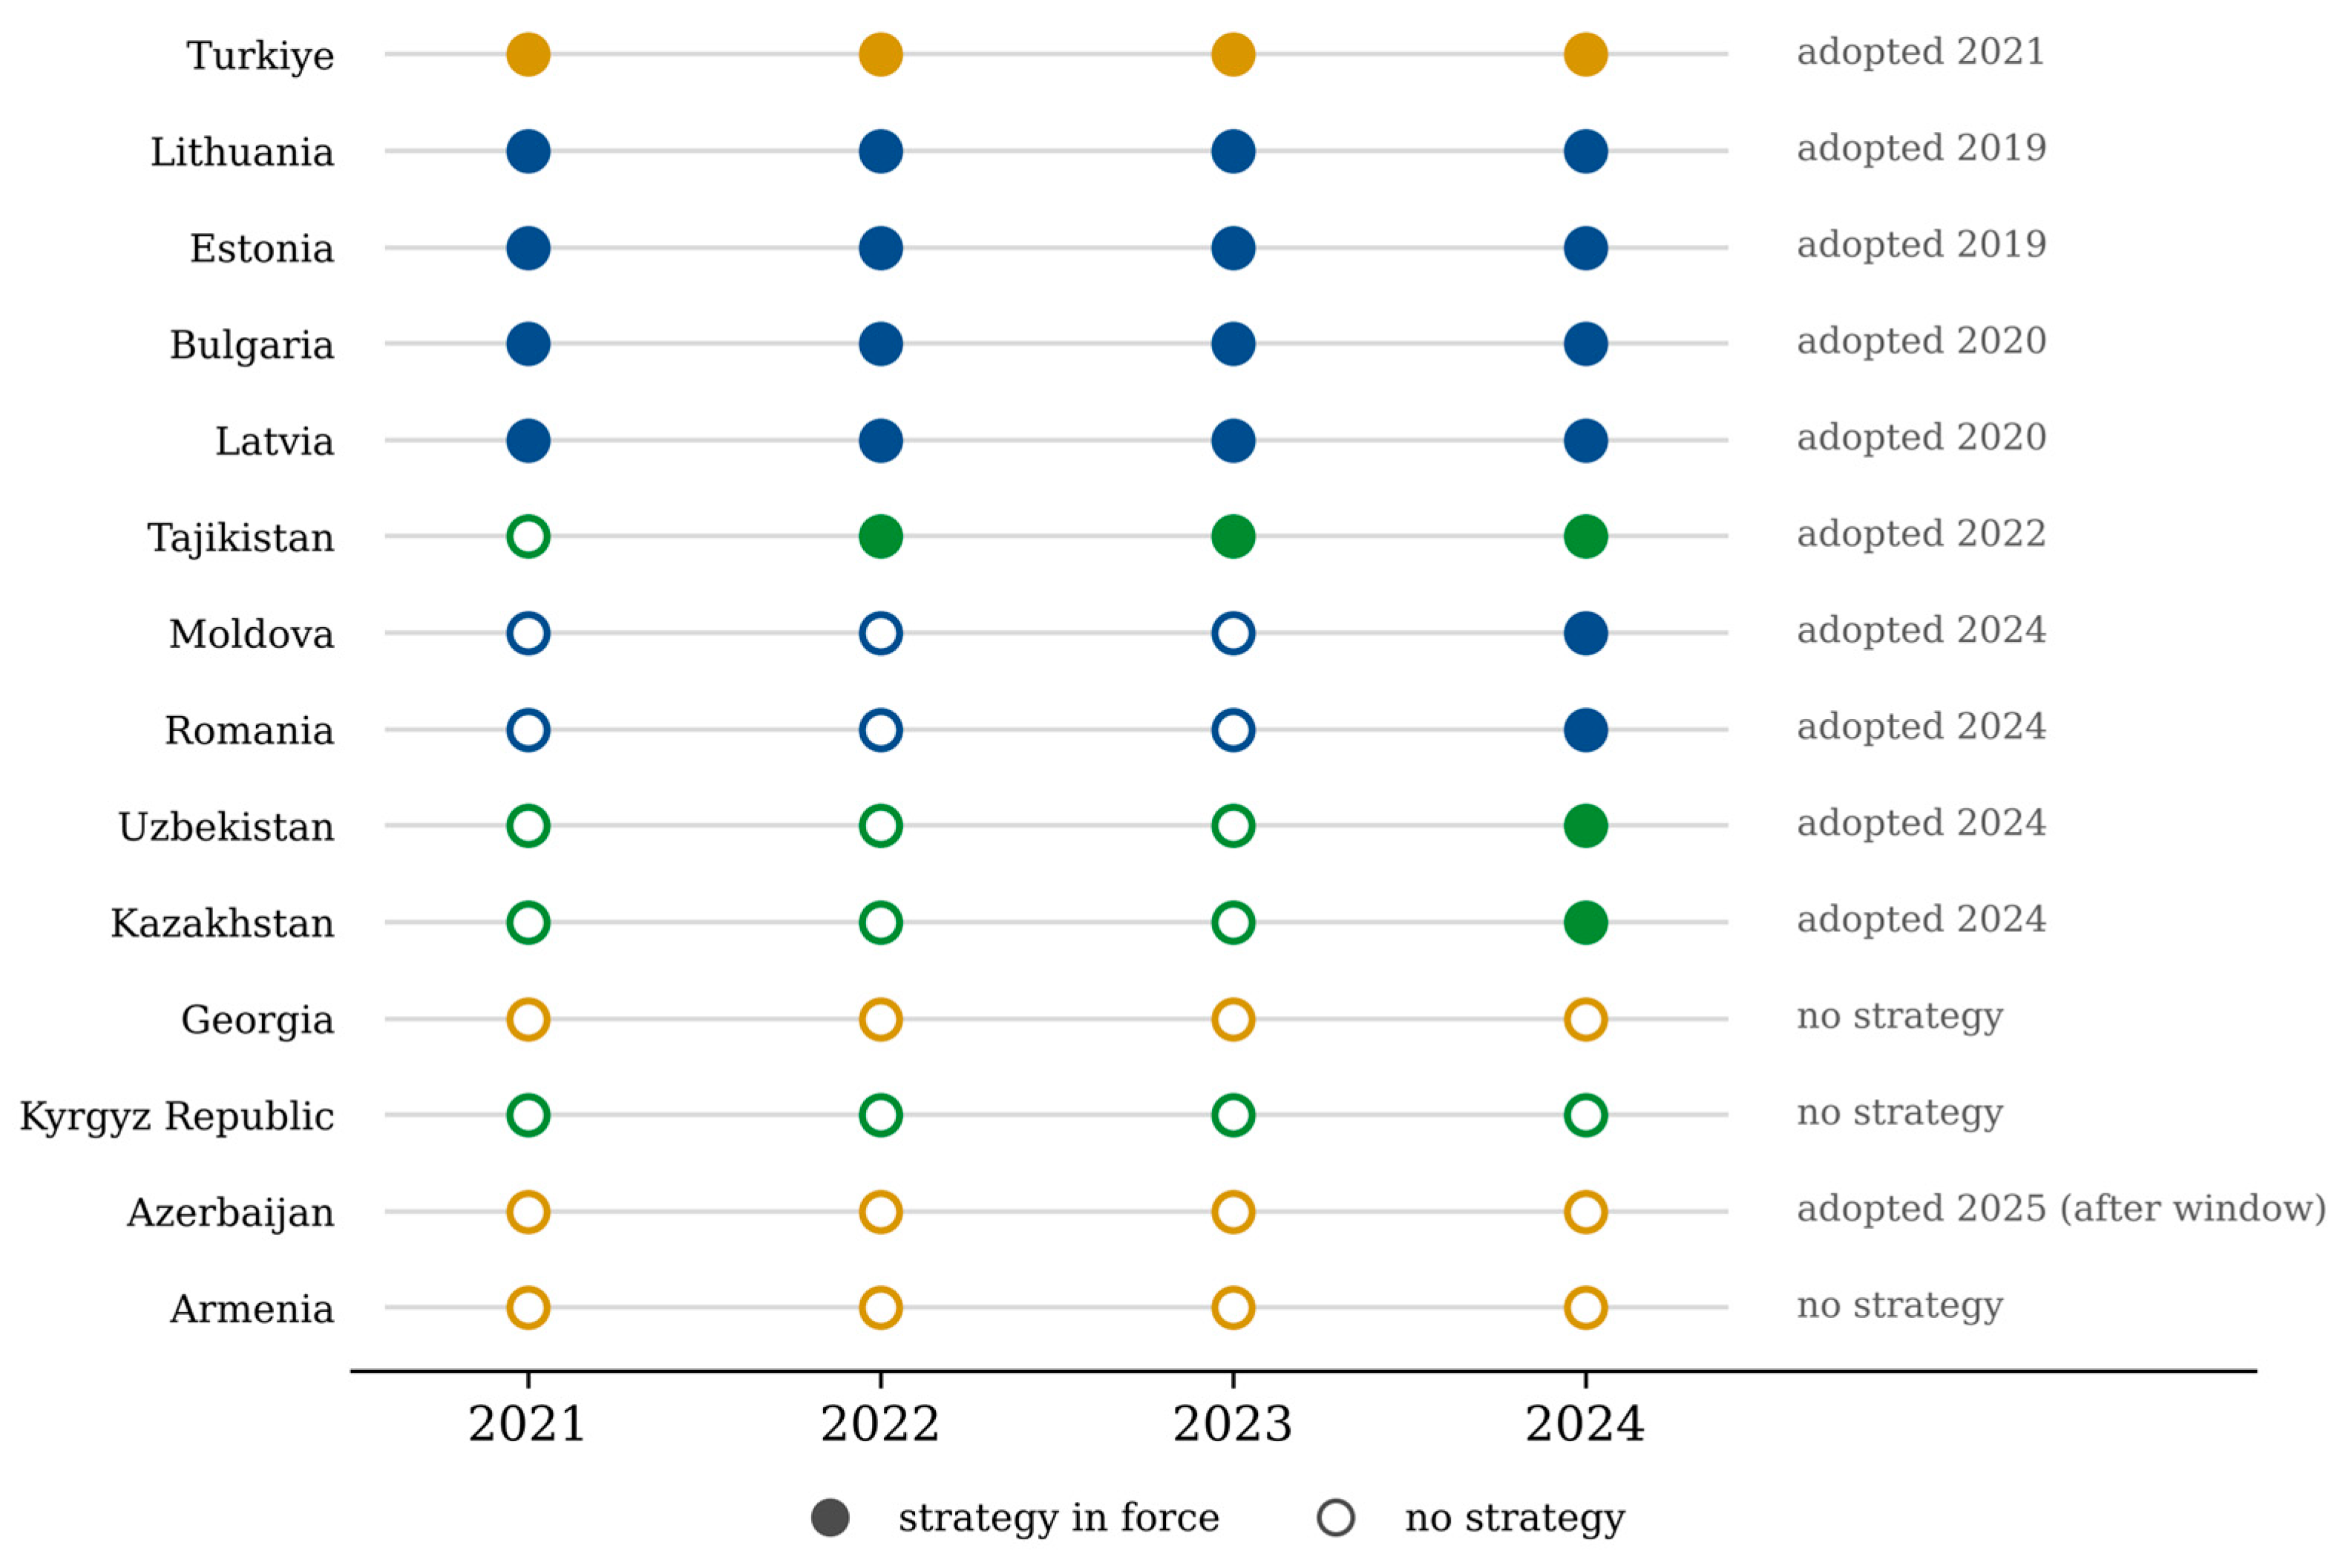
This exercise instruments AI readiness with a binary indicator equal to one in country-years in which a national AI strategy (or equivalent government framework) is in force. Adoption dates were compiled from official government sources: Lithuania (2019, Lithuanian Artificial Intelligence Strategy), Estonia (2019, national AI strategy approved by the e-Estonia Council in June 2019), Latvia (2020), Bulgaria (2020, Concept for the Development of Artificial Intelligence until 2030, December 2020), Turkiye (2021, National Artificial Intelligence Strategy 2021–2025, Presidential Circular 2021/18), Tajikistan (2022, Government Resolution No. 483 of 30 September 2022), Romania (2024, National Artificial Intelligence Strategy 2024–2027, July 2024), Kazakhstan (2024, Government Resolution No. 592 of 24 July 2024), Moldova (2024, White Paper on Artificial Intelligence and Data Governance of 2 October 2024), Uzbekistan (2024, Presidential Decree PQ-358 of 14 October 2024), and Azerbaijan (2025, Presidential Decree of 19 March 2025, outside the sample window). Armenia, Georgia, and the Kyrgyz Republic had not adopted a national AI strategy by the end of the window (Figure A1). Within the window, the instrument changes value in only five economies: Kazakhstan (2024); Moldova (2024); Romania (2024); Tajikistan (2022); Uzbekistan (2024).
Figure A1.
National AI strategy adoption, 2021–2024 (filled marker = strategy in force). Colors denote regional groups.
We present this exercise strictly as exploratory and do not interpret it causally, for three reasons. First, the exclusion restriction is doubtful, because national AI strategies can affect productivity directly through R&D funding, digital infrastructure, skills programs, or regulation rather than only through the readiness score. Second, the specification with country fixed effects has a weak first stage (F = 10.81 with heteroskedasticity-robust and 4.99 with cluster-robust standard errors, both below the robust benchmark discussed below). A stronger first stage is obtained only by replacing country fixed effects with region fixed effects, which leaves time-invariant country-level confounding unresolved: the identifying variation then comes largely from cross-country differences between early adopters (the Baltic states, Bulgaria, Turkiye) and other economies. Third, the endogenous variable is a continuous composite score; even under valid exclusion and monotonicity, 2SLS would recover a weighted average of marginal responses with unobserved weights (Angrist & Imbens, 1995), not a local average treatment effect for a well-defined complier group. We therefore do not use the term “LATE”.
Two further features of the first stage deserve emphasis. First, its strength depends on the fixed effects. With country fixed effects, the instrument is identified only by the five within-window switchers, and the first-stage F falls from 20.98 to 10.81 (heteroskedasticity-robust) and from 9.46 to 4.99 (cluster-robust). Most of the instrument’s predictive power therefore comes from between-country differences in strategy status—the variation that the country fixed effects of our main specification remove—so the region-fixed-effects estimate does not refer to the within-country association estimated in Section 5. Second, the relationship between instrument and endogenous variable is partly mechanical. The Government pillar of the Oxford Insights index contains, in its Vision dimension, an indicator for whether a country has a national AI strategy (Oxford Insights, 2021, p. 70; 2022, p. 48; 2023, p. 38; 2024, p. 32). Strategy adoption therefore raises the readiness score by construction. To remove this component, we replace the endogenous variable with the strategy-free measure used in specification A8 (the mean of the Technology Sector and Data & Infrastructure pillars; correlation with the full index r = 0.96). The first stage then collapses (F = 0.59 with region and 0.43 with country fixed effects), which indicates that the instrument predicts the full index largely through the Government pillar that contains the strategy indicator.
Timing is a further concern. Several strategies were adopted in the second half of a calendar year—Romania (July 2024), Kazakhstan (24 July 2024), Moldova (2 October 2024), and Uzbekistan (14 October 2024)—and Oxford Insights notes that strategies published after its data collection are not reflected in that edition (Oxford Insights, 2021, p. 33). A strategy adopted late in 2024 is unlikely to affect the 2024 readiness score or productivity in the same year. We therefore construct a timing-adjusted instrument under which a strategy adopted after 30 June counts from the following year. Under this rule, the 2024 adoptions fall outside the window, and only two economies switch within it (Tajikistan (2023); Turkiye (2022)). The first stage is weaker still (F = 9.56 with region and 0.85 with country fixed effects).
Table A3 reports all eight specifications. With the original instrument and the full index, the coefficient is −0.0107 with region fixed effects (p = 0.589 heteroskedasticity-robust; p = 0.521 cluster-robust) and −0.0021 with country fixed effects (p = 0.343). No coefficient in the table is statistically significant, and every first-stage F lies below the Montiel Olea and Pflueger (2013) critical value of 23.1 for a 10 percent worst-case bias at the 5 percent level, the appropriate benchmark with non-i.i.d. errors and one instrument (the Stock and Yogo (2005) critical values assume i.i.d. errors). Because the exercise is not used to evaluate H1, RQ1, or RQ2, we report conventional heteroskedasticity- and cluster-robust standard errors rather than the wild cluster bootstrap used in the main text. Given the doubtful exclusion restriction, the weak and partly mechanical first stage, and the timing of adoption, we regard these results at most as complementary evidence and draw no causal conclusions from them.
Table A3.
Exploratory 2SLS estimates for log labor productivity (N = 56).
Appendix B.2. Grid-Search Threshold Specification
We estimated log(LabProd)it = βL·AIit·1(Oili,2021 < γ) + βH·AIit·1(Oili,2021 ≥ γ) + δ′Xit + μi + λt + εit for each candidate γ on a grid from 0.5 to 25 percent of GDP in steps of 0.5 (50 grid points) and recorded the sum of squared residuals (SSR). Because 2021 oil rents take only fourteen distinct values, the grid produces only three distinct non-degenerate sample splits (Table A4); above 20.98 percent, no observation falls in the high regime. The SSR minimum is not unique: every γ from 1.0 to 14.5 percent (28 of 50 grid points) produces the identical split, because no economy has 2021 oil rents between 0.96 and 14.84 percent of GDP. That split places 48 observations from twelve countries in the low regime and eight observations from Azerbaijan and Kazakhstan in the high regime.
The high-regime slope is therefore equivalent to a separate readiness slope for Azerbaijan and Kazakhstan. In the best-fitting split, βL = −0.0039 and βH = +0.0022, with an SSR reduction of 5.4 percent relative to a single slope. We did not conduct the bootstrap test of Hansen (1999) and do not interpret any value of γ as an estimated threshold; the data provide no information about where, between 0.96 and 14.84 percent of GDP, a threshold might lie.
Table A4.
Distinct sample splits produced by the threshold grid (2021 oil rents).
References
- Acemoglu, D., & Autor, D. (2011). Skills, tasks and technologies: Implications for employment and earnings. In O. Ashenfelter, & D. Card (Eds.), Handbook of labor economics (Vol. 4B, pp. 1043–1171). Elsevier. [Google Scholar] [CrossRef] [Scilit]
- Acemoglu, D., & Restrepo, P. (2020). Robots and jobs: Evidence from US labor markets. Journal of Political Economy, 128(6), 2188–2244. [Google Scholar] [CrossRef] [Scilit]
- Acemoglu, D., & Restrepo, P. (2022). Tasks, automation, and the rise in US wage inequality. Econometrica, 90(5), 1973–2016. [Google Scholar] [CrossRef] [Scilit]
- Akram, R., Li, Q., Srivastava, M., & Irfan, M. (2024). Nexus between green technology innovation and climate policy uncertainty: Unleashing the role of artificial intelligence in an emerging economy. Technological Forecasting and Social Change, 209, 123820. [Google Scholar] [CrossRef] [Scilit]
- Alderete, M. V. (2026). Cross-Country gaps in artificial intelligence: Factors explaining digital inequality. Information Development. [Google Scholar] [CrossRef] [Scilit]
- Al Fadhel, L., Athari, S. A., Sassine, M. E., & Djafar-Henni, M. (2026). Do artificial intelligence, knowledge management, and education skills drive sustainable energy transition? Social Sciences and Humanities Open, 13, 102766. [Google Scholar] [CrossRef] [Scilit]
- Allison, P. D. (2012, September 10). When can you safely ignore multicollinearity? Statistical horizons. Available online: https://statisticalhorizons.com/multicollinearity/ (accessed on 4 October 2026).
- Alnafrah, I. (2025). The two tales of AI: A global assessment of the environmental impacts of artificial intelligence from a multidimensional policy perspective. Journal of Environmental Management, 392, 126813. [Google Scholar] [CrossRef] [Scilit]
- Anakpo, G., & Kollamparambil, U. (2022). Artificial intelligence and average wages in Southern Africa: A panel VAR approach. Development Southern Africa, 39(17), 575–588. [Google Scholar] [CrossRef] [Scilit]
- Angrist, J. D., & Imbens, G. W. (1995). Two-Stage least squares estimation of average causal effects in models with variable treatment intensity. Journal of the American Statistical Association, 90(430), 431–442. [Google Scholar] [CrossRef]
- Assanova, A., Issaeva, A., Dzhubalieva, Z., & Uchkampirova, A. (2025). Financial-Digital investments in human capital as a factor of sustainable economic growth: Assessment, dynamics and impact of artificial intelligence (A Kazakhstan case study). Economic Annals-XXI, 213(1–2), 18–29. [Google Scholar] [CrossRef] [Scilit]
- Baghirova, T., Mammadova, A., Hasanova, N., & Aliyeva, Z. (2025). Adoption of digital technologies in Azerbaijan’s agricultural sector: A comparative global perspective. Pakistan Journal of Agricultural Research, 38(1), 30–35. [Google Scholar] [CrossRef] [Scilit]
- Baltagi, B. H. (2013). Econometric analysis of panel data (5th ed.). Wiley. [Google Scholar]
- Ben Brik, A. B. (2026). Measuring governance or wealth? Construct validation of AI readiness indices. Policy and Internet, 18(3), e70050. [Google Scholar] [CrossRef] [Scilit]
- Beşer, N. Ö., Çabas, M., Beşer, M., & Magazzino, C. (2025). Industrialization, natural resource rent, and energy intensity: Drivers of environmental degradation in the EU’s path to sustainable development. Energy and Environment. [Google Scholar] [CrossRef] [Scilit]
- Bresnahan, T. F., & Trajtenberg, M. (1995). General purpose technologies: ‘Engines of growth’? Journal of Econometrics, 65(1), 83–108. [Google Scholar] [CrossRef] [Scilit]
- Brynjolfsson, E., Rock, D., & Syverson, C. (2021). The productivity J-curve: How intangibles complement general purpose technologies. American Economic Journal: Macroeconomics, 13(1), 333–372. [Google Scholar] [CrossRef] [Scilit]
- Cameron, A. C., Gelbach, J. B., & Miller, D. L. (2008). Bootstrap-Based improvements for inference with clustered errors. Review of Economics and Statistics, 90(3), 414–427. [Google Scholar] [CrossRef] [Scilit]
- Canova, F., & Ciccarelli, M. (2013). Panel vector autoregressive models: A survey. Advances in Econometrics, 31, 205–246. [Google Scholar] [CrossRef] [Scilit]
- Dai, S., & Du, X. (2023). Discovering the role of trade diversification, natural resources, and environmental policy stringency on ecological sustainability in the BRICST region. Resources Policy, 85, 103868. [Google Scholar] [CrossRef] [Scilit]
- Destek, G., & Destek, M. A. (2026). Natural wealth or growth trap? The economic effects of resource rents, financial inclusion, and green innovation. iScience, 29(7), 116424. [Google Scholar] [CrossRef] [Scilit]
- Drago, C., Costantiello, A., Savorgnan, M., & Leogrande, A. (2025). Macroeconomic and labor market drivers of AI adoption in Europe: A machine learning and panel data approach. Economies, 13(8), 226. [Google Scholar] [CrossRef] [Scilit]
- Gazanfarli, M. K. (2025). How digitalisation affects agricultural progress in Azerbaijan: Evidence from panel data approach. International Journal of Sustainable Agricultural Management and Informatics, 11(1), 97–110. [Google Scholar] [CrossRef] [Scilit]
- Guliyev, H. (2023). Artificial intelligence and unemployment in high-tech developed countries: New insights from dynamic panel data model. Research in Globalization, 7, 100140. [Google Scholar] [CrossRef] [Scilit]
- Guliyev, H., Huseynov, N., & Nuriyev, N. (2023). The relationship between artificial intelligence, big data, and unemployment in G7 countries: New insights from dynamic panel data model. World Development Sustainability, 3, 100107. [Google Scholar] [CrossRef] [Scilit]
- Hansen, B. E. (1999). Threshold effects in non-dynamic panels: Estimation, testing, and inference. Journal of Econometrics, 93(2), 345–368. [Google Scholar] [CrossRef] [Scilit]
- Hasanova, J., & Najafova, K. (2025). Digitization, automation problems and solutions in small business on the example of Azerbaijan. WSEAS Transactions on Business and Economics, 22, 1358–1369. [Google Scholar] [CrossRef] [Scilit]
- Herwartz, H., & Wang, S. (2024). Statistical identification in panel structural vector autoregressive models based on independence criteria. Journal of Applied Econometrics, 39(4), 620–639. [Google Scholar] [CrossRef] [Scilit]
- Humbatova, S. İ. Q., Garayev, A. I. O., Tanriverdiev, S. M. O., & Hajiyev, N. Q.-O. (2019). Analysis of the oil, price and currency factor of economic growth in Azerbaijan. Entrepreneurship and Sustainability Issues, 6(3), 1335–1353. [Google Scholar] [CrossRef] [Scilit]
- Huseynova, K., Habibova, Z., Guliyev, M., & Guluzade, F. (2026). Digital transformation of public services: The experience of implementing e-government in different regions. Revista de Direito, Estado e Telecomunicações, 18(2), 1–31. [Google Scholar] [CrossRef] [Scilit]
- Imai, K., Keele, L., & Yamamoto, T. (2010). Identification, inference and sensitivity analysis for causal mediation effects. Statistical Science, 25(1), 51–71. [Google Scholar] [CrossRef] [Scilit]
- Ismayilov, M. (2025). Formation and development directions of the digital economy in Azerbaijan. Scientific Work, Special Issue, 54–57. [Google Scholar] [CrossRef] [Scilit]
- Ismayilov, N., & Tumpach, M. (2026). Budgetary management quality and economic growth: Within-country evidence from developing economies. Investment Management and Financial Innovations, 23(2), 400–423. [Google Scholar] [CrossRef] [Scilit]
- Işık, C., Ongan, S., & Islam, H. (2026). Driving energy transition through artificial intelligence: Integrating economic, environmental, social, and governance (ECON-ESG) factors in OECD countries. Journal of the Knowledge Economy, 17, 750–776. [Google Scholar] [CrossRef] [Scilit]
- Li, Z., Yang, H., & Zhang, T. (2025). Impact of enterprise artificial intelligence development on human capital structure. Finance Research Letters, 61, 107600. [Google Scholar] [CrossRef] [Scilit]
- Liu, Y., Ma, X., Zhu, Y., & Shafa, S. (2024). Harnessing corporate digitalization for green tech advancements: The mediating influence of mineral resource endowments. Resources Policy, 97, 105221. [Google Scholar] [CrossRef] [Scilit]
- Love, I., & Zicchino, L. (2006). Financial development and dynamic investment behavior: Evidence from panel VAR. Quarterly Review of Economics and Finance, 46(2), 190–210. [Google Scholar] [CrossRef] [Scilit]
- Ma, X., Huo, Y., & Zhu, T. (2025). Leveraging the digital economy for enhanced digital service trade exports: Lessons from China. PLoS ONE, 20, e0333798. [Google Scholar] [CrossRef] [Scilit]
- MacKinnon, J. G., Nielsen, M. Ø., & Webb, M. D. (2023). Cluster-Robust inference: A guide to empirical practice. Journal of Econometrics, 232(2), 272–299. [Google Scholar] [CrossRef] [Scilit]
- MacKinnon, J. G., & Webb, M. D. (2018). The wild bootstrap for few (treated) clusters. Econometrics Journal, 21(2), 114–135. [Google Scholar] [CrossRef] [Scilit]
- Mandon, P. (2025). Beyond the AI divide: A straightforward approach to identifying global and local overperformers in AI preparedness. Digital Business, 5(2), 100136. [Google Scholar] [CrossRef] [Scilit]
- Montiel Olea, J. L., & Pflueger, C. (2013). A robust test for weak instruments. Journal of Business & Economic Statistics, 31(3), 358–369. [Google Scholar] [CrossRef] [Scilit]
- Nasution, M. K. M., Elveny, M., Pamucar, D., & Gušavac, B. A. A. (2024). Uncovering the hidden insights of the government AI readiness index: Application of fuzzy LMAW and Schweizer-Sklar weighted framework. Decision Making: Applications in Management and Engineering, 7(2), 443–468. [Google Scholar] [CrossRef] [Scilit]
- Nogueira, M. C., & Madaleno, M. (2023). Skill-Biased technological change and gender inequality across OECD countries—A simultaneous approach. Economies, 11(4), 115. [Google Scholar] [CrossRef] [Scilit]
- Oxford Insights. (2021). Government AI readiness index 2021. Available online: https://oxfordinsights.com/wp-content/uploads/2023/11/Government_AI_Readiness_21.pdf (accessed on 8 August 2026).
- Oxford Insights. (2022). Government AI readiness index 2022. Available online: https://oxfordinsights.com/wp-content/uploads/2023/11/Government_AI_Readiness_2022_FV.pdf (accessed on 8 August 2026).
- Oxford Insights. (2023). Government AI readiness index 2023. Available online: https://oxfordinsights.com/wp-content/uploads/2023/12/2023-Government-AI-Readiness-Index-1.pdf (accessed on 8 August 2026).
- Oxford Insights. (2024). Government AI readiness index 2024. Available online: https://oxfordinsights.com/wp-content/uploads/2024/12/2024-Government-AI-Readiness-Index-2.pdf (accessed on 8 August 2026).
- Rahimov, V. (2025). A Bayesian VAR model for inflation: The case of Azerbaijan. Financial and Credit Activity: Problems of Theory and Practice, 4(63), 180–191. [Google Scholar] [CrossRef] [Scilit]
- Roodman, D., MacKinnon, J. G., Nielsen, M. Ø., & Webb, M. D. (2019). Fast and wild: Bootstrap inference in stata using boottest. Stata Journal, 19(1), 4–60. [Google Scholar] [CrossRef] [Scilit]
- Sachs, J. D., & Warner, A. M. (1995). Natural resource abundance and economic growth. NBER working paper 5398. National Bureau of Economic Research. [Google Scholar] [CrossRef] [Scilit]
- Sigmund, M., & Ferstl, R. (2021). Panel vector autoregression in R with the package panelvar. Quarterly Review of Economics and Finance, 80, 693–720. [Google Scholar] [CrossRef] [Scilit]
- Sitnicka, S., Mursalov, M., Mammadov, H., & Zhou, Y. (2025). Ethics, institutions, infrastructure, and governance in AI national-level readiness: A hidden driver of banking transformation. Business Ethics and Leadership, 9(3), 290–304. [Google Scholar] [CrossRef] [Scilit]
- Spivakovskyy, S., Kesoyan, N. M., Astapova-Vyazmina, O., & Zhou, Y. (2026). E-Government development: Artificial intelligence vibrancy and readiness as drivers of digital public administration. Problems and Perspectives in Management, 24(1), 649–672. [Google Scholar] [CrossRef] [Scilit]
- Stock, J. H., & Yogo, M. (2005). Testing for weak instruments in linear IV regression. In D. W. K. Andrews, & J. H. Stock (Eds.), Identification and inference for econometric models: Essays in honor of Thomas Rothenberg (pp. 80–108). Cambridge University Press. [Google Scholar]
- Sun, L., & Hasi, M. (2024). Effects of mining sector FDI, environmental regulations, and economic complexity on mineral resource dependency in selected OECD countries. Resources Policy, 91, 104651. [Google Scholar] [CrossRef] [Scilit]
- Syverson, C. (2017). Challenges to mismeasurement explanations for the US productivity slowdown. Journal of Economic Perspectives, 31(2), 165–186. [Google Scholar] [CrossRef] [Scilit]
- Touitou, T., & Yacine, L. (2025). Digitalization and economic growth in the MENA region: Evidence from panel data analysis. Telecommunications Policy, 49(7), 102992. [Google Scholar] [CrossRef] [Scilit]
- Usman, O., Iorember, P. T., Alola, A. A., & Bekun, F. V. (2026). Effect of domestic material production on environmental sustainability in EU countries under changing financial development: A dynamic panel threshold regression approach. Environment, Development and Sustainability, 28, 11383–11402. [Google Scholar] [CrossRef] [Scilit]
- Varavin, Y. V., Kozlova, M. V., Rakhimberdinova, M. U., & Ozpence, O. (2026). The impact of artificial intelligence on the structural transformation of Kazakhstan’s economy. Economy: Strategy and Practice, 21(1), 110–127. [Google Scholar] [CrossRef] [Scilit]
- Wooldridge, J. M. (2010). Econometric analysis of cross section and panel data (2nd ed.). MIT Press. [Google Scholar]
- World Bank. (2026a). World development indicators. Database last updated 13 July 2026. The World Bank. Available online: https://databank.worldbank.org/source/world-development-indicators (accessed on 4 October 2026).
- World Bank. (2026b). Worldwide governance indicators. 2026 update. The World Bank. Available online: https://www.worldbank.org/en/publication/worldwide-governance-indicators (accessed on 4 October 2026).
- Yang, R., An, X., Chen, Y., & Yang, X. (2023). The knowledge analysis of panel vector autoregression: A systematic review. SAGE Open. [Google Scholar] [CrossRef] [Scilit]
- Yong, S.-W., Law, S.-H., Ibrahim, S., & Mohamad, W. N. W. (2024). ICTs and labour productivity nexus in developing countries: Evidence from panel estimation approach. International Journal of Business and Society, 25(1), 27–48. [Google Scholar] [CrossRef] [Scilit]
- Yuzbashiyeva, G., Abasova, S., & Yuzbashiyev, I. (2024). The role of innovation in economy strengthening of Azerbaijan in the conditions of transition to industry 5.0: On the example of a comparative analysis of indicators of some Eurasian countries. Technology Audit and Production Reserves, 6(80), 71–81. [Google Scholar] [CrossRef] [Scilit]
- Zhao, P., Gao, Y., & Sun, X. (2022). How does artificial intelligence affect green economic growth? Evidence from China. Science of the Total Environment, 834, 155306. [Google Scholar] [CrossRef] [Scilit]
- Zhao, Y., Wang, W., Liang, Z., & Luo, P. (2024). Racing towards zero carbon: Unraveling the interplay between natural resource rents, green innovation, geopolitical risk and environmental pollution in BRICS countries. Resources Policy, 88, 104379. [Google Scholar] [CrossRef] [Scilit]

Disclaimer/Publisher’s Note: The statements, opinions and data contained in all publications are solely those of the individual author(s) and contributor(s) and not of MDPI and/or the editor(s). MDPI and/or the editor(s) disclaim responsibility for any injury to people or property resulting from any ideas, methods, instructions or products referred to in the content. |
© 2026 by the authors. Licensee MDPI, Basel, Switzerland. This article is an open access article distributed under the terms and conditions of the Creative Commons Attribution (CC BY) license.