


Abstract
Virtual reality (VR) provides an effective experimental environment for the controlled investigation of autonomic physiological responses under different levels of virtual immersion. This study investigated heart rate variability (HRV) responses to mental stress induced by an interactive VR game. Two stereoscopic conditions were compared: low immersion using polarising glasses and high immersion using a VR headset. Additionally, the applicability of visual, mathematical, and machine learning approaches for analysing VR-related changes in the autonomic nervous system is evaluated. The experiment involved 42 healthy volunteers (37 men and 5 women; mean age 26 ± 7 years). The HRV analysis is based on RR-intervals and includes time, frequency, and nonlinear indicators. Within the nonlinear framework, visual-mathematical methods, including Poincaré diagrams, recurrence plots, and histogram analysis, were applied. For automated classification of physiological states, a Random Forest model using 17 selected HRV parameters was applied. The results show exposure to the VR game elicited significant changes in autonomic cardiac regulation and heart rate variability, with different stereoscopic technologies producing distinct physiological responses. Nonlinear methods and applied visual-mathematical analyses reveal complex dynamic characteristics of heart rate that classical HRV indicators cannot fully capture. ROC and confusion matrix analyses show that the Random Forest model has good discriminative ability in distinguishing between a resting state and different levels of virtual immersion. The results confirm the potential of the proposed integrated approach, combining virtual reality, linear and nonlinear HRV analyses, and machine learning, as a tool for the objective assessment and modelling of autonomic physiological responses during VR exposure. The study has several limitations, including the relatively small and homogeneous sample size and the absence of stress and psychological state assessment through validated questionnaires, which should be addressed in future research.
1. Introduction
In recent years, virtual reality (VR) has been advancing at an extremely rapid pace and is increasingly used in areas such as medicine, education, simulator systems, engineering, and computer games [1,2,3,4,5]. This technology enables the creation of controlled, interactive three-dimensional environments in which the user can immerse themselves and interact with virtual objects in real time. As a result, virtual reality increases the effectiveness of training, supports diagnostics and therapy in medicine, and optimises the design and testing processes in engineering practice [6,7,8,9,10,11,12,13,14,15,16,17].
Modern virtual reality systems use stereoscopic technologies to create a three-dimensional visual environment, such as virtual helmets and stereoscopic glasses (polarising, anaglyph, etc.). By presenting different images to each eye, a sense of depth is created that closely resembles natural human perception. The quality of visualisation depends on several factors, including resolution, refresh rate, latency, and synchronisation [18,19,20,21,22,23,24].
Despite its advantages, stereoscopic visualisation can lead to visual strain and discomfort. Prolonged use of stereoscopic systems is often associated with symptoms such as eye fatigue, headache, dizziness, and decreased concentration. These effects can affect the psychoemotional state of the user and lead to motion sickness and increased levels of mental stress [25,26,27,28,29]. In this study, mental stress refers to the psychophysiological response associated with exposure to different virtual reality configurations, assessed through heart rate variability analysis. In this context, there is a need to study the impact of different stereoscopic technologies on human perception and physiological responses and to develop approaches to minimise negative effects and improve the ergonomic characteristics of virtual reality systems.
One of the widely used non-invasive methods for assessing physiological strain is the analysis of heart rate variability (HRV). It reflects the interaction between the sympathetic and parasympathetic divisions of the autonomic nervous system and serves as a reliable indicator of mental stress, fatigue, and cognitive load.
HRV analysis approaches are divided into time-based, frequency-based, and nonlinear methods. Along with classical quantitative indicators, visual and visual-mathematical methods, such as Poincaré diagrams and graphical representations of RR intervals, are increasingly used to allow a more in-depth assessment of heart rate dynamics and autonomic regulation [30,31,32,33].
In recent years, artificial intelligence and machine learning methods have found increasingly widespread application in the biomedical analysis of physiological signals. Machine learning algorithms enable the automated detection of dependencies and patterns in multidimensional physiological data that are difficult to identify with classical statistical approaches. Of particular interest are ensemble methods, such as Random Forest, which provide high robustness, good generalisation ability, and the ability to assess the significance of individual parameters [34,35,36,37,38,39].
In the context of HRV analysis, Random Forest enables automated classification of psychophysiological states based on time-domain, frequency-domain, and nonlinear indicators. This provides an opportunity for a more precise distinction between different levels of mental stress and the degree of virtual immersion. Additionally, the application of ROC analysis, confusion matrices, and feature importance assessments enables quantitative evaluation of the discriminative ability of the HRV parameters used and the model’s effectiveness.
The present study aims to analyse the influence of virtual reality and various stereoscopic technologies on heart rate variability, using a combined approach of statistical, visual-mathematical, and machine learning methods. In the experimental protocol, a previously developed and published game [40,41,42,43,44] was modified for compatibility with two stereoscopic technologies, implemented at low and high levels of virtual immersion, and used to generate stress. Changes in heart rate variability indicators recorded at rest and during a stressful load were analysed, along with the feasibility of their automated classification using the Random Forest algorithm.
2. Literature Review
Heart rate variability is a well-established non-invasive marker for assessing the autonomic nervous system and its responses to various types of stress, including physical and mental stress. Several studies have shown that increased mental stress is associated with decreased HRV, reflecting increased sympathetic and decreased parasympathetic activity [45,46,47].
Traditional methods for generating cognitive stress include mental arithmetic, Stroop tests, and time-limited reaction tasks. Virtual reality is emerging as an effective tool for creating controlled experimental environments. Through interactive and immersive scenarios, VR enables the induction of more realistic psychophysiological responses than traditional laboratory methods [48,49].
Studies [50,51] have shown that stress generated through VR leads to increased blood pressure, increased heart rate, and decreased HRV, which induces activation of the sympathetic division of the autonomic nervous system. However, the mechanisms by which different visual technologies influence VR remain poorly understood.
HRV analysis includes time-domain, frequency-domain and nonlinear approaches. Time-domain indicators (SDNN, RMSSD) reflect the overall variability, while frequency analysis assesses the sympatho-parasympathetic balance. Nonlinear methods, including Poincaré analysis (SD1, SD2), provide additional information about the complex dynamics of heart rate [52,53,54].
Machine learning methods are increasingly used to analyse biomedical signals and classify psychophysiological states. Ensemble algorithms such as Random Forest show high robustness, good generalisation, and the ability to assess feature significance. In HRV analysis, they are applied to distinguish stressful and non-stressful states [55,56,57].
Stereoscopic technologies in VR can cause varying degrees of visual strain, related to a mismatch between accommodation (focusing) and convergence (the eyes’ tendency to converge on a single point). Active and passive stereoscopic systems differ in how they visualise and can lead to varying levels of visual fatigue, headaches, and decreased concentration. These factors can affect the psychophysiological state and, accordingly, HRV parameters.
Despite the growing body of research on HRV during stress and the use of virtual reality as an experimental environment, several important research gaps remain. Most previous studies have investigated either conventional linear HRV indices or machine learning approaches separately, while relatively few have combined linear and nonlinear HRV analyses with automated classification methods. Furthermore, direct comparisons of different stereoscopic VR configurations and their influence on autonomic physiological responses remain scarce.
The novelty of the present study lies in the integration of three complementary components: (1) a comparative analysis of autonomic physiological responses under two stereoscopic VR configurations with different levels of immersion, (2) a combined linear and nonlinear HRV analysis incorporating time-domain, frequency-domain, Poincaré, Recurrence Quantification Analysis, and Multiscale Entropy methods, and (3) a Random Forest-based classification model using HRV features to distinguish the experimental conditions. This integrated framework provides a more comprehensive assessment of autonomic physiological responses during VR exposure than approaches based on a single analytical methodology.
3. Materials and Methods
3.1. Materials
3.1.1. Participants
The study involved 42 healthy volunteers (37 males and 5 females) aged 26 ± 7 years, who had no history of cardiovascular disease or visual problems that would affect the perception of a stereoscopic image. None of the participants reported taking medications that could affect cardiovascular function. All participants were informed in advance of the purpose and protocol of the experiment and provided informed consent to participate. During the experiment, the participants were seated in a quiet laboratory environment.
3.1.2. Experimental Protocol
The experimental protocol includes a baseline phase and two experimental conditions:
- 3D game, implemented using a low-immersion virtual reality configuration based on a passive stereoscopic system with polarising glasses and a GlobeView 3D passive monitor (Schneider Digital, Holzkirchen, Germany);
- 3D game, implemented using a high-immersion virtual reality configuration based on a VR helmet Shinecon VR (ShineconIndustrial Co., Ltd., Dongguan, China, model series 2016–2020), which is compatible with the Samsung Galaxy A54 5G smartphone (Samsung Electronics, Suwon, Republic of Korea) used in the experiment (OS Android).
The experiment consisted of three experimental phases: (i) a 25 min resting ECG recording used as the baseline, (ii) a 25 min VR session using the low-immersion system, and (iii) a 25 min VR session using the high-immersion system. ECG was recorded continuously throughout all three phases.
The order of the conditions was randomised, with at least 2 h between them. Before each experimental session, participants were instructed to abstain from consuming caffeine-containing beverages and alcohol. All recordings were performed under the same laboratory conditions and followed an identical experimental protocol for all participants. Continuous ECG recordings were acquired using a Dynamic ECG System TLC9803 Holter device (Contec Medical Systems Co., Ltd., Qinhuangdao, China).
All recordings had the same duration (25 min). Time-domain and nonlinear HRV indices were calculated from the complete 25 min recordings. In accordance with the recommendations of the Task Force of the European Society of Cardiology and the North American Society of Pacing and Electrophysiology [32], frequency-domain HRV indices (LF and HF) were calculated from consecutive 5 min segments, and the mean values obtained from the five segments were used for statistical analysis.
ECG recordings were performed using a Dynamic ECG System TLC9803 Holter device (Contec Medical Systems Co., Ltd., Qinhuangdao, China) with a sampling frequency of 250 Hz and 24-bit resolution. The device provides a frequency response of 0.05–40 Hz and includes a 50 Hz power-line interference filter. The recorded ECG signals were processed using the manufacturer’s software, which performs R-peak detection, cardiac complex classification, and HRV analysis based on proprietary MCSS™ and TMCA™ algorithms. The software automatically identifies normal beats, premature atrial and ventricular complexes, prolonged RR intervals, and episodes of atrial fibrillation. The detected events and potential artefacts were reviewed and, when necessary, manually corrected by the researcher.
HRV analysis included time, frequency, and nonlinear methods [30,32]. Time indicators included Mean RR, Number RR, SDNN, and RMSSD. Frequency analysis assessed the sympatho-parasympathetic balance through spectral components. Nonlinear analysis includes Poincaré analysis with SD1, SD2, and SD1/SD2 indicators; recurrence plot analysis with REC%, DET%, ENTR, Lmax, and Laminarity%; and Multiscale Entropy analysis [58,59]. These methods describe the complex dynamics of cardiac regulation.
A Random Forest model based on HRV features was used to classify the experimental conditions. The model assesses the ability of physiological parameters to distinguish different levels of virtual immersion. Additionally, a significance analysis of the features was performed to identify the most informative HRV parameters.
The results of the analysis are presented through tabular and graphical visualisations.
3.1.3. High and Low Immersion Virtual Reality Systems
One of the experimental conditions in this study uses a high-immersion virtual reality configuration, implemented via a VR headset and a mobile device. This section describes the technical characteristics of the Cardboard VR system used to determine the level of virtual immersion.
Google Cardboard is an accessible form of virtual reality, based on a mobile device, that provides stereoscopic visualisation and tracking of head movements. The technology uses the smartphone display to generate two separate images—one for each eye, which creates a sense of depth and spatial perception. The change in head orientation is detected by the built-in gyroscopic sensor of the mobile device, which allows for a dynamic change in perspective in the virtual environment.
Although Cardboard VR offers a lower level of immersion than modern autonomous VR headsets, it provides a realistic three-dimensional perception at a low cost and is widely compatible with mobile devices. This makes it suitable for scientific research and experimental applications that require a controlled virtual environment without specialised hardware.
The VR application used in this study was a modification of an application presented in previous publications [40,41,42,43,44]. The main modification involved adaptation for mobile devices and compatibility with Cardboard VR technology. The application was used to provide the VR experimental condition and to compare physiological responses under different VR configurations.
In comparison, the low-immersion VR configuration was implemented using a passive stereoscopic system, including a GlobeView 3D monitor (Schneider Digital, Holzkirchen, Germany) and polarising glasses. This configuration provides the perception of a three-dimensional image without complete visual isolation of the participant from the real environment, resulting in a lower degree of immersion than the Cardboard VR system.
It should be noted that the two VR configurations differ not only in immersion level but also in several technical characteristics, including display type, visual field, degree of visual isolation, head movement tracking, and hardware ergonomics.
3.1.4. Virtual Reality Game
The experimental game was developed to induce mental stress in a controlled virtual environment. Several versions of the application have been implemented so far, including a polarised glasses version, an anaglyph version, an active stereoscopic 3D version, an immersive version with a VR headset, and a mixed reality version based on HoloLens 2 (see Supplementary Files, Figures S1–S5).
In this study, a modified version of the game was used, adapted for mobile devices and compatible with both low- and high-immersion virtual environments. Compared to the previous implementation based on Photontree 3D Pro, the new version offers greater immersion through Cardboard VR technology and real-time head tracking.
Two virtual cameras, corresponding to the left and right eyes, were used to realise the stereoscopic image. The distance between them approximates the natural interocular distance, enabling depth perception in the virtual environment. The basic principle of stereoscopic visualisation is presented in Algorithm 1.
| Algorithm 1. Pseudo code for Cardboard VR camera |
| class VRCameraRig { Camera centerCamera Camera leftEye Camera rightEye float eyeDistance = 0.064 // ~64 mm between eyes function Start() { // creating two cameras leftEye = CreateCamera() rightEye = CreateCamera() // parent to head leftEye.parent = centerCamera rightEye.parent = centerCamera } function Update() { // rotating from phone/VR Cardboard headset rotation = GetHeadRotation() centerCamera.rotation = rotation // position of eyes leftEye.localPosition = Vector3(-eyeDistance / 2, 0, 0) rightEye.localPosition = Vector3( eyeDistance / 2, 0, 0) // eyes look at in front leftEye.rotation = rotation rightEye.rotation = rotation } function Render() { // left screen SetViewport(leftEye, x = 0, y = 0, w = 0.5, h = 1) // right screen SetViewport(rightEye, x = 0.5, y = 0, w = 0.5, h = 1) RenderCamera(leftEye) RenderCamera(rightEye) } } |
In the highly immersive version, the orientation of the virtual camera is controlled by data from the mobile device’s gyroscopic sensor, which provides 360-degree tracking of head movements. The implementation of this mechanism is presented in Algorithm 2.
Interaction with the virtual environment is carried out using a wireless Xbox One controller (Microsoft Corporation, Redmond, WA, USA). The use of an external controller allows the separation of control of game actions from visual perception and head movements, thereby contributing to a more natural interaction with the virtual environment (Supplementary Files, Figure S6).
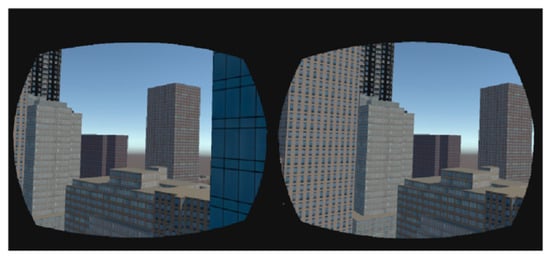
Figure 1 illustrates the game view when using Cardboard VR technology and the separation of the image for the left and right eye.
Figure 1.
Cardboard VR view.
| Algorithm 2. Code for viewing in 360 |
| using UnityEngine; public class GyroCardboardCamera: MonoBehaviour { private Gyroscope gyro; // that is most important private bool gyroEnabled; void Start() { gyroEnabled = EnableGyro(); } private bool EnableGyro() { if (SystemInfo.supportsGyroscope) { gyro = Input.gyro; gyro.enabled = true; return true; } return false; } void Update() { if (gyroEnabled) { Quaternion deviceRotation = gyro.attitude; transform.localRotation = new Quaternion( -deviceRotation.x, -deviceRotation.y, deviceRotation.z, deviceRotation.w ); } } } |
3.2. Methods
The analysis of heart rate variability is performed using time, frequency, nonlinear and visual methods [30,32,60]. Additionally, a Random Forest machine learning algorithm is used to automate the classification and assessment of HRV indicator significance. The combined approach provides a more comprehensive assessment of the autonomic nervous system’s functional state and the body’s response to mental stress.
3.2.1. Time-Domain Analysis
The following parameters are used from the time indicators:
- MeanRR—average value of RR intervals, characterising the average duration between consecutive heartbeats;
- NumberRR—total number of analysed RR intervals within the corresponding record;
- SDNN—standard deviation of NN intervals, characterising the overall variability of the heart rate;
- RMSSD—square root of the average value of the squares of the differences between consecutive RR intervals, reflecting short-term variability and parasympathetic activity.
3.2.2. Frequency-Domain Analysis
In the frequency domain, the following spectral components of HRV are analysed [32]:
- LF (Low Frequency) component (0.04–0.15 Hz);
- HF (High Frequency) component (0.15–0.40 Hz);
- The LF/HF ratio was considered as a parameter reflecting changes in autonomic cardiac regulation.
Spectral analysis was performed using an autoregressive (AR) method applied to consecutive 5 min segments of the ECG recordings. Each 25 min recording was divided into five consecutive segments, and the mean value of the obtained spectral parameters was used for further statistical analysis. The frequency-domain parameters were calculated from NN intervals after artefact correction.
3.2.3. Nonlinear and Visual Analysis
In addition to classical linear indicators, the study uses nonlinear and visual methods to analyse heart rate variability. Nonlinear methods enable analysis of the complex dynamics of heart rate that cannot be fully captured by linear time and frequency indicators.
Histogram Analysis
Histogram analysis is used to visualise the distribution of RR intervals and to assess changes in heart rate variability under different experimental conditions. The shape of the histogram and the degree of dispersion of the NN intervals reflect the peculiarities of autonomic regulation and provide information about its dynamics and stability.
Poincaré Analysis
Poincaré plots are a graphical representation of the relationship between consecutive RR intervals [32]. They are used to assess the geometric structure and nonlinear dynamics of cardiac rhythms. The following parameters are calculated from the plots:
- SD1—characterizes short-term variability;
- SD2—characterizes long-term variability;
- SD1/SD2—an indicator of the ratio between short-term and long-term dynamics of the heart rhythm.
Recurrence Plot Analysis
Recurrence plots are used to analyse the dynamic structure and repeatability of time series by reconstructing the phase space of the RR intervals [61,62]. The method allows visualisation and quantitative assessment of repeatable states in heart rhythm dynamics.
The reconstruction of the phase space was performed using a time-delay embedding method defined by the embedding dimension (m) and time delay (τ). The time delay was estimated using the Average Mutual Information (AMI) method, while the optimal embedding dimension was evaluated using the False Nearest Neighbours (FNN) method in a preliminary analysis. Based on this analysis, a fixed set of parameters was applied to all RR interval series: embedding dimension m = 10 and time delay τ = 1. Recurrence was defined using a threshold ε based on the Euclidean distance between reconstructed states. The threshold was adaptively selected for each recording to achieve a fixed Recurrence Rate (REC%) of 5%, ensuring comparability between participants and experimental conditions. Quantitative indicators characterising the nonlinear dynamics of the system are extracted from the recurrence matrix:
- Recurrence Rate (REC%)—percentage of recurrent points, characterising the overall degree of recurrence of states;
- Determinism (DET%)—measure of predictability of the system, based on the proportion of recurrent points forming diagonal structures;
- Entropy (ENTR)—characterises the complexity and diversity of diagonal lines in the recurrence diagram;
- Lmax—length of the longest diagonal line (excluding the main diagonal), used as an indicator of stability and sensitivity to changes in dynamics;
- Laminarity (LAM%)—measure of the presence of horizontal structures in the recurrence diagram, characterising laminar (more stable or “held”) states in the system.
Multiscale Entropy Analysis
Multiscale Entropy (MSE) is used to assess the complexity of time series by analysing the entropy at different time scales. The method allows characterisation of RR interval dynamics across different levels of temporal aggregation, thereby revealing the multiscale structure of heart rhythm.
The procedure includes two main steps: (1) creating coarse-grained time series for different scale factors (scale factors τ = 1–20) and (2) calculating Sample Entropy (SampEn) for each scale.
Sample Entropy is calculated with the following parameters:
- embedding dimension (m = 2);
- tolerance threshold (r = 0.2 × SD of the signal).
The resulting MSE curve describes the dependence of entropy on scale and serves as an indicator of the complexity and adaptability of the physiological system. Higher MSE values indicate increased complexity of physiological dynamics, which is often associated with greater adaptability of autonomic regulation. Conversely, reduced MSE values may reflect decreased complexity and reduced physiological flexibility. In comparison, lower values may indicate reduced variability and physiological flexibility, for example, during mental stress or in pathological conditions.
3.2.4. Machine Learning Analysis (Random Forest)
For automated classification of physiological states (rest and mental stress), a Random Forest algorithm was used, an ensemble method that combines multiple decision trees. The final classification is determined by a majority vote among the individual trees, which increases robustness to noise and overfitting.
The analysis is based on 17 HRV parameters from time, frequency, and nonlinear analyses of HRV, including MeanRR, NumberRR, SDNN, RMSSD, LF, HF, LF/HF, as well as indicators from Poincaré, Recurrence Plot, and Multiscale Entropy analyses.
The dataset comprised HRV measurements obtained from 42 participants. Data splitting was performed at the participant level rather than at the level of individual recordings or feature vectors. Consequently, all measurements from a given participant were assigned entirely to either the training or the testing dataset, thereby preventing participant leakage and information leakage between datasets. Five participants were used for model training, whereas the remaining 37 participants formed an independent test set.
A hold-out validation strategy was applied. Cross-validation and hyperparameter optimization were not performed. Furthermore, no feature scaling or feature selection was applied before data splitting. The three experimental classes (Rest, VR Low, and VR High) contained an equal number of observations; therefore, no class-balancing procedures were required.
The model is used both for state classification and for feature importance assessment based on Gini impurity reduction. In this way, the most informative HRV measures for distinguishing between resting and mental stress states are identified.
The model evaluation includes accuracy, precision, recall, F1-score and ROC-AUC. Additionally, a confusion matrix is analysed. The robustness of the model is verified by out-of-bag (OOB) error.
Table 1 summarises the HRV analysis methods, the machine learning approach (Random Forest), and the extracted parameters, along with their physiological interpretation.
Table 1.
Summary of HRV analysis methods, machine learning approach, and extracted parameters.
The combined use of linear and nonlinear methods for analysing heart rate variability enables a more complete assessment of the functional state of the autonomic nervous system and its responses to mental stress. All calculations and graphical representations are performed using proprietary software developed in MATLAB (ver. R2018a).
Additionally, for automated classification of physiological states, a machine learning method was applied—Random Forest, which integrates multiple decision trees to increase the accuracy and robustness of the model. The RF model not only allows distinguishing between states but also quantitatively assesses the significance of HRV parameters using Gini-based feature importance, providing additional information about the most informative physiological characteristics associated with the stress response.
3.3. Statistical Analysis
The statistical analysis was performed to assess differences in HRV parameters among the three experimental conditions (rest, VR with low immersion, and VR with high immersion), using repeated measurements on the same participants. Data are presented as mean ± standard deviation (mean ± SD).
To assess the effect of the experimental condition on individual HRV parameters, a one-way repeated-measures analysis of variance (RM-ANOVA) was conducted. The assumption of sphericity was evaluated using Mauchly’s test. Whenever the assumption of sphericity was violated, the statistical significance was assessed using the Greenhouse–Geisser corrected p-values.
Following the overall RM-ANOVA, planned pairwise comparisons were performed between the resting condition and each VR condition (Rest vs. VR Low and Rest vs. VR High), corresponding to the predefined study objectives. These comparisons were conducted using paired-samples t-tests, and the resulting p-values were adjusted using the Bonferroni correction for multiple comparisons.
In addition to statistical significance, the effect size was estimated using Cohen’s d for paired samples to quantify the magnitude of the observed differences between conditions. This approach provides information on the practical significance of the observed effects independently of sample size.
Additionally, a machine learning analysis was performed using the Random Forest algorithm described in the previous section to assess the discriminative ability of the HRV features. This approach was used as a complement to the classical statistical evaluation to assess the separability of the experimental conditions in the classification.
4. Results
The results of the study show systematic changes in heart rate variability between the three experimental groups—rest, low-immersion VR and high-immersion VR. A progressive modulation of the autonomic nervous system was observed with increasing levels of virtual immersion, as evidenced by both linear and nonlinear HRV measures. The results shown in Table 2 reveal distinct differences between the three groups.
Table 2.
Mean ± SD values of time-domain, frequency-domain, nonlinear, and recurrence-based HRV parameters under resting, low-immersion VR, and high-immersion VR conditions.
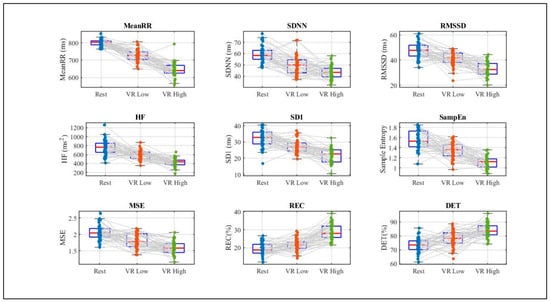
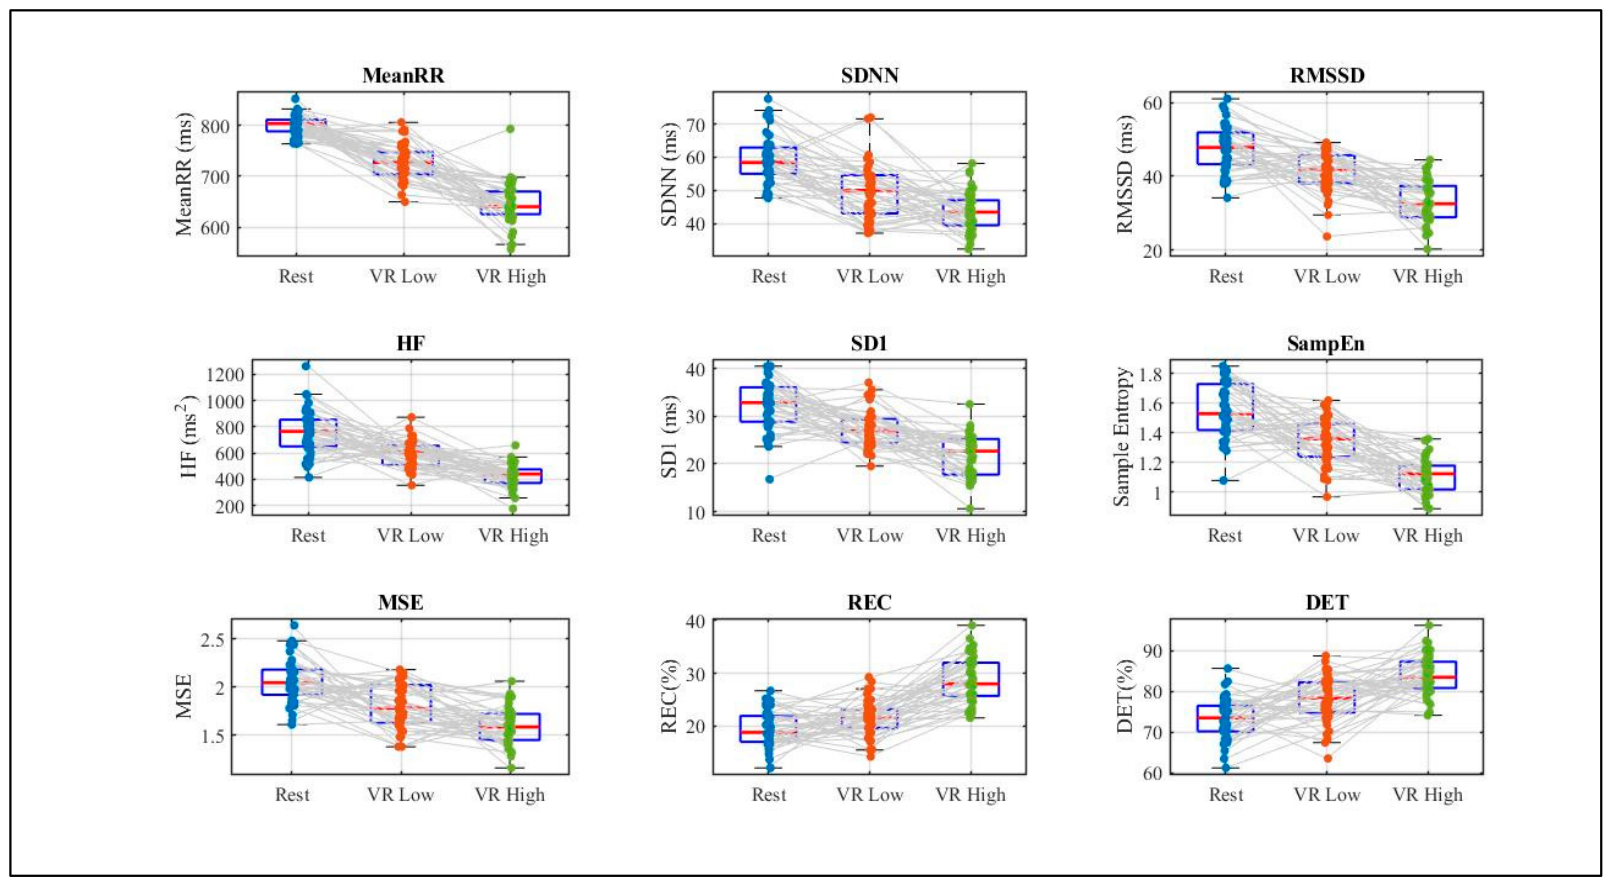
To complement the statistical results presented in Table 2, Figure 2 shows boxplots of selected representative HRV parameters across all participants under the three experimental conditions (Rest, VR Low, and VR High). The boxplots illustrate the median, interquartile range (IQR), and the distribution of individual observations, including potential outliers. The distributions demonstrate a consistent shift in the HRV parameters across the experimental conditions, supporting that the observed differences are representative of the study population rather than being driven by only a few participants.
Figure 2.
Boxplots of selected representative HRV parameters for all participants under the three experimental conditions (Rest, VR Low, and VR High).
4.1. Time-Domain Analysis of HRV Parameter
The results of the time-domain HRV analysis show a clear and consistent trend toward decreased heart rate variability with increasing levels of virtual immersion. In the resting condition, the highest RR interval values and HRV indices were observed, indicating greater autonomic variability compared with the VR conditions and suggesting relatively stronger parasympathetic modulation. In VR conditions with a low degree of immersion, a moderate decrease in SDNN and RMSSD is observed, accompanied by shorter RR intervals, indicating initial sympathetic activation. In VR with a high degree of immersion, these changes are significantly more pronounced, with the strongest decreases in HRV indicators and the shortest RR intervals, indicating increased mental stress and sympathetic dominance.
The effect size (Cohen’s d) confirms these trends, indicating large-to-very-large effects when comparing the resting and VR conditions. In particular, the differences between resting and VR with a high degree of immersion yield very large effect sizes (d > 2), emphasising the strong physiological impact of the virtual environment on autonomic regulation.
4.2. Frequency-Domain Analysis of HRV Parameters
The frequency-domain analysis shows a clear change in autonomic nervous regulation as the level of virtual immersion increases. In the resting state, higher values of the HF component are observed, which reflects stronger parasympathetic activity and lower physiological load.
In VR with a low degree of immersion, a decrease in HF and a concomitant increase in the LF component are observed, indicating initial sympathetic activation and a shift in autonomic balance. This trend is strengthened in VR with a high degree of immersion, where HF reaches its lowest values, and LF and LF/HF ratios increase significantly, indicating dominant sympathetic activity and increased mental stress.
The size of the Cohen’s d effect confirms these observations, showing large to very large effects when comparing resting and VR conditions. The most pronounced changes are observed in the HF and LF/HF indicators, highlighting the sensitivity of frequency metrics to VR-induced load.
4.3. Nonlinear and Visual Analysis of HRV Parameters
For a more in-depth assessment of the complex dynamics of heart rate, nonlinear and visual methods such as histograms, Poincaré plots, and recurrence analysis have been applied, enabling the evaluation of structural changes in HRV signals across different experimental conditions.
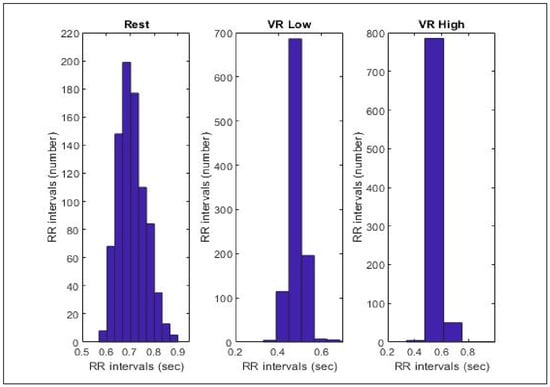
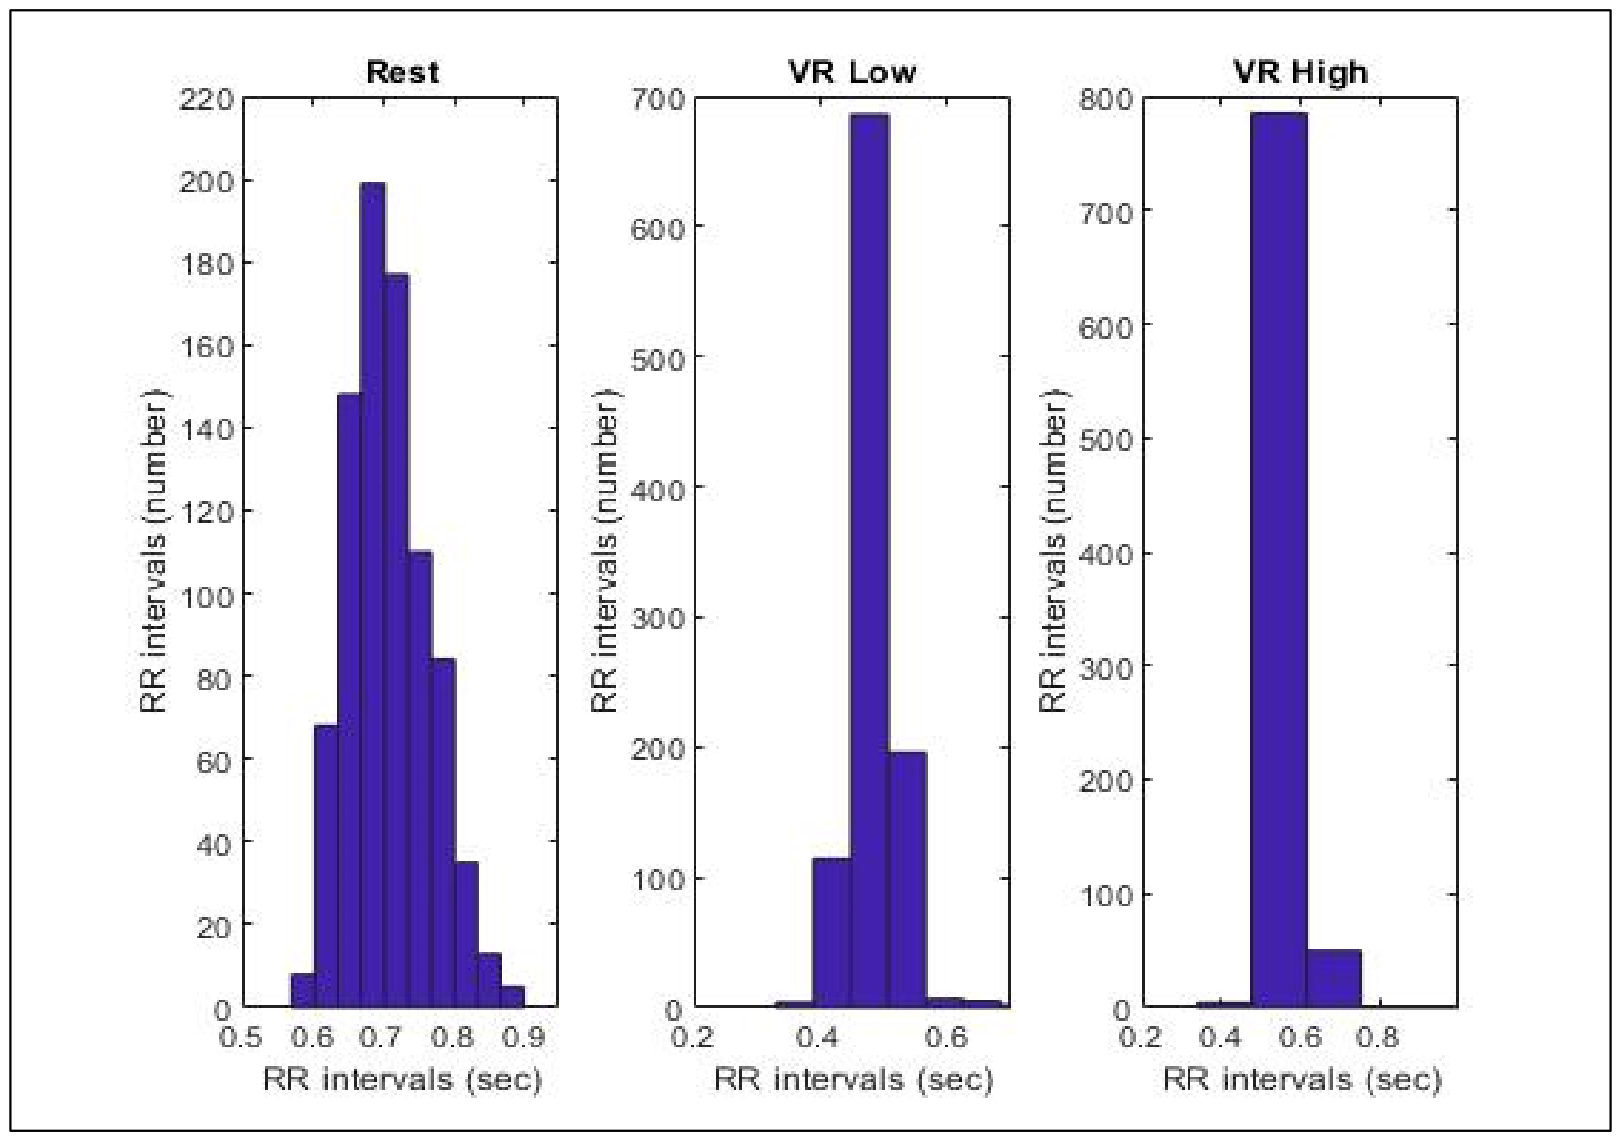
The histogram analysis (Figure 3) shows a gradual narrowing of the distribution of RR intervals with increasing virtual immersion, reflecting reduced variability and a narrower heart rate dynamic range. This trend is most pronounced in the high-immersion condition, where the distribution becomes more compact than in the resting state.
Figure 3.
Histogram analysis of RR intervals for Rest, VR Low, and VR High conditions.
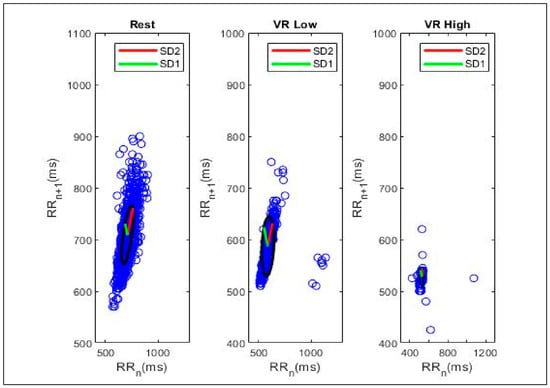
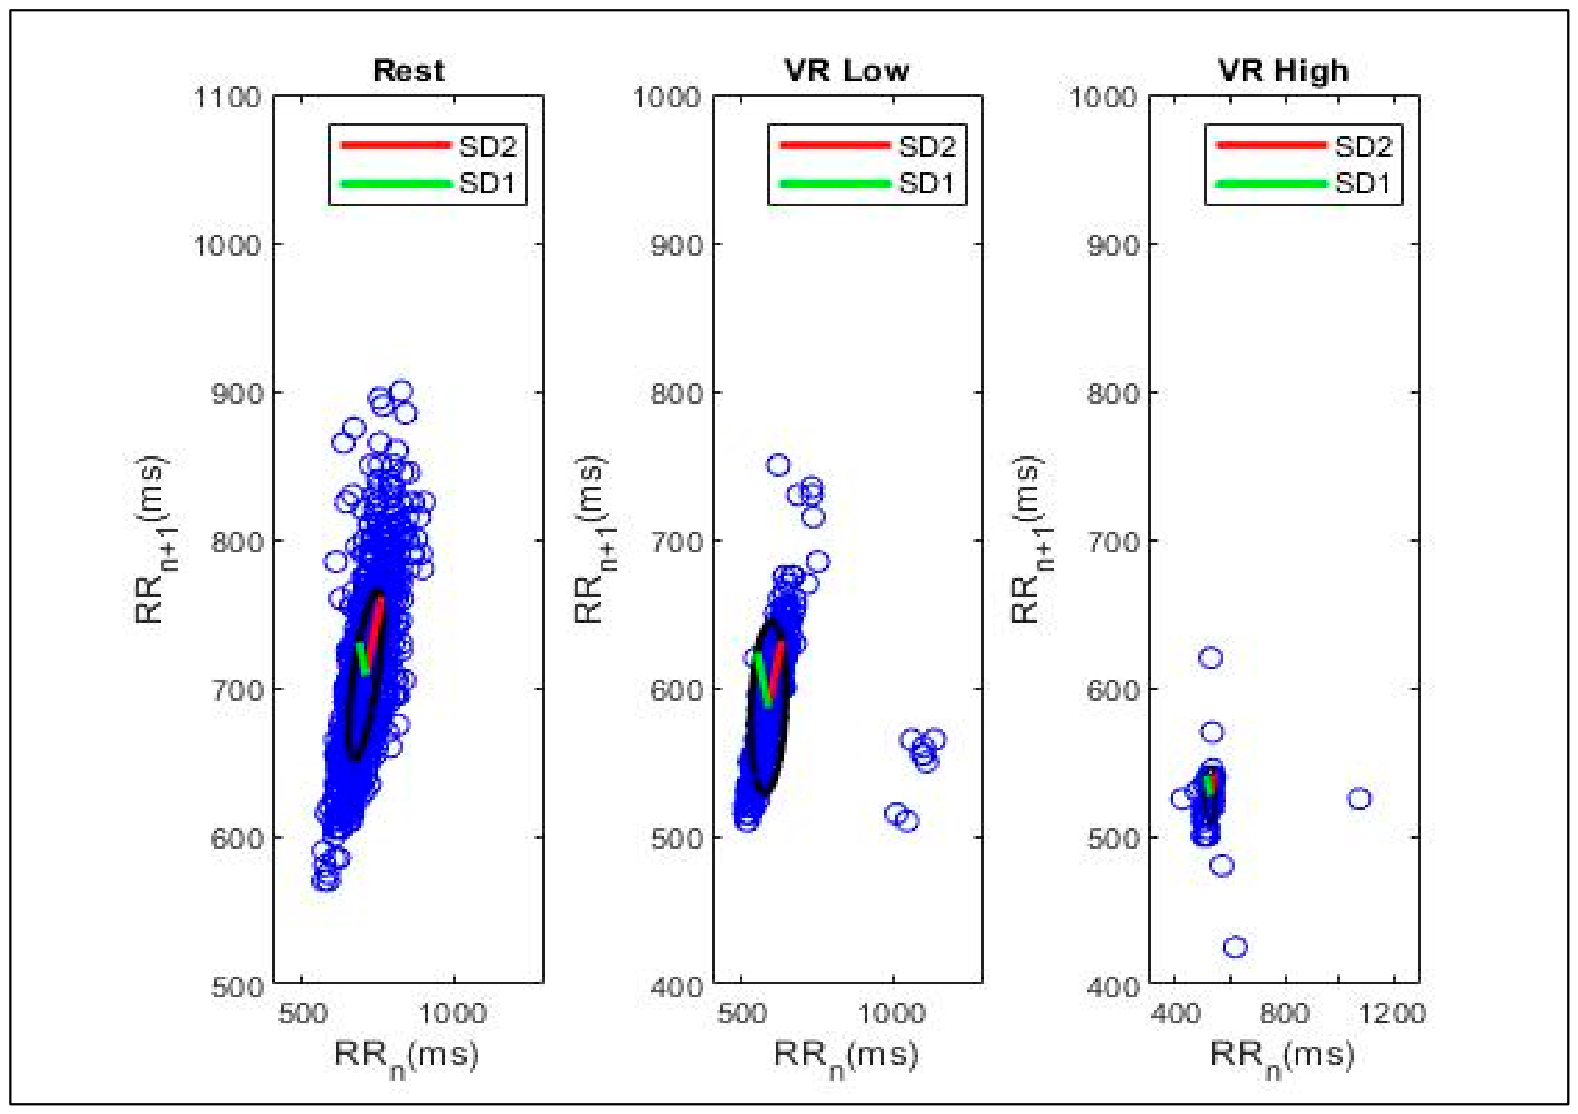
The Poincaré plots (Figure 4) show a clear decrease in point dispersion under the VR conditions, accompanied by reductions in both short-term (SD1) and long-term (SD2) variability. These changes reflect a decrease in cardiac dynamic complexity and a weakening of parasympathetic modulation.
Figure 4.
Poincaré plots of RR intervals for Rest, VR Low, and VR High conditions.
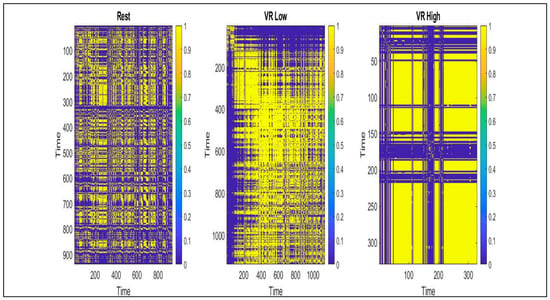
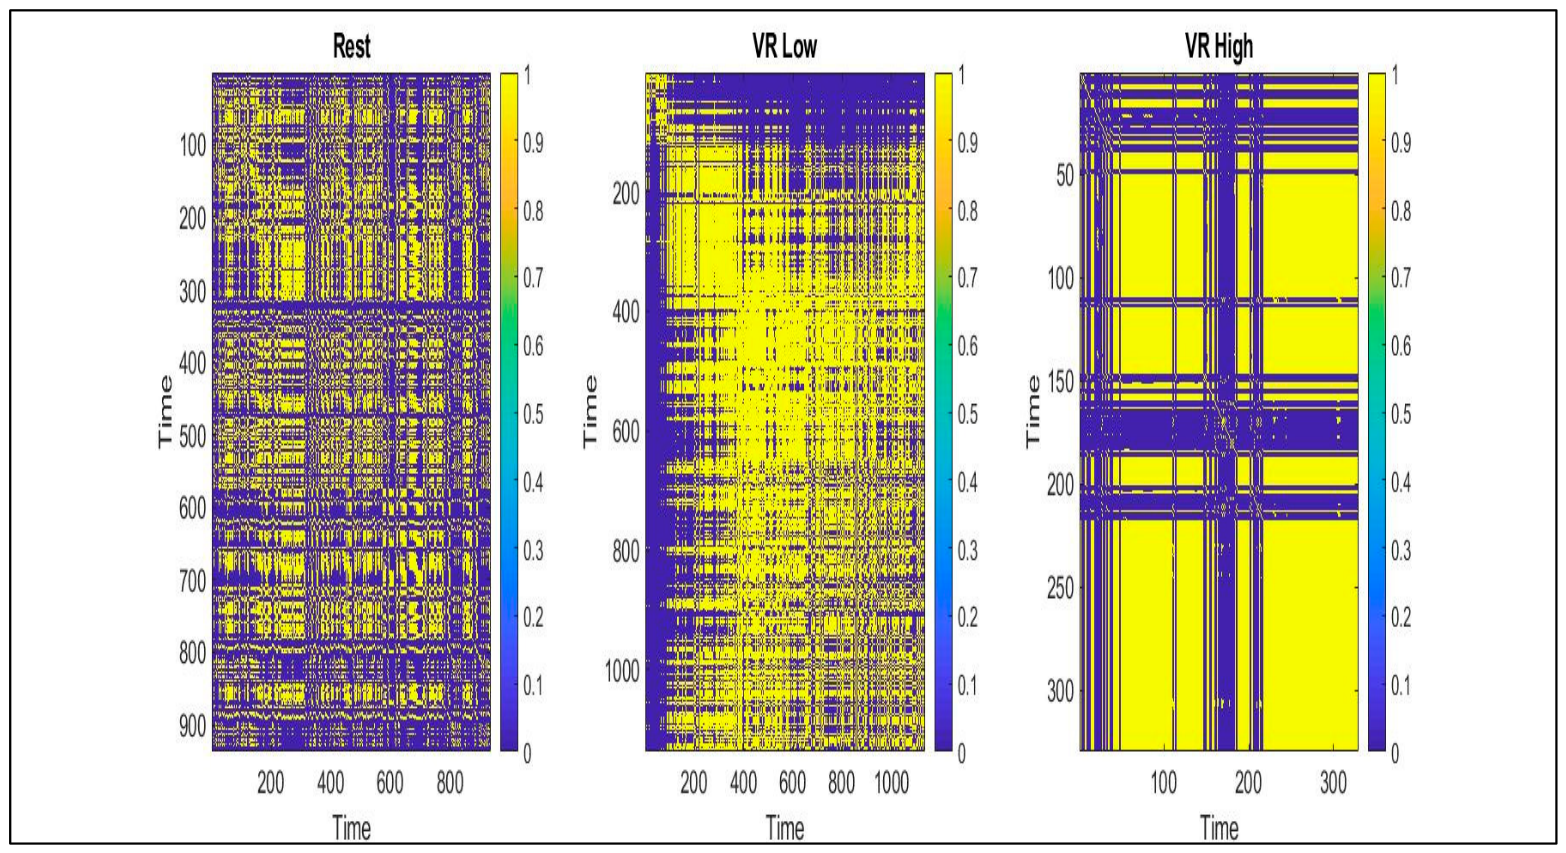
Recurrence analysis (Figure 5) shows an increase in the structural regularity of HRV signals under VR conditions, expressed by higher recurrence and longer deterministic structures. This indicates greater predictability and reduced chaoticity of heart rhythm under mental stress.
Figure 5.
Recurrence plots of RR intervals for Rest, VR Low, and VR High conditions.
Taken together, nonlinear and visual analyses show a consistent decrease in complexity and increase in regularity of cardiac dynamics with increasing degree of virtual immersion.
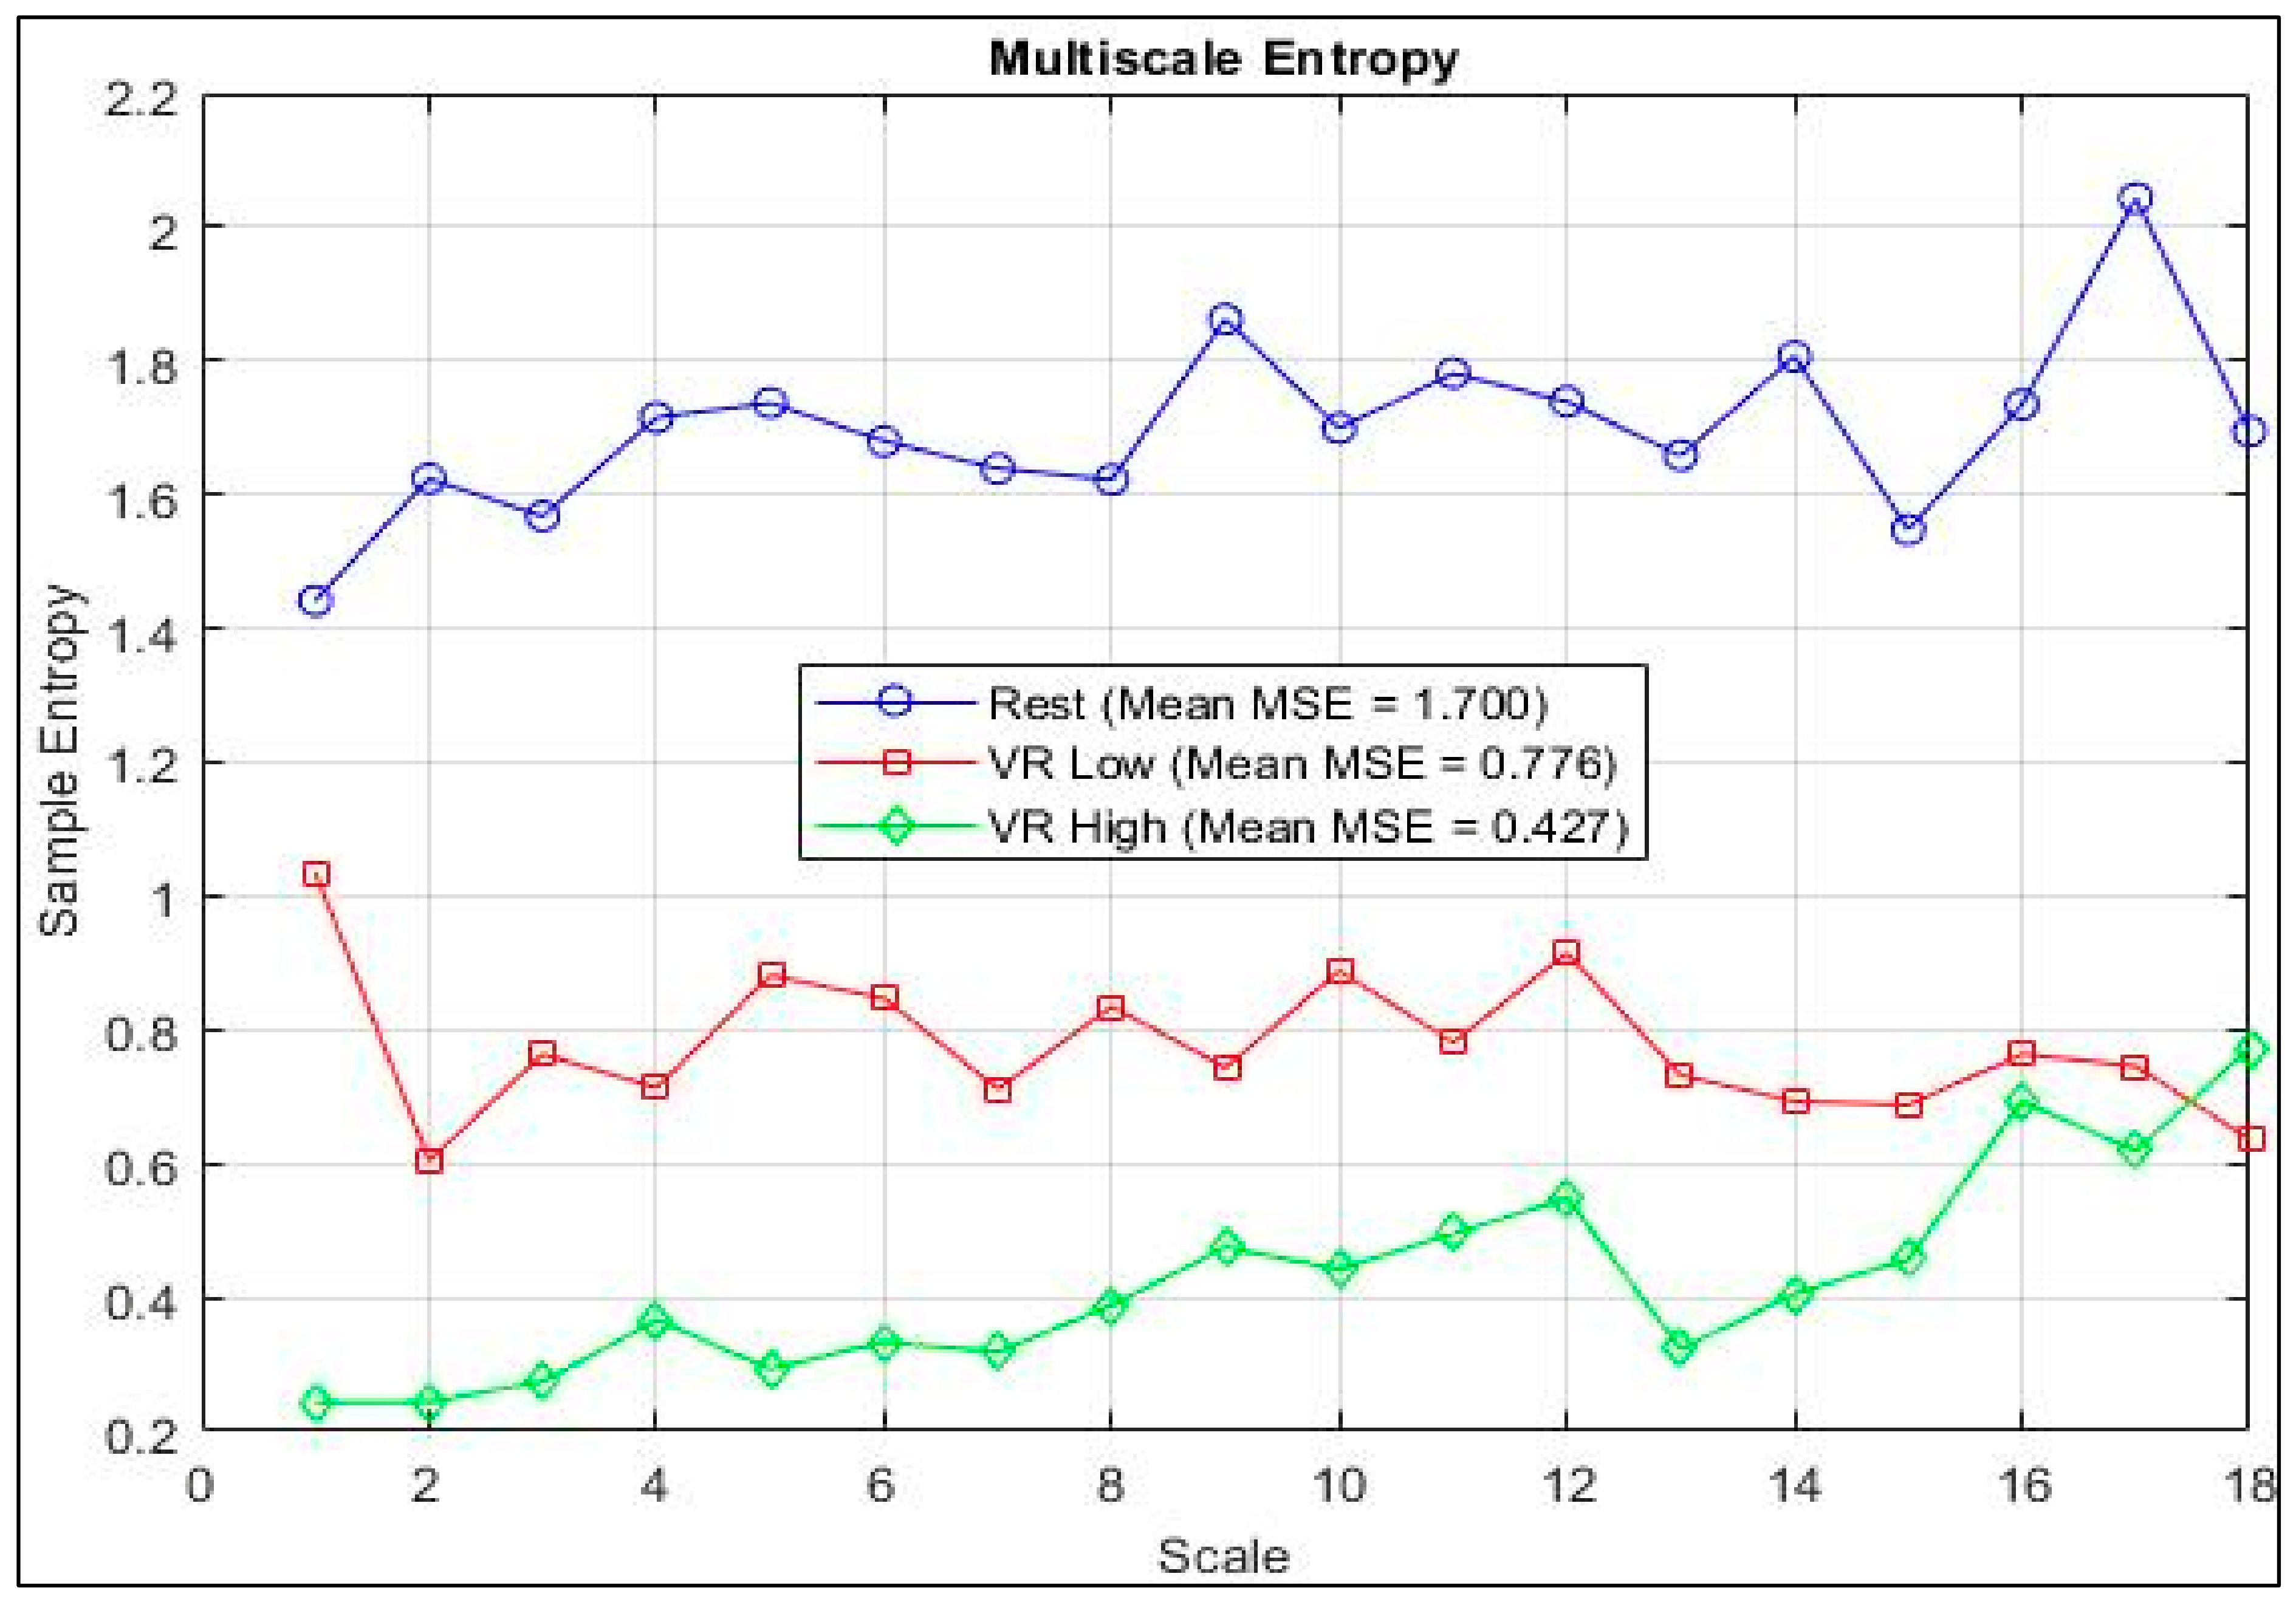
For additional assessment of the multiscale complexity of the heart rhythm, Multiscale Entropy analysis was applied, based on the dependence between Sample Entropy and the scale factor. The method allows assessment of the dynamic complexity of HRV signals across different time scales and provides information on the adaptability of the autonomic nervous system.
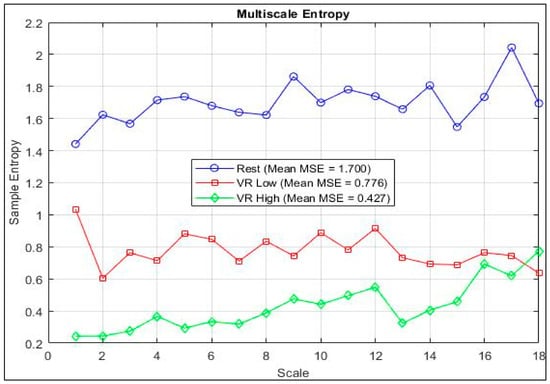
The results (Figure 6) show a clear dependence of entropy on scale, with higher Sample Entropy values across a wide range of scales in the resting state, reflecting higher complexity and better physiological adaptability. Under VR conditions, a decrease in entropy is observed, with this effect most pronounced at high degrees of virtual immersion.
Figure 6.
MSE of RR intervals for Rest, VR Low, and VR High conditions.
The decrease in MSE values at higher scales indicates reduced multiscale complexity of the heart rhythm and a limited ability of the autonomic nervous system to adapt to mental stress.
Overall, the MSE analysis confirms the results of the nonlinear and recurrent methods and further demonstrates a decrease in physiological complexity with increasing levels of virtual-induced load.
4.4. Random Forest Classification Analysis
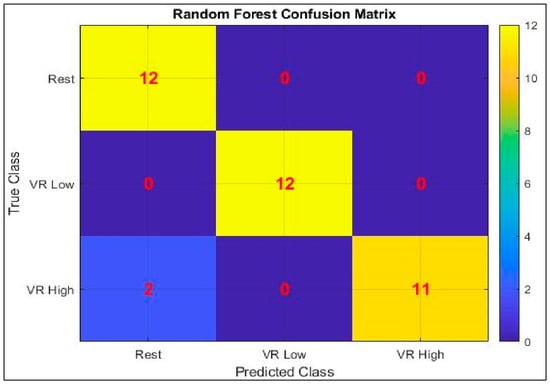
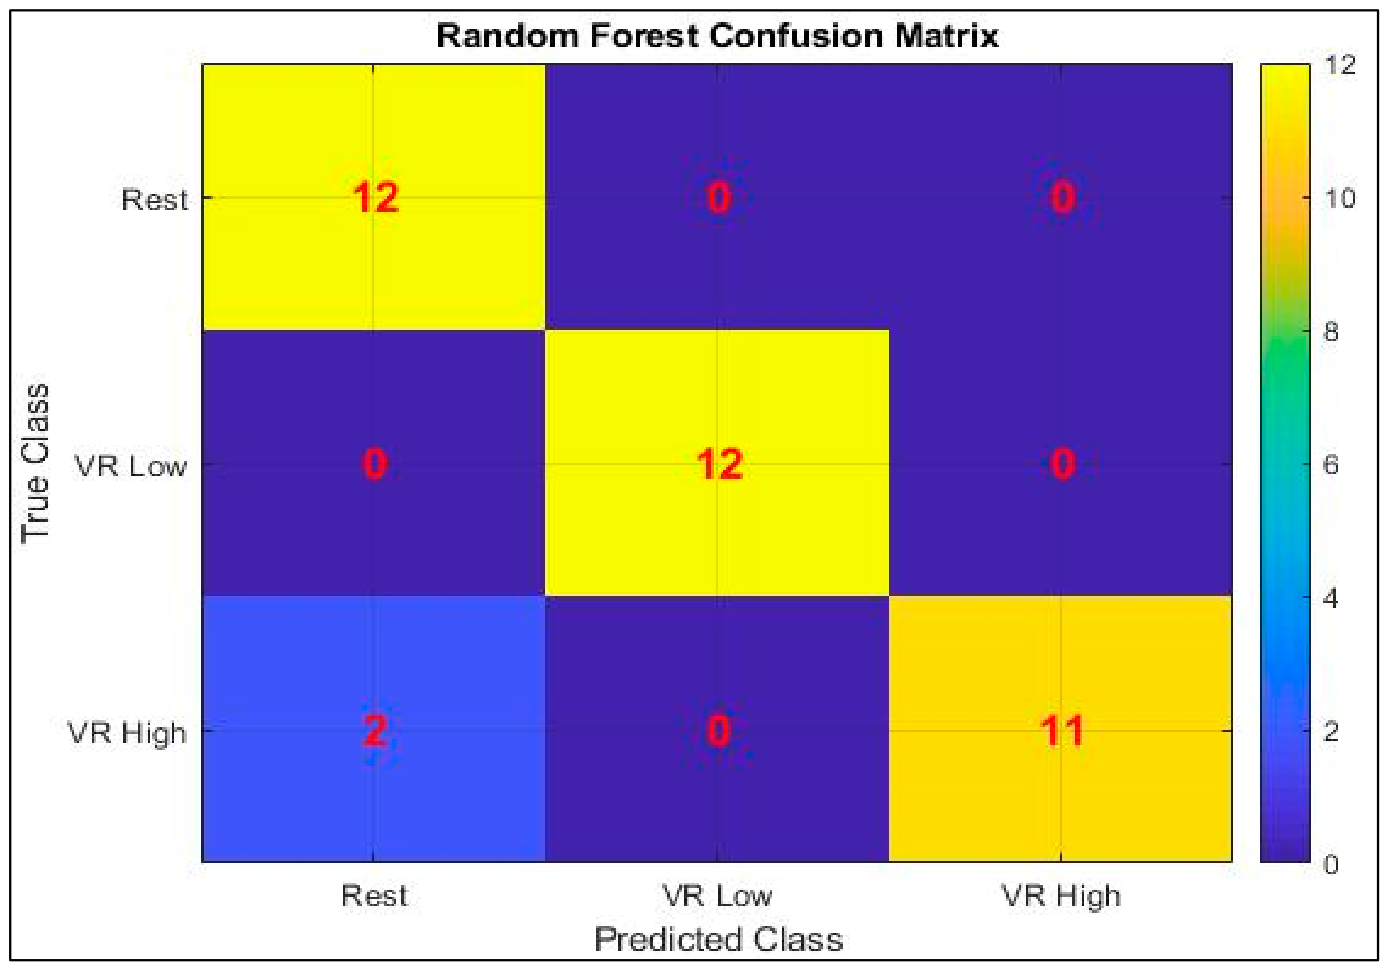
The confusion matrix (Figure 7) shows high classification accuracy between the three experimental conditions—rest, VR with low immersion and VR with high immersion. The most pronounced distinction is observed between the rest state and high-immersion VR, confirming clear physiological differences between these conditions.
Figure 7.
Confusion Matrix of the Random Forest model.
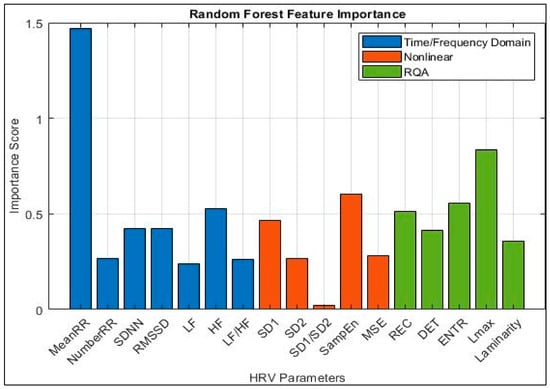
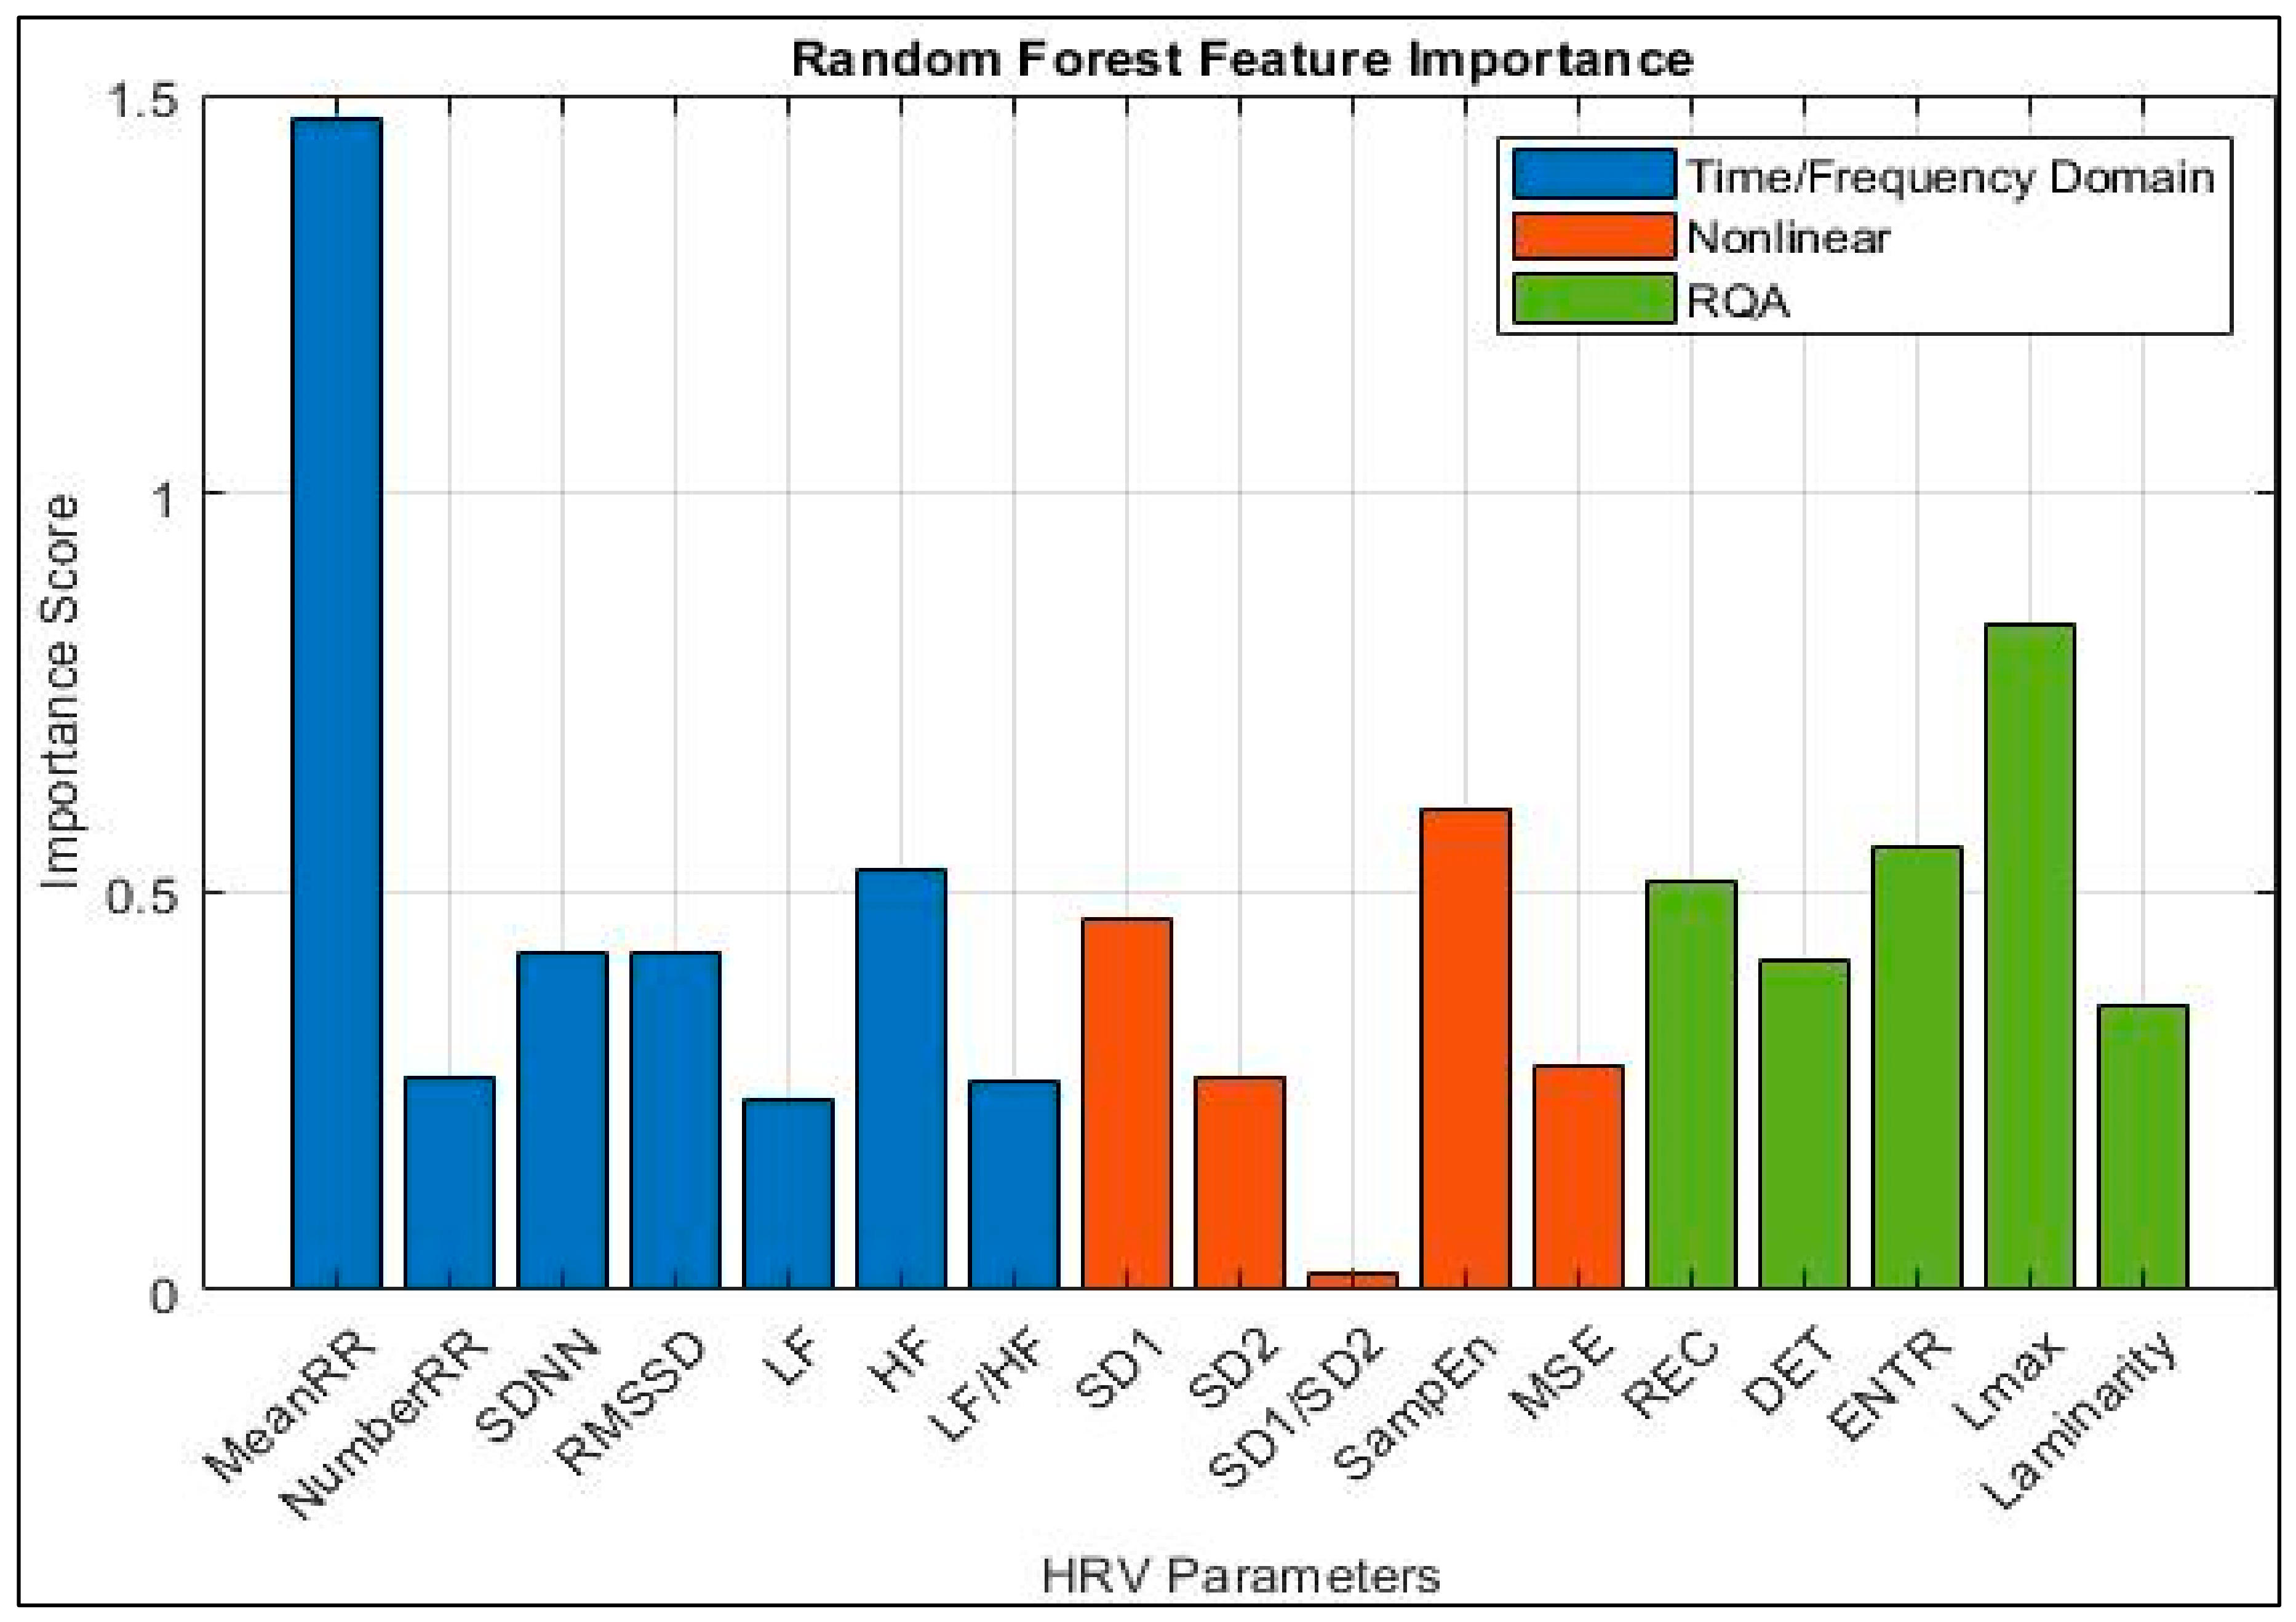
The analysis of feature significance (Figure 8) shows a clear distribution of the contributions of the different HRV parameters to the classification process. The highest significance is observed for the time parameter MeanRR, which indicates its key role in distinguishing between the experimental conditions. In the time and frequency domains, parameters such as RMSSD, SDNN, and HF also demonstrate high prognostic value, underscoring the importance of parasympathetic activity in the classification of physiological conditions. Nonlinear features, including SD1, Sample Entropy, and Multiscale Entropy, further contribute to the model by reflecting changes in heart rhythm complexity across different levels of virtual immersion. RQA features (REC, DET, ENTR and Lmax) also show significant contributions, with Lmax and ENTROPY in particular highlighting the importance of structural regularity and the complexity of the system dynamics. Overall, the results show that the most informative features for classification come from a combination of time-domain and nonlinear HRV features, confirming the effectiveness of the multimodal approach.
Figure 8.
Feature Importance of the Random Forest model.
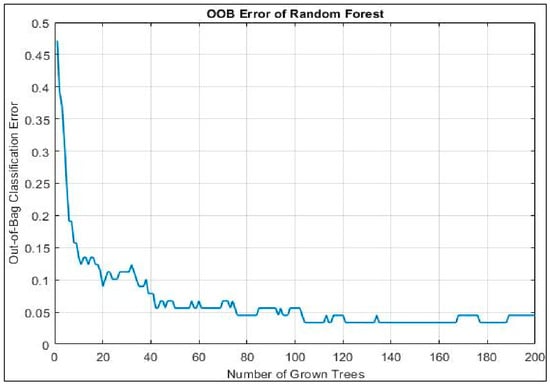
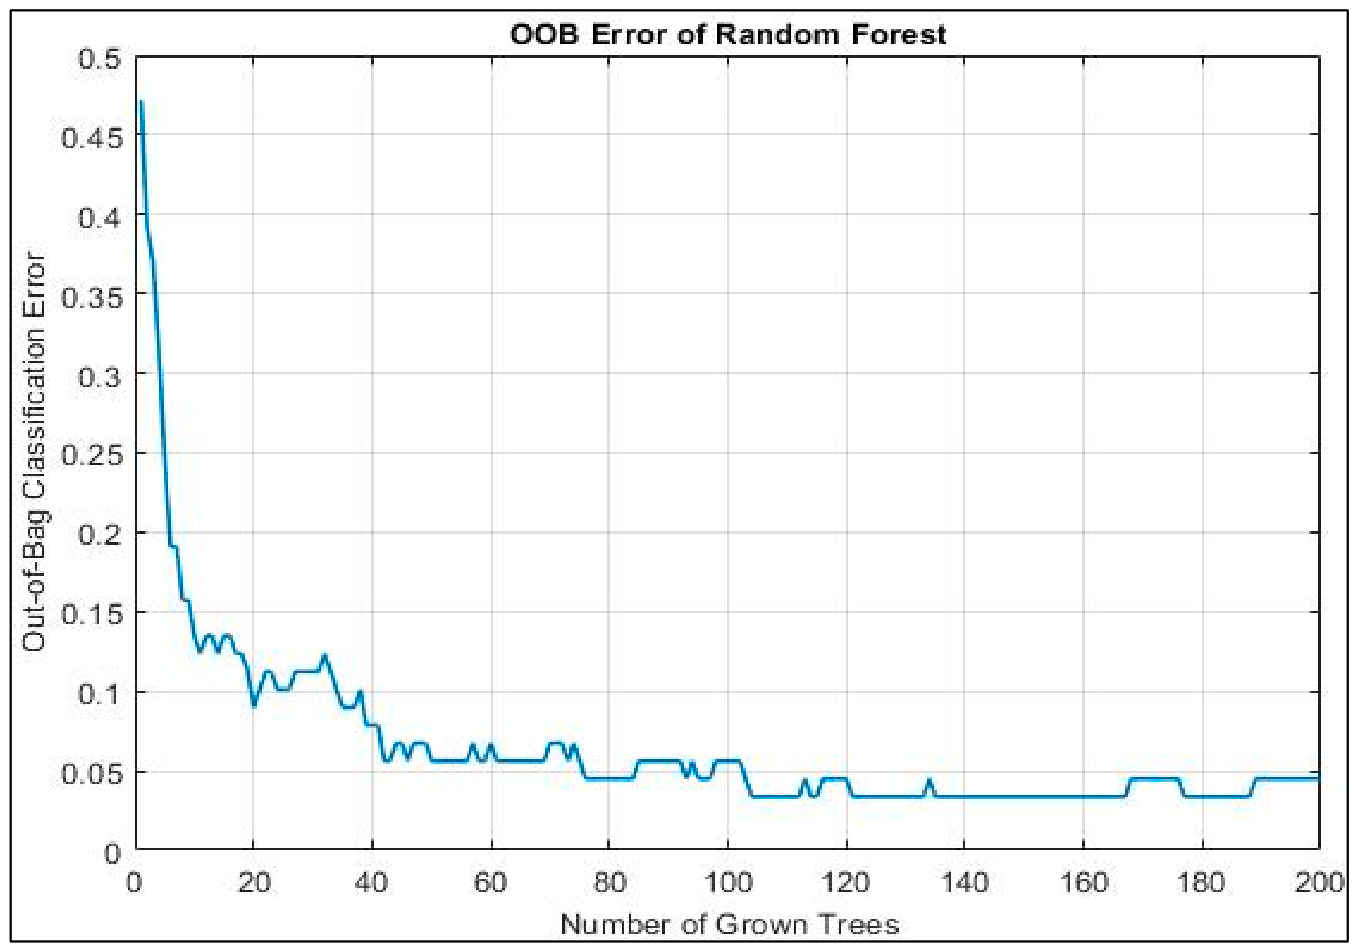
The out-of-bag (OOB) error curve (Figure 9) indicates stable model performance during training and suggests no obvious evidence of overfitting. However, the OOB estimate should be interpreted together with the independent test-set results, particularly given the relatively small sample size.
Figure 9.
Out-of-Bag Classification Error of the Random Forest model.
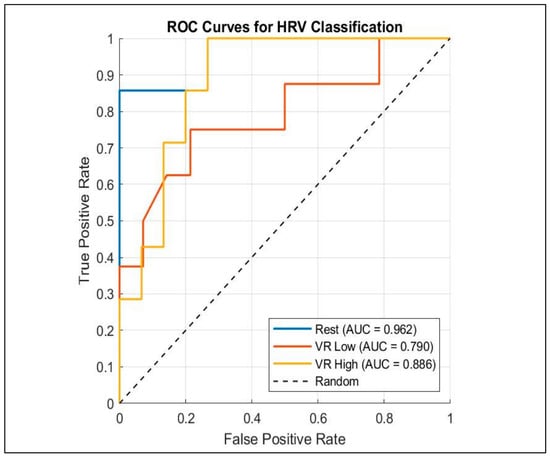
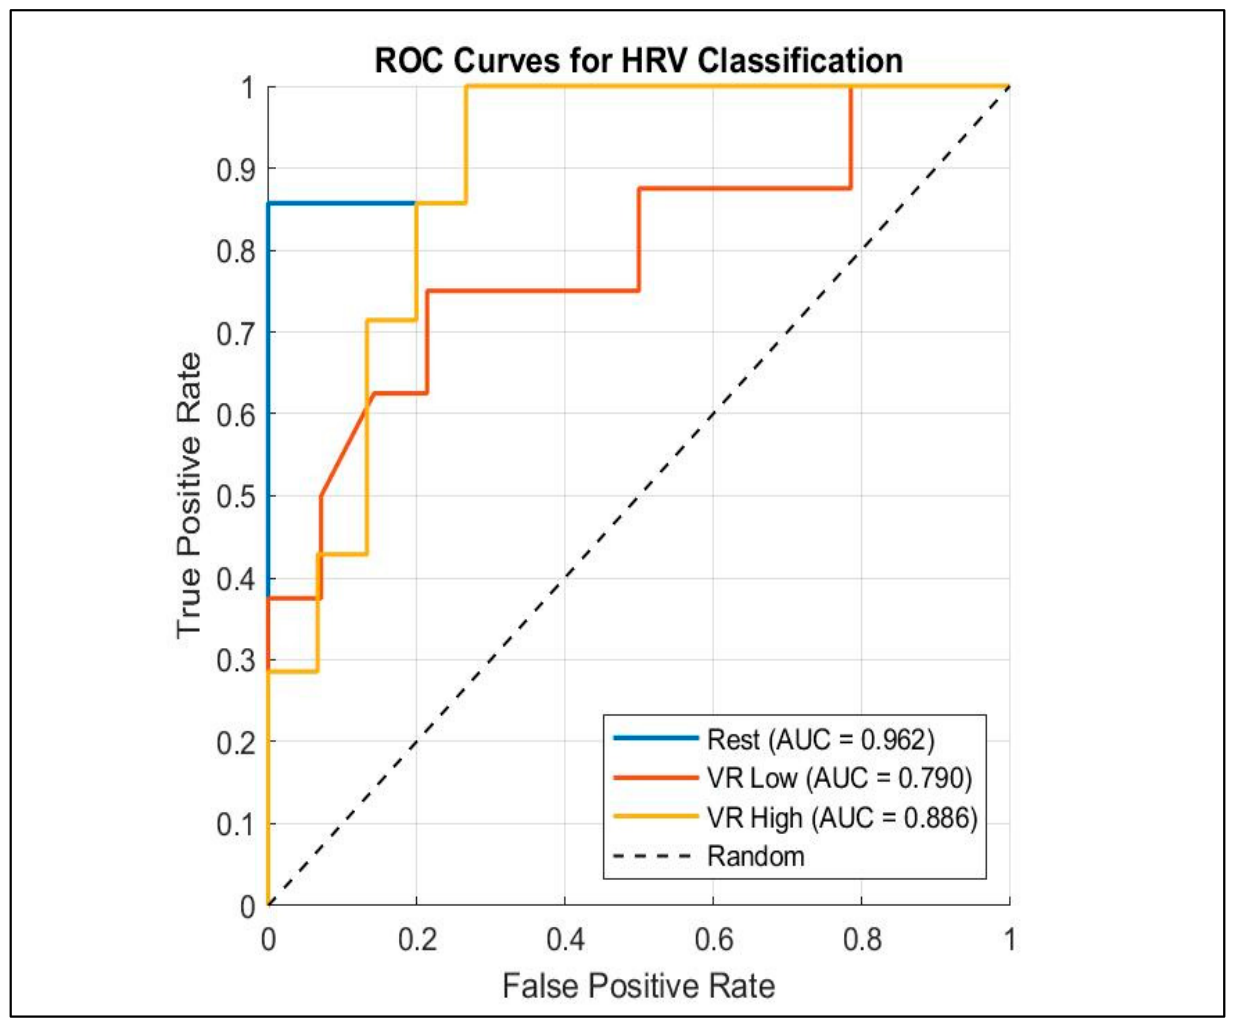
The ROC analysis (Figure 10), together with the summary classification performance metrics presented in Table 3, demonstrates the model’s high discriminative ability, with high AUC values for all classes.
Figure 10.
ROC curves of the Random Forest model for HRV classification.
Table 3.
ROC and classification performance metrics of the Random Forest model.
5. Discussion
The results obtained indicate that virtual reality provides an effective experimental platform for investigating autonomic physiological responses under controlled conditions. The complex analysis of heart rate variability, based on linear, nonlinear, visual, and machine learning methods, indicates pronounced changes in autonomic regulation across different levels of virtual immersion. The most pronounced physiological responses are observed under conditions of high virtual immersion, suggesting increased autonomic activation accompanied by reduced parasympathetic modulation.
Time-domain analysis shows a statistically significant decrease in MeanRR, SDNN, and RMSSD during VR exposure, particularly under VR High conditions. These changes reflect reduced overall heart rate variability and reduced short-term parasympathetic modulation, findings commonly associated with increased physiological activation and cognitive demand. The observed trend towards a progressive decrease in HRV parameters from the resting state to the VR Low and VR High conditions suggests that the degree of virtual immersion directly affects autonomic nervous regulation and physiological adaptability.
The frequency-domain findings provide additional evidence of altered autonomic regulation during VR exposure. The observed increase in the LF component and LF/HF ratio, together with a decrease in the HF component, suggests alterations in autonomic cardiac regulation during VR exposure. Although these changes are commonly associated with increased physiological activation and stress-related responses, LF/HF should not be interpreted as a direct measure of sympathovagal balance or sympathetic dominance, particularly because respiratory activity was not controlled in the present study. The more pronounced effects observed under VR High conditions may indicate that a higher degree of virtual immersion is associated with increased sensory and cognitive demands and greater autonomic activation.
These findings are in agreement with several previous studies reporting decreased heart rate variability and increased sympathetic activity during VR-induced mental stress [51]. Similar trends towards reductions in SDNN, RMSSD, and the HF component, as well as increases in the LF/HF ratio, were observed under cognitive load and in immersive virtual environments. This confirms that virtual reality can be successfully used as an experimental model to study autonomic nervous system regulation under stressful conditions.
Nonlinear and visual methods provide additional information about the complex dynamics of heart rate that classical linear HRV indicators cannot fully capture. Histogram analysis shows a gradual narrowing of the distribution of RR intervals under VR conditions, indicating reduced variability and increased regularity of heart rate. Similarly, Poincaré diagrams demonstrate a clear decrease in point scatter and reduction in ellipsoidal structure under VR exposure. A decrease in the values of the parameters SD1 and SD2 reflects limitations in both short- and long-term heart rate variability, which is consistent with reduced autonomic flexibility during VR exposure.
Recurrence analysis shows increased structural regularity and determinism of HRV signals under VR conditions. Increased values of REC, DET, Lmax and Laminarity indicate higher predictability and lower complexity of heart rate dynamics during VR exposure. The decrease in entropy indices further confirms the reduced nonlinear complexity and limited adaptability of the autonomic nervous system. The results obtained are consistent with the concept that stressful physiological states are characterised by reduced dynamic complexity and increased regularity of biological signals.
Comparable observations have been described in publications devoted to nonlinear HRV analysis and recurrence-based methods in mental stress [60,61,62]. Previous studies have shown that recurrence plot and entropy-based indices are sensitive to changes in autonomic regulation and can successfully distinguish different levels of physiological load. The results obtained in the present study confirm these observations and further demonstrate the applicability of visual approaches in the analysis of VR-induced physiological responses.
Multiscale entropy analysis provides further insight into these changes. In the resting state, higher entropy values are observed across a wide range of time scales, reflecting greater physiological complexity and better adaptability of the autonomic nervous system. Under VR conditions, a clear decrease in entropy is observed, especially at VR High exposure, indicating a reduction in the multiscale complexity of the heart rhythm. Since physiologically healthy systems are typically characterised by high complexity and adaptability, the observed decrease in MSE may indicate limited autonomic flexibility during VR exposure.
An important aspect of the present study is the integration of a machine learning approach with classical HRV analysis. The Random Forest model demonstrated promising classification performance in distinguishing between resting-state and physiological states corresponding to the different experimental conditions. The analysis of the confusion matrix and ROC curves showed good discriminative ability for classifying VR High conditions, in which physiological changes are most pronounced. These results suggest the possibility of using HRV-based features and ensemble machine learning algorithms for automated recognition of stress-induced physiological states.
Feature importance analysis shows that both classical and nonlinear HRV indicators contribute significantly to the model’s classification performance. MeanRR, RMSSD, HF, SampEn, and the recurrence-based indicators REC, ENTR, and Lmax are the most informative features. This highlights the importance of a combined approach including both linear and nonlinear measures of autonomic regulation. The relatively lower contribution of some parameters, such as SD1/SD2, suggests limited discriminative ability in distinguishing different levels of virtual immersion.
Our machine learning results are comparable with previous reports demonstrating that Random Forest classifiers can distinguish stress-related physiological states using HRV features. Unlike most previous studies, the present work combines conventional HRV indices with nonlinear and visual-mathematical analyses, providing a more comprehensive assessment of autonomic responses during VR exposure [63,64]. The observed differences between VR Low and VR High conditions are also related to the specific characteristics of the stereoscopic technologies used. Systems with a high degree of immersion usually require more intensive visual processing, greater concentration, and higher cognitive load, which can lead to visual fatigue, increased attentional demand, and autonomic activation. In this context, the results support the hypothesis that the level of virtual immersion significantly affects the user’s psychophysiological responses.
Despite the promising results, the present study has some limitations. The sample is relatively small and primarily comprises young, healthy volunteers, which may limit the generalizability of the results to broader populations. Analyses performed using recurrence plots and entropy methods are sensitive to parameter choices, which may affect quantitative results.
Future studies will include larger, more diverse groups of participants, multimodal physiological monitoring, and standardised psychological questionnaires to assess subjective stress and virtual immersion. Additionally, the use of deep learning and explainable artificial intelligence approaches may improve the automated assessment and modelling of psychophysiological responses in virtual environments.
In conclusion, the results demonstrate that virtual reality provides an effective experimental platform for investigating autonomic physiological responses under different levels of virtual immersion. The combined application of linear HRV indicators, nonlinear methods, visual analysis and machine learning techniques provides a comprehensive framework for assessing changes in autonomic cardiac regulation at different levels of virtual immersion. The proposed approach has potential for use in the development of adaptive VR systems, intelligent monitoring systems of autonomic physiological responses, and clinical applications in mental health, neurorehabilitation, and personalised digital medicine.
6. Limitations and Future Work
This study has several limitations. First, the sample size was relatively small and included only healthy volunteers within a limited age range, which restricts the generalizability of the findings to broader populations. Second, psychophysiological assessment relied primarily on heart rate variability analysis without incorporating validated psychological questionnaires to evaluate perceived stress. Third, the LF/HF ratio should be interpreted in the context of its limitations, as its role as a direct marker of sympathovagal balance remains a matter of discussion in the contemporary literature. In the present study, LF/HF was considered as an additional HRV index rather than a specific marker of sympathetic and parasympathetic activity. Fourth, the study did not include an additional quantitative assessment of VR presence and simulator sickness through questionnaires, which could have complemented the assessment of participants’ subjective perceptions of the VR environment. Fifth, the machine learning model was trained and validated on a limited dataset, and therefore its generalization capability requires further investigation.
Future work will focus on expanding the study population by including participants from different age groups as well as individuals with autonomic nervous system disorders. The integration of standardized psychological questionnaires together with additional physiological signals, such as electroencephalography (EEG), and respiratory parameters, is expected to provide a more comprehensive assessment of stress-related psychophysiological responses. Furthermore, advanced machine learning and deep learning algorithms will be investigated to improve classification accuracy, robustness, and the feasibility of real-time psychophysiological state assessment.
7. Conclusions
The present study demonstrates that virtual reality. provides a powerful and reliable experimental platform for investigating autonomic physiological responses under controlled conditions. The results indicate that increasing the degree of virtual immersion is associated with systematic and consistent changes in autonomic nervous regulation, expressed in reduced heart rate variability, reduced parasympathetic activity and increased autonomic activation accompanied by reduced parasympathetic modulation.
Combined analysis of HRV using linear, nonlinear and visual methods reveals a consistent reduction in physiological complexity during VR exposure. The observed narrowing of RR distributions, reduction in Poincaré parameters (SD1, SD2), increased regularity in the recurrence structure, and decreased multiscale entropy unambiguously indicate reduced adaptability of the autonomic nervous system during VR exposure.
A significant contribution of the present work is the evidence that nonlinear metrics (Recurrence Quantification Analysis and Multiscale Entropy) provide a more sensitive and informative assessment of VR-related changes in autonomic cardiac regulation compared to classical linear metrics. These results confirm that the physiological system should be considered a nonlinear, dynamic, and multiscale process that traditional statistical approaches cannot fully characterise.
Additionally, the integration of a machine learning approach—Random Forest—demonstrates the potential in automated classification of the three experimental conditions based on HRV features. The combination of linear and nonlinear HRV features enables reliable differentiation between rest and low and high degrees of virtual immersion, with the most pronounced separation observed at high degrees of immersion. These findings support the potential of artificial intelligence as a tool for objective assessment of autonomic physiological responses during VR exposure.
The obtained results have significant theoretical and practical implications. From a theoretical perspective, they support the hypothesis that VR exposure is associated with reduced physiological complexity and reduced autonomic flexibility. From an applied perspective, the study demonstrates the potential of VR as an experimental and diagnostic platform for developing adaptive monitoring systems, supporting the objective monitoring of autonomic physiological responses, and supporting personalised interventions. In summary, the proposed integrated framework—including virtual reality, multidimensional HRV analysis, and machine learning—provides a comprehensive, sensitive, and scalable approach to studying autonomic physiological responses to virtual reality exposure. This approach opens possibilities for future applications in digital medicine, neurorehabilitation, cognitive science, and intelligent systems for real-time monitoring of autonomic physiological responses.
Supplementary Materials
The following supporting information can be downloaded at https://www.mdpi.com/article/10.3390/technologies14080487/s1: The Supplementary File SuppFigures (PDF file) contains images related to the different versions of the game. The visualization is implemented using passive 3D, active 3D, and VR/AR technologies. For the development of the two versions of the virtual reality game, with low and high immersion, Unity (ver. 2020.3.42f1) and Blender (ver.3.1.2) were used. The following supporting information can be downloaded at https://1drv.ms/b/c/491a59bf2a2eff67/IQCD2JkkHx2QSp-48VQEGttgAY-4c10siHbg9wNMAbPWVtc (accessed on 24 July 2026). The Supplementary File SuppVideos (ZIP archive containing video files) includes videos demonstrating the different versions of the game developed using the following technologies: active 3D visualization (shutter technology), passive 3D visualization (anaglyph technology), passive 3D visualization (polarization technology), immersive VR (side-by-side technology), AR (Mixed Reality/HoloLens 2), and traditional 3D visualization. The following supporting information can be downloaded at https://1drv.ms/u/c/491a59bf2a2eff67/IQBKfgkQJCHHQp12A1BDtuH6ATXnTSlplp4qJnq_4z0DCmo (accessed on 1 August 2026).
Author Contributions
Conceptualization, P.L. and E.G.; methodology, P.L. and E.G.; investigation, P.L.; software, P.L.; data processing and analysis, P.L. and E.G.; writing—original draft preparation, P.L.; writing—review and editing, E.G. All authors have read and agreed to the published version of the manuscript.
Funding
This research was funded by the NATIONAL SCIENCE FUND of Bulgaria (scientific project “Research, mathematical analysis and assessment of the impact of stress on cardiac data”), grant number KP-06-M72/1, 5 December 2023.
Institutional Review Board Statement
The study was approved by the Ethics Committee of the Institute of Robotics at the Bulgarian Academy of Sciences (protocol code 6 and date: 2 November 2024).
Informed Consent Statement
Informed consent was obtained from all subjects involved in the study.
Data Availability Statement
The original contributions presented in the study are included in the article.
Acknowledgments
This work was conducted with the financial assistance of the National Science Fund of Bulgaria project number KP-06-M72/1, 5 December 2023, which is gratefully acknowledged.
Conflicts of Interest
The author declares no conflicts of interest.
References
- Marougkas, A.; Troussas, C.; Krouska, A.; Sgouropoulou, C. Virtual Reality in Education: A Review of Learning Theories, Approaches and Methodologies for the Last Decade. Electronics 2023, 12, 2832. [Google Scholar] [CrossRef] [Scilit]
- Ottogalli, K.; Rosquete, D.; Amundarain, A.; Aguinaga, I.; Borro, D. Flexible Framework to Model Industry 4.0 Processes for Virtual Simulators. Appl. Sci. 2019, 9, 4983. [Google Scholar] [CrossRef] [Scilit]
- Rosas, J.; Palma, L.B.; Antunes, R.A. An Approach for Modeling and Simulation of Virtual Sensors in Automatic Control Systems Using Game Engines and Machine Learning. Sensors 2024, 24, 7610. [Google Scholar] [CrossRef] [Scilit] [PubMed]
- Sáiz-Manzanares, M.C.; Marticorena-Sánchez, R.; Escolar-Llamazares, M.C.; Gonzales-Diez, I.; Velaso-Saiz, R. Using Serious Game Techniques with Health Sciences and Biomedical Engineering Students: An Analysis Using Machine Learning Techniques. Information 2024, 15, 804. [Google Scholar] [CrossRef] [Scilit]
- Fonseca, D.; Cavalcanti, J.; Peña, E.; Valls, V.; Sanches-Sepulveda, M.; Moreira, F.; Navarro, I.; Redondo, E. Mixed Assessment of Virtual Serious Games Applied in Architectural and Urban Design Education. Sensors 2021, 21, 3102. [Google Scholar] [CrossRef] [Scilit] [PubMed]
- Parsons, T.D. Virtual Reality for Enhanced Ecological Validity and Experimental Control in the Clinical, Affective and Social Neurosciences. Front. Hum. Neurosci. 2015, 9, 660. [Google Scholar] [CrossRef] [Scilit] [PubMed]
- Bohil, C.J.; Alicea, B.; Biocca, F.A. Virtual Reality in Neuroscience Research and Therapy. Nat. Rev. Neurosci. 2011, 12, 752–762. [Google Scholar] [PubMed]
- Kanschik, D.; Bruno, R.R.; Wolff, G.; Kelm, M.; Jung, C. Virtual and Augmented Reality in Intensive Care Medicine: A Systematic Review. Ann. Intensive Care 2023, 13, 81. [Google Scholar] [CrossRef] [Scilit] [PubMed]
- Helou, S.; Khalil, N.; Daou, M.; El Helou, E. Virtual Reality for Healthcare: A Scoping Review of Commercially Available Applications for Head-Mounted Displays. Digit. Health 2023, 9, 20552076231178619. [Google Scholar] [CrossRef] [Scilit] [PubMed]
- Saeed, S.; Khan, K.B.; Hassan, M.A.; Qayyum, A.; Salahuddin, S. Review on the Role of Virtual Reality in Reducing Mental Health Diseases Specifically Stress, Anxiety, and Depression. arXiv 2024, arXiv:2407.18918. [Google Scholar] [CrossRef] [Scilit]
- Mugisha, S.; Job, M.; Zoppi, M.; Testa, M.; Molfino, R. Computer-Mediated Therapies for Stroke Rehabilitation: A Systematic Review and Meta-Analysis. arXiv 2024, arXiv:2409.20260. [Google Scholar] [CrossRef] [Scilit]
- Marozau, A.; Karpowicz, B.; Kowalewski, T.; Zinevych, P.; Stawski, W.; Kuzdraliński, A.; Kopeć, W. Towards Effective Immersive Technologies in Medicine: Potential and Future Applications Based on VR, AR, XR and AI Solutions. arXiv 2025, arXiv:2507.19466. [Google Scholar] [CrossRef] [Scilit]
- Kamińska, D.; Smółka, K.; Zwoliński, G. Detection of Mental Stress through EEG Signal in Virtual Reality Environment. Electronics 2021, 10, 2840. [Google Scholar] [CrossRef] [Scilit]
- Robbemond, L.M.; Noordzij, M.L.; van Driel, C.M.G.; Veling, W. Physiological Responses to Virtual Reality-Based Stress Regulation and Relaxation Interventions: A Systematic Review. Stress Health 2026, 42, e70164. [Google Scholar] [CrossRef] [Scilit] [PubMed]
- Kobayashi, T.; Jadram, N.; Ninomiya, S.; Suzuki, K.; Sugaya, M. A Pilot Study on Emotional Equivalence Between VR and Real Spaces Using EEG and Heart Rate Variability. Sensors 2025, 25, 4097. [Google Scholar] [CrossRef] [Scilit] [PubMed]
- Velana, M.; Sobieraj, S.; Digutsch, J.; Rinkenauer, G. The Advances of Immersive Virtual Reality Interventions for the Enhancement of Stress Management and Relaxation among Healthy Adults: A Systematic Review. Appl. Sci. 2022, 12, 7309. [Google Scholar] [CrossRef] [Scilit]
- Widjaja, D.; Orini, M.; Vlemincx, E.; Van Huffel, S. Cardiorespiratory Dynamic Response to Mental Stress: A Multivariate Time-Frequency Analysis. Comput. Math. Methods Med. 2013, 2013, 451857. [Google Scholar] [CrossRef] [Scilit] [PubMed]
- Selzer, M.N.; Castro, S.M. A Methodology for Generating Virtual Reality Immersion Metrics Based on System Variables. J. Comput. Sci. Technol. 2023, 23, e08. [Google Scholar] [CrossRef] [Scilit]
- Ojeda de Ocampo, F.; Hernández-Melgarejo, G.; Ramírez-Treviño, A.; Fuentes-Aguilar, R.Q. Presence Assessment in Virtual Reality: A Systematic Literature Review. Appl. Sci. 2026, 16, 3102. [Google Scholar] [CrossRef] [Scilit]
- Niehorster, D.C.; Li, L.; Lappe, M. The Accuracy and Precision of Position and Orientation Tracking in the HTC Vive Virtual Reality System for Scientific Research. I-Perception 2017, 8, 2041669517708205. [Google Scholar] [CrossRef] [Scilit] [PubMed]
- Monica, R.; Aleotti, J. Evaluation of the Oculus Rift S Tracking System in Room Scale Virtual Reality. Virtual Real. 2022, 26, 1335–1345. [Google Scholar] [CrossRef] [Scilit]
- Tusher, H.M.; Mallam, S.; Nazir, S. A Systematic Review of Virtual Reality Features for Skill Training. Technol. Knowl. Learn. 2024, 29, 843–878. [Google Scholar] [CrossRef] [Scilit]
- Xiong, J.; Hsiang, E.-L.; He, Z.; Zhan, T.; Wu, S.-T. Augmented Reality and Virtual Reality Displays: Emerging Technologies and Future Perspectives. Light Sci. Appl. 2021, 10, 216. [Google Scholar] [CrossRef] [Scilit] [PubMed]
- Gilson, S.J.; Fitzgibbon, A.W.; Glennerster, A. Quantitative Analysis of Accuracy of an Inertial/Acoustic 6DOF Tracking System in Motion. J. Neurosci. Methods 2006, 154, 175–182. [Google Scholar] [CrossRef] [Scilit] [PubMed]
- Oh, H.; Son, W. Cybersickness and Its Severity Arising from Virtual Reality Content: A Comprehensive Study. Sensors 2022, 22, 1314. [Google Scholar] [CrossRef] [Scilit] [PubMed]
- Kourtesis, P.; Papadopoulou, A.; Roussos, P. Cybersickness in Virtual Reality: The Role of Individual Differences, Its Effects on Cognitive Functions and Motor Skills, and Intensity Differences during and after Immersion. Virtual Worlds 2024, 3, 62–93. [Google Scholar] [CrossRef] [Scilit]
- Veličković, P.; Milovanović, M. Improvement of the Interaction Model Aimed to Reduce the Negative Effects of Cybersickness in VR Rehab Applications. Sensors 2021, 21, 321. [Google Scholar] [CrossRef] [Scilit] [PubMed]
- Saredakis, D.; Szpak, A.; Birckhead, B.; Keage, H.A.D.; Rizzo, A.; Loetscher, T. Factors Associated with Virtual Reality Sickness in Head-Mounted Displays: A Systematic Review and Meta-Analysis. Front. Hum. Neurosci. 2020, 14, 96. [Google Scholar] [CrossRef] [Scilit] [PubMed]
- Krokos, E.; Varshney, A. Quantifying VR Cybersickness Using EEG. Virtual Real. 2022, 26, 77–89. [Google Scholar] [CrossRef] [Scilit]
- Malik, M.; Camm, A.J.; Bigger, J.T.; Breithardt, G.; Cerutti, S.; Cohen, R.J.; Coumel, P.; Fallen, E.L.; Kennedy, H.L.; Kleiger, R.E.; et al. Heart Rate Variability: Standards of Measurement, Physiological Interpretation, and Clinical Use. Eur. Heart J. 1996, 17, 354–381. [Google Scholar] [CrossRef] [Scilit]
- Rabkin, S.W. Artificial Intelligence in the Assessment of Heart Rate Variability as an Instrument to Understand the Connection Between Psychologic and Psychiatric Conditions and the Heart. Bioengineering 2026, 13, 554. [Google Scholar] [CrossRef] [Scilit] [PubMed]
- Ernst, G. Heart Rate Variability; Springer: London, UK, 2014. [Google Scholar] [CrossRef] [Scilit]
- Shaffer, F.; Ginsberg, J.P. An Overview of Heart Rate Variability Metrics and Norms. Front. Public Health 2017, 5, 258. [Google Scholar] [CrossRef] [Scilit] [PubMed]
- Al Abdi, R.; AlKaabi, S.; Elsifi, S.; Yousaf, J. Mental Stress Detection Using Physiological Sensors and Artificial Intelligence: A Review. Sensors 2026, 26, 1616. [Google Scholar] [CrossRef] [Scilit] [PubMed]
- Kamińska, D. Recognition of Human Mental Stress Using Machine Learning: A Case Study on Refugees. Electronics 2023, 12, 3468. [Google Scholar] [CrossRef] [Scilit]
- Doborjeh, M.; Doborjeh, Z.; Kasabov, N.; Barati, M.; Wang, G.Y. Deep Learning of Explainable EEG Patterns as Dynamic Spatiotemporal Clusters and Rules in a Brain-Inspired Spiking Neural Network. Sensors 2021, 21, 4900. [Google Scholar] [CrossRef] [Scilit] [PubMed]
- Chaddad, A.; Wu, Y.; Kateb, R.; Bouridane, A. Electroencephalography Signal Processing: A Comprehensive Review and Analysis of Methods and Techniques. Sensors 2023, 23, 6434. [Google Scholar] [CrossRef] [Scilit] [PubMed]
- Lekkas, G.; Vrochidou, E.; Papakostas, G.A. Time–Frequency Transformations for Enhanced Biomedical Signal Classification with Convolutional Neural Networks. BioMedInformatics 2025, 5, 7. [Google Scholar] [CrossRef] [Scilit]
- Martinek, R.; Ladrova, M.; Sidikova, M.; Jaros, R.; Behbehani, K.; Kahankova, R.; Kawala-Sterniuk, A. Advanced Bioelectrical Signal Processing Methods: Past, Present, and Future Approach—Part III: Other Biosignals. Sensors 2021, 21, 6064. [Google Scholar] [CrossRef] [Scilit] [PubMed]
- Lebamovski, P.; Gospodinova, E. Investigating the Impact of Mental Stress on Electrocardiological Signals through the Use of Virtual Reality. Technologies 2024, 12, 159. [Google Scholar] [CrossRef] [Scilit]
- Lebamovski, P.; Gospodinova, E. Investigating Stress During a Virtual Reality Game Through Fractal and Multifractal Analysis of Heart Rate Variability. Appl. Syst. Innov. 2025, 8, 16. [Google Scholar] [CrossRef] [Scilit]
- Lebamovski, P. Exploring Heart Rate Variability and Mental Effects of Gameplay in Virtual Reality and 3D Morphing Animation. Technologies 2025, 13, 157. [Google Scholar] [CrossRef] [Scilit]
- Lebamovski, P.; Gospodinova, E. Impact of Stereoscopic Technologies on Heart Rate Variability in Extreme VR Gaming Conditions. Technologies 2025, 13, 545. [Google Scholar] [CrossRef] [Scilit]
- Lebamovski, P.; Gospodinova, E.; Georgieva-Tsaneva, G. Effects of Virtual and Mixed Reality Environments on Heart Rate Dynamics During High-Intensity Gaming. In Proceedings of the 2025 9th International Symposium on Multidisciplinary Studies and Innovative Technologies (ISMSIT), Ankara, Turkiye, 14–16 November 2025. [Google Scholar] [CrossRef] [Scilit]
- Pham, T.; Lau, Z.J.; Chen, S.H.A.; Makowski, D. Heart Rate Variability in Psychology: A Review of HRV Indices and an Analysis Tutorial. Sensors 2021, 21, 3998. [Google Scholar] [CrossRef] [Scilit] [PubMed]
- Agorastos, A.; Mansueto, A.C.; Hager, T.; Pappi, E.; Gardikioti, A.; Stiedl, O. Heart Rate Variability as a Translational Dynamic Biomarker of Altered Autonomic Function in Health and Psychiatric Disease. Biomedicines 2023, 11, 1591. [Google Scholar] [CrossRef] [Scilit] [PubMed]
- Kim, H.-G.; Cheon, E.-J.; Bai, D.-S.; Lee, Y.H.; Koo, B.-H. Stress and Heart Rate Variability: A Meta-Analysis and Review of the Literature. Psychiatry Investig. 2018, 15, 235–245. [Google Scholar] [CrossRef] [Scilit] [PubMed]
- Myllyneva, A.; Ranta, K.; Juutinen, J.; Alho, K.; Hietanen, J.K. Eye Contact in Virtual Reality: A Psychophysiological Study. Comput. Hum. Behav. 2020, 112, 106454. [Google Scholar] [CrossRef] [Scilit]
- Lemmens, J.S.; Simon, M.; Sumter, S.R. Fear and Loathing in VR: The Emotional and Physiological Effects of Immersive Games. Virtual Real. 2022, 26, 223–234. [Google Scholar] [CrossRef] [Scilit]
- Ishaque, S.; Khan, N.; Krishnan, S. Physiological Signal Analysis and Stress Classification from VR Simulations Using Decision Tree Methods. Bioengineering 2023, 10, 766. [Google Scholar] [CrossRef] [Scilit] [PubMed]
- Weibel, R.P.; Kerr, J.I.; Naegelin, M.; Ferrario, A.; Schinazi, V.R.; La Marca, R.; Hoelscher, C.; Nater, U.M.; von Wangenheim, F. Virtual Reality-Supported Biofeedback for Stress Management: Beneficial Effects on Heart Rate Variability and User Experience. Comput. Hum. Behav. 2023, 141, 107607. [Google Scholar] [CrossRef] [Scilit]
- Georgieva-Tsaneva, G. Investigation of Heart Rate Variability by Statistical Methods and Detrended Fluctuation Analysis. CBU Int. Conf. Proc. 2019, 7, 729–734. [Google Scholar] [CrossRef] [Scilit]
- Tsanev, Y.-A.; Georgieva-Tsaneva, G.; Dechev, M. Study of Changes in the Fractality of Heart Rate Variability after Training in Athletes. Int. J. Environ. Sci. 2025, 11, 376–383. [Google Scholar] [CrossRef]
- Georgieva-Tsaneva, G.; Cheshmedzhiev, K.; Tsanev, Y.-A.; Dechev, M. Physiological State Recognition via HRV and Fractal Analysis Using AI and Unsupervised Clustering. Information 2025, 16, 718. [Google Scholar] [CrossRef] [Scilit]
- Kyriakou, K.; Resch, B.; Sagl, G.; Petutschnig, A.; Werner, C.; Niederseer, D.; Liedlgruber, M.; Wilhelm, F.H.; Osborne, T.; Pykett, J. Detecting Moments of Stress from Measurements of Wearable Physiological Sensors. Sensors 2019, 19, 3805. [Google Scholar] [CrossRef] [Scilit] [PubMed]
- Abd Al-Alim, M.; Mubarak, R.; Salem, N.M.; Sadek, I. A Machine-Learning Approach for Stress Detection Using Wearable Sensors in Free-Living Environments. Comput. Biol. Med. 2024, 179, 108918. [Google Scholar] [CrossRef] [Scilit] [PubMed]
- Cho, D.; Ham, J.; Oh, J.; Park, J.; Kim, S.; Lee, N.-K.; Lee, B. Detection of Stress Levels from Biosignals Measured in Virtual Reality Environments Using a Kernel-Based Extreme Learning Machine. Sensors 2017, 17, 2435. [Google Scholar] [CrossRef] [Scilit] [PubMed]
- Costa, M.; Goldberger, A.L.; Peng, C.-K. Multiscale Entropy Analysis of Complex Physiologic Time Series. Phys. Rev. Lett. 2002, 89, 068102. [Google Scholar] [CrossRef] [Scilit] [PubMed]
- Costa, M.; Goldberger, A.L.; Peng, C.-K. Multiscale Entropy Analysis of Biological Signals. Phys. Rev. E 2005, 71, 021906. [Google Scholar] [CrossRef] [Scilit] [PubMed]
- Vuksanovic, V.; Gal, V. Nonlinear and Chaos Characteristics of Heart Period Time Series: Healthy Aging and Postural Change. Auton. Neurosci. 2005, 121, 94–100. [Google Scholar] [CrossRef] [Scilit] [PubMed]
- Dimitriev, D.A.; Saperova, E.V.; Dimitriev, A.D.; Karpenko, Y.D. Recurrence Quantification Analysis of Heart Rate During Mental Arithmetic Stress in Young Females. Front. Physiol. 2020, 11, 40. [Google Scholar] [CrossRef] [Scilit] [PubMed]
- Naschitz, J.E.; Itzhak, R.; Shaviv, N.; Khorshidi, I.; Sundick, S.; Isseroff, H.; Fields, M.; Priselac, R.M.; Yeshurun, D.; Sabo, E. Assessment of cardiovascular reactivity by fractal and recurrence quantification analysis of heart rate and pulse transit time. J. Hum. Hypertens. 2003, 17, 111–118. [Google Scholar] [CrossRef] [Scilit] [PubMed]
- Haque, Y.; Zawad, R.S.; Rony, C.S.A.; Al Banna, H.; Ghosh, T.; Kaiser, M.S.; Mahmud, M. State-of-the-Art of Stress Prediction from Heart Rate Variability Using Artificial Intelligence. Cogn. Comput. 2024, 16, 455–481. [Google Scholar] [CrossRef] [Scilit]
- Oskooei, A.; Chau, S.M.; Weiss, J.; Sridhar, A.; Rodriguez Martinez, M.; Michel, B. DeStress: Deep Learning for Unsupervised Identification of Mental Stress in Firefighters from Heart-Rate Variability Data. arXiv 2019, arXiv:1911.13213. [Google Scholar] [CrossRef] [Scilit]

Disclaimer/Publisher’s Note: The statements, opinions and data contained in all publications are solely those of the individual author(s) and contributor(s) and not of MDPI and/or the editor(s). MDPI and/or the editor(s) disclaim responsibility for any injury to people or property resulting from any ideas, methods, instructions or products referred to in the content. |
© 2026 by the authors. Licensee MDPI, Basel, Switzerland. This article is an open access article distributed under the terms and conditions of the Creative Commons Attribution (CC BY) license.