1. Introduction
Off-grid residential microgrids in tropical regions require renewable architectures that can maintain reliable electricity supply under variable solar availability, pronounced daily irradiance cycles, evening demand peaks, and diverse household consumption levels. Stand-alone and hybrid renewable systems have been widely studied as alternatives for isolated, weak-grid, and non-electrified communities, especially where grid extension is technically difficult, geographically constrained, or economically unjustified [
1,
2,
3]. At the residential scale, however, these systems must simultaneously provide reliability, affordability, operational flexibility, and renewable-only operation under time-varying demand and climate-sensitive electricity use.
In PV-dominated tropical microgrids, this challenge is strongly shaped by the mismatch between daytime solar generation and residential consumption. During high-irradiance periods, PV generation may exceed the instantaneous load and available storage capacity, leading to excess electricity or curtailment. Conversely, evening hours and low-solar periods require sufficient storage or backup capacity to maintain autonomy and avoid unmet load [
4,
5]. PV–battery systems are attractive in this context because they are modular, mature, efficient over short time scales, and well suited to managing fast or diurnal fluctuations in generation and demand [
6,
7]. However, extending autonomy only by increasing battery capacity can become technically and economically inefficient when prolonged low-generation periods, high renewable fraction targets, or multi-day backup requirements are considered [
8,
9]. Battery-only expansion may then lead to oversized storage, underutilized assets, additional replacement needs, and diminishing lifecycle cost benefits [
6,
9].
These limitations have motivated growing interest in PV–BESS–H
2 architectures. In such systems, hydrogen is not intended to replace batteries for short-duration balancing. Instead, the architecture can be interpreted as a layered storage configuration in which the BESS supports short-duration balancing, while the hydrogen pathway provides longer-duration storage, renewable surplus absorption, and delayed backup through electrolysis, hydrogen storage, and PEM fuel cell generation [
3,
7,
10]. Even so, the techno-economic ranking of PV–battery-only, PV–hydrogen-only, and PV–BESS–H
2 systems remains highly dependent on site conditions, cost assumptions, reliability targets, dispatch strategy, degradation treatment, and curtailment management [
6,
7].
Previous studies have already addressed the techno-economic assessment of off-grid hybrid renewable energy systems, including feasibility analysis, component sizing, cost optimization, reliability evaluation, renewable fraction assessment, and multi-criteria comparison [
1,
2,
3]. HOMER Pro and related simulation–optimization tools are widely used to screen candidate configurations and report indicators such as net present cost (NPC), cost of energy (COE), levelized cost of energy (LCOE), renewable fraction, excess electricity, and unmet load [
11,
12]. Thus, the unresolved issue is not the absence of techno-economic studies on off-grid HRES or PV–BESS–H
2 systems. Rather, it lies in how economic indicators are interpreted when software-reported cost metrics are compared with externally reconstructed values based on different accounting conventions. This ambiguity becomes critical when software-reported COE values are compared directly with externally calculated LCOE values. These indicators should not be treated as equivalent unless their accounting boundaries are explicitly harmonized [
11,
12,
13]. Differences may arise from discounting conventions, project lifetime assumptions, scheduled replacements, O&M costs, residual or salvage value, degradation treatment, and the definition of the electricity denominator, especially whether generated, served, or discounted delivered electricity is used [
13,
14]. In PV–BESS–H
2 microgrids, these accounting choices are especially consequential because battery cycling, electrolyzer operation, hydrogen storage, PEM fuel cell generation, excess electricity treatment, replacement timing, and salvage allocation all influence how the same renewable resource is translated into cost and delivered-energy metrics [
3,
7,
9,
10]. The gap addressed here is therefore methodological rather than purely computational: retained HRES configurations may be technically feasible, yet their economic interpretation remains ambiguous unless NPC and LCOE boundaries are reconstructed and harmonized. An auditable reconstruction approach is consequently needed to separate operational feasibility from cost-accounting effects and to compare HOMER-derived benchmark values with TEM-derived LCOE values within a reconciled metric boundary.
Chetumal, located in southeastern Mexico, provides a relevant demonstration context for this framework because it combines tropical climatic conditions, favorable solar resource availability, and residential electricity use patterns that may be influenced by cooling-related demand [
15]. The site is not presented here as the sole source of novelty. Instead, it is used as a representative tropical off-grid residential case in which metric reconciliation and storage role interpretation can be demonstrated. Two demand scenarios, 16.67 and 53.42 kWh/day, are used to represent contrasting residential electricity use levels under the same climatic context. These profiles are design-oriented representative scenarios rather than monitored household load measurements; therefore, they are used to evaluate the proposed reconstruction framework, not to predict the electricity consumption of a specific dwelling [
16].
This study addresses the above gap by presenting a metric-reconciled TEM–HOMER reconstruction framework for retained PV–BESS–H2 configurations under tropical off-grid residential conditions. The contribution does not lie in using HOMER Pro for hybrid system screening or in proposing a universally optimal PV–battery–hydrogen architecture. Instead, the novelty lies in separating archived HOMER Pro operational benchmark outputs from an external, auditable techno-economic reconstruction. In this reconstruction, NPC, scheduled replacements, O&M costs, salvage value, discounted delivered electricity, HOMER-derived LCOE, TEM-derived LCOE, sensitivity indicators, and storage role metrics are calculated under explicit and harmonized accounting assumptions. This structure allows cost differences to be interpreted as the result of transparent assumptions and metric definitions, rather than as opaque software-reported outputs.
The framework is demonstrated using two representative tropical off-grid residential demand scenarios in Chetumal, Mexico, corresponding to 16.67 and 53.42 kWh/day. These scenarios are used to examine how retained PV–BESS–H2 configurations behave under contrasting residential electricity use levels, while explicitly distinguishing representative demand scenarios from monitored household load measurements. Within this framework, the BESS is interpreted as a short-duration balancing layer, whereas the hydrogen pathway is interpreted as a delayed-backup and surplus-PV conversion layer. The main contributions of this study are summarized as follows:
A metric-reconciled TEM–HOMER framework is proposed to separate archived HOMER Pro benchmark outputs from an external, auditable techno-economic reconstruction of retained PV–BESS–H2 configurations.
A harmonized LCOE accounting procedure is used to compare HOMER-derived and TEM-derived LCOE values under a consistent discounted delivered electricity convention.
The external TEM reconstructs NPC, scheduled replacements, O&M costs, salvage value, discounted delivered electricity, and lifetime cost allocation under transparent and reproducible assumptions.
Storage role indicators are used to interpret the complementary operation of the BESS and hydrogen pathway, distinguishing short-duration battery balancing from surplus-PV electrolysis, hydrogen storage, and PEM fuel cell backup.
Sensitivity indicators and a reproducibility package are provided to support assumption tracing, early-stage technology assessment, and future extensions involving architecture-level re-optimization, flexible loads, degradation-aware modeling, and part-load component behavior.
The remainder of this article is organized as follows.
Section 2 describes the study site, representative demand scenarios, retained HOMER Pro configurations, component assumptions, TEM formulation, metric reconciliation procedure, sensitivity approach, and reproducibility package.
Section 3 presents the operational, economic, storage role, and sensitivity results.
Section 4 discusses the methodological contribution, battery–hydrogen storage role interpretation, economic implications, architecture-level limitations, flexible-load extensions, and transferability.
Section 5 summarizes the main conclusions.
2. Methodology
This section describes the methodology used to assess a fully renewable residential PV–BESS–H2 microgrid operating off-grid in Chetumal, Mexico. The approach combines site-specific climatic inputs, representative residential demand scenarios, retained HOMER Pro benchmark configurations, simplified component assumptions, a rule-based interpretation of storage operation, and an aligned techno-economic model (TEM). The TEM is used to reconstruct economic indicators, reconcile cost metrics, and perform sensitivity analysis under explicit assumptions.
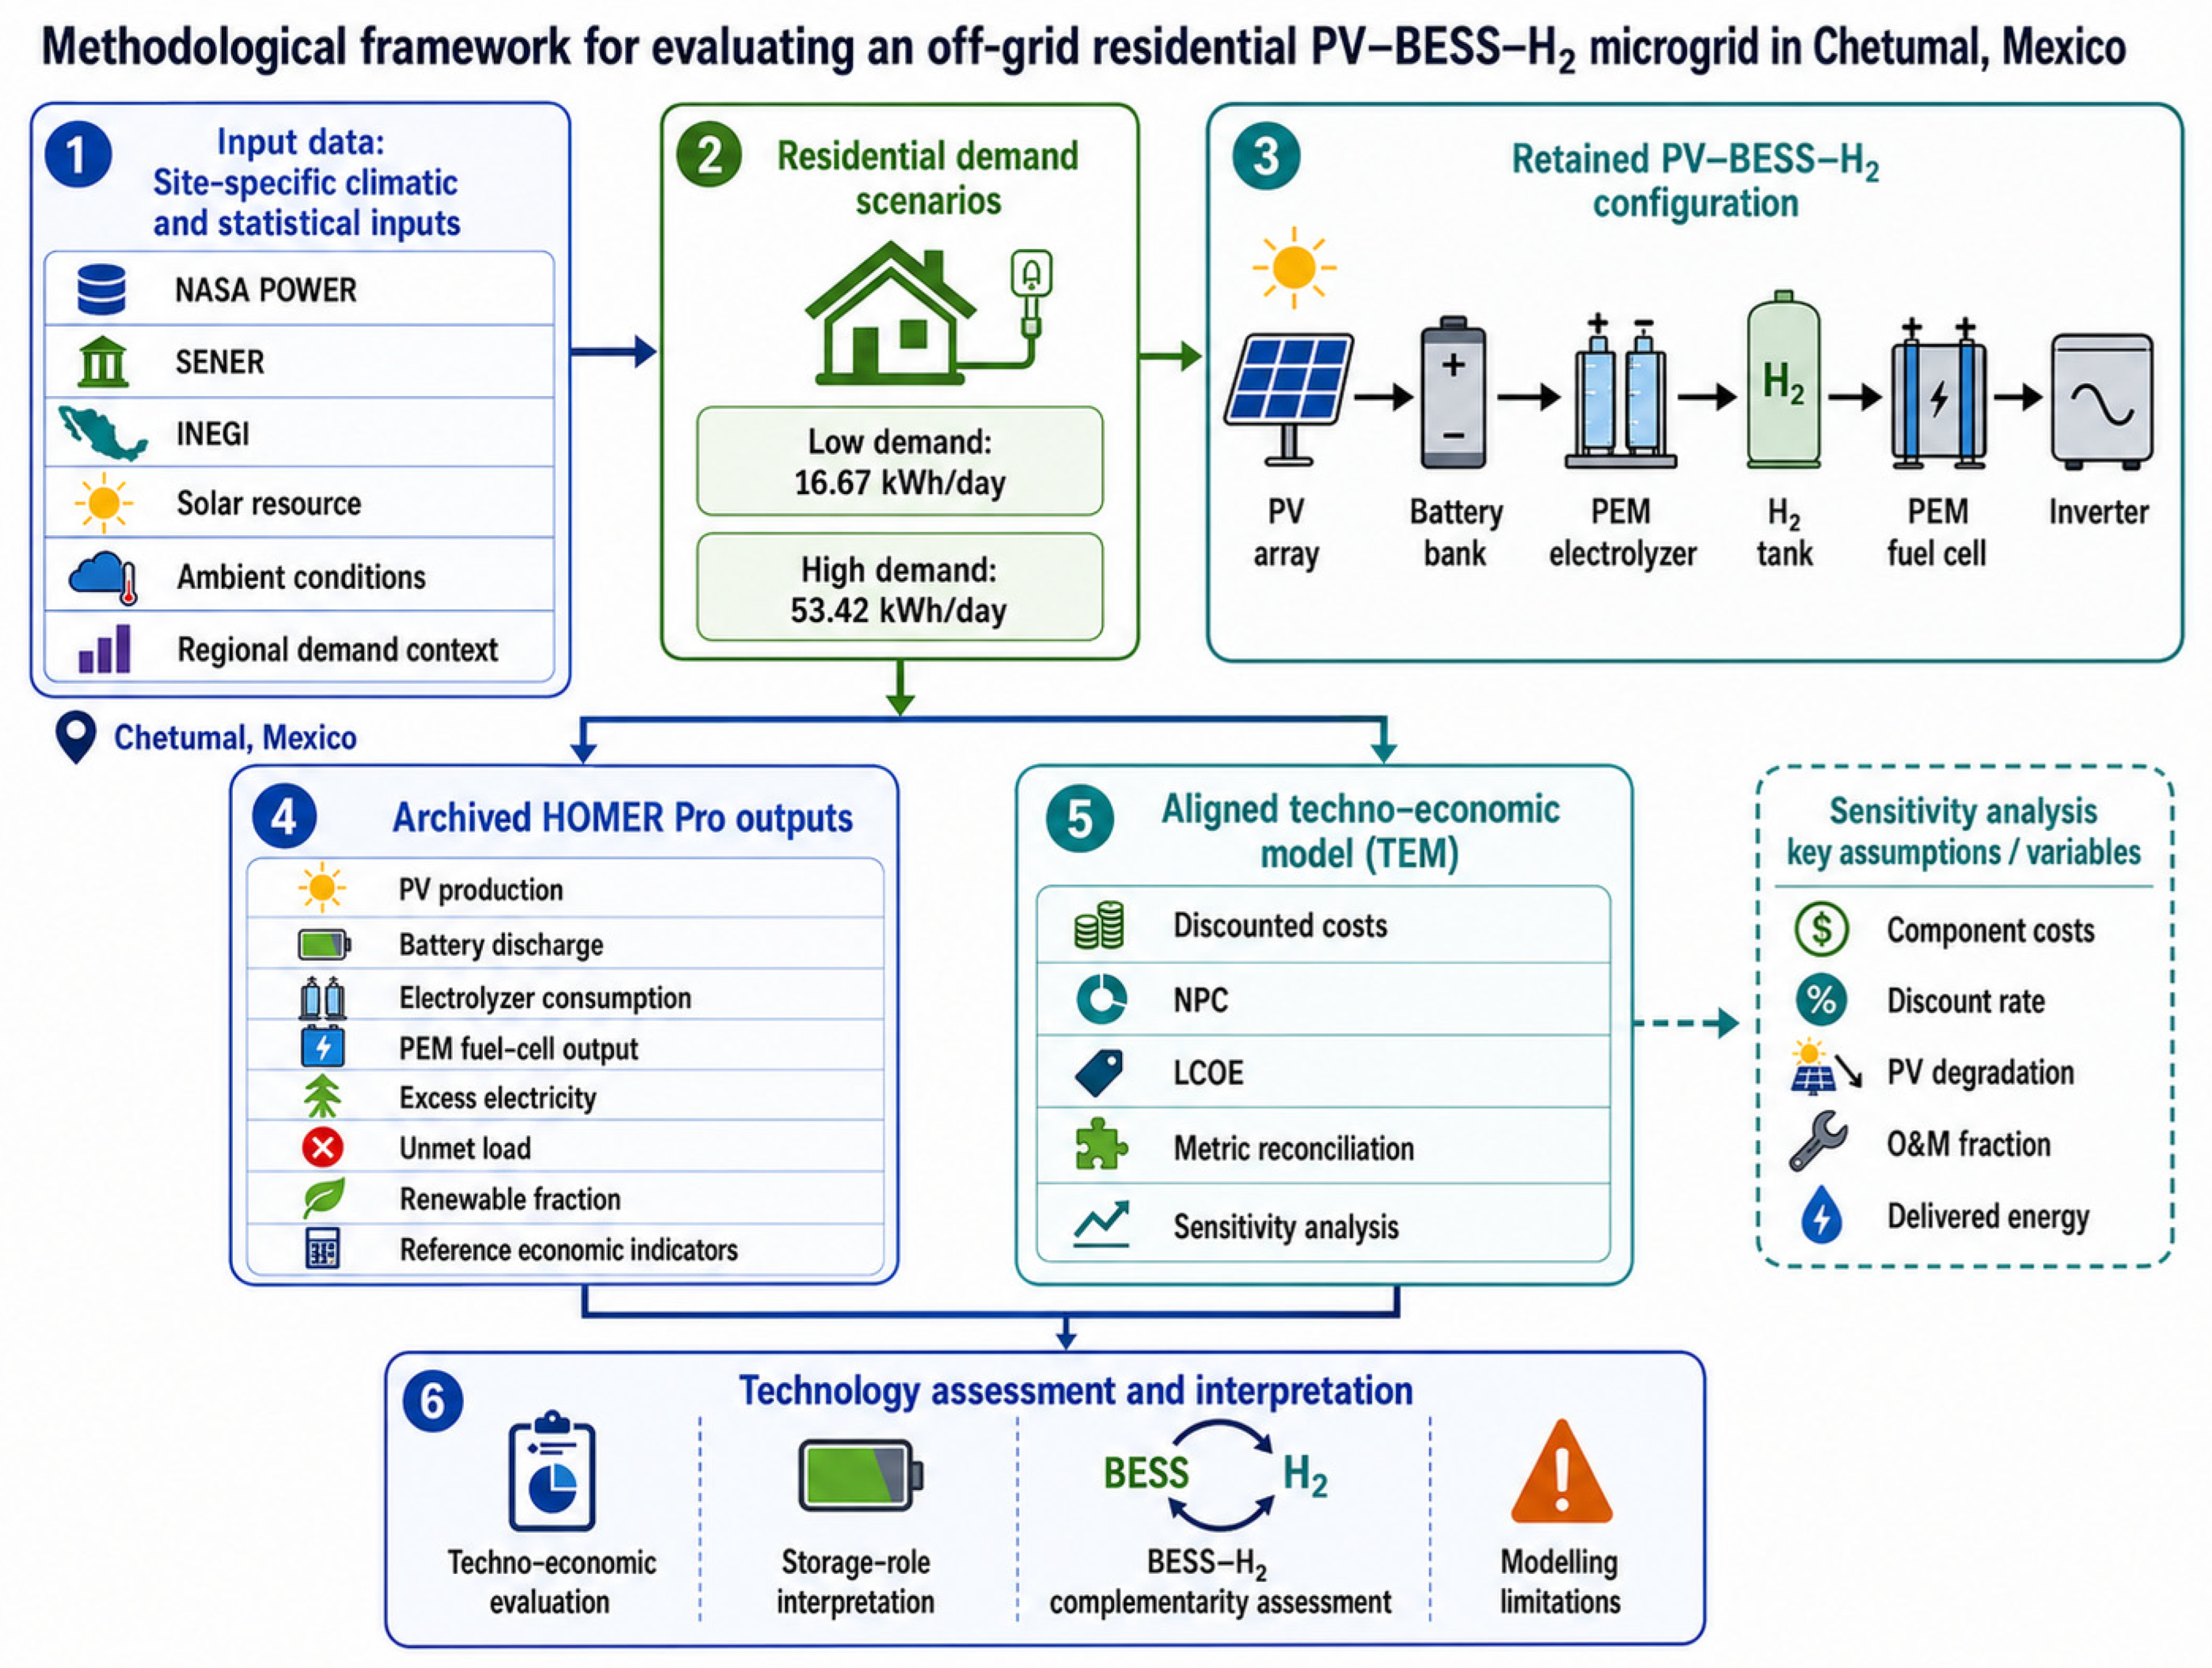
As shown in
Figure 1, the assessment links climatic inputs, representative demand profiles, retained PV–BESS–H
2 configurations, archived HOMER Pro outputs, and the aligned TEM. HOMER Pro provides the archived operational benchmark outputs, including PV production, battery operation, electrolyzer electricity consumption, hydrogen production, PEM fuel cell output, excess electricity, unmet load, renewable fraction, and economic benchmark values. The TEM then provides a transparent economic reconstruction layer for calculating discounted costs, net present cost (NPC), levelized cost of energy (LCOE), replacement effects, salvage treatment, and sensitivity to assumptions such as component costs, discount rate, PV degradation, O&M fraction, and delivered electricity.
The workflow starts with site-specific climatic and contextual inputs used to characterize the solar resource, ambient conditions, and regional residential setting [
17,
18]. Residential electricity demand is represented by two constructed annual hourly load scenarios corresponding to low- and high-demand conditions. These demand scenarios are design-oriented representations rather than monitored household load traces [
18,
19].
The retained PV–BESS–H
2 configurations are then evaluated using archived HOMER Pro outputs and the aligned TEM under consistent technical and economic assumptions [
20].
The following subsections describe the technology assessment framework, site data and climatic preprocessing, representative residential demand scenarios, retained system architecture and HOMER Pro benchmark configurations, component models and assumptions, rule-based dispatch and storage role interpretation, economic assumptions and cost benchmarking, TEM-based NPC and LCOE reconstruction, sensitivity analysis, and modeling limitations with the reproducibility package.
2.1. Technology Assessment Framework
This study evaluates a fully renewable off-grid residential hybrid renewable energy system (HRES) based on photovoltaic generation, battery energy storage, and hydrogen-based backup under tropical conditions in Chetumal, Mexico. The assessment is structured as a transparent technology assessment framework rather than as a conventional software-dependent optimization study. In this structure, archived operational benchmark outputs generated using HOMER Pro (HOMER Energy LLC, Boulder, CO, USA) provide information for the retained configurations, while the aligned techno-economic model (TEM) provides the reproducible economic reconstruction layer. The tropical context enters the assessment through the solar resource and ambient-temperature inputs used to estimate PV generation. Residential demand, however, is not dynamically coupled to hourly ambient temperature. Instead, two representative demand scenarios are used to evaluate the framework under contrasting electricity use levels. This limitation is explicitly addressed in
Section 2.10. The framework has three main purposes. First, it evaluates the technical behavior of retained PV–BESS–H
2 configurations under two representative residential demand scenarios. Second, it uses archived HOMER Pro outputs to document operational indicators, including PV production, battery discharge, electrolyzer electricity consumption, PEM fuel cell output, excess electricity, unmet load, and renewable fraction. Third, it reconstructs net present cost (NPC), levelized cost of energy (LCOE), scheduled replacement effects, operation and maintenance (O&M) costs, salvage treatment, discounted delivered electricity, and sensitivity indicators under explicit TEM assumptions. This distinction is central to the current study. HOMER Pro is not treated as the sole source of techno-economic interpretation, and the TEM is not presented as a reproduction of HOMER Pro’s proprietary optimization, dispatch, replacement, or ranking routines. Instead, HOMER Pro provides archived evidence of feasible operation and retained component sizes, while the TEM supports metric reconciliation and auditable economic interpretation. Within this framework, the battery subsystem is interpreted as the short-duration balancing layer, whereas the hydrogen subsystem is interpreted as a delayed-backup pathway. The proposed approach therefore supports a reproducible, case-based assessment of how storage roles and economic performance change under contrasting residential demand levels.
2.2. Site Data and Climatic Preprocessing
Chetumal, Quintana Roo, Mexico (18.52° N, 88.31° W; approximately 10 m above sea level), was selected as the study site. The location represents a tropical residential context in southeastern Mexico, where favorable solar resource availability coincides with warm ambient conditions and electricity use patterns that may be influenced by cooling-related demand. According to the Köppen–Geiger classification, the region has a tropical savanna climate (Aw), characterized by marked wet and dry seasons [
21].
Climatic inputs were obtained from the NASA POWER database for the 2018–2024 period [
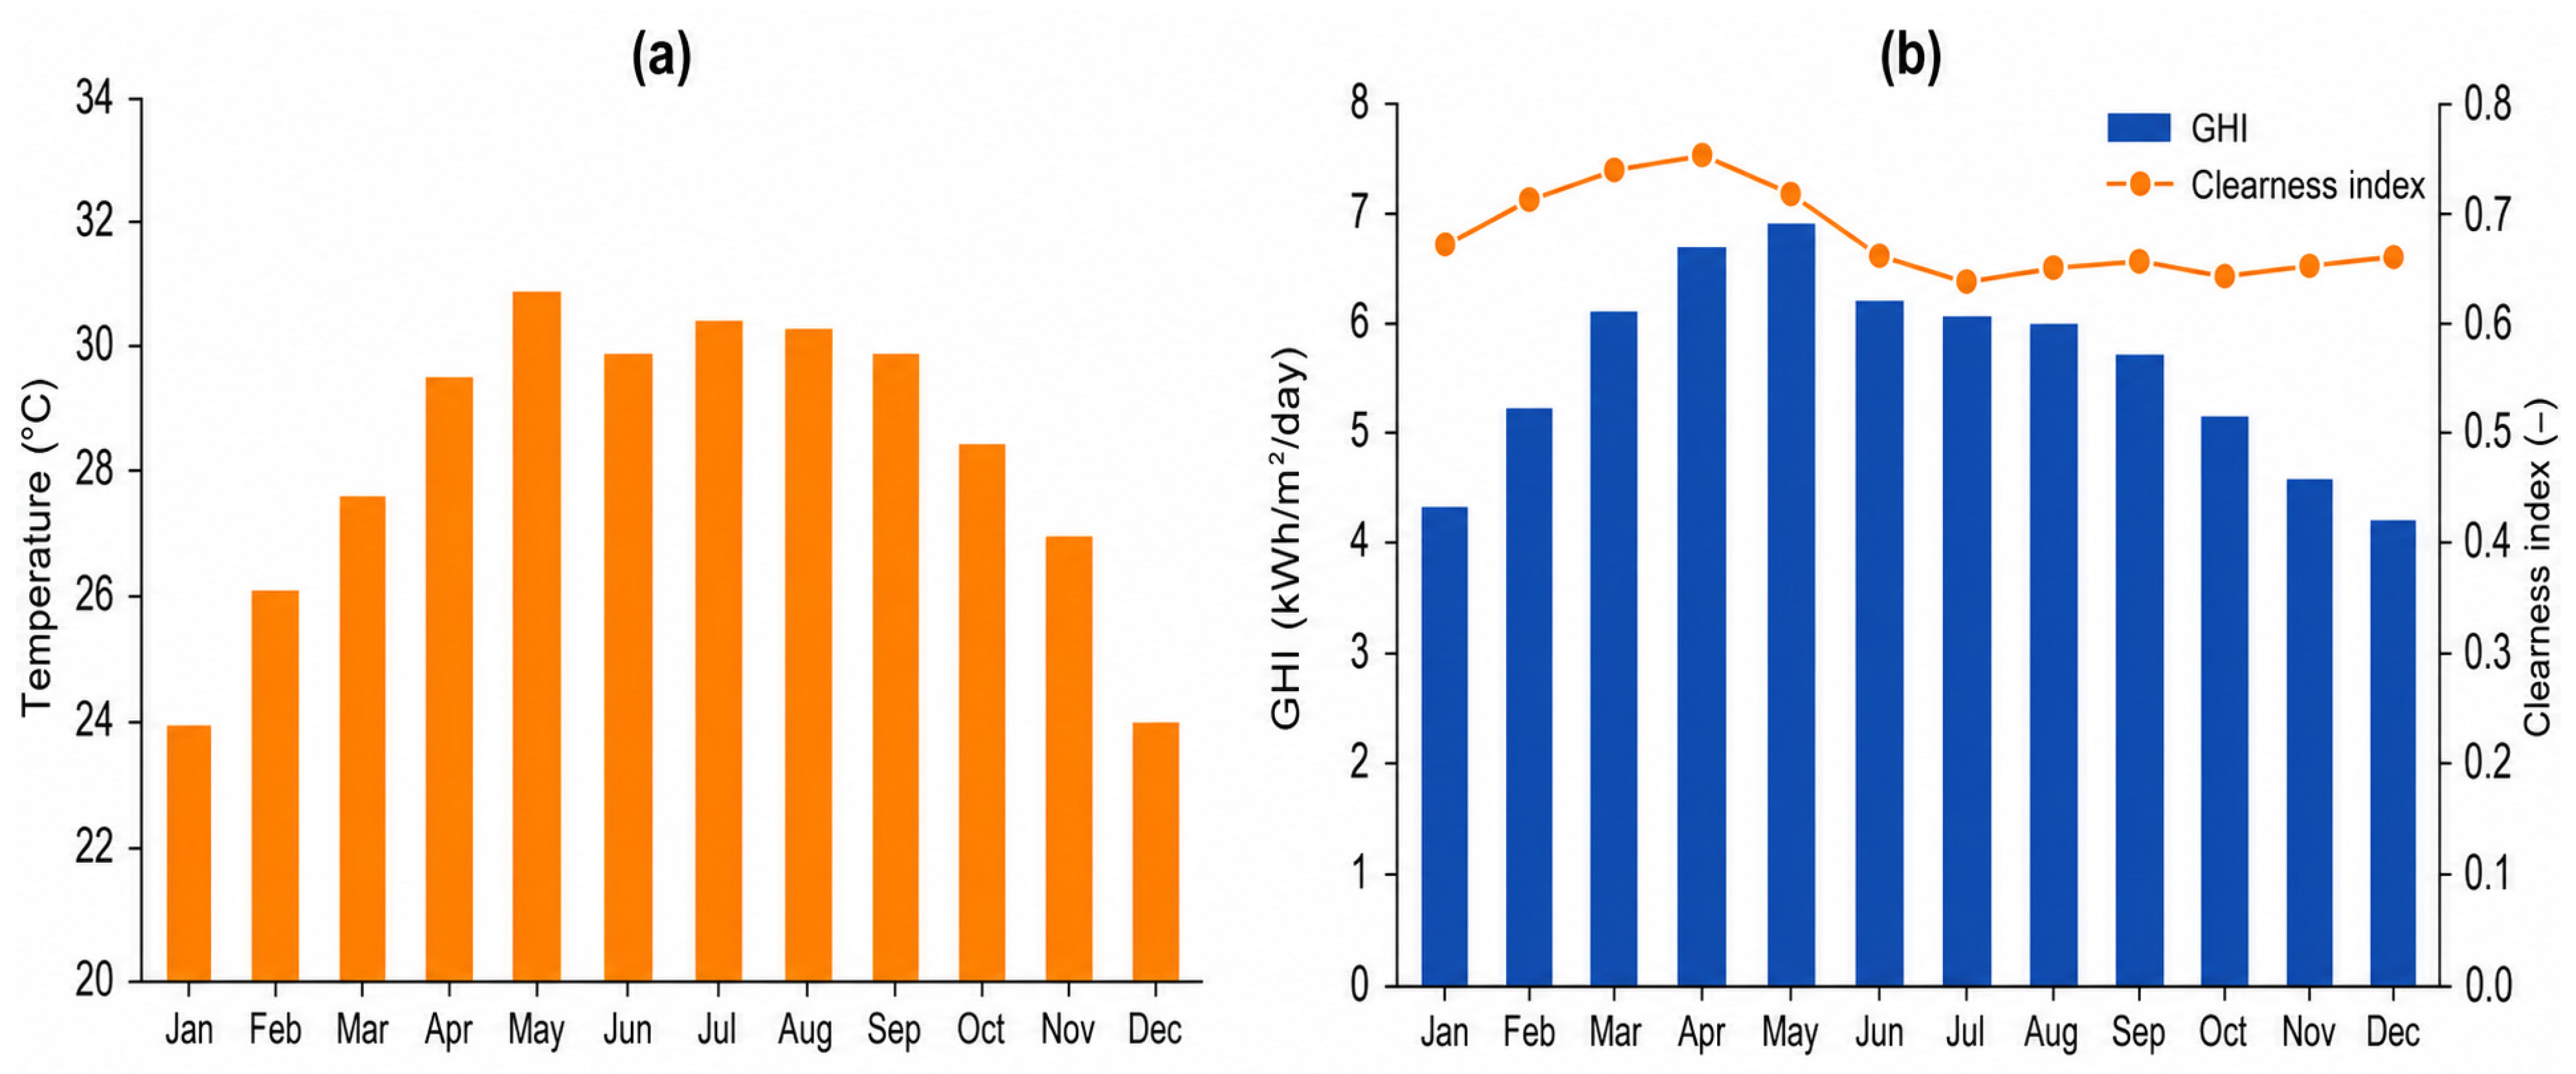
17]. The variables retained for system modeling were global horizontal irradiation (GHI) and ambient air temperature. These variables were used as common environmental inputs for both the archived HOMER Pro benchmark outputs and the TEM-based reconstruction. Before analysis, the climatic records were reviewed for temporal consistency and assembled into a uniform hourly input structure. This preprocessing step ensured that the operational benchmarks and the economic reconstruction were based on the same site-specific climatic boundary conditions. GHI and ambient temperature were retained because they directly affect PV energy yield, including the temperature-dependent correction of PV output considered in the component-level formulation. The tropical climate may also influence residential electricity demand through cooling-related consumption; however, demand was not dynamically coupled to hourly ambient temperature in this study. Instead, two representative annual demand scenarios were used to evaluate the framework under contrasting electricity use levels. This modeling limitation is explicitly addressed in
Section 2.10. For descriptive purposes, monthly statistics were derived from the processed hourly climatic dataset.
Figure 2a presents the monthly average ambient temperature, while
Figure 2b shows the corresponding monthly GHI and clearness index. These monthly statistics are included only to summarize the seasonal climatic profile of the study site. All simulation, operational benchmark, and TEM reconstruction indicators reported in the following sections are based on the processed hourly climatic inputs.
2.3. Representative Residential Demand Scenarios
Two annual hourly residential demand scenarios were defined for Chetumal, Quintana Roo, to evaluate the retained off-grid PV–BESS–H2 configurations under contrasting household electricity use levels. The scenarios were conceived as regionally plausible design cases rather than as monitored load traces from individual dwellings. Their purpose is therefore not to reproduce the behavior of a specific household but to examine how system operation, storage interaction, and techno-economic performance vary with demand magnitude under a common tropical context.
The adopted demand representation does not explicitly model a dynamic hourly coupling between ambient temperature and household electricity use. Climate sensitivity is represented directly in PV generation through irradiance and ambient-temperature inputs, whereas electricity demand is treated through scenario-based variability. Weekday/weekend differentiation was also not explicitly modeled; both scenarios use the same annual hourly demand structure. These assumptions were adopted to maintain a transparent comparison between the low- and high-demand cases and are discussed as modeling limitations in
Section 2.10.
The high-demand scenario was defined using regional electricity statistics and supporting evidence on household electricity consumption in Quintana Roo and southeastern Mexico as contextual references [
18,
19]. Climatic boundary conditions, including solar resource and ambient temperature, were derived from NASA POWER [
17]. Together with previous evidence on climate-sensitive electricity demand, these references indicate that residential electricity use in the region may be influenced by warm climatic conditions, cooling-related demand, household occupancy, and appliance use [
18,
19,
22,
23].
The low-demand case of 16.67 kWh/day represents a moderate residential electricity use condition, whereas the high-demand case of 53.42 kWh/day represents an electricity-intensive tropical residential condition. These values are not intended to define statistically representative household averages for Chetumal. Instead, they provide two contrasting demand magnitudes under the same climatic boundary conditions, allowing the proposed TEM–HOMER reconstruction framework to evaluate changes in retained PV–BESS–H2 configurations, storage roles, NPC, LCOE, excess electricity, and sensitivity behavior between moderate and high residential electricity use regimes.
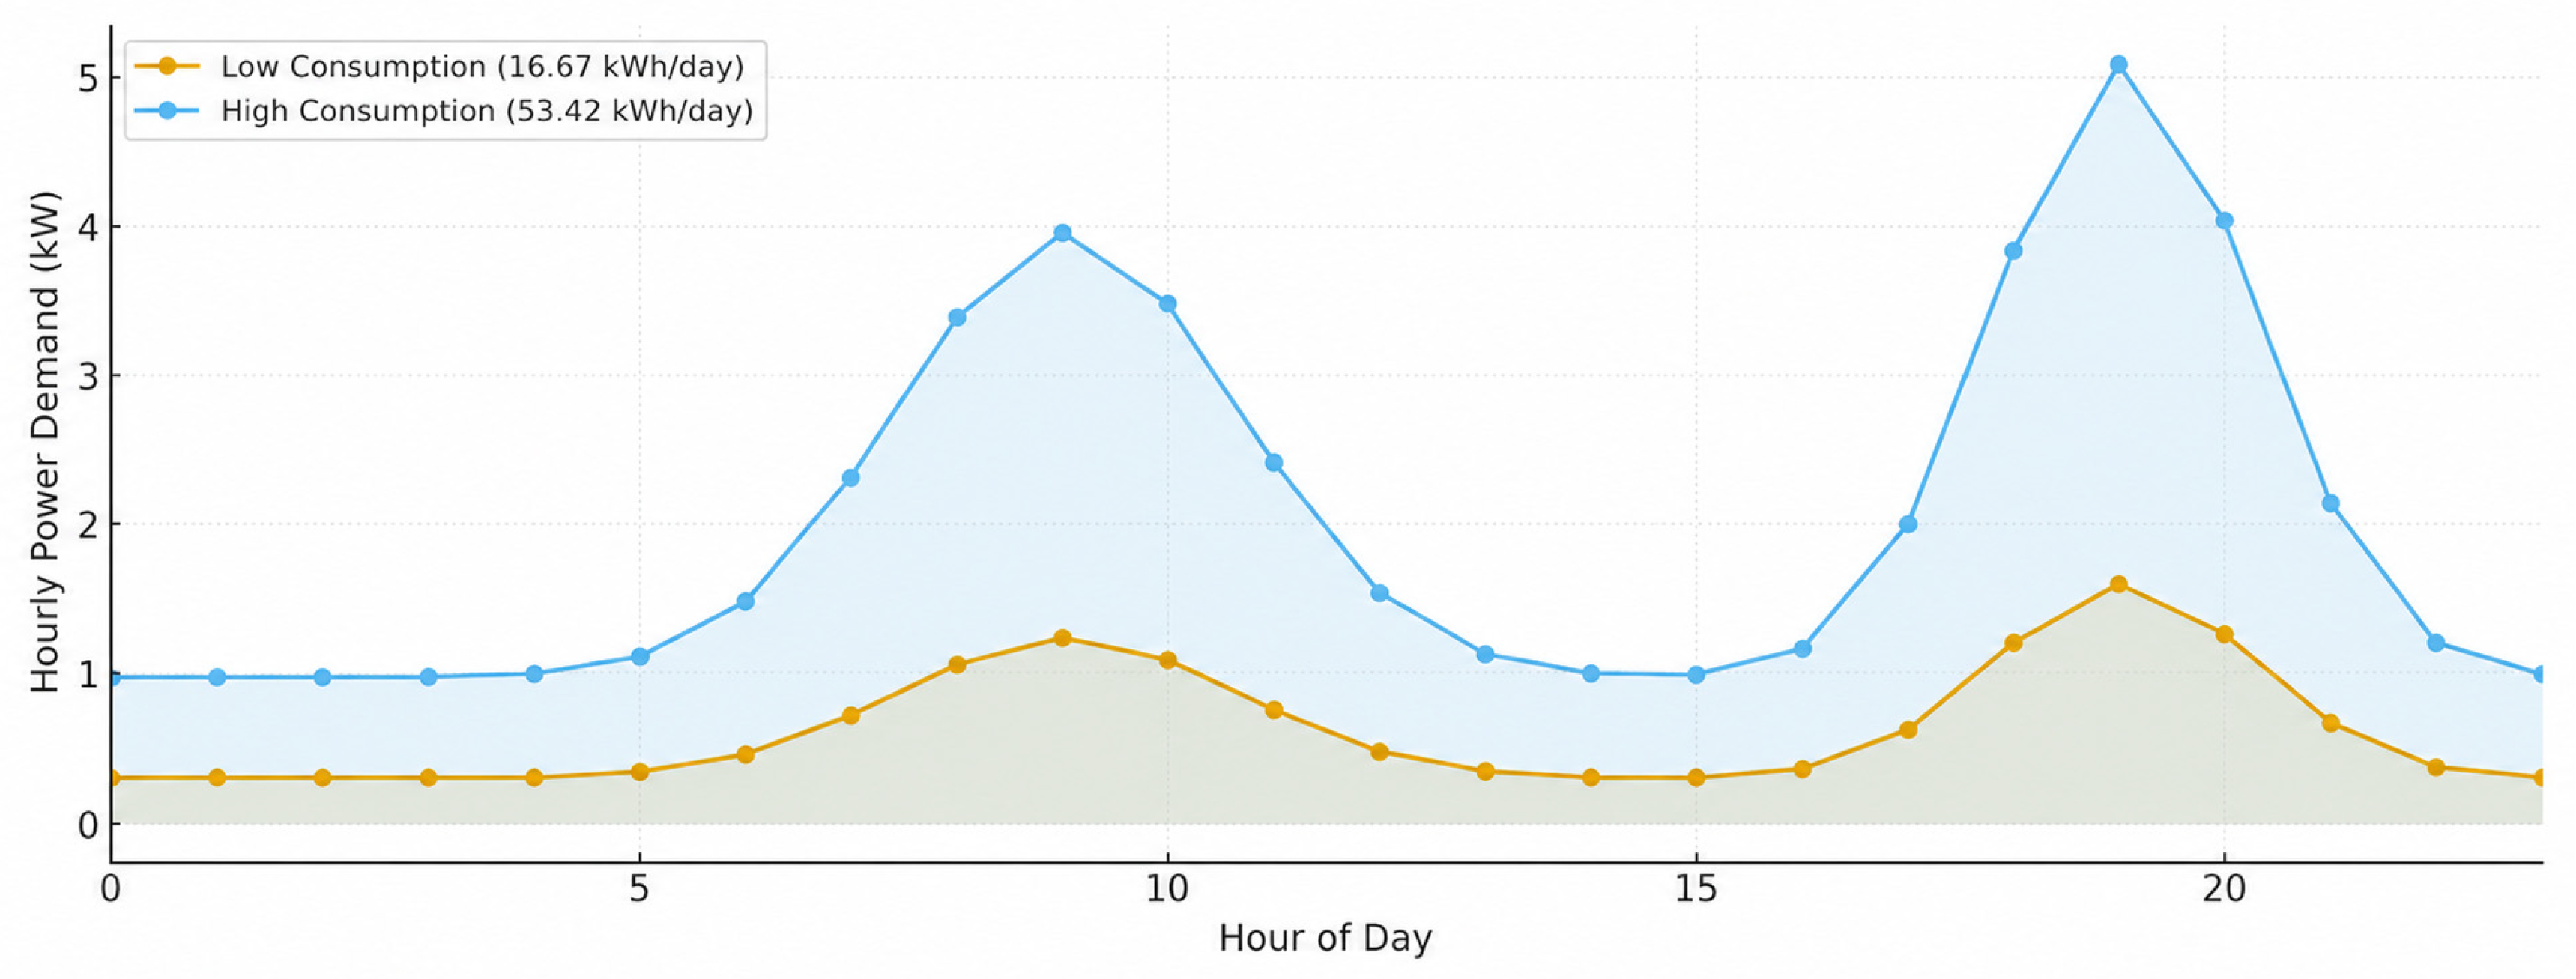
Table 1 summarizes the average daily demand and peak-load values used in the low- and high-demand cases. The scenarios were implemented as annual hourly residential load profiles in both the archived HOMER Pro outputs and the aligned TEM. Both scenarios were generated using the same representative diurnal demand structure, characterized by higher electricity use during morning and evening periods and lower demand during nighttime hours. This common profile was scaled to match the target average daily energy consumption of each scenario and converted into a continuous 8760 h annual load series.
Figure 3 presents the resulting hourly load profiles for the low- and high-demand residential scenarios. These profiles should be interpreted as constructed design profiles for comparative system assessment, not as direct measurements of individual household electricity use. Accordingly, the numerical results reported in this study should be interpreted as scenario-based technology-assessment outcomes rather than as direct predictions of measured residential electricity consumption in Chetumal.
2.4. Retained System Architecture and HOMER Pro Benchmark Configurations
This section defines the system architecture used to analyze the retained fully renewable residential HRES. It describes the off-grid topology, the interaction among PV generation, battery storage, hydrogen production, hydrogen storage, and PEM fuel cell backup, and the assumptions used to maintain consistency between the archived HOMER Pro outputs and the aligned techno-economic model (TEM). This section also summarizes the component capacities retained for the two representative residential demand scenarios and explains how these configurations are used as fixed technical inputs for TEM-based economic reconstruction and sensitivity analysis. The retained configurations are interpreted as archived HOMER Pro benchmark configurations rather than as newly generated global optima. Therefore, the upstream HOMER Pro search space, the complete feasible solution set, near-optimal alternatives, and Pareto fronts are not reconstructed or claimed as new results in this study. Instead, the retained configurations provide the operational and technical basis for interpreting storage roles and reconstructing NPC and LCOE under explicit TEM assumptions.
2.4.1. System Topology
The hybrid renewable energy system (HRES) was modeled in islanded mode, so that residential electricity demand was supplied exclusively by on-site renewable generation and storage resources. In HOMER Pro, a grid component was included only to satisfy software configuration requirements, while electricity imports and exports were disabled in all simulations. Under these conditions, the system was treated throughout the assessment as a fully off-grid residential microgrid.
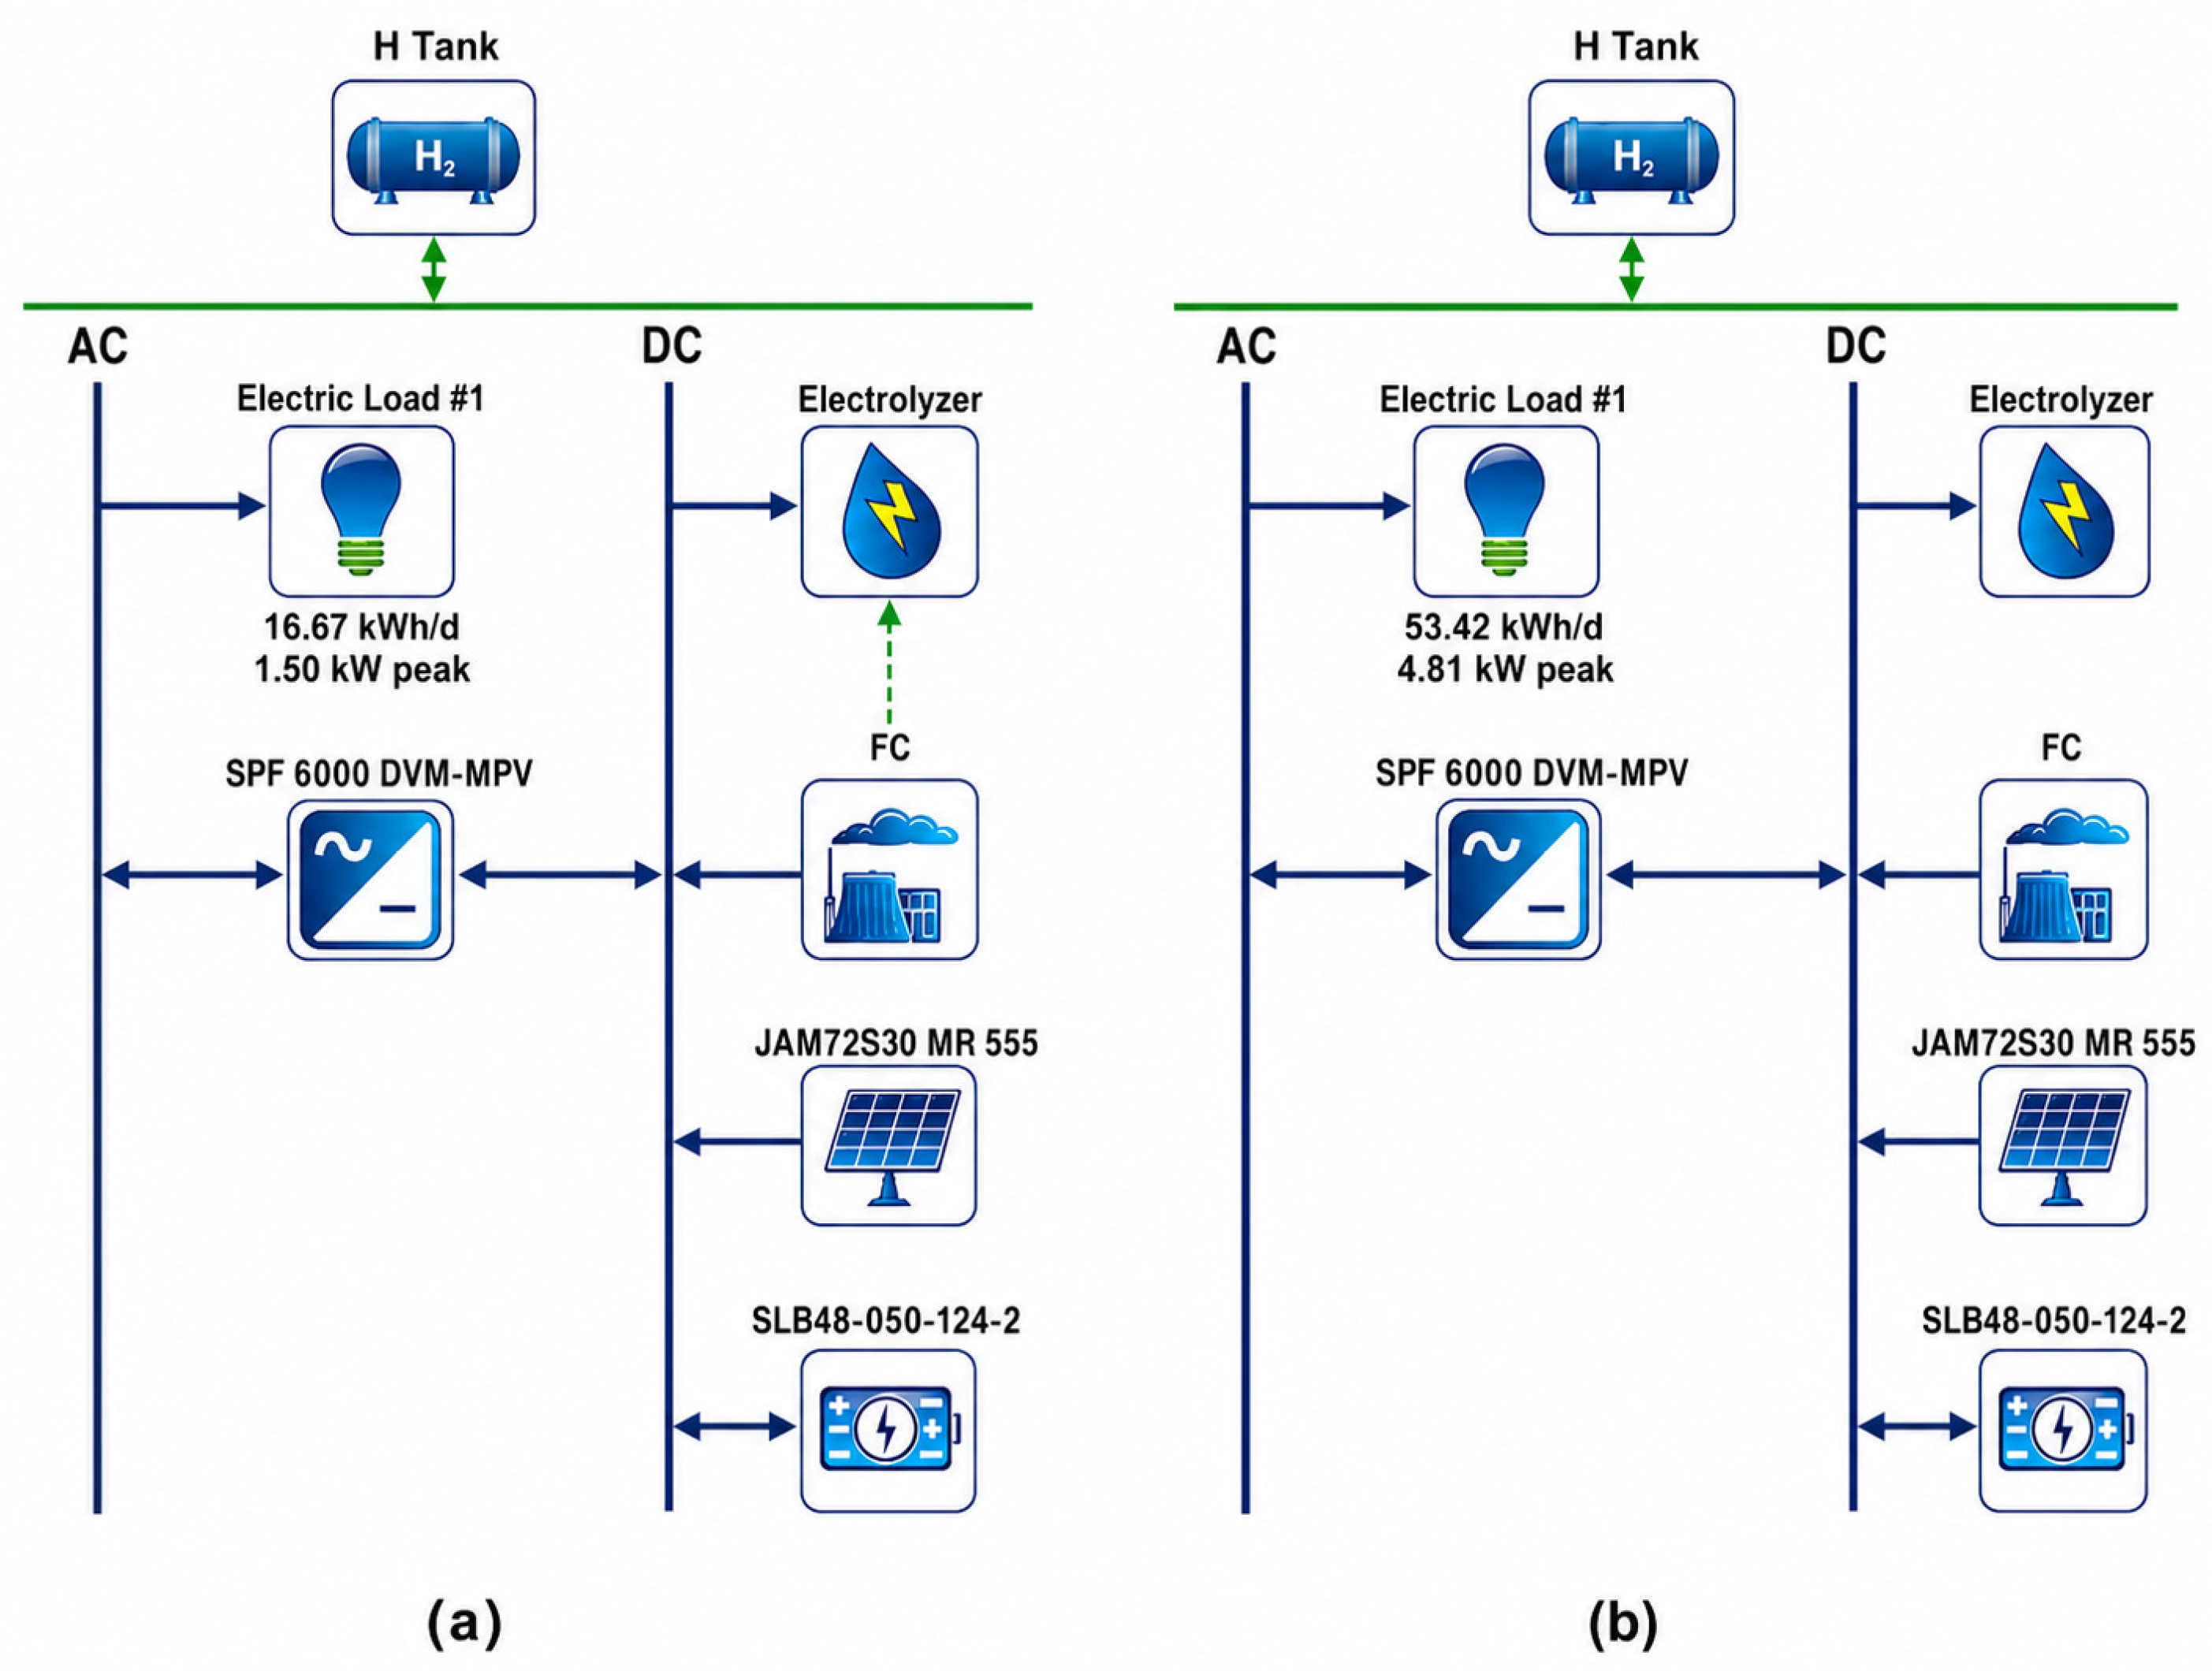
The retained HRES architecture consists of a photovoltaic (PV) array, a lithium-ion battery bank, a PEM electrolyzer, a compressed hydrogen storage tank, a PEM fuel cell, and a converter/inverter interfacing the DC-side components with the AC residential load. The PV array acts as the primary renewable electricity source. The battery energy storage system (BESS) provides short-duration buffering and intra-day balancing. When PV generation exceeds the instantaneous load and battery charging requirements, the electrolyzer absorbs the remaining PV surplus and converts it into hydrogen. The hydrogen tank stores this energy in chemical form, and the PEM fuel cell converts stored hydrogen back into electricity when PV generation and battery support are insufficient to satisfy demand. The converter/inverter provides the AC/DC interface between the generation and storage components and the residential AC load.
The commercial component models identified in
Figure 4 are the JAM72S30 MR 555 PV module (JA Solar Technology Co., Ltd., Beijing, China), the SLB48-050-124-2 lithium-ion battery (Polarium Energy Solutions AB, Stockholm, Sweden), and the SPF 6000 DVM-MPV inverter (Shenzhen Growatt New Energy Co., Ltd., Shenzhen, China). The electrolyzer, hydrogen tank, and PEM fuel cell were represented using generic HOMER Pro components and were therefore not associated with specific manufacturers.
Figure 4 shows the retained system topology for the two residential demand scenarios: the low-demand case in
Figure 4a and the high-demand case in
Figure 4b.
Consistent with this topology, the operating hierarchy prioritizes direct PV supply to the load, assigns short-duration balancing to the battery bank, directs remaining PV surplus to hydrogen production, and reserves PEM fuel cell operation for periods when PV generation and battery support cannot satisfy demand. This hierarchy was defined to provide a transparent and physically interpretable allocation of storage functions within the retained PV–BESS–H2 configuration. Accordingly, the system topology supports a design-oriented assessment of layered storage interaction under off-grid residential operation, rather than the demonstration of an optimal supervisory control strategy.
2.4.2. Retained HOMER Pro Benchmark Configurations
The retained configurations were recovered from archived HOMER Pro schematic summaries and output files generated during the previous modeling stage. These records provided the component capacities and operational indicators used in the present reconstruction, including PV array size, battery bank size, PEM electrolyzer rated power, hydrogen storage capacity, PEM fuel cell rated power, inverter capacity, renewable fraction, unmet load, excess electricity, and annual energy flows.
In this revision, the archived configurations are treated as retained benchmark cases rather than as newly generated global optima. The complete upstream HOMER Pro search space, feasible solution set, optimization ranking, Pareto front, and near-optimal alternatives were not reconstructed. No additional HOMER Pro optimization runs, architecture-level resizing, Pareto front generation, or near-optimal alternative screening were performed. Accordingly, the retained configurations are used as fixed technical inputs for the aligned TEM reconstruction, not as newly optimized or Pareto-optimal solutions.
The aligned TEM is then used to reconstruct NPC, LCOE, replacement effects, O&M contributions, sensitivity indicators, and storage role metrics under explicit assumptions.
Table 2 summarizes the retained benchmark configurations used throughout the operational interpretation, economic reconstruction, and sensitivity analysis. The capacities reported in
Table 2 should therefore be interpreted as archived retained inputs for the TEM-based reconstruction. They define the fixed technical basis for the subsequent operational benchmark interpretation, metric reconciliation, and sensitivity analysis.
2.4.3. Configuration Selection Scope and Benchmark Interpretation
For each residential demand scenario, the retained configuration corresponds to an archived feasible renewable-only solution that satisfied the imposed off-grid operating conditions in the previous HOMER Pro modeling stage. The archived outputs reported benchmark indicators such as net present cost, renewable fraction, unmet load, excess electricity, and component-level energy flows under the assumptions used in this modeling stage.
The present study does not reconstruct the full upstream HOMER Pro search space, feasible solution set, ranking procedure, Pareto front, or near-optimal alternatives. The retained systems should therefore not be interpreted as newly optimized, globally optimal, Pareto-optimal, or universally superior configurations. Instead, they are used as fixed archived benchmark configurations for storage role interpretation and for economic reconstruction through the aligned TEM.
This distinction is central to the methodological contribution of this study. HOMER Pro provides archived benchmark evidence of feasible renewable-only operation and retained component capacities. The TEM provides the transparent economic layer used to reconstruct NPC, LCOE, replacement effects, O&M contributions, salvage treatment, discounted delivered electricity, and sensitivity behavior under explicit assumptions. The TEM is not intended to reproduce HOMER Pro’s proprietary dispatch, optimization, replacement, salvage, or ranking routines. Rather, it enables an auditable, metric-reconciled interpretation of the retained PV–BESS–H2 configurations under low- and high-demand residential conditions.
2.5. Component Models and Key Assumptions
The retained HRES architecture was represented through component-level relations describing the main energy conversion and storage processes of the photovoltaic array, lithium-ion battery bank, PEM electrolyzer, hydrogen storage tank, PEM fuel cell, and inverter. These relations provide a transparent physical basis for interpreting the PV–BESS–H2 architecture and for defining the aligned techno-economic model (TEM). The purpose of the component formulation is not to reproduce the proprietary internal routines of HOMER Pro but to state the main assumptions used for conversion efficiencies, storage limits, and cost-relevant component capacities in an explicit and auditable way.
The component relations were intentionally kept at a steady-state techno-economic level to preserve transparency and reproducibility. Part-load curves, transient operation, cycling-dependent battery degradation, hydrogen tank pressure dynamics, thermal coupling, and degradation-aware dispatch are not explicitly represented. These modeling limitations are discussed in
Section 2.10. Detailed operational indicators are not recalculated in this subsection; instead, they are taken from the archived HOMER Pro benchmark outputs and interpreted in the
Section 3. The retained component capacities used as fixed TEM inputs are reported in
Table 2, while the equations below define the simplified component-level relations used for transparent interpretation.
2.5.1. PV Model
Hourly photovoltaic generation was represented using irradiance- and temperature-dependent performance relations for fixed-tilt PV arrays [
21,
24]. In HOMER Pro, the conversion from global horizontal irradiance to plane-of-array irradiance, the estimation of PV cell temperature, and the calculation of PV array power output were handled through the software’s internal routines [
25,
26,
27]. In the aligned TEM, the same physical rationale was retained through an equivalent formulation corrected for irradiance and temperature, ensuring consistency between the climatic inputs and the economic interpretation of PV performance. The PV formulation accounts for both intra-day irradiance variability and the effect of ambient temperature on module output. The PV cell temperature was estimated using a standard NOCT-based relation:
where
is the PV cell temperature,
is the ambient temperature,
is the nominal operating cell temperature, and
is the plane-of-array irradiance at time
.
The corresponding hourly photovoltaic power output was then calculated as
where
is the nominal PV array power,
is the irradiance under standard test conditions,
is the PV power temperature coefficient, and
is the cell temperature under standard test conditions. This relation allows the effective PV output to be adjusted according to both irradiance availability and local thermal conditions.
2.5.2. Battery Model
The battery energy storage system (BESS) was modeled as the short-duration storage layer of the HRES. Its function is to absorb intra-day mismatches between photovoltaic generation and residential demand, reducing short-term PV curtailment and delaying the activation of the hydrogen pathway during temporary supply deficits. Within the proposed layered-storage architecture, the battery acts as the primary flexibility resource for short-term balancing, while the hydrogen subsystem is reserved for extended backup support. Battery operation was represented through the following state-of-charge (SoC) balance:
where
is the battery state of charge at time
,
and
are the charging and discharging powers, respectively,
and
are the charge and discharge efficiencies,
is the adopted battery capacity convention in the TEM, and
is the simulation time step.
Battery operation was constrained by admissible lower and upper SoC limits, depth-of-discharge restrictions, and rated charging and discharging power limits. These constraints preserve physically plausible operation and ensure that the battery fulfills its intended short-duration balancing role within the overall HRES architecture. In the retained archived HOMER Pro configurations, the battery subsystem was represented as a modular string-based bank, with a nominal capacity of 5.04 kWh per string and an accessible capacity of 4.536 kWh per string. This yields total retained accessible capacities of 4.536 kWh and 27.216 kWh for the low- and high-demand scenarios, respectively. The minimum battery state of charge identified in the retained HOMER configuration was 12%; this value is reported separately from the accessible capacity values exported in the HOMER summaries. These directly recoverable configuration values are summarized in
Table 2 and define the battery basis used in the aligned TEM.
2.5.3. Hydrogen Subsystem Model
The hydrogen subsystem was modeled as the medium- and long-duration storage layer of the HRES. Its role is to convert surplus photovoltaic electricity into hydrogen through a PEM electrolyzer, store this hydrogen in a pressurized tank, and convert it back into electricity through a PEM fuel cell when photovoltaic generation and battery reserves are insufficient to satisfy the residential load. Within the proposed architecture, hydrogen storage acts as a strategic reserve for extended supply deficits, whereas the battery remains responsible for short-term balancing. The hydrogen mass produced by the electrolyzer at each time step was calculated as
where
is the hydrogen mass produced during the time step,
is the electrical power supplied to the electrolyzer,
is the electrolyzer efficiency,
is the simulation time step, and
is the lower heating value of hydrogen.
The hydrogen inventory in the storage tank was updated according to
where
is the stored hydrogen mass at time
,
is the hydrogen mass generated by the electrolyzer, and
is the hydrogen consumed by the fuel cell during the same interval. Tank operation was constrained by admissible lower and upper hydrogen storage limits.
When required, the PEM fuel cell reconverted stored hydrogen into electricity according to
where
is the electrical power produced by the fuel cell and
is the fuel cell efficiency. These relations provide a transparent physical basis for tracking hydrogen production, storage evolution, and electricity recovery within the overall energy balance of the microgrid. In the retained archived HOMER Pro configurations, the hydrogen subsystem was represented by electrolyzer capacities of 3 and 5 kW for the low- and high-demand scenarios, respectively, fuel cell capacities of 2 and 5 kW, and a hydrogen storage capacity of 2 kg in both cases. These values are directly recoverable from the archived HOMER Pro outputs and are reported in
Table 2. The retained electrolyzer, fuel cell, and hydrogen storage capacities reported in
Table 2 define the hydrogen subsystem basis used in the aligned TEM.
2.6. Rule-Based Dispatch and Storage Role Interpretation
System operation was interpreted through a deterministic rule-based dispatch hierarchy designed to distinguish short-duration balancing from delayed backup support. This hierarchy was used as an interpretive layer for the retained PV–BESS–H2 configurations. The objective was not to emulate an advanced supervisory controller or to reproduce the proprietary internal dispatch routines of HOMER Pro. Instead, the aim was to clarify the operational priority among PV generation, battery storage, hydrogen production, PEM fuel cell backup, and excess electricity under contrasting residential demand conditions.
At each hourly time step, the dispatch logic follows a physically intuitive sequence. Photovoltaic generation first serves the residential load. If PV production exceeds demand, the surplus is directed to battery charging until the admissible upper state-of-charge limit is reached. Any remaining surplus is then supplied to the electrolyzer for hydrogen production and storage. If surplus electricity is still available after battery charging and electrolyzer operation, it is recorded as excess electricity. Conversely, when PV generation is insufficient to meet the load, the battery is discharged first, subject to its admissible operating range. If a deficit remains after battery support, the PEM fuel cell is activated when hydrogen inventory and fuel cell operating constraints allow dispatch. Unmet load is recorded only when the load cannot be supplied after direct PV generation, allowable battery discharge, and available PEM fuel cell output have been exhausted.
Under this hierarchy, the battery subsystem acts as the primary short-duration flexibility resource, whereas the hydrogen pathway acts as a delayed-backup layer activated when generation deficits persist beyond the range that can be handled efficiently by the battery. This interpretation is used to classify storage behavior into short-duration balancing events, mainly associated with battery charge and discharge, and delayed-backup events, associated with electrolyzer operation, hydrogen storage, and PEM fuel cell generation. At the system level, the hourly power balance can be expressed as
where
is the power generated by the photovoltaic array,
is the electrical power supplied by the PEM fuel cell,
is the battery discharging power,
is the residential demand,
is the battery charging power,
is the electrical power directed to the electrolyzer, and
is curtailed or unused surplus power.
This balance provides a consistent basis for assigning operational roles to each subsystem and for interpreting how each storage layer contributes within the retained configurations. Storage role indicators were extracted from the archived HOMER Pro operational outputs to evaluate the interaction between the battery and hydrogen subsystems. The assessment was not formulated as an additional optimization objective. Instead, complementarity was treated as an interpretive outcome derived from the retained benchmark configurations. Battery operation was characterized using battery charge, battery discharge, state-of-charge behavior, and monthly discharge profiles. These indicators describe the contribution of the BESS to intra-day balancing and short-duration load support. The hydrogen subsystem was characterized using electrolyzer electricity consumption, hydrogen production, stored hydrogen, and PEM fuel cell output. These indicators describe how surplus PV electricity is converted into hydrogen and later recovered as backup electricity during deficit periods.
Three groups of indicators were considered. Renewable-supply indicators, including PV production, renewable fraction, unmet load, and excess electricity, were used to verify renewable-only operation. Battery-use indicators were used to quantify short-duration balancing. Hydrogen-use indicators were used to evaluate surplus-PV absorption, delayed energy recovery, and backup generation. Higher battery discharge indicates stronger reliance on electrochemical short-duration balancing, whereas higher electrolyzer consumption and PEM fuel cell output indicate greater use of the hydrogen loop for surplus absorption and delayed backup. Excess electricity was interpreted as residual PV surplus not absorbed by either storage pathway under the retained configuration and dispatch assumptions. The aligned TEM adopts the same storage role interpretation for the economic assessment. In this way, the HOMER Pro operational benchmark and the TEM-based economic reconstruction remain conceptually consistent. HOMER Pro provides the archived operational indicators, while the TEM quantifies the economic implications of the retained component capacities and storage roles under explicit cost and performance assumptions.
2.7. Economic Assumptions and Cost Benchmarking
The techno-economic evaluation of the retained HRES configurations was based on a common set of economic assumptions applied consistently to the low- and high-demand scenarios. These assumptions define the project lifetime, discounting convention, O&M treatment, fuel cost, PV degradation, component-specific capital costs, replacement schedules, replacement cost fractions, and salvage treatment convention used in the aligned techno-economic model (TEM). The aligned TEM uses the retained component capacities reported in
Table 2 as fixed technical inputs. Therefore, it does not re-optimize component sizes. Instead, it evaluates the economic implications of the archived HOMER Pro configurations under explicit and reproducible cost assumptions. This structure separates the economic reconstruction from the upstream HOMER Pro configuration screening and ensures that cost indicators are calculated within a transparent accounting framework. The common project-level economic assumptions adopted in the TEM are summarized in
Table 3.
A project lifetime of 25 years and a real discount rate of 8% were assumed. The system was modeled with zero fuel cost because the retained configuration is fully renewable and does not include diesel or grid electricity purchases. PV degradation was included as an annual reduction in delivered electricity, while annual O&M costs were represented through component-level assumptions reported in the economic input dataset and
Supplementary File S1.
The component cost coefficients adopted in the aligned TEM should be interpreted as parametric techno-economic assumptions rather than vendor quotations or Mexico-specific market prices. They were used to construct a transparent and reproducible base case reconstruction for the retained configurations, not to claim definitive local procurement costs. Because component prices for batteries, electrolyzers, PEM fuel cells, inverters, and hydrogen storage can vary substantially with technology maturity, supplier, scale, installation context, and regional market conditions, their influence was explicitly evaluated through the one-way and multi-parameter sensitivity analyses described in
Section 2.9.
Recent techno-economic research supports treating the cost assumptions of PV–BESS–H
2 systems as uncertain and boundary-dependent inputs rather than fixed market values. Component costs, replacement assumptions, O&M, financing, and storage roles are commonly handled as parametric inputs in off-grid PV–battery–hydrogen models [
8,
9,
10]. Reported lithium-ion BESS costs in PV–battery and PV–battery–hydrogen studies commonly span approximately 150–350 USD/kWh in contemporary modeling, while broader assumptions extend from about 100 to 760 USD/kWh depending on year, system boundary, duration, and whether the value represents pack, battery module, or full system cost [
28,
29,
30,
31,
32]. PEM electrolyzer costs are also highly scenario-dependent: present-day system assumptions commonly fall around 1000–2000 USD/kW, whereas future or optimistic cost reduction assumptions may fall within approximately 300–1000 USD/kW [
33,
34,
35,
36,
37]. PEM fuel cell cost assumptions in PV–hydrogen and PV–battery–hydrogen studies are typically reported in the low-thousands USD/kW range, with explicit values around 2864 USD/kW in a hybrid lithium-ion battery–hydrogen microgrid benchmark and 3000–6000 USD/kW in PV/PEMFC hybrid system modeling, although lower module-level or optimistic assumptions have also been reported [
10,
38,
39]. Compressed hydrogen storage costs vary even more strongly with pressure level, tank class, storage scale, and whether compression and balance of plant are included. Generic stationary assumptions are often in the few-hundred USD/kg-H
2 range, with reported values around 300–350 USD/kg-H
2 in PV-adjacent techno-economic models. In contrast, high-pressure tank systems can exceed 1000 USD/kg-H
2 and may reach approximately 1200–2700 USD/kg-H
2 depending on tank class and pressure level [
40,
41,
42,
43]. Accordingly, the values in
Table 4 are interpreted as internally consistent base case TEM inputs, including optimistic cost reduction assumptions for selected hydrogen components, not as current Mexico-specific market quotations. In particular, the H
2 tank cost coefficient is retained as a low-weight parametric input associated with the archived 2 kg storage capacity and should not be generalized as a market-representative compressed-tank cost.
Component-specific cost coefficients and replacement assumptions implemented in the aligned TEM are summarized in
Table 4. These parameters were applied to the retained component capacities reported in
Table 2 to calculate initial capital expenditure, scheduled replacement costs, O&M contributions, the adopted zero-salvage TEM base case, and the economic inputs required for the TEM-based NPC and LCOE reconstruction described in
Section 2.8. The uncertainty associated with these assumptions is addressed through the one-way and multi-parameter sensitivity analyses.
2.8. TEM Reconstruction, HOMER-Derived LCOE, and Metric Reconciliation
The aligned TEM, including the NPC and LCOE reconstruction, replacement and salvage accounting, discounted delivered electricity, and sensitivity analyses, was implemented in Microsoft Excel 365 (Microsoft Corporation, Redmond, WA, USA). The TEM reconstruction was performed using explicit discounted-cost and discounted-energy equations over the project lifetime. In its general form, the net present cost is calculated as the sum of initial capital expenditure, discounted operation and maintenance costs, and discounted scheduled replacements, minus any end-of-life salvage credit:
where
is the net present cost reconstructed with the aligned TEM,
is the initial capital expenditure,
is the operation and maintenance cost in year
,
is the replacement cost in year
,
is the salvage value credited at the end of the project horizon,
N is the project lifetime, and
r is the real discount rate.
For reusable implementations of the TEM, the salvage value of a component with remaining useful life at the end of the project horizon can be estimated using a linear remaining-life approach:
where
is the salvage value of component
at the end of the project horizon,
is the replacement cost of component
,
is the component lifetime, and
is the remaining useful life of the component at year
.
The TEM formulation includes the salvage term to make the cost-accounting boundary explicit and reusable under alternative assumptions. However, in the audited base-case reconstruction presented in
Section 3.2, no end-of-life salvage credit was applied to the TEM NPC or TEM-derived LCOE. This zero-salvage convention was adopted to keep the external reconstruction conservative, transparent, and directly traceable to the retained component capacities, scheduled replacements, O&M assumptions, discounting, PV degradation, and discounted delivered electricity denominator. It should not be interpreted as a reproduction of HOMER Pro’s internal salvage accounting. The archived HOMER NPC values are used in this study as benchmark economic outputs from the retained HOMER Pro configurations. By contrast, the TEM provides an external reconstruction under explicitly declared assumptions. Therefore, the comparison between archived HOMER NPC and TEM NPC, and between HOMER-derived LCOE and TEM-derived LCOE, is interpreted as a metric-reconciled benchmark comparison rather than as a component-by-component replication of HOMER Pro’s proprietary replacement, salvage, dispatch, optimization, or cost-accounting routines. Annual delivered electricity was adjusted for PV degradation according to
where
is the delivered electricity in year
,
is the first-year delivered electricity, and
is the annual PV degradation rate.
The present value of lifetime delivered electricity was then calculated as
where
is the discounted lifetime electricity delivered to the residential load. The TEM-derived levelized cost of energy was calculated as
A metric reconciliation step was required because the cost-of-energy value reported directly by commercial software interfaces and the LCOE calculated in an external techno-economic model do not necessarily follow the same accounting convention. Differences may arise from replacement schedules, residual value, salvage credit, O&M allocation, degradation, discounting, and the electricity denominator used in the calculation. For this reason, the HOMER Pro graphical interface cost of energy was not used as the quantitative benchmark in this study. Instead, a HOMER-derived LCOE was recalculated from the archived HOMER NPC values using the same discounted delivered electricity denominator adopted in the TEM:
where
is the HOMER-derived LCOE used as the harmonized benchmark,
is the archived HOMER Pro net present cost, and
is the discounted delivered electricity denominator used consistently in the TEM.
The TEM-derived LCOE was calculated using the retained component capacities and the explicit economic assumptions described in
Section 2.7 and
Section 2.8. The HOMER-derived LCOE was then used as the harmonized benchmark for comparison with the TEM-derived LCOE, thereby avoiding direct comparison between non-equivalent software-reported and externally reconstructed cost indicators.
The reconstruction was evaluated at two complementary levels. First, archived HOMER Pro outputs were used to document the technical and operational behavior of the retained configurations, including annual PV production, battery charge and discharge, electrolyzer electricity consumption, hydrogen production, PEM fuel cell output, excess electricity, unmet load, and renewable fraction. These indicators provide the operational reference for interpreting the role of the battery and hydrogen subsystems under each demand scenario. Second, the aligned TEM was used to calculate discounted economic indicators under explicit assumptions, including CAPEX, scheduled replacements, annual O&M, reconstructed NPC, discounted delivered electricity, and LCOE. For each compared indicator X, the relative deviation between the TEM reconstruction and the corresponding HOMER-derived benchmark was calculated as
where
is the value calculated with the aligned TEM and
is the corresponding HOMER-based benchmark derived from the archived HOMER Pro outputs. For LCOE,
corresponds to
; for NPC, it corresponds to the archived HOMER NPC.
In this study, the relative deviation was primarily used to compare TEM-derived LCOE against HOMER-derived LCOE and TEM NPC against archived HOMER NPC under the adopted reconciliation convention. The economic comparison should therefore be interpreted as a metric-reconciled reconstruction of retained HOMER Pro benchmark configurations. It does not claim to reproduce HOMER Pro’s internal cost-accounting algorithms. Rather, it provides an auditable procedure for tracing how component capacities, scheduled replacements, O&M assumptions, discounting, PV degradation, salvage convention, and discounted delivered electricity affect NPC and LCOE in the retained PV–BESS–H2 configurations.
2.9. Sensitivity Analysis Methodology
Sensitivity analysis was performed with the aligned TEM to evaluate how selected techno-economic and performance assumptions influence NPC and LCOE for the retained PV–BESS–H
2 configurations. The analysis was conducted without modifying the component capacities reported in
Table 2. Therefore, the results should be interpreted as the response of fixed benchmark configurations to changes in economic and performance assumptions, not as a new sizing or optimization exercise.
Two complementary sensitivity levels were considered. First, a one-way sensitivity analysis was implemented by varying one input at a time while keeping all other assumptions at their base case values. Second, a deterministic multi-parameter scenario analysis was used to evaluate the combined effect of optimistic and conservative assumption sets. These scenarios do not represent a probabilistic uncertainty analysis. Instead, they provide a deterministic assessment of combined uncertainty around the base TEM reconstruction.
2.9.1. One-Way Sensitivity Analysis Design
The one-way sensitivity analysis was used to identify the individual influence of key economic and technical assumptions on NPC and LCOE. In each case, one input parameter was modified while the retained system capacities remained fixed. The variables considered were discount rate, PV capital cost, battery capital cost, electrolyzer capital cost, PEM fuel cell capital cost, inverter capital cost, hydrogen storage capital cost, annual O&M cost, PV degradation rate, and annual delivered electricity. Cost multipliers were applied relative to the base values reported in
Table 4.
Table 5 summarizes the sensitivity variables, base values, tested ranges, and output indicators considered in the aligned TEM.
Because the retained component capacities remain unchanged in all one-way sensitivity cases, the analysis isolates the effect of each assumption without introducing a new sizing step. This approach identifies the parameters that most strongly affect NPC and LCOE for the retained PV–BESS–H2 configurations.
2.9.2. Multi-Parameter Scenario Definition
In addition to the one-way analysis, a deterministic multi-parameter scenario sensitivity was implemented to evaluate the combined effect of simultaneous changes in selected assumptions. Three scenarios were defined: optimistic, base, and conservative. The base scenario corresponds to the aligned TEM assumptions reported in
Section 2.7 and
Section 2.8. The optimistic scenario combines lower cost and discount rate assumptions with higher delivered electricity and lower PV degradation. The conservative scenario combines higher cost and discount rate assumptions with lower delivered electricity and higher PV degradation.
Table 6 summarizes the multi-parameter sensitivity scenarios implemented in the aligned TEM.
The purpose of this analysis is to evaluate how the retained configurations respond when several cost and performance assumptions shift simultaneously. Therefore, the optimistic and conservative cases should be interpreted as bounded scenario tests around the base TEM reconstruction, not as alternative optimized system designs. As in the one-way sensitivity analysis, the retained component capacities were kept fixed in all cases.
2.10. Modeling Limitations and Reproducibility Package
The proposed framework was designed as a technology assessment approach for a residential off-grid PV–BESS–H2 system, rather than as a high-resolution dynamic simulation, real-time control model, or new global optimization exercise. Several modeling limitations should therefore be acknowledged.
First, the analysis is based on retained configurations recovered from archived HOMER Pro outputs. No additional HOMER Pro optimization runs were performed at this stage. The retained systems should therefore be interpreted as feasible benchmark configurations, not as newly optimized designs.
Second, the aligned TEM does not reproduce the proprietary dispatch, optimization, degradation, or replacement routines implemented internally in HOMER Pro. Instead, it reconstructs the economic performance of the retained configurations using explicit assumptions for component capacities, capital costs, replacements, O&M, salvage treatment, PV degradation, discounted electricity, NPC, LCOE, and sensitivity cases.
Third, the component-level relations are based on simplified steady-state or quasi-steady assumptions. Cycling-dependent battery degradation, PEM electrolyzer and fuel cell transients, part-load efficiency curves, hydrogen tank pressure dynamics, detailed thermal coupling, inverter transients, and advanced supervisory control strategies are not explicitly represented.
Fourth, the demand profiles are representative constructed scenarios rather than monitored household measurements. The low- and high-demand cases are therefore intended for comparative technology assessment under tropical residential conditions, not as direct predictions for a specific dwelling.
To support reproducibility, this study is organized around traceable inputs, benchmark summaries, and TEM calculations.
Supplementary File S1 provides selected supporting information, including representative demand scenario data, retained configuration data, archived HOMER Pro benchmark summaries, aligned TEM input assumptions, economic reconstruction tables, storage role indicators, and sensitivity analysis results supporting the main tables and figures reported in this article. This structure allows the retained configurations and TEM calculations to be inspected, modified, or recalculated under alternative assumptions.
3. Results
This section presents the technical behavior, economic reconstruction, storage role indicators, and sensitivity results of the retained PV–BESS–H2 configurations under the low- and high-demand residential scenarios. Archived HOMER Pro outputs are used to describe operational performance, including renewable supply, battery use, hydrogen pathway operation, excess electricity, and unmet load. The aligned techno-economic model (TEM) is then used to reconstruct NPC, HOMER-derived LCOE, TEM-derived LCOE, relative deviations, and sensitivity effects under harmonized accounting assumptions.
The results should be interpreted as metric-reconciled reconstructions of retained benchmark configurations, not as evidence of newly optimized, globally optimal, or Pareto-optimal system designs. They should also not be interpreted as proof of superiority over all possible PV–battery-only, PV–hydrogen-only, or alternative PV–BESS–H2 architectures.
3.1. Technical Benchmark of the Retained Configurations
The retained low- and high-demand configurations correspond to the archived HOMER Pro benchmark configurations described in
Section 2.4. These configurations were not re-optimized in the aligned TEM. Instead, they were used as fixed technical inputs for operational interpretation and subsequent economic reconstruction.
The low-demand case includes a 5 kW PV array, one battery string, a 3 kW PEM electrolyzer, a 2 kg H
2 tank, a 2 kW PEM fuel cell, and a 6 kW inverter. The high-demand case includes a 15 kW PV array, six battery strings, a 5 kW PEM electrolyzer, a 2 kg H
2 tank, a 5 kW PEM fuel cell, and an 18 kW inverter. The detailed retained capacities are reported in
Table 2.
Table 7 summarizes the annual technical benchmark indicators obtained from the archived HOMER Pro outputs for the retained PV–BESS–H
2 configurations. Both retained configurations achieved a renewable fraction of 100% with negligible unmet load, indicating feasible renewable-only operation under the imposed off-grid assumptions. These results describe the technical behavior of the retained benchmark configurations and should not be interpreted as proof of global optimality or as a comprehensive comparison against all possible alternative architectures.
The high-demand case required substantially larger annual PV generation and battery discharge than the low-demand case. Annual PV output increased from 11,027.66 to 33,082.97 kWh/year, while battery discharge increased from 827.12 to 6125.52 kWh/year. This indicates a stronger contribution of the BESS to short-duration load balancing in the high-demand configuration. The hydrogen pathway was also active in both cases, as reflected by electrolyzer electricity input and PEM fuel cell output. Excess electricity increased from 77.02 kWh/year in the low-demand case to 3761.19 kWh/year in the high-demand case, indicating that residual surplus remained after the admissible storage and conversion pathways were used under the retained configuration.
3.2. Economic Reconstruction and Metric Reconciliation
Table 8 compares the archived HOMER Pro economic benchmark with the aligned TEM reconstruction for the two retained configurations.
To avoid comparing non-equivalent cost indicators, the HOMER Pro graphical interface COE was not used as the quantitative benchmark. Instead, a HOMER-derived LCOE was recalculated from the archived HOMER NPC values using the same discounted delivered electricity convention adopted in the TEM. The TEM-derived LCOE was calculated from the retained component capacities, scheduled replacements, O&M assumptions, discounted delivered electricity, and TEM accounting convention described in
Section 2.8.
The TEM closely matched the HOMER-derived LCOE benchmark under the adopted reconciliation convention, with relative deviations of +3.6% and +2.1% for the low- and high-demand cases, respectively. The corresponding NPC deviations were also +3.6% and +2.1%, as both LCOE values were calculated using the same discounted delivered electricity denominator. These results indicate that, under the declared TEM accounting assumptions, the external reconstruction captures the dominant lifecycle cost structure of the retained configurations and can serve as an auditable interpretation layer for the archived HOMER Pro benchmark cases. The comparison should not be interpreted as a validation of HOMER Pro or as a reproduction of its proprietary internal cost, dispatch, replacement, or optimization routines. Rather, it shows that the retained configurations can be economically interpreted outside the software environment when component capacities, archived benchmark outputs, TEM cost assumptions, discounted delivered electricity, and cost-accounting conventions are made explicit. This metric reconciliation step is central to this study because it avoids direct comparison between non-equivalent software-reported and externally reconstructed cost indicators.
3.3. Storage Role Indicators
Storage role indicators were calculated from the archived HOMER Pro outputs to interpret the operational roles of the battery and hydrogen subsystems.
Table 9 summarizes the main ratios and annual indicators used to evaluate short-duration battery contribution, hydrogen pathway contribution, surplus absorption, residual excess electricity, apparent hydrogen electricity return, BESS nominal autonomy, annual hydrogen production, inferred annual hydrogen consumption, maximum hydrogen storage utilization, and annual hydrogen throughput relative to the retained tank capacity.
The results show that the BESS and hydrogen subsystem do not play interchangeable roles in the retained architecture. Battery discharge relative to load served increased from 13.6% in the low-demand case to 31.4% in the high-demand case, indicating stronger reliance on short-duration electrochemical balancing as residential demand increases. By contrast, PEM fuel cell output relative to load served decreased from 38.0% to 19.3%. This indicates that the hydrogen pathway contributed as a delayed-backup layer in both scenarios, with a higher relative contribution in the low-demand configuration.
The electrolyzer input-to-PV output ratio was also higher in the low-demand case, showing that a larger share of PV generation was routed to hydrogen production. The higher excess electricity ratio in the high-demand case should not be interpreted as a failure of the architecture. Rather, it indicates that residual PV surplus remained after the admissible load-serving, battery-charging, electrolyzer, and hydrogen storage pathways had been used under the retained configuration. This result also suggests that future architecture-level re-optimization could improve surplus absorption through larger electrolyzer capacity, additional hydrogen end uses, demand-side management, flexible loads, or alternative dispatch rules.
The annual hydrogen indicators further support this delayed-backup interpretation. The archived HOMER Pro outputs reported hydrogen production of 138.45 kg/year in the low-demand case and 226.16 kg/year in the high-demand case. Maximum stored hydrogen reached 0.419 and 0.762 kg, respectively, within the retained 2 kg tank capacity. These values correspond to maximum tank utilizations of 20.95% and 38.10%, indicating that the hydrogen tank was not fully saturated during the annual simulation. The retained 2 kg H2 tank capacity was taken from the archived HOMER Pro benchmark configuration and was not re-optimized in this revision. A tank size sensitivity would therefore require new architecture-level sizing or optimization runs.
Because the archived benchmark outputs do not provide a fully audited hourly hydrogen inventory trajectory or an explicit hydrogen consumption time series, hydrogen cycling is interpreted through annual storage-throughput indicators rather than detailed equivalent-cycle counts. Annual H2 consumption was inferred from the PEM fuel cell electrical output using the assumed fuel cell electrical efficiency and the lower heating value of hydrogen. This gives approximately 138.6 kg H2/year for the low-demand case and 226.4 kg H2/year for the high-demand case, close to the corresponding annual H2 production values of 138.45 and 226.16 kg/year. This near balance supports the interpretation that, over the annual horizon, the hydrogen subsystem operated primarily as a surplus-PV conversion and delayed-backup pathway rather than as a seasonal hydrogen storage reservoir.
A production-normalized tank-throughput indicator was calculated as annual H2 production divided by the retained 2 kg tank capacity. This gives 69.2 and 113.1 tank-capacity equivalents per year for the low- and high-demand cases, respectively. This indicator should not be interpreted as a detailed equivalent-cycle count, because validated hourly filling and depletion cycles were not reconstructed in this revision. Instead, it provides a compact annual measure of hydrogen throughput relative to the retained tank size. Similarly, the apparent H2 electricity return ratio of 38.1% in both scenarios should be interpreted as a system-level annual recovery indicator, not as a standalone electrolyzer–fuel cell round-trip efficiency.
Finally, BESS nominal autonomy increased from 6.5 h in the low-demand case to 12.2 h in the high-demand case, confirming the stronger short-duration storage margin of the high-demand retained configuration. Taken together, these indicators reinforce the interpretation of the retained PV–BESS–H2 architecture as a layered storage system, in which the BESS supports routine short-duration balancing and the hydrogen pathway provides surplus-PV conversion and delayed backup under off-grid operation.
3.4. Sensitivity Analysis Results
The aligned TEM was further used to evaluate how selected techno-economic and performance assumptions affect NPC and LCOE while keeping the retained component capacities fixed. Unlike the archived HOMER Pro benchmark, which provides fixed operational and economic outputs for the retained configurations, the TEM allows key assumptions to be modified transparently without introducing a new sizing or optimization step. The sensitivity results should therefore be interpreted as economic responses of the retained benchmark configurations to assumption changes, not as newly optimized system designs. The sensitivity analysis was organized in two levels. First, a one-way sensitivity analysis was performed to identify the individual influence of each variable on LCOE. Second, multi-parameter scenarios were used to evaluate the combined effect of optimistic and conservative assumption sets. These results are deterministic TEM-based stress tests and should not be interpreted as probabilistic uncertainty bounds or Monte Carlo results.
3.4.1. One-Way Sensitivity Results
The one-way sensitivity analysis considered variations in delivered electricity, discount rate, PV capital cost, battery capital cost, electrolyzer capital cost, PEM fuel cell capital cost, inverter capital cost, hydrogen storage cost, annual O&M cost, and PV degradation rate. Each parameter was varied independently while all other assumptions were kept at their base values. The retained component capacities reported in
Table 2 were not modified during the sensitivity analysis.
Table 10 summarizes the main LCOE sensitivity effects obtained with the aligned TEM.
Delivered electricity showed the largest influence in both scenarios, with an approximate ±11.1% effect on LCOE. This result reflects the denominator effect of lifetime electricity delivery: for a fixed system cost, lower utilization increases LCOE, whereas higher utilization reduces it. The discount rate was also a dominant factor, with impacts of approximately 9.5% in the low-demand case and 9.3% in the high-demand case, confirming the importance of financing assumptions in off-grid renewable microgrid economics.
Battery cost and PV cost were also influential, although their relative importance differed between scenarios. Battery cost had a stronger impact in the high-demand case because the retained high-demand configuration includes a larger battery bank and therefore a higher replacement burden over the project lifetime. PV cost affected both scenarios substantially because the PV array is the primary generation source and one of the main capital cost components. PV degradation produced a moderate but consistent effect in both scenarios because it directly reduces discounted lifetime delivered electricity.
Hydrogen-related costs showed lower sensitivity than delivered electricity, discount rate, PV cost, and battery cost under the adopted TEM cost structure. PEM fuel cell cost had a moderate effect, while electrolyzer cost showed a lower impact. The negligible H2 tank cost effect should be interpreted as model-specific because it reflects the low tank cost coefficient used in the aligned TEM and the fixed 2 kg storage capacity retained in both configurations. This result should not be generalized to hydrogen storage economics and should be revisited under alternative hydrogen storage cost assumptions.
Overall, the one-way sensitivity results indicate that LCOE is driven mainly by assumptions affecting either the discounted electricity denominator or the dominant capital-cost terms. Hydrogen components remain operationally relevant within the retained architecture, but their one-way economic influence is less dominant under the base TEM cost assumptions.
3.4.2. Multi-Parameter Scenario Results
The multi-parameter sensitivity results provide a deterministic combined sensitivity assessment around the base TEM reconstruction. Unlike the one-way sensitivity analysis, in which each parameter is varied independently, the optimistic and conservative scenarios combine simultaneous changes in discount rate, component costs, annual O&M cost, PV degradation, and delivered electricity. The retained component capacities were kept fixed in all cases. These scenarios should therefore be interpreted as economic stress tests of the retained benchmark configurations, not as alternative optimized designs.
Table 11 summarizes the resulting LCOE values for the low- and high-demand configurations. Under the optimistic scenario, the LCOE decreased from 0.3320 to 0.2105 USD/kWh in the low-demand case and from 0.3571 to 0.2270 USD/kWh in the high-demand case. These values correspond to reductions of 36.6% and 36.4%, respectively, relative to the base TEM reconstruction. In contrast, the conservative scenario increased the LCOE to 0.5024 USD/kWh in the low-demand case and 0.5393 USD/kWh in the high-demand case, corresponding to increases of 51.3% and 51.0%, respectively.
These results confirm that the economic interpretation of the retained PV–BESS–H2 configurations is strongly dependent on the simultaneous evolution of financing conditions, component costs, O&M assumptions, PV degradation, and delivered electricity. The magnitude of the optimistic–conservative spread reinforces the need to report harmonized accounting assumptions explicitly when comparing HOMER-derived and TEM-derived LCOE values. However, these scenario bounds should not be interpreted as probabilistic uncertainty intervals, because no stochastic sampling or Monte Carlo analysis was performed.
4. Discussion
This section interprets the technical and economic results in relation to the proposed TEM–HOMER framework. The discussion focuses on metric reconciliation and methodological contribution, battery–hydrogen storage roles, excess electricity and curtailment, architecture-level comparison, flexible demand extensions, and the transferability and limitations of the proposed framework.
4.1. Metric Reconciliation and Methodological Contribution
The main methodological contribution of this study is an auditable economic reconstruction that enables a consistent interpretation of retained PV–BESS–H2 benchmark configurations. The contribution is therefore not a new sizing optimization, or a validation or reproduction of HOMER Pro’s internal routines. This distinction is important because hybrid renewable energy system assessments often combine software-reported cost indicators with externally calculated techno-economic metrics, even when replacement schedules, residual value, salvage treatment, degradation assumptions, discounting, and electricity denominator definitions are not fully aligned. Under these conditions, apparent differences in economic performance may arise from accounting conventions rather than from the intrinsic behavior of the energy architecture.
In the proposed framework, HOMER Pro provides the retained archived configurations and operational benchmark outputs, whereas the aligned techno-economic model (TEM) provides a transparent economic interpretation layer. The TEM does not attempt to reproduce HOMER Pro’s proprietary dispatch, optimization, replacement, salvage, ranking, or internal cost-accounting routines. Instead, it reconstructs NPC and LCOE using explicit assumptions for component capacities, capital costs, scheduled replacements, O&M treatment, discounting, PV degradation, salvage convention, and discounted lifetime delivered electricity. This separation allows the operational benchmark and the external economic reconstruction to be interpreted independently, while maintaining a consistent basis for comparison. A central element of this reconciliation is the use of a HOMER-derived LCOE. The cost-of-energy value reported directly by the HOMER Pro graphical interface was not used as the quantitative benchmark because its internal accounting convention may differ from the one implemented in the TEM. Instead, a HOMER-derived LCOE was recalculated from the archived HOMER Pro NPC and the discounted lifetime delivered electricity using the same delivered-energy denominator adopted in the TEM. This procedure avoids direct comparison between non-equivalent cost indicators and provides a common basis for comparing archived HOMER economic outputs with externally reconstructed TEM indicators.
The resulting agreement between the HOMER-derived and TEM-derived LCOE values indicates that the external TEM captures the dominant lifecycle cost structure of the retained configurations under an explicit and denominator-harmonized LCOE convention. This agreement should not be interpreted as evidence that the TEM reproduces HOMER Pro’s internal salvage, replacement, dispatch, optimization, or cost-accounting routines. In particular, the TEM base case adopts a zero end-of-life salvage credit, whereas the archived HOMER NPC values are treated as benchmark economic outputs from the retained HOMER Pro configurations. The comparison is therefore metric-reconciled rather than a component-by-component replication of HOMER Pro internal accounting.
This distinction strengthens the reproducibility of this study. By separating archived HOMER Pro benchmark outputs from the TEM-based reconstruction, the proposed framework makes the economic interpretation auditable and assumption-dependent rather than software-opaque. It allows readers to trace how component capacities, replacement schedules, O&M assumptions, discounting, PV degradation, salvage convention, and delivered electricity affect NPC and LCOE. It also enables sensitivity analysis without requiring new HOMER Pro optimization runs, which is useful when the objective is to evaluate the robustness of retained configurations under alternative techno-economic assumptions.
Accordingly, the value of the proposed TEM–HOMER framework lies in metric reconciliation, transparent cost reconstruction, and storage role interpretation for retained benchmark configurations. The framework does not claim global optimality, Pareto optimality, or universal superiority of the PV–BESS–H2 architecture. Rather, it provides a reproducible basis for interpreting how archived feasible configurations behave economically when their cost and energy metrics are reconstructed under explicit accounting boundaries. This is especially relevant for early-stage technology assessment of off-grid renewable microgrids, where understanding the effect of assumptions, denominators, replacement schedules, degradation, and salvage conventions can be as important as identifying a technically feasible system architecture.
4.2. Battery–Hydrogen Storage Roles
The operational indicators support the interpretation of PV–BESS–H2 systems as layered storage architectures rather than as systems with interchangeable storage capacity. In the retained configurations, the BESS operates primarily as a short-duration balancing resource. Its role is associated with frequent charge–discharge events that absorb intra-day PV variability, reduce short-term mismatches between generation and demand, and limit immediate reliance on the PEM fuel cell.
This role becomes more pronounced in the high-demand case, where battery discharge relative to load served increases from 13.6% to 31.4%. This confirms a stronger dependence on electrochemical storage for routine balancing as residential demand increases. The hydrogen pathway plays a different role. Rather than competing directly with the battery in short-duration cycling, the electrolyzer–tank–PEM fuel cell chain acts as a delayed-backup pathway. Surplus PV electricity that is not immediately consumed by the load or absorbed by the BESS can be converted into hydrogen, stored, and later recovered through the PEM fuel cell during deficit periods. This interpretation is consistent with the PEM fuel cell output-to-load indicator, which shows that the hydrogen subsystem contributes to load support in both scenarios, although its relative contribution is higher in the low-demand configuration. This distinction is important because the BESS and hydrogen subsystem should not be evaluated as direct substitutes. The BESS has higher short-term storage efficiency and faster operational response, making it more suitable for daily balancing. In contrast, the hydrogen pathway introduces additional conversion losses but provides a route for storing surplus renewable electricity beyond the immediate battery-buffering function. Therefore, the lower apparent H2 electricity return ratio does not invalidate the role of hydrogen in the retained architecture. Instead, it reveals that the hydrogen subsystem is not intended to maximize round-trip efficiency for short cycles but to provide delayed backup, surplus energy utilization, and additional renewable autonomy under off-grid constraints. The differentiated storage behavior also links technical operation to economic interpretation. Battery costs influence routine balancing and replacement burden, particularly in the high-demand case with a larger battery bank. Hydrogen-related components influence backup capability, surplus conversion, and the extent to which PV overgeneration can be routed into a storable energy carrier. Thus, the PV–BESS–H2 architecture should be interpreted as a layered storage configuration in which the battery and hydrogen subsystem provide complementary, time-scale-dependent functions rather than redundant services.
4.3. Curtailment and Excess Electricity
The excess electricity indicator provides additional insight into the operational limits of the retained PV–BESS–H2 configurations. In this study, excess electricity is interpreted as residual surplus after all admissible storage and conversion pathways have been used. In other words, PV electricity becomes excess only after the instantaneous load has been supplied, the battery has reached its admissible charging limit, the electrolyzer cannot absorb additional power, the hydrogen tank cannot store additional hydrogen, or no flexible demand is available to shift consumption toward surplus generation periods.
This interpretation is important because excess electricity should not be treated simply as a failure of the PV–BESS–H2 architecture. Under fully renewable off-grid constraints, retained configurations may prioritize reliability and negligible unmet load, which can require PV oversizing and storage redundancy. As a result, residual surplus may remain even when both battery and hydrogen pathways are present. In this sense, excess electricity reflects the interaction among PV sizing, demand timing, battery capacity, electrolyzer rating, hydrogen storage capacity, PEM fuel cell backup requirements, and the absence of flexible controllable loads.
The higher excess electricity ratio observed in the high-demand case suggests that the retained configuration still leaves part of the PV surplus unused after the load-serving, battery-charging, and hydrogen production pathways have been satisfied. This does not invalidate the technical feasibility of the configuration. Rather, it indicates that the retained architecture was not necessarily optimized to minimize curtailment. Because the system is evaluated as a fixed benchmark configuration under renewable-only operation, excess electricity should be interpreted as an opportunity for further architecture-level refinement rather than as a direct measure of poor performance.
Future reductions in excess electricity could be achieved through several strategies. Increasing electrolyzer capacity could allow a larger share of short-duration PV surplus to be converted into hydrogen. Increasing hydrogen storage capacity could also improve surplus absorption, although this option should be evaluated together with tank cost assumptions, PEM fuel cell utilization, and the actual frequency of long-duration deficits. Demand-side management could further improve surplus use by shifting flexible consumption toward high-PV hours. In tropical residential contexts, cooling-related demand response, thermal comfort bands, EV charging, domestic hot water loads, and flexible hydrogen production may be more relevant than space heating flexibility. Alternative dispatch rules could also modify the balance between battery charging, hydrogen production, and residual curtailment.
Accordingly, the excess electricity results should be interpreted together with the storage role indicators and sensitivity analysis. The battery provides short-duration balancing, the hydrogen subsystem provides delayed backup and surplus conversion, and excess electricity represents the residual renewable energy that remains after these roles have been fulfilled under the retained configuration. This reinforces the need to distinguish between technical feasibility, reliability-oriented sizing, and curtailment-minimizing optimization in future PV–BESS–H2 microgrid assessments.
4.4. Architecture-Level Comparison
The storage role interpretation also provides a basis for discussing the retained PV–BESS–H
2 architecture relative to simpler off-grid renewable configurations. Previous studies have demonstrated the feasibility of off-grid HRES configurations under different climatic, technological, and demand contexts [
44,
45]. Other works have focused more specifically on residential PV–battery operation, battery self-consumption, and the role of batteries in short-duration balancing [
46]. Battery–hydrogen configurations have also been studied as hybrid storage architectures in which batteries and hydrogen pathways provide complementary services across different time scales [
47,
48].
Within this research context, the present study does not claim universal superiority of PV–BESS–H2 over PV–battery-only or PV–hydrogen-only alternatives. Instead, it uses a retained PV–BESS–H2 benchmark architecture to examine how layered storage roles, metric reconciliation, and TEM-based sensitivity analysis can support a more transparent interpretation of tropical off-grid residential microgrids. The objective is therefore not to replace a formal re-optimization of alternative architectures but to clarify the functional trade-offs associated with different storage choices.
Table 12 presents a qualitative architecture-level comparison. A PV–battery-only system can provide high short-term efficiency, fast response, and relatively simple operation. However, long-duration autonomy may require a large battery bank, increasing capital cost, replacement burden, and material requirements. A PV–hydrogen-only system can support longer-duration storage and renewable backup, but its lower electrical round-trip efficiency and weaker suitability for frequent short cycles make it less attractive for routine intra-day balancing. The retained PV–BESS–H
2 architecture combines these two storage layers: the BESS supports short-duration balancing, while the hydrogen subsystem provides delayed backup and a route for surplus PV conversion.
This comparison shows that the three architectures address different operational needs. Batteries are better suited to frequent daily balancing, whereas hydrogen becomes more relevant when surplus renewable electricity must be stored beyond the immediate battery-buffering function. Therefore, a low apparent H2 electricity return ratio does not by itself invalidate the inclusion of hydrogen. Rather, it indicates that the hydrogen pathway should be evaluated according to its backup, autonomy, and surplus conversion roles, not as a direct substitute for battery cycling.
A fair quantitative comparison among PV–battery-only, PV–hydrogen-only, and PV–BESS–H2 architectures would require independent sizing, dispatch, cost, and reliability optimization for each topology under the same climatic, demand, and economic assumptions. Within the scope of this work, the PV–BESS–H2 system is interpreted as a retained benchmark architecture that enables analysis of storage complementarity, metric reconciliation, and sensitivity behavior in a tropical off-grid residential context.
4.5. Flexible Demand and Future Curtailment Reduction
The excess electricity results also highlight the importance of flexible demand in future PV–BESS–H2 microgrid assessments. In the retained configurations evaluated in this study, residential demand was represented as a fixed hourly load profile, without explicit demand response, controllable appliances, electric vehicle charging, or thermal load shifting. Under this modeling structure, PV surplus can only be absorbed by the instantaneous load, the battery, the electrolyzer, or the hydrogen tank. Once these pathways are saturated or limited by their rated capacities, the remaining surplus appears as excess electricity.
Future curtailment reduction could therefore be addressed not only through larger storage or conversion components, but also through flexible demand strategies. Electric vehicle charging, controllable HVAC operation, cooling-related demand response, domestic hot water loads, flexible hydrogen production, and appliance scheduling could shift part of the electricity demand toward high-PV-production hours. These strategies would increase the use of locally generated renewable electricity and could reduce the residual surplus that remains after battery charging and hydrogen production.
The relevance of each flexible demand option depends strongly on the climatic and residential context. In tropical residential contexts such as Chetumal, cooling-related demand response and EV charging may be more relevant than space-heating heat pump flexibility. HVAC operation could be shifted within acceptable thermal comfort bands, allowing part of the cooling load to coincide with daytime PV production without compromising indoor comfort. Similarly, EV charging could provide a flexible electrical load if charging schedules are coordinated with solar availability. Domestic hot water production and heat pump operation may also contribute to load shifting, although their relevance may be lower than cooling-related flexibility in warm tropical climates.
Flexible hydrogen production represents another possible strategy. Instead of operating the electrolyzer only as a residual surplus absorber, future dispatch strategies could coordinate electrolyzer operation with PV availability, hydrogen storage state, expected evening deficits, and forecasted demand. Such control strategies could improve the use of PV surplus while preserving the delayed-backup role of the hydrogen pathway.
These extensions were outside the scope of the present benchmark reconstruction because the retained HOMER Pro outputs and the aligned TEM were based on fixed demand profiles and fixed component capacities. However, incorporating flexible loads, demand response, and forecast-based dispatch would be a natural next step for reducing curtailment, improving system utilization, and evaluating whether the retained PV–BESS–H2 architecture can be further refined under tropical off-grid residential conditions.
4.6. Transferability and Limitations
The proposed framework is transferable, but the numerical results are site, demand, cost, and configuration-specific. Its transferable contribution lies in the structure of the TEM–HOMER workflow rather than in the direct generalization of the obtained LCOE, NPC, component capacities, excess electricity levels, or storage role shares. The framework can be adapted to other off-grid residential contexts by replacing the climatic inputs, demand profiles, retained system configurations, component costs, degradation assumptions, and economic parameters.
Several elements of the framework are directly transferable. The separation between archived simulation outputs and transparent TEM-based economic reconstruction can be applied to other HOMER Pro cases or comparable simulation tools. Similarly, the NPC and LCOE equations, replacement cost treatment, O&M assumptions, salvage treatment, discounting, and discounted delivered electricity provide an auditable basis for metric reconciliation. The storage role and sensitivity indicators also provide reproducible tools for interpreting system behavior under fixed benchmark configurations.
The numerical outcomes reported in this study are bounded by the Chetumal solar resource, the constructed low- and high-demand scenarios, the retained HOMER Pro configurations, the adopted component costs, the replacement schedule, the discount rate, PV degradation, and the TEM accounting convention. The excess electricity ratio and the relative contributions of the BESS and hydrogen subsystem are also specific to the retained PV–BESS–H2 architecture, including the fixed 2 kg hydrogen tank, selected electrolyzer and PEM fuel cell capacities, battery bank sizes, and absence of flexible demand. Accordingly, these values should be interpreted as case-specific benchmark results rather than universal performance indicators for PV–BESS–H2 microgrids.
A major methodological limitation is that the original HOMER Pro search space, candidate component ranges, feasible solution set, optimization ranking, Pareto front, and near-optimal alternatives were not available for reconstruction. Consequently, the framework is reproducible at the level of metric-reconciled TEM reconstruction for retained benchmark configurations but not at the level of reproducing the original HOMER Pro optimization process. The retained configurations were therefore treated as archived benchmark cases and were not re-optimized in this revision.
Accordingly, the results do not represent globally optimal or Paretooptimal sizing, nor do they demonstrate universal superiority of PV–BESS–H2 over PV–battery-only, PV–hydrogen-only, or alternative PV–BESS–H2 designs. A fair architecture-level comparison would require independent sizing, dispatch, cost, and reliability optimization for each alternative under common climatic, demand, and economic assumptions.
Additional limitations arise from the modeling assumptions. The residential demand profiles are representative constructed scenarios rather than monitored household load traces. Weekday/weekend variability, occupant behavior, appliance-level demand, dynamic temperature–demand coupling, and flexible loads were not explicitly modeled. The component-level representation also excludes part-load electrolyzer and PEM fuel cell performance, cycling-dependent battery degradation, hydrogen pressure dynamics, thermal coupling, and degradation-aware supervisory control. These assumptions preserve transparency and consistency in the metric reconciliation framework, but they should be addressed in future operational studies.
Future work should extend the framework using monitored residential demand data, stochastic weather/year analysis, updated local cost information, degradation-aware battery and hydrogen models, flexible demand, EV charging, cooling-related demand response, and forecast-based dispatch. New HOMER Pro or open-source optimization runs should also be performed under fully documented search space bounds to compare PV–battery-only, PV–hydrogen-only, and PV–BESS–H2 architectures on a common Pareto or multi-criteria basis. Such extensions would move the proposed TEM–HOMER framework from benchmark reconstruction toward broader architecture comparison, curtailment reduction, and tropical microgrid design optimization.
5. Conclusions
This study provides a metric-reconciled techno-economic reconstruction of retained PV–BESS–H2 benchmark configurations for tropical off-grid residential applications in Chetumal, Mexico. Its contribution is not a new sizing optimization routine or a claim of universal superiority for the PV–BESS–H2 architecture. Instead, this study introduces a transparent TEM–HOMER workflow that separates archived operational benchmark outputs from an auditable economic reconstruction. This separation enables a consistent interpretation of NPC, LCOE, storage roles, excess electricity, and sensitivity behavior for fixed retained configurations.
The TEM closely matched the HOMER-derived economic benchmark under harmonized accounting assumptions. In the low-demand scenario, the HOMER-derived LCOE was 0.3204 USD/kWh, compared with a TEM-derived value of 0.3320 USD/kWh, corresponding to a relative deviation of approximately +3.6%. In the high-demand scenario, the HOMER-derived and TEM-derived LCOE values were 0.3497 and 0.3571 USD/kWh, respectively, corresponding to a relative deviation of approximately +2.1%. These deviations indicate that the TEM captures the dominant economic structure of the retained configurations when NPC, discounted delivered electricity, replacement effects, O&M costs, salvage treatment, discounting, and PV degradation are handled under a common accounting convention.
The metric reconciliation step was central to the interpretation of the economic results. Rather than comparing the HOMER Pro graphical interface cost of energy directly with an externally calculated TEM LCOE, a HOMER-derived LCOE was recalculated from the archived HOMER Pro NPC values and discounted lifetime delivered electricity using the same convention adopted in the TEM. This procedure avoids attributing differences in accounting definitions to technological performance and provides a more consistent basis for comparing software-derived and externally reconstructed economic indicators.
The storage role indicators showed that the BESS and hydrogen subsystem perform differentiated and complementary functions. The BESS primarily supports short-duration balancing, with battery discharge relative to load served increasing from 13.6% in the low-demand case to 31.4% in the high-demand case. The hydrogen pathway operates as a delayed-backup and surplus-conversion route, contributing to load support through the PEM fuel cell while absorbing part of the PV surplus through the electrolyzer. The battery and hydrogen subsystems should therefore not be interpreted as direct substitutes but as storage layers operating at different time scales and with different economic implications.
The sensitivity analysis confirmed that the economic performance of the retained configurations is strongly assumption-dependent. Delivered electricity, discount rate, PV capital cost, battery capital cost, and PV degradation were among the dominant LCOE drivers. The deterministic multi-parameter scenarios further showed that simultaneous changes in financing, component costs, O&M, PV degradation, and delivered electricity can substantially shift the LCOE away from the base reconstruction. Hydrogen-related components also affected the economic interpretation, although their relative influence was lower under the adopted TEM cost assumptions. In particular, the negligible H2 tank cost effect should be interpreted as model-specific and should not be generalized to all hydrogen storage applications.
This study has clear scope limitations. The retained configurations were treated as archived benchmark cases and were not re-optimized in this revision. Therefore, the results should not be interpreted as globally optimal, Pareto-optimal, or as evidence that PV–BESS–H2 is universally superior to PV–battery-only or PV–hydrogen-only alternatives. The numerical results are specific to the Chetumal climatic context, the constructed demand scenarios, the retained component capacities, the adopted cost assumptions, and the fixed demand profiles used in the benchmark reconstruction.
Future work should extend the framework through independent re-optimization of alternative architectures, Pareto-based trade-off analysis, monitored residential load data, stochastic weather/year assessment, degradation-aware battery and hydrogen models, part-load electrolyzer and PEM fuel cell performance, dynamic temperature–demand coupling, and flexible loads. In tropical residential contexts, cooling-related demand response, EV charging, domestic hot water loads, flexible hydrogen production, and forecast-based dispatch may be especially relevant for reducing excess electricity and improving renewable energy utilization. These extensions would allow the proposed TEM–HOMER framework to move from benchmark reconstruction toward broader architecture comparison and curtailment-aware tropical microgrid design.





 ,
,