


Abstract
Artificial Intelligence (AI) adoption has emerged as a critical priority for governments globally, driven by its transformative potential in improving public service delivery, governance efficiency, and innovation ecosystems. Despite this, substantial disparities exist in AI readiness and adoption levels across countries, necessitating an in-depth exploration of the factors influencing AI adoption. This study leverages data from the Oxford Insights Government AI Readiness Index to model cross-country patterns of government AI readiness through clustering, regression, classification, and explainable machine learning. A Random Forest regression model was first used to estimate the 2024 AI Government Readiness score using lagged 2023 indicators. However, because the dependent variable is a composite index constructed from conceptually related dimensions, this model is interpreted as a lagged score-approximation and benchmarking exercise rather than as an independent forecasting model. The main analytical contribution lies in the clustering-classification framework, which identifies four country-level AI readiness profiles and evaluates the indicators that most strongly distinguish countries across low, moderate-low, intermediate, and high readiness groups. SHAP and permutation-based interpretation methods are used to examine feature contributions, while recognizing that these results indicate model contribution rather than causal effects. The findings underscore the multifaceted nature of AI readiness, emphasizing the interplay between governance, digital infrastructure, and technological investment.
1. Introduction
Artificial Intelligence (AI) has emerged as a transformative technology with profound implications for societies, governments, and industries globally. Its application in public and private sectors has demonstrated immense potential to enhance efficiency, optimize resource allocation, and create innovative solutions to complex problems [1,2]. However, while AI adoption is advancing rapidly in some regions, significant disparities persist in readiness and implementation across countries, driven by differences in resources, governance structures [3], and technological capabilities [2,4]. Understanding these disparities and the factors influencing AI adoption has become critical for global efforts to harness AI’s benefits equitably.
The importance of analyzing the factors influencing AI adoption lies in addressing these disparities and ensuring inclusive progress. AI can empower governments and organizations to make data-driven decisions, improve public service delivery, and respond to societal challenges effectively [5]. However, without adequate attention to the contextual variables that drive or hinder adoption, such as governance frameworks, technological infrastructure, and human capital, the benefits of AI may remain concentrated in certain regions or organizations [6,7]. Moreover, ethical concerns such as fairness, transparency, and accountability further complicate the adoption process, particularly in public sector contexts where trust and legitimacy are paramount [2,4].
Existing studies on AI readiness and digital transformation tend to follow three main approaches. First, several studies focus on single-country analyses that examine the determinants of AI adoption within specific national contexts. For instance, ref. [4] analyzes the institutional quality, digital infrastructure, governance effectiveness, and regulatory capacity shape the adoption of AI systems in Brazil. The study emphasized that AI readiness depends not only on technological availability, but also on the strength of public institutions, government coordination, and ability to promote trust, transparency, and responsible AI deployment. Similarly, ref. [8] examines AI adoption patterns in Mexico by emphasizing the role of education quality, research and development investment, technological innovation, and public sector digitalization as key determinants of national AI readiness [9]. While these studies provide valuable country-specific insights, their findings are difficult to generalize across heterogeneous contexts of Latin America and the Caribbean.
Second, other studies such as [10] rely on descriptive readiness assessments based on composite indexes, international rankings, and benchmarking frameworks, showing that the combination of multiple dimensions, including digital infrastructure, governance effectiveness, innovation capacity, human capital, regulatory quality, and data governance, to provide broad comparative overview of how countries perform relative to one another. They are particularly useful for identifying regional disparities in institutional and technological preparedness; however, they often provide limited causal explanation regarding which factors most strongly drive AI readiness outcomes.
Third, only a limited number of studies integrate machine learning techniques to explain AI readiness through non-linear relationships and complex variable interactions across countries [11,12]. This methodological gap restricts the ability to move beyond descriptive benchmarking and weakens the design of evidence-based and context-sensitive policy interventions.
This study aims to address these challenges by modeling the global structure of government AI readiness, with a focus on identifying country-level readiness profiles and the indicators that distinguish countries across different levels of preparedness for AI adoption. Existing literature provides extensive insights into drivers, challenges, and implications of AI adoption, particularly in the context of public governance and technological readiness [4,10]. At the same time, research highlights important barriers such as weak governance systems, limited data availability, low digital inclusion, cybersecurity risks, and insufficient public trust in AI-driven systems, especially in developing economies [13,14]. From a public governance perspective, AI adoption has been associated with improvements in administrative efficiency, public service delivery, transparency, and policy design; however, these benefits depend heavily on state capacity, regulatory quality, and ethical governance frameworks [15]. These findings confirm that AI readiness is a multidimensional process that goes beyond technological adoption and requires strong institutional coordination and long-term policy planning.
Using a robust dataset and state-of-the-art machine learning models, the research investigates the roles of governance, technological maturity, and data infrastructure in shaping AI adoption trajectories. Specifically, the study seeks to identify the most critical determinants of AI readiness, evaluate their impact on adoption levels, and provide actionable insights for policymakers and organizations. By bridging gaps in existing research, this study contributes to a deeper understanding of how countries can strategically position themselves to benefit from AI advancements. Unlike prior descriptive and governance-oriented studies [10,15,16], this research combines predictive modeling, clustering techniques, and explainable AI methods to provide a comprehensive and interpretable assessment of global AI readiness.
This study distinguishes between two complementary analytical objectives. First, a supervised regression model is used to estimate the 2024 Government AI Readiness score from lagged 2023 indicators. Given that the dependent variable is a composite index derived from related dimensions, this model is interpreted as a lagged score-approximation and benchmarking exercise rather than as a direct forecast of an independent external outcome. Second, and more importantly, the study applies unsupervised clustering to identify country-level AI readiness profiles and then uses classification modeling to examine which indicators distinguish countries across these empirically derived profiles. This second stage constitutes the main empirical contribution of the study.
Three contributions follow from this analytical design. First, it provides a global empirical assessment of government AI readiness by integrating governance, digital infrastructure, and technological variables within a unified analytical framework. Second, it applies machine learning techniques to identify non-linear patterns and heterogeneous country profiles that are often overlooked in traditional descriptive or linear approaches. Third, it offers policy-relevant insights by identifying the indicators and broader readiness domains that most clearly distinguish countries across AI readiness profiles, thereby informing differentiated strategies for institutional strengthening, digital infrastructure development, and innovation policy. The remainder of the article is structured as follows. The next section reviews the literature on global determinants of AI readiness and adoption in government contexts. The subsequent section describes data. The Section 4 presents the empirical results and their modeling strategy, including cluster analysis and machine learning techniques. The Section 5 involves policy implications. The Section 6 concludes and outlines directions for future research.
2. Literature Review
AI adoption has become a critical focus for governments and organizations globally due to its transformative potential across various sectors. Existing literature provides extensive insights into the drivers, challenges, and implications of AI adoption, particularly in the context of public governance and technological readiness.
The role of governance in enabling AI adoption has been extensively studied. Key findings underscore the importance of strategic government action, including the development of national AI strategies and supportive regulatory frameworks. According to [1], the creation of a clear AI roadmap is instrumental in aligning public sector goals with technological advancements. This is further corroborated by [17], who emphasize that countries with well-defined AI policies are better positioned to deploy AI technologies effectively. Moreover, the presence of robust data governance mechanisms, such as privacy laws and ethical guidelines, has been shown to significantly influence AI adoption readiness [18].
Policy effectiveness is also linked to institutional capacity. Governments that invest in building institutional frameworks capable of managing AI risks and opportunities are more likely to achieve widespread adoption [19,20]. This aligns with evidence suggesting a strong interplay between governance quality and technological readiness in determining national AI adoption levels. Moreover, technological infrastructure, particularly telecommunications and digital services, constitutes a foundational pillar of AI readiness. Recent empirical evidence suggests that countries with advanced telecommunications networks and robust digital ecosystems tent to exhibit higher levels of AI adoption [10,21,22]. In particular, investments in broadband and 5G infrastructure have been identified as critical enablers of AI development, especially in data-intensive sectors such as healthcare and smart cities [23,24].
Digital public services also play a critical role. The E-Government Survey developed by [25] demonstrated that countries with higher scores in online services tend to lead in AI adoption, as these services generate valuable datasets and foster digital literacy. This is further supported by findings from [26], who argued that enhancing e-government capabilities not only improves public service delivery but also lays the groundwork for AI integration.
The availability of skilled labor and investment in research and development (R&D) are equally crucial for AI adoption. Graduates in science, technology, engineering, and mathematics (STEM) fields and active participation in global knowledge networks, such as GitHub, are strong indicators of a country’s AI readiness [27]. Similarly, R&D spending directly correlates with the development of AI technologies, as demonstrated by studies on innovation ecosystems in developed economies [28]. Moreover, human capital development is particularly relevant for developing nations, where the lack of technical expertise often hinders AI adoption. Training initiatives and international collaborations aimed at building AI-specific skills can help bridge this gap. For instance, initiatives like artificial intelligence for development (AI4D) have been successful in fostering AI capacity in low-resource settings [29].
Despite the opportunities, several challenges persist in AI adoption. Digital inequality remains a significant barrier, as countries with limited access to digital infrastructure struggle to participate in the global AI economy [10]. Additionally, concerns about ethical risks, such as algorithmic bias and data privacy, have prompted calls for more stringent governance measures [18]. The high cost of implementing AI technologies also limits adoption in low- and middle-income countries. According to [10], many governments lack the financial resources to invest in the infrastructure and talent required for AI deployment. International cooperation and technology transfer are often suggested as viable solutions to address these barriers.
Existing studies often adopt fragmented approaches, focusing on isolated factors rather than their interaction, and rely predominantly on linear methodologies that may fail to capture complex and non-linear relationships [13,21]. Limited attention has been given to cross-country heterogeneity and the role of non-linear relationships in shaping AI readiness. Empirical evidence suggest substantial cross-country heterogeneity in institutional quality, digital infrastructure, innovation capacity, human capital, and regulatory effectiveness, generating heterogeneous AI adoption trajectories across regions [21,30,31]. These differences are particularly pronounced in developing economies, where structural inequalities and governance asymmetries influence the capacity to adopt and regulate AI technologies [13,32]. Moreover, the interaction among these determinants is often non-linear, meaning that improvements in one dimension (e.g., digital infrastructure) may produce different outcomes depending on institutional conditions, education levels, or policy capacity [33]. Traditional linear models may therefore be insufficient to capture these complex interdependencies, which justifies the use of machine learning techniques such as Random Forest to identify hidden patterns and variable importance in cross-country analyses [34,35].
3. Data
Index data published by Oxford Insights are utilized for data modeling [20]. The dataset includes multiple variables related to government AI readiness, covering a wide range of information and communications technology (ICT) indicators of 193 countries. The target variable for the analysis, AI Government Readiness, represents a composite score reflecting each country’s capacity to effectively integrate AI into public services. To include a lag effect in the analysis, the study uses the 2024 AI Government Readiness score as the target variable and 39 indicators from 2023 as the input features. This approach provides a more realistic representation of predictive relationships. To include temporal ordering in the analysis, the study uses the 2024 AI Government Readiness score as the target variable and 39 indicators from 2023 as input features [36]. This design avoids using same-year indicators to estimate the same-year readiness score. However, because the AI Government Readiness score is a composite index constructed from conceptually related dimensions, the lagged design does not fully eliminate structural dependence between the predictors and the target. Therefore, the regression task is interpreted as a lagged score-approximation exercise rather than as the prediction of a fully independent external outcome. The study uses machine learning to model readiness patterns and identify indicators associated with country-level readiness profiles, without making causal claims. Government AI Readiness is a composite index based on 10 dimensions grouped into three main pillars: government, technology sector, and data and infrastructure (Figure 1). This multidimensional structure captures substantial cross-country heterogeneity, as it allows the model to identify differentiated patterns and non-linear relationships in AI readiness across diverse contexts.
Figure 1.
AI Government Readiness structure. Source: [20].
- •
- Government: Establishment of clear and strategic vision for developing and governing AI, complemented by robust regulations and proactive management of ethical risks (governance and ethics). Additionally, this pillar also includes strong internal digital capabilities, including the skills and organizational practices necessary to remain agile and responsive to emerging technologies.
- •
- Technology sector: The availability of effective AI tools depends on a well-developed technology sector capable of meeting government demands. This sector should exhibit a high capacity for innovation, supported by a business ecosystem conducive to entrepreneurship and substantial investment in research and development. A skilled and well-educated workforce is also critical for the sector’s success.
- •
- Data and infrastructure: AI technologies rely heavily on access to extensive, high-quality data (data availability), which should also be representative of the population to minimize bias and inaccuracies (data representativeness). The ability to harness the potential of this data is essential for AI implementation.
The dataset was preprocessed to address missing values and ensure consistency across observations. Missing-value treatment is an important preprocessing step because incomplete observations may reduce model stability and introduce estimation bias if not handled appropriately [37,38]. To prevent data leakage, the train-test split was performed before any preprocessing step that could learn from the data distribution. Missing-value imputation was fitted only on the training data and then applied to the test data using the parameters learned from the training set. The same leakage-controlled procedure was used for both the regression-based score approximation model and the classification of AI-readiness profiles. No 2024 explanatory indicators were used during feature engineering; the predictors correspond to the 39 Oxford Insights indicators from 2023, while the 2024 AI Government Readiness score was used only as the target variable in the regression task. Moreover, to ensure a comprehensive understanding of the dataset, descriptive statistics were computed for all variables, including mean, standard deviation, minimum, and maximum values. This step allows for the identification of variability across countries and provides initial insights into the distributional properties of the indicators.
4. Results
4.1. Descriptive Statistics
Table 1 shows descriptive statistics of normalized data (from source), taking values from 0 to 100. The index is constructed as the unweighted arithmetic mean of its corresponding dimensions and pillars, following the methodology proposed by [20]. AI Government Readiness with a mean of 44.94 indicates moderate readiness globally, showcasing substantial disparities among countries, with the lowest score of 9.20. The relatively low global average, combined with a wide range of values, indicates substantial cross-country heterogeneity in AI readiness. This dispersion suggests that structural differences in governance capacity, technological infrastructure, and human capital significantly shape countries’ ability to adopt AI.
Table 1.
Descriptive statistics (target and feature variables).
Within the government pillar, AI strategy has a mean score of 37.31, suggesting that a significant proportion of countries remain in early stages of strategic AI development compared to more advanced economies. Similarly, ethical principles and guidelines incorporation into AI frameworks are lagging globally, with a mean of just 17.88. However, there is a more consistent adoption of data protection and privacy regulations among countries, with a mean of 78.84. Digital capacity, a critical factor in AI readiness, reveals mixed progress. Online services achieved a global score of 55.77, representing an intermediate level of digital service provision among countries. However, foundational IT infrastructure, vital for supporting AI operations, scored slightly better, with a mean of 57.75. Government promotion of emerging technologies scored 39.56, suggesting that while some countries actively encourage innovation, many still face problems promoting advanced technologies adoption.
In terms of the technology sector, the data indicates that venture capital availability is low, resulting in limited financial backing for AI entrepreneurship in most countries [39]. Similar disparities are found in other relevant indicators such as R&D spending, AI research papers publications and computer software spending. On the other hand, private investment in emerging technologies scored 43.09, representing the reality of many economies with low or medium innovation capabilities. Human capital indicators highlight gaps in workforce readiness. Graduates in STEM or computer science averaged 29.55, suggesting that while there is some emphasis on technical education, there is room for significant improvement. However, female STEM graduates recorded a relatively high mean of 67.43, reflecting progress in gender inclusivity within technical fields. ICT skills scored a mean of 32.61 with a high standard deviation of 23.83, indicating uneven digital skills among populations.
Regarding data and infrastructure, foundational for data-driven AI, achieved an average score of 57.87 and 50.26 respectively, indicating moderate levels of global development. Broadband quality scored a mean of 42.60, with some nations achieving as low as 18.40, highlighting persistent connectivity disparities. Data availability and governance represent important challenges. Open data initiatives had a low mean score of 34.67, emphasizing the need for more transparent data-sharing practices. Similarly, data governance, vital for ensuring data quality and security, recorded an average of just 25.39. Societal factors, such as household internet access, showed progress with a mean of 63.98 but still highlighted inequities. Moreover, the cost of the cheapest internet-enabled device averaged 52.90% of monthly GDP, underscoring affordability challenges in many regions of the world.
Overall, the descriptive results reveal three key patterns: (i) significant disparities in AI readiness across countries, (ii) relatively stronger performance in regulatory aspects compared to strategic and innovation dimensions, and (iii) persistent gaps in human capital, data governance, and innovation-system capacity. These patterns highlight the multidimensional and uneven nature of AI readiness at the global level. The high standard deviations observed across several indicators further confirm the presence of heterogeneous distributions, reinforcing the need for analytical approaches capable of capturing non-linear, context-specific, and profile-based differences among countries.
Table 1 provides an overview of the distributional characteristics of the target and explanatory variables. Since the indicators are normalized on a 0–100 scale, differences in means and standard deviations can be interpreted as differences in relative readiness across countries. High standard deviations indicate substantial cross-country dispersion, suggesting that countries differ considerably in their institutional, technological, and data-infrastructure conditions. Variables such as AI strategy, ethical principles, 5G infrastructure, and data governance show particularly high variability, indicating that these dimensions are unevenly developed across countries. In contrast, indicators such as gender gap in internet access and time spent dealing with government regulations show lower dispersion, suggesting more limited variation across the sample.
4.2. Correlation Analysis
Figure 2 presents the correlation matrix of the explanatory variables. Regulatory quality exhibits strong positive correlation with key indicators such as government effectiveness, telecommunication infrastructure, adoption of emerging technologies, ICT trade, and online services. This pattern suggests that a stronger institutional framework is associated with higher levels of technological development and digital capacity. Moreover, these results indicate that governance-related variables are closely interconnected with technological and innovation indicators, highlighting the systemic nature of AI readiness. In contrast, some variables exhibit weak or negative correlations, indicating that not all dimensions evolve simultaneously and reinforcing the presence of heterogeneous development paths across countries.
Figure 2.
Correlation matrix.
The presence of high correlations above 0.7 among several predictors indicates potential multicollinearity and conceptual overlap among index components [40]. Although Random Forest models are generally less sensitive to multicollinearity than parametric regression models in terms of predictive performance [41], correlated predictors may still affect the interpretation of individual feature-importance measures. In particular, importance may be distributed across related variables or concentrated in one indicator that acts as a proxy for a broader latent dimension. Therefore, feature-importance results are interpreted cautiously and discussed primarily at the level of broader AI-readiness domains, such as digital public capacity, institutional governance, technological dynamism, innovation capacity, human capital, and data infrastructure.
Figure 2 should be interpreted as a diagnostic tool for identifying relationships among explanatory variables before applying machine learning models. Positive correlations indicate that countries scoring high in one readiness dimension tend to score high in another, while weaker correlations suggest that some dimensions evolve more independently. The presence of several correlations above 0.7 indicates that AI readiness indicators are not independent but form interrelated domains. This finding supports the interpretation of AI readiness as a multidimensional system, while also requiring caution in interpreting individual feature-importance rankings because correlated indicators may share explanatory information.
4.3. Cluster Analysis
Given that the dependent variable is a composite index derived from the input features, an unsupervised learning approach is employed to identify underlying structures in the data and mitigate potential multicollinearity issues. This approach allows the analysis to uncover latent groupings of countries without imposing prior assumptions, providing a complementary perspective to the supervised prediction model. A K-means clustering algorithm was applied to the 39 input features representing various AI readiness indicators across countries after standardizing the variables to ensure comparability across different scales. The objective is to identify clusters of countries with similar structural characteristics AI readiness. The K-means algorithm is appropriate as it groups observations based on their feature similarity [42], enabling the identification of homogeneous groups of countries based on similarities in their AI readiness profiles.
To determine the ideal number of clusters, two key metrics were examined, inertia and silhouette score, as shown in Figure 3. The inertia graph shows a clear elbow at k = 4, where the rate of decrease in inertia slows, indicating that additional clusters provide limited improvements in explaining within cluster variance [43]. Similarly, the silhouette score also reaches a local maximum around k = 4, indicating well separated and internally cohesive clusters. This result suggests the existence of four distinct AI readiness profiles across countries, reflecting heterogeneous development patterns. Therefore, these clusters capture structural heterogeneity in governance capacity, technological development, and data infrastructure, reinforcing the relevance of differentiated policy approaches. The identified clusters are subsequently used to support the classification analysis and to better interpret the non-linear relationships identified in the predictive models. Overall, both metrics consistently support the selection of k = 4 as the optimal number of clusters.
Figure 3.
Cluster selection (k = 4).
Figure 4 presents the clustering results, where countries are grouped into four clusters, obtained through principal component analysis (PCA), which reduces the 39-dimensional feature space into two principal components (PC1 and PC2) for visualization purposes. Each color represents a distinct cluster, highlighting groups of countries with similar AI readiness profiles. There is a minor overlap particularly between cluster 2 and 3, suggesting that some countries share intermediate characteristics between these groups. However, increasing the number of clusters beyond k = 4 would reduce cluster interpretability and may lead to over = segmentation given the sample size (193 countries), limiting the robustness of subsequent classification analysis. The visual separation of clusters indicates the presence of distinct structural patterns in AI readiness across countries, reinforcing the existence of heterogeneous development trajectories. Therefore, these results further support the use of non-linear modeling approaches to capture complex relationships that cannot be identified through linear methods.
Figure 4.
K-means clustering (k = 4). Note: Cluster 0 = countries with a low AI readiness profile, Cluster 1 = countries with a high AI readiness profile, Cluster 2 = countries with a moderate-low AI readiness profile, and Cluster 3 = countries with an intermediate AI readiness profile.
Cluster Profile
Table 2 summarizes the main characteristics of each cluster. A categorical variable, “AI readiness profile”, is constructed based on cluster classification. The full list of countries by clusters is reported in Appendix A and Figure 5 shows the number of countries per cluster classified according AI adoption level.
Table 2.
Cluster profiles and AI readiness classification.
Figure 5.
Number of countries per cluster.
The AI adoption level per cluster is presented in Figure 6 and the differences across country clusters are summarized as follows:
Figure 6.
Distribution of AI readiness among clusters.
- •
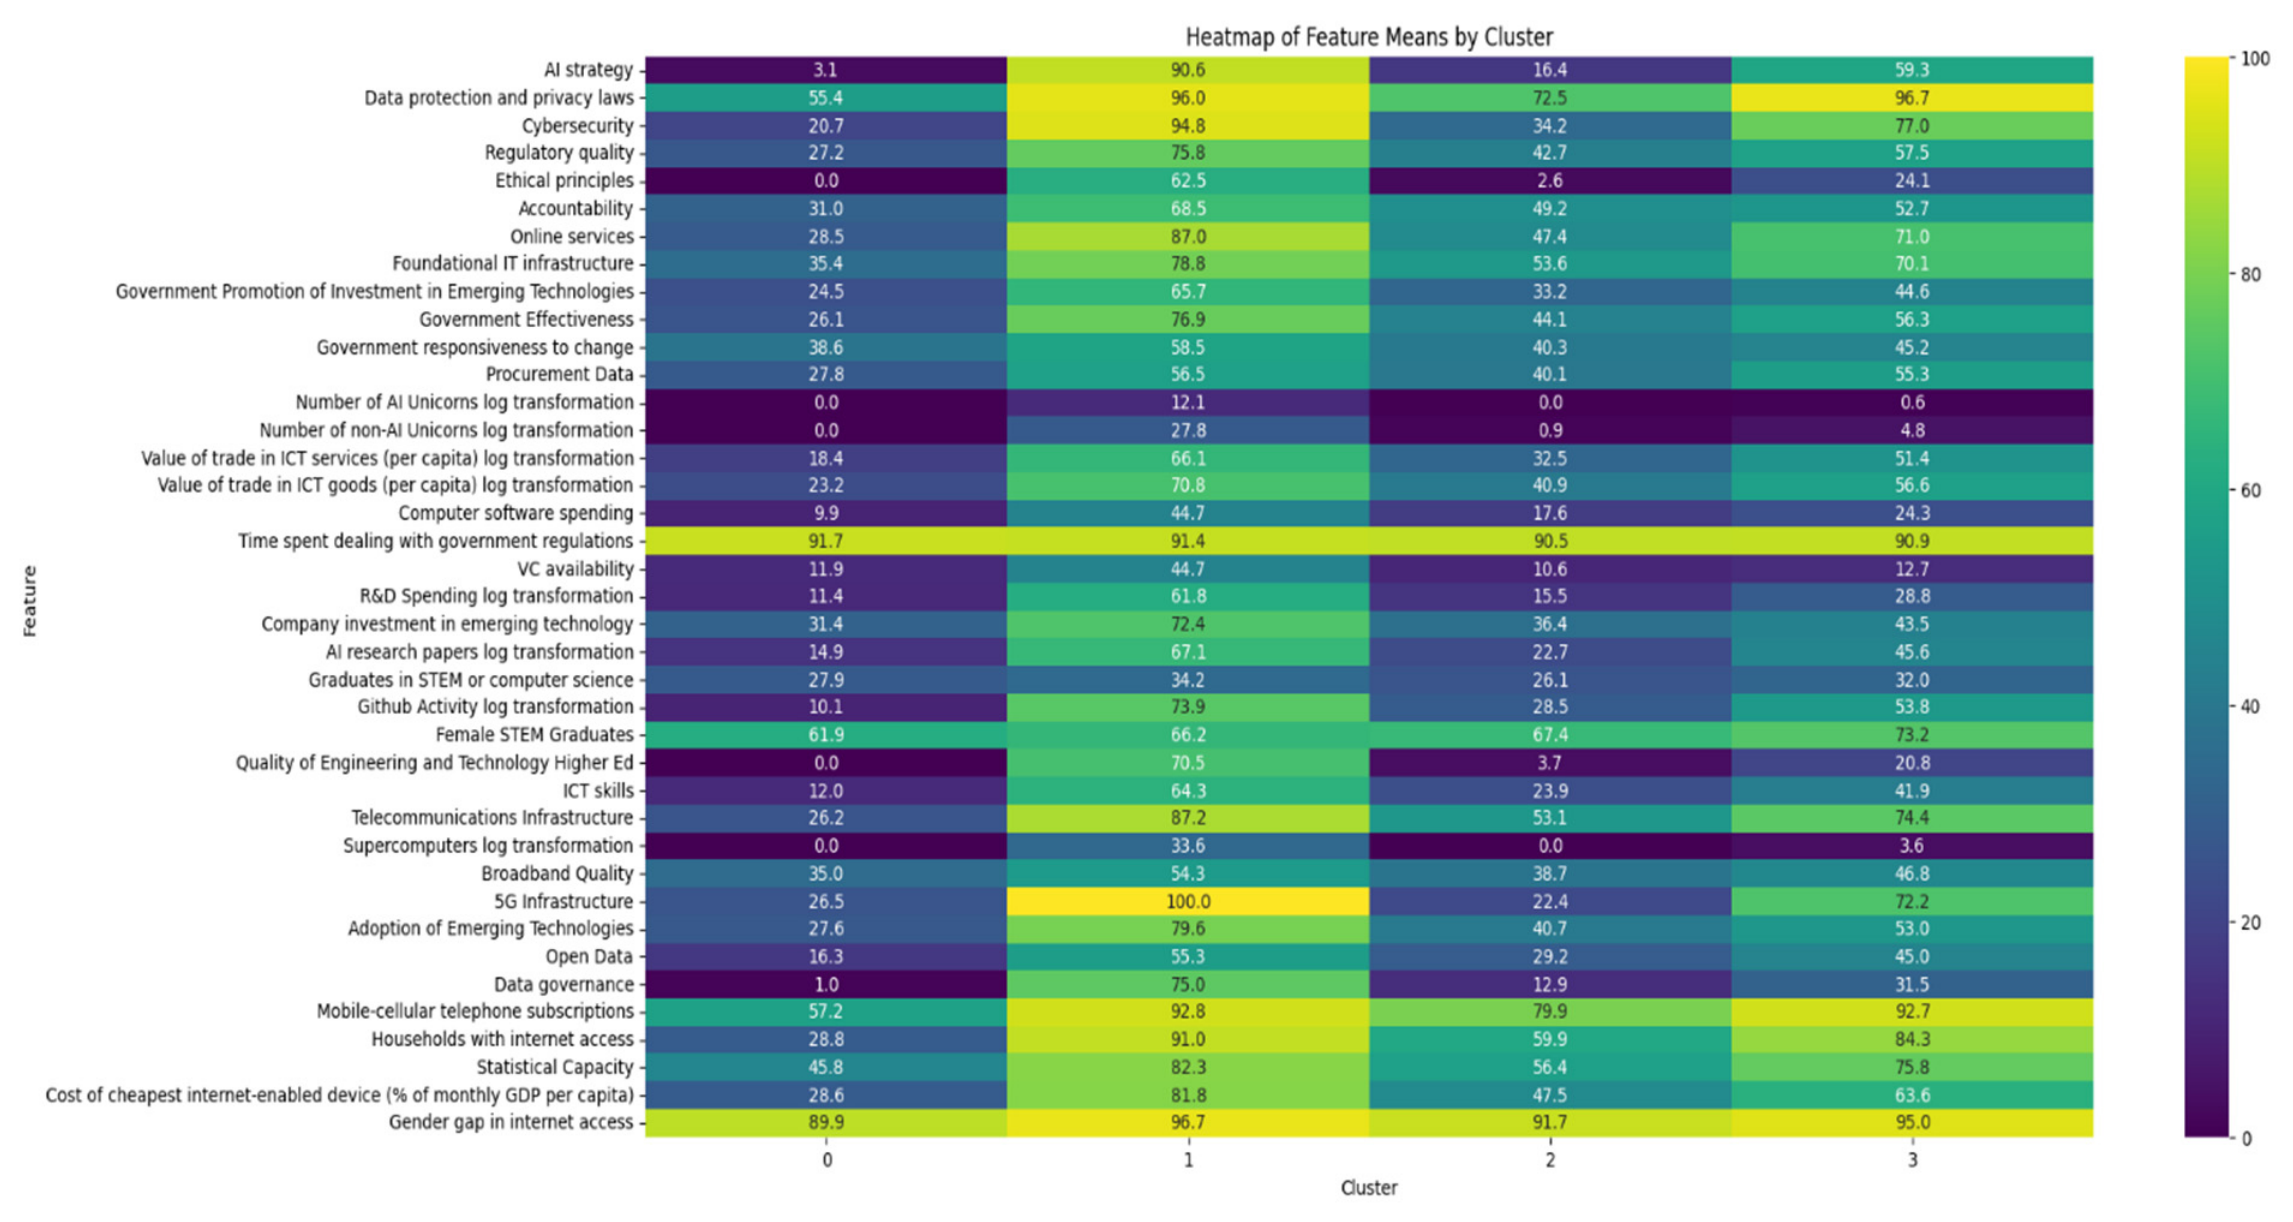
- Cluster 0 (low AI readiness profile): This cluster is characterized by a very low level of AI strategic development (3.1) and weak digital governance and infrastructure. It also exhibits low scores in key governance indicators, including data protection (55.4), cybersecurity (20.7), regulatory quality (27.2), and online services (28.5). Limited access to digital and technological infrastructure reflected low levels of broadband quality (35.0), mobile-cellular subscriptions (57.2), and household internet access (28.8). A significant gender digital divide is presented with the high value of 89.9, which should reflects generalized low access levels rather than equitable digital inclusion.
- •
- Cluster 1 (high AI readiness profile): This cluster is characterized by a highly developed AI strategy (90.6) along with strong digital governance and infrastructure. It exhibits high scores in key governance indicators, including data protection (96.0), cybersecurity (94.8), and regulatory quality (75.8), indicating a highly mature and well-established digital ecosystem. Near-universal mobile-cellular subscriptions (92.8), high levels of internet access (91.0), and robust 5G infrastructure (100). High levels of adoption of emerging technologies (79.6) as well as strong private sector investment in emerging technologies. A low gender gap in internet access further reflects more inclusive digital access.
- •
- Cluster 2 (moderate-low AI readiness profile): This cluster groups countries with relatively low AI government readiness score of 37.4 and limited AI strategic development (16.4), particularly when compared to countries with high AI adoption (cluster 1). It exhibits mixed digital governance and infrastructure, with moderate scores in governance indicators such as data protection (72.5), cybersecurity (34.2), and regulatory quality (42.7). Digital access remains moderate with mobile-cellular subscriptions (79.9) and household internet access (59.9), although still significantly below the levels observed in cluster 1. Moderate adoption of emerging technologies (40.7) and limited investment in advanced infrastructure such as 5G (22.4). A relatively high gender gap in internet access (91.7) suggests persistent inequalities in digital inclusion.
- •
- Cluster 3 (intermediate AI readiness profile): This cluster is characterized by an intermediate level of AI strategic development (59.3), positioning these countries between high AI adoption (cluster 1) and moderate-low AI adoption (cluster2). It exhibits relatively high scores in data protection (96.7) and cybersecurity (76.9), alone with moderate regulatory quality (57.5). Digital access is relatively strong, high mobile-cellular subscriptions (92.7) and internet access (84.3), although still below the levels observed in cluster 1. Adoption of emerging technologies is moderate (53.0), with moderate investment in advanced infrastructure such as 5G (72.2). A gender gap indicator (94.9) suggests relatively balanced digital access between men and women.
Specifically, Appendix B provides the heatmap of feature means by cluster.
4.4. Machine Learning Method
To address the research objectives, this study uses machine learning to model government AI readiness and classify countries into empirically derived readiness profiles. The analytical strategy consists of two complementary stages. First, a Random Forest regression model estimates the 2024 AI Government Readiness score from lagged 2023 indicators. Given the composite nature of the target variable, this stage is interpreted as a benchmarking and score-approximation exercise. Second, K-means clustering is used to identify country-level readiness profiles, and a Random Forest classifier is employed to evaluate whether these profiles can be distinguished based on the 39 indicators. This second stage constitutes the main analytical component of the study.
All model estimation procedures followed a leakage-controlled workflow. First, predictors and target variables were defined. Second, the data were divided into training and testing subsets. Third, missing-value imputation was fitted only on the training set and then applied to the test set. Fourth, model estimation and hyperparameter tuning were performed using only the training data. Finally, the held-out test set was used exclusively for final model evaluation. This procedure ensures that information from the test set did not influence imputation, model selection, or performance estimation.
In addition, a Leave-One-Pillar-Out robustness analysis was conducted to evaluate whether the relationships among readiness dimensions were substantive rather than merely mechanical. Each pillar was alternately treated as the target variable, while indicators from that same pillar were excluded from the predictor set. The remaining two pillars were then used to estimate the omitted pillar.
Therefore, this study employs a Random Forest algorithm as the primary modeling approach due to its robustness in handling complex, high-dimensional datasets with relatively small samples, in this case including 39 features related to AI readiness across 193 countries. As an ensemble learning method, Random Forest combines multiple decision trees to produce stable and accurate predictions, effectively capturing non-linear relationships and feature interactions, making it well suited for both regression and classification tasks in policy studies [44,45]. Recent studies in machine learning applications for policy analytics and socio-economic prediction further support the use of ensemble methods such as Random Forest due to their predictive stability, robustness to overfitting, and interpretability, particularly in cross-country analyses involving complex institutional and technological determinants [46,47,48].
Random Forest is a non-parametric supervised learning method, meaning it does not assume a specific form or distribution for the underlying data, making it versatile and adaptable to a wide range of data types and relationships. In supervised learning, the algorithm learns from labeled data to make predictions on unseen instances, allowing it to capture complex and non-linear patterns without requiring assumptions about the data’s distribution [49]. Moreover, Random Forest is less sensitive to multicollinearity than parametric regression models in terms of predictive performance, making it appropriate for high-dimensional and interdependent readiness indicators. However, this does not eliminate interpretability concerns associated with correlated predictors. For this reason, feature-importance results are interpreted as model-contribution and profile-discrimination measures rather than as independent causal effects of isolated variables.
In both regression and classification tasks, Random Forest operates by constructing multiple decision trees during training. Each tree is trained on a random subset of the data, with features also randomly sampled at each split within the trees. This ensemble approach enhances the model’s predictive performance by averaging the outputs of all trees (for regression) or by taking the majority vote across trees (for classification). The result is a model that is more robust and less likely to overfit than individual decision trees, especially in high-dimensional datasets like the one used in our analysis of AI readiness across 193 countries [1,44]. Moreover, Random Forest provides feature-importance measures that help identify which indicators contribute most strongly to score approximation or profile classification. However, because several indicators are correlated and conceptually overlapping, these importance measures are interpreted cautiously. They are used to identify relevant readiness domains rather than to isolate independent causal drivers of AI readiness [50].
The Random Forest method’s robustness and interpretability make it a suitable choice for both regression and classification. For regression, Random Forest helps mitigate multicollinearity by evaluating multiple subsets of features, making it highly accurate and reliable for continuous prediction tasks [51]. In classification, its adaptability in constructing non-linear decision boundaries allows for effective separation of classes. Studies such as [1] have shown that understanding AI adoption and readiness requires comprehensive analysis across multiple factors.
Recent literature has also highlighted the importance of Automated Machine Learning (AutoML) in improving model selection and reducing researcher-driven bias in data-driven applications [16]. AutoML frameworks automate key stages of the machine learning pipeline, including feature selection, hyperparameter tuning, model comparison, and validation, allowing more robust and reproducible predictive performance across heterogeneous datasets [16,52]. As discussed by [16,53,54], automation helps minimize subjectivity associated with manual preprocessing and model specification, particularly in high-dimensional environments where variable interactions are complex. While the present study adopts a theory-driven variable selection strategy combined with Random Forest and SHAP interpretability techniques, the AutoML perspective provides an important methodological benchmark by emphasizing transparency, robustness, and reduced human intervention in predictive modeling [16,55].
Previous studies on AI readiness and digital transformation have commonly relied on linear regression models, PCA, structural equation modeling, or composite index approaches to evaluate the determinants of AI adoption [1,15,56]. While these methods provide useful insights, they often assume linear relationships and may fail to capture the complex interactions, threshold effects, and cross-country heterogeneity that characterize AI readiness processes. In contrast, machine learning approaches such as Random Forest offer greater flexibility in modeling high-dimensional and non-linear relationships without requiring strong parametric assumptions [35,45]. Random Forest is also less sensitive to multicollinearity and performs well with relatively small samples, which is particularly relevant in cross-country studies involving multiple institutional, technological, and governance indicators. Furthermore, the integration of SHAP values improves model interpretability by identifying both the magnitude and direction of variable importance, addressing one of the main limitations of black-box machine learning models [47]. Combined with clustering techniques, this approach allows the identification of heterogeneous national trajectories of AI adoption, providing a more robust, interpretable, and policy-relevant analytical framework than traditional linear approaches.
4.4.1. Regression-Based Score Approximation Approach
The first model applies a Random Forest regression approach to estimate the 2024 AI Government Readiness Index as a continuous outcome, using 39 lagged indicators from 2023 as predictors. The dataset is split into training (80%) and testing (20%) subsets. Because the target variable is a composite index constructed from conceptually related indicators, the results of this model are interpreted as lagged score-approximation performance rather than as evidence of independent forecasting capacity. The regression results are presented in Table 3.
Table 3.
Random Forest regression results.
The leakage-controlled Random Forest regression achieved an R2 of 0.928, MAE of 3.134, MSE of 21.301, and RMSE of 4.615 on the held-out test set. The R2 value indicates high internal score-approximation accuracy. However, this result should be interpreted cautiously because the AI Government Readiness score is a composite index whose construction is conceptually related to the predictor set. Therefore, the high R2 does not, by itself, demonstrate independent forecasting capacity. Rather, it shows that lagged readiness indicators contain substantial information for approximating the subsequent year’s composite readiness score. Given the range of the dependent variable, the MAE indicates that the model’s estimates are, on average, approximately 3.13 points away from the observed readiness score. The main analytical value of this model lies in supporting the interpretation of feature contributions, while recognizing the structural dependence between the predictors and the target. The mean absolute error (MAE) of 3.20 reflects a low average prediction error relative to the scale of the index, indicating strong predictive accuracy. This suggests that the model’s predictions are, on average, within 3.2 units of the true AI readiness scores, indicating a high degree of accuracy in the predictions. The mean sqaure error (MSE) value (21.10) further confirms model robustness, indicating that large prediction errors are limited and do not significantly affect overall performance. Given the wide range of the dependent variable (9.20–84.80), the magnitude of the error metrics remains proportionally low, reinforcing the model’s reliability across heterogeneous country contexts.
These results are visually by Figure 7, indicating high predictive precision and minimal systematic deviation. A strong fit to this line is indicative of the model’s ability to capture the relationships between the 39 input features and the target variable, with minimal systematic errors in prediction. This pattern suggests that the model generalizes well to unseen data, reinforcing its suitability for cross-country comparative analysis.
Figure 7.
Prediction on test data for AI government readiness. Note: Blue points represent country-level observations, comparing actual scores with estimated values estimated. The red dashed line represents the perfect-fit line (y = x), where predicted and actual values are equal. Points closer to this line indicate more accurate score approximation, while larger deviations from the line indicate higher prediction error.
Figure 8 shows the residuals (the differences between actual and predicted values) for the predictions. The residuals are centered around zero, indicating the absence of sustematic bias in predictions. The slight negative skew suggests a tendency to underestimate AI readiness in a small subset of countries, potentially reflecting unobserved structural or institutional factors not fully captured by the model. However, given the concentration of residuals near zero, the model’s predictions are generally close to the actual values.
Figure 8.
Distribution of residuals.
4.4.2. Feature Importance
Shapley additive explanations (SHAP) are employed to assess feature contributions in the AI readiness score-approximation model. This approach helps identify which indicators contribute most strongly to the model’s estimation of the composite readiness score. Given the composite nature of the target variable and the correlation among several indicators, SHAP values are interpreted as model-contribution measures rather than as evidence of independent causal effects [57].
Figure 9 illustrates global SHAP values. The bar plot indicates the mean absolute SHAP value for each feature, representing its average importance across all predictions. Features with higher mean SHAP values contribute more to the model’s predictions. The plot includes all 39 features, displaying the top 15 most influential features.
Figure 9.
Global SHAP values for the leakage-controlled Random Forest regression model.
Online services emerges as the most influential feature in the score-approximation model, followed by AI strategy, adoption of emerging technologies, telecommunications infrastructure, R&D spending, and government effectiveness. This indicates that variation in digital public-service capacity contributes substantially to the model’s approximation of the composite AI-readiness score. However, given the correlation among several indicators, these variables should not be interpreted as independent causal drivers. Rather, the SHAP results indicate that the model’s approximation of the readiness score is strongly associated with broader domains such as strategic AI governance, digital public-service capacity, technological dynamism, infrastructure maturity, institutional effectiveness, and innovation capacity. Local SHAP values, presented in Figure 10, illustrate how individual features contribute to specific country-level predictions. The scatter plot illustrates the impact of each feature on individual predictions. Each observation represents a country, with color gradients indicating feature values (blue for low, red for high). For instance, higher levels of online services (red points) are associated with positive SHAP values, indicating a strong positive contribution to AI readiness. Conversely, lower levels reduce predicted readiness. Specifically, the dominance of online services suggests that digital public service maturity may act as a gateway variable, enabling the effective deployment and scaling of AI technologies in the public sector. Similar patterns are observed for AI strategy and governement effectiveness, reinforcing the importance of institutional and policy-driven factors.
Figure 10.
Local SHAP values for the leakage-controlled Random Forest regression model.
4.4.3. Random Forest Classification of AI Readiness Profiles
In the second stage, a Random Forest classifier is employed to classify countries into the four empirically derived AI readiness profiles obtained from the K-means clustering analysis. Unlike the regression model, this classification task does not use the Oxford Insights total score as the dependent variable. Instead, the target variable corresponds to the cluster assignment generated from the multivariate structure of the 39 indicators. Therefore, the classification model evaluates the separability of country readiness profiles and identifies which indicators are most relevant for distinguishing low, moderate-low, intermediate, and high readiness groups. This complementary approach mitigates potential issues related to multicollinearity and enhances the robustness of the analysis by modeling discrete adoption categories. This classification model aims to distinguish between countries acrossdifferent adoption levels and identify the key factors associated with AI readiness categories. Figure 11 and Figure 12 represent the classification report and confusion matrix on training and test data of the optimized Random Forest estimator after hyperparameter tuning using GridSearch optimization.
Figure 11.
Confusion matrix for the leakage-controlled Random Forest classification model on the training data.
Figure 12.
Confusion matrix for the leakage-controlled Random Forest classification model on the test data.
The leakage-controlled Random Forest classifier achieved an overall test accuracy of 87.2%, with macro-precision of 87.1%, macro-recall of 88.4%, and macro-F1 of 87.0%. These results indicate that the empirically derived AI-readiness profiles are internally separable based on the 39 Oxford Insights indicators. This result should not be interpreted as external validation of future AI adoption outcomes. Rather, it shows that the clusters represent distinguishable configurations of governance, technology-sector, and data-infrastructure indicators. The confusion matrix shows that most misclassifications occur between adjacent readiness profiles. Low-profile countries are occasionally classified as moderate-low, and intermediate-profile countries are occasionally classified as high. This pattern suggests that the model captures meaningful profile separation, while also reflecting the gradual and continuous nature of AI-readiness development across countries.
4.4.4. Permutation Feature Importance
Permutation feature importance is employed to evaluate the contribution of each feature in the Random Forest multi-class classification model. Permutation importance measures how much the model’s performance decreases when a feature’s values are randomly shuffled, disrupting the relationship between the feature and the target variable. This method measures the decrease in model performance when a feature’s values are randomly permuted, thereby disrupting its relationship with the target variable [58].
In Figure 13, the x-axis represents the mean decrease in classification accuracy caused by randomly permuting each feature in the held-out test set. Larger values indicate that the classifier relies more strongly on that feature to distinguish countries across AI-readiness profiles. The black error bars represent variability across repeated permutations. Wider error bars indicate that the estimated importance of a feature is less stable across repetitions and should therefore be interpreted more cautiously.
Figure 13.
Permutation feature importance for the leakage-controlled Random Forest classification model on the test data.
Figure 13 reports permutation feature importance for the leakage-controlled Random Forest classification model. The results indicate that Statistical Capacity produces the largest decrease in classification accuracy when permuted, followed by ICT skills, the cost of the cheapest internet-enabled device, the quality of engineering and technology higher education, AI research activity, and company investment in emerging technology. These results suggest that the classification of countries into AI-readiness profiles is strongly associated with data capacity, digital skills, affordability and access conditions, advanced human capital, research activity, and innovation-system maturity. In contrast to the regression-based score approximation model, which emphasizes online services and AI strategy, the classification model highlights the variables that most clearly separate countries across empirically derived readiness profiles. Given the presence of correlated predictors, these results are interpreted as profile-discrimination evidence rather than as isolated causal effects of individual indicators. These results complement, rather than duplicate, the SHAP findings from the regression-based score approximation model. While the regression SHAP analysis identifies the indicators most relevant for approximating the composite AI Government Readiness score, permutation importance identifies the indicators most relevant for distinguishing countries across readiness profiles. Taken together, the results suggest that AI readiness is multidimensional: digital public-service capacity and AI strategy are central to score approximation, whereas statistical capacity, ICT skills, affordability conditions, advanced human capital, and innovation-system indicators are central to differentiating country profiles.
4.4.5. Leave-One-Pillar-Out Robustness Analysis
To further address the possibility that the supervised models only reproduce the arithmetic structure of the composite index, a Leave-One-Pillar-Out robustness analysis was conducted. In this procedure, each of the three Oxford Insights pillars was alternately treated as the target variable, while all indicators belonging to that same pillar were excluded from the predictor set. Thus, each model estimated one pillar using only indicators from the remaining two pillars. This provides a more conservative test of whether governance, technology-sector maturity, and data-infrastructure readiness are empirically interconnected beyond the direct construction of the overall AI Government Readiness score.
Table 4 reports the results. When the Government pillar was estimated using only Technology Sector and Data Infrastructure indicators, the model achieved an R2 of 0.73, with an MAE of 7.26 and RMSE of 9.46. When the Technology Sector pillar was estimated using Government and Data Infrastructure indicators, the model achieved an R2 of 0.90, with an MAE of 3.15 and RMSE of 4.14. Finally, when the Data Infrastructure pillar was estimated using Government and Technology Sector indicators, the model achieved an R2 of 0.89, with an MAE of 4.61 and RMSE of 5.78.
Table 4.
Leave-One-Pillar-Out Robustness analysis results.
These results indicate that the three pillars are strongly interconnected. Although the full score-approximation model must still be interpreted cautiously because of the composite nature of the target variable, the Leave-One-Pillar-Out analysis shows that the relationships among governance, technology-sector maturity, and data infrastructure are not solely the result of using each pillar’s own indicators to reconstruct itself. Rather, the findings support a systemic interpretation of AI readiness, in which institutional, technological, and infrastructural conditions co-vary across countries.
5. Discussion and Implications
5.1. Discussion of Findings
The combined analysis of feature importance from the regression and classification models provides a complementary assessment of the indicators most strongly associated with AI readiness score approximation and profile discrimination. The regression and classification models provide complementary perspectives on AI readiness. The regression-based SHAP analysis emphasizes digital public-service capacity, strategic AI governance, technological dynamism, infrastructure maturity, and innovation capacity as central to approximating the composite readiness score. In contrast, the classification-based permutation importance analysis highlights statistical capacity, ICT skills, affordability and access conditions, higher education quality, research activity, and private-sector investment as key dimensions distinguishing countries across AI-readiness profiles. These findings indicate that higher AI readiness profiles are not characterized by isolated indicators, but rather by the combined configuration of digital infrastructure, governance capacity, and innovation ecosystems. Importantly, the two interpretability methods provide complementary rather than identical evidence. This is expected because the regression model approximates the composite AI-readiness score, whereas the classification model distinguishes countries across empirically derived readiness profiles. The combined results therefore support a multidimensional interpretation of AI readiness, in which score approximation and profile discrimination are associated with partially different but substantively related sets of indicators. Several indicators show limited discriminative contribution in the classification model, suggesting that some readiness components may function as baseline enabling conditions rather than as the main dimensions differentiating AI-readiness profiles. This result should be interpreted cautiously, given the presence of correlated predictors and the fact that permutation importance reflects model dependence rather than causal relevance.
The regression and classification models provide complementary perspectives: the former approximates the composite readiness score, while the latter identifies the indicators that differentiate countries across empirically derived AI-readiness profiles. The regression-based SHAP analysis emphasizes online services, AI strategy, adoption of emerging technologies, telecommunications infrastructure, R&D spending, and government effectiveness. In contrast, the classification-based permutation importance analysis highlights statistical capacity, ICT skills, affordability and access conditions, higher education quality, AI research activity, and company investment in emerging technology as discriminating features across AI-readiness profiles. The Leave-One-Pillar-Out robustness analysis further supports this systemic interpretation. Even when each pillar’s own indicators are excluded, the remaining pillars retain substantial explanatory capacity. The strongest cross-pillar association is observed when the Technology Sector pillar is estimated from Government and Data Infrastructure indicators, followed by the estimation of Data Infrastructure from Government and Technology Sector indicators. The Government pillar is also meaningfully estimated from Technology Sector and Data Infrastructure indicators, although with comparatively lower performance. These results suggest that AI readiness should be understood as an interdependent configuration of institutional capacity, technological maturity, and data-infrastructure conditions rather than as a set of isolated dimensions.
These findings are consistent with recent literature emphasizing that robust governance frameworks and advanced digital ecosystems are essential conditions for AI diffusion and public sector digital transformation [1,56,59]. This is consistent with prior empirical evidence showing that countries with stronger regulatory quality, institutional effectiveness, and digital infrastructure tend to exhibit higher levels of AI adoption, particularly in data-intensive sectors such as healthcare, smart cities, and digital public services [13,60].
The cluster analysis further confirms substantial cross-country heterogeneity, showing that countries follow distinct AI adoption trajectories depending on their structural conditions. This supports prior research suggesting that AI readiness is shaped by the interaction among governance quality, human capital, innovation capacity, and data infrastructure rather than by isolated variables [56,61]. The identification of four differentiated clusters reinforces the argument that developing economies face additional structural barriers, including weaker institutions, lower digital access, and greater inequalities in technological inclusion [62]. These results also explain why variables such as broadband quality may lose predictive importance once minimum infrastructure thresholds are achieved, functioning more as enabling conditions than as differentiating factors.
Moreover, the superior performance of Random Forest compared to linear and logistic regression confirms the importance of modeling non-linear relationships in AI readiness studies. This result aligns with recent machine learning applications in policy analytics and socio-economic prediction, where ensemble methods have shown greater predictive stability and robustness when dealing with high-dimensional and interdependent variables [35,47,48]. Therefore, this study contributes methodologically by demonstrating that machine learning approaches provide a more accurate framework for understanding AI adoption across heterogeneous national contexts.
5.2. Policy Implications
These findings have important implications for public policy design when interpreted as evidence of the structural conditions associated with higher AI readiness profiles. First, the prominence of online services and telecommunications infrastructure suggests that digital public infrastructure is one of the main dimensions distinguishing higher-readiness countries from lower-readiness countries. Governments should prioritize broadband expansion, digital connectivity, and public platforms that facilitate AI integration across sectors.
Second, the significance of AI strategy underscores the importance of coherent and forward-looking governance frameworks. Governments should prioritize the development of integrated national AI strategies aligned with broader socio-economic objectives, incorporating ethical standards, regulatory clarity, and workforce development, and long-term implementation mechanisms. Institutional quality also emerges as a critical determinant, suggesting that effective governance and administrative capacity are essential for translating technological potential into actual AI deployment. Strengthening public sector capabilities and improving policy implementation processes should therefore be a central component of AI strategies.
Third, the relevance of emerging technologies and R&D investment points to the need for strengthening innovation ecosystems through policies that foster entrepreneurship, private-sector participation, and technological experimentation. International development institutions and regional funding bodies can facilitate the creation of AI innovation ecosystems by supporting research and development initiatives, reducing financial barriers, and promoting public–private collaboration, particularly in developing economies.
The results highlight important opportunities for international cooperation. Countries with advanced AI readiness can support lower-performing nations through knowledge transfer, technical assistance, and capacity-building initiatives, while international organizations can play a coordinating role in promoting inclusive and equitable AI development. Capacity-building programs focused on policy implementation, regulatory quality, and data management are essential to ensure that AI adoption is both effective and sustainable over time.
In this line, recent studies emphasize that strengthening AI governance systems requires not only regulatory quality and institutional capacity, but also robust data security and privacy protection mechanisms [13,63,64,65]. AI models frequently process large-scale personal, financial, and institutional datasets, increasing exposure to risks such as data leakage, model inversion attacks, unauthorized access, adversarial manipulation, and privacy breaches [66]. These vulnerabilities may undermine institutional trust and limit the effective adoption of AI-driven public and private services. As highlighted by [67], defense mechanisms such as differential privacy, information obfuscation, homomorphic encryption, federated learning, secure multi-party computation, and access control protocols play a critical role in mitigating these risks while preserving model utility and transparency. In the context of AI readiness, stronger governance therefore depends not only on formal regulation, but also on the technical capacity to ensure secure data management, algorithmic accountability, and privacy-preserving model deployment across digital ecosystems [68]. This is particularly relevant for developing economies, where weak institutional safeguards may amplify distrust and slow AI adoption despite improvements in digital infrastructure [69,70].
At the global level, the central role of AI strategy points to the necessity of aligning national frameworks with international standards. Multilateral platforms can support this process by promoting shared principles for ethical, transparent, and inclusive AI governance, while also encouraging policy harmonization across countries. Persistent disparities in telecommunications infrastructure and technological adoption highlight the risk of widening global inequalities. Without coordinated interventions aimed at improving connectivity, digital access, and technical skills in under-resourced contexts, the benefits of AI are likely to remain unevenly distributed across countries.
5.3. Theoretical Contributions
This study makes three main theoretical contributions to the literature on AI readiness and government adoption. First, it advances existing research by moving beyond fragmented and predominantly linear approaches that often examine isolated determinants of AI adoption. Instead, the findings demonstrate that AI readiness is shaped by the interaction among institutional quality, digital infrastructure, innovation capacity, and governance effectiveness, reinforcing the multidimensional nature of AI adoption processes.
Second, the study contributes to the literature on cross-country heterogeneity by showing that countries do not follow a uniform path toward AI readiness. The identification of four differentiated clusters reveals that structural conditions, institutional asymmetries, and digital inequalities generate heterogeneous adoption trajectories. This supports recent studies arguing that developing economies face distinct barriers in AI adoption that require differentiated analytical and policy approaches.
Third, this research contributes methodologically by validating the use of machine learning techniques, particularly Random Forest combined with SHAP interpretability, for AI readiness analysis. Traditional linear models may be insufficient to capture the non-linear relationships and hidden interactions among determinants of AI adoption. By demonstrating the superior predictive performance and interpretability of Random Forest combined with SHAP, this study provides a stronger analytical framework for future cross-country policy research.
6. Conclusions
This study provides a comprehensive and data-driven assessment of government AI readiness profiles across countries, combining clustering techniques with non-parametric machine learning methods. Rather than directly forecasting actual AI adoption, the analysis models the structure of AI readiness and identifies the indicators that distinguish countries across different readiness profiles. The findings consistently highlight that higher AI readiness profiles are not characterized by isolated factors, but by the combined configuration of governance quality, digital infrastructure, and innovation capacity. In particular, the results show that different dimensions become relevant depending on the analytical task. The regression-based score approximation model emphasizes online services, AI strategy, adoption of emerging technologies, telecommunications infrastructure, R&D spending, and government effectiveness. In contrast, the classification model emphasizes statistical capacity, ICT skills, affordability and access conditions, higher education quality, AI research activity, and company investment in emerging technology as discriminating features across AI-readiness profiles. The results further reveal the presence of non-linear relationships and cross-country heterogeneity, underscoring the importance of moving beyond traditional linear approaches to better capture the complexity of AI adoption dynamics.
The empirical evidence confirms that countries with clearly defined AI strategies, robust governance frameworks, and strong digital capabilities systematically achieve higher levels of AI readiness. Telecommunications infrastructure and online services act as foundational enablers, while investments in innovation and human capital strengthen countries’ capacity to develop and deploy AI technologies effectively. Moreover, other variables, such as broadband quality or open data appear to function as baseline conditions rather than key differentiating factors, suggesting that not all components of digital development contribute equally to advancing AI adoption.
This study contributes to the literature in several ways. First, it advances the understanding of AI adoption by integrating multiple dimensions (e.g., governance, infrastructure, and innovation) within a unified analytical framework. Second, it provides methodological contributions by applying non-parametric models, including Random Forest and SHAP analysis, which allow for the identification of non-linear effects and complex interactions often overlooked in prior research. Third, the study introduces a classification-based perspective on AI-readiness profiles, offering a more nuanced interpretation of global disparities by identifying the indicators that distinguish countries across different readiness configurations. Finally, it contributes to policy discussions by providing empirically grounded insights into the key levers that governments can activate to enhance AI readiness.
Despite these contributions, the study is subject to several limitations. First, the analysis relies on secondary data from composite indices, which may embed measurement errors or methodological biases inherent in their construction. Moreover, the dependent variable used in the regression task is itself a composite readiness index constructed from dimensions that are conceptually related to the predictor set. As a result, the high regression accuracy should not be interpreted as independent evidence of forecasting ability. Although the use of 2023 indicators to estimate the 2024 score introduces temporal ordering and avoids same-year score reconstruction, the one-year lag does not fully eliminate structural dependence because the index framework remains conceptually similar across years. Therefore, the regression results are best understood as lagged score approximation rather than as prediction of an external outcome. Second, the classification model should be interpreted as a readiness-profile discrimination exercise rather than as external validation of actual AI adoption levels. Since the clusters are generated from the same indicator space used in the classifier, the leakage-controlled classification accuracy of 87.2% indicates that the country profiles are internally separable, but it does not prove that the model can forecast future AI adoption. Third, the cross-sectional nature of the dataset limits the ability to fully capture dynamic changes in AI readiness over time. Fourth, the relatively small sample size at the country level may limit the generalizability of certain machine learning results, particularly for more granular subgroup analyses. Finally, unobserved institutional, cultural, or political factors may influence AI readiness but are not fully captured within the available indicators. The Leave-One-Pillar-Out robustness analysis partially mitigates this concern by showing meaningful cross-pillar associations after excluding the target pillar’s own indicators; nevertheless, these results remain associational and should not be interpreted as causal evidence.
Another limitation concerns the interpretation of feature importance under correlated predictors. Although Random Forest models are less affected by multicollinearity than parametric regression models in terms of predictive performance, correlated indicators can distort individual importance measures by distributing importance across related variables or by elevating one variable as a proxy for a broader readiness dimension. Therefore, SHAP and permutation-importance results are interpreted as indicators of model contribution and profile discrimination, not as causal effects of isolated variables. Future research should extend this analysis by incorporating longitudinal data to better understand the temporal evolution of AI readiness and adoption. Further studies could also explore causal identification strategies, such as quasi-experimental designs, to strengthen inference regarding the impact of specific policy interventions. In addition, more granular analyses at the regional or sectoral level would provide deeper insights into within-country heterogeneity. Expanding the framework to include institutional quality measures, behavioral factors, and geopolitical dimensions may also enrich the understanding of AI adoption dynamics.
From a policy perspective, the findings provide a clear roadmap for enhancing AI readiness. Governments should prioritize the development of coherent AI strategies, invest in digital infrastructure, and foster innovation ecosystems that support technological advancement. International collaboration will be essential to reduce global disparities, particularly through knowledge transfer, capacity building, and coordinated governance frameworks. By addressing these dimensions in an integrated manner, countries can harness the transformative potential of AI to promote sustainable development, improve public service delivery, and strengthen their position within the global digital economy.
Author Contributions
Conceptualization, A.N.P.; methodology, A.N.P.; investigation, A.N.P. and A.B.T.-P.; writing—original draft preparation, A.N.P.; writing—review and editing, A.N.P. and A.B.T.-P.; supervision, A.N.P. and A.B.T.-P.; project administration, A.B.T.-P. All authors have read and agreed to the published version of the manuscript.
Funding
We are grateful to the Universidad de las Américas UDLA, which financially supported this research (568.B.XVI.25).
Institutional Review Board Statement
Ethical review and approval were waived for this study due to the Legal Regulations of the Ethical Committee of the Universidad de Las Américas https://blogs.udla.edu.ec/ceish/ (accessed on 26 March 2026).
Data Availability Statement
The data will be made available upon request. The original database is available in the following webpage: https://www.oxfordinsights.com. The python code portraying the analytical process can be found here: https://github.com/CienciaDatosUDLA/Ciencia-de-Datos/blob/main/IA_adoption.ipynb, Accessed on 20 February 2026.
Acknowledgments
During the preparation of this manuscript, the authors used ChatGPT GPT-5.5 solely for basic English language revision. The authors emphasize that the entire research process, including the conception of the study, literature review, research design, data collection, data processing, analysis, interpretation of results, and formulation of conclusions, was conducted exclusively by the authors. ChatGPT did not contribute to any aspect of the scientific content or research development. The authors have thoroughly reviewed and edited any language suggestions and take full responsibility for the content of this publication.
Conflicts of Interest
The authors declare no conflicts of interest. The funders had no role in the design of the study, the collection, analysis, or interpretation of data, the writing of the manuscript, or the decision to publish the results.
Acronymous
| AI | Artificial intelligence |
| AI4D | Artificial intelligence for development |
| AutoML | Automated machine learning |
| ICT | Information and communications technology |
| MAE | Mean absolute error |
| MSE | Mean square error |
| PCA | Principal component analysis |
| R&D | Research and development |
| SHAP | Shapley additive explanations |
| STEM | Science, technology, engineering, and mathematics |
Appendix A
Table A1.
Countries by cluster.
Appendix B
Appendix B reports the mean value of each indicator across the four AI-readiness profiles. The heatmap complements the clustering analysis by showing how each profile differs across governance, technology-sector, and data-infrastructure dimensions. Higher values indicate stronger average performance in a given indicator for that profile, while lower values indicate relative weakness. This visualization helps identify the structural configuration of each profile, showing, for example, that high-readiness countries combine stronger AI strategy, digital infrastructure, institutional capacity, and innovation-system indicators, whereas low-readiness countries show broader weaknesses across most dimensions.
Figure A1.
Heatmap of feature means by cluster.
References
- Wirtz, B.W.; Weyerer, J.C.; Geyer, C. Artificial Intelligence and the Public Sector—Applications and Challenges. Int. J. Public Adm. 2018, 42, 596–615. [Google Scholar] [CrossRef] [Scilit]
- Neumann, O.; Guirguis, K.; Steiner, R. Exploring artificial intelligence adoption in public organizations: A comparative case study. Public Manag. Rev. 2024, 26, 114–141. [Google Scholar] [CrossRef] [Scilit]
- Criado, J.I.; Sandoval-Almazán, R.; Gil-Garcia, J.R. Artificial intelligence and public administration: Understanding actors, governance, and policy from micro, meso, and macro perspectives. Public Policy Adm. 2025, 40, 173–184. [Google Scholar] [CrossRef] [Scilit]
- Madan, R.; Ashok, M. AI adoption and diffusion in public administration: A systematic literature review and future research agenda. Gov. Inf. Q. 2023, 40, 101774. [Google Scholar] [CrossRef] [Scilit]
- Margetts, H.; Dorobantu, C. Rethink government with AI. Nature 2019, 568, 163–165. [Google Scholar] [CrossRef] [Scilit]
- Mikalef, P.; Islam, N.; Parida, V.; Singh, H.; Altwaijry, N. Artificial intelligence (AI) competencies for organizational performance: A B2B marketing capabilities perspective. J. Bus. Res. 2023, 164, 113998. [Google Scholar] [CrossRef] [Scilit]
- Wirtz, B.W.; Weyerer, J.C.; Sturm, B.J. The Dark Sides of Artificial Intelligence: An Integrated AI Governance Framework for Public Administration. Int. J. Public Adm. 2020, 43, 818–829. [Google Scholar] [CrossRef] [Scilit]
- Åström, J.; Reim, W.; Parida, V. Value creation and value capture for AI business model innovation: A three-phase process framework. Rev. Manag. Sci. 2022, 16, 2111–2133. [Google Scholar] [CrossRef] [Scilit]
- Prasodjo, T. Agile Governance in the Digital Age: A Qualitative Study of Its Effectiveness and Implementation Challenges. Gold. Ratio Soc. Sci. Educ. 2025, 5, 1–10. Available online: https://www.researchgate.net/publication/389436636_Agile_Governance_in_the_Digital_Age_A_Qualitative_Study_of_Its_Effectiveness_and_Implementation_Challenges. [CrossRef] [Scilit]
- Misuraca, G.; Van Noordt, C. AI Watch—Artificial Intelligence in Public Services; Publications Office of the European Union: Luxembourg, 2020. [Google Scholar] [CrossRef]
- Singh Kushwah, J.; Kumar, A.; Patel, S.; Soni, R.; Gawande, A.; Gupta, S. Comparative study of regressor and classifier with decision tree using modern tools. Mater. Today Proc. 2022, 56, 3571–3576. [Google Scholar] [CrossRef] [Scilit]
- Curto, G.; Jojoa, M.; Comin, F.; Garcia-Zapirain, B. Are AI systems biased against the poor? A machine learning analysis using Word2Vec and GloVe embeddings. AI Soc. 2024, 39, 617–632. [Google Scholar] [CrossRef] [Scilit] [PubMed]
- Dwivedi, Y.K.; Hughes, L.; Ismagilova, E.; Aarts, G.; Coombs, C.; Crick, T.; Duan, Y.; Dwivedi, R.; Edwards, J.; Eirug, A.; et al. Artificial Intelligence (AI): Multidisciplinary perspectives on emerging challenges, opportunities, and agenda for research, practice and policy. Int. J. Inf. Manag. 2021, 57, 101994. [Google Scholar] [CrossRef] [Scilit]
- Kaur, R.; Gabrijelčič, D.; Klobučar, T. Artificial intelligence for cybersecurity: Literature review and future research directions. Inf. Fusion. 2023, 97, 101804. [Google Scholar] [CrossRef] [Scilit]
- Sun, T.Q.; Medaglia, R. Mapping the challenges of Artificial Intelligence in the public sector: Evidence from public healthcare. Gov. Inf. Q. 2019, 36, 368–383. [Google Scholar] [CrossRef] [Scilit]
- Hutter, F.; Kotthoff, L.; Vanschoren, J. Automated Machine Learning—Methods, Systems, Challenges; Springer: Cham, Switzerland, 2019. [Google Scholar] [CrossRef] [Scilit]
- Mah, P.M. National AI Strategies. Eur. Res. Stud. J. 2024, XXVIΙ, 96–115. [Google Scholar] [CrossRef] [Scilit]
- Floridi, L. Establishing ethical AI: Requirements, methods, and implications. Philos. Technol. 2020, 33, 1–21. Available online: https://www.redalyc.org/journal/3230/323082338016/323082338016.pdf (accessed on 10 February 2026). [CrossRef] [Scilit]
- Panch, T.; Pearson-Stuttard, J.; Greaves, F.; Atun, R. Artificial intelligence: Opportunities and risks for public health. Lancet Digit. Health 2019, 1, e13–e14. [Google Scholar] [CrossRef] [Scilit]
- Oxford Insights. Government AI Readiness Index. Published 2023. Available online: https://www.oxfordinsights.com (accessed on 12 October 2025).
- Zuiderwijk, A.; Chen, Y.-C.; Salem, F. Implications of the use of artificial intelligence in public governance: A systematic literature review and a research agenda. Gov. Inf. Q. 2021, 38, 101577. [Google Scholar] [CrossRef] [Scilit]
- Lei, X.; Shen, Z.Y.; Štreimikienė, D.; Baležentis, T.; Wang, G.; Mu, Y. Digitalization and sustainable development: Evidence from OECD countries. Appl. Energy 2024, 357, 122480. [Google Scholar] [CrossRef] [Scilit]
- Du, Z.-Y.; Wang, Q. Digital infrastructure and innovation: Digital divide or digital dividend? J. Innov. Knowl. 2024, 9, 100542. [Google Scholar] [CrossRef] [Scilit]
- Zhao, X.; Dong, F. Digital infrastructure construction and corporate innovation efficiency: Evidence from Broadband China Strategy. Humanit. Soc. Sci. Commun. 2025, 12, 347. [Google Scholar] [CrossRef] [Scilit]
- United Nations. United Nations E-Government Survey. Digital Government in the Decade of Action. Published 2022. Available online: https://publicadministration.un.org/egovkb/en-us/reports/un-e-government-survey-2022 (accessed on 12 January 2025).
- Huang, M.-H.; Rust, R. A strategic framework for artificial intelligence in marketing. J. Acad. Mark. Sci. 2020, 49, 30–50. [Google Scholar] [CrossRef] [Scilit]
- Manyika, J.; Chui, M.; Miremadi, M.; Bughin, J.; George, K.; Willmott, P.; Dewhurst, M. A Future That Works: Automation, Employment, and Productivity; McKinsey & Company: New York, NY, USA, 2017; Available online: https://www.mckinsey.com/~/media/mckinsey/featured%20insights/digital%20disruption/harnessing%20automation%20for%20a%20future%20that%20works/mgi-a-future-that-works-full-report-updated.pdf (accessed on 10 February 2026).
- Crawford, K. Atlas of AI: Power, Politics, and the Planetary Costs of Artificial Intelligence. Perspect. Sci. Christ. Faith 2022, 74, 61–62. [Google Scholar] [CrossRef] [Scilit]
- Smith, M.; Seward, R. AI for development: Advancing artificial intelligence capacities in low-resource settings. Dev. Policy Rev. 2020, 38, 617–632. [Google Scholar] [CrossRef] [Scilit]
- Aoki, N. An experimental study of public trust in AI chatbots in the public sector. Gov. Inf. Q. 2020, 37, 101490. [Google Scholar] [CrossRef] [Scilit]
- Cannavale, C.; Claudio, L.; Koroleva, D. Digitalisation and artificial intelligence development. A cross-country analysis. Eur. J. Innov. Manag. 2025, 28, 112–130. [Google Scholar] [CrossRef] [Scilit]
- Tulcanaza-Prieto, A.B.; Cortez-Ordoñez, A.; Rivera, J. Development and Influence of the Economic Groups in Ecuador. SAGE Open 2025, 15, 21582440251358563. [Google Scholar] [CrossRef] [Scilit]
- Makridakis, S. The forthcoming Artificial Intelligence (AI) revolution: Its impact on society and firms. Futures 2017, 90, 46–60. [Google Scholar] [CrossRef] [Scilit]
- May, S.; Ajumoke, S. Interpreting Machine Learning Predictions with SHAP and LIME for Transparent Decision Making. Int. J. Comput. Sci. Math. Theory 2025, 11, 22–49. [Google Scholar] [CrossRef]
- Breiman, L. Random Forests. Mach. Learn. 2001, 45, 5–32. [Google Scholar] [CrossRef] [Scilit]
- Wooldridge, J. Econometric Analysis of Cross Section And Panel Data, 2nd ed.; MIT Press: Cambridge, MA, USA, 2010. [Google Scholar]
- Gujarati, D. Basic Econometrics, 2nd ed.; McGraw Hill: Columbus, OH, USA, 1988. [Google Scholar]
- Verbeek, M. A Guide to Modern Econometrics, 3rd ed.; John Wiley & Sons: Hoboken, NJ, USA, 2008. [Google Scholar]
- Shabbir, M.S. Artificial Intelligence and Entrepreneurial Ecosystems in Emerging Economies: Rethinking Innovation, Governance and SME Development. J. Entrep. Innov. Emerg. Econ. 2026, 4, 23939575261443024. [Google Scholar] [CrossRef] [Scilit]
- Hair, J.F.; Anderson, R.E.; Tatham, R.L.; Black, W.C. Multivariate Data Analysis; Prentice-Hall: Hoboken, NJ, USA, 1995. [Google Scholar]
- Pindyck, R.S.; Rubinfeld, D.L. Econometría: Modelos y Pronósticos, 4th ed.; McGraw Hill: Columbus, OH, USA, 2001; Available online: https://books.google.co.kr/books/about/Econometría.html?id=QmyYAAAACAAJ&redir_esc=y (accessed on 25 March 2018).
- Kotu, V.; Deshpande, B. Data Science, Concepts and Practice, 2nd ed.; Elsevier Inc.: Amsterdam, The Netherlands, 2019. [Google Scholar]
- Syakur, M.; Khusnul Khotimah, B.; Rohman, E.; Dwi Satoto, B. Integration K-Means Clustering Method and Elbow Method For Identification of The Best Customer Profile Cluster. IOP Conf. Ser. Mater. Sci. Eng. 2018, 336, 012017. [Google Scholar] [CrossRef] [Scilit]
- Breiman, L. Statistical Modeling: The Two Cultures. Stat. Sci. 2001, 16, 199–215. [Google Scholar] [CrossRef] [Scilit]
- Saarela, M.; Jauhiainen, S. Comparison of feature importance measures as explanations for classification models. SN Appl. Sci. 2021, 3, 272. [Google Scholar] [CrossRef] [Scilit]
- Daniya, T.; Geetha, M.; Kumar, S. Classification and regression trees with gini index. Adv. Math. Sci. J. 2020, 9, 1857–8438. [Google Scholar] [CrossRef] [Scilit]
- Mullainathan, S.; Spiess, J. Machine Learning: An Applied Econometric Approach. J. Econ. Perspect. 2017, 31, 87–106. [Google Scholar] [CrossRef] [Scilit]
- Probst, P.; Wright, M.N.; Boulesteix, A. Hyperparameters and tuning strategies for random forest. Wiley Interdiscip. Rev. Data Min. Knowl. Discov. 2018, 9, e1301. Available online: https://api.semanticscholar.org/CorpusID:4753950 (accessed on 10 February 2026). [CrossRef] [Scilit]
- Hastie, T.; Tibshirani, R.; Friedman, J. The Elements of Statistical Learning: Data Mining, Inference, and Prediction, 2nd ed.; Springer: Cham, Switzerland, 2009. [Google Scholar]
- James, G.; Wittern, D.; Hastie, T.; Tibshirani, R. An Introduction to Statistical Learning: With Applications in R; Springer: Cham, Switzerland, 2013. [Google Scholar]
- Liaw, A.; Wiener, M. Classification and Regression by RandomForest. R News 2002, 2, 18–22. [Google Scholar]
- Ossai, W.; Fagbola, T.M. Machine learning-based predictive modelling of renewable energy adoption in developing countries. Energy Rep. 2025, 14, 66–84. [Google Scholar] [CrossRef] [Scilit]
- Rosário, A.T.; Boechat, A.C. How Automated Machine Learning Can Improve Business. Appl. Sci. 2024, 14, 8749. [Google Scholar] [CrossRef] [Scilit]
- Addula, S.R.; Sekhar Sajja, G. Automated Machine Learning to Streamline Data-Driven Industrial Application Development. In 2024 Second International Conference Computational and Characterization Techniques in Engineering & Sciences (IC3TES); IEEE: New York, NY, USA, 2024; pp. 1–4. [Google Scholar] [CrossRef] [Scilit]
- Hu, X.; Zhu, M.; Feng, Z.; Stanković, L. Manifold-based Shapley explanations for high dimensional correlated features. Neural Netw. 2024, 180, 106634. [Google Scholar] [CrossRef] [Scilit]
- Ahn, M.J.; Chen, Y.-C. Digital transformation toward AI-augmented public administration: The perception of government employees and the willingness to use AI in government. Gov. Inf. Q. 2022, 39, 101664. [Google Scholar] [CrossRef] [Scilit]
- Trevisan, V. Using SHAP Values to Explain How Your Machine Learning Model Works. Towards Data Science. Published 2022. Available online: https://towardsdatascience.com/using-shap-values-to-explain-how-your-machine-learning-model-works-732b3f40e137 (accessed on 1 December 2025).
- Jensen, T. Feature Importance for Any Model Using Permutation. Medium. Published 2022. Available online: https://medium.com/@T_Jen/feature-importance-for-any-model-using-permutation-7997b7287aa (accessed on 23 February 2025).
- Ibourk, A.; Elouaour, Z. Financial Technology As A Driver of Financial Inclusion and Inclusive Development in the MENA Region: Risks and Opportunities; Policy Center for the New South: Rabat, Morocco, 2022. [Google Scholar]
- Vinuesa, R.; Azizpour, H.; Leite, I.; Balaam, M.; Dignum, V.; Domisch, S.; Felländer, A.; Langhans, S.D.; Tegmark, M.; Nerini, F.F. The role of artificial intelligence in achieving the Sustainable Development Goals. Nat. Commun. 2020, 11, 233. [Google Scholar] [CrossRef] [Scilit]
- Mhlanga, D. Artificial Intelligence in the Industry 4.0, and Its Impact on Poverty, Innovation, Infrastructure Development, and the Sustainable Development Goals: Lessons from Emerging Economies? Sustainability 2021, 13, 5788. [Google Scholar] [CrossRef] [Scilit]
- Tulcanaza-Prieto, A.; Morocho-Cayamcela, M. The Evolution and Takeoff of the Ecuadorian Economic Groups. Economies 2021, 9, 188. [Google Scholar] [CrossRef] [Scilit]
- Jobin, A.; Ienca, M.; Vayena, E. The global landscape of AI ethics guidelines. Nat. Mach. Intell. 2019, 1, 389–399. [Google Scholar] [CrossRef] [Scilit]
- Schreiber, A.; Schreiber, I. AI for cyber-security risk: Harnessing AI for automatic generation of company-specific cybersecurity risk profiles. Inf. Comput. Secur. 2025, 33, 520–546. [Google Scholar] [CrossRef] [Scilit]
- Tumma, C.; Azmeera, R.; Ayyamgari, S.; Thumma, B.Y.R. Data Security and Privacy Protection in Artificial Intelligence Models: Challenges and Defense Mechanisms. Int. J. Sci. Res. Eng. Manag. 2025, 9, 1–9. [Google Scholar] [CrossRef] [Scilit]
- Liu, L.; Wang, Y.; Liu, G.; Peng, K.; Wang, C. Membership Inference Attacks Against Machine Learning Models via Prediction Sensitivity. IEEE Trans. Dependable Secur. Comput. 2023, 20, 2341–2347. [Google Scholar] [CrossRef] [Scilit]
- Ghiurău, D.; Popescu, D.E. Data Security and Privacy in GPT Models: Techniques and Challenges. Appl. Sci. 2026, 16, 1900. [Google Scholar] [CrossRef] [Scilit]
- Kairouz, P.; McMahan, H.B. Advances and Open Problems in Federated Learning. Found. Trends Mach. Learn. 2021, 14, 1–210. [Google Scholar] [CrossRef] [Scilit]
- Tulcanaza-Prieto, A.B.; Cortez-Ordoñez, A.; Lee, C.W. Influence of Customer Perception Factors on AI-Enabled Customer Experience in the Ecuadorian Banking Environment. Sustainability 2023, 15, 12441. [Google Scholar] [CrossRef] [Scilit]
- Rubio, J.; Tulcanaza-Prieto, A.B. Digital Payments Trust in Latin America and the Caribbean. Economies 2025, 13, 140. [Google Scholar] [CrossRef] [Scilit]
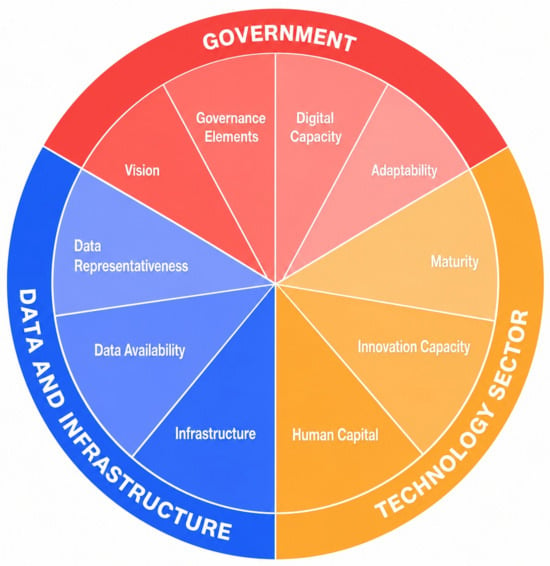
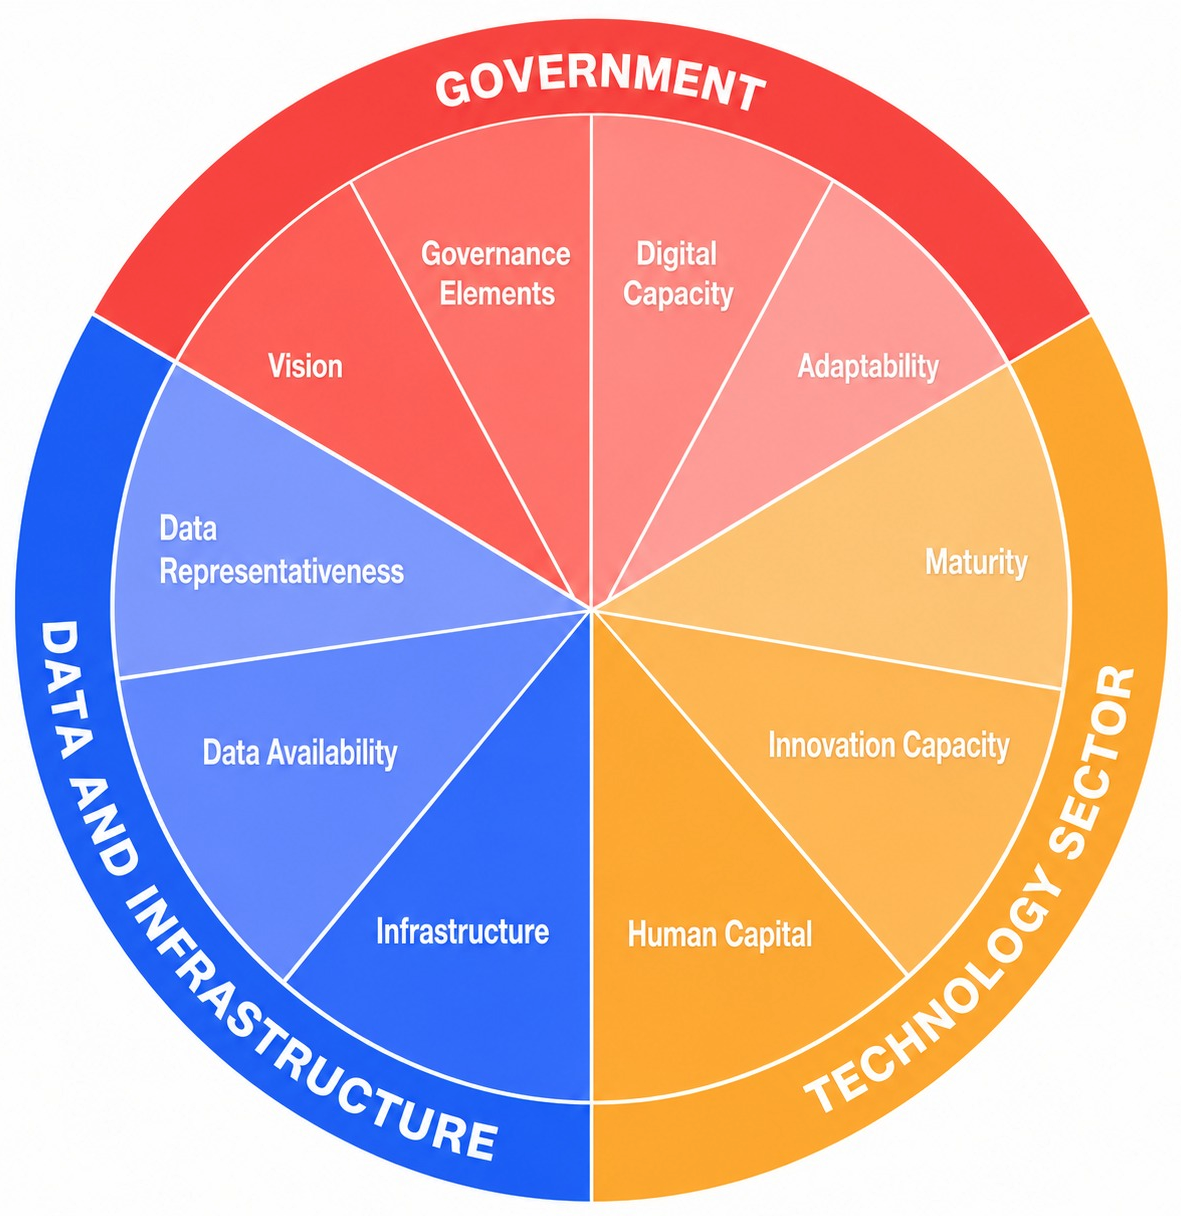
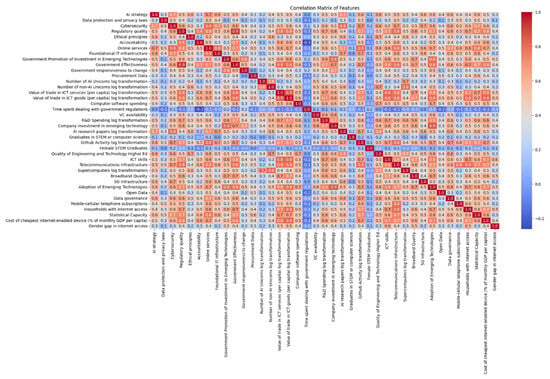
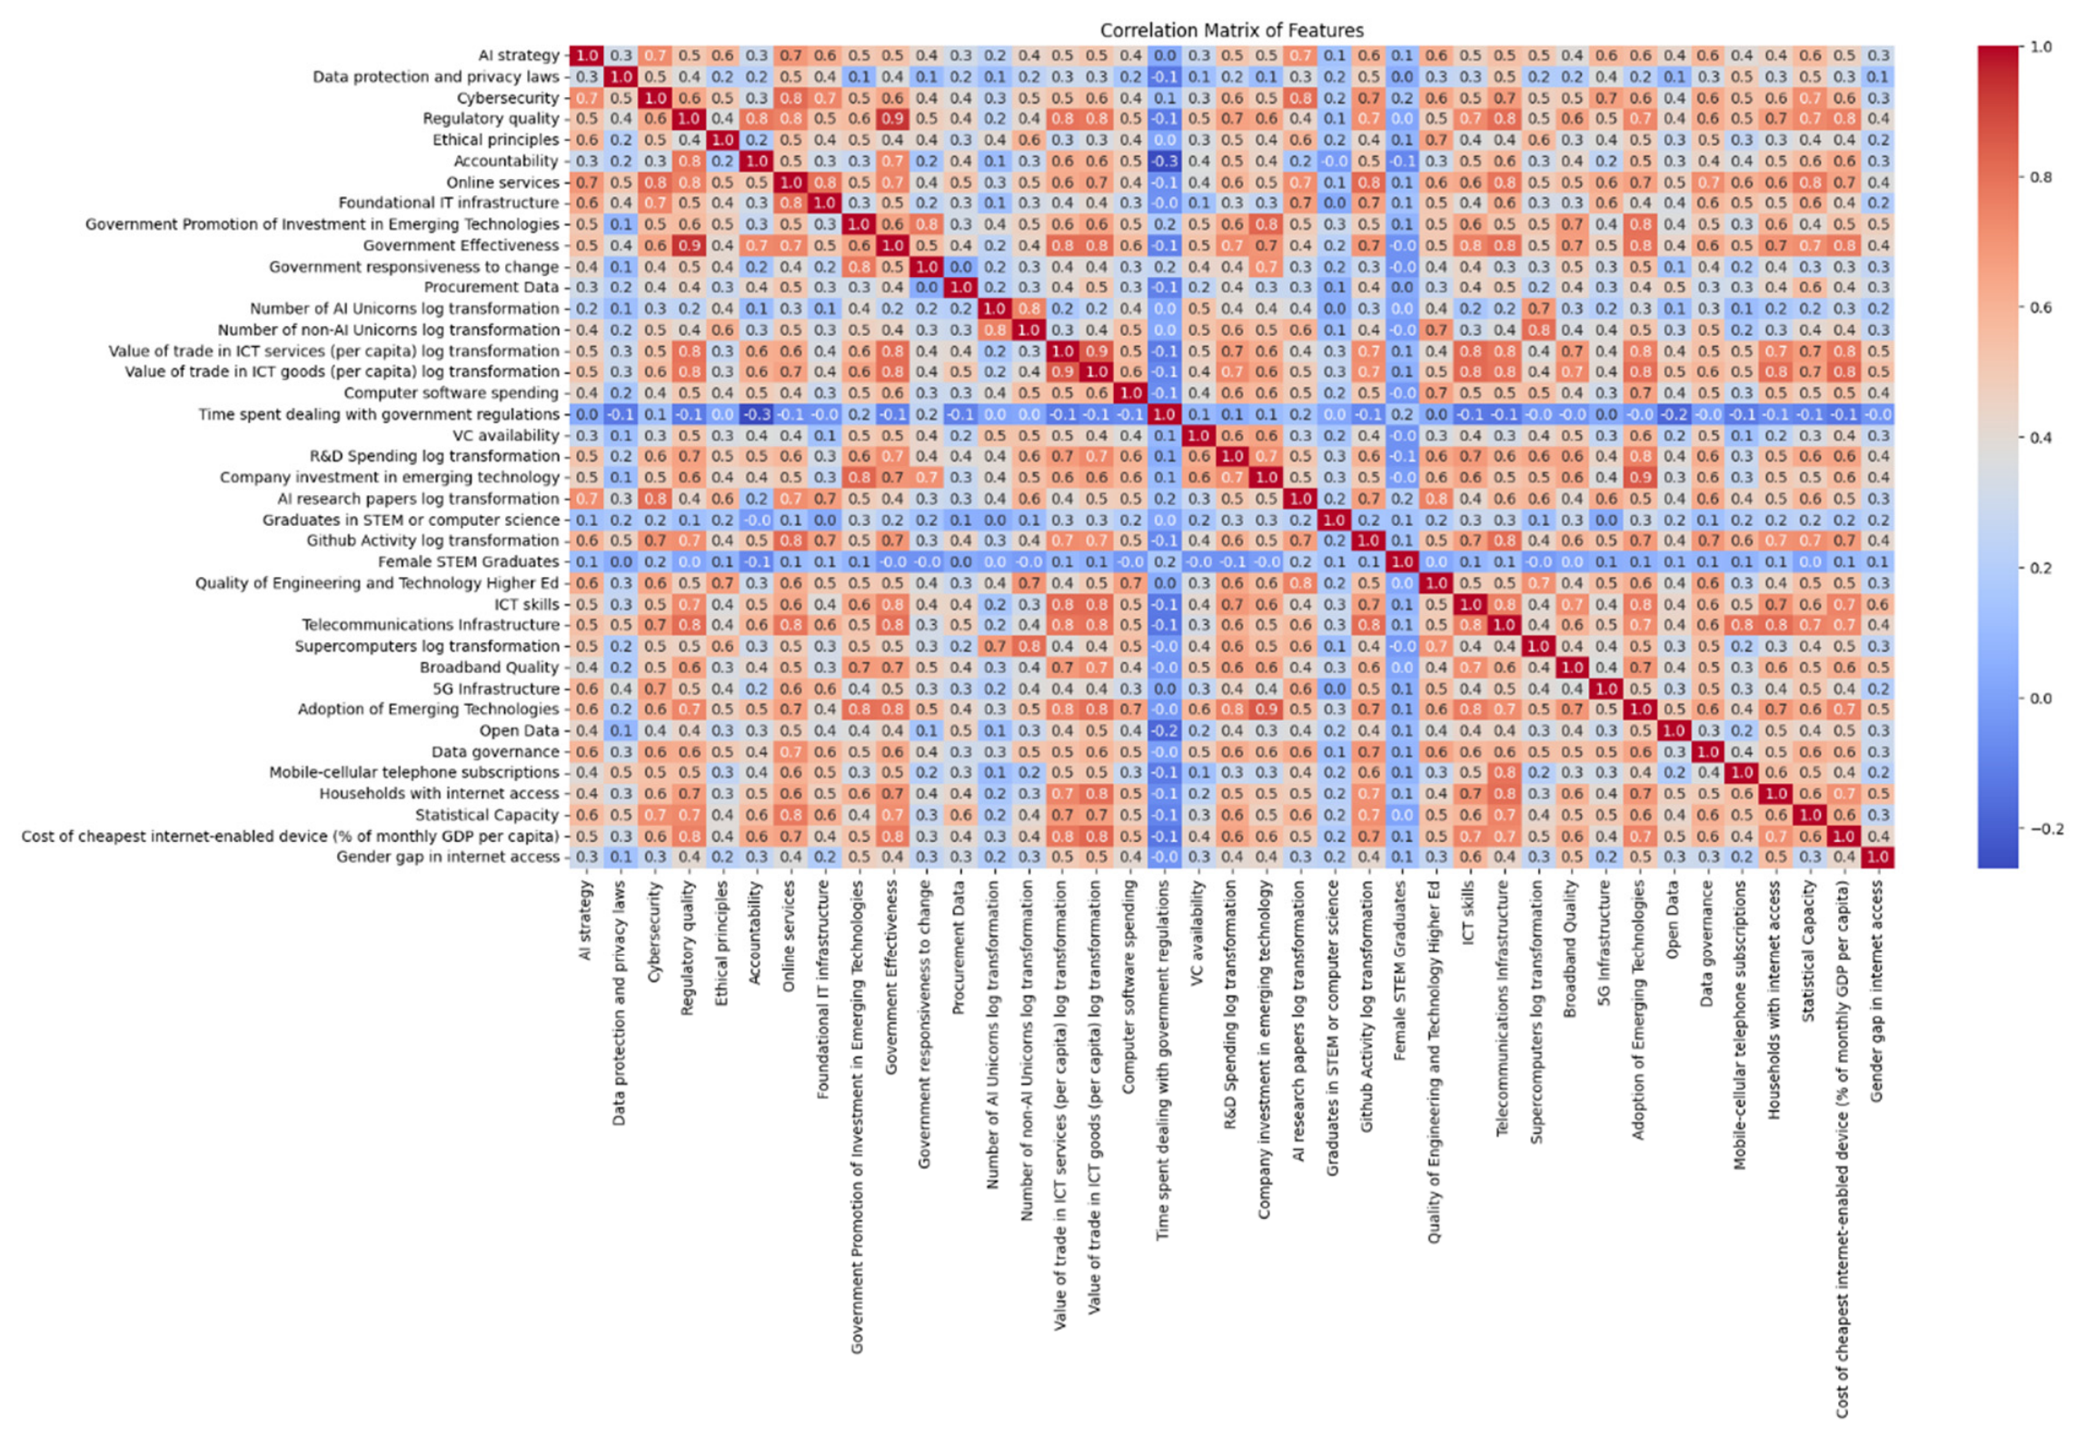
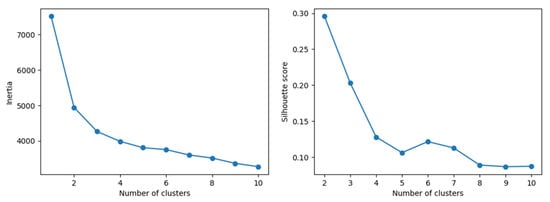
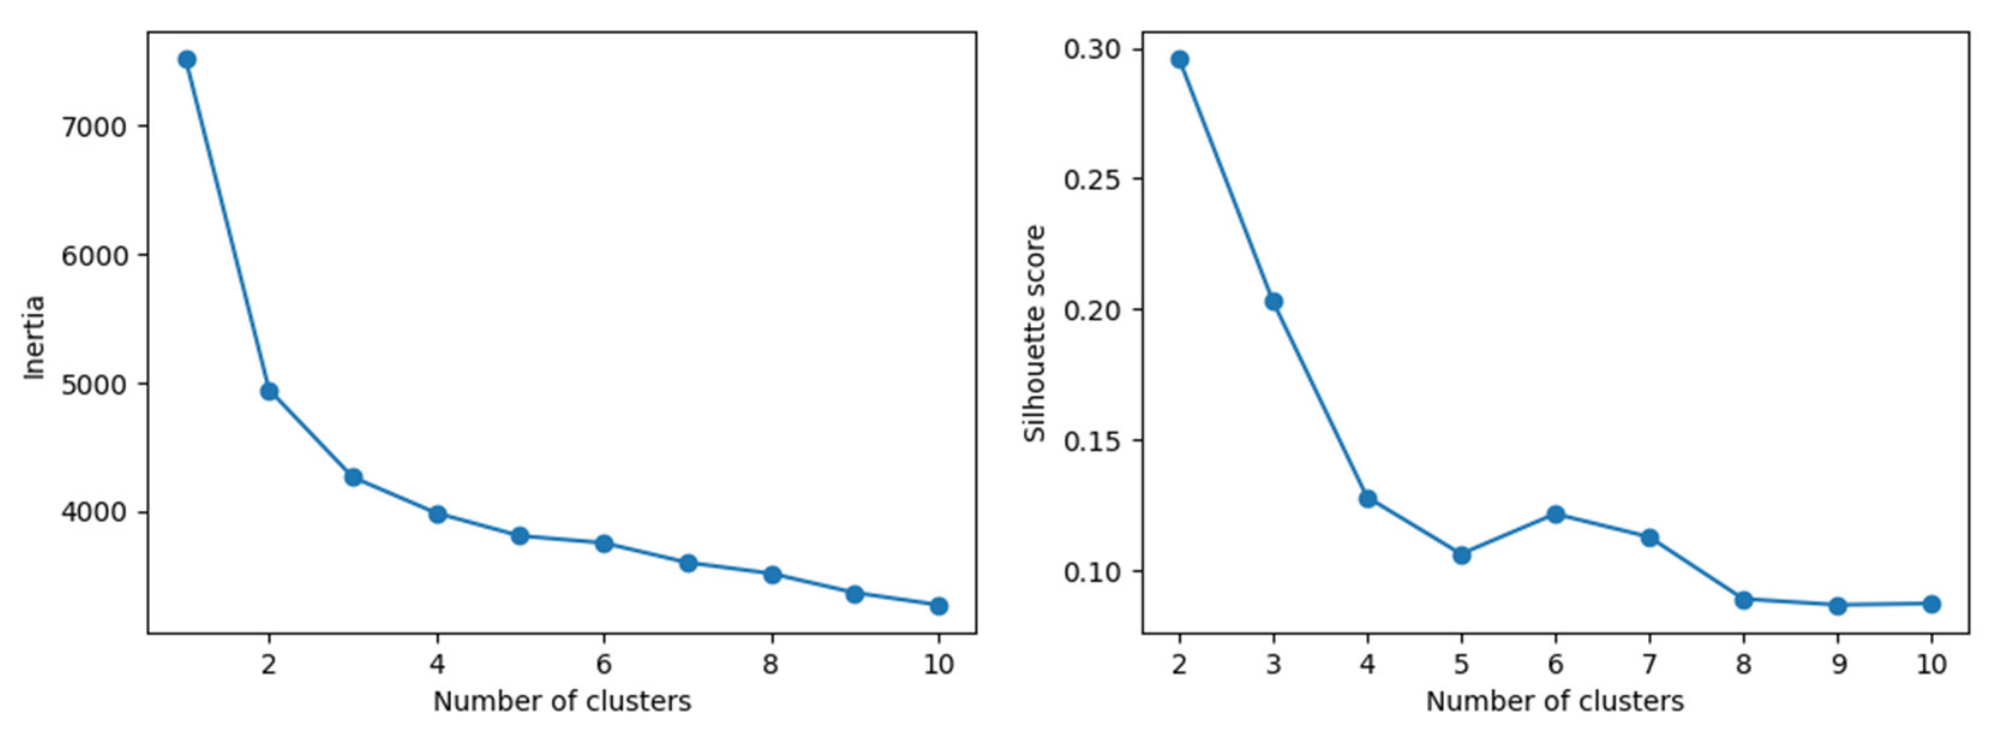
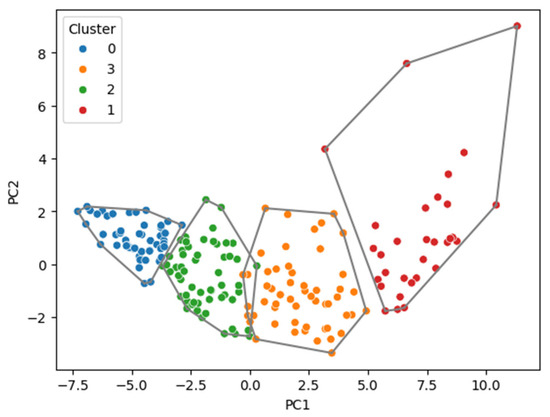
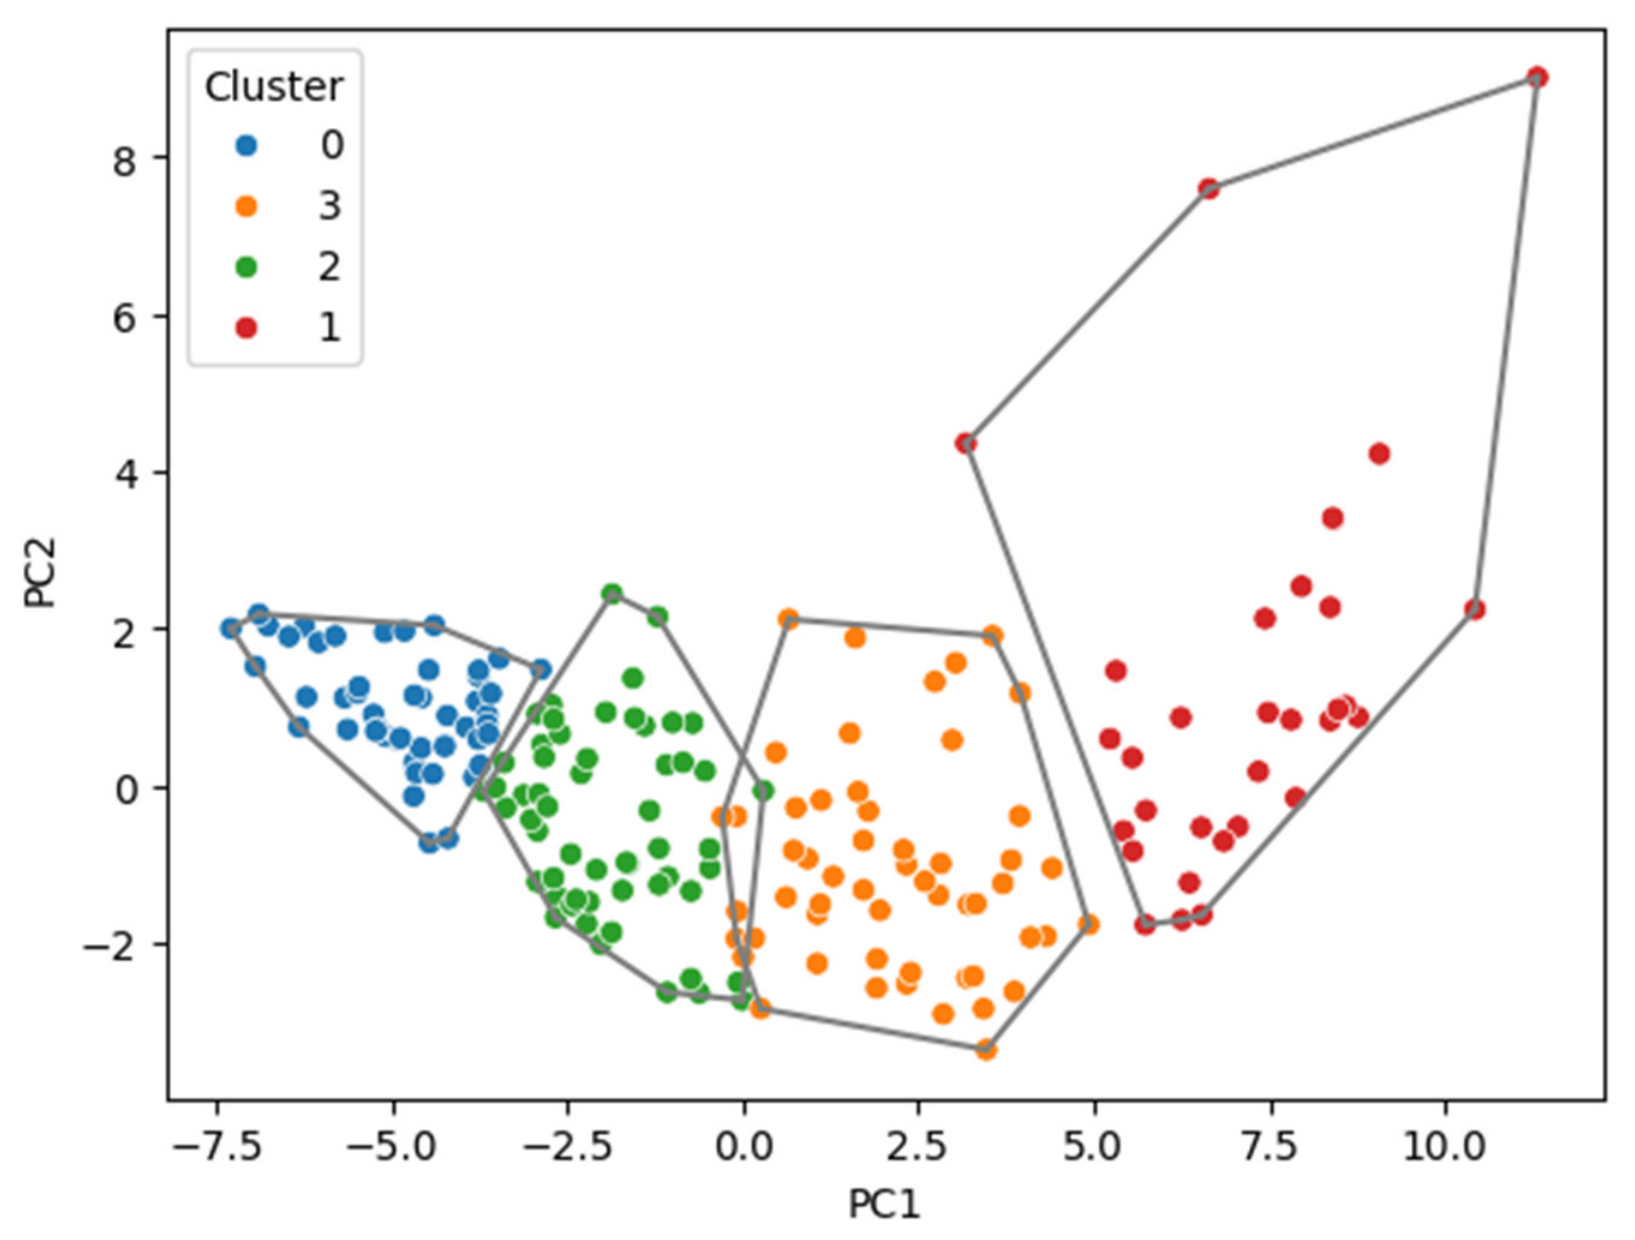
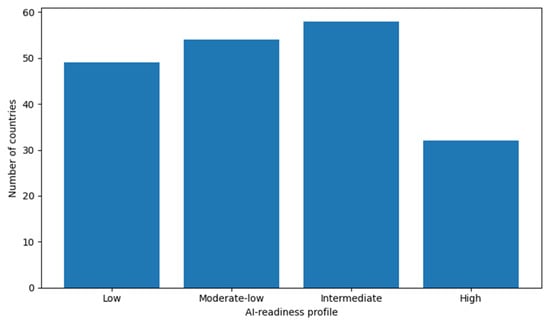
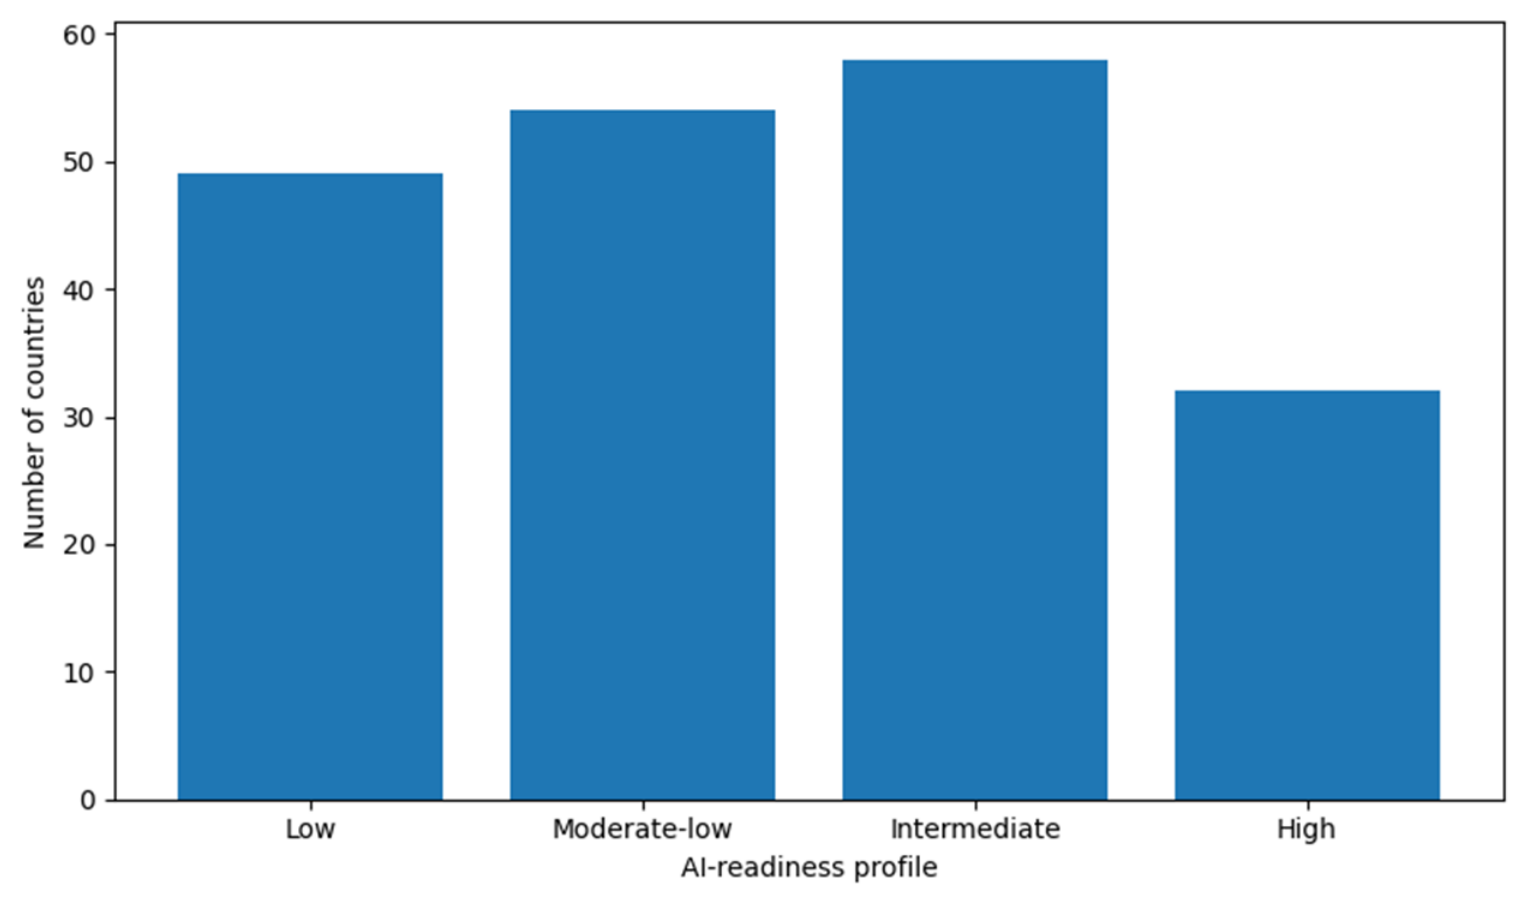
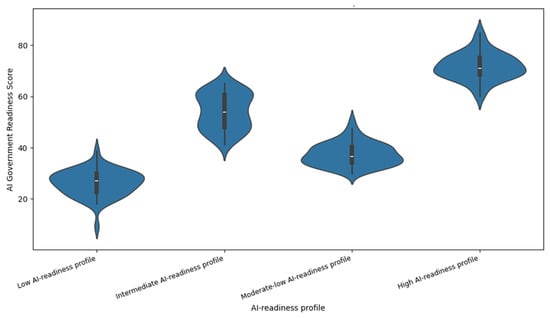
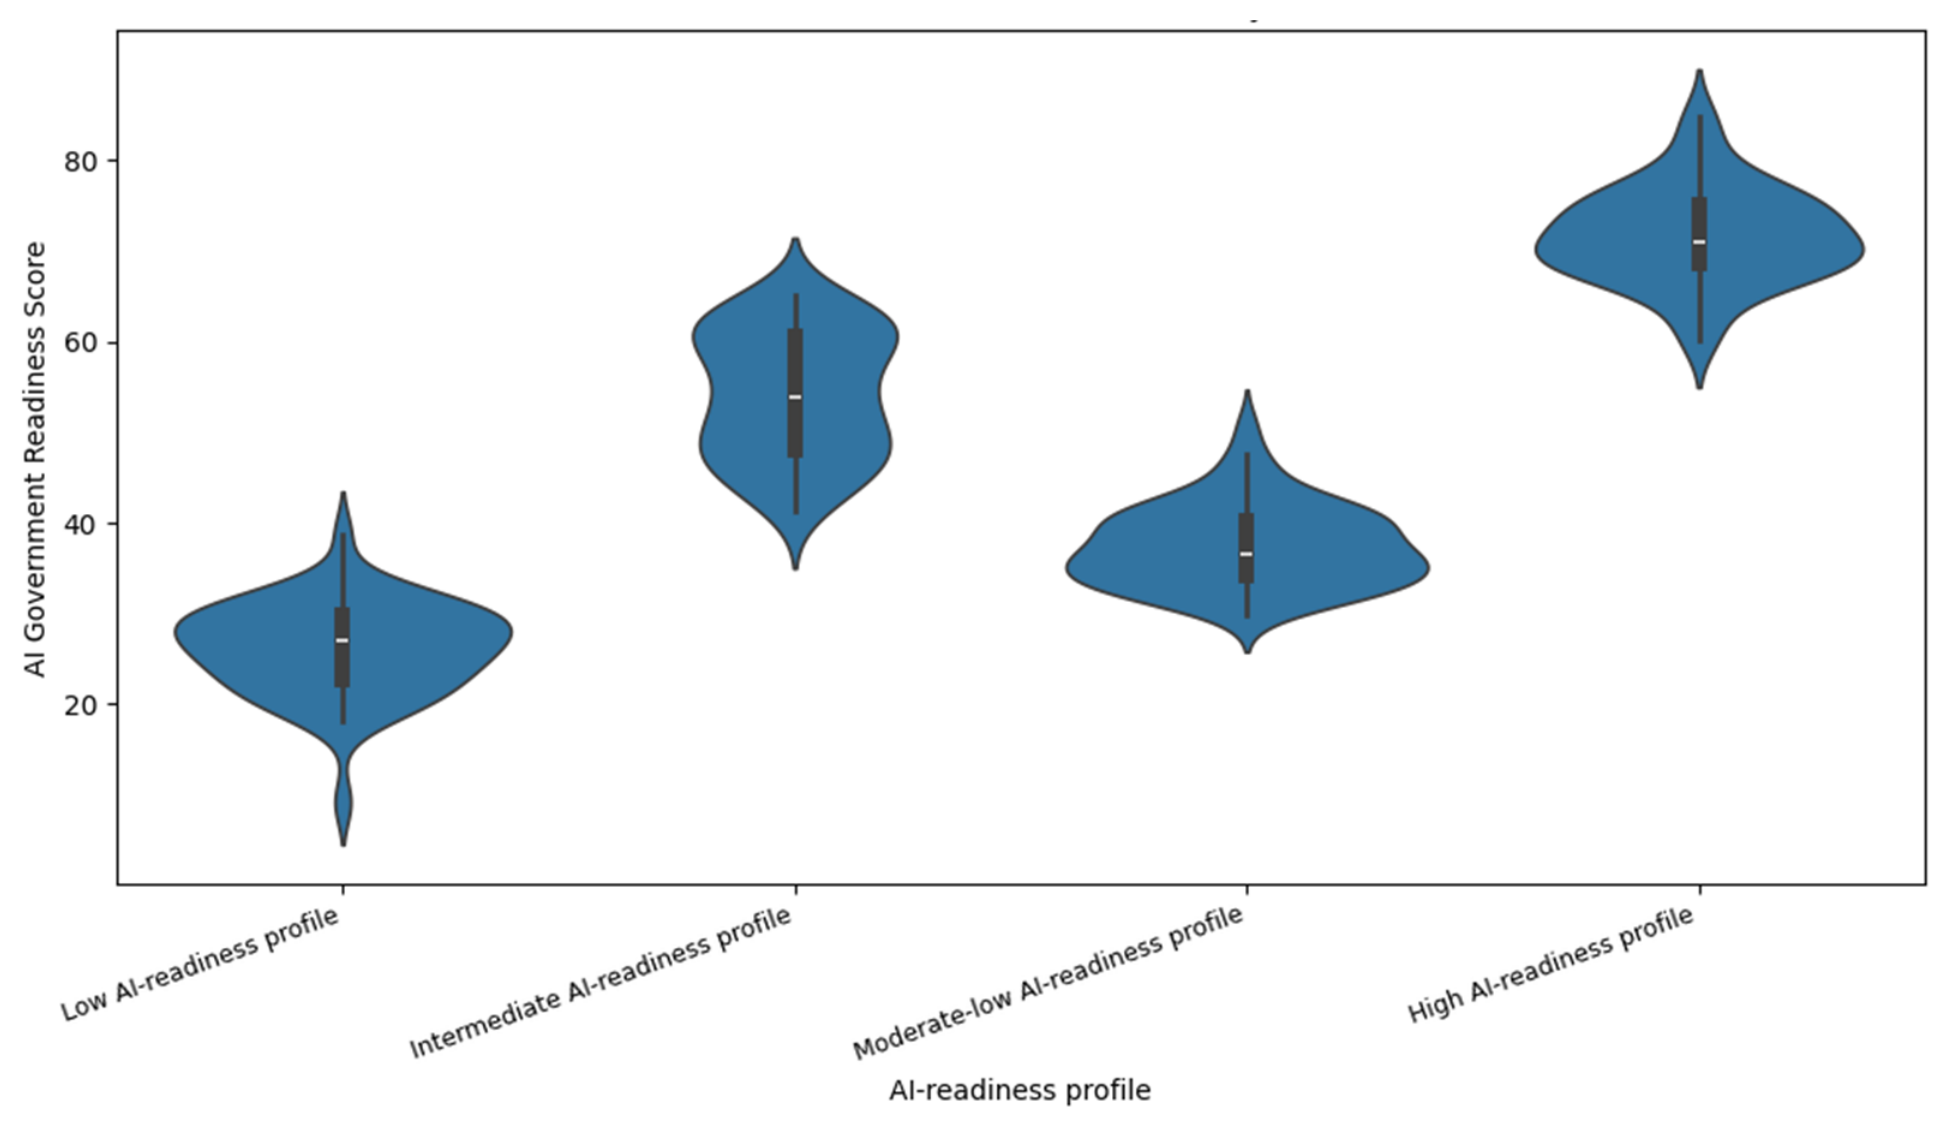
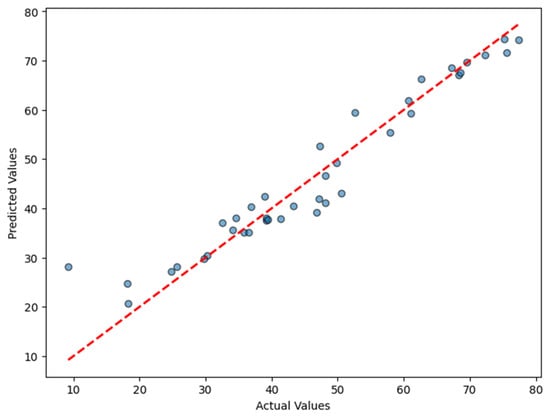
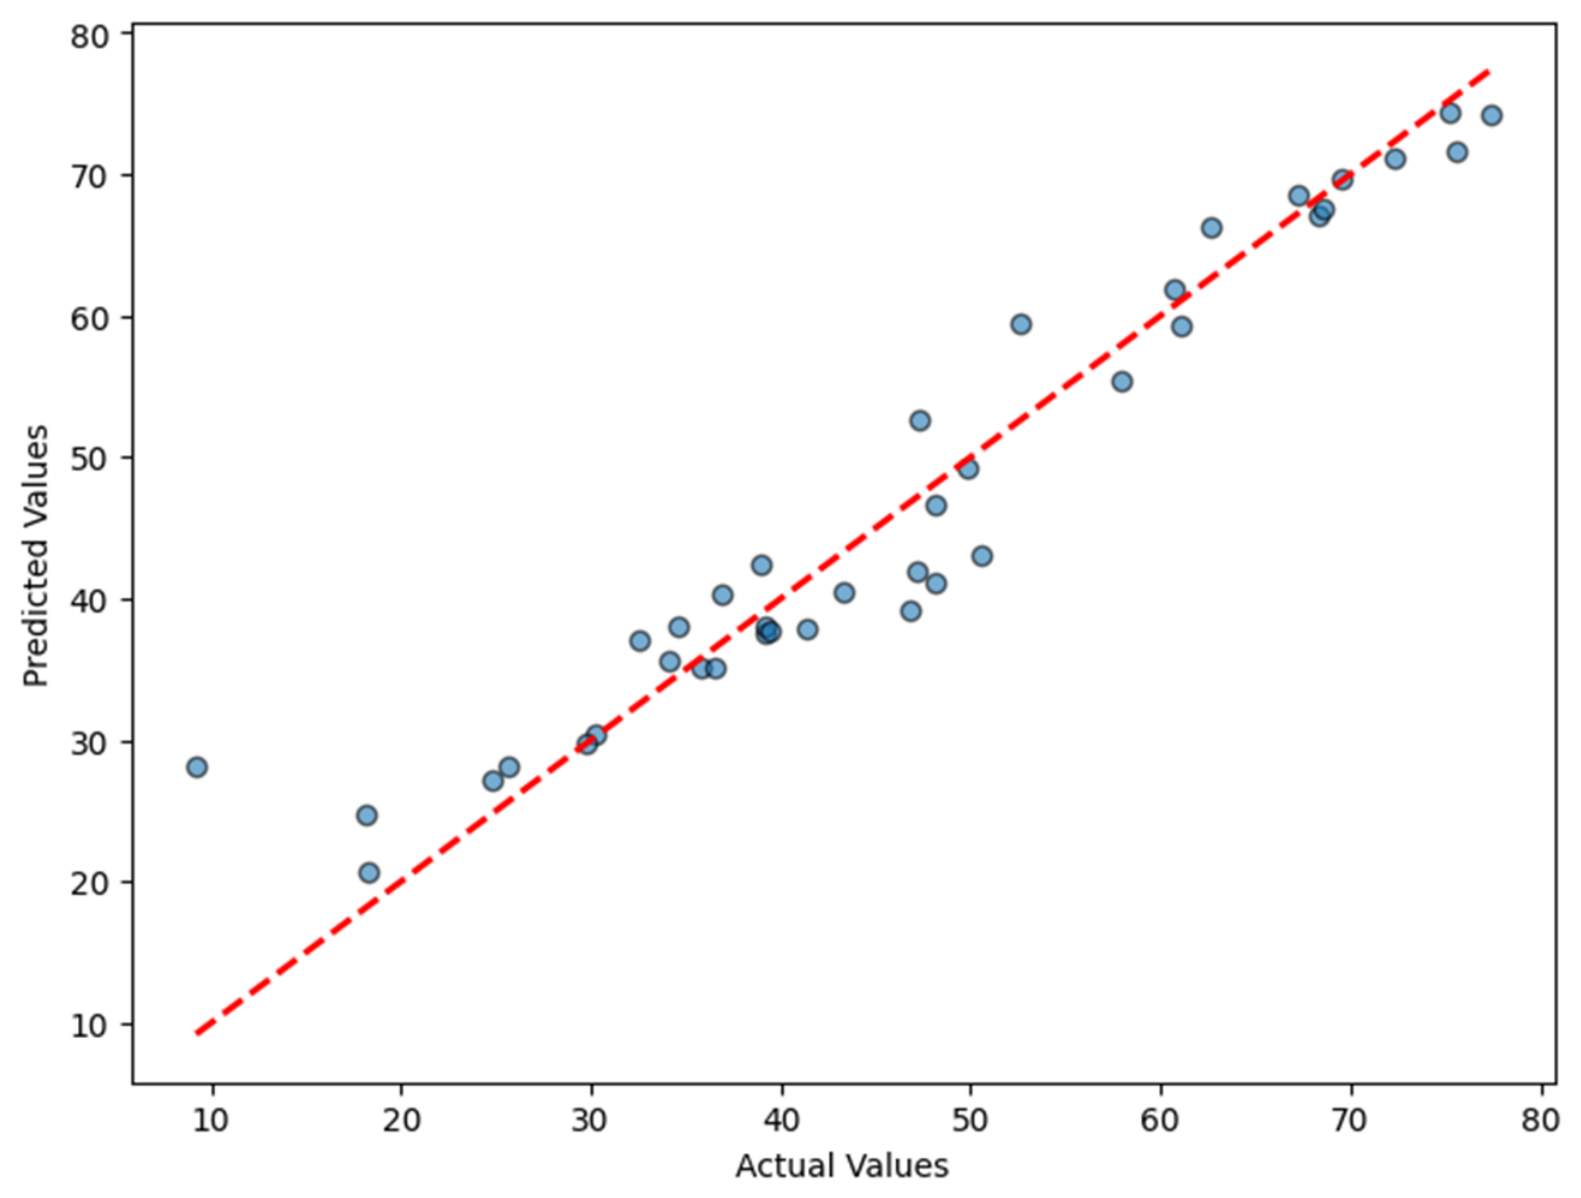
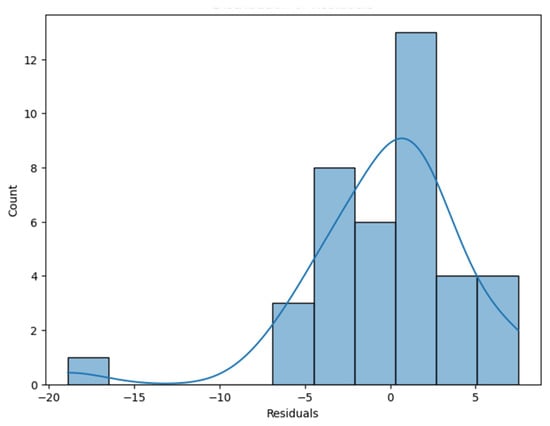
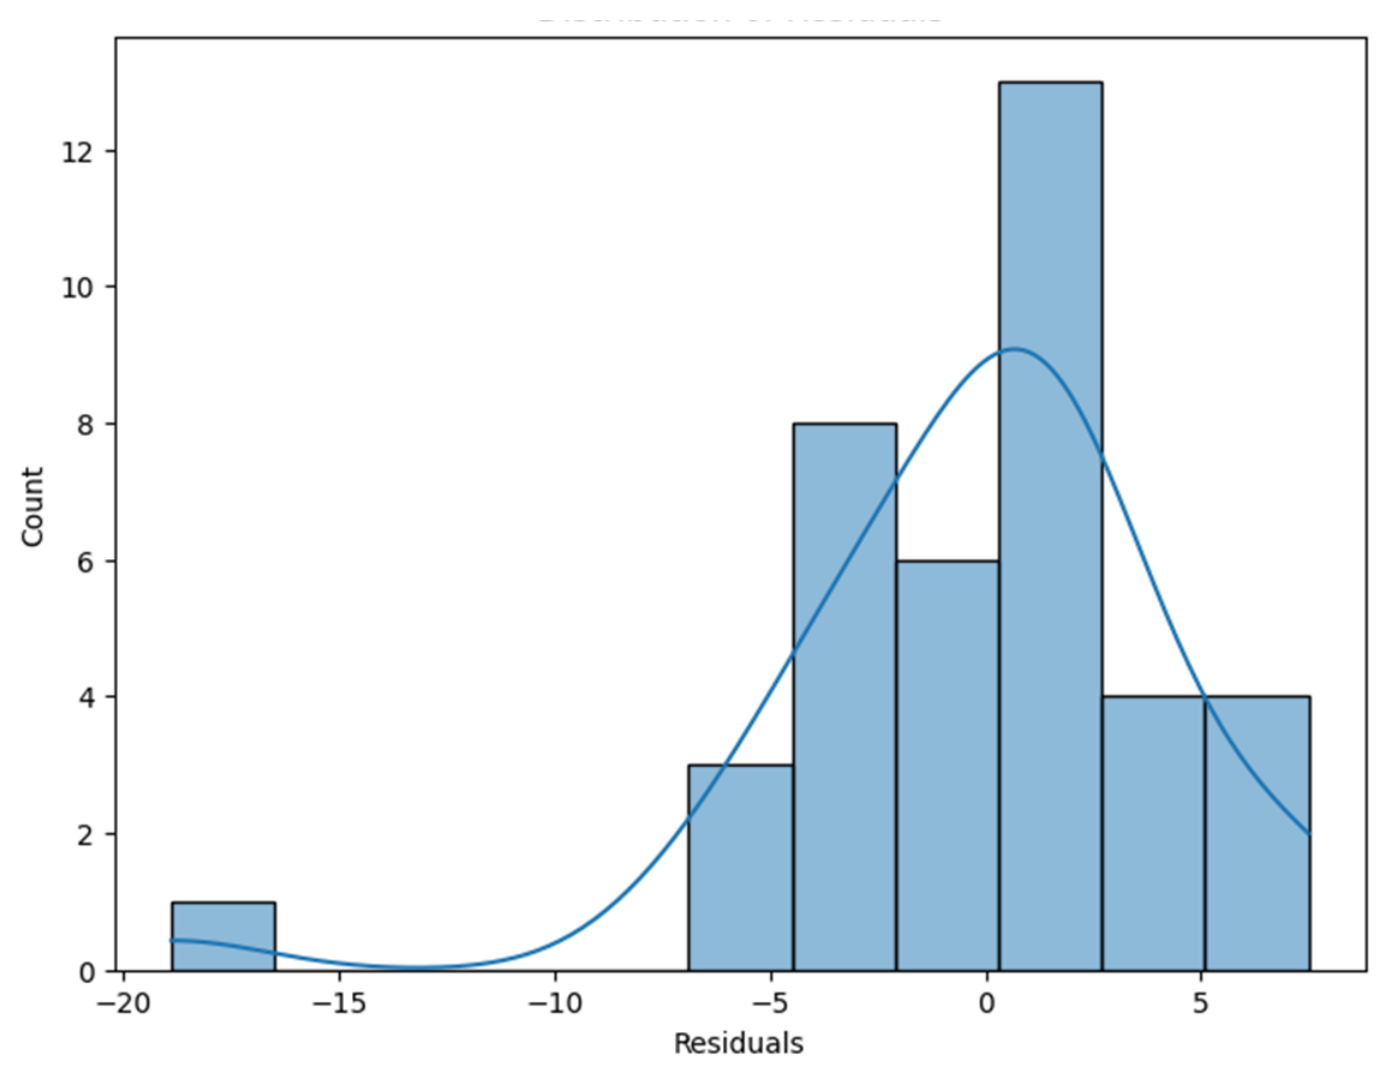
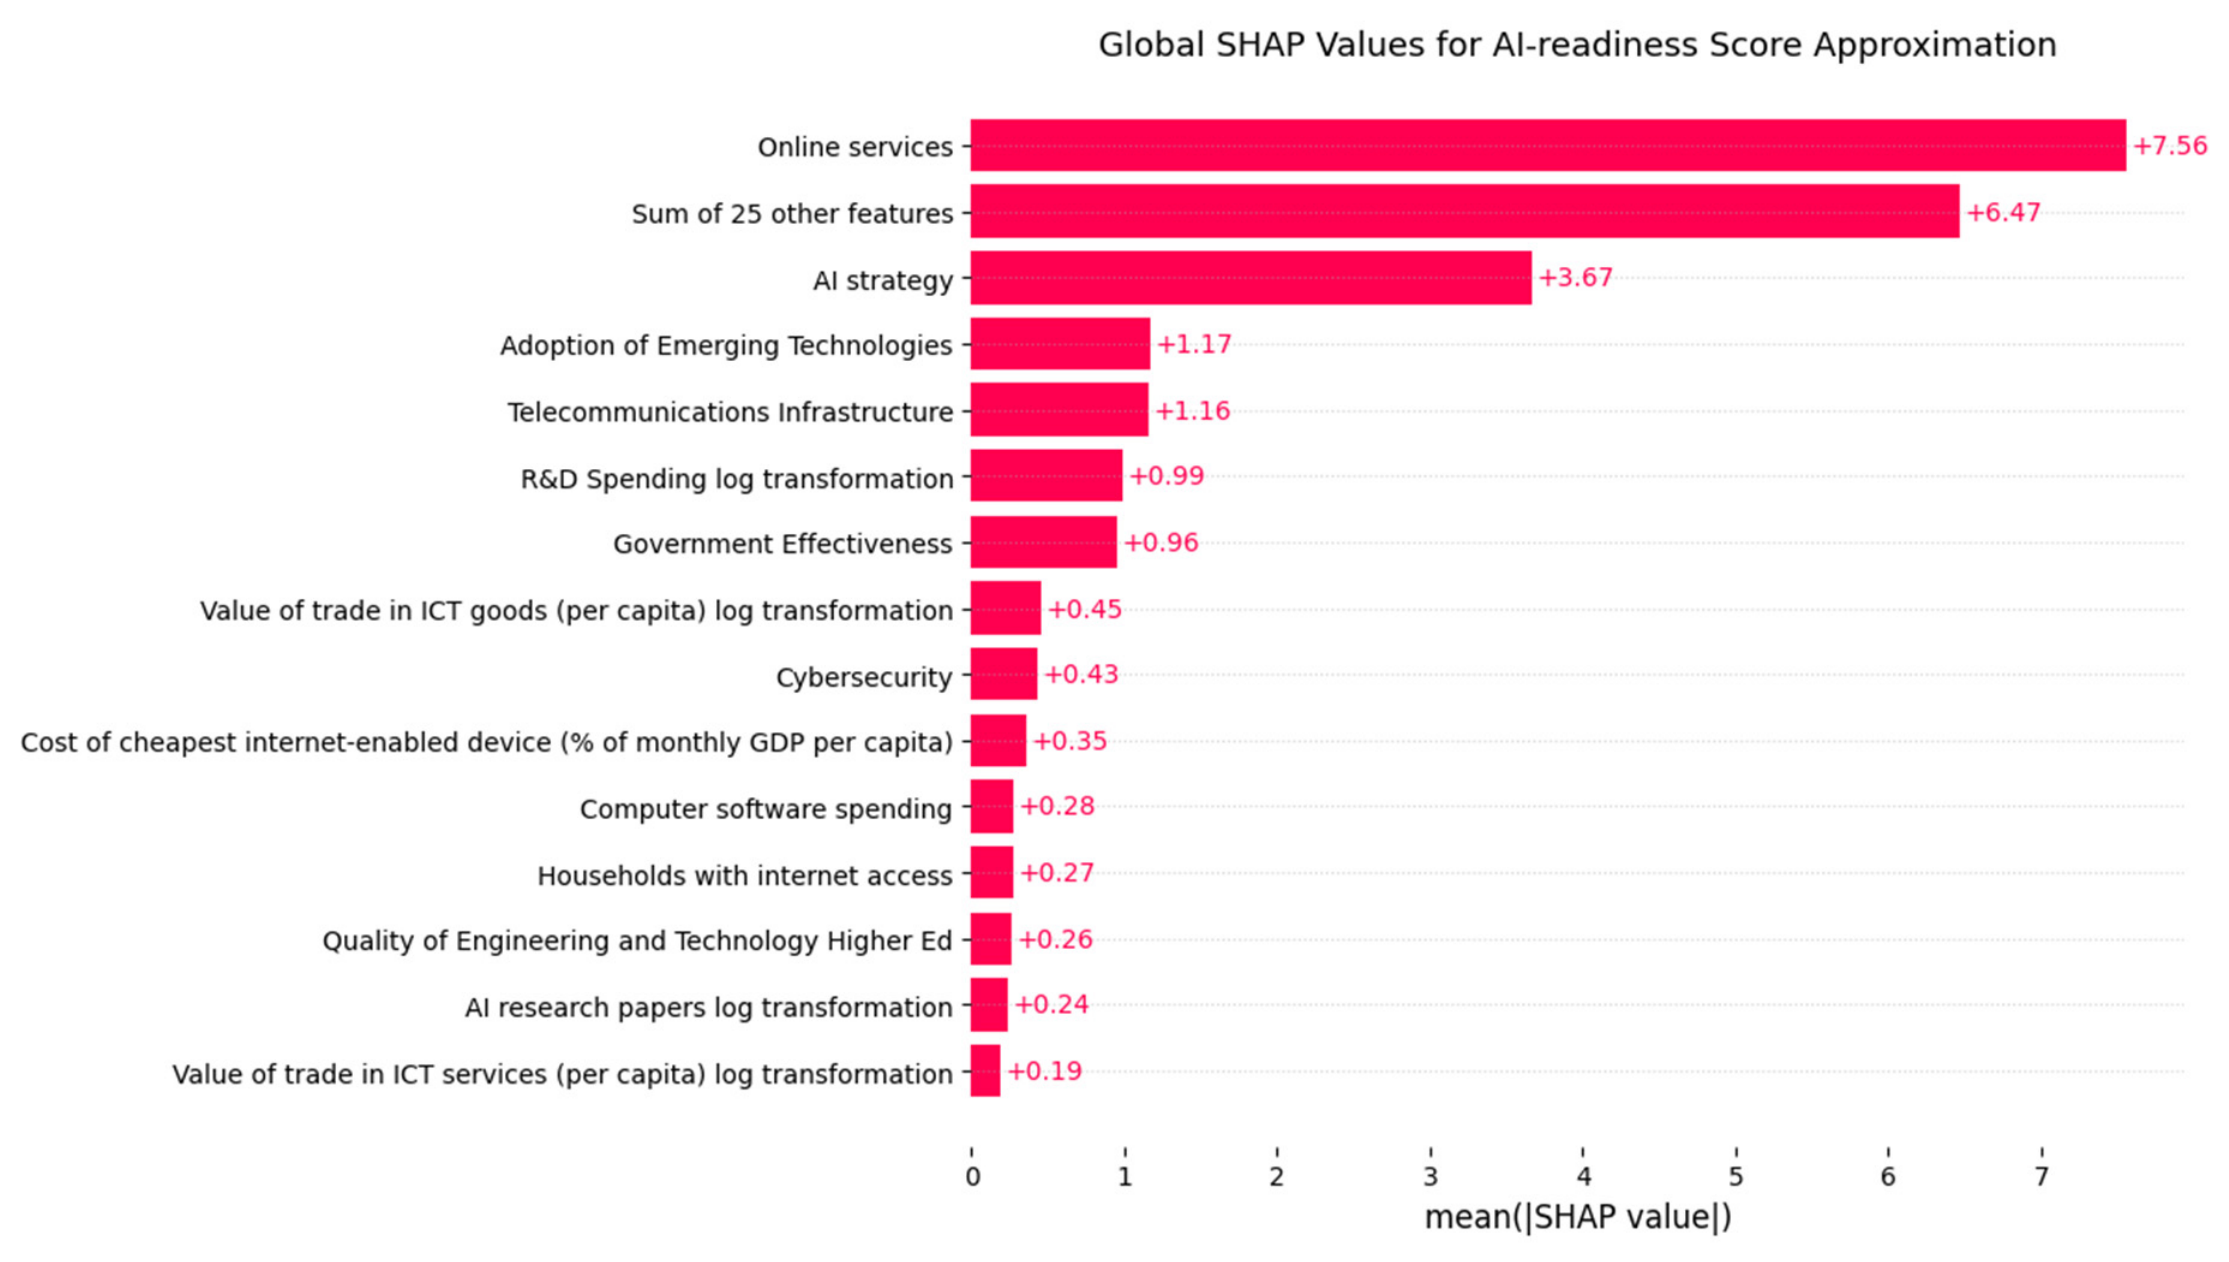
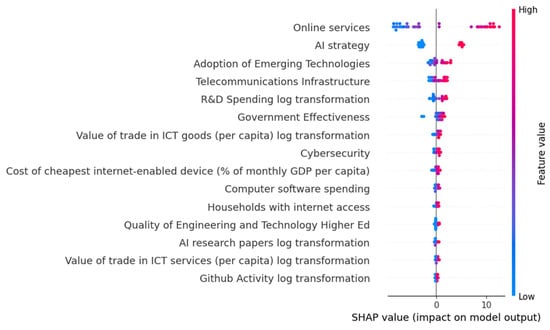
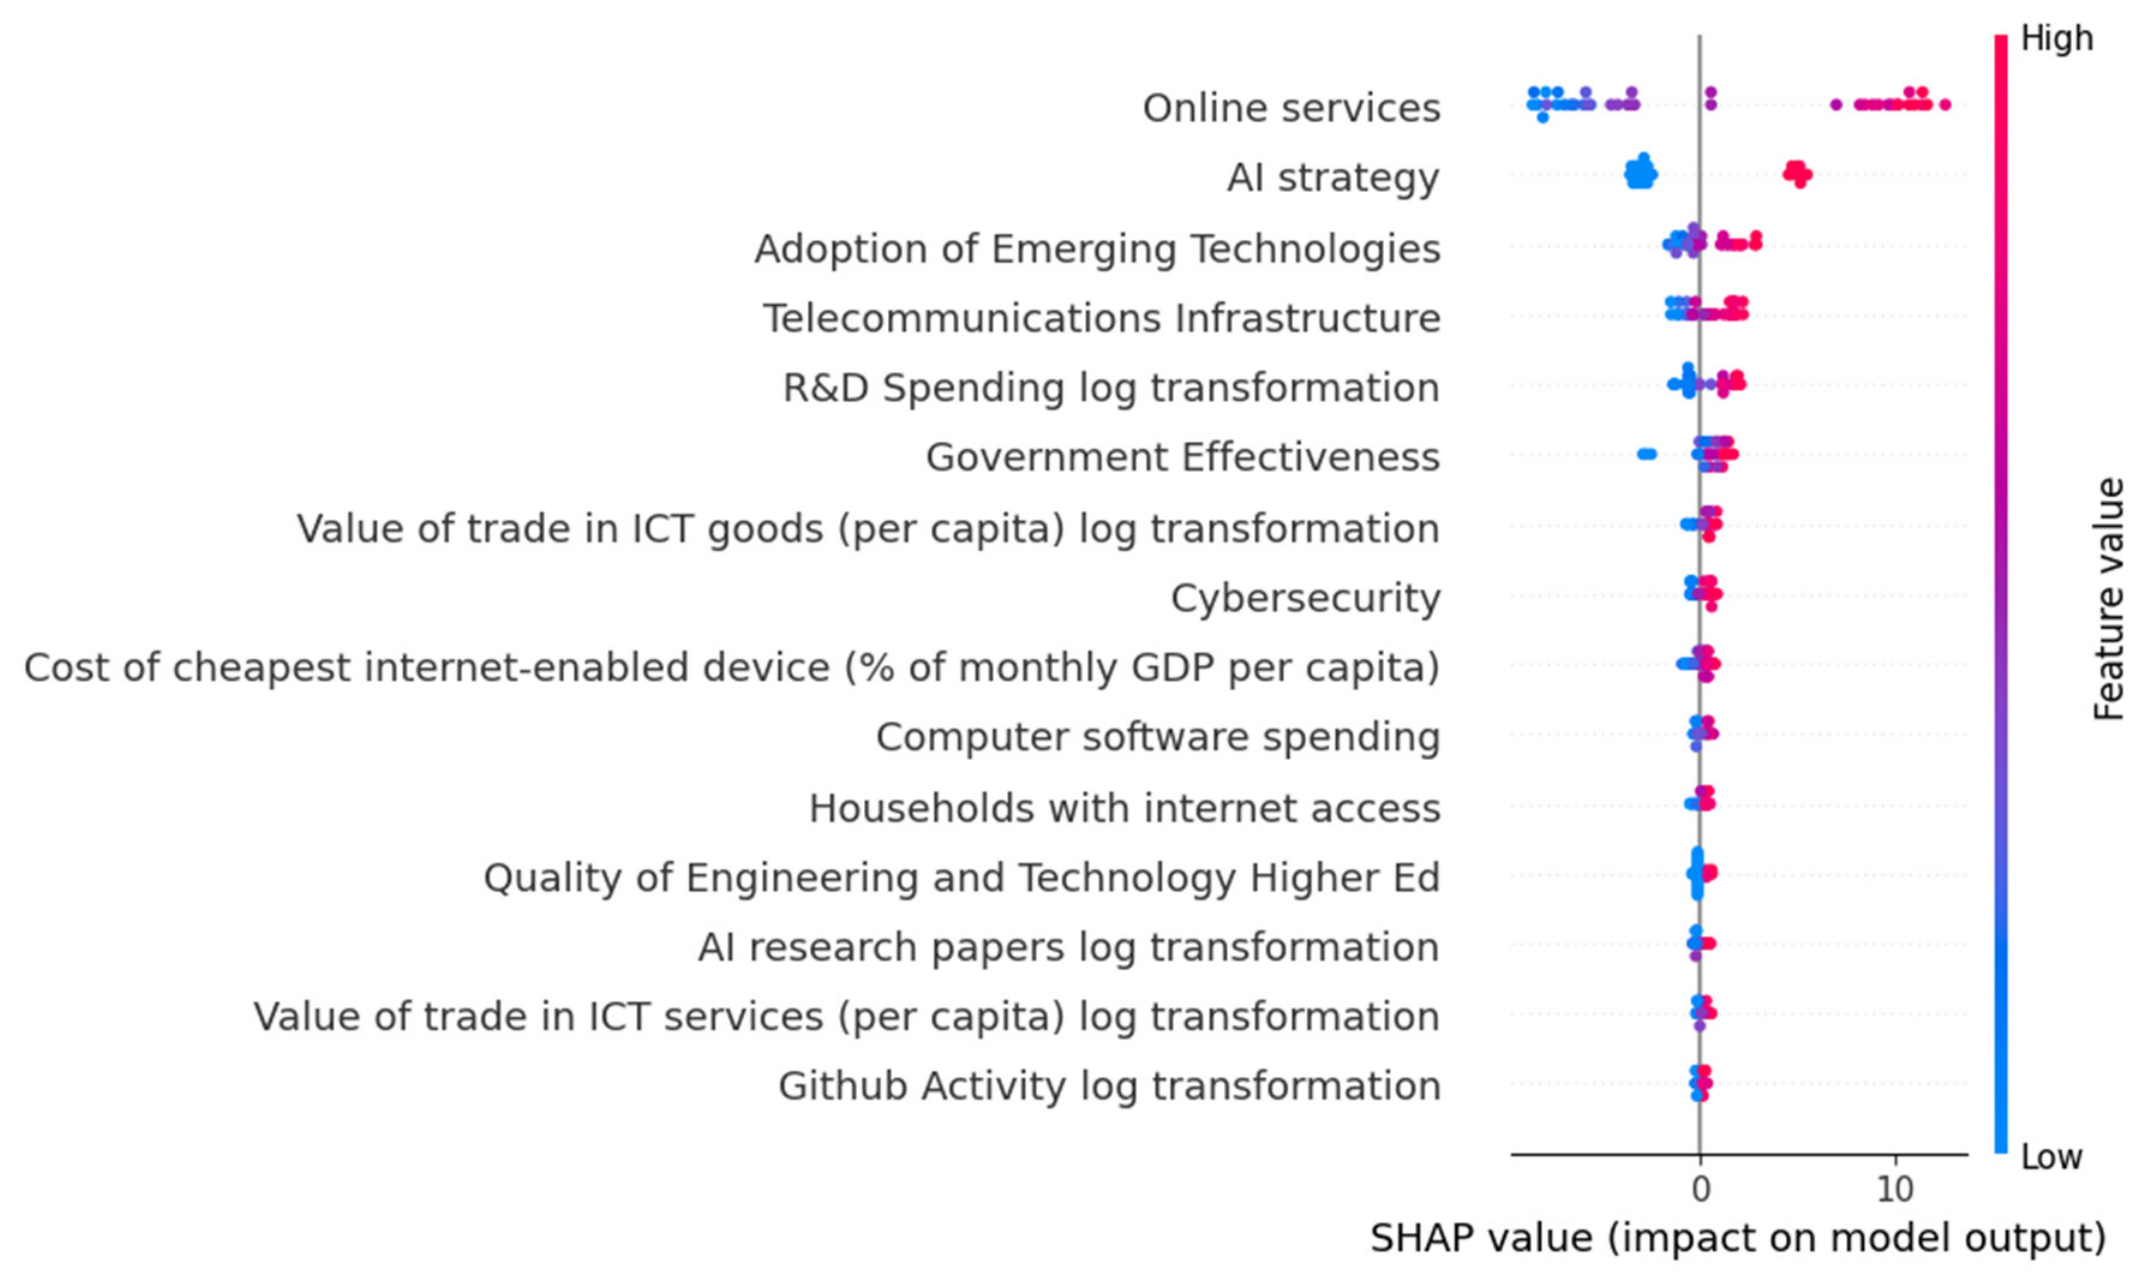
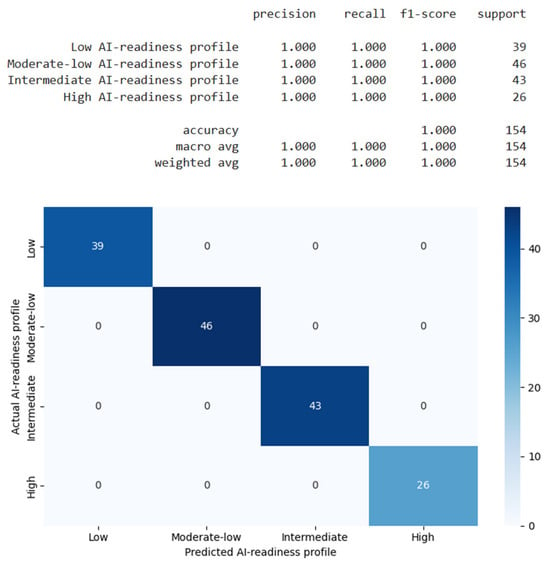
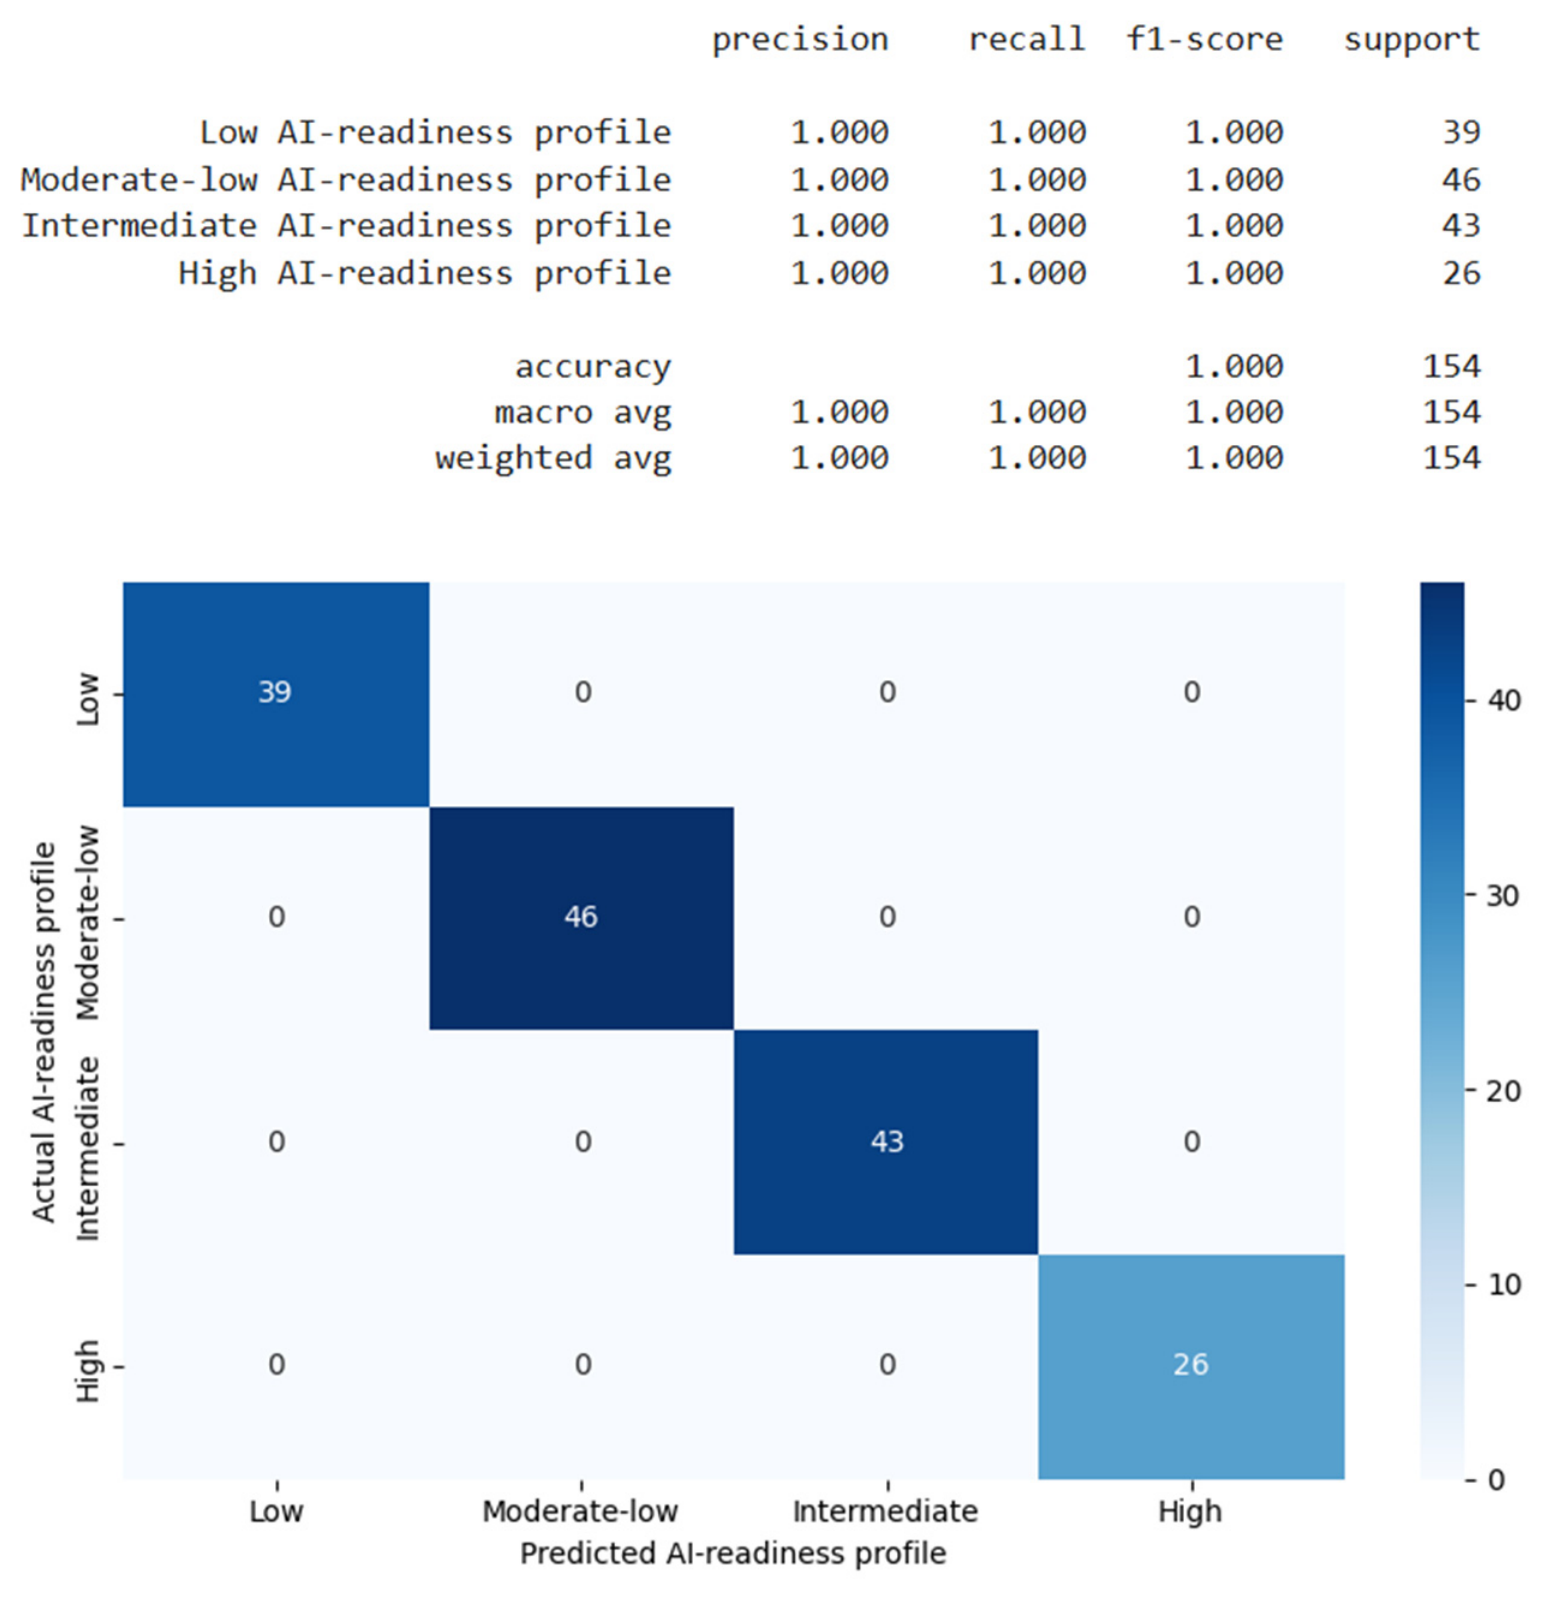
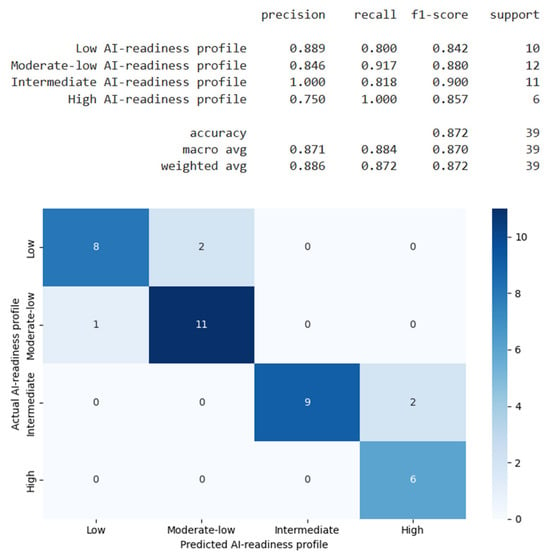
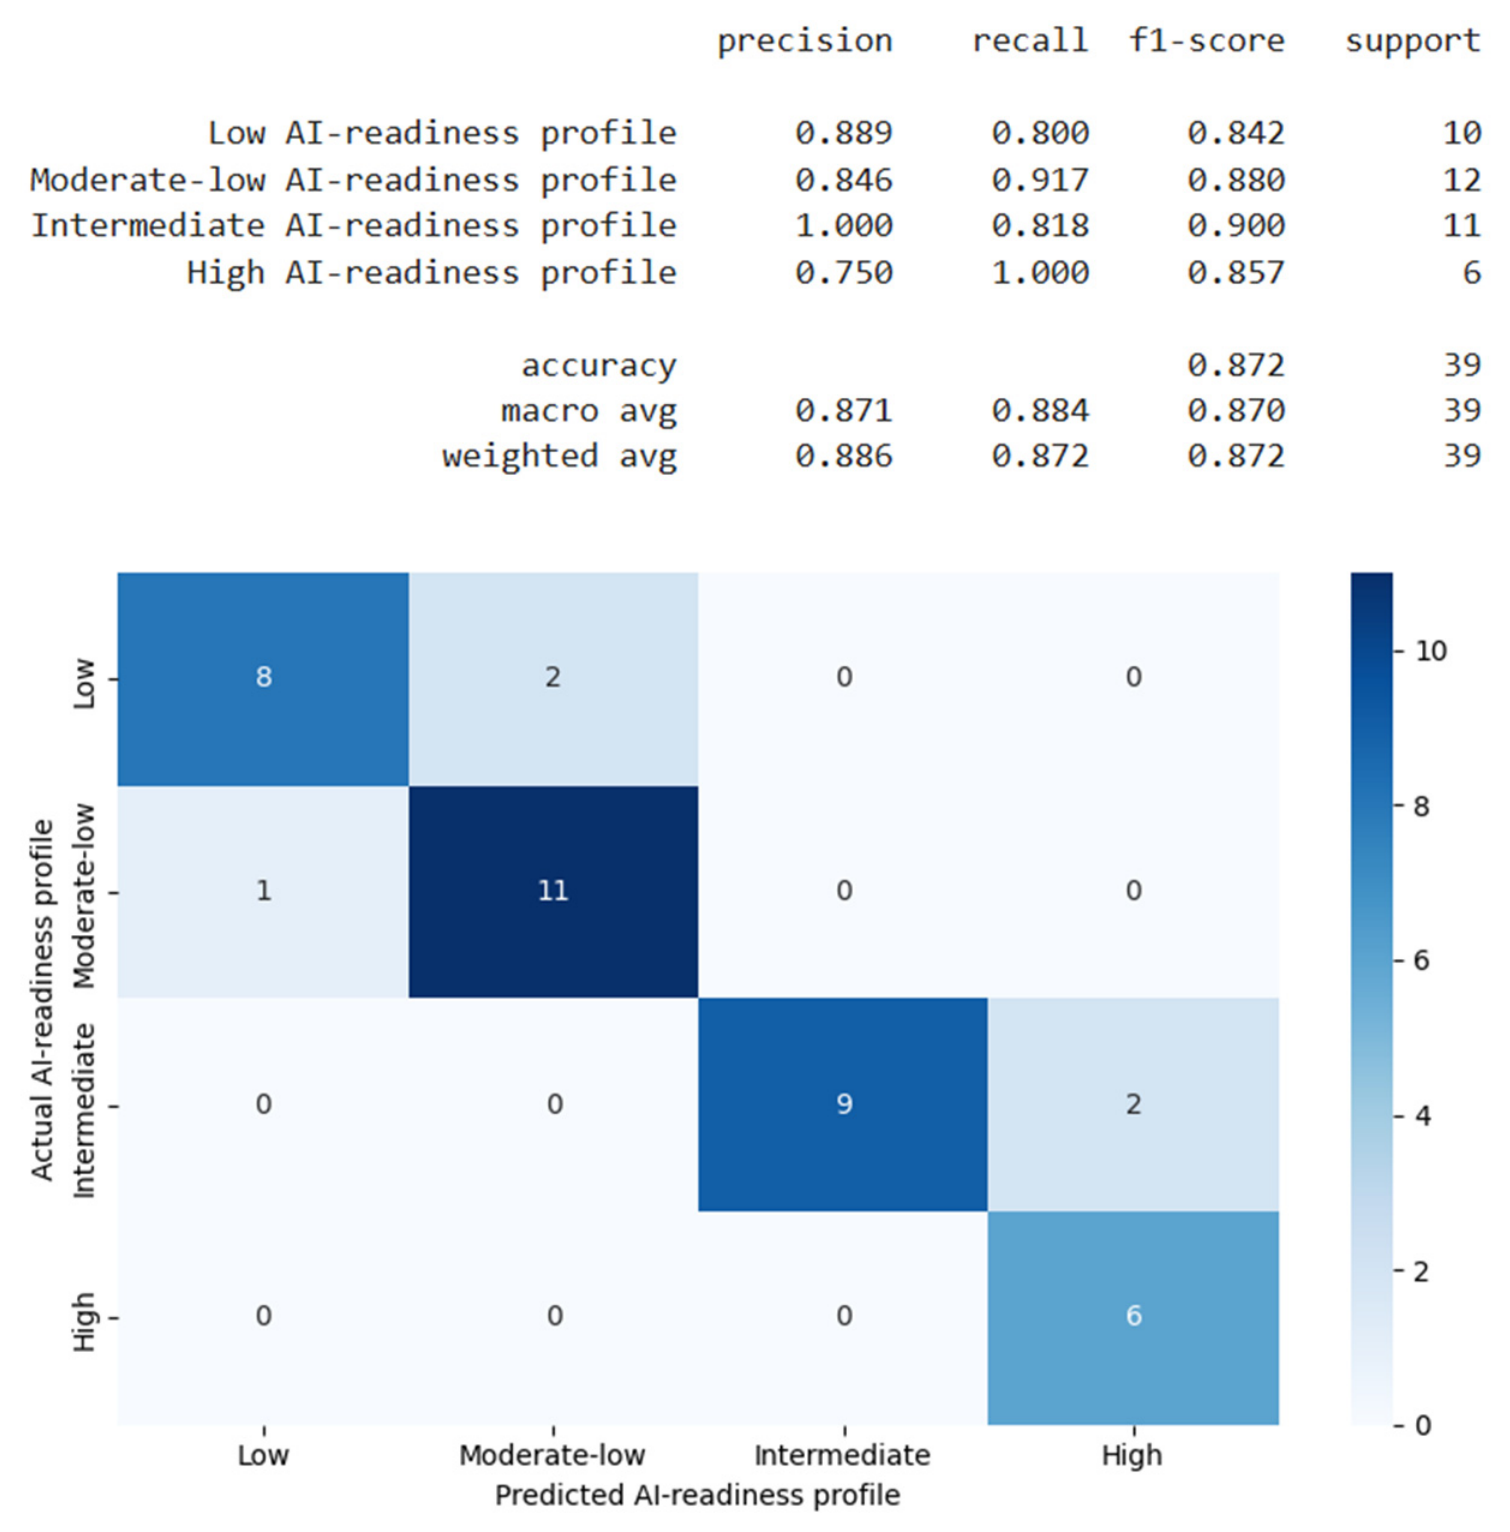
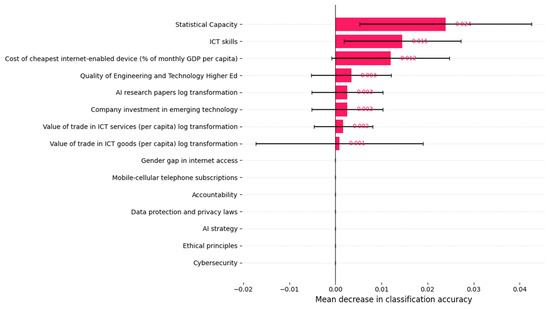

Disclaimer/Publisher’s Note: The statements, opinions and data contained in all publications are solely those of the individual author(s) and contributor(s) and not of MDPI and/or the editor(s). MDPI and/or the editor(s) disclaim responsibility for any injury to people or property resulting from any ideas, methods, instructions or products referred to in the content. |
© 2026 by the authors. Licensee MDPI, Basel, Switzerland. This article is an open access article distributed under the terms and conditions of the Creative Commons Attribution (CC BY) license.