


Abstract
Smartwatches are increasingly used in safety-critical scenarios, yet their optical heart-rate (HR) measurements often contain noise, artifacts, and missing data, undermining clinical trust. This paper presents Edge Beats, a data-curation layer and end-to-end architecture that enables the low-cost, open source PineTime smartwatch to function as a practical HR sensing node for distributed wearable systems. Heart-rate packets are streamed from PineTime to an ESP32 at the edge layer over Bluetooth Low Energy (BLE), then forwarded via an embedded Message Queuing Telemetry Transport (MQTT) broker to an edge server laptop for processing and visualization. A lightweight multi-stage algorithm cleans and smooths the HR stream using physiological boundary checks, a configurable data imputation technique, and exponential moving average (EMA) smoothing, all designed for real-time operation on resource-constrained hardware. We have evaluated the system over long monitoring sessions and compared the processed PineTime output against a commercial Huawei GT Pro 2 smartwatch. The system suppresses extreme spikes and short-term oscillations, yielding a more stable HR trace with qualitative agreement to the reference trends while keeping values in a physiologically plausible range. Network measurements show low latency (almost 3 ms one-way, 15 ms RTT) and stable throughput, and power measurements (100–450 mW for ESP32 and 3–70 mW for PineTime watch) confirm that continuous HR streaming over BLE and MQTT is feasible within the PineTime’s energy budget. These results imply that data stream processing combined with a modest publish–subscribe architecture improves the stability and usability of HR streams obtained from commodity wearable sensors, making PineTime a candidate as a complementary component for mission-critical health and safety systems.
1. Introduction
Smartwatches have fully invaded the lifestyle-device space and are increasingly entering clinical decision support. However, this shift relies on one key requirement: the consistency and usability of their physiological measurements. In life-critical applications, where delays or false-positive alarms may harm patients, End-to-End (E2E) systems must be capable of generating stable and continuously available Heart Rate (HR) data streams with explicit timing guarantees across heterogeneous, distributed processing elements. Although high-end smartwatches can provide more reliable sensing, their cost limits accessibility for large-scale deployment, especially in Low- and Middle-Income Countries (LMICs). Therefore, low-cost smartwatches must be adapted for such applications. The PineTime smartwatch is well-suited for this purpose because it is open source, inexpensive, and equipped with an optical Photoplethysmography (PPG) sensor and an accelerometer, making it suitable for reproducible research and edge-based systems engineering.
Recent works have shown growing interest in open-hardware and open-software wearables (OHSW) as research platforms: Pascale et al. [1] developed a fully OHSW smartwatch for educational and research purposes, demonstrating that transparent smartwatch designs are practical even on low-cost hardware. The watch integrates a small set of core components (e.g., a microcontroller, touchscreen, inertial sensor, and haptic actuator) and is extensible, although adding additional sensors may require packaging modifications. Bhat et al. [2] argue that open source wearable design methodologies help establish a common base platform with standardized hardware and software tools, thereby improving interoperability across devices and research groups and facilitating reproducible comparisons. They further highlight how OHSW can connect researchers, clinicians, and hardware/software developers to address technical and societal challenges. Beyond hardware transparency, OHSW ecosystems also accelerate rapid prototyping of customizable data-collection applications [3].
In addition, OHSW are often inexpensive, making them attractive for large-scale deployments such as elderly monitoring in care homes, remote monitoring of outpatients, home healthcare, and telemedicine. For example, Dismore et al. [4] deployed the open source CueBand wristband to support people with Parkinson’s disease in a real-world remote monitoring study, illustrating that open designs can reach clinically meaningful deployments and integrate into care workflows. However, the success of such deployments still depends on the reliability of HR and on scalability to monitor a large number of distributed and mobile users.
Also, achieving clinical-grade behavior from off-the-shelf PPG sensors remains non-trivial. The main challenge with optical HR sensors is their susceptibility to noise from various sources. Motion artifacts, poor skin contact, ambient light interference, and individual physiological differences can all introduce errors into the measurements [5]. As a result, raw sensor data frequently exhibits sporadic spikes, sudden crashes, and other anomalies, making it unsuitable for immediate use in any application. If left unaddressed, such artifacts can mislead users, bias analyses, and ultimately erode trust in the monitoring pipeline. Therefore, a solution is needed to detect anomalous results and remove them without affecting the system’s overall real-time performance.
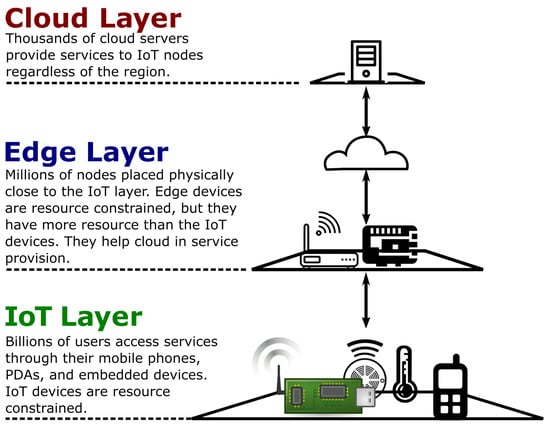
Edge Computing (EC) can help scale up the system while maintaining real-time communication. Edge computing is a computer network paradigm in which computing devices are deployed at the edge of the network, near users, to provide services in place of the cloud or servers, reducing traffic and latency in the cloud, as shown in Figure 1. In EC, an intermediate gateway (i.e., a fog/edge node) between the Internet of Things (IoT) and the cloud layer performs local filtering, aggregation, and decision support before forwarding curated data to the cloud [6]. EC finds applications in several fields; in agriculture, it improves farm-level operational monitoring by enabling efficient data processing and management, particularly in scenarios with limited connectivity or high data volumes [7]. In smart cities, EC has been used to improve the performance of smart transportation, smart building, and smart grid systems by bringing data analysis closer to the network edge [8]. In healthcare, the EC carries out predictive analytics locally and remote patient monitoring in a decentralized manner to improve response times [9].
Figure 1.
The structure of a typical edge computing.
This study develops an EC-based framework that transforms noisy HR readings from the low-cost PineTime smartwatch into a more stable and physiologically constrained HR data stream suitable for large-scale real-time health and well-being monitoring. The proposed system does not improve the proprietary algorithm within the smartwatch that converts raw PPG waveforms into HR values. Rather, it processes the HR readings received at the edge, enabling the system to clean HR data from any watch connected to it, regardless of the watch’s hardware. This work is a necessary first step toward using PineTime HR data in downstream applications, because the underlying measurements must be sufficiently stable for downstream analysis and monitoring for alerts to trigger, trends to be analyzed, and meaningful insights to be generated. To establish this baseline, the proposed system performs E2E quality control over the HR stream, suppressing artifacts and enforcing physiologically plausible values, reducing implausible fluctuations and improving temporal consistency in the HR stream. The curated HR output can then support downstream tasks such as anomaly detection, continuous health monitoring, and fitness coaching.
The contributions of this research are as follows:
- We design and implement a multi-stage HR curation pipeline that combines outlier handling and exponential moving average (EMA) smoothing.
- We develop an EC-based distributed system architecture using PineTime for data acquisition, an ESP32 as a gateway, and a laptop PC for edge processing, visualization, and storage.
- We implement a Message Queuing Telemetry Transport (MQTT)-based communication layer for efficient and reliable transmission between resource-constrained devices.
- We validate the approach by comparing PineTime-derived HR data against measurements from a high-end commercial smartwatch.
- We evaluate system performance in terms of communication delay, throughput, computational cost, and energy consumption.
The remainder of the paper is organized as follows. Section 2 reviews related work on PPG-based HR accuracy and reliability. Section 3 presents the proposed methodology, including the data curation pipeline and system architecture. Section 4 presents the experimental setup for testing the proposed system. Section 5 shows and discusses the results of the experiment. Section 6 discusses limitations and deployment considerations, and Section 7 concludes with future directions.
2. Literature Review
Consumer wearables are aesthetically pleasing, lower-cost than their medical-grade counterparts, and typically require no training to operate. Consequently, researchers aim to bridge the gap between consumer-grade convenience and clinical-grade data to improve the accuracy of PPG-based HR sensing. Several studies suggest that wrist-worn devices can support medical and clinical-adjacent use cases [10,11]. In ref. [11], consumer devices were evaluated against a pulse oximeter reference. The results show that wrist-worn smartwatches can produce HR estimates comparable to those of a home pulse oximeter, though performance remains below that of medical-grade instruments such as clinical ECG systems. A similar study was conducted in a clinical setting, comparing cuffless blood pressure measurements from a smartwatch with those from a mercury sphygmomanometer [10]. Using the ANSI/AAMI/ISO 81060-2:2018 validation criteria [12], the authors found small mean errors, concluding that the smartwatch’s PPG sensor can provide accurate and reliable blood pressure measurements in patients with acute ischemic stroke. However, they noted that the measurements were collected after a period of rest and wakefulness, leaving the accuracy during physical activity and sleep unverified.
A primary challenge in wrist-worn PPG sensing is the degradation of signal quality caused by user movement. To mitigate this issue, prior studies have analyzed the correlation between various onboard sensors and PPG accuracy [13,14,15]. The findings indicate that the raw PPG waveform (e.g., light-intensity fluctuations and amplitude changes) serves as a more reliable indicator of HR trustworthiness than motion-sensor data alone, as it is a superior predictor of signal integrity.
Thus, researchers have proposed lightweight reliability estimation and filtering methods suitable for on-device execution. Ra et al. [13] proposed a computationally efficient Hidden Markov Model with Viterbi decoding to label the reliability of individual HR estimates, reporting approximately 98% accuracy and enabling noisy measurements to be filtered in real time. Similarly, Ahn et al. [14] introduced a small two-state Hidden Markov Model designed for smartwatch deployment with minimal additional power consumption. This line of work supports developer-friendly interfaces that enable applications to access not only an HR estimate but also an associated confidence or reliability indicator.
Signal-processing techniques have been proposed to improve HR precision during vigorous movement, such as exercise. FitBeat [15], for example, combines PPG amplitude to detect skin contact, accelerometer data with Recursive Least Squares (RLS) adaptive filtering to remove motion artifacts, and spectral analysis to estimate the pulse signal. When tested on a Moto 360 smartwatch, FitBeat substantially improved accuracy, reducing mean HR error to approximately 4 BPM, which is a 10× improvement over the device’s built-in application.
Artificial intelligence (AI) is also a viable approach for improving inference from noisy physiological signals using wearables. Rahman et al. [16] used heart-rate variability (HRV) features derived from ECG chest straps and smartwatch PPG to train machine learning models that distinguish healthy participants from patients with pulmonary diseases such as asthma and COPD with accuracy above 80%. They also reported associations between HRV features and clinically relevant spirometry measures, suggesting that off-the-shelf wearables may support monitoring of chronic disease severity.
Importantly, even premium consumer wearables such as the Apple Watch can exhibit reduced sensing performance in free-living settings due to motion and other real-world confounders, despite the use of advanced sensors and measurement techniques. In ref. [17], the authors assessed passive atrial fibrillation (AF) detection using a commercial Apple Watch and trained a deep neural network on HR and step-count data from nearly 9750 participants. In an in-person cardioversion validation cohort, the model achieved excellent discrimination (AUC = 0.97) when compared against a 12-lead ECG. However, performance was lower in a free-living ambulatory evaluation, underscoring the difficulty of translating results from controlled clinical validation to real-world deployment.
Despite challenges with accuracy, smartwatches and wrist-worn PPG devices find several applications in the health sector: Chandel et al. [18] developed the Cardiopulmonary Care Platform (C2P) for noninvasive fatigue tracking. The system uses the smartwatch to passively track HR, breathing rate, and breathing signal power as candidate markers of physiological fatigue in subjects with cardiopulmonary disease. It uses an onboard barometer for robust stair-climbing recognition. Its major technical contribution was a computationally efficient method for directly reconstructing breathing cycles from wrist PPG signals, which was validated against a medical flowmeter.
Many works have used the PineTime watch for their research. It is an inexpensive open source smartwatch featuring a sunlight-readable touch display, a one-week battery life, and an nRF52832 SoC that supports Bluetooth 5 and custom firmware [19]. Selinger and Dimitrijevic [20] used a PineTime watch to measure HR to predict energy expenditure (EE). They showed that tree-based regression models can run on the PineTime smartwatch, which has very limited memory. Their work also demonstrated that a regression tree could be more accurate than conventional linear regression models, without requiring max as an input, a value that is usually unknown to non-professional athletes. This method achieved a good determination coefficient () with only a 26 KiB increase in PineTime’s firmware size, demonstrating the feasibility of implementing complex, non-linear models on low-power wearables.
Additionally, Vázquez et al. [21] used a PineTime watch as a sensor in their research platform to obtain subjects’ physiological signals for sleep metrics and make raw sensor data available for offline processing. Their work highlights the advantages of an open, inexpensive smartwatch for reproducible sleep research, but it does not consider real-time assurances of data quality. In this work, we used PineTime, an inexpensive, open, and resource-constrained wearable, to develop an EC-based framework. The system uses an ESP32 as a gateway, and a laptop as the edge node that performs lightweight, multi-stage HR curation (outlier handling and EMA smoothing) before local visualization and storage, or transmission to the cloud. The system can power applications such as remote patient monitoring and telemedicine dashboards, elderly care and home health supervision, activity-aware fitness coaching, and HR early warning/anomaly detection, while remaining scalable to multiple mobile users through lightweight gateway processing and MQTT-based communication.
3. Proposed System
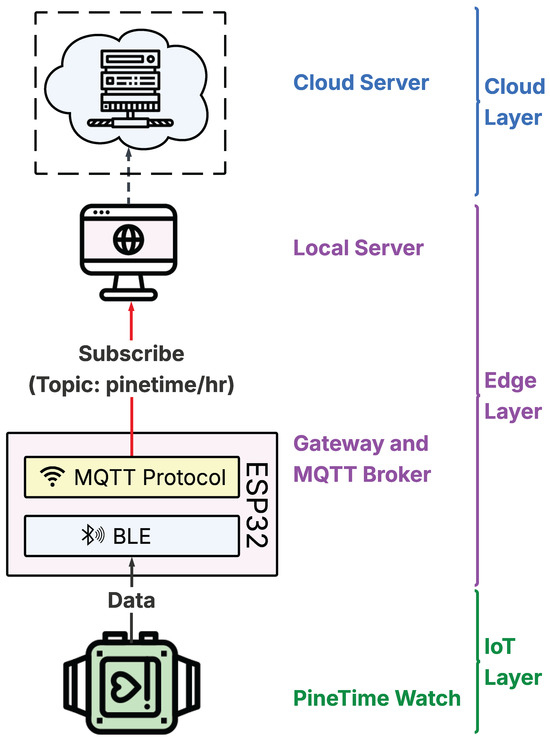
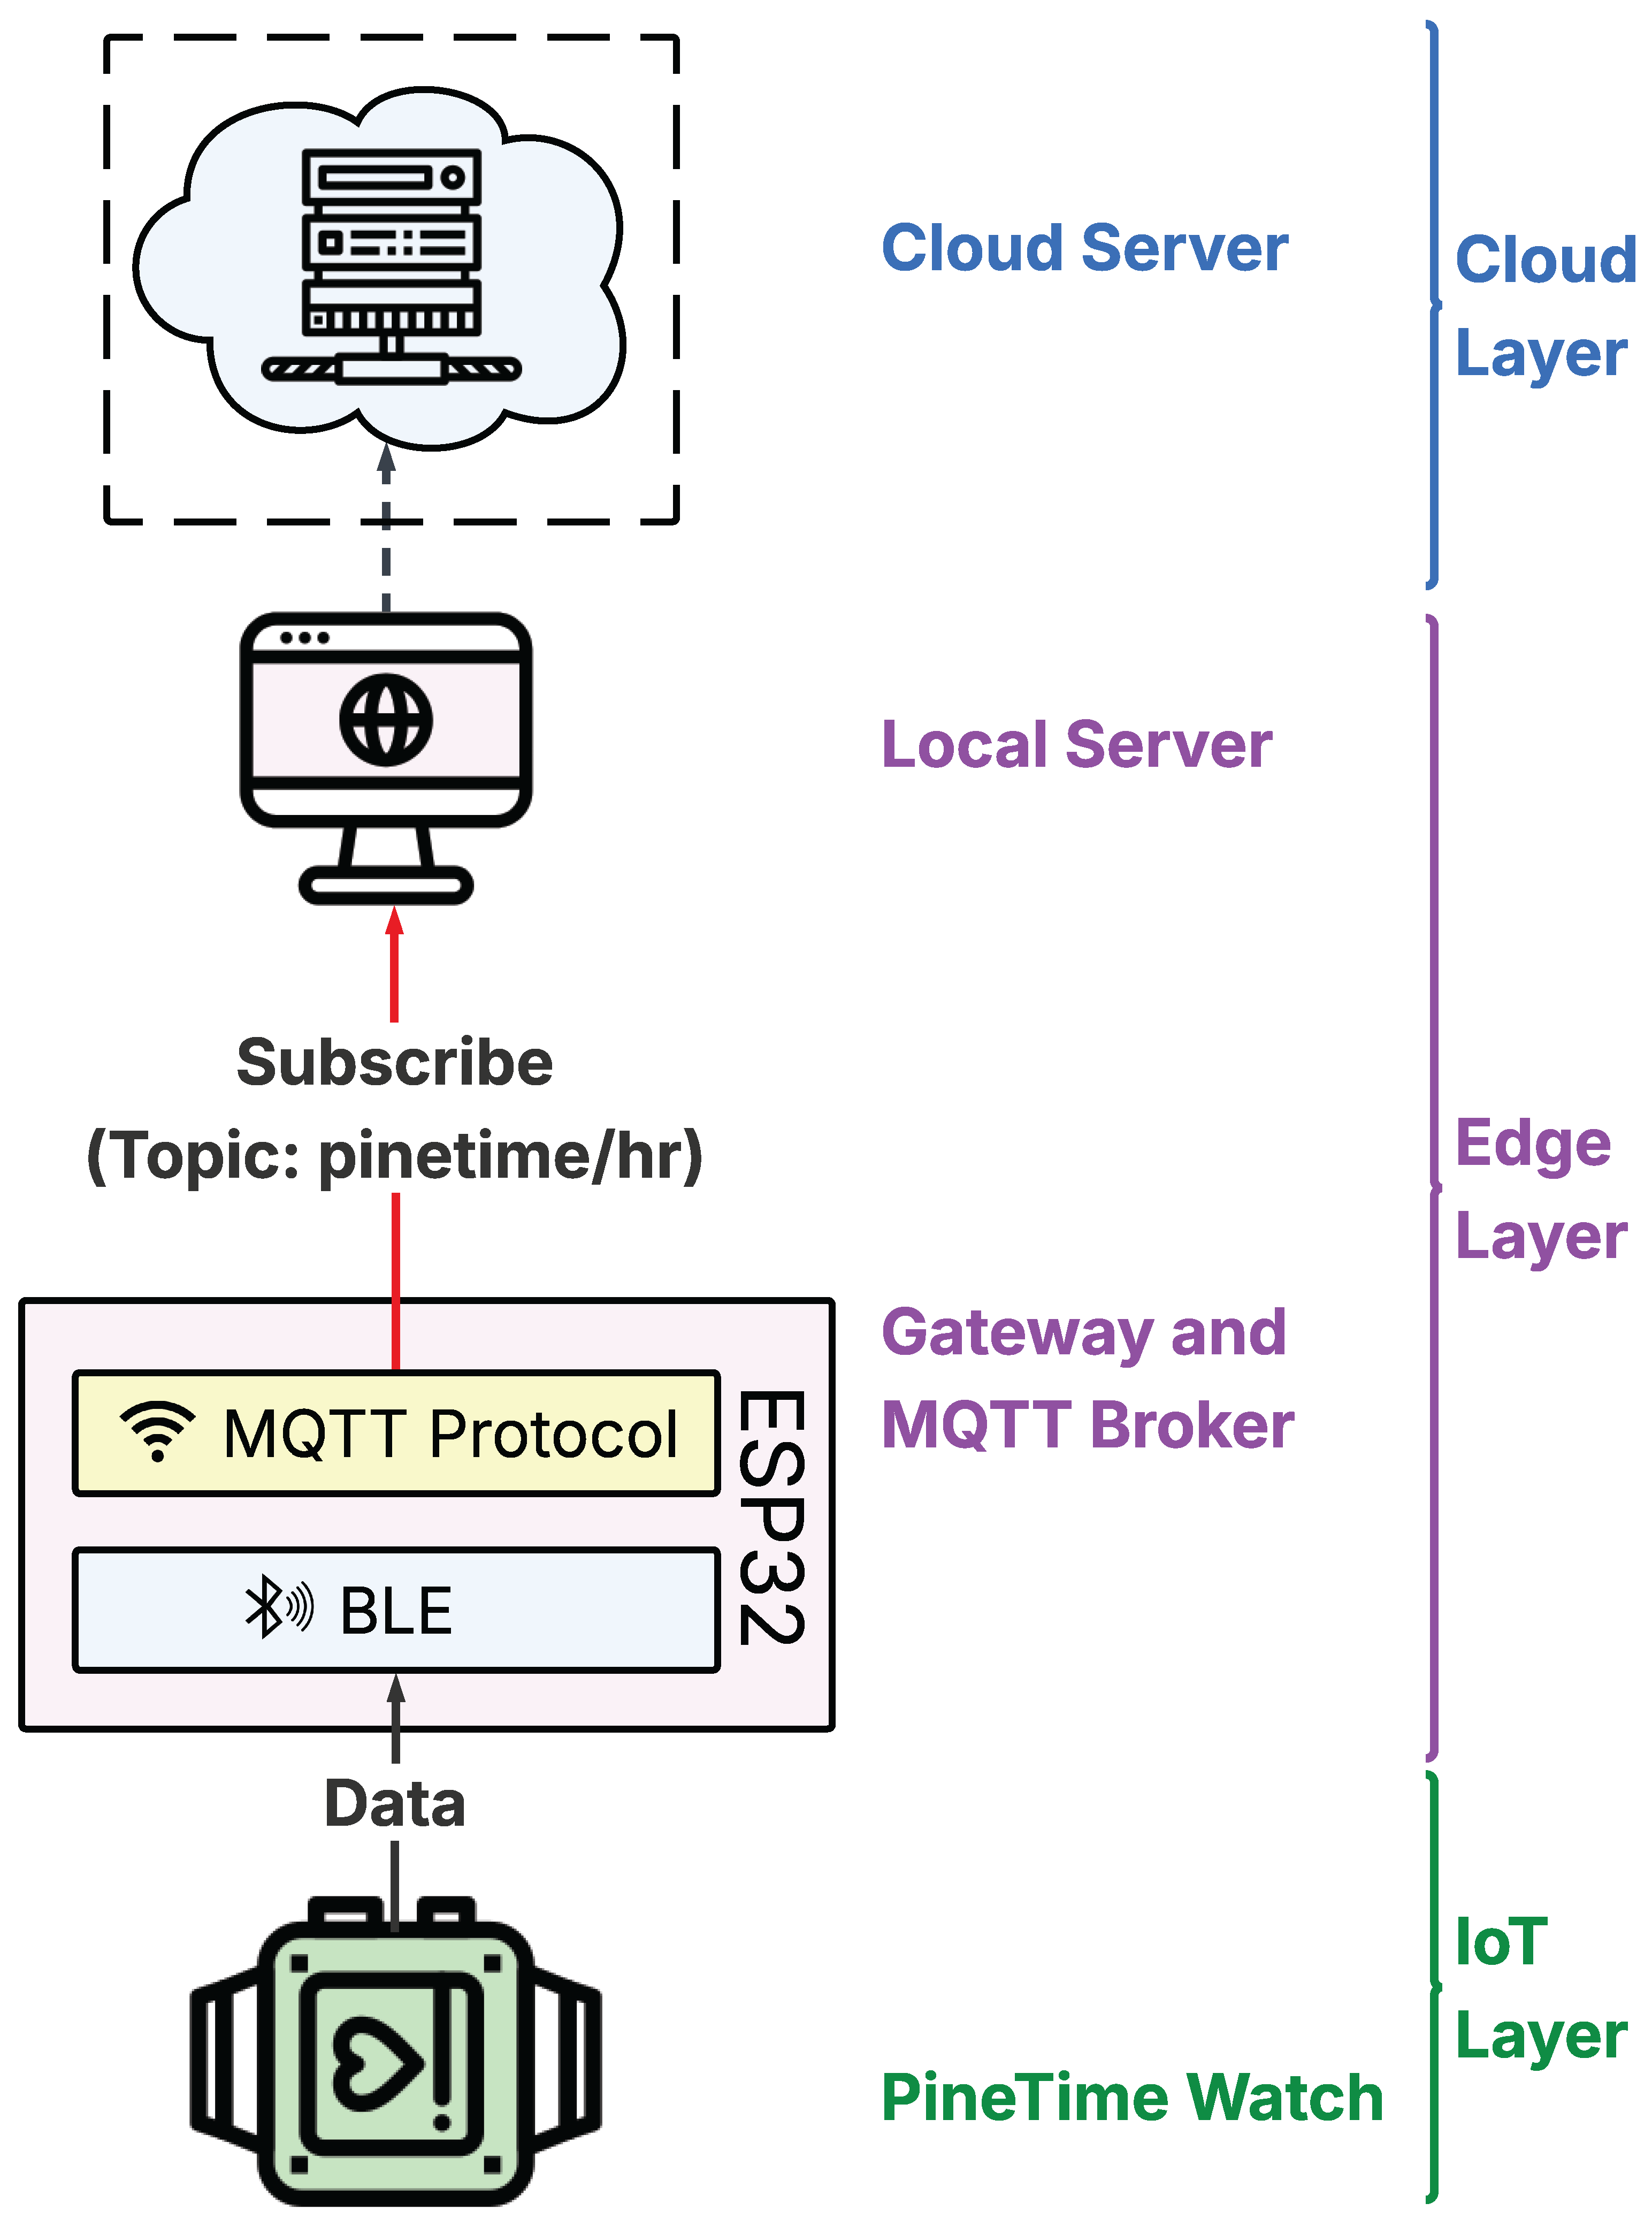
This section describes the proposed system methodology and explains how it transforms noisy PineTime HR measurements into a reliable data stream within a distributed wearable network. Figure 2 provides an overview of the proposed system, which consists of an IoT layer, an edge layer, and a cloud layer. The IoT layer comprises the PineTime watches worn by users. The edge layer comprises an ESP32 gateway (and MQTT broker) and an on-premises local server that performs data processing, visualization, and storage. We show the cloud layer in a dashed box because it is optional, and this research did not implement it. The following subsections explain how the different components of the proposed system operate.
Figure 2.
System architecture.
3.1. PineTime Watch Data
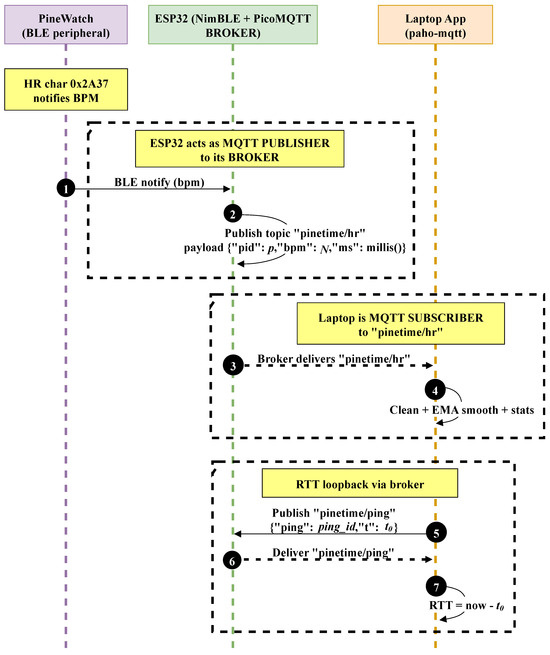
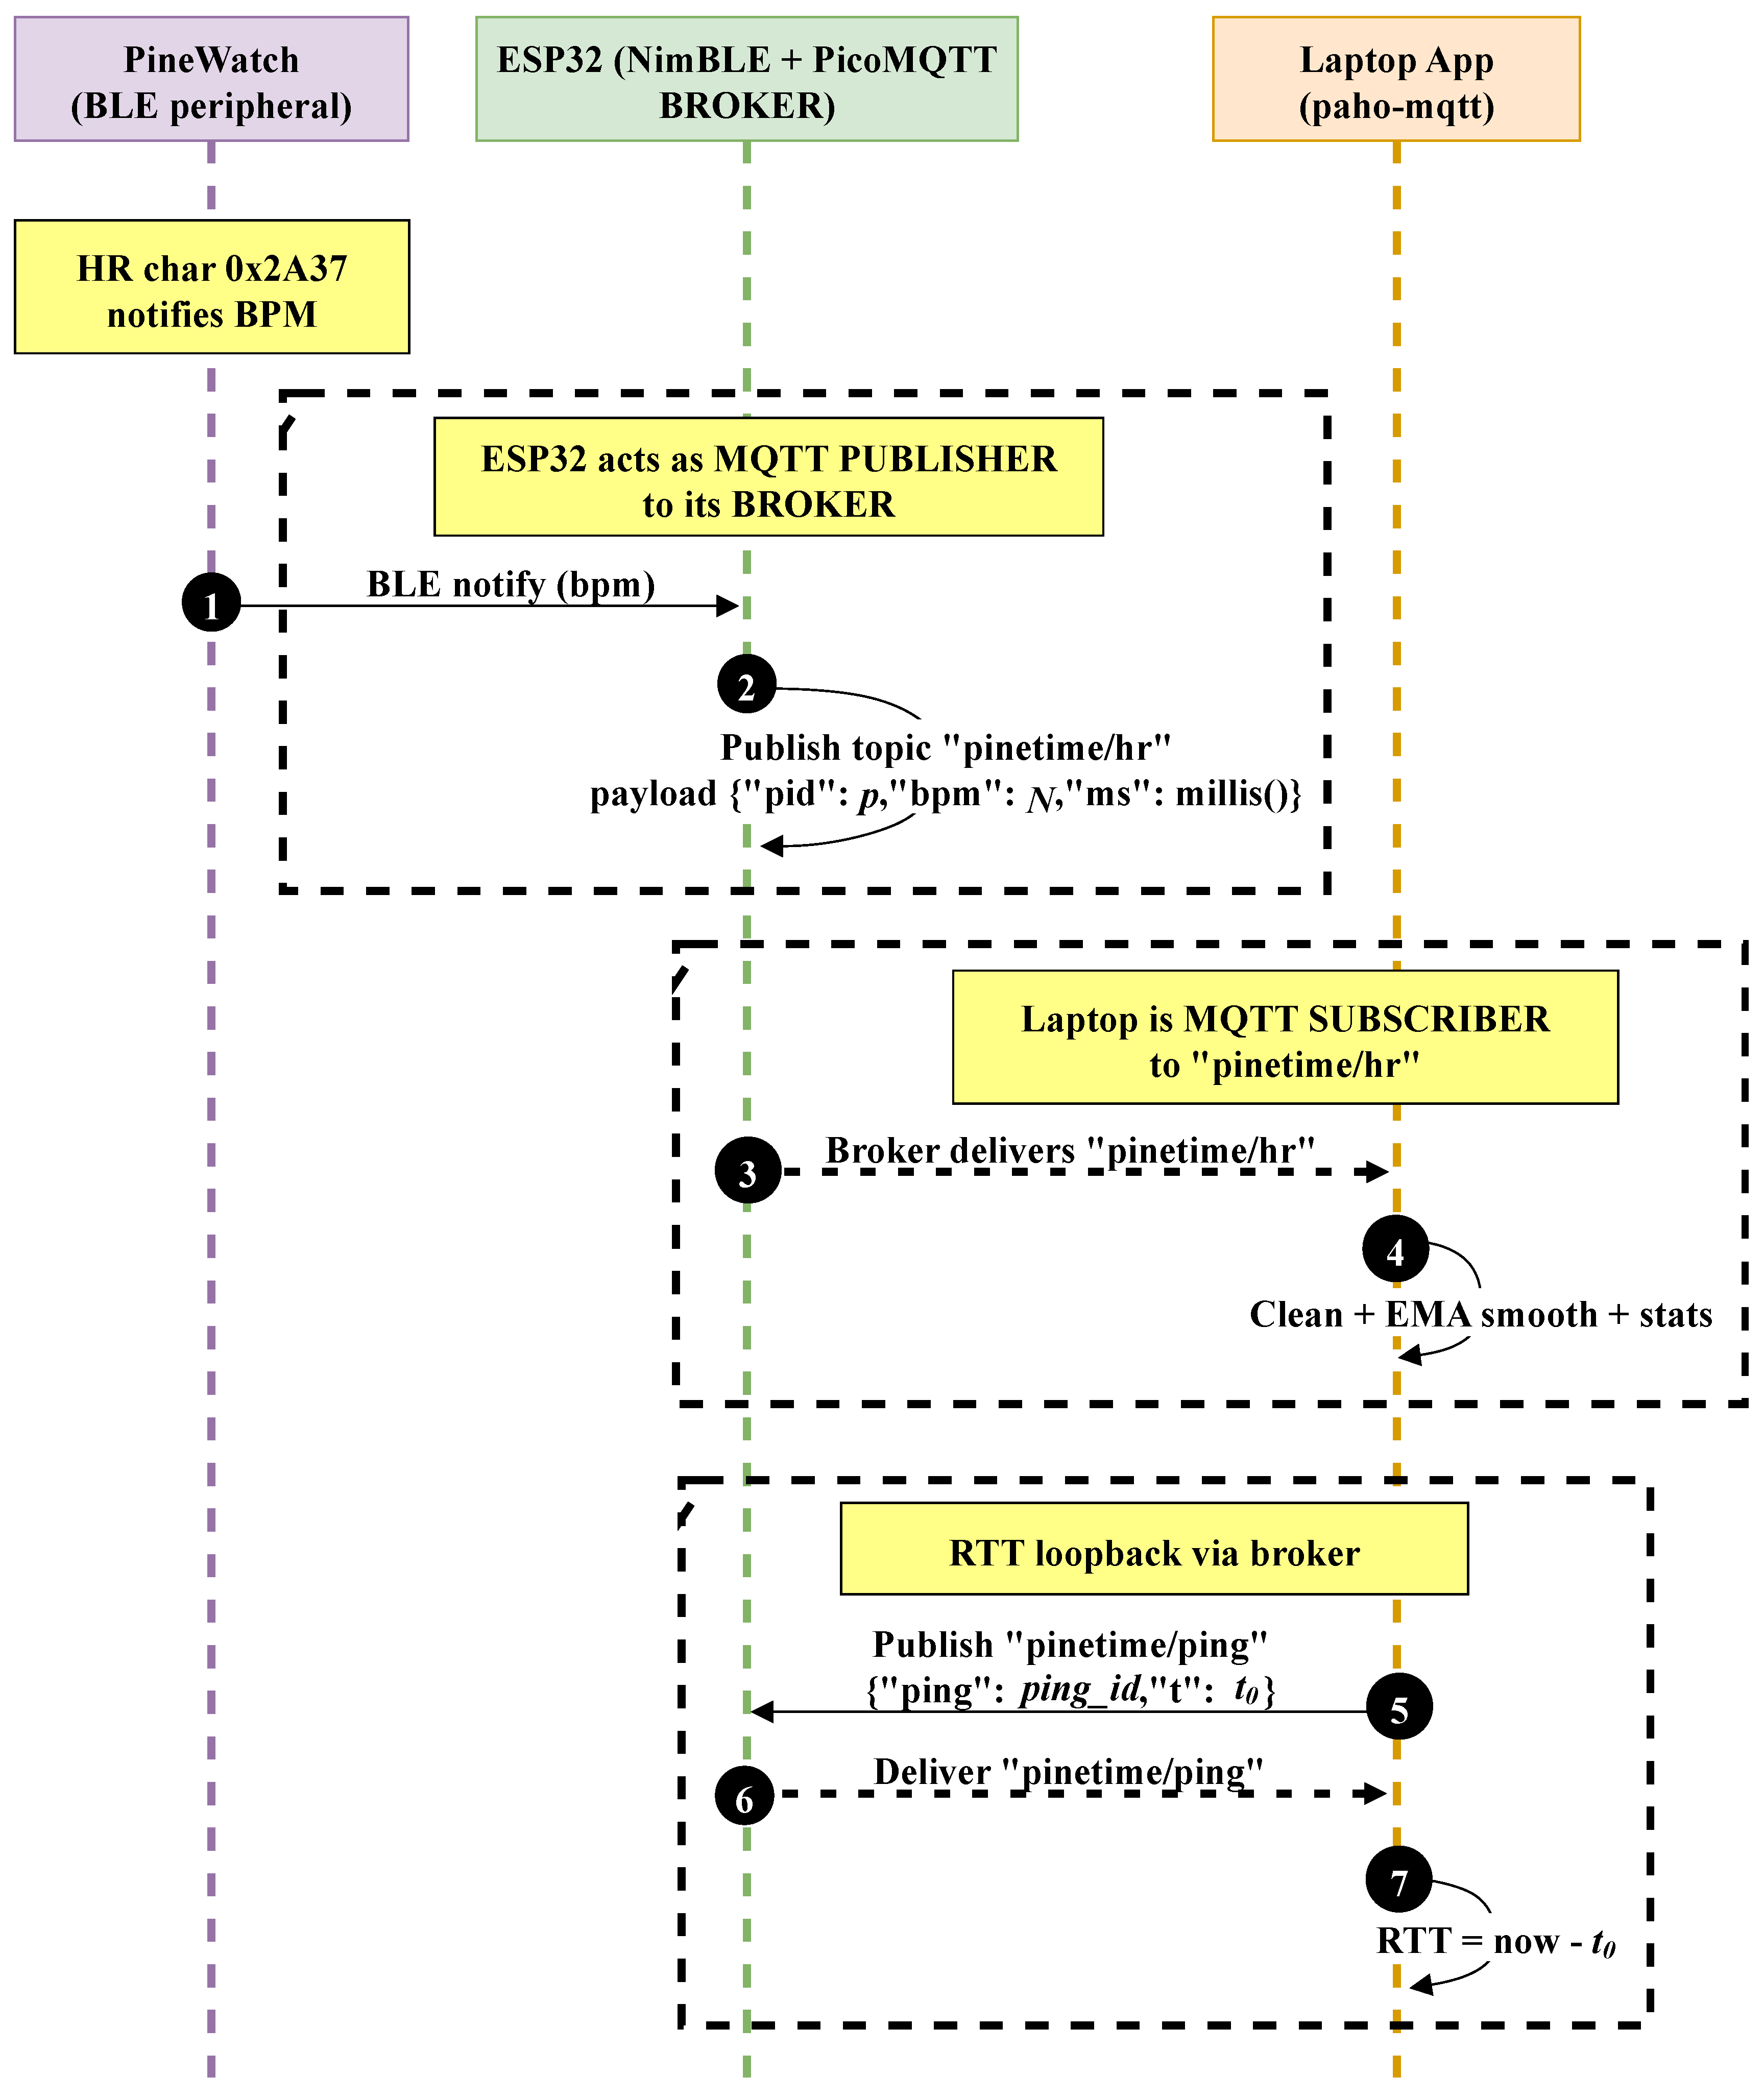
At the IoT layer, the primary sensing device is the PineTime64 smartwatch, running on InfiniTime OS firmware [22]. The watch continuously measures the user’s HR at 100 ms intervals using its HRS3300 optical sensor [23]. However, it only sends the HR values to the edge layer if the new HR value differs from the previous one. Figure 3 presents the sequence diagram of the proposed system. The first event shows the PineTime smartwatch connecting to the ESP32 over the Bluetooth Low Energy (BLE) standard Bluetooth SIG Heart Rate Profile (HRP) [24]. It then sends HR data notifications via the standard Generic Attribute Profile (GATT) characteristic 0 × 2A37 to an ESP32 microcontroller, which acts as a gateway device between the IoT and the edge layer.
Figure 3.
MQTT publish–subscribe sequence diagram.
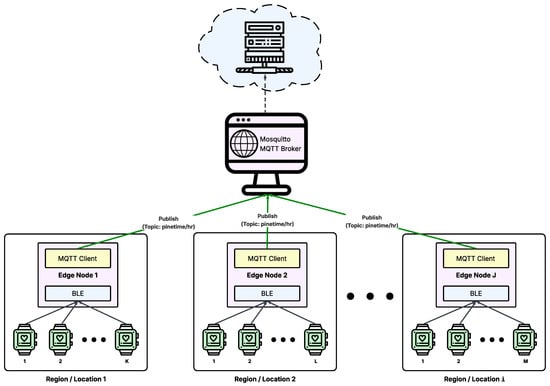
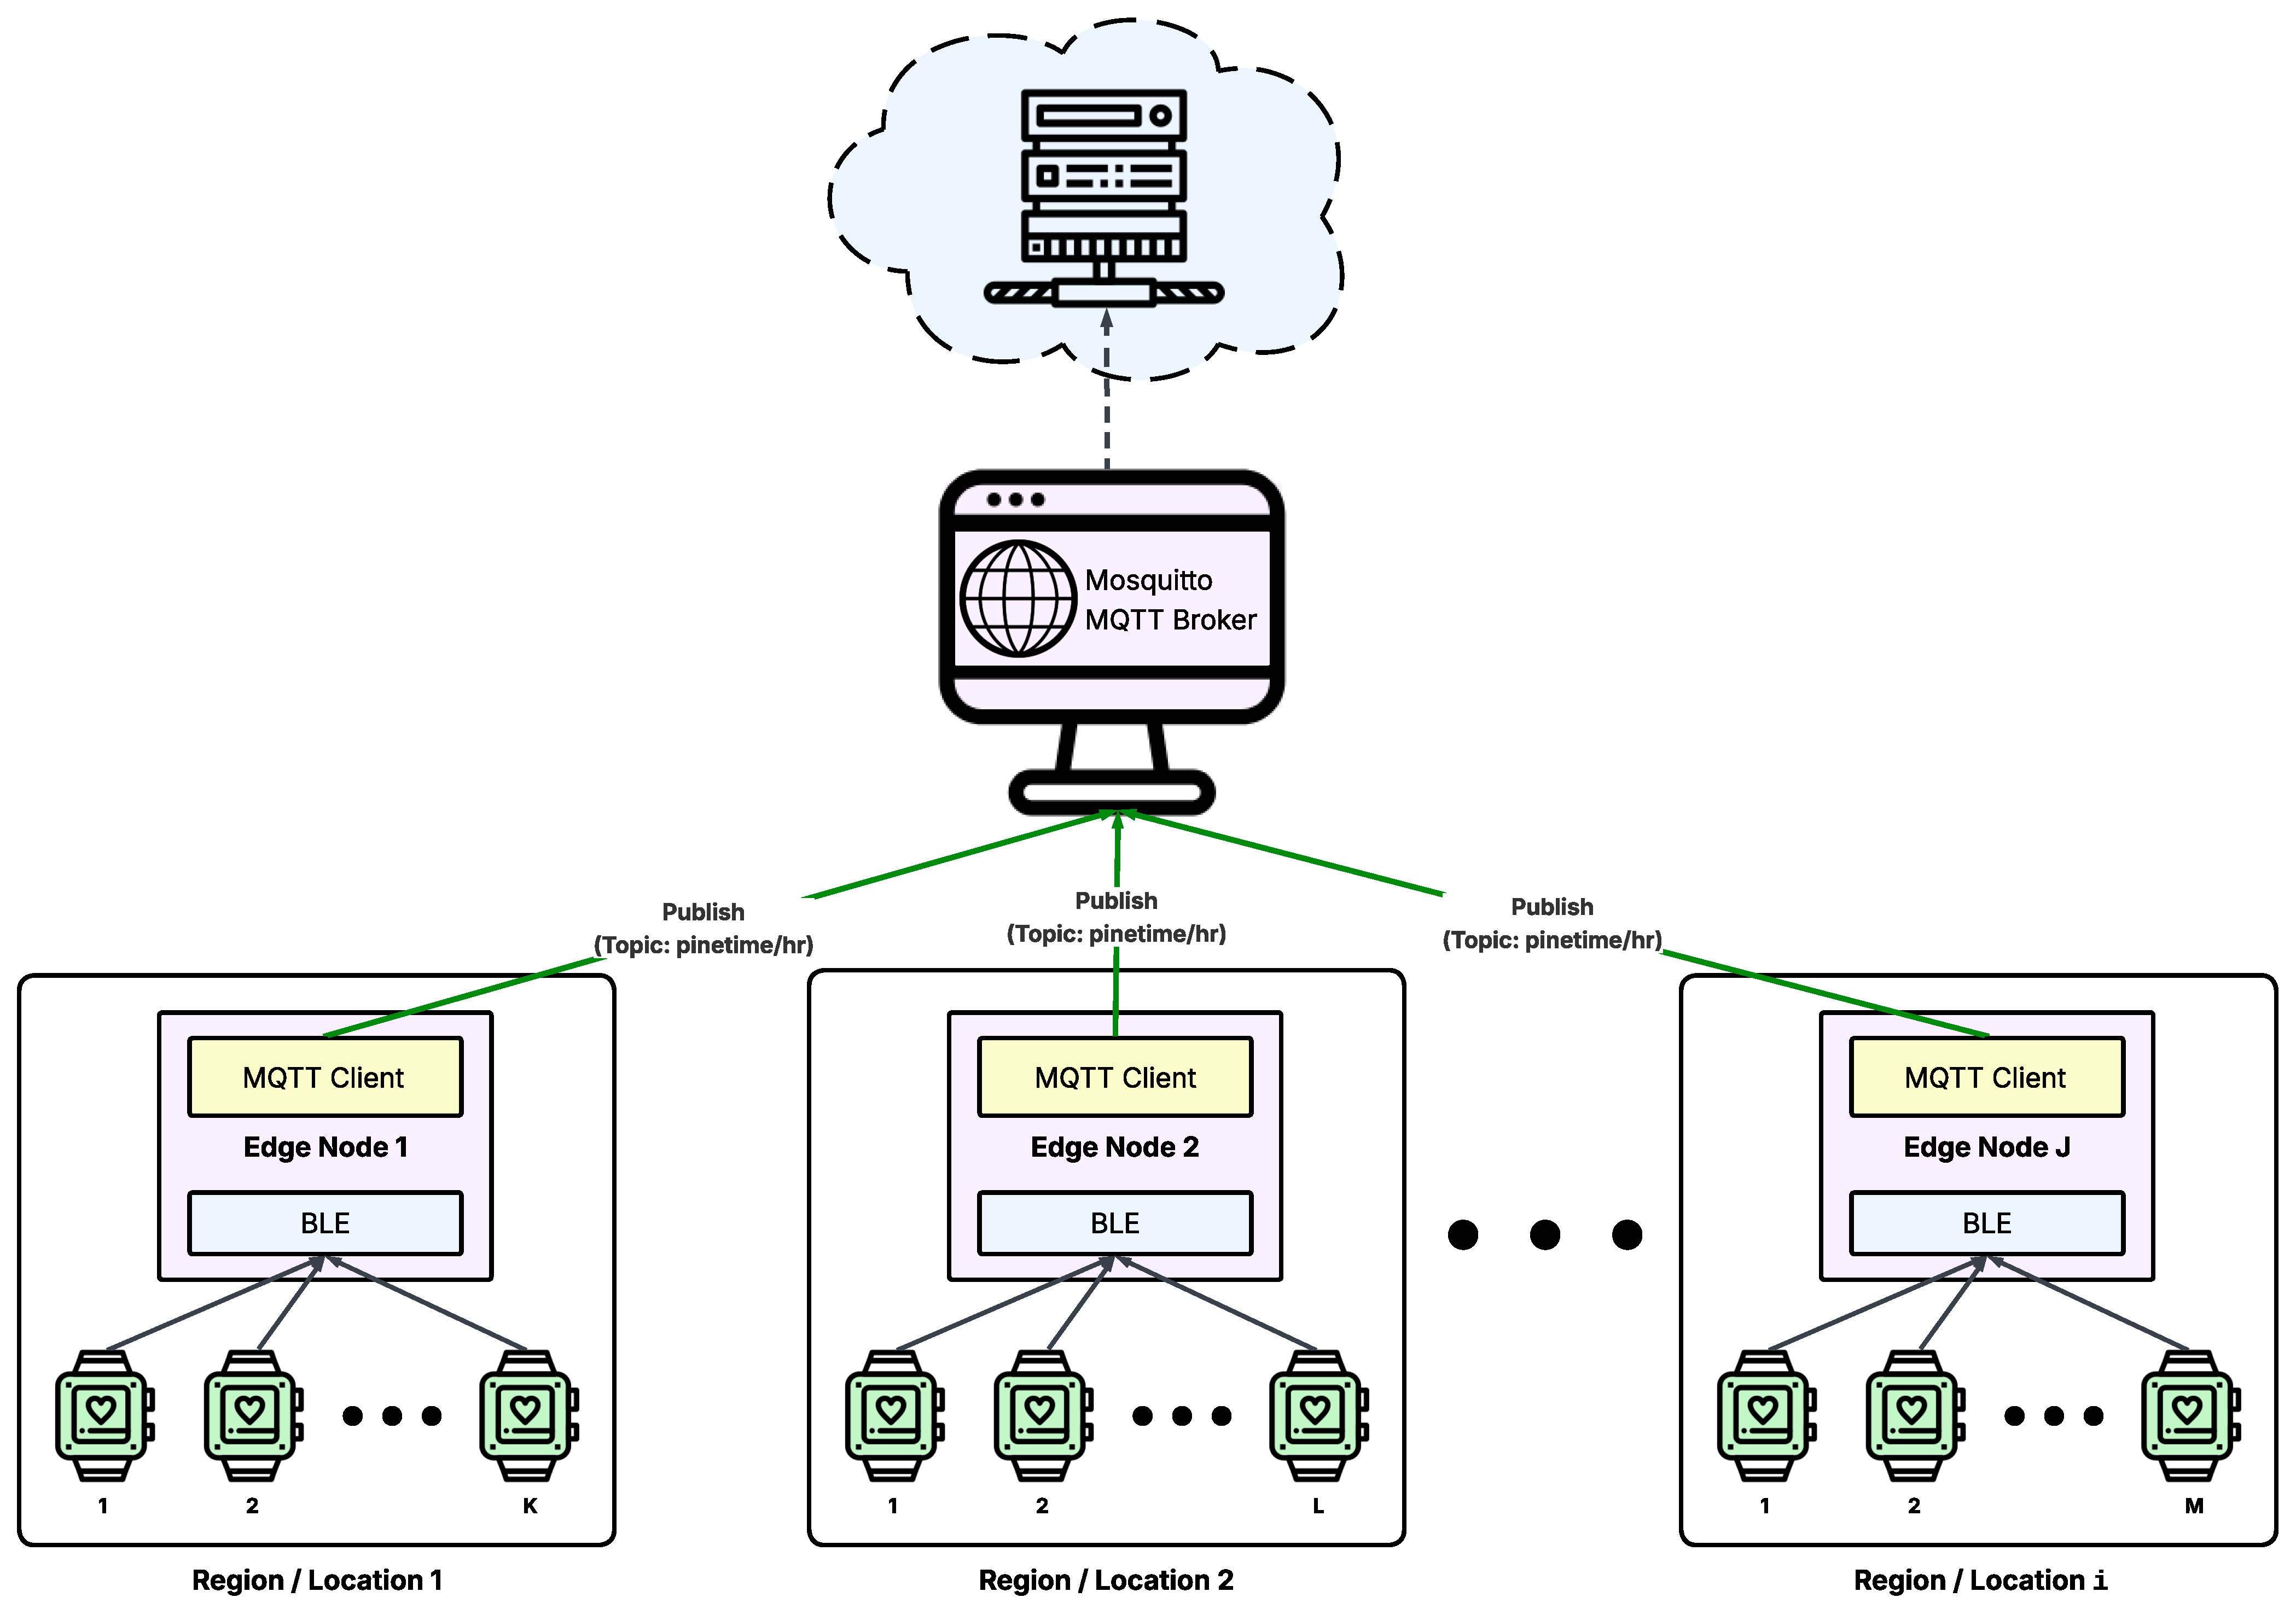
Deploying a gateway between the IoT and the edge layer breaks the network into segments or regions, as shown in Figure 4. This method ensures scalability because each region manages a subset of the watches in the network. It also allows mobility, allowing watches to move from one region to another. An example of this deployment scenario is in a senior care home, where residents can wear the watches to monitor vital signs and send the data to nearby ESP32 gateways located throughout the facility. The different locations could be different rooms in the center. Then, the gateways publish to the broker. We chose BLE because it is the only wireless communication interface available on the PineTime watch. In addition, its limited range can help administrators infer wearers’ general locations based on their gateway.
Figure 4.
Large-scale deployment of the proposed system.
3.2. ESP32 Implementation
The edge layer uses the MQTT protocol because it is ideal for distributed, wearable-device systems due to the fact that it is lightweight, has very low overhead, and operates in a publish–subscribe model capable of handling continuous sensor data flow. MQTT is a broker-centric publish–subscribe paradigm in which clients publish messages to named topics and other clients subscribe to the topics they are interested in [25]. The broker receives all published messages and is responsible for forwarding them to every subscribed client. Publishers and subscribers are loosely coupled. Thus, they never talk to each other directly; instead, they talk through the broker. This design supports asynchronous communication and tolerates temporary disconnections, because publishers and subscribers do not need to be active at the same time. Also, the ESP32 does not need to know which devices are receiving the data, and new subscribers can join or leave without affecting the watch or the bridge. The broker centralizes connection management and message routing, simplifying recovery from brief network interruptions. This design helps ensure that heart-rate data from the PineTime is delivered reliably, with measured timing, to all consumers in the system.
In the proposed system, the broker is hosted directly on the ESP32 using an embedded MQTT implementation (PicoMQTT) [26]. This technique avoids the need for an external server and keeps all communication inside the local network created by the ESP32. It also enables local buffering of published data when the uplink (e.g., Wi-Fi backhaul) is unavailable, improving tolerance to connectivity outages. The same architecture would also allow using an external broker, such as Mosquitto, on the local server for larger deployments, as shown in Figure 4.
As shown in Figure 2, the ESP32 microcontroller also serves as the edge device alongside the local server. It also serves as a bridge between the BLE-based IoT network and the MQTT-based Wi-Fi/IP edge network, converting incoming BLE HR notifications into MQTT messages (published under the pinetime/hr topic), as shown in the sequence diagram. This design enables the local server to subscribe to the topic and receive the HR data stream. It also reduces the integration burden on the local server. Thereby, supporting scalability as the number of smartwatches increases (see Figure 4): the server receives standardized, structured messages suitable for downstream processing, and any cloud component (if used) can be updated using the curated data produced by the local server.
Since the watch uses standard HRP as mentioned in Section 3.1, the ESP32 uses the NimBLE library [27] to receive HR notifications from it. Algorithm 1 shows the callback function that runs in the microcontroller every time the watch sends an HR notification. Table 1 defines the parameters used by the algorithms for the proposed system, reporting the admissible range/type, unit, value used in this paper, and a brief description of each parameter’s function. Line 1 shows that the ESP32 discards all empty notifications. However, if the notification is not empty, the edge device obtains the patient ID, which is pre-programmed in the watch during firmware installation. Then, it checks the precision of the HR data using the variable (see Line 6): if the first bit is zero, the HR data is 8-bit, and the second byte contains the beats-per-minute (bpm) data. Otherwise, it is 16-bit, and the third and second bytes are concatenated to form the bpm data.
| Algorithm 1: HR Data Conversion |
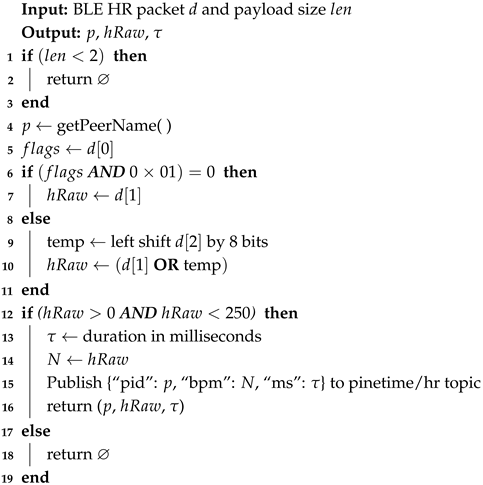 |
Finally, the last if-else block in Line 12 ensures that the data is within the standard HRP range for HR measurement before converting it to a publish–subscribe message and publishing it over the MQTT middleware. If it is not within range, the microcontroller discards the message. However, if , then the HR is valid. The microcontroller stores the time (in milliseconds) since it was turned on () using the Python v3.14.3 perf_counter() function [28], the HR value (), and the patient ID (p). The ESP32, acting as an MQTT publisher, then publishes a JSON message on the topic pinetime/hr, with a payload of the format “pid”: p, “bpm”: , “ms”: . This format is small enough for low-bandwidth links, simple enough to parse on the ESP32 and the laptop, and still human-readable for debugging. At this point, the data is still essentially raw; the ESP32 does not modify the HR notification other than attaching the timestamp.
Table 1.
Parameters for the algorithms in the proposed system.
| Algorithm 2: HR Cleaning and Smoothing |
 |
| Algorithm 3: Latency Calculation |
 |
| Algorithm 4: Throughput Calculation |
 |
3.3. Local Server Implementation
The last component in the edge layer is the local server, which acts as an MQTT subscriber. In this research, we use a laptop PC as the local server; therefore, we use the terms server and laptop interchangeably in this document. The third and fourth events of the sequence diagram in Figure 3 show that whenever the broker (ESP32) receives a new HR message, it immediately forwards the message to all subscribers of the pinetime/hr topic, including the laptop. The laptop then parses the JSON payload, runs the cleaning and smoothing algorithm, updates the real-time plots, and stores the cleaned and smoothed values, along with timing information, in a CSV log or database. The cleaning and smoothing algorithm is explained in Section 3.3.1. Also, events five, six, and seven demonstrate how the proposed system measures the middleware’s performance. Section 3.3.2 describes how the server tracks the latency and throughput of the middleware. Optionally, the local server can be connected to the cloud (in the dashed box) for backup and additional data processing. The cloud can also be used to distribute updates to the local server when there is a need to enhance the security layer or add additional functionality.
3.3.1. Data Processing
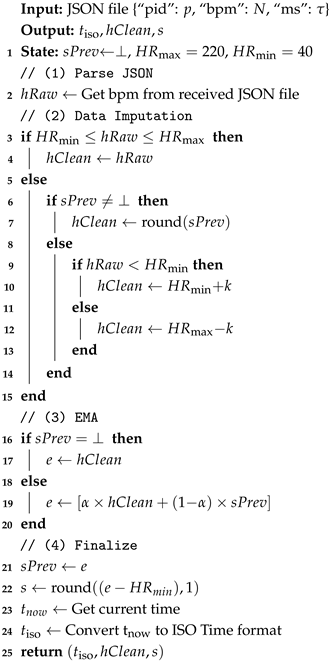
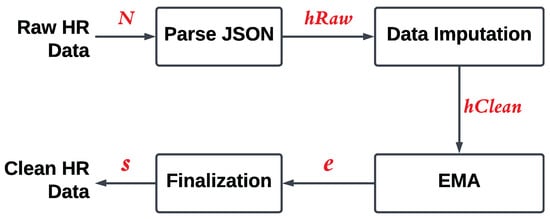
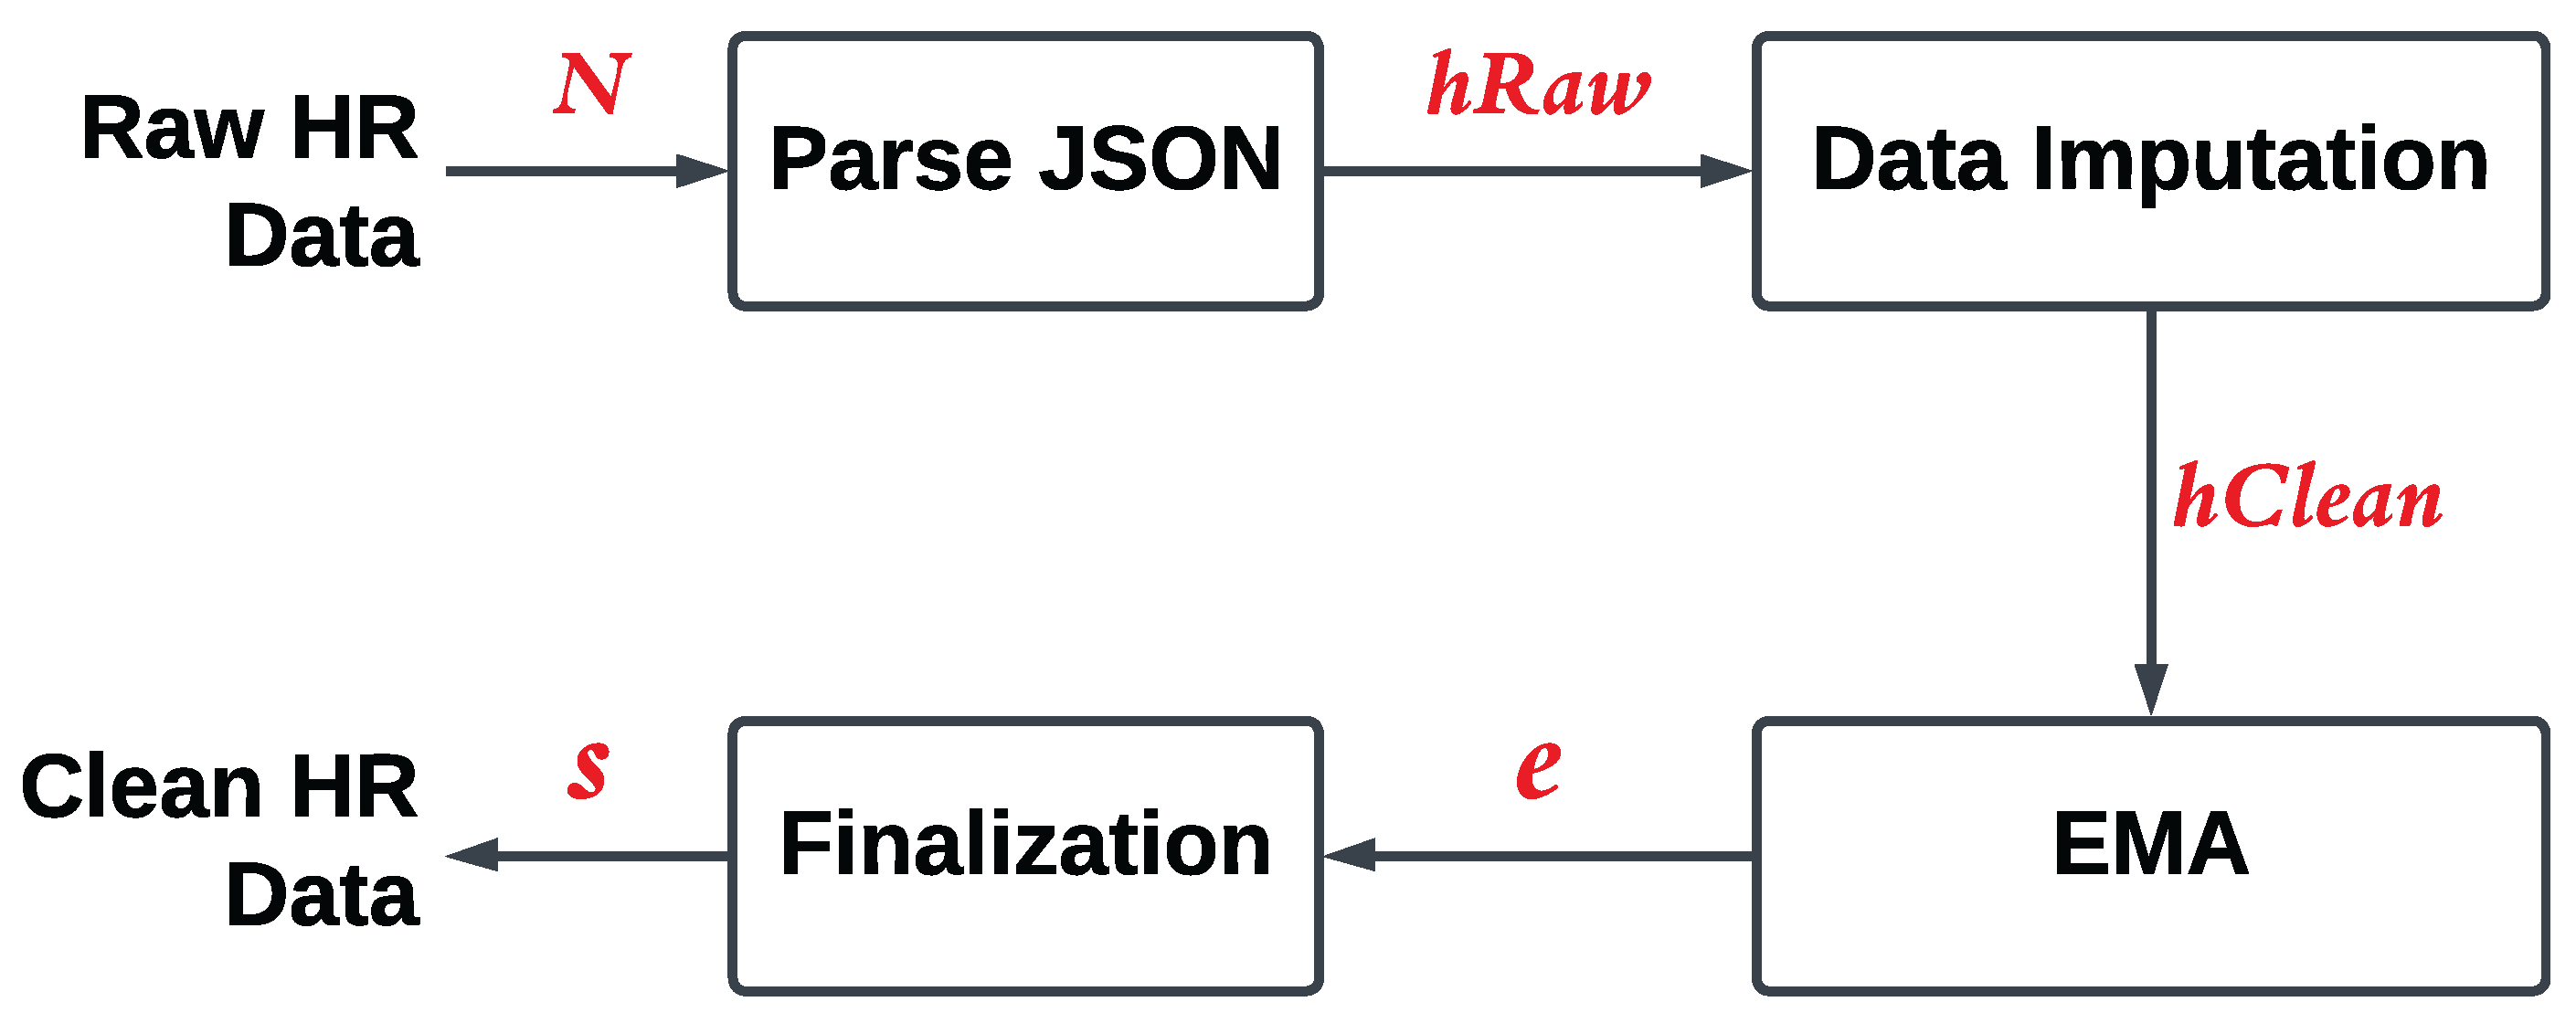
The raw HR samples are often heavily corrupted by noise and outliers. To address this issue, we developed a four-stage algorithm that transforms noisy PineTime readings into smoother and more physiologically plausible HR values suitable for downstream analysis and alerting. The four stages of the cleaning process are shown in Figure 5. This multi-stage procedure preserves real physiological changes in the HR stream while suppressing many transient spikes and dips caused by sensor noise. This section describes how these stages were implemented on the local server.
Figure 5.
Stages for HR data cleaning and smoothing.
Algorithm 2 presents the implementation of the three processing stages (see Table 1 for definition of the parameters). The first stage of the algorithm parses the JSON file the server receives, extracting the HR as shown in Line 2.
Secondly, the algorithm cleans the data by removing invalid values or replacing outlier values. The cleaning stage begins in Line 3 by defining a physiologically plausible range of HRs using lower and upper bounds. We set bpm because 30 bpm is the lowest plausible HR [29] and 60 bpm is the lower bound of a normal resting HR [30]. For the upper bound, we set bpm by evaluating Equation (1) at , which yields the maximum possible HR [31]. These limits can be adjusted depending on the target application and user population. If , the sample is accepted and ; otherwise, the algorithm applies hold replacement cleaning technique. In hold replacement (Line 6), out-of-range samples are replaced with the previously cleaned value . During the first hold iteration, when is empty, the algorithm bootstraps the output by setting for and for , where k is a pre-programmed margin chosen to accelerate convergence and reduce initial transient error.
Thirdly, the algorithm performs temporal smoothing by applying an Exponential Moving Average (EMA). EMA is widely used in the processing of wearable device signals, as it requires only a fixed amount of memory and imposes a small computational burden per sample, a crucial point for devices with microcontroller-class computational power [14,18]. The EMA can place greater weight on the most recent data points. Unlike the simple moving average, which weighs all observations equally, the EMA reacts more significantly to recent HR changes.
In Line 16, the algorithm checks the previous cleaned HR reading (); if it is empty, the EMA state is initialized using the clean HR value () computed in the data imputation stage. Otherwise, implement the EMA. The expression in the square bracket in Line 19 is our implementation of EMA, where e is the new EMA value, is the previous e () carried over from the prior iteration (i.e., the previous EMA output), is the output from the data imputation stage, and is the smoothing factor. The smoothing factor controls how fast older observations decay. A lower factor results in a more stable but slower response, while a higher factor yields a quicker response at the expense of more noise. We have selected to make a good compromise between these opposing requirements (see the ablation study in Section 5.4.1).
Fourthly and finally, the algorithm formats and stores the values obtained after the computation: As shown in Line 22, is subtracted from EMA to cancel out an inherent error in the system. The corrected value is then rounded up to one decimal place to obtain the final smooth HR value (s). The algorithm also records the time of computation of s and stores it in to help track when HR was smoothed. It is also converted to ISO time format () for legibility [32]. The last line of the algorithm returns , , and s for storage and visualization.
3.3.2. Measuring Network Performance
In addition to curating the HR stream, the local server also calculates the network performance and notifies the network administrator/user directly on the dashboard. It measures latency, throughput, and Round-Trip Time (RTT) on the MQTT middleware. One-way latency reflects how quickly a newly generated HR sample becomes available to the edge application, and therefore determines the responsiveness of real-time visualization and time-critical alerting. Throughput captures the effective rate at which HR payload bytes arrive at the subscriber, which helps reveal congestion, packet losses, or throttling effects under load. RTT complements one-way latency by quantifying bidirectional responsiveness of the MQTT path (publisher–broker–subscriber) and is useful for diagnosing transient Wi-Fi impairments, broker delays, or reconnection behavior.
Latency
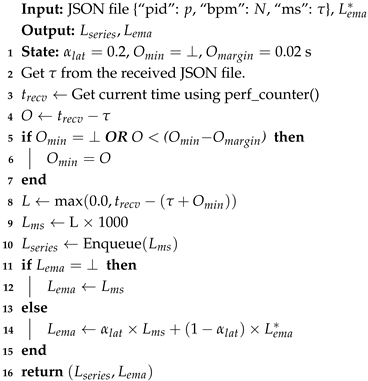
In this paper, latency (L) is defined as the one-way delay between the time an HR message is generated at the ESP32 gateway and the time it is received at the local edge server. Since the clocks of the ESP32 and the server are not synchronized, L is estimated using an offset-compensated approach based on the minimum observed timestamp difference. Algorithm 3 describes how the local server estimates one-way latency (L) for messages received on the pinetime/hr topic. For each message, the server extracts the sender timestamp from the JSON payload and records the local reception time using the perf_counter() Python v3.14.3 function. The server does not compute L directly as because the ESP32 and PC clocks are not synchronized. Rather, it uses an offset-compensated estimate based on the minimum-offset method, as shown in Lines 4–8. The technique starts by computing the observed offset (Line 4). The minimum offset is initialized on the first sample, and subsequently updated whenever a new observed offset is smaller than the current minimum by at least (Lines 5–7), indicating a new best-case offset estimate. Then, the L estimate is computed as (Line 8), converted to milliseconds , and appended to array. Additionally, the latency EMA, , is updated from (Lines 11–15). Both and are returned to the GUI module in Line 16, where is used to calculate the average, standard deviation, and variance of the latency, while is used for plotting the graph on the dashboard and for the latency value shown in the dashboard label on the top right corner.
Throughput
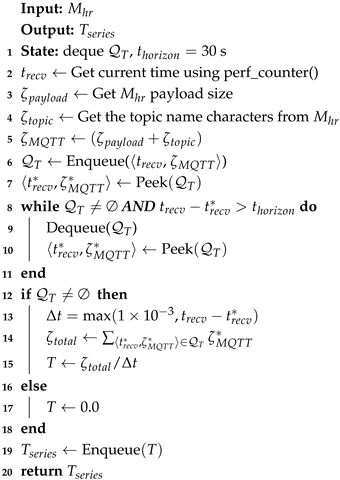
In this paper, throughput (T) is defined as the application-layer data rate (goodput) from the ESP32 to the local server, computed as the total number of bytes in received MQTT messages (including payload and topic overhead) divided by the observation interval. This metric reflects the effective rate at which HR data becomes available to the edge application. Algorithm 4 shows how the proposed system estimates the goodput T of received MQTT traffic using a sliding-window method. Upon receiving an MQTT message from the pinetime/hr topic, the server records the reception time, , using perf_counter(). It then computes the application-layer message size as , where is the payload size and is the topic-name length (Lines 3–5). The time-size tuple (, ) is appended to the queue . To enforce a horizon of s, the algorithm removes entries from the head of whose is older than as shown by the sliding-window mechanism in Lines 7–11. Lines 12–17 calculate T as follows: If is not empty, the actual window duration is computed as , where is the reception time of the oldest retained entry, and is the total byte count of all retained entries (Line 14). The throughput is estimated using . However, if is empty, then . Finally, the sample T is appended to the throughput array and returned to the GUI module. The GUI uses it to compute summary statistics (mean, standard deviation, and variance) and to plot the throughput over time.
Round-Trip Time (RTT)
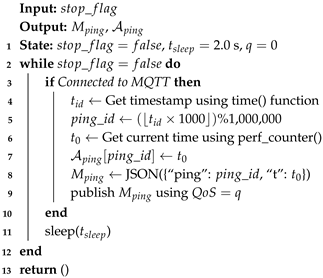
Round-trip time (RTT) is defined as the elapsed time between transmitting a ping message from the local server and receiving the corresponding response from the ESP32. This measurement reflects application-layer round-trip delay, including communication, broker processing, and system overhead. The system estimates the network RTT using two functions: RTT Pinger and Ping handler. The RTT Pinger runs as a dedicated thread, periodically publishing ping messages at s intervals. Algorithm 5 shows how the function runs. It consists of a conditional loop that runs while the . The is initialized to false when the system starts and set to true when the user presses the “Stop” button on the GUI. Next, the function checks whether the local server is connected to the MQTT network. If it is not connected to the network, Line 11 is executed, causing the function to sleep seconds. This sleep serves two purposes: (1) it prevents busy-waiting and reduces resource usage by allowing the operating system to schedule other processes, and (2) it preserves the intended ping periodicity such that pings resume at a consistent interval once the server is connected to the network. When a client is connected, the pinger executes Lines 4–9 to construct and publish the ping message , as follows: It generates a unique ping identifier () from the current wall-clock timestamp obtained using the time() Python v3.14.3 function [28], then records a high-resolution local timestamp using perf_counter() function. The value is stored in an associative array with as index, so that the Ping Handler can correctly match replies to requests, even if messages arrive out of order. Next, the function constructs a message using a JSON object with the format {“ping”: , “t”: } and publishes it with . Then, the thread sleeps for seconds before generating the next ping.
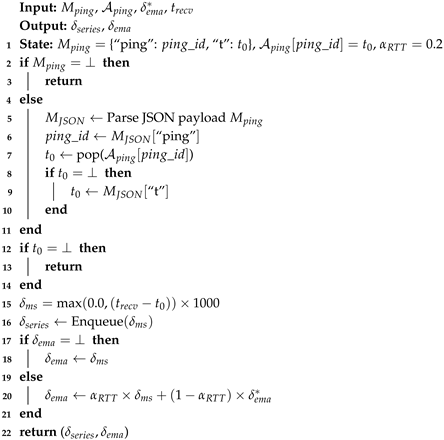
The Ping Handler catches the MQTT pings and calculates the RTT. Algorithm 6 shows how the function works. Upon receiving the MQTT RTT ping message, the software records the time of reception using the perf_counter() function and extracts the payload . Then, it sends them to the Ping Handler function. Lines 2–11 attempt to parse and returns to caller if parsing fails. In Line 5, the algorithm successfully parses and stores the content in . It then uses to extract the ping identifier . The algorithm uses to obtain the corresponding timestamp () when the message was published from the array (i.e., ). As a precaution, Line 8 checks the validity of ; if invalid, the algorithm tries to fetch it from . Line 12 then validates ; if it remains invalid, it indicates that is corrupt, so the algorithm exits and returns to the caller. Otherwise, we calculate RTT in milliseconds as , as shown in Line 15, and appended to the RTT array . Additionally, Lines 17–21 update the RTT EMA value using . Finally, the function outputs and to the GUI, where is used to compute summary statistics (mean, standard deviation, and variance) and to plot the RTT over time, while is displayed in the dashboard top-right corner for real-time inspection.
| Algorithm 5: RTT Pinger Function |
 |
| Algorithm 6: Ping Handler Calculating RTT |
 |
4. Experimental Settings
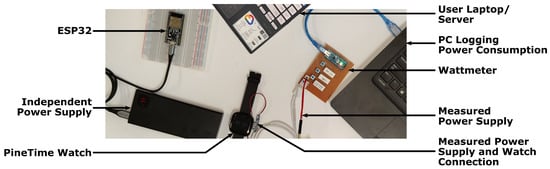
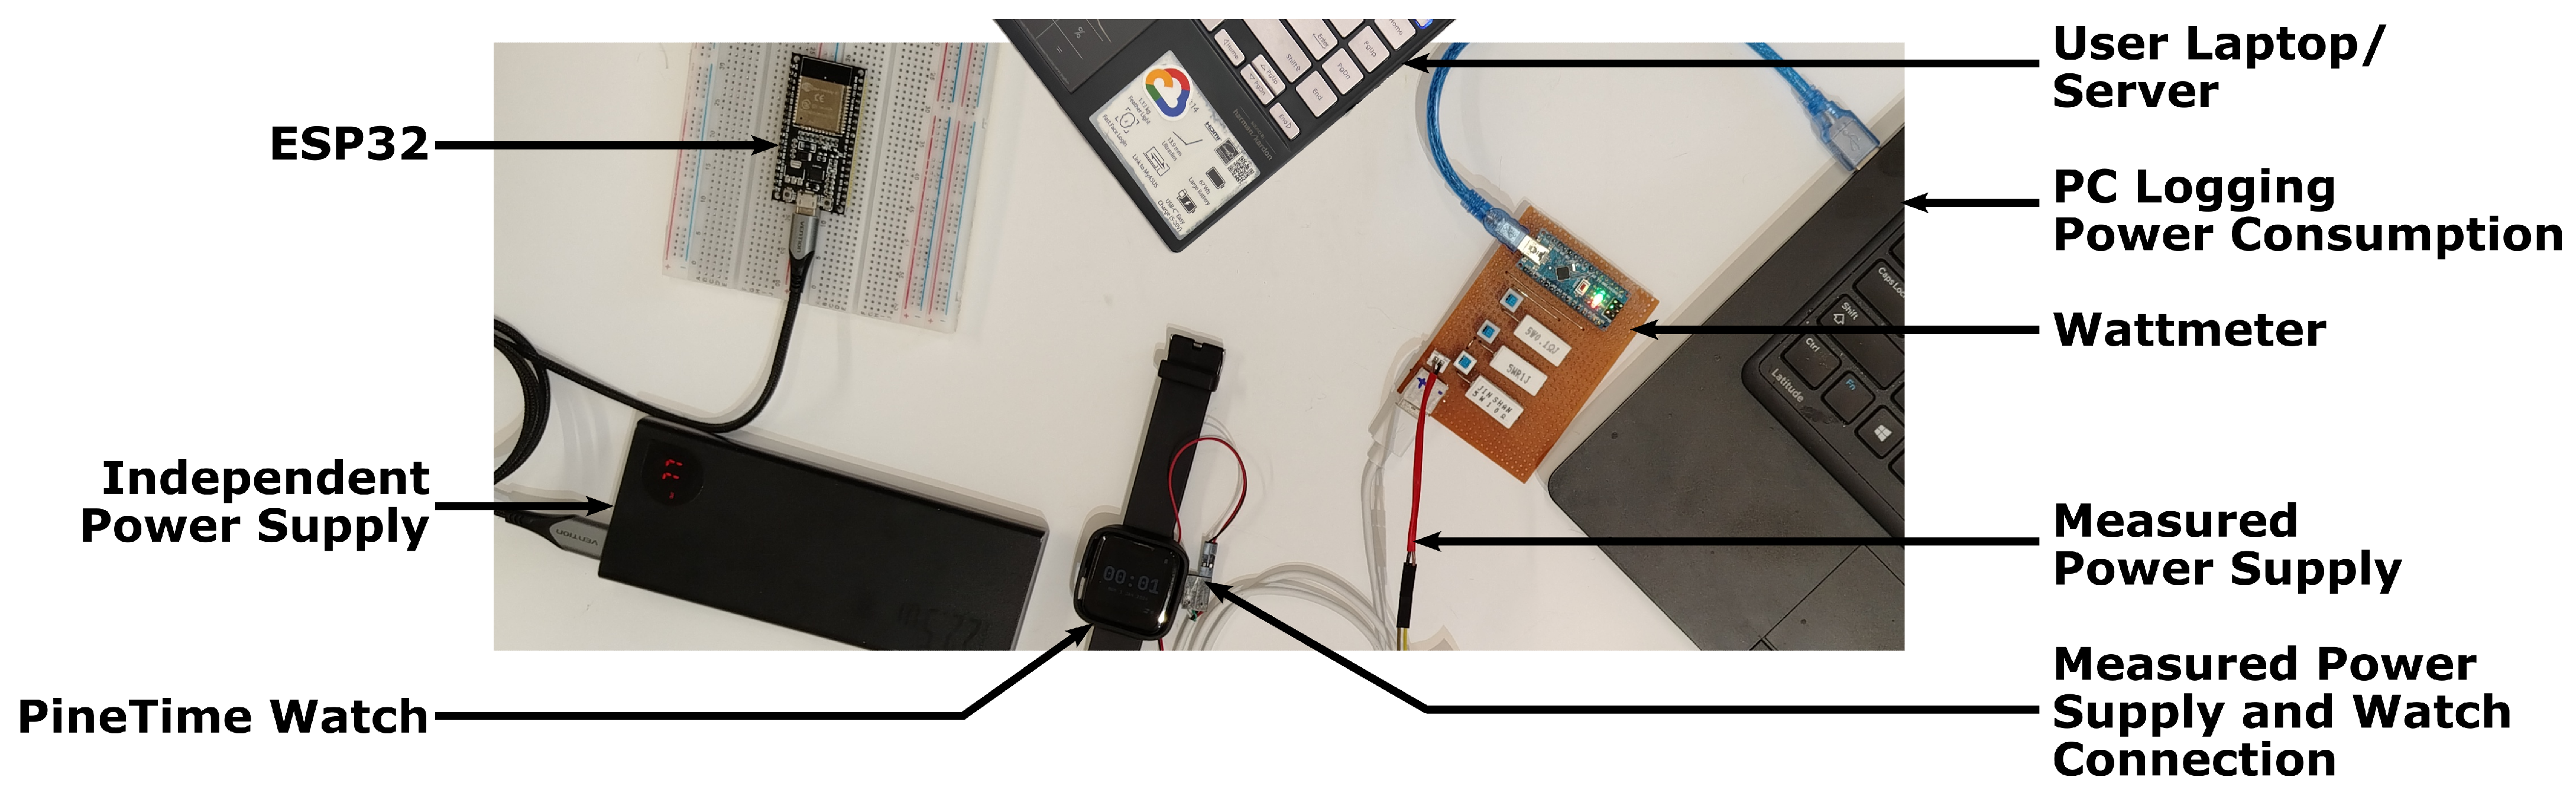
This section describes the experimental setup used to validate the proposed distributed wearable monitoring system. The setup enables E2E system operation while supporting evaluation of its general functionality, throughput, RTT, one-way latency, and energy consumption. As shown in Figure 6, the experimental setup consists of the three main components of the proposed system: (1) PineTime Watch (from Pine64, Hong Kong, China), (2) ESP32 Microcontroller (from Espressif Systems, Shanghai, China), and (3) ASUS ZenBook 14 from (ASUSTeK Computer Inc., Taipei, Taiwan), labeled as User Laptop/Server.
Figure 6.
Actual hardware implementation and experimental setup.
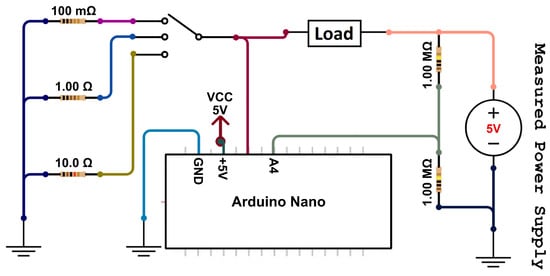
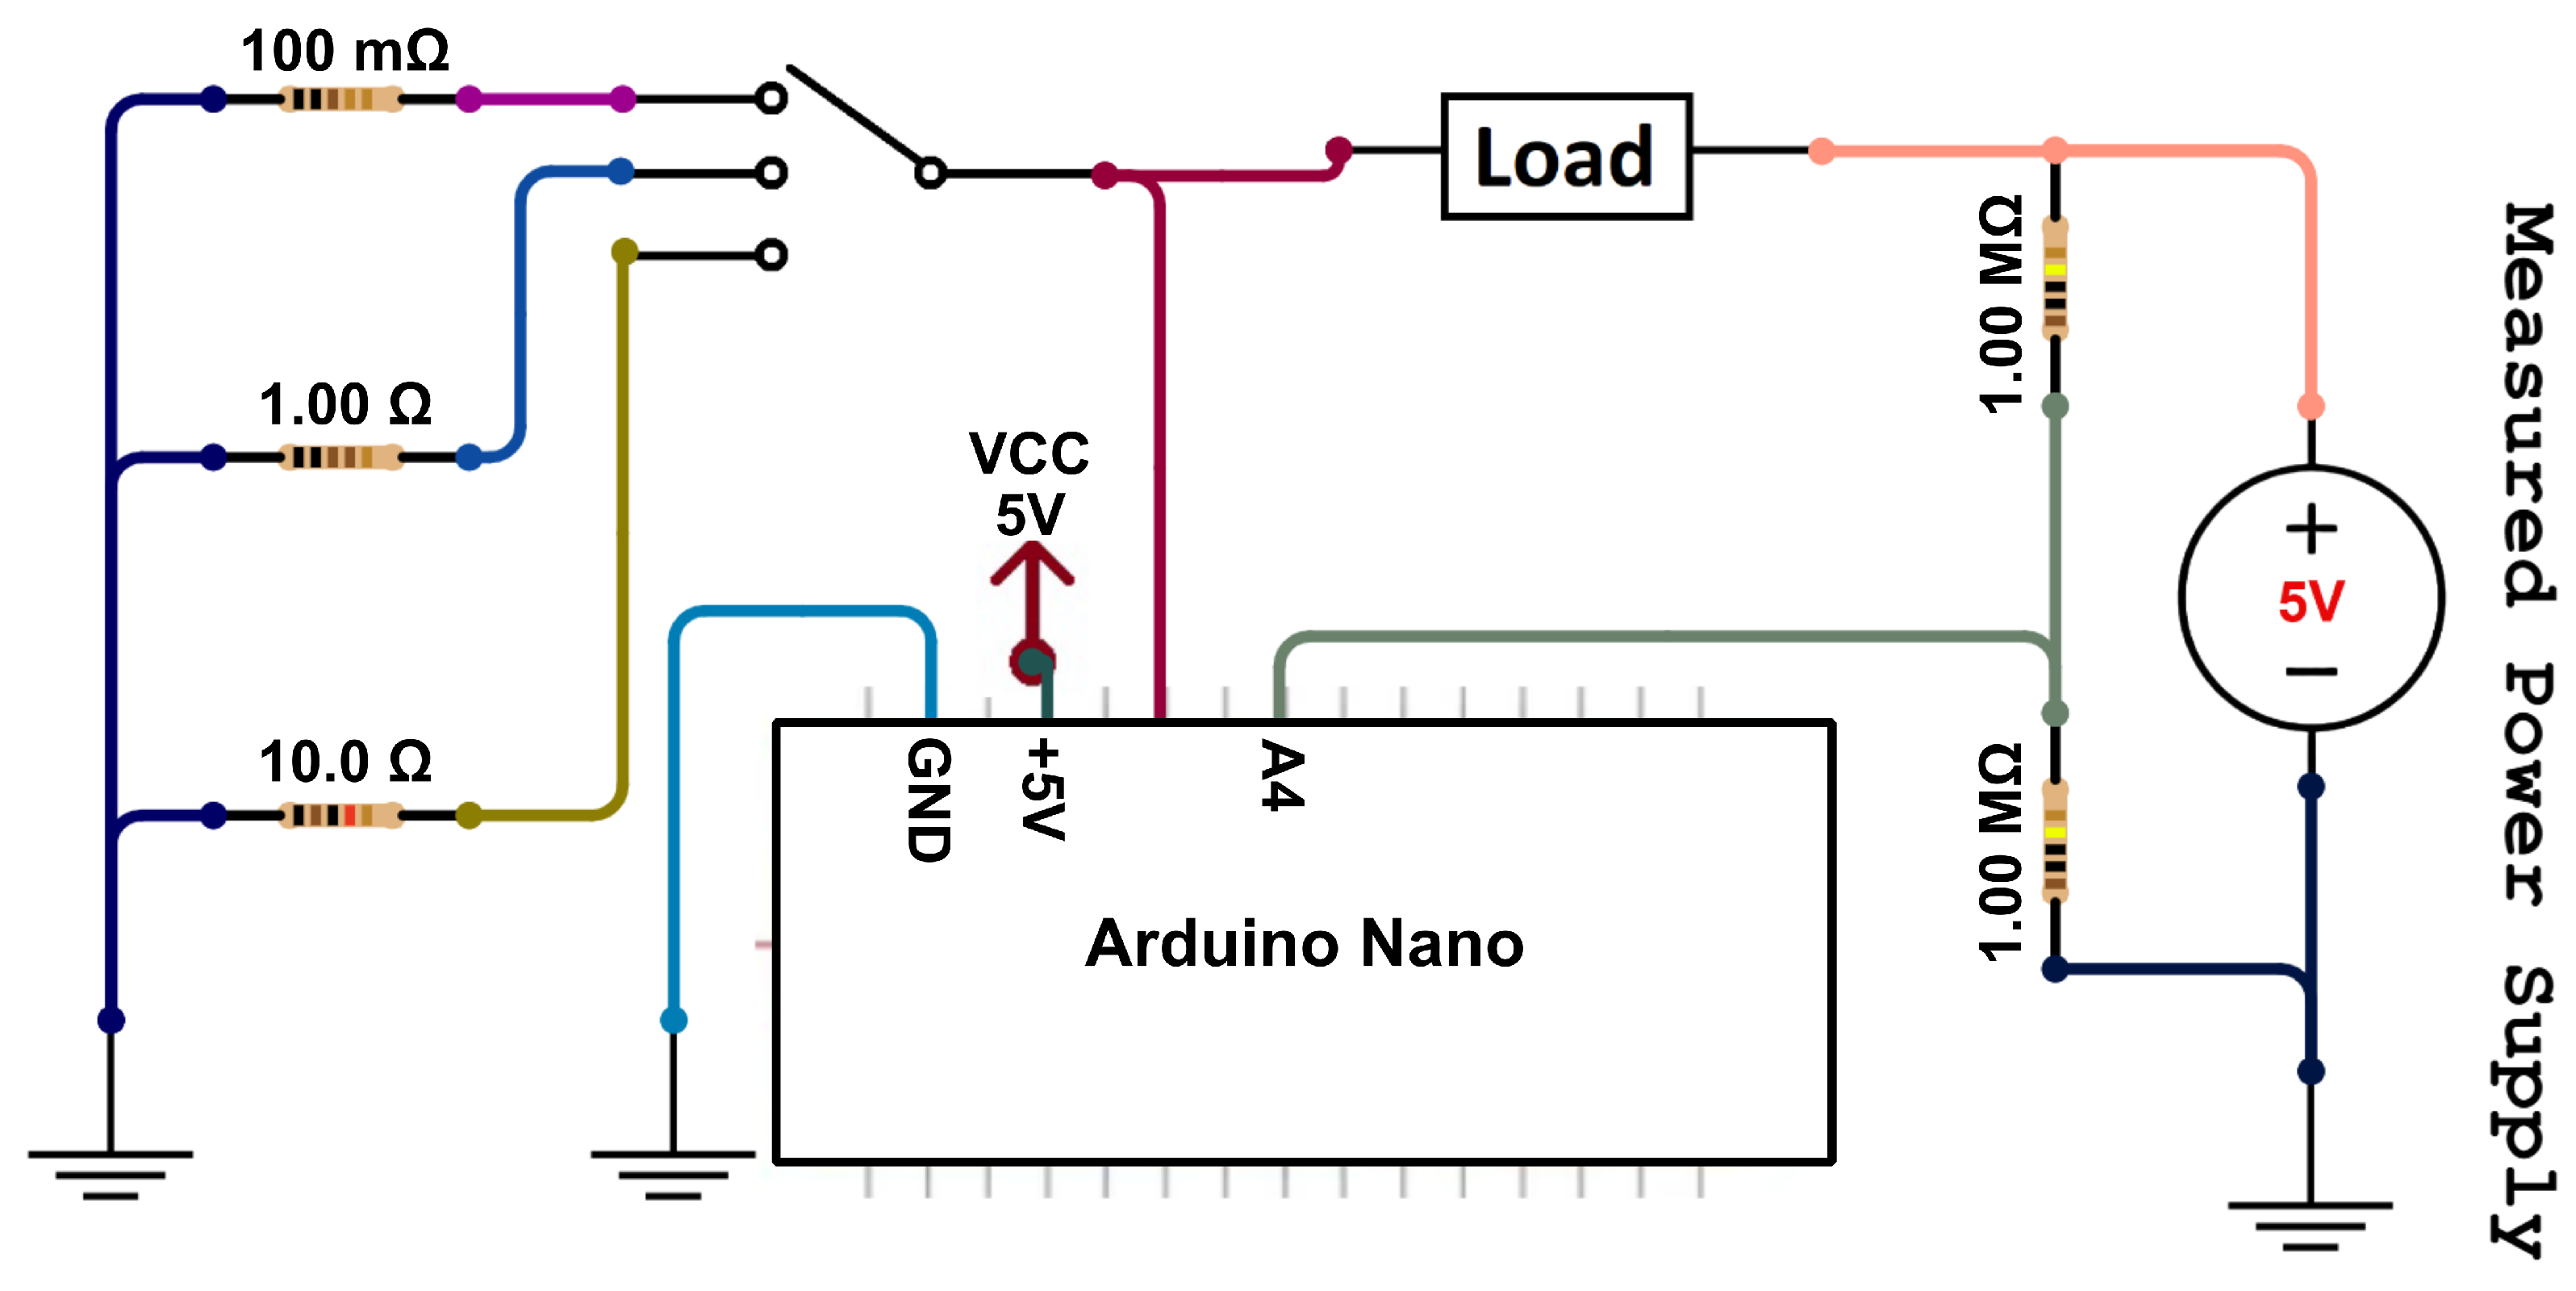
The PineTime smartwatch operates as the sensing node and connects to the ESP32 microcontroller via BLE to transmit the patient’s HR data. The PineTime is powered through a wattmeter that allows its power consumption to be monitored during normal system operation. The circuit diagram of the wattmeter is shown in Figure 7. It measures load current using an in-series shunt resistor selected from , corresponding to low, medium, and high sensitivity, respectively. The voltage drop across the shunt, , is measured and the load current is computed as shown in Equation (2). The supply voltage V is measured at the power supply output (i.e., before the shunt resistor). Therefore, the voltage applied to the PineTime is as expressed in Equation (3) and the PineTime power consumption is computed as shown in Equation (eqn:power).
Figure 7.
Wattmeter measuring the loads.
In our experiments, we selected to increase measurement sensitivity for the PineTime current range. The digital wattmeter transmits voltage and current measurements to a PC (labeled “PC Logging Power Consumption”) via an Arduino Nano. Data logging from the Arduino is performed over a USB connection using PuTTY (v0.83) as the terminal emulator.
The ESP32 serves as the BLE gateway and embedded MQTT broker. It receives HR readings from the PineTime watch via BLE, converts them to an MQTT message in JSON format, and publishes them over Wi-Fi to the User Laptop/Server. To isolate power measurements of the gateway from the smartwatch, the ESP32 is powered independently using a USB power bank, while the PineTime is powered through the wattmeter. This separation ensures that the reported power measurements correspond only to the PineTime smartwatch.
The experimental setup also shows a laptop labeled “User Laptop/Server”, an ASUS ZenBook 14 equipped with an Intel Core i7 Ice Lake processor, 16 GB of LPDDR4X RAM, and a 512 GB SSD. The User Laptop/Server runs the monitoring application, which subscribes to HR readings from the MQTT broker on the ESP32 and performs data processing, visualization, and logging. It connects to the ESP32 Wi-Fi access point, subscribes to the relevant MQTT topics, applies the cleaning and smoothing algorithm, and displays live plots of the HR stream and network statistics. The laptop also stores CSV logs that are later used for offline analysis. During measurements, the watch is worn on the wrist and remains within the ESP32 gateway’s reliable BLE range, while running firmware that measures HR and sends standard BLE heart-rate notifications to the gateway.
5. Result Analysis and Discussion
This section presents and discusses the experimental results obtained from the proposed system. The analysis focuses on four main aspects: the overall operation of the monitoring system; the communication performance of the MQTT-based network; the power consumption of the resource-constrained devices; an ablation study to deduce the optimal parameter for the smoothing algorithm; and a comparison between the PineTime HR data, our proposed system, and a Huawei GT Pro 2 smartwatch. Together, these results are used to assess the practicality, responsiveness, energy efficiency, and reliability of the proposed distributed wearable monitoring system.
5.1. System Performance
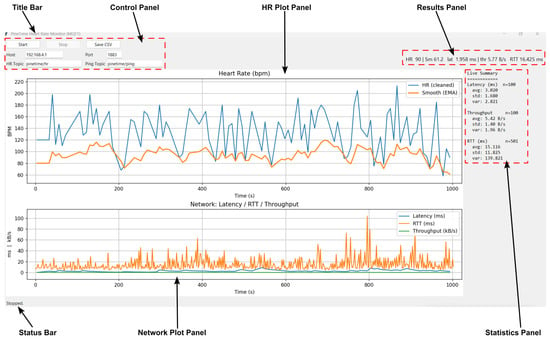
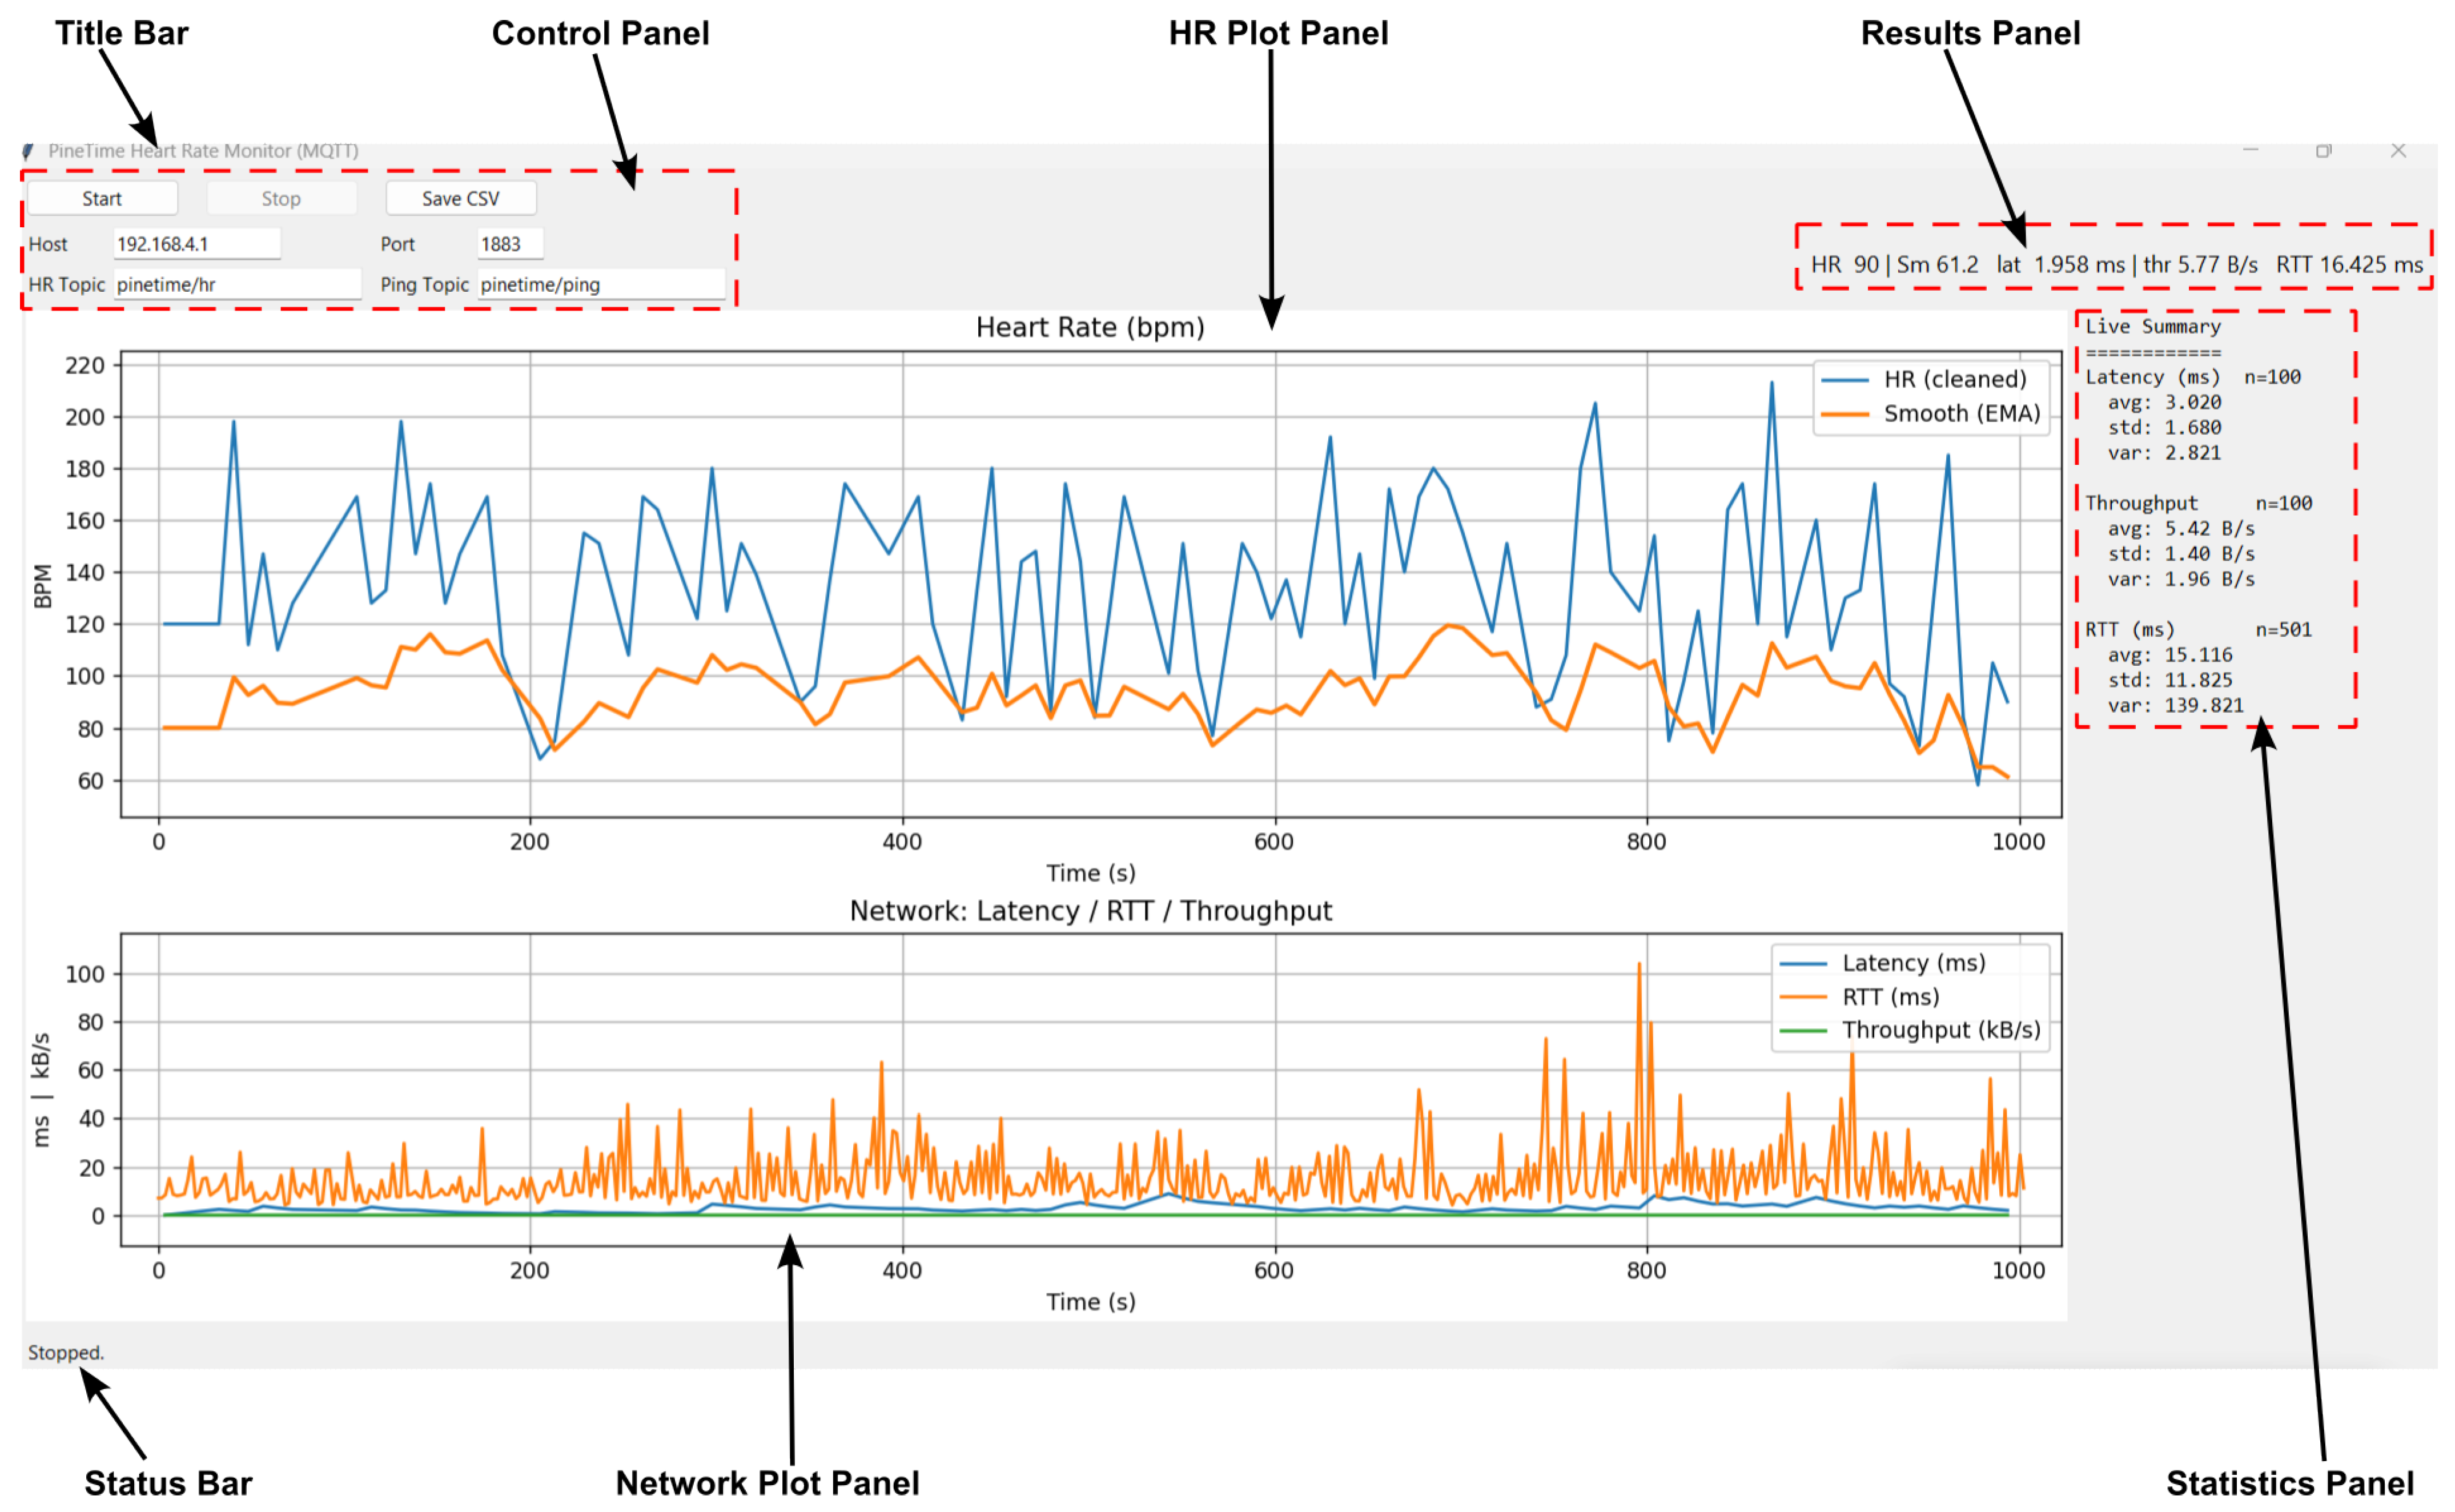
This section presents the general working of the proposed system. Figure 8 shows the entire User Interface (UI) of the application. We use dashed rectangles to indicate features containing many components. The figure features a Title Bar that displays the application name, in keeping with the tradition of PC applications. The application also includes a control panel with buttons and input fields that let the user control the software’s functionality. Table 2 shows the components of the control panel and their function.
Figure 8.
Application user interface with cleaned and smoothed graph of HR data.
Table 2.
Control panel components and their function.
The “HR Plot Panel” plots the HR values against time. The top-right corner is the legend for the graph, showing HR (Cleaned) and Smooth (EMA). The HR (Cleaned) graph in blue corresponds to at the data imputation stage of Algorithm 2. The orange line representing the Smooth (EMA) graph is the final result of applying the EMA filter, s. The smoothed data also yield a more stable representation of HR trends, free of short-term perturbations and transient artifacts, while preserving true physiological variations.
The application also includes a “Results Panel” located in the top-right corner of the UI. It displays the instantaneous values of the system’s five parameters as follows (from left to right): (1) in bpm; (2) s which is the smoothed HR value computed by Algorithm 2; (3) the EMA smoothed latency in ms, , as calculated by Algorithm 3; (4) the throughput value in B/s, T, as calculated by Algorithm 4; and (5) the EMA smoothed RTT in ms, , as calculated by Algorithm 6. These values are refreshed every 150 ms. They are also saved in a CSV when the Save CSV button is pressed. Sample data is available online [33].
The app also includes a “Statistics Panel” that displays latency, throughput, and RTT statistics for the MQTT network during the session. The first part shows the sample size, average, standard deviation, and variance of latency calculated from . The second part summarizes the statistics of throughput, presenting the sample size, average, standard deviation, and variance of . The last part calculates the sample size, average, standard deviation, and variance of RTT from .
The “Network Plot Panel” is located below the HR Plot Panel. The panel is refreshed every 250 ms. It visualizes three network-performance metrics over time: the EMA-smoothed one-way latency estimate in milliseconds (blue), the RTT in milliseconds (orange), and the throughput T in kB/s (green). The system reports throughput in kB/s to keep the scale readable for higher message rates in large-scale deployments. The system plots to emphasize the underlying latency trend and reduce visual clutter from sample-to-sample jitter.
However, the system plots as an instantaneous RTT to preserve short-lived spikes and outliers. We made this design choice because the two metrics are related. Therefore, presenting latency in EMA form and RTT in raw form provides complementary insight into trend versus instantaneous behavior without redundantly smoothing both streams. This combined view allows the user to quickly observe transient congestion, spikes, and long-term trends, which is useful for monitoring and troubleshooting network behavior as the system scales.
Finally, the “Status Bar” provides real-time feedback about the system’s operating state and connection status. Table 3 shows the messages displayed in the Status Bar and the conditions under which each message is issued (e.g., start/stop button actions, fetal errors, successful subscription, connection failures, and unexpected disconnects). This lightweight logging interface improves usability by making internal events visible to users, enabling faster system diagnosis and troubleshooting during connectivity issues or runtime failures.
Table 3.
Messages displayed by the status bar.
5.2. Network Performance
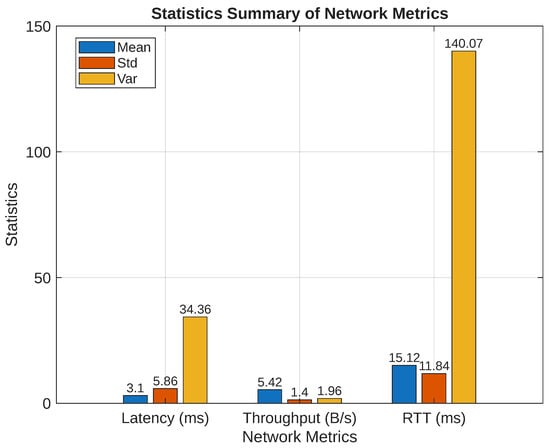
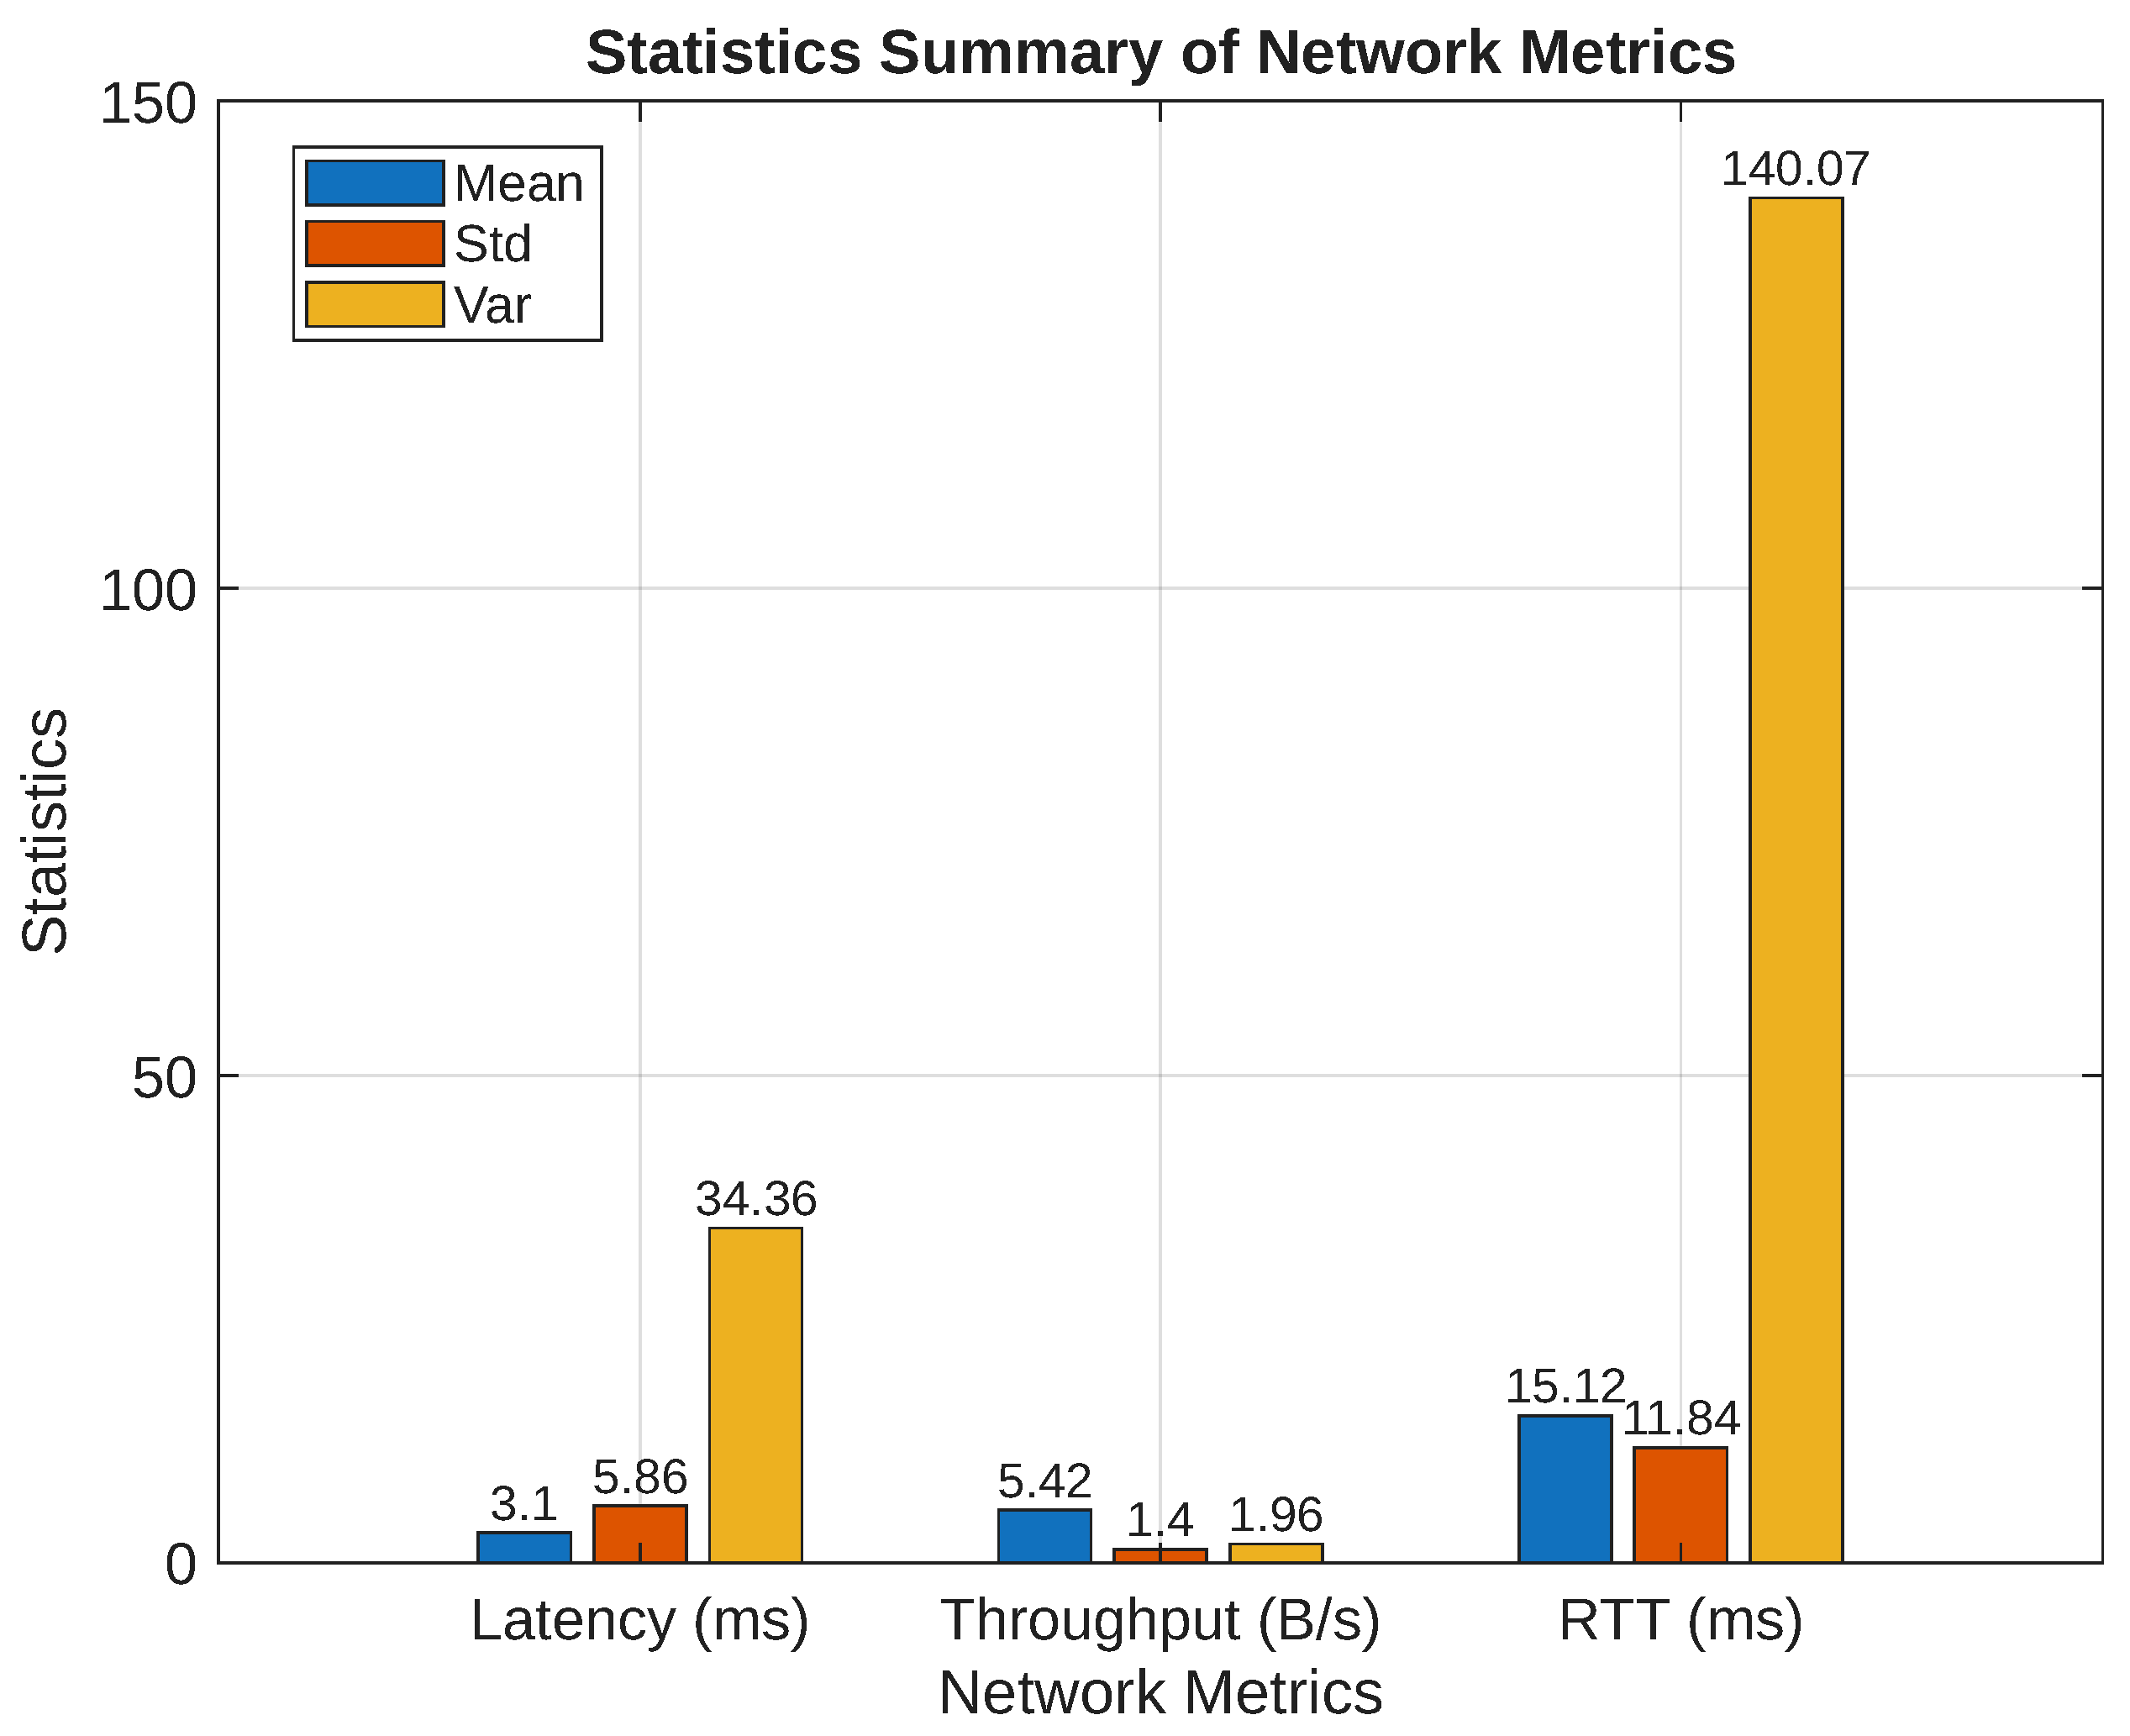
This section presents the network performance of the proposed system in terms of one-way latency, throughput, and RTT, as computed using Algorithms 3, 4 and 6, respectively. Figure 9 shows the results as obtained from the Statistics Panel of the local server application in Figure 8, after 100 samples for latency and throughput, and 500 samples for RTT.
Figure 9.
Network performance of the proposed system.
The results show that the one-way latency has a mean of 3.098 ms, a standard deviation of 5.862 ms, and a variance of 34.357 ms2, indicating responsive communication with occasional delay spikes. The throughput has a mean of 5.42 B/s, a standard deviation of 1.40 B/s, and a variance of 1.96 (B/s)2, which is sufficient for low-rate HR monitoring applications. The RTT has a mean of 15.124 ms, a standard deviation of 11.835 ms, and a variance of 140.070 ms2, confirming low-latency bidirectional communication between the wearable node and the local server.
5.3. Power Consumption
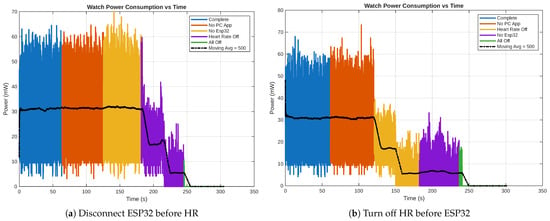
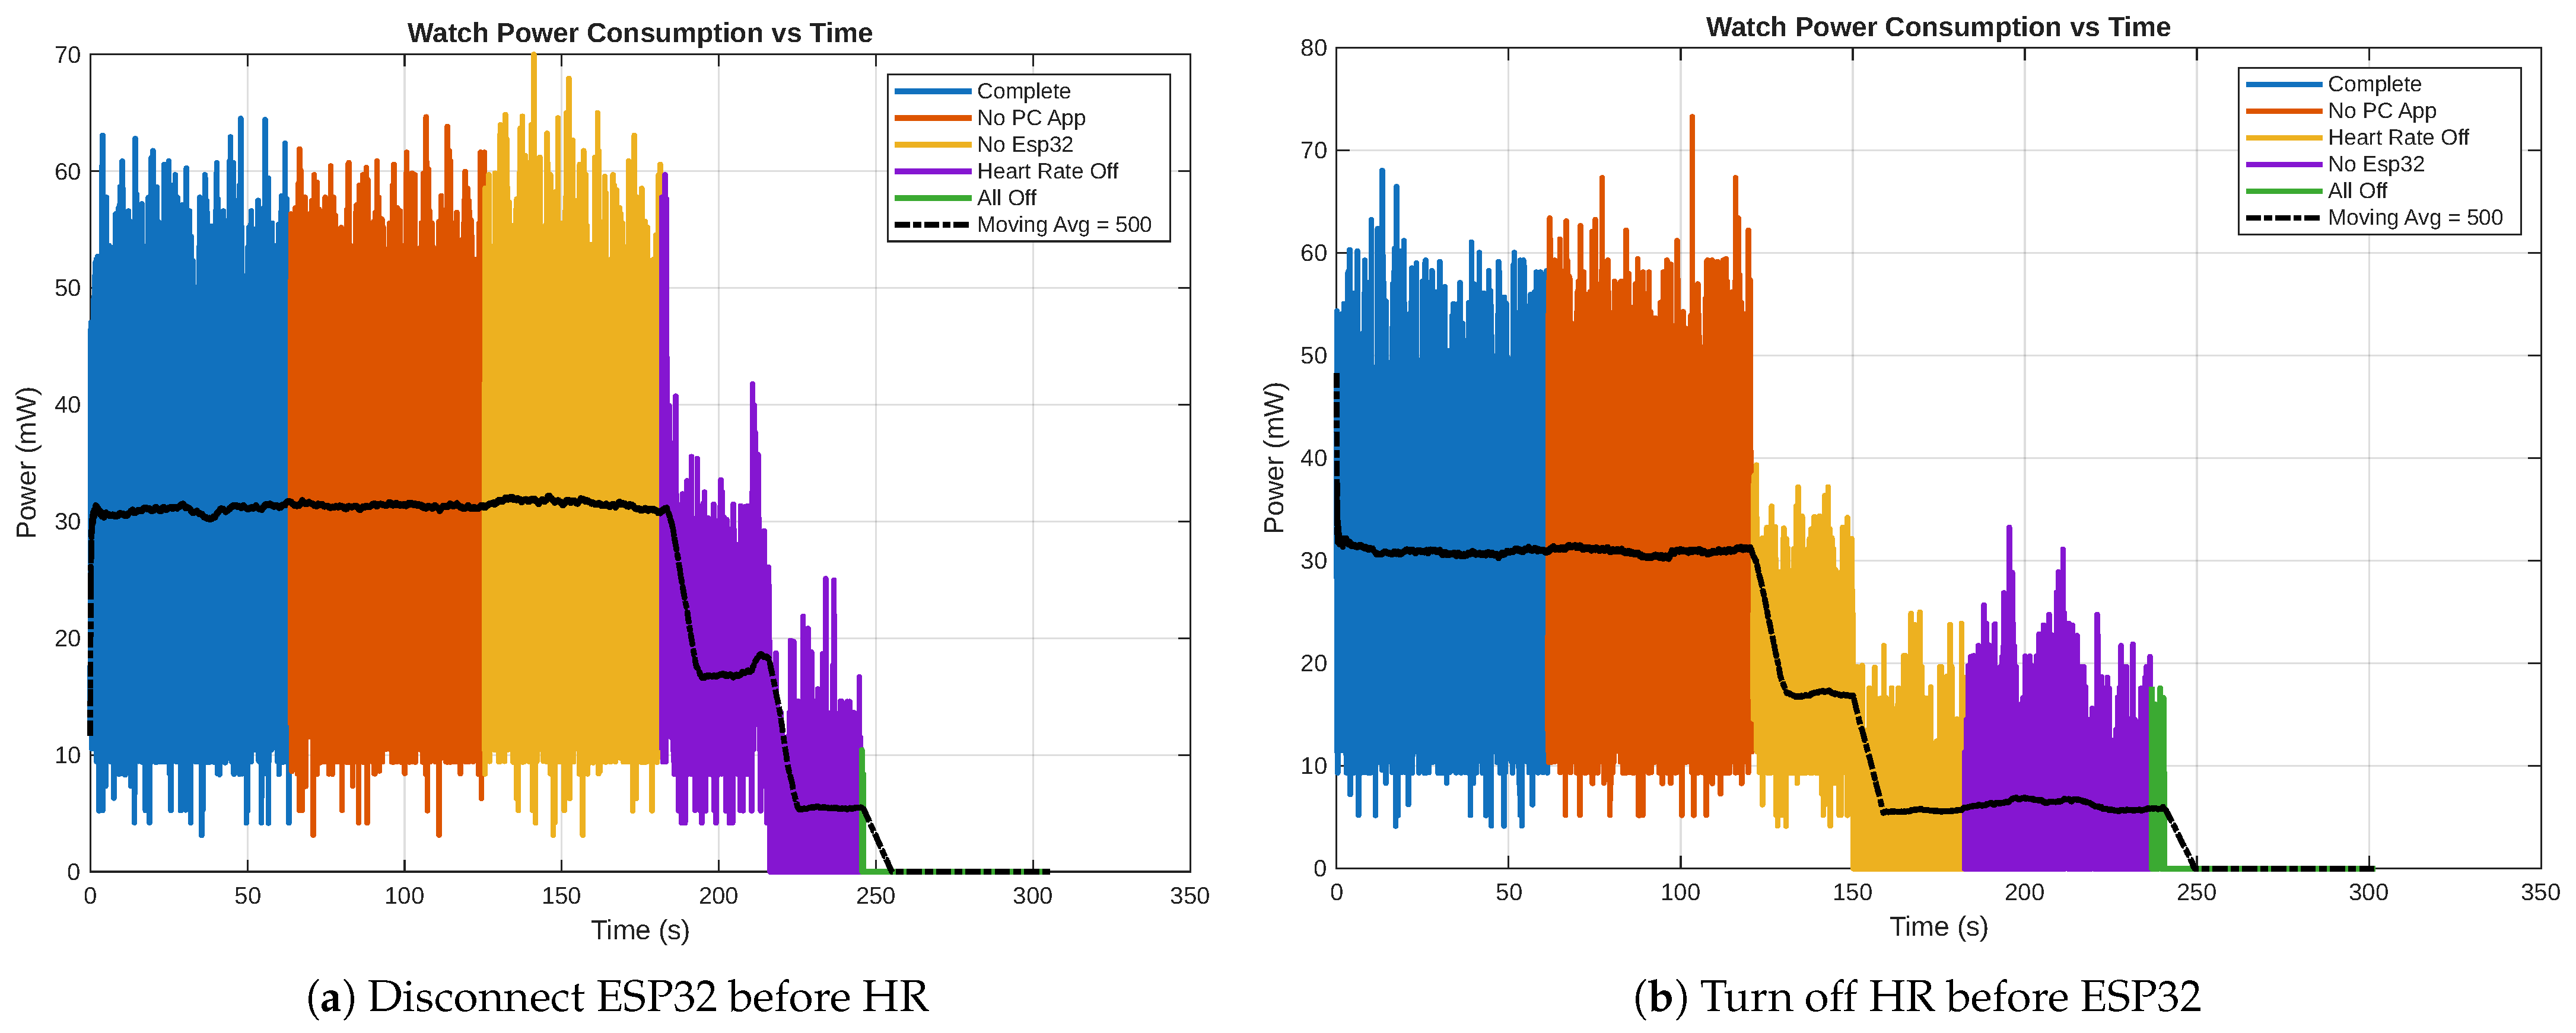
We also investigated the power consumption of the resource-constrained devices on the network, the ESP32 and the PineTime watch, using the setup described in Section 4. The PineTime smartwatch’s power consumption was measured in five successive stages. A component or function was turned off or disconnected in each stage, as follows: (1) all components in the experimental setup were connected and operating normally, (2) the server application was turned off, (3) the ESP32 gateway was turned off, (4) the HR sensor was turned off through the PineTime settings, and (5) the PineTime itself was turned off, thereby switching off all devices on the network to identify possible background power readings from external sources. Each stage lasted approximately 60 s to ensure that steady-state operation was reached before analysis.
A second experiment was conducted to investigate the watch’s Bluetooth behavior in the absence of a pairing device. To carry out this experiment, the procedures in the first experiment were modified as follows: Steps (3) and (4) were swapped, with stage (3) turning off the HR sensor on the watch before stage (4) disconnecting the ESP32. In stage (5), the watch was completely disconnected, effectively switching off all devices on the network. Like the first experiment, each step lasted 60 s. Figure 10 shows the line graph of the recorded power consumption of the PineTime watch in both experiments.
Figure 10.
Investigating the power consumption of the PineTime watch using different configurations.
Figure 10a shows the results of the first experiment. For clarity, each stage is shown using a different color: blue represents the complete system in operation, orange corresponds to the stage where the server application was turned off, yellow shows the condition where the ESP32 was also turned off, purple represents the stage where the HR sensor on the PineTime was disabled, and green indicates when all the components in the network are turned off. In addition, a moving average of the measured power, computed with a window size of 500 samples, is plotted as a black dashed line to highlight the overall trend.
The results show that the power consumption of the PineTime smartwatch ranges from approximately 3 mW to 70 mW, with an average of around 30 mW, which is broadly consistent with the device information provided by PINE64 documentation [34]. During the first two stages, when the PineTime remains connected to the ESP32, its power consumption typically ranges from approximately 5 mW to 65 mW. When the ESP32 is turned off, the PineTime’s power briefly increases to nearly 70 mW, especially immediately after disconnection. This increase is likely caused by the watch actively searching for a Bluetooth connection. After the HR sensor is disabled through the watch settings, the measured power decreases steadily as both the sensor activity and Bluetooth communication are reduced, eventually falling to about 25 mW and lower. Finally, when all devices are turned off, the wattmeter reading falls to zero, indicating negligible to no background noise in the measurement setup. These results suggest that disabling the HR sensor when continuous monitoring is not required can significantly reduce the PineTime’s power consumption.
To further investigate this behavior of the Bluetooth after disconnecting the ESP32, a second experiment was conducted (Figure 10b) in which the HR sensor (and consequently Bluetooth activity) was explicitly disabled on the watch before disconnecting the ESP32. In this case, no comparable power spike is observed, and the power remains below approximately 35 mW after disconnection. This comparison suggests that the previously observed spike can be attributed to the watch actively searching for a Bluetooth connection when the HR service remains enabled, but the gateway becomes unavailable.
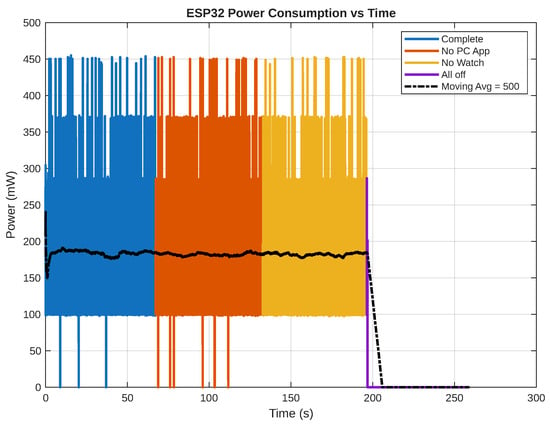
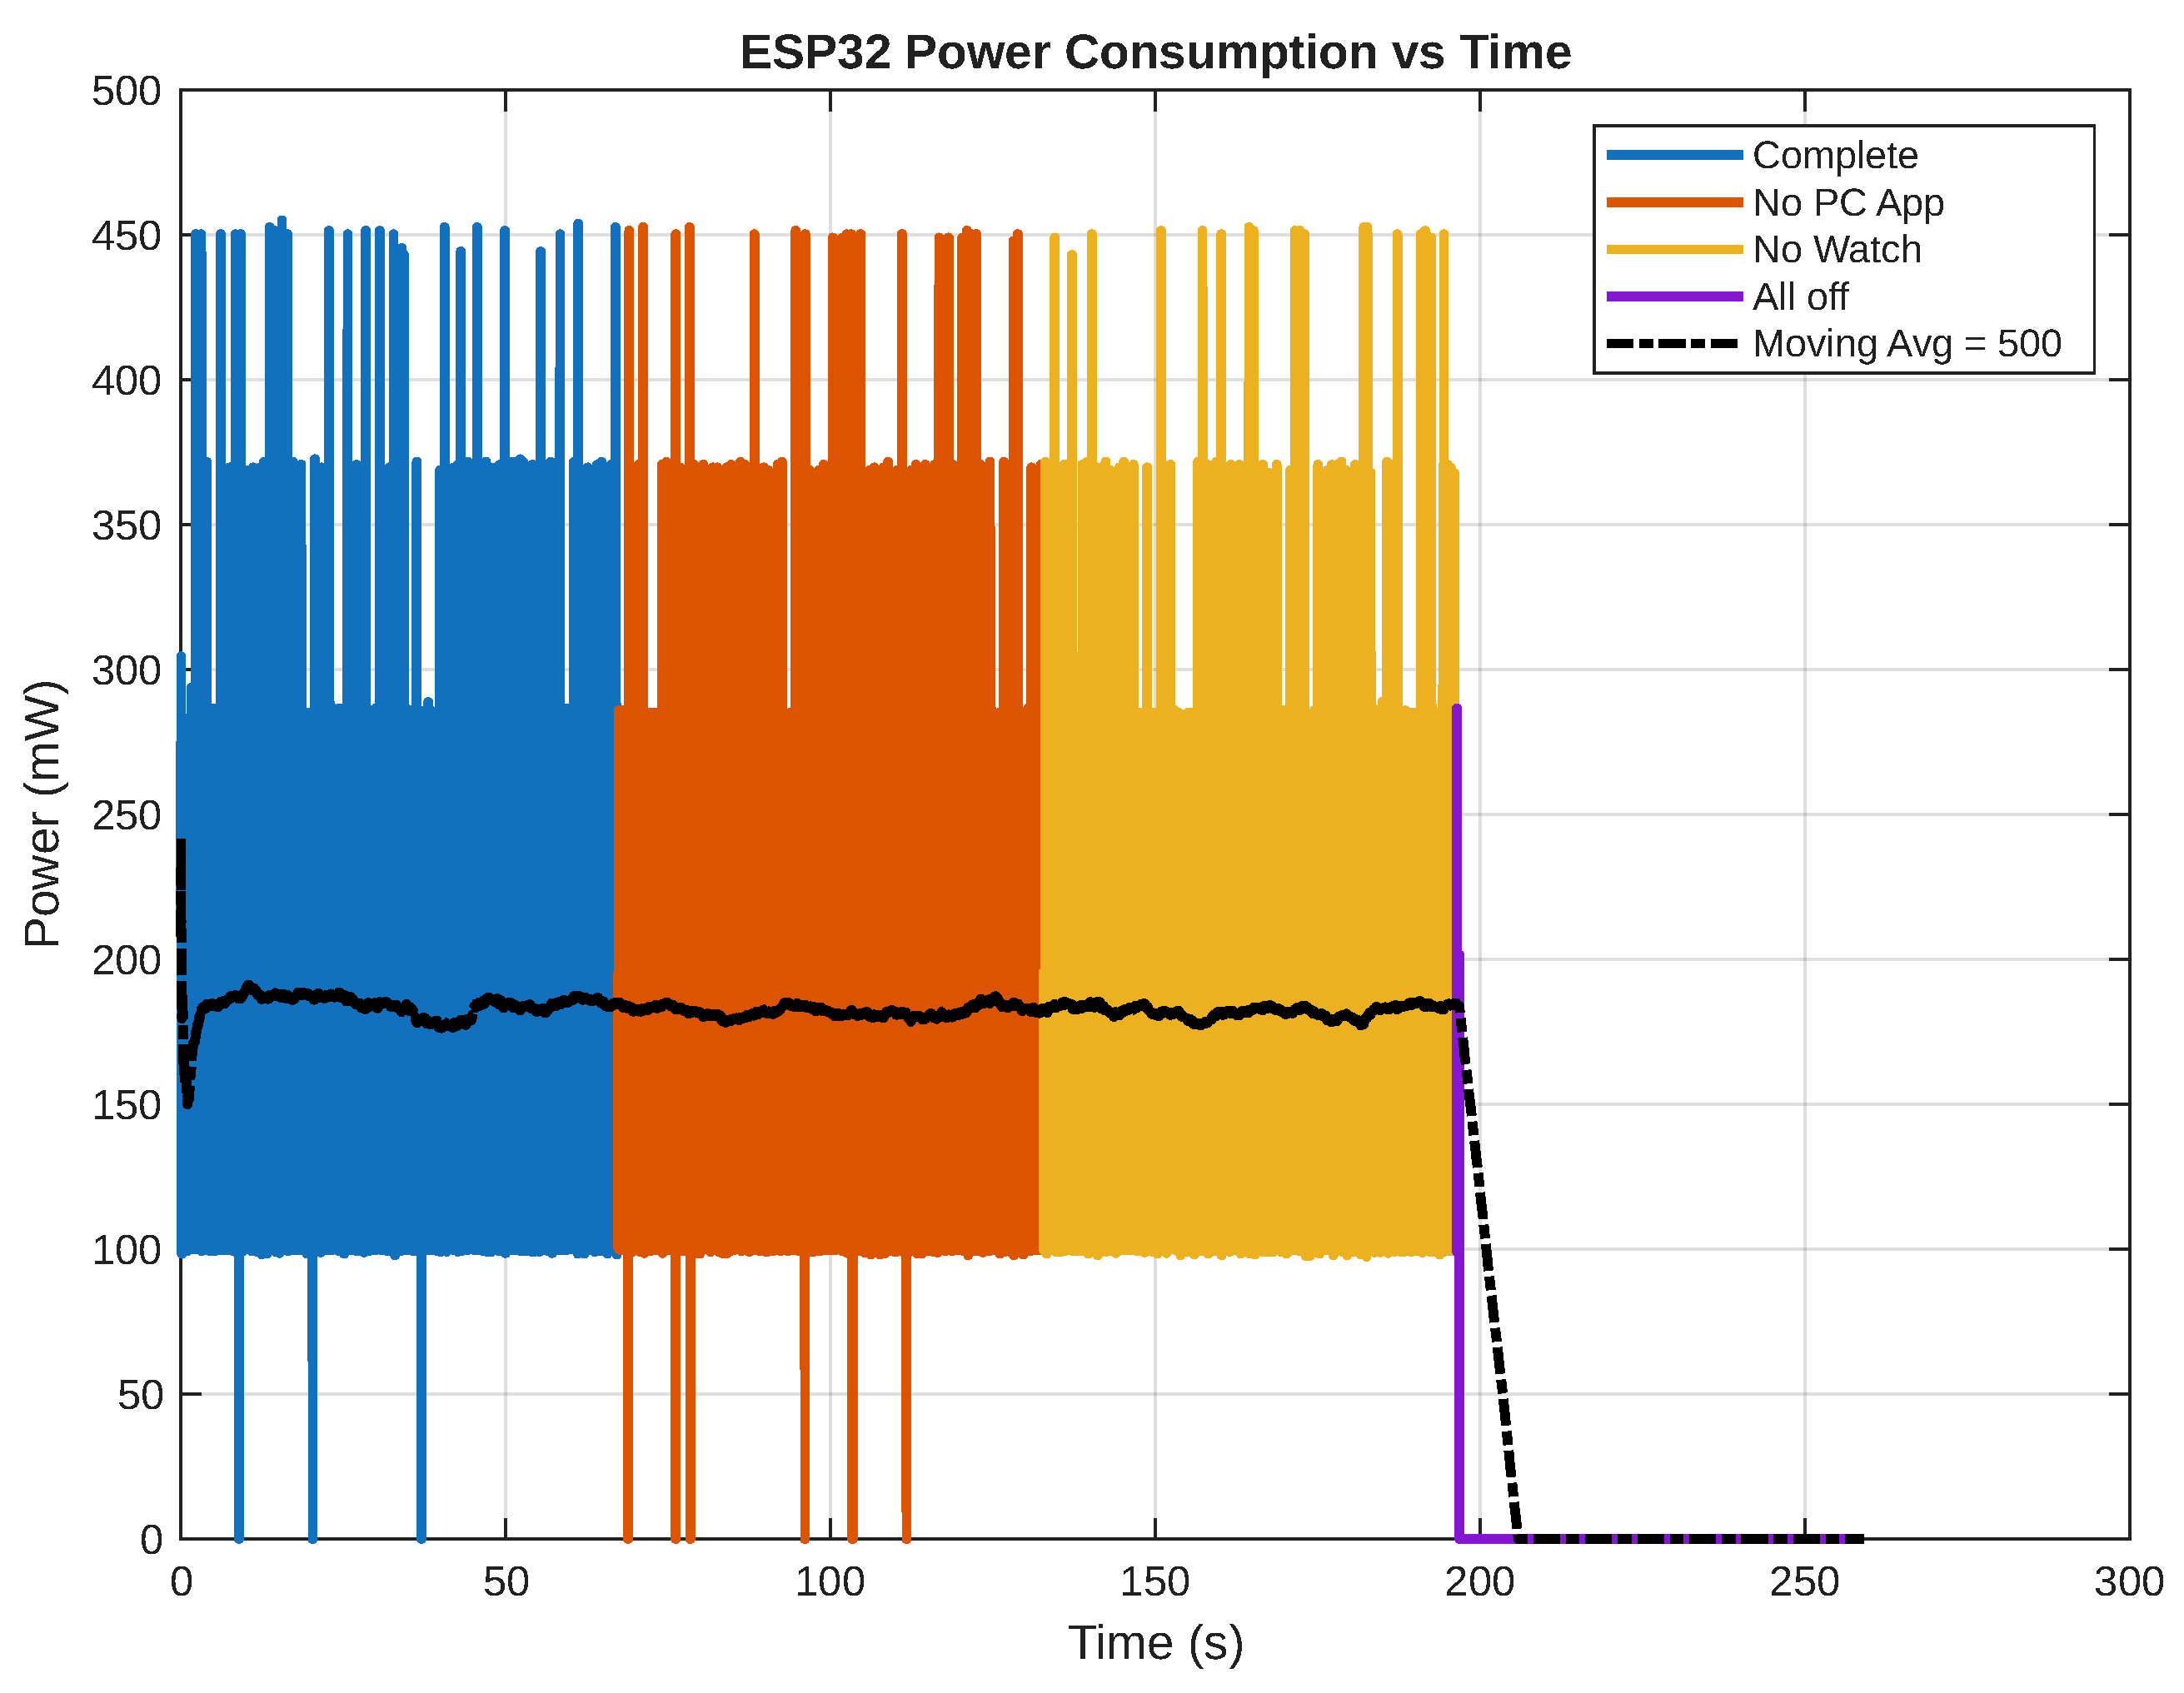
For the ESP32 power measurement, the supply arrangement was reconfigured such that the PineTime was powered independently from a PC USB port, while the ESP32 was powered through the wattmeter. This change was necessary because the PineTime draws very little current, causing the power bank used in the default setup to switch off intermittently because it is not detecting any effective load. To evaluate the ESP32 power profile, wattmeter readings were recorded sequentially under four operating conditions: (1) the complete system running, (2) the local server application turned off, (3) the PineTime turned off, and (4) the ESP32 turned off to quantify background noise in the measurement setup. Each condition was recorded for 60 s to allow transient responses associated with state transitions to settle before analysis.
Figure 11 shows the results of the experiment. Each stage is shown in a different color: blue for the complete system, orange for the ESP32 and PineTime operating without the local server application, yellow for the ESP32 running alone, and purple for when all devices are powered down. In addition, a moving average with a window size of 500 samples is plotted as a black dashed line to highlight the overall trend of the experiment. The results show that the ESP32 exhibits a nearly constant power profile throughout the experiment, with instantaneous values typically ranging from approximately 100 mW to 450 mW and an average of about 180 mW. These results indicate that the ESP32 has relatively low power consumption, suggesting that the proposed system can be deployed using battery power.
Figure 11.
Power consumption of the ESP32.
5.4. Clean and Smoothing Algorithm Performance
To qualitatively evaluate the behavior of the processed PineTime HR stream, we compare it against a commercial Huawei GT 2 Pro smartwatch [35], which has been widely adopted in prior wearable-health studies [36,37,38] and provides a practical reference for trend-level comparison. To quantitatively evaluate the agreement between the processed PineTime HR data and the reference device, we employ Mean Absolute Error (MAE), Root Mean Square Error (RMSE), and the Pearson correlation coefficient (r), as shown in Equations (5), (6), and (7), respectively [39]. Where denotes the processed PineTime HR value and denotes the corresponding HR value from the reference Huawei smartwatch at sample i. MAE measures the average absolute difference between the two signals, providing an intuitive indication of the overall deviation. RMSE emphasizes larger errors by squaring the differences before averaging, making it more sensitive to outliers. The correlation coefficient, r, quantifies the linear relationship between the two HR streams and indicates how well their trends align over time. These metrics provide an assessment of both error magnitude and trend consistency between the compared HR data streams.
where,
5.4.1. Ablation Study
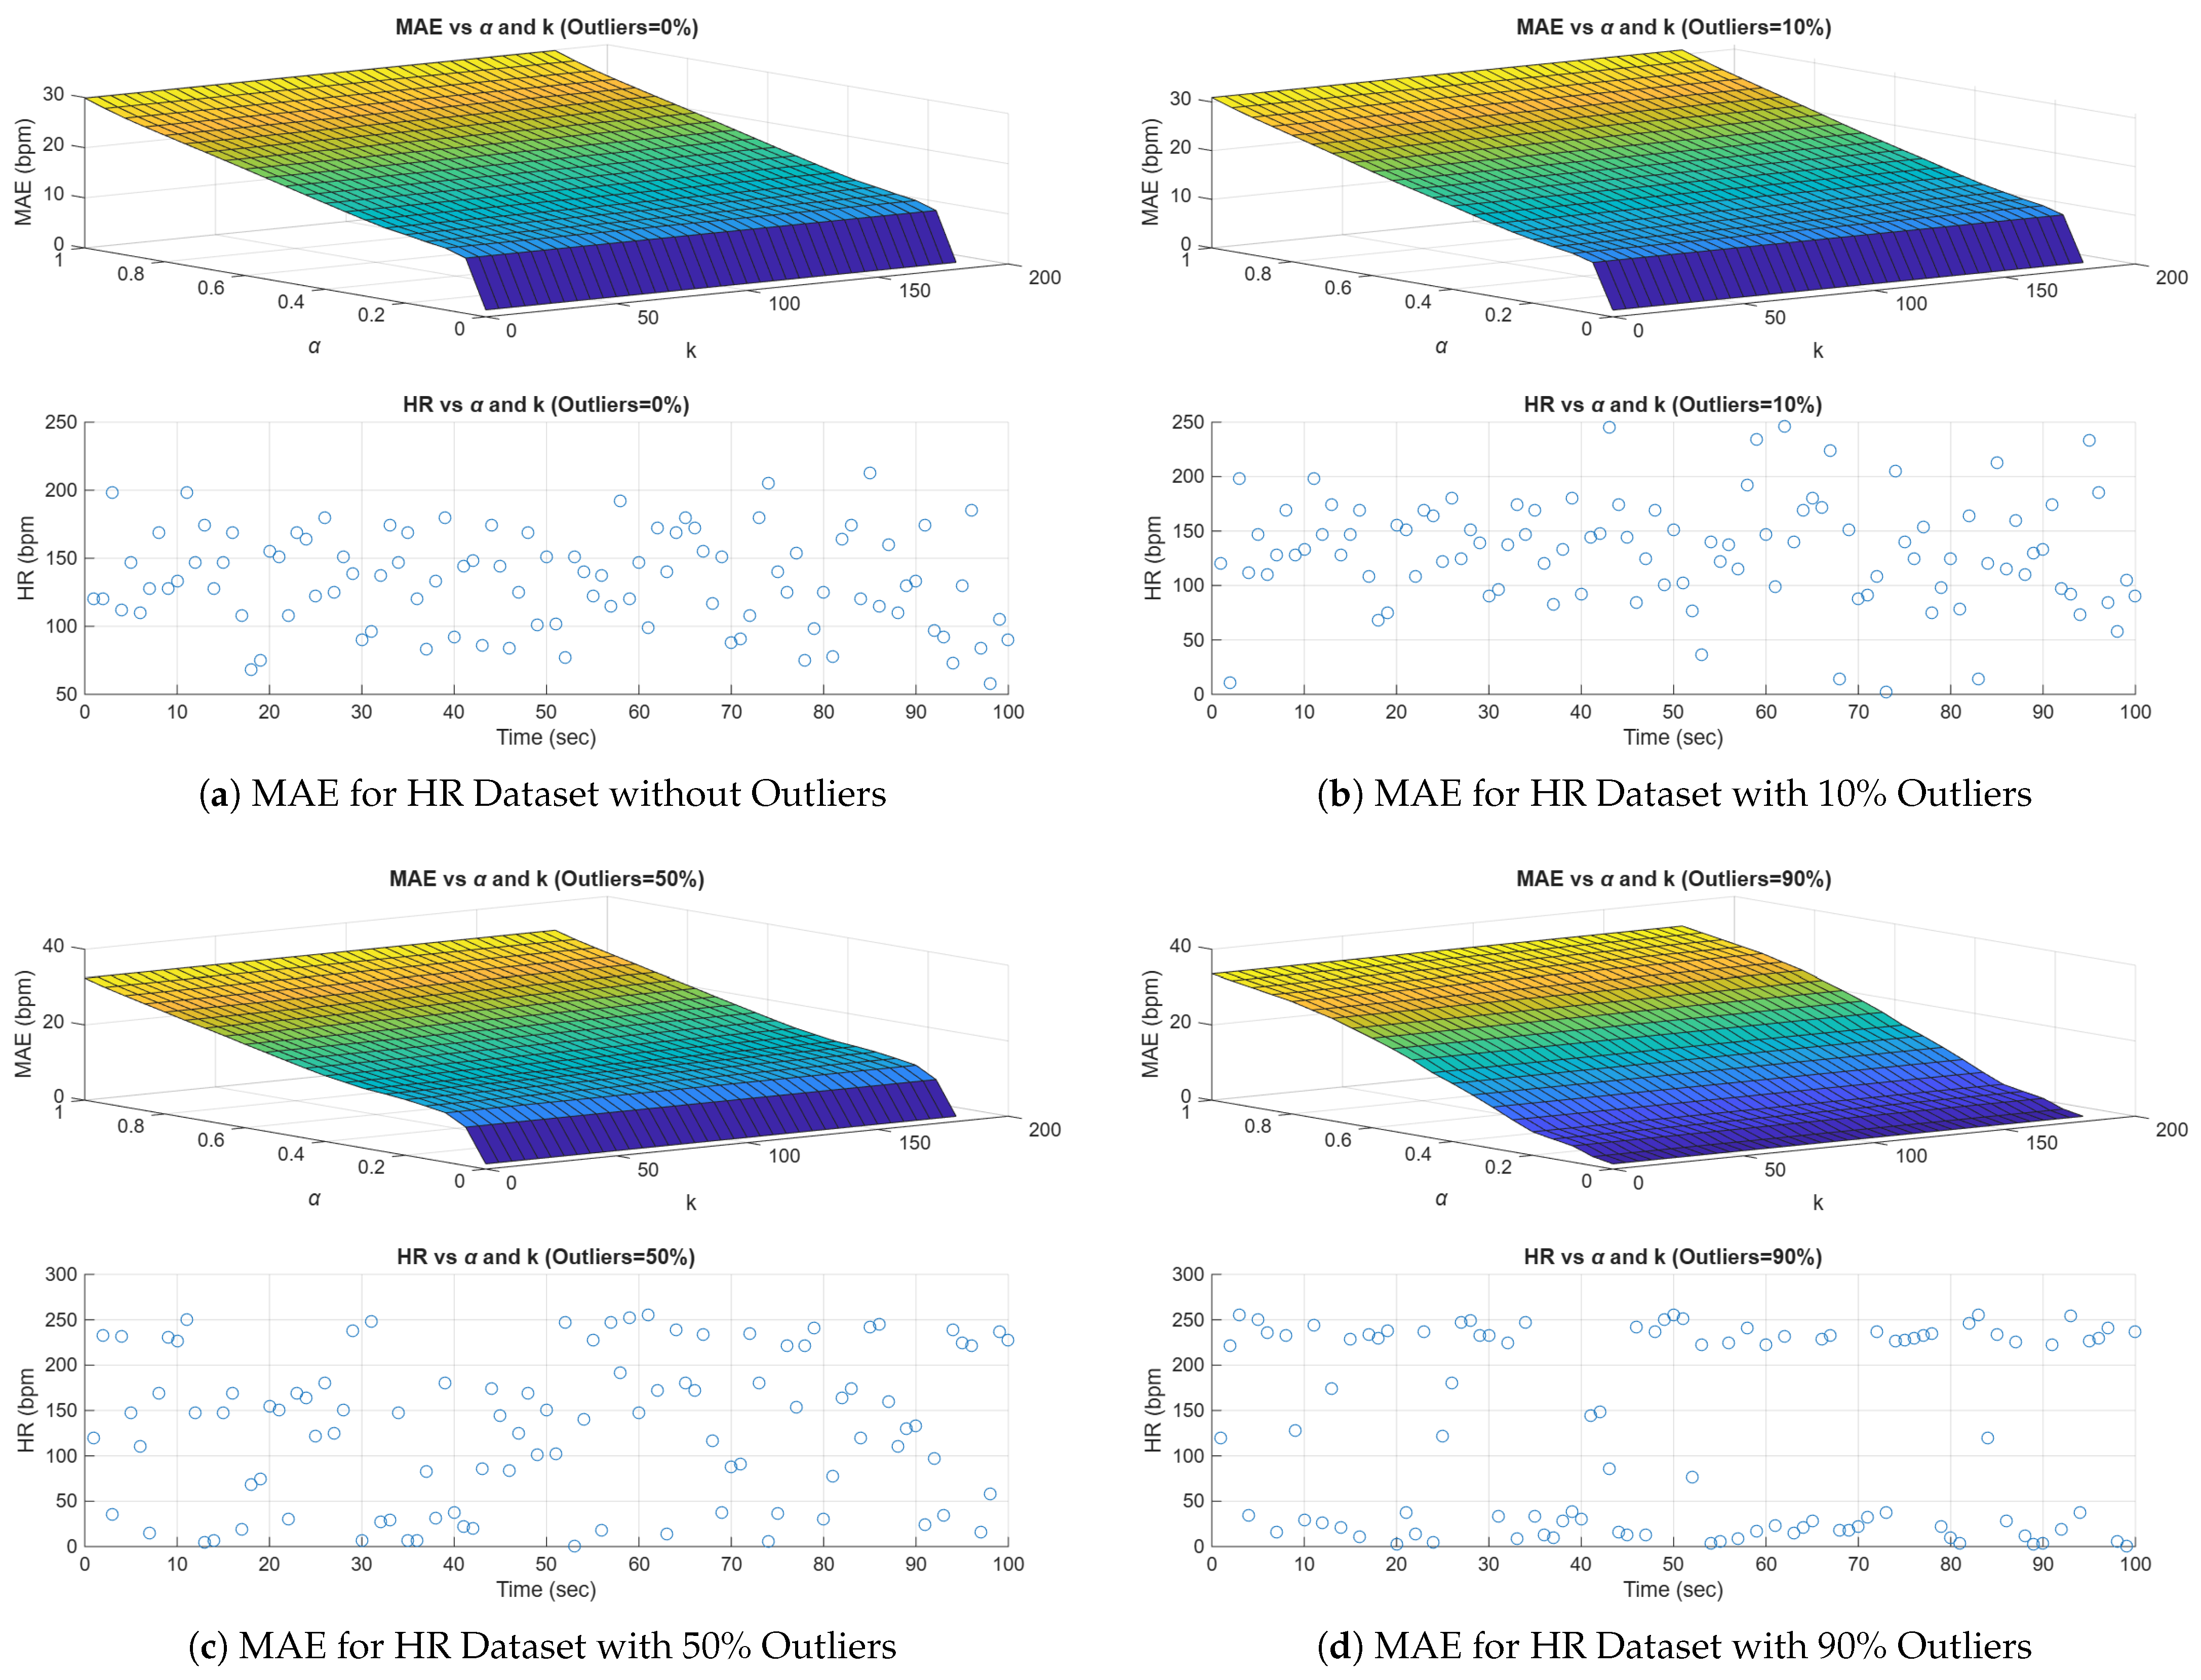
Algorithm 3 requires the assignment of four parameters (, , k, and ) to perform HR stream cleaning and smoothing effectively. The literature has guided the assignment of and [29,31], as discussed in Section 3.3.1. To determine the optimal values of k and , we conduct an ablation study using the MAE between the PineTime and Huawei smartwatch HR streams. Since the collected PineTime HR dataset does not contain values outside the range, we synthesized 10%, 50%, and 90% outliers (half spikes and half dips) and uniformly distributed them in the dataset, enabling proper evaluation of the parameters.
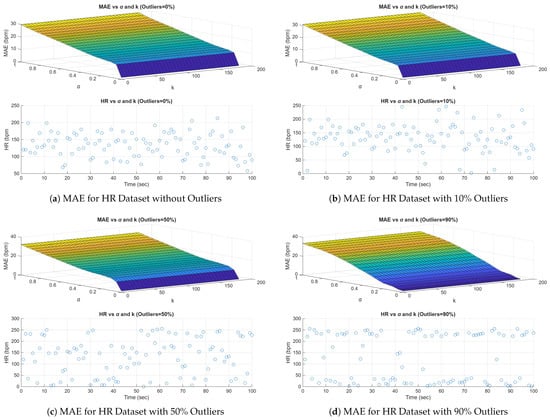
Figure 12 shows the results of the ablation study for values of k ranging (because and implies ) at increments of 5 and ranging at increments of 0.05. Each figure contains two subfigures: the upper subfigure shows the MAE at different values of and k, while the lower subfigure shows the distribution of HR values over time. Figure 12a shows the MAE between the PineTime and Huawei smartwatch HR streams using the collected PineTime HR dataset without outliers. Figure 12b–d were obtained by uniformly injecting 10%, 50%, and 90% outliers into the PineTime HR dataset, respectively. This process enables controlled evaluation of the proposed system under an increasing levels of outliers.
Figure 12.
Ablation study of k and using HR dataset and modified dataset. The color gradient indicates the magnitude of the MAE, transitioning from dark blue/darker-shaded regions (lowest error) to yellow/light-shaded regions (highest error).
The results show that k has minimal influence on the MAE across all experiments. This result is intuitive, because all cases begin with a valid HR value, while k is only used during the initialization step of Algorithm 3 when . In contrast, strongly influences the smoothing behavior. All figures show their lowest MAE at because the Huawei HR has low variance, and the EMA output remains fixed at the initialization value. Algorithm 3 shows that the EMA is initialized using the first sample. In these experiments, the first HR value falls within a valid range, making equal that value. Therefore, the filtered HR stream remains equal to the first HR value throughout the entire test. Although this behavior minimizes MAE in highly corrupted streams, it also removes responsiveness to legitimate temporal HR variations. Conversely, removes smoothing entirely, causing the EMA output to follow the current HR sample directly, and allowing all outliers to propagate into the cleaned stream. Figure 12a–c show a rapid increase in MAE at small values, followed by an approximately linear growth region at larger values. This behavior indicates that smaller values of suppress outliers more effectively, although at the cost of reduced responsiveness to legitimate HR variations. However, Figure 12d (90% outliers) shows that even aggressive smoothing struggles under extremely high outlier rates.
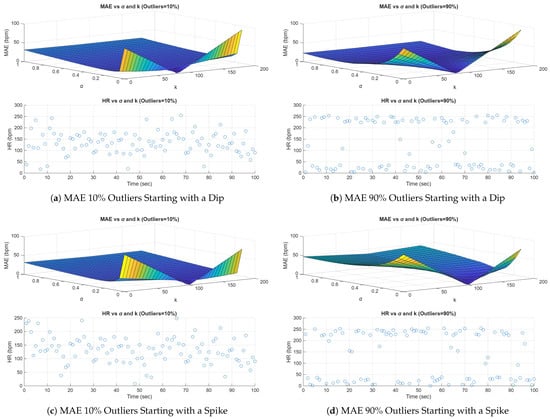
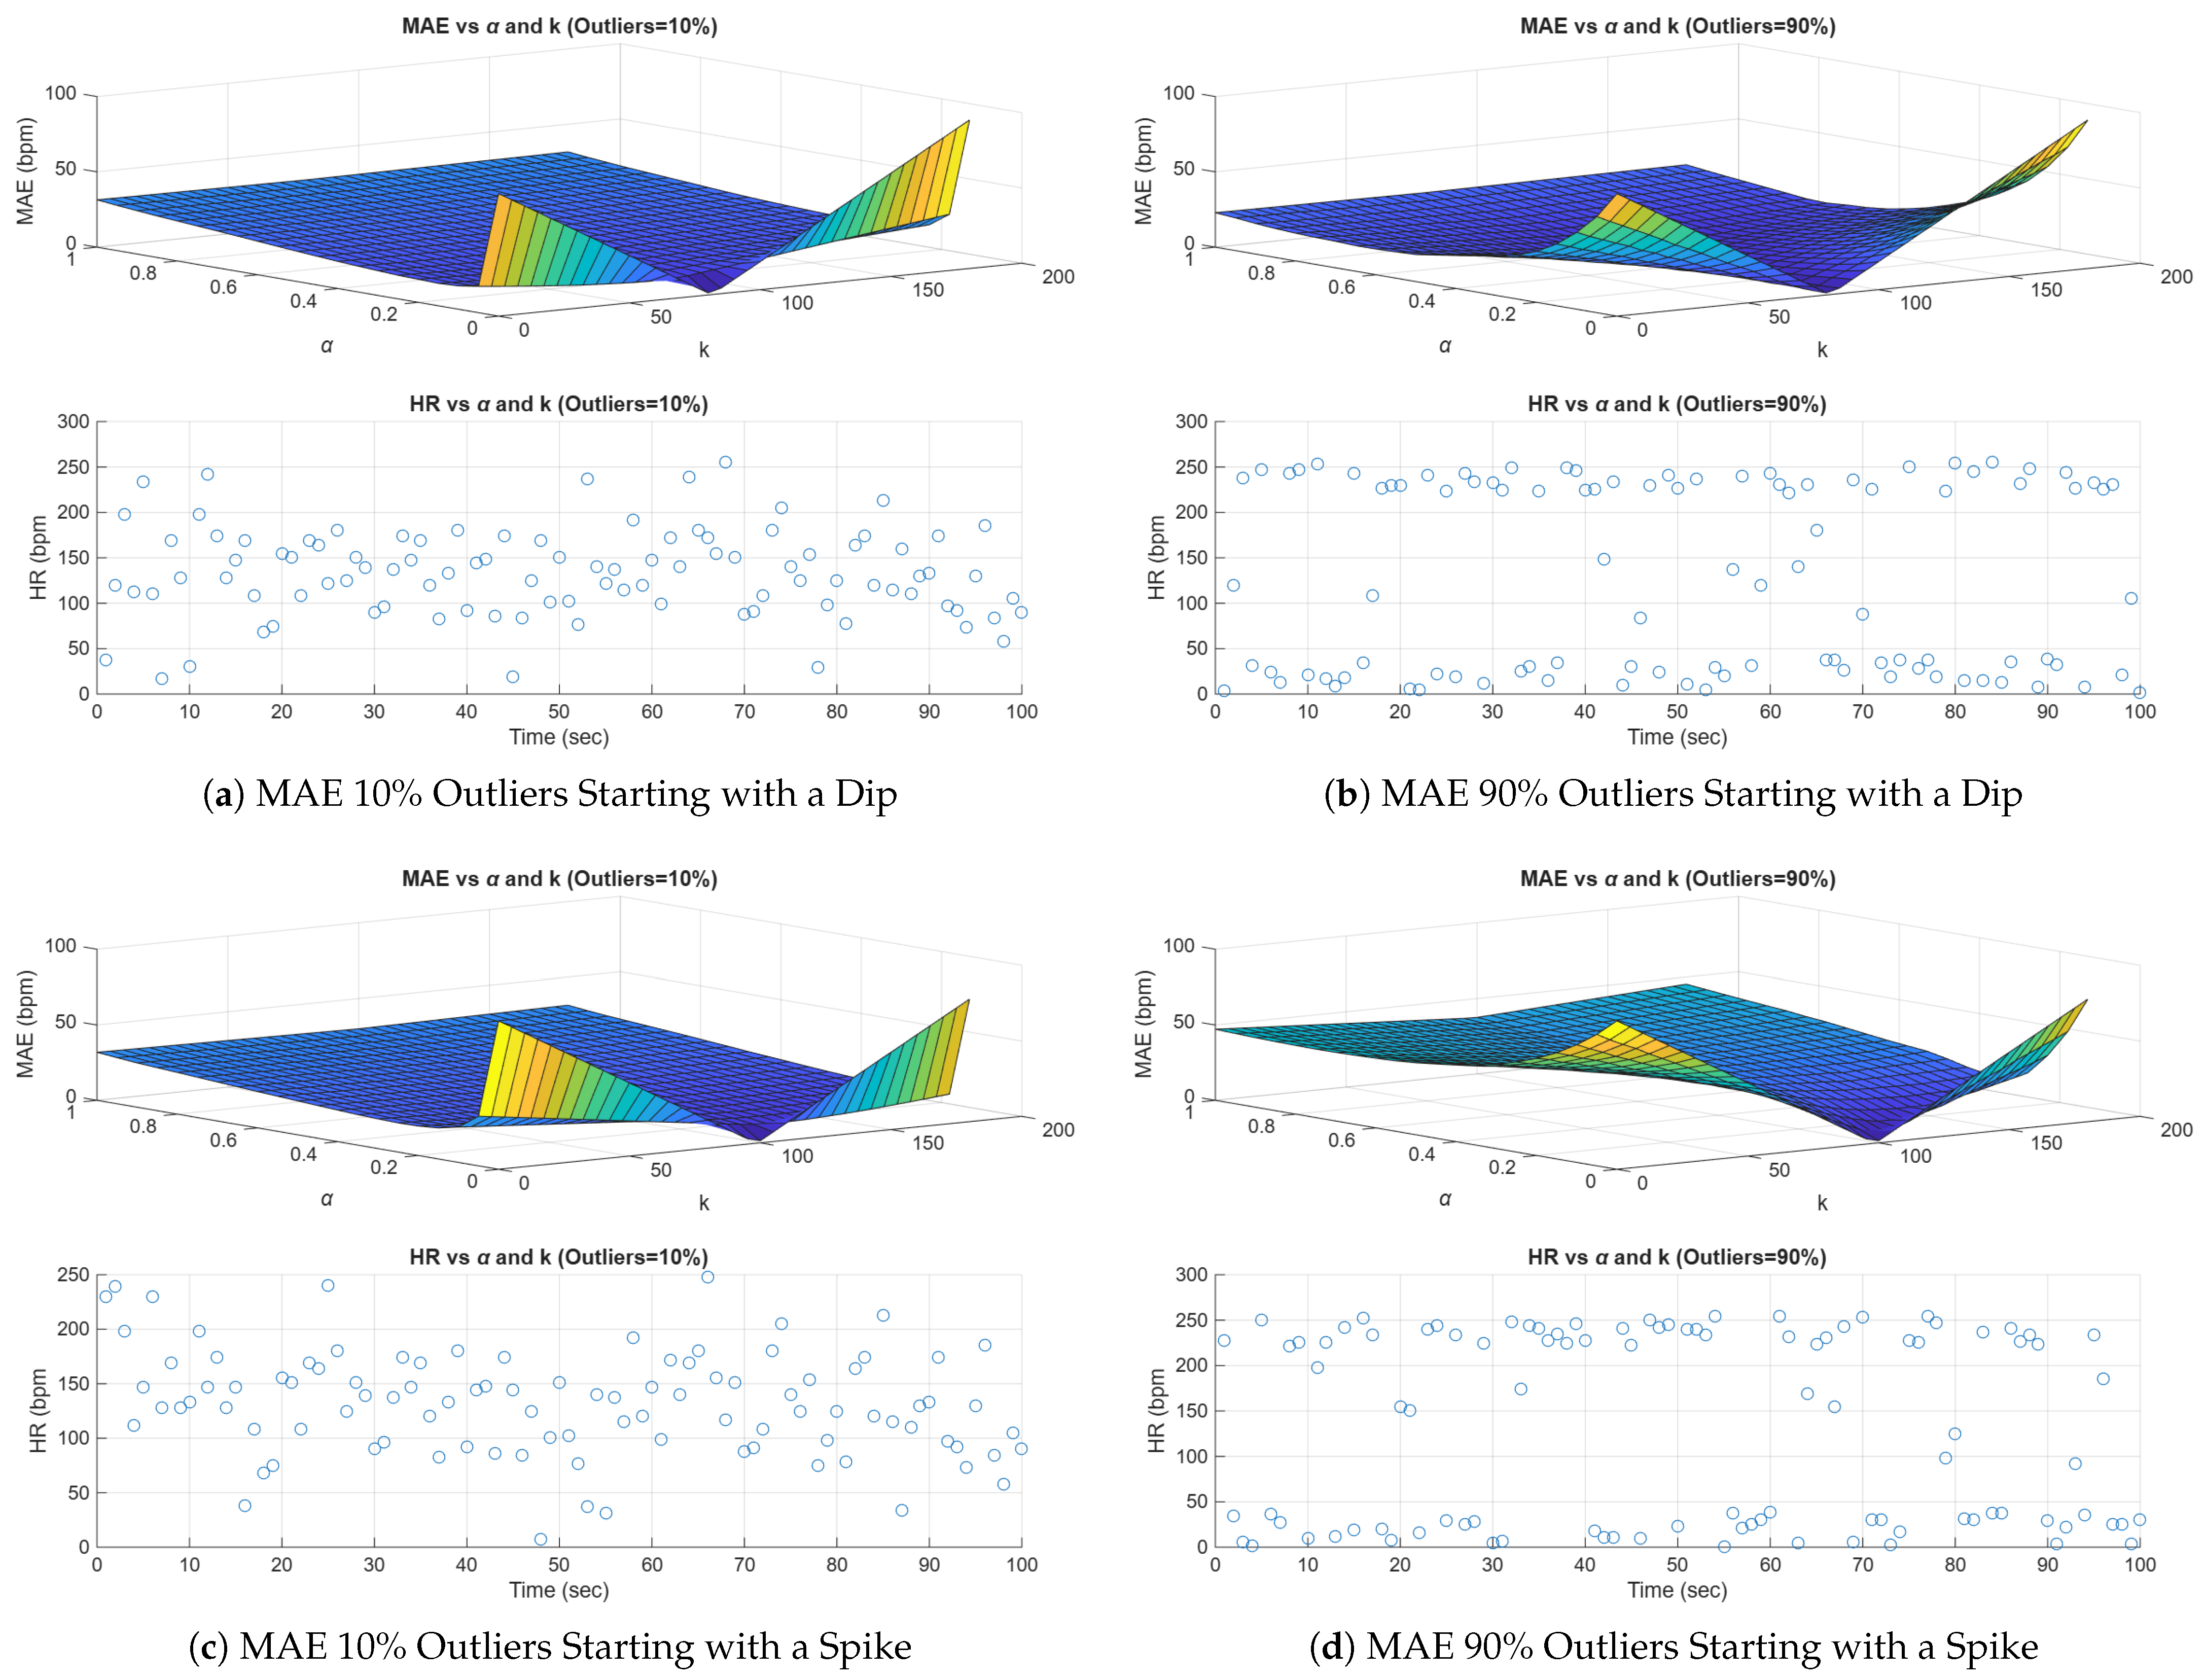
Our previous analysis showed that the first HR value processed by Algorithm 3 significantly influences the EMA behavior, especially for small values. Therefore, we conducted additional experiments in which the first HR sample received by the system was intentionally corrupted with either a dip or a spike outlier. Figure 13 shows the results of the experiments. Figure 13a,b show the MAE surfaces for datasets with and outliers, respectively, when the first HR value is a dip. Similarly, Figure 13c,d show the corresponding results when the first HR value is a spike outlier.
Figure 13.
Ablation study of k and using modified HR dataset with first HR value a dip or spike. The color gradient indicates the magnitude of the MAE, transitioning from dark blue/darker-shaded regions (lowest error) to yellow/light-shaded regions (highest error).
All four figures exhibit similar MAE surface patterns, showing that the influence of k is strongly dependent on the first HR value processed by Algorithm 3. The figures also show that the algorithm is more sensitive to k at smaller values of , especially at , where the EMA output remains fixed at the initialization value determined by the first HR sample.
For the first-dip experiments shown in Figure 13a,b, the MAE is proportional to , where 120 corresponds to the first HR value in the original dataset without outliers. Consequently, the MAE surfaces approach the same trend as the no-outlier case (Figure 12a) near , because . Similarly, the first-spike experiments shown in Figure 13c,d exhibit MAE behavior proportional to , causing the MAE surfaces to approach the no-outlier trend near , because .
Nevertheless, all figures show that the initialization effect diminishes rapidly as increases. For approximately and , the MAE surfaces transition into a smoother and approximately linear trend, indicating that the EMA becomes increasingly dominated by incoming HR samples rather than the initialization value. Therefore, we selected as a conservative bootstrap offset with limited influence on the long-term EMA behavior.
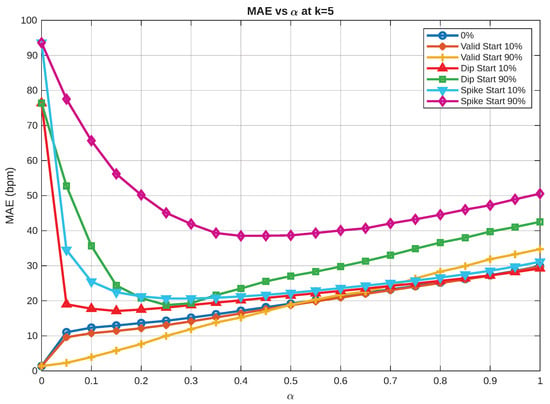
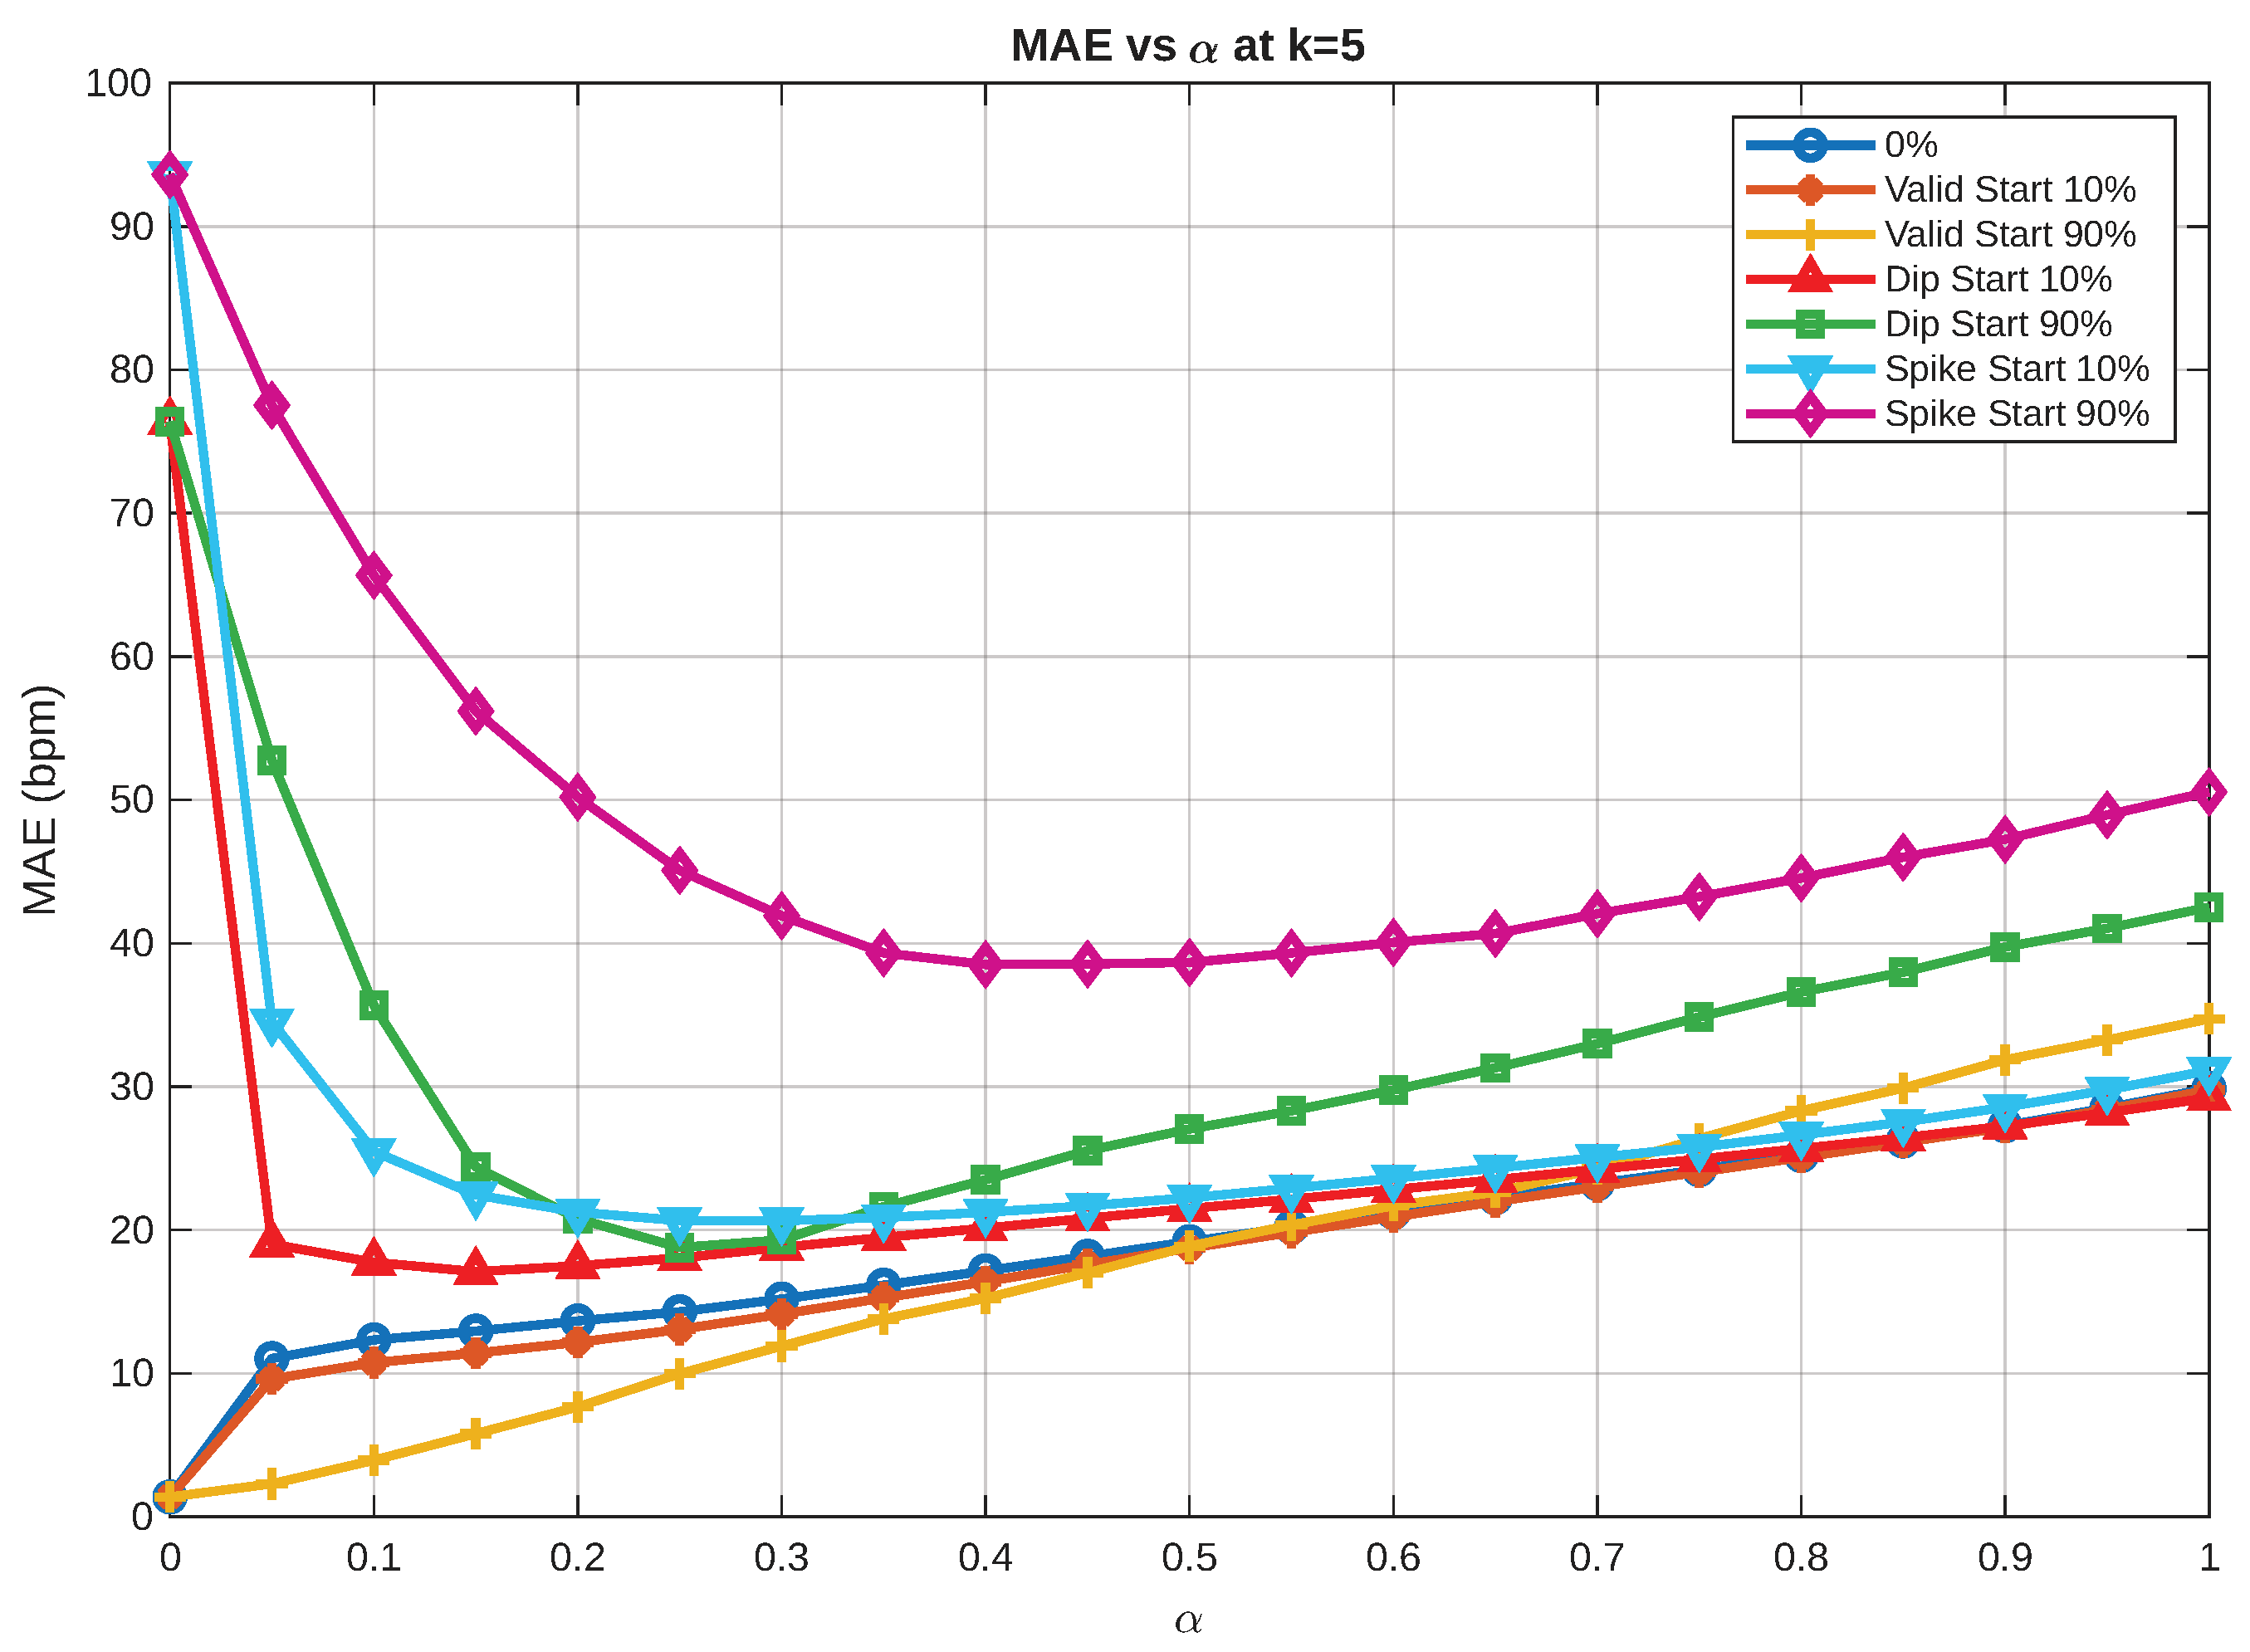
To determine a suitable value for , we investigated MAE for different values of at . Figure 14 shows the result of this investigation. It shows that the MAE curves for multiple noisy scenarios (including spike and dip outliers) reach a low stable operating region for approximately . Based on this observation, we selected because it consistently provided low MAE across both clean and corrupted HR streams while maintaining stable filtering behavior.
Figure 14.
MAE for different values at .
5.4.2. Comparative Analysis with Commercial Smartwatch
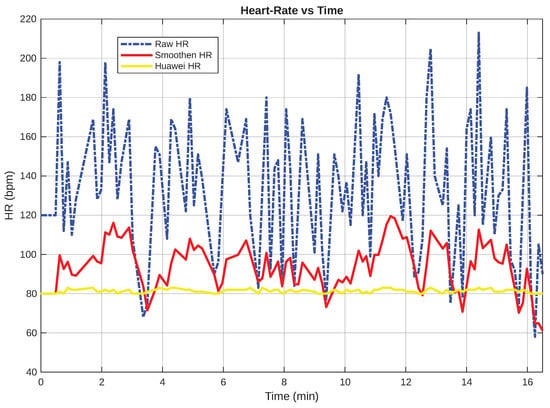
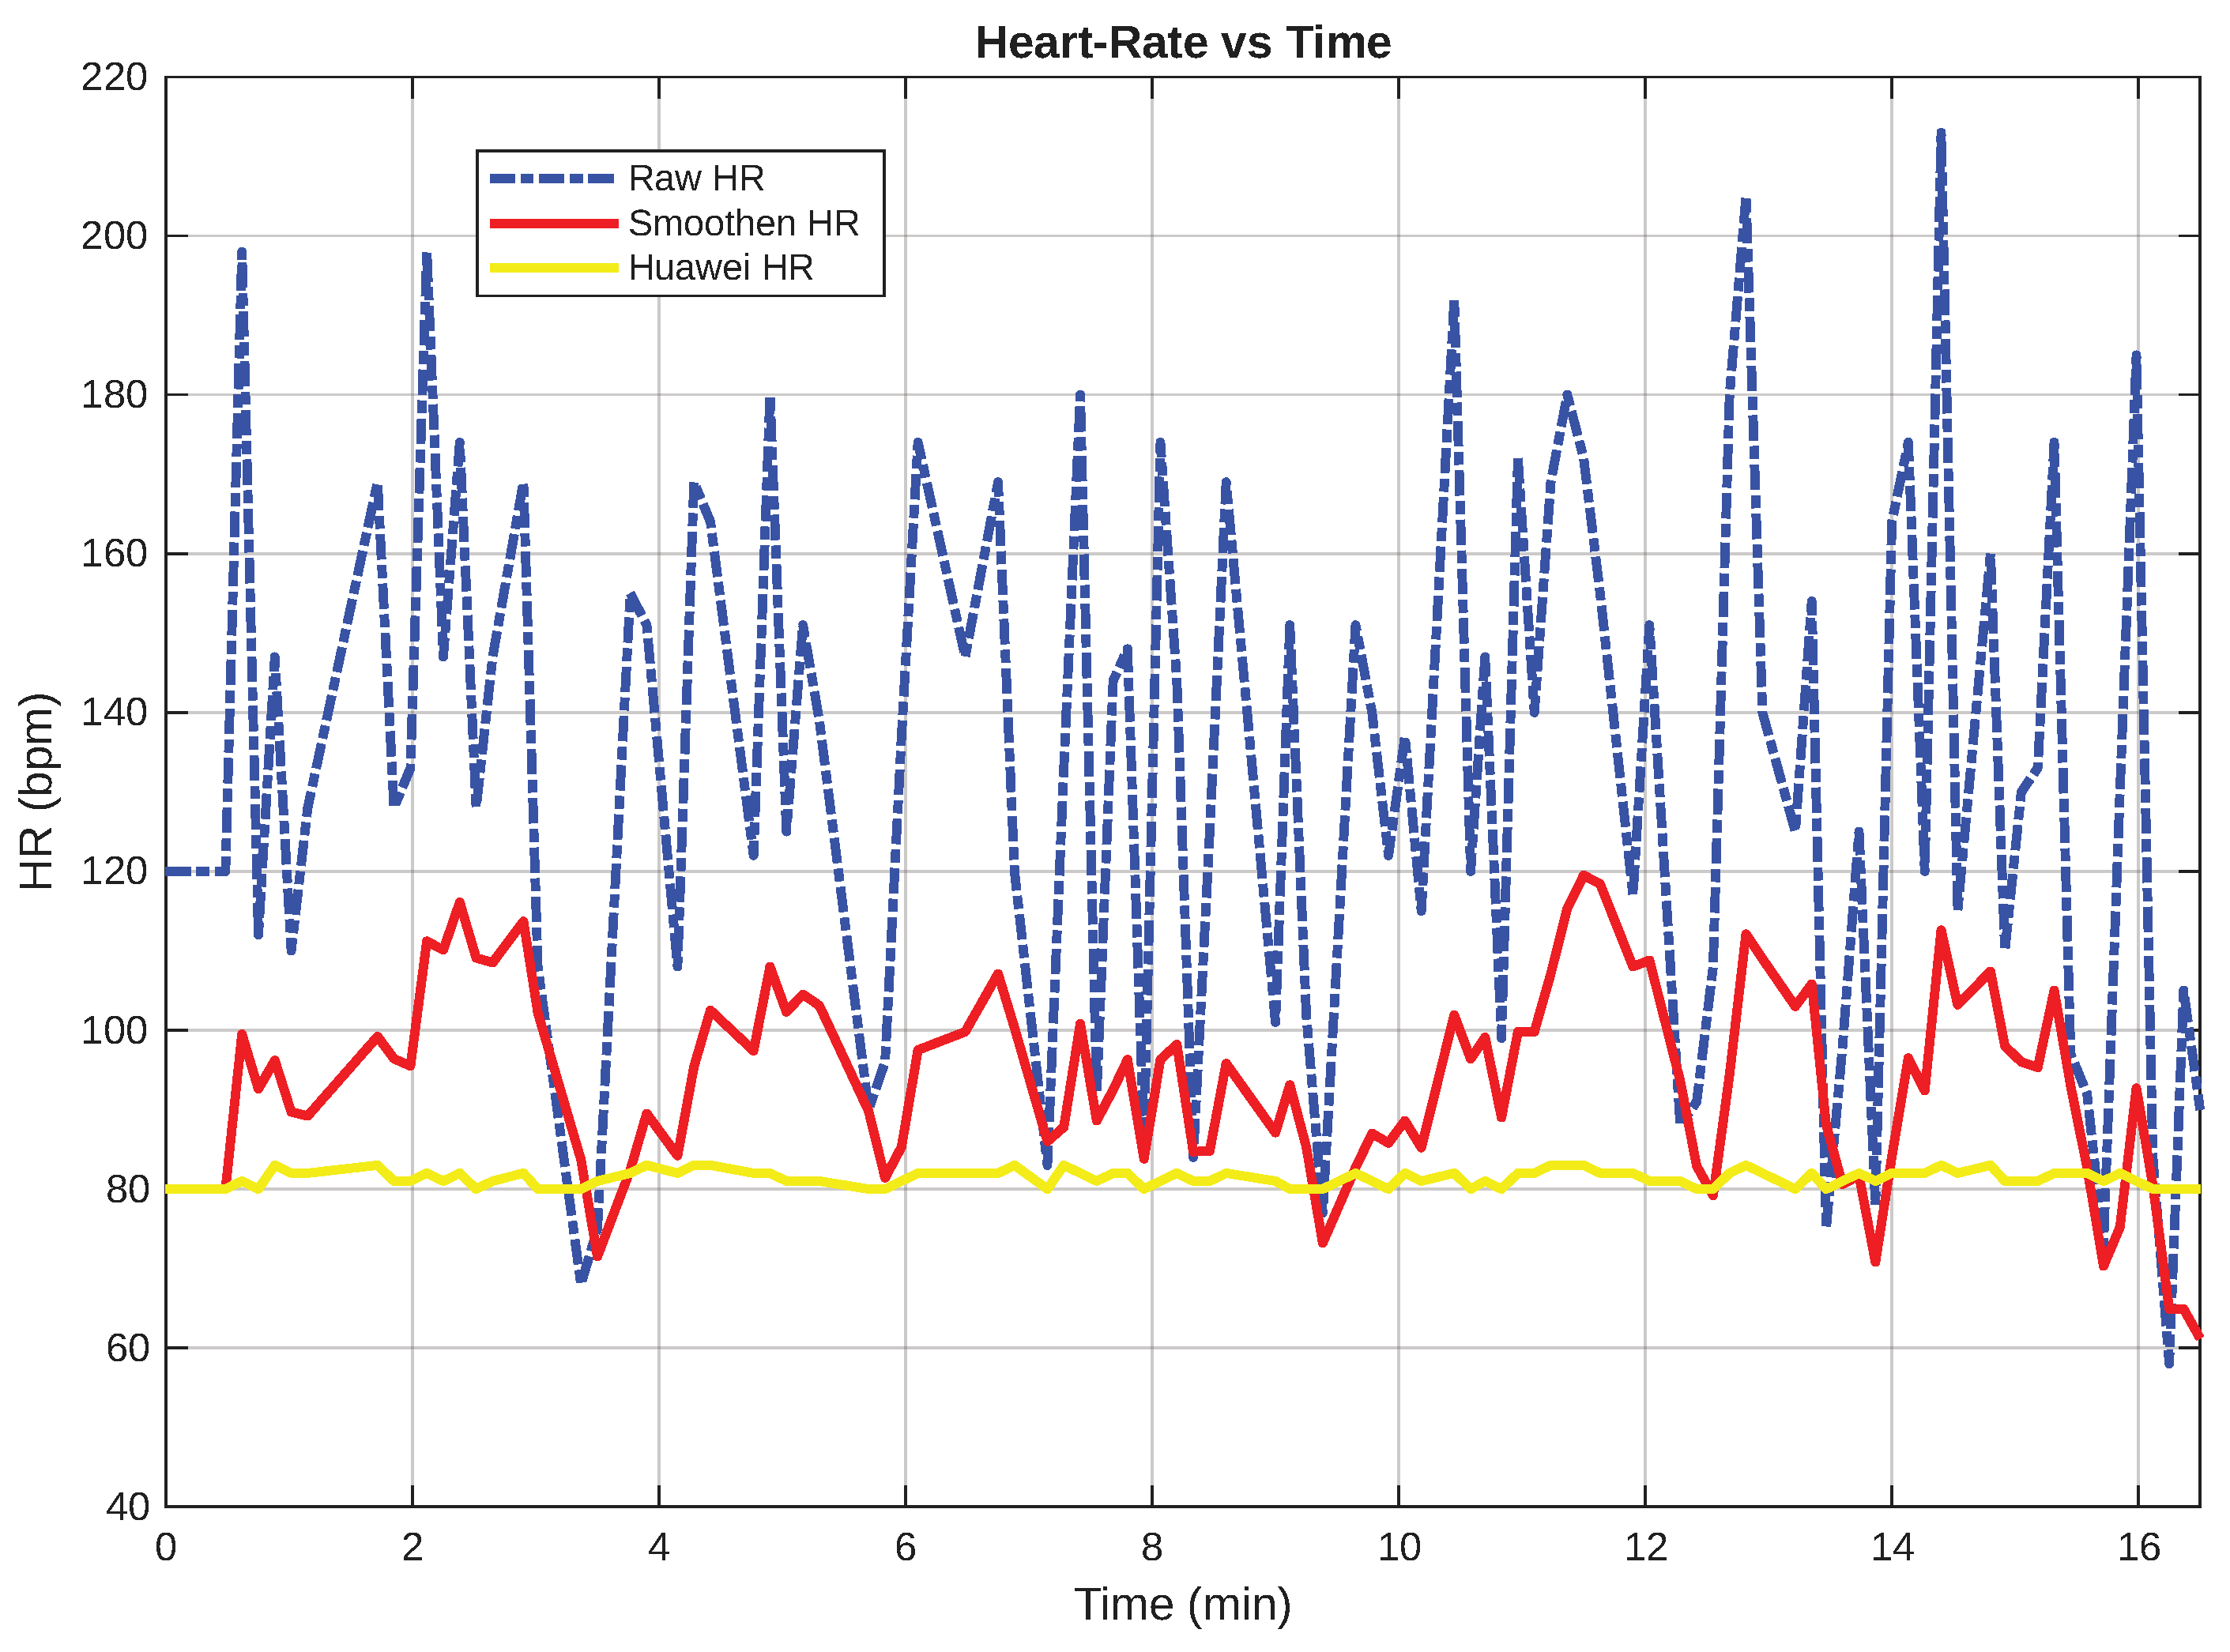
A side-by-side comparison of the HR values obtained by the two devices during the continuous monitoring is shown in Figure 15. The proposed clean and smoothing algorithm uses and settings. The comparison plot shows three traces for HR: raw HR (blue) represents the raw value from the PineTime watch, which is also since no value is outside the valid range; Smoothed HR (red) represents s, which is raw HR after cleaning and smoothing; and the HR from the Huawei watch (yellow). The raw HR data is highly variable and noisy, jumping from around 60 bpm to above 210 bpm throughout the monitoring period. This raw HR data is full of spikes and drops characteristic of optical PPG sensor limitations, including motion artifacts, poor skin contact, and interference from ambient light. These fluctuations would cause false alarms, leading to unreliable information for medical decision-makers.
Figure 15.
HR comparison between Huawei Smart Watch and PineWatch (cleaned and smoothed).
The red trace shows the drastic improvement achieved by applying our proposed system, including outlier removal and exponential moving average smoothing, as presented in Algorithm 2. The smoothed PineTime result shows significant noise reduction, with values remaining within the physiologically realistic range of 70–120 bpm (in most monitoring sessions). This stabilization improves the suitability of the HR stream for qualitative trend monitoring over time.
The yellow trace from the Huawei Smart Watch serves as a reference for evaluating our PineTime’s output. The more advanced sensor hardware and proprietary algorithms of the Huawei device yield more stable results, with values fluctuating between 80 and 85 bpm for most of the monitoring. In practice, this means a low-cost, open source smartwatch, such as PineTime, can serve as a useful complementary health-monitoring device with sufficient data processing. Although the processed PineTime data is not as accurate as that from high-end commercial devices, it serves as motivation for good data processing, including for consumer IoT devices.
Table 4 compares the performance of the proposed system in terms of Mean, MAE, RMSE, and r under different HR dataset conditions. Seven experiments were conducted using modified HR datasets, as shown in the second column of the table. “No Outliers” represents the original HR dataset without injecting outliers. “First Valid (10% Outliers)” and “First Valid (90% Outliers)” represent datasets with 10% and 90% uniformly distributed outliers, respectively, where the first HR sample remains valid. “First Spike (10% Outliers)” and “First Spike (90% Outliers)” represent datasets with uniformly distributed outliers in which the first HR sample is an artificially high spike. Similarly, “First Dip (10% Outliers)” and “First Dip (90% Outliers)” represent datasets where the first HR sample is an artificially low dip.
Table 4.
Comparison of the proposed system (at , ) on different datasets.
The mean HR value of the Huawei smartwatch dataset is 81.38 bpm. As expected, the No Outliers experiment and the experiments with lower outlier rates (10%) produce mean HR values closer to the Huawei reference than the experiments with 90% outliers. The experiments with high outlier rates (the First Spike (90% Outliers) and First Dip (90% Outliers) cases) exhibit substantially larger deviations from the reference HR stream. In general, the first-spike experiments have much higher mean values than their first-dip counterparts. Although 10% outliers and the No Outlier experiments have similar mean HR values, the MAE, RMSE, and r provide a more comprehensive assessment of our system’s performance. The No Outliers experiment achieves the strongest correlation with the Huawei smartwatch () and generally lower error metrics than the spike- and dip-based experiments. It suggests that the processed PineTime HR stream shows moderate trend-level agreement with the reference device under stable conditions.
Even though the First Valid (10% Outliers) experiment achieves slightly lower MAE and RMSE values, its lower correlation coefficient suggests weaker trend alignment with the Huawei reference. This fall in performance is exacerbated as the proportion of injected outliers increases to 90%, the error metrics increase substantially, and the correlation coefficient approaches zero, indicating a significant degradation in agreement with the reference HR stream. The spike- and dip-based experiments further demonstrate that extreme abnormal values can bias the resulting HR statistics and reduce temporal consistency with the Huawei measurements.
Finally, the results show relatively high MAE values across all evaluated configurations. This observation is consistent with prior studies reporting substantial measurement errors from low-cost PineTime smartwatches. Sowiński et al. [40] reported an MAE of 19.39 bmp for raw PineTime measurements and 13.72 bmp when applying a moving-average filter, while a dedicated machine learning correction model reduced the error to 8.19 BPM. These findings highlight the inherent challenges associated with obtaining accurate HR measurements from low-cost optical PPG sensors and suggest that a significant portion of the observed error originates from the sensing device itself rather than the communication architecture. Consequently, the proposed system should be viewed as an edge-computing framework for stabilizing and distributing HR streams rather than as a replacement for dedicated HR-correction algorithms. In its current form, the system is best suited for non-critical healthcare or general wellness monitoring applications.
6. Limitations and Considerations
Despite the promising results presented in Section 5, the proposed system still has several limitations. First, the PineTime optical HR sensor is highly sensitive to motion artifacts, particularly during vigorous movement. Although the proposed smoothing and cleaning algorithm mitigates some of these effects, it cannot remove them completely. As a result, users performing high-intensity physical activities may still produce more inaccurate HR readings.
Second, the proposed algorithm introduces additional delay due to its processing stages and smoothing operations. For most monitoring applications, this delay is negligible. However, it may become problematic in systems that require immediate feedback or strict real-time response. Therefore, the trade-off between accuracy and latency must be carefully considered based on the target application’s requirements.
Finally, battery life remains an important consideration. Continuous HR monitoring and wireless data transmission can significantly increase power consumption. Although the ESP32 and the PineTime watch are relatively power-efficient, the overall system could be made more energy-efficient through additional power-management strategies, such as adaptive sampling, duty cycling, or sleep modes.
7. Conclusions and Future Work
This project shows that the PineTime, a consumer-grade wearable device, can be integrated into low-cost edge-based monitoring systems using edge-level processing. Our proposed system mitigates several common issues in optical HR sensing, namely noise, outliers, and flash artifacts. The resulting HR stream exhibits improved temporal stability and reduced extreme fluctuations, allowing the system’s use in non-critical healthcare monitoring, fitness training, scientific research, and safety applications.
Additionally, the results show that an edge-computing-based distributed system design is a practical and flexible approach, in which the PineTime gathers the information, the ESP32 transmits it, and the PC saves and visualizes the data. With a one-way latency as low as 3.10 ms, this configuration enables real-time monitoring and supports higher-order processing. The system also ensures scalability by using a two-tier edge layer, where additional gateways can be deployed as the number of IoT devices increases, allowing them to convey data to the edge server via Wi-Fi, which offers greater bandwidth than BLE.
Future work will focus on improving the intelligence, scalability, and accessibility of the proposed system. Advanced machine learning techniques will be incorporated into the system to enhance outlier detection using larger datasets. In addition, the system will be extended to support multiple PineTime devices simultaneously for group monitoring scenarios. Finally, cloud connectivity and mobile application support will also be investigated to enable remote monitoring, real-time alerts, historical data access, and easier data sharing with caregivers or healthcare providers.
Author Contributions
Conceptualization, M.M.H., B.A. and F.A.; methodology, M.M.H. and N.T.; software, M.M.H.; validation, F.A.; formal analysis, M.M.H., N.T. and F.A.; investigation, M.M.H., N.T. and F.A.; resources, M.M.H. and F.A.; data curation, M.M.H.; writing—original draft preparation, M.M.H. and N.T.; writing—review and editing, F.A.; visualization, M.M.H., N.T. and F.A.; supervision, B.A. and F.A.; project administration, B.A.; funding acquisition, B.A. All authors have read and agreed to the published version of the manuscript.
Funding
The APC was funded by the Applied Research Center for Nonprofit and Social Development, King Fahd University of Petroleum & Minerals (KFUPM) under the grant number FADL2486.
Institutional Review Board Statement
Not applicable.
Informed Consent Statement
Not applicable.
Data Availability Statement
The data generated from the server application is available at https://github.com/moazzemhossain/PineWatchData.git (accessed on 2 June 2026).
Acknowledgments
The authors would like to acknowledge all support provided by the Applied Research Center for Non-Profit and Social Development and King Fahd University of Petroleum & Minerals (KFUPM).
Conflicts of Interest
The authors declare no conflicts of interest.
Abbreviations
The following abbreviations are used in this manuscript:
| AF | Atrial Fibrillation |
| AI | Artificial Intelligence |
| BLE | Bluetooth Low Energy |
| BPM/bpm | Beats Per Minute |
| CSV | Comma-Separated Values |
| EC | Edge Computing |
| ECG | Electrocardiogram |
| E2E | End-to-End |
| EMA | Exponential Moving Average |
| ESP32 | Espressif 32-bit Microcontroller |
| GATT | Generic Attribute Profile |
| HR | Heart Rate |
| HRP | Heart Rate Profile |
| HRV | Heart Rate Variability |
| IoT | Internet of Things |
| JSON | JavaScript Object Notation |
| LPDDR4X | Low-Power Double Data Rate 4X |
| MAE | Mean Absolute Error |
| MQTT | Message Queuing Telemetry Transport |
| OHSW | Open-Hardware and Open-Software Wearables |
| PC | Personal Computer |
| PPG | Photoplethysmography |
| QoS | Quality of Service |
| r | Pearson correlation coefficient |
| RAM | Random Access Memory |
| RLS | Recursive Least Squares |
| RMSE | Root Mean Square Error |
| RTT | Round-Trip Time |
| SSD | Solid-State Drive |
| UI | User Interface |
| USB | Universal Serial Bus |
| Wi-Fi | Wireless Fidelity |
References
- Pascale, R.; Tudose, D.; Ţurcanu, T. Open Hardware and Software Smartwatch. In Proceedings of the 2024 23rd RoEduNet Conference: Networking in Education and Research (RoEduNet), Bucharest, Romania, 19–20 September 2024; pp. 1–5. [Google Scholar] [CrossRef] [Scilit]
- Bhat, G.; Deb, R.; Ogras, U.Y. OpenHealth: Open-Source Platform for Wearable Health Monitoring. IEEE Des. Test 2019, 36, 27–34. [Google Scholar] [CrossRef] [Scilit]
- Hamid, T.; Helm, K.; Choi, H.; Park, J.; Kendell, C.; Cummings, S.; Messe, S.; Modri, S.; Lee, I.; Weimer, J.; et al. Raproto: An Open-Source Platform for Rapid Prototyping with Wearable Devices. In Proceedings of the 2024 IEEE 20th International Conference on Body Sensor Networks (BSN), Chicago, IL, USA, 15–17 October 2024; pp. 1–4. [Google Scholar] [CrossRef] [Scilit]
- Dismore, L.; Montague, K.; Carvalho, L.; Guerreiro, T.; Jackson, D.; Guan, Y.; Walker, R. A protocol for the evaluation of a wearable device for monitoring of symptoms, and cueing for the management of drooling, in people with Parkinson’s disease. PLoS ONE 2023, 18, e0280727. [Google Scholar] [CrossRef] [Scilit] [PubMed]
- Kim, K.B.; Baek, H.J. Photoplethysmography in Wearable Devices: A Comprehensive Review of Technological Advances, Current Challenges, and Future Directions. Electronics 2023, 12, 2923. [Google Scholar] [CrossRef] [Scilit]
- Suriyan, K.; Ganesh, S.; Palaniyammal, P.; Priya, G.; Singh, V. Recent Trends in Edge Computing: Challenges and Opportunities. In Building Data-Driven Edge Systems for Business Success; IGI Global: Hershey, PA, USA, 2026; pp. 323–344. [Google Scholar] [CrossRef] [Scilit]
- Mahmood, G.G.; Sacco, P.; Carabin, G.; Mazzetto, F. Farm-Level Operational Monitoring in Smart Agriculture: Review and Classification Framework. Sustainability 2026, 18, 419. [Google Scholar] [CrossRef] [Scilit]
- Ahmed, Z.R.; Askar, S.; Hussein, D.H.; Ibrahim, M.A. Fog Computing Challenges and Opportunities in IoT Networks: A Review. Procedia Comput. Sci. 2025, 259, 1749–1764. [Google Scholar] [CrossRef] [Scilit]
- Kumar, N.; Jaiprakash, S.P.; Prakash, C.S. Introduction to Cloud, Fog, and Edge Computing in Healthcare. In Integrating Cloud, Fog, and Edge Computing in Healthcare: Federated Learning and Blockchain Approaches: Harnessing Distributed Technologies for Enhanced Healthcare Delivery; Springer Nature Switzerland: Cham, Switzerland, 2026; pp. 1–15. [Google Scholar] [CrossRef] [Scilit]
- Liu, Y.H.; Chen, L.C.; Guo, Y.S.; Lin, H.J. Validation of blood pressure measurement using a smartwatch in patients with acute ischemic stroke. Medicine 2025, 104, e42899. [Google Scholar] [CrossRef] [Scilit] [PubMed]
- Wasilewska, K.; Rumiński, J. Analysis of the Accuracy of Pulse Estimation Using Smart Watches. In Proceedings of the 2018 11th International Conference on Human System Interaction (HSI), Gdansk, Poland, 4–6 July 2018; pp. 519–525. [Google Scholar] [CrossRef] [Scilit]
- ISO 81060-2:2018; Non-Invasive Sphygmomanometers—Part 2: Clinical Investigation of Intermittent Automated Measurement Type. International Organization for Standardization (ISO): Geneva, Switzerland, 2018. Available online: https://www.iso.org/obp/ui/en/#iso:std:iso:81060:-2:ed-3:v1:en (accessed on 16 February 2026).
- Ra, H.K.; Ahn, J.; Yoon, H.J.; Yoon, D.; Son, S.H.; Ko, J. I am a “Smart” watch, Smart Enough to Know the Accuracy of My Own Heart Rate Sensor. In Proceedings of the 18th International Workshop on Mobile Computing Systems and Applications, New York, NY, USA, 21–22 February 2017; HotMobile’17. pp. 49–54. [Google Scholar] [CrossRef] [Scilit]
- Ahn, J.; Ra, H.K.; Yoon, H.J.; Son, S.H.; Ko, J. On-Device Filter Design for Self-Identifying Inaccurate Heart Rate Readings on Wrist-Worn PPG Sensors. IEEE Access 2020, 8, 184774–184784. [Google Scholar] [CrossRef] [Scilit]
- Tu, L.; Huang, J.; Bi, C.; Xing, G. FitBeat: A Lightweight System for Accurate Heart Rate Measurement during Exercise. In Proceedings of the 2017 IEEE International Conference on Smart Computing (SMARTCOMP), Hong Kong, China, 29–31 May 2017; pp. 1–8. [Google Scholar] [CrossRef] [Scilit]
- Rahman, M.J.; Nemati, E.; Rahman, M.M.; Nathan, V.; Vatanparvar, K.; Kuang, J. Automated assessment of pulmonary patients using heart rate variability from everyday wearables. Smart Health 2020, 15, 100081. [Google Scholar] [CrossRef] [Scilit]
- Tison, G.H.; Sanchez, J.M.; Ballinger, B.; Singh, A.; Olgin, J.E.; Pletcher, M.J.; Vittinghoff, E.; Lee, E.S.; Fan, S.M.; Gladstone, R.A.; et al. Passive detection of atrial fibrillation using a commercially available smartwatch. JAMA Cardiol. 2018, 3, 409–416. [Google Scholar] [CrossRef] [Scilit] [PubMed]
- Chandel, V.; Mukhopadhyay, S.; Jaiswal, D.; Jani, D.S.; Khandelwal, S.; Pal, A. C2P: An Unobtrusive Smartwatch-Based Platform for Automatic Background Monitoring of Fatigue. In Proceedings of the First International Workshop on Human-Centered Sensing, Networking, and Systems, Delft, The Netherlands, 5 November 2017; HumanSys’17. pp. 19–24. [Google Scholar] [CrossRef] [Scilit]
- Pine64. PineTime—Pine64.org. 2021. Available online: https://pine64.org/documentation/PineTime/ (accessed on 13 February 2026).
- Selinger, S.; Dimitrijevic, L. Tree-Based Regressors for Predicting Energy Expenditure from Heart Rate in Wearable Devices. In Proceedings of the Fourteenth International Conference on Adaptive and Self-Adaptive Systems and Applications, Barcelona, Spain, 24–28 April 2022. [Google Scholar]
- Vázquez, F.M.; Seepold, R.; Gutiérrez, D.V.; del Río Guerra, M.S.; Madrid, N.M. Development of a research-oriented application for the acquisition, analysis, and export of sleep metrics from smartwatches. Procedia Comput. Sci. 2025, 270, 5250–5259. [Google Scholar] [CrossRef] [Scilit]
- InfiniTime. Infinitimeorg/InfiniTime: Firmware for Pinetime Smartwatch Written in C++ and Based on FreeRTOS. 2026. Available online: https://github.com/InfiniTimeOrg/InfiniTime (accessed on 18 February 2026).
- Nanjing TianYiHeXin Electronics Co., Ltd. HRS3300 Heart Rate Sensor Datasheet; Nanjing TianYiHeXin Electronics Co., Ltd.: Nanjing, China, 2026. [Google Scholar]
- Bluetooth SIG. Heart Rate Profile; Bluetooth Special Interest Group (SIG): Kirkland, WA, USA, 2011. [Google Scholar]
- Quincozes, S.; Emilio, T.; Kazienko, J. MQTT Protocol: Fundamentals, Tools and Future Directions. IEEE Lat. Am. Trans. 2019, 17, 1439–1448. [Google Scholar] [CrossRef]
- Leśniewski, M. PicoMQTT: MQTT Broker and Client Library for ESP8266 and ESP32. 2025. Available online: https://github.com/mlesniew/PicoMQTT (accessed on 2 June 2026).
- Powell, R. H2zero/Nimble-Arduino: A Fork of the Nimble Library Structured for Compilation with Arduino, for Use with ESP32, nrf5x. 2025. Available online: https://github.com/h2zero/NimBLE-Arduino (accessed on 21 February 2026).
- PSF. Time-Time Access and Conversions. 2026. Available online: https://docs.python.org/3/library/time.html (accessed on 2 June 2026).
- Nelson, B.W.; Low, C.A.; Jacobson, N.; Areán, P.; Torous, J.; Allen, N.B. Guidelines for wrist-worn consumer wearable assessment of heart rate in biobehavioral research. npj Digit. Med. 2020, 3, 90. [Google Scholar] [CrossRef] [Scilit] [PubMed]
- Sports Medicine. Heart Rate: Sports Medicine: UC Davis Health. 2026. Available online: https://health.ucdavis.edu/sports-medicine/resources/heart-rate (accessed on 2 June 2026).
- Robergs, R.A.; Landwehr, R. The surprising history of the “HRmax=220-age” equation. J. Exerc. Physiol. 2002, 5, 1–10. [Google Scholar]
- PSF. Datetime—Basic Date and Time Types. 2026. Available online: https://docs.python.org/3/library/datetime.html (accessed on 2 June 2026).
- Hossain, M.M. PineTime and Huawei HR BPM Dataset. 2025. Available online: https://github.com/moazzemhossain/PineWatchData.git (accessed on 14 December 2025).
- Pine64. Hardware—PineTime—PINE64. 2025. Available online: https://pine64.org/documentation/PineTime/Hardware/ (accessed on 11 December 2025).
- Huawei. Watch GT 2 Pro Specs. 2021. Available online: https://consumer.huawei.com/sa/community/details/topicId-111796/ (accessed on 2 June 2026).
- Bogár, B.; Pető, D.; Sipos, D.; Füredi, G.; Keszthelyi, A.; Betlehem, J.; Pandur, A.A. Detection of Arrhythmias Using Smartwatches—A Systematic Literature Review. Healthcare 2024, 12, 892. [Google Scholar] [CrossRef] [Scilit] [PubMed]
- Liu, X.; Fan, J.; Guo, Y.; Dai, H.; Xu, J.; Wang, L.; Hu, P.; Lin, X.; Li, C.; Zhou, D.; et al. Wearable Smartwatch Facilitated Remote Health Management for Patients Undergoing Transcatheter Aortic Valve Replacement. J. Am. Heart Assoc. 2022, 11, e023219. [Google Scholar] [CrossRef] [Scilit] [PubMed]
- Niu, Y.; Wang, H.; Wang, H.; Zhang, H.; Jin, Z.; Guo, Y. Diagnostic validation of smart wearable device embedded with single-lead electrocardiogram for arrhythmia detection. Digit. Health 2023, 9, 20552076231198682. [Google Scholar] [CrossRef] [Scilit] [PubMed]
- Safjan, K. Kaggle Evaluation Metrics Used for Regression Problems. 2019. Available online: https://safjan.com/kaggle-evaluation-metrics-used-for-regression-problems/ (accessed on 2 June 2026).
- Sowiński, P.; Rachwał, K.; Danilenka, A.; Bogacka, K.; Kobus, M.; Dąbrowska, A.; Paszkiewicz, A.; Bolanowski, M.; Ganzha, M.; Paprzycki, M. Frugal Heart Rate Correction Method for Scalable Health and Safety Monitoring in Construction Sites. Sensors 2023, 23, 6464. [Google Scholar] [CrossRef] [Scilit] [PubMed]

Disclaimer/Publisher’s Note: The statements, opinions and data contained in all publications are solely those of the individual author(s) and contributor(s) and not of MDPI and/or the editor(s). MDPI and/or the editor(s) disclaim responsibility for any injury to people or property resulting from any ideas, methods, instructions or products referred to in the content. |
© 2026 by the authors. Licensee MDPI, Basel, Switzerland. This article is an open access article distributed under the terms and conditions of the Creative Commons Attribution (CC BY) license.