


Abstract
Late fusion can combine the outputs of separately trained RGB and thermal detectors without retraining them. We evaluate such training-free fusion, together with a rule-based reliability-aware controller that adapts per-frame thresholds and modality weights, on M3FD, FLIR-aligned, and FLIR ADAS v2. Box-level COCO metrics on the registered M3FD and aligned FLIR-aligned pairs are the primary results, and frame-level class-set metrics are secondary. At the operating threshold of 0.35, fixed fusion of two YOLOv8n detectors raised AP50 over the thermal detector from 0.319 to 0.377 on M3FD and from 0.623 to 0.666 on FLIR-aligned (from 0.724 to 0.758 over all detections down to a confidence of 0.001). Over all detections, the FLIR-aligned gain was 0.0198 to 0.0345 over three training seeds, 0.0168 when the detectors were trained for 60 instead of 30 epochs, and 0.0222 with larger YOLOv8m detectors (AP50 from 0.797 to 0.819); the 60-epoch and YOLOv8m results are single runs and do not show whether the gain decreases for better detectors. With YOLOv8m, fusion still raised AP50 but lowered box-level F1 at the operating threshold of 0.35 used for all systems, a reduction observed at this single operating point. On the unregistered FLIR ADAS v2 pairs, fusion lowered AP50, and its frame-level gain depends on how the frame label is defined. On the same detections, our single-score ProbEn-style rule was 0.092 AP50 below fixed fusion; published results obtained with other detectors and evaluation code are not directly comparable. The controller shifts the operating point toward slightly higher precision and lower recall; a threshold change of fixed fusion reproduces this shift; and at equal recall, fixed fusion is at least as precise, so we report the controller as a negative result. Fusion takes 0.4–1.0 ms per frame on a CPU for detections with a confidence of at least 0.35 and 8.8–9.6 ms when all detections are fused.
1. Introduction
Detecting objects is a central requirement in modern surveillance systems, but visual conditions around a camera are rarely constant. A scene may change with time of day, weather, shadows, glare, partial occlusion, or sensor noise. In such cases, a detector that depends on only one sensing source may miss objects that are important for monitoring or may return uncertain predictions. Object detection itself is a well-established computer vision task, and RGB cameras remain one of the most common sensing choices because they are widely available and informative [1].
RGB frames provide color, texture, shape, and contextual cues that help to separate object categories in difficult scenes [2,3]. However, RGB-only detection is sensitive to changes in illumination, especially in surveillance footage captured at night or under mixed lighting. When fog, glare, or darkness weakens these cues, the detector has less appearance information to rely on, and its predictions become less stable.
Thermal imagery provides another source of evidence because it responds to heat rather than visible light. This can be valuable when the RGB frame is unclear; an object may still stand out in the thermal image if the heat contrast with the background is sufficient [4,5]. However, thermal images are not a complete replacement for RGB. They may miss fine semantic, color, and texture information, and thermal boundaries can be weak when objects have similar heat signatures. Under these conditions, thermal detections may also be uncertain.
RGB–thermal fusion therefore offers a way to use the strengths of both sensing channels [6,7,8]. Existing fusion strategies include fusion at the input, feature, and decision levels [2,3,5,6,7,8]. This paper focuses on decision-level fusion, where the outputs of independently trained RGB and thermal detectors are combined after inference. This choice is practical for deployment because the detector architecture does not need to be redesigned. It also makes the fusion step easier to inspect, as the decision can be related to boxes, confidence scores, class labels, and spatial agreement.
One approach to decision-level fusion is to merge overlapping RGB and thermal detections based on class agreement, confidence score, and spatial overlap. Although this fixed fusion strategy is easy to interpret and useful as a baseline, it cannot respond to changes in the relative quality of the two detector outputs. In some frames, RGB evidence may be clearer than thermal evidence; in others, thermal evidence may provide stronger support when visible detail is degraded. In this paper, reliability means only this relative support of the two branches. Raw detector confidence is treated as an observable cue, not as a probability of correctness, because detector confidences may need explicit calibration before they can be read as probabilities [9,10,11].
We do not propose another jointly trained RGB–thermal detector. Instead, we ask what training-free fusion of two independently trained detectors actually achieves when it is measured with one fully specified protocol, and whether it can be made adaptive with nothing more than the information available after inference. For the second question, we treat fusion as a post-inference arbitration problem. A training-free controller scores each branch from its detection confidence and detection count, checks whether the two branches agree on the top class, and adapts the per-frame thresholds and modality weights before the final fusion. These scores serve only to rank and adjust the two branches.
Output-level fusion has several practical consequences. First, the fusion stage is training-free: it requires no access to intermediate feature representations and no joint multimodal retraining. Second, the RGB and thermal detector branches remain independent and, therefore, can be trained, calibrated, updated, or replaced separately. Third, the resulting fusion decisions remain traceable to explicit detector outputs rather than being distributed across learned cross-modal feature representations. These are properties of the design rather than a methodological contribution. Whether they cost accuracy compared with learned fusion, as well as whether detector outputs carry enough information for adaptive arbitration, has to be tested.
This leads to four questions: How much does training-free late fusion gain over the single modalities, and where does the gain come from? When is box-level fusion of the two outputs valid? Does reliability-aware arbitration add anything beyond the choice of an operating threshold? And how does training-free fusion compare with other output-level fusion operators and with published RGB–thermal detectors? We study these questions on FLIR ADAS v2, M3FD, and FLIR-aligned [4,7,12] with four settings: RGB-only detection, thermal-only detection, conventional fixed RGB–thermal fusion, and reliability-aware RGB–thermal fusion (Figure 1). All four are evaluated on the same paired frames with the same protocol, both per frame and per box. Box-level metrics on the registered M3FD pairs and the aligned FLIR-aligned pairs are our primary results. Frame-level class-set metrics, as well as all results on FLIR ADAS v2, whose RGB and thermal images are not registered, are secondary.
Figure 1.
Workflow of the four evaluated settings (S1–S4). Each setting has its own evaluation output, and all four are scored with the same protocol; box-level metrics on the registered pairs of M3FD and FLIR-aligned are the primary results, and frame-level metrics are secondary. The shaded region marks the contribution of this work, a common evaluation of training-free output-level fusion (S3, S4) that shows where the gains come from and when box-level fusion is valid. S4, the reliability-aware controller, is reported as a negative result.
The main contributions of this paper are as follows:
- An evaluation protocol for training-free output-level fusion of independently trained RGB and thermal detectors that others can reproduce. It uses COCO-style box-level metrics on registered or aligned pairs as the primary measure, defines frame-level class-set metrics (micro-averaged and per-frame means) explicitly as a secondary measure, and adds precision–recall curves, thresholds selected by grouped cross-fitting, and cluster-bootstrap confidence intervals. We apply it to M3FD, FLIR-aligned, and FLIR ADAS v2.
- An account of where the gain of late fusion comes from. Box-level fusion improves AP50 only on registered or aligned pairs (at the operating threshold of 0.35, M3FD: from 0.319 to 0.377; FLIR-aligned: from 0.623 to 0.666) and lowers it on the unregistered FLIR ADAS v2 pairs (from 0.333 to 0.255). On M3FD, a misregistration of 2–5% of the image width is enough to remove the benefit. On FLIR ADAS v2, fixed fusion raises frame-level micro-F1 from 0.808 (thermal only) to 0.865, mainly because the two detectors recover different classes, but this gain depends on how the frame label is defined and falls to 0.007 against the thermal annotations alone.
- A comparison with other output-level fusion operators on identical detector outputs, and with eight published RGB–thermal detectors on FLIR-aligned. Fusing two YOLOv8n detectors without training (AP50 75.8% over all detections) is above two trained fusion methods, but 2.9 to 10.8 points below the strongest fusion networks trained on aligned pairs. These published values were obtained with other detectors and evaluation code, and our own ProbEn-style rule applied to the same detections is 0.092 below fixed fusion. It needs neither paired training data nor a fusion network.
- A documented negative result. The reliability-aware controller shifts the operating point of fixed fusion toward slightly higher precision and lower recall, and a change in the fixed-fusion threshold reproduces this shift. We show why with a decision audit of every frame, decision traces of real frames, component ablations, an 828-setting sensitivity analysis, grouped cross-fitting, three training seeds, detectors trained for 60 epochs, a larger detector (YOLOv8m), and a day/night analysis.
Figure 1 summarizes the four settings and marks what this work contributes, and Figure 2 shows the main findings on real frames.
Figure 2.
The main findings on real frames. (a) RGB (blue) and thermal (orange) detections on a FLIR ADAS v2 pair and the class sets that they recover. Each detector finds three of the five annotated classes, and their union finds all five, so the frame-level recall rises from 3/5 to 5/5. (b) Thermal detections (orange, solid) and RGB detections mapped by normalization (blue, dashed) on an unregistered FLIR ADAS v2 pair and on a FLIR-aligned pair. The boxes coincide only when the images are aligned, so box-level fusion needs registered or calibrated inputs. (c) Frame-level precision–recall curve of fixed fusion on FLIR ADAS v2 for thresholds from 0.05 to 0.95, with fixed fusion at 0.35 (square) and the reliability-aware controller (star). The controller moves the operating point along the curve rather than producing a better curve.
The rest of this paper is organized as follows: Section 2 reviews work on RGB–thermal detection, fusion strategies, and multimodal benchmarks. Section 3 describes the four settings, the datasets and how their images are paired, the detectors, the fusion rules, and the evaluation protocol. Section 4 reports the box-level and frame-level results, the effect of registration, the comparisons with output-level and published methods, and our analysis of the controller. Section 5 discusses the findings and their limits, and Section 6 concludes the paper.
2. Related Work
The literature on RGB–thermal object detection can be organized most clearly by where multimodal interaction occurs and by how much coupling it introduces between the two detector branches. This distinction is important for positioning the present work: the objective here is not to maximize the learned cross-modal representation capacity but to find out what late fusion of independent detector branches achieves, as well as whether it can be made adaptive without losing the ability to inspect each decision.
2.1. RGB–Thermal Complementarity and Fusion Locus
RGB and thermal sensing provide complementary evidence. RGB imagery contributes color, texture, shape, and scene context, but its usefulness can deteriorate under low light, glare, shadows, fog, and related visible-spectrum degradation [2,3]. Thermal sensing depends on emitted radiation rather than visible light and can therefore remain informative when the RGB appearance is weak, although thermal imagery provides less color and fine texture and may become ambiguous when the heat contrast is low [4,5]. This complementarity motivates multimodal systems in which the relative value of the two modalities can change between scenes [6,7,8].
Fusion can be performed at the input/pixel level, inside learned feature representations, or after the detectors have produced their output. Input- and pixel-level approaches combine the modalities before or early in detection and can benefit from complementary image evidence, but they are sensitive to cross-sensor alignment and typically couple the downstream detector with a particular multimodal input design [6,7,13]. Feature-level approaches instead learn cross-modal interaction inside the detector. These methods offer substantially more representational capacity than output-level fusion, but they usually require access to intermediate features, architectural modification, and joint multimodal training. Decision-level fusion occupies the opposite end of this design spectrum: branches can remain independent, while boxes, classes, and confidence scores are combined after inference.
2.2. Learned Cross-Modal Fusion
A large part of recent RGB–thermal research has focused on learned feature interaction. Representative directions include modality-balancing mechanisms [14,15], guided or cross-attention fusion [2,16,17,18,19,20,21], target-aware fusion [3,7], dynamic local/non-local aggregation [22], and deep visible–infrared feature fusion [8,23]. More recent work also incorporates conflict-aware learning, channel resampling, self-calibration, and explicit complementarity modules [24,25,26,27]. Cyclic fuse-and-refine blocks [12], cross-modality transformers [28], channel switching with spatial attention [29], and state-space fusion models [30] follow the same principle. These approaches are well suited to learning rich cross-modal representations and to handling modality imbalance inside the detector, but their fusion behavior is inherently tied to the learned architecture and training procedure.
Transformer-based multispectral detectors extend this direction by using adaptive queries, long-range interaction, or modality-balanced optimization [5,31]. Such models can represent complex cross-modal dependencies and misalignment more flexibly than simple late fusion, but they also increase architectural and training complexity. The comparison with the present work is therefore not a like-for-like contest in representational capacity: learned feature/attention/transformer methods optimize multimodal representations, whereas training-free fusion deliberately leaves those representations inside independently trained detectors unchanged.
2.3. Post-Inference and Reliability-Aware Fusion
Post-inference fusion combines detector outputs rather than internal features. Probabilistic ensembling and box-level methods such as ProbEn and weighted boxes fusion (WBF) demonstrate that useful multi-model integration can be performed after inference without learning a shared multimodal representation [32,33]. Non-maximum suppression and its soft variant [34] can be applied across modalities in the same way. Recent late-fusion work also reinforces the continuing relevance of output-level combination when modularity and simplicity of deployment are priorities [35]. The principal attraction of this family is modularity: individual detectors can be trained, evaluated, updated, or replaced separately. However, a conventional fixed late-fusion rule applies the same thresholds and modality contributions even when the relative support provided by RGB and thermal detections changes from frame to frame.
The present work uses the term reliability explicitly in an operational sense. Raw detector confidence is not assumed to be a calibrated probability; object-detection calibration studies show why such an interpretation can be unsafe [9,10,11]. Instead, the controller combines confidence with a bounded detection count into a dominance score and uses this score, together with top-class agreement, to set post-inference thresholds and weights. The evaluated controller is thus a form of late fusion; unlike a fixed or purely probabilistic ensemble, it adjusts thresholds and weights frame by frame.
2.4. Multimodal Benchmarks and Evaluation Protocols
What a benchmark contains limits what an RGB–thermal comparison can show. FLIR ADAS provides paired RGB and thermal driving footage [4], but many of its pairs are not aligned. Zhang et al. removed the misaligned pairs by hand to obtain FLIR-aligned [12], and most feature-level RGB–thermal detectors now report their results on this subset [3,17,28,29]. M3FD provides registered visible–infrared pairs captured with a synchronized binocular camera system [7], and LLVIP provides aligned low-light pairs [36]. Even so, results are hard to compare across studies, since they differ in splits, class sets, averaging schemes, and evaluation code. Structured multimodal benchmarks with explicitly specified tasks and metrics have also been proposed in other domains—for example, MeniOmni for meniscus-injury assessment from MRI and clinical text [37]. Our evaluation follows the same principle for RGB–thermal detection: all fusion settings are evaluated on the same paired frames with one fully specified protocol.
2.5. Method Positioning and Research Gap
Table 1 summarizes the design space at the level most relevant to this study. The key distinction is whether fusion requires internal multimodal features and joint training, or whether adaptivity can be introduced using detector outputs alone.
Table 1.
Positioning of the evaluated approach within major RGB–thermal and multispectral fusion families. The comparison is methodological; published studies use different datasets, training protocols, classes, and evaluation metrics, except for the FLIR-aligned results compared in Section 4.4.
The gap that we address is a narrow one. Learned RGB–thermal fusion builds strong cross-modal representations, but it ties the fusion to the detector architecture and its training. Conventional late fusion keeps the detectors modular and its decisions easy to trace, yet it is rarely evaluated with the same protocol, data, and metrics as the learned methods, and its frame-level and box-level gains are seldom separated. Much less is known about where the gains of training-free late fusion come from, when box-level fusion is valid, how it compares with other output-level operators and with published detectors, and whether a controller that adapts thresholds and modality weights from the detector outputs adds anything.
This paper tries to close that gap. We do not propose another feature-fusion architecture. Instead, we provide a reproducible evaluation of decision-level fusion that uses only detector outputs, needs no fusion-specific training, keeps both branches replaceable, and makes every decision traceable. The adaptive extension is part of this evaluation, and we report it as a negative result.
3. Materials and Methods
3.1. Overview of the Evaluated Settings
The evaluated methodology is built around a post-inference RGB–thermal fusion pipeline (Figure 1). The RGB and thermal inputs are processed by two independent YOLO-based detector branches, so each branch produces its own bounding boxes, predicted class labels, and confidence scores. The fusion module then works only on these detector outputs. In the fixed setting (S3), detections with the same class and sufficient spatial overlap are merged using predefined modality weights. In the reliability-aware setting (S4), the same outputs are adjusted using confidence, class agreement, spatial overlap, detection count, and dominance gap. This architecture keeps the two detector branches replaceable while giving the fusion stage a way to react to weak or conflicting detections; whether this reaction is useful is tested in Section 4.
The pipeline uses separately trained RGB and thermal detectors and performs fusion after inference, without concatenation at the input level or changes in the detector feature layers [1,38]. Each detector receives its corresponding modality input and produces post-inference detections, including bounding boxes, predicted class labels, and confidence scores. The fusion module operates on these post-inference detections and compares them using class labels, confidence scores, bounding-box overlap, and cross-modal consistency. The two unimodal settings (S1, S2) keep the detections of one branch above the operating threshold. Each of the four settings has its own evaluation output, and all four are evaluated with the same protocol (Section 3.7).
3.2. Datasets
The experiments were conducted on three RGB–thermal datasets—FLIR ADAS v2, M3FD, and FLIR-aligned, which provide paired visible and thermal/infrared imagery for object detection [4,7,12]. FLIR ADAS v2 provides annotated thermal and visible-spectrum frames collected in outdoor driving conditions, where object visibility and illumination may vary [4]. The detectors and the controller were developed on this dataset, but its RGB and thermal images are not registered, so its results are secondary (Section 3.6). Its training split (10,742 thermal and 10,318 RGB images) was used to train the detectors, and its validation split (1144 thermal and 1085 RGB images) contained the 872 RGB–thermal pairs on which all FLIR ADAS v2 results were evaluated.
M3FD provides registered pairs under a different visible–infrared data distribution and is one of the two datasets of the primary box-level evaluation [7]. It provides 4200 registered visible–infrared image pairs of multiple scenarios. Its six annotated classes were mapped to the detector classes (people to person, car to car, bus to bus, truck to truck, lamp to light, and motorcycle to motor), and only these classes were evaluated. The FLIR ADAS v2 detectors were applied to M3FD unchanged; no M3FD image was used for training.
FLIR-aligned is the subset of FLIR ADAS from which misaligned RGB–thermal pairs were removed by hand [12]. It has 4129 training and 1013 test pairs with three classes (person, car, and bicycle), and it is the benchmark on which most published RGB–thermal detectors report their results. We used it as the second dataset of the primary box-level evaluation, to compare training-free fusion with these detectors on the same test split, and to repeat the analysis with training, selection, and evaluation data that are disjoint (Section 3.8).
Pairing and Registration
FLIR ADAS v2 provides separately captured RGB images (Teledyne FLIR Blackfly S camera, 52.8° horizontal field of view; , , or pixels in our paired subset) and thermal images (Tau 2, pixels, 45° horizontal field of view) that are not pixel-registered [4]. We paired the 872 frames of the validation split through the video identifier and frame index in the dataset metadata (out of 1085 RGB and 1144 thermal validation images). No registration, cropping, calibration, or other coordinate transformation was applied: each box was only normalized to within its own image. The frame label of a pair is the union of the class names annotated in its RGB and thermal images; box-level results use the thermal annotations in the thermal image, and results against the RGB annotations are given in the Supplementary Materials. Section 4.6 quantifies how far the normalized RGB and thermal boxes are from each other.
The M3FD pairs ( pixels) were captured with a synchronized binocular optical–infrared system and registered by the dataset authors [7], and FLIR-aligned contained only pairs that were checked to be aligned [12]. Each of these two datasets has one set of annotations, which was used for both the frame labels and the box-level evaluation.
3.3. RGB and Thermal Detection Branches
The detection stage uses two separately trained YOLO-based detectors: one for RGB inputs and one for thermal inputs [1,38,39]. The RGB and thermal branches are treated as independent detectors before fusion. Because the two branches are independent, each detector can be trained and evaluated on its own.
For each input frame or image pair, the RGB detector produces RGB detections and the thermal detector produces thermal detections. Each detection contains a predicted class label, a bounding box, and a confidence score. The fusion module is applied after inference and uses only bounding boxes, class labels, and confidence scores, without relying on internal detector features.
Keeping the two branches separate helps with inspection because a fused detection can be related to the RGB and thermal outputs that produced it. It also keeps the pipeline modular: either detector can be evaluated, recalibrated, or replaced without changing the fusion logic.
3.4. Fixed Decision-Level Fusion Baseline
In the baseline fusion setting, the RGB and thermal detections are combined with a fixed rule that is used in the same way for all samples. For each sample, the method first looks for detections from the two modalities that share the same predicted class and have enough spatial overlap. A matched RGB–thermal pair is then merged into one fused detection.
In the fixed-fusion implementation, bounding boxes are first normalized to the coordinate range of their own image so that detections can be compared even when RGB and thermal image resolutions differ, but this normalization does not register the two views (Section 3.2). Predictions with confidence below 0.35 are removed before fusion. This threshold acts on the original detector confidence. Each remaining confidence score is then multiplied by a modality weight derived from the FLIR ADAS v2 unimodal mAP50 scores: 0.4718 for RGB and 0.5282 for thermal. The weighted detections are grouped by frame and predicted class and then clustered greedily in order of decreasing weighted confidence with a normalized bounding-box IoU threshold of 0.55, so that a cluster can contain detections of either modality. Within each cluster, the fused box is computed as a weighted average of the normalized coordinates, and the fused confidence is set to the maximum weighted confidence in that cluster. A detection that is not clustered with any other detection is kept as a single-modality output with its weighted confidence as the score. Nothing is discarded for lacking a match.
With this baseline, matched detections can support each other through predefined confidence and overlap rules. The limitation is that the rule does not adapt to the relative operational support of the two modality outputs in a particular frame. It is applied uniformly, regardless of RGB visibility, thermal contrast, or object-boundary clarity. For that reason, fixed fusion is a useful controlled baseline, but it is not designed to respond to changes in the quality of the modality.
3.5. Reliability-Aware Controller (Evaluated Rule)
The reliability-aware setting extends fixed decision-level fusion with an output-only reliability-arbitration stage. No feature maps are accessed, and no additional fusion network is trained. Instead, the controller uses quantities that are already available after detector inference. In the following formulation, “reliability” denotes a score computed from the detector outputs and used only to arbitrate between the two branches. It is not a calibrated posterior probability, a confidence-calibration model, or a formal uncertainty estimate. This distinction is important because detector confidence scores can be miscalibrated and, therefore, should not automatically be read as probabilities of correctness [9,10,11]. Consequently, confidence enters the controller as an observable ranking cue and is interpreted jointly with cross-modal agreement, spatial consistency, detection activity, and relative branch dominance. The name reliability-aware describes what the rules were designed to do, not what they achieve. Section 4.8 shows that the score is only weakly related to detection quality and does not identify an unreliable modality, so we call the score of Equation (4) a dominance heuristic, or dominance score, and we report the controller as an evaluated rule with a negative result, not as a proposed method.
All parameters of the controller (gap boundaries, raised thresholds, and weight multipliers; Figure 3) were set by hand during development, on the same frames used for evaluation, and the M3FD values were adjusted on the M3FD evaluation frames in the same way. No independent validation split was used. Section 4.9 tests whether any conclusion depends on these values, including parameters selected by grouped cross-fitting on other videos or frame blocks. All results on FLIR ADAS v2 and M3FD were obtained with the values of Figure 3b, which are the values in the analysis code (the configuration file, controller_config.py, is part of Supplementary Data S2 and S3; the analysis notebooks in Data S3 define the same values, and a script in Data S3 recomputes every controller decision in Data S1 from this file), and all results on FLIR-aligned with the FLIR ADAS v2 values, except for the modality weights, which were set for each detector pair from its held-out validation mAP50 (Section 3.8). The only other exceptions are the variants that are labeled as such: the ablation, the sensitivity grid, and the cross-fitted parameters (Section 4.9), the test of the modality weights (Supplementary Table S1), and the thresholds lowered by 0.349 for AP over all detections (Section 4.2).
Figure 3.
The reliability-aware controller. (a) Decision rules. The frame-level top-class agreement test of Equation (5) compares only the two top classes of the frame and selects thresholds and weight multipliers; boxes are paired only in the detection-level clustering step (same class, IoU ≥ 0.55). (b) Parameter values used on FLIR ADAS v2 and M3FD; for M3FD, the weight multipliers depend on which modality is dominant. FLIR-aligned uses the FLIR ADAS v2 values, except for the modality weights , which are set for each detector pair from its held-out validation mAP50 (Section 3.8). Panel (a) was rendered with Graphviz from a description that follows the implemented code path, and the table in (b) was generated automatically from the controller configuration that produced all reported results and the modality weights of Section 3.4; both sources are provided in the Supplementary Materials.
3.5.1. Detection Sets and Branch-Level Dominance Score
For modality , where R and T denote the RGB and thermal branches, respectively, the detector output for a paired frame is written as
where is the normalized bounding box, is the predicted class, is the detector confidence, and is the number of detections saved for the frame (all detections with a confidence of at least 0.05). The statistics of Equations (2)–(4) are computed from all of these saved detections, of every detector class, and not only from those that pass the base threshold introduced below. On FLIR-aligned, where all detections down to a confidence of 0.001 are kept for COCO-style AP (Section 3.8), the statistics are computed from the detections with a confidence of at least 0.05, both at the operating threshold and for AP over all detections, so that and are the same in both evaluations. The detection-count term is bounded to prevent dense or noisy frames from dominating the score:
The top confidence and the corresponding top class are
If a branch does not produce a detection, is set to zero and is undefined. The branch-level dominance score is then
where controls the contribution of the bounded detection-count term. For FLIR ADAS v2, . For M3FD, the implemented setting is slightly thermally biased, with and . The frame-level semantic agreement indicator is
which requires both branches to produce a detection. A frame in which one branch has no detection counts as a disagreement. The dominant branch d and the weaker branch w are selected from the relative scores,
Thus, measures the strength of the frame-level dominance of a modality, and ties () go to the RGB branch.
3.5.2. Design Rationale and Measured Behavior of the Operational Cues
The controller combines cues that answer different questions about the two detector outputs, rather than treating any single signal as a complete measure of reliability. Top confidence describes the strongest prediction of a branch, and the bounded count indicates whether that output is sustained or isolated. Agreement checks whether both branches support the same dominant class, pairwise consistency checks whether that support occurs at compatible locations, and the dominance gap sets how strongly the controller reacts when the branches disagree. Table 2 summarizes this mechanism-level rationale, together with the behavior of each cue measured in Section 4.
Table 2.
Design rationale of the operational cues, their known limitations, and their behavior measured in this study (Section 4.6, Section 4.8 and Section 4.9).
The cues were meant to complement each other. The pair gives branch-level evidence, A gives a coarse frame-level semantic check, gives spatial and semantic support at the detection level, and sets the strength of the response. No single cue was meant to decide on its own. In practice, however, the top confidence dominates the score (Section 4.8).
Table 2 gives the intended role of each cue, and its last column shows how each cue actually behaves in our data. The ablation in Section 4.9 shows that the whole effect of the controller on frame-level micro-F1 comes from the threshold adjustment; this metric depends only on the predicted class sets and cannot show an effect of the weights, and at the box level the raised thresholds and the weight multipliers each change AP50 by less than 0.003.
3.5.3. Cross-Modal Consistency and Dynamic Arbitration
Frame-level dominance is complemented by detection-level consistency. Two detections u and v, of the same or of different branches, are considered compatible when they predict the same class and their normalized boxes have sufficient spatial overlap:
This pairwise condition is the local consistency check that is used when forming class-specific fusion clusters. The top-class indicator in Equation (5) provides the corresponding frame-level semantic check. It only selects thresholds and weights, and it never pairs boxes.
The common base confidence threshold is . When the two branches agree, the base threshold is retained for both branches. When they disagree, the weaker branch is filtered more conservatively according to the dominance gap, whereas the dominant branch keeps .
The dominance-gap cutoffs are fixed at and for both datasets. Accordingly, is treated as a small gap, as a moderate gap, and as a large gap. The weaker-branch threshold is therefore written as
For FLIR ADAS v2, , so a small gap leaves the weaker branch at ; for M3FD, the corresponding values are . The weight of each branch is scaled by a multiplier that depends on its role (dominant or weaker), on agreement, and on the gap band. For the dominant and the weaker branch, respectively,
For FLIR ADAS v2, the multipliers are the same for both modalities: and on agreement, , and . For M3FD, they also depend on which modality is dominant. On agreement, RGB is multiplied by 1.00 and the thermal branch by 1.03. When RGB is dominant, it is multiplied by 1.05 in every gap band and the thermal branch by 1.00. When the thermal branch is dominant, it is multiplied by and RGB by in the small, moderate, and large gap bands. Overall, the dominant branch is up-weighted by multipliers of up to 1.12, and the weaker branch is down-weighted by multipliers as low as 0.45; Figure 3 lists all values. The multipliers are therefore also applied when the top classes agree, and they differ between the two datasets. The gap boundaries are shared by the two datasets, whereas the count coefficients, the raised thresholds, and the weight multipliers are dataset-specific. Together with the stricter weaker-branch confidence threshold, this provides a bounded and interpretable response to modality conflict. The operational arbitration mechanism changes only the post-inference operating weights and thresholds; it does not calibrate the detector confidences or estimate predictive uncertainty, and the underlying RGB and thermal detectors remain unchanged.
3.5.4. Reliability-Adjusted Box Fusion
The fixed-fusion modality weights are and . Reliability arbitration produces an effective modality weight
where if and otherwise. The order of the operations matters. The thresholds of Equation (8) are applied to the original confidence , before any weighting, so a detection enters the fusion only if its own confidence reaches the threshold of its branch. Only then is the weighted confidence used: to order the detections for clustering, to weight the box average of a cluster, and as the fused score. Detections that survive the modality-specific confidence thresholds are grouped by predicted class and clustered using Equation (7): the detections of a class are visited in order of decreasing , and each detection that is not yet assigned starts a cluster with all unassigned detections v for which . For a cluster , the fused normalized box is computed as
and the fused confidence is
A detection that is not clustered with a detection of the other modality is kept as a single-modality output with its weighted confidence as the score. Such boxes make up 97.6% of the fused boxes on FLIR ADAS v2 and 55.0% on M3FD. Detections that pass their branch thresholds and match across modalities are combined, whereas a detection of the weaker branch must pass a stricter threshold before it can influence the final output, even when it has a partner in the other branch. Importantly, every quantity in Equations (1)–(13) is observable from detector outputs or is an explicit fusion parameter, which preserves the traceability of the decision process. Algorithm 1 and Figure 3 summarize the complete procedure.
| Algorithm 1 Reliability-aware post-inference RGB–thermal fusion of one paired frame. |
|
3.6. Baseline Settings and Evaluation Protocol
Performance is evaluated under four settings: (1) RGB-only detection, using visible-light detector outputs only; (2) thermal-only detection, using thermal detector outputs only; (3) fixed RGB–thermal fusion; and (4) reliability-aware RGB–thermal fusion.
The RGB-only baseline shows the behavior of a detector that relies on visual appearance cues such as color, texture, shape, and scene context. The thermal-only baseline shows the behavior of detection based mainly on heat contrast. Fixed fusion then combines RGB and thermal detections with one predefined decision-level rule across all samples. This setting is included to determine whether the reliability-aware rule adds value beyond simple post-inference fusion. Finally, the reliability-aware fusion setting tests whether adjusting the fusion decision using operational output-derived cues changes the fusion behavior relative to RGB-only, thermal-only, and fixed fusion settings. The same detector outputs are used in all cases; the controller changes only the post-inference decision. All fusion settings use the same base confidence threshold of 0.35 and the same normalized bounding-box IoU clustering threshold of 0.55, ensuring that fixed fusion and reliability-aware fusion are compared under the same base fusion conditions.
Output-Level Fusion Operators: To compare fixed fusion and the controller with the closest existing methods, we applied weighted boxes fusion (WBF) [33], cross-modal non-maximum suppression (NMS), Soft-NMS [34], and a ProbEn-style Bayesian fusion [32] to exactly the same saved detector outputs, paired frames, fusion IoU (0.55), and modality weights, and we evaluated them with the same code. WBF, NMS, and Soft-NMS used the implementation released with [33], with the two branches as the two models. ProbEn needs class posteriors, which are no longer available after YOLO post-processing, so we implemented its fusion rule in single-score form. Within each cluster, the highest-scoring detection of each modality was fused with Bayes’ rule under conditional independence and a uniform prior, and the boxes were averaged with the scores as weights. All other parameters were left at their defaults. Section 4.2 and Section 4.3 therefore compare these implementations under one shared setting, not the best performance that each method can reach; tuned parameters, or the original ProbEn with class posteriors, may perform better.
Statistical Analysis: Frames of the same video (FLIR ADAS v2) or with neighboring frame indices (M3FD, FLIR-aligned) are correlated, so all confidence intervals are 95% percentile intervals of a cluster bootstrap with 1000 resamples [40] over the 12 FLIR ADAS v2 videos, 84 blocks of 50 consecutive M3FD frames, or 15 blocks of 100 consecutive FLIR-aligned frame indices. For differences between two systems, the paired per-frame results were resampled jointly. The p-values come from a cluster sign-flip test on the per-frame F1 differences. All differences were computed from unrounded values.
Selection by Grouped Cross-Fitting: When a threshold or a controller parameter is selected from data, it is selected on videos or frame blocks other than those on which it is evaluated [41]: the FLIR ADAS v2 frames are split into four folds of videos and the M3FD frames into five folds of 50-frame blocks, the parameters are chosen on the other folds to maximize micro-F1, and the results of the held-out folds are pooled.
Primary and Secondary Results
The primary results of this study are the box-level metrics on the two datasets whose RGB and thermal images are registered or aligned: M3FD and FLIR-aligned. On FLIR-aligned, the training, selection, and evaluation data are also disjoint, so this dataset additionally serves for the comparison with published detectors and for the robustness checks (training seeds, training length, and detector size).
Frame-level class-set metrics are secondary. They do not use box geometry, but on FLIR ADAS v2 the frame label is the union of the annotations of two images that are paired only through metadata and may differ in viewpoint and time (Section 3.2). A frame-level gain on this dataset therefore depends partly on the label, and box-level fusion is not valid on its unregistered pairs (Section 4.6). All FLIR ADAS v2 results are therefore secondary, although the detectors and the controller were developed on this dataset. The M3FD results test whether the fusion behavior is repeated under a different visible–infrared data distribution, not zero-shot transfer of detector weights or strict parameter-free generalization from FLIR ADAS v2.
Several fusion constants are shared across the two evaluations: the base confidence threshold , the normalized clustering threshold , the detection-count normalizer , and the dominance-gap cutoffs . The dominance score, the dynamic weaker-branch thresholds, and the weight multipliers, however, are dataset-specific. FLIR ADAS v2 uses with small/moderate/large weaker-branch thresholds , whereas M3FD uses with thresholds . The M3FD asymmetry reflects the observed stronger thermal branch in that evaluation. Because these M3FD-specific operating parameters are not identical to the FLIR ADAS v2 values, the M3FD results of the controller are not a strict zero-adaptation cross-dataset transfer result. Section 4.9 also reports results for the FLIR ADAS v2 configuration applied unchanged to M3FD.
3.7. Evaluation Metrics
We used detector-level metrics for the RGB-only and thermal-only branches, and frame-level class-set metrics and box-level metrics for all four settings.
Detector-Level Metrics: The unimodal precision, recall, mAP50, and mAP50-95 in Section 4.1 are those of the Ultralytics validator [38] on the full validation split of each modality (1085 RGB and 1144 thermal images) at the validator’s own settings. They characterize the trained detectors and are not comparable with the fusion metrics on the 872 paired frames.
Frame-Level Metrics: For frame i, let be the set of class names annotated in the frame (FLIR ADAS v2: the union of the classes annotated in the RGB and in the thermal image of the pair; M3FD: the annotated classes mapped to the detector classes; FLIR-aligned: the annotated classes), and let be the set of class names with at least one output detection. Because every operator considered here fuses detections class by class, is the union of the classes that pass the threshold of either branch, unless a threshold is applied to the fused scores (Section 4.3). The per-frame counts are
and the per-frame precision, recall, and F1 are
When both sets are empty, ; otherwise, a ratio with a zero denominator is set to 0. No box matching is involved. Over the N frames of a dataset, the micro-averaged metrics pool the counts,
so that F1 equals of the reported precision and recall, whereas the per-frame means
do not satisfy this identity. The tables in Section 4.5 report the micro-averaged metrics of Equation (16) as the main frame-level metric, with the pooled counts, and the mean per-frame F1 as a labeled secondary column. Top-1 agreement uses the class of the highest-scoring output detection of frame i (weighted score for the fusion settings):
where a frame without output counts as a miss. A frame with several annotated classes therefore counts as correct when its top class is any one of them.
Box-Level Metrics: Predictions are matched one-to-one, in order of decreasing score, to ground-truth boxes of the same class with
with at most 100 detections per image as in pycocotools [42]. With the interpolated precision of class k as a function of recall at the IoU threshold t, and the set of evaluated classes,
evaluated with the 101-point interpolation of COCO. AP50 and AP75 are and , and AP50:95 is the mean of over . Box-level precision, recall, and F1 at IoU 0.5 are computed from the pooled matches at the operating threshold. Our implementation gives the same AP50 and AP50:95 as pycocotools in every configuration that we cross-checked. FLIR ADAS v2 outputs were evaluated against the thermal annotations, M3FD outputs against its registered annotations, and FLIR-aligned outputs against its annotations; all systems of a dataset are evaluated on the same paired frames.
These metrics are consistent with common object-detection evaluation practice [43].
3.8. Implementation Details
We implemented two separately trained YOLO-based detectors: one for RGB inputs and one for thermal inputs. Each detector outputs bounding boxes with predicted class labels and associated confidence scores. The fusion module operates only on post-inference detector outputs. It does not access the internal feature maps of the detectors and does not modify the detector architecture.
The RGB and thermal branches used the same main detector configuration to keep the branch comparison controlled. Both branches were trained with YOLOv8n pretrained weights for 30 epochs at image size 640, batch size 8, four workers, deterministic seed 0, automatic mixed precision enabled, and the automatic optimizer setting. The main optimization and augmentation settings included an initial learning rate of 0.01, final learning-rate factor of 0.01, momentum of 0.937, weight decay of 0.0005, warmup for 3 epochs, mosaic augmentation enabled during training with close-mosaic at the final 10 epochs, and horizontal flipping probability of 0.5. The checkpoint saved by Ultralytics as best.pt (best validation fitness) was used: the last epoch (30) for the thermal detector and epoch 28 for the RGB detector. The detector validation setting used IoU = 0.70 and maximum detections = 300. For fusion, the predictions of each detector were saved down to a confidence of 0.05 (NMS IoU 0.70, at most 300 detections per image). The post-inference fusion settings were kept fixed across the compared fusion methods: confidence threshold = 0.35, normalized bounding-box IoU clustering threshold = 0.55, RGB fixed-fusion weight = 0.4718, thermal fixed-fusion weight = 0.5282, detection-count normalization , dominance-gap cutoffs , and the dataset-specific thresholds and weight multipliers listed in Figure 3.
Fixed fusion uses modality weights for RGB and thermal detections based on the FLIR ADAS v2 unimodal mAP50 scores of the selected checkpoints (0.364 and 0.408). The resulting weight is 0.4718 for RGB and 0.5282 for thermal. The weighted confidence of each detection is defined as the detector confidence multiplied by the corresponding modality weight. Reliability-aware fusion uses the same post-inference structure, but it adjusts the effective modality weights and confidence thresholds according to operational arbitration cues: top detection confidence, normalized detection count, cross-modal top-class agreement, and the RGB–thermal dominance gap. For FLIR ADAS v2, detection-count scaling is applied equally to both modalities. For M3FD, the dominance score is slightly biased toward the thermal branch because the thermal detector showed stronger behavior in the M3FD evaluation. Specifically, the M3FD count coefficients, raised thresholds, and weight multipliers are dataset-specific, while the common base threshold, IoU clustering rule, and dominance-gap cutoffs remain unchanged.
FLIR-Aligned Detectors: The RGB and thermal detectors for FLIR-aligned were trained with the same recipe (COCO-pretrained YOLOv8n, 640 px, 30 epochs, batch 8; Ultralytics 8.4.31) on 3762 of its 4129 training pairs. The other 367 pairs (every tenth block of 100 consecutive frame indices) were held out to select the checkpoints and to set the modality weights (RGB 0.425, thermal 0.575, from the held-out validation mAP50). No test pair was used for any choice, and the controller kept its FLIR ADAS v2 configuration. Following common practice for COCO-style AP, all detections down to a confidence of 0.001 were kept, and AP was computed with pycocotools over the 8591 person, car, and bicycle objects of the 1013 test pairs (objects of other classes are ignored). For AP over all detections, all thresholds of the controller were lowered by 0.349, so that it received the same candidate detections as the other systems (confidence ≥ 0.001), while its frame statistics were still computed as in Section 3.5.1. It did not, however, keep the same range of detections: the base threshold and the threshold of the weaker branch at a small gap became 0.001, but when the top classes disagreed and the gap was moderate or large, the weaker branch kept a threshold of 0.101 or 0.201. For the seed-0 YOLOv8n detectors, this happened in 46 of the 1013 test frames, and the controller output 3.0% fewer fused detections than fixed fusion (156,552 against 161,327). To test robustness, both detectors were retrained with seeds 1 and 2, each detector pair receiving its own modality weights from the held-out pairs, and the seed-0 detectors were also trained for 60 epochs with the same recipe (in every run, the learning-rate schedule spanned the whole training, and mosaic augmentation was switched off for the last 10 epochs). To test a larger detector, both detectors were also trained as COCO-pretrained YOLOv8m (25.9 M parameters, against 3.0 M for YOLOv8n) with the same recipe, data, and seed; their modality weights from the held-out pairs were 0.439 (RGB) and 0.561 (thermal).
Runtime Measurement: The fusion step was timed frame by frame on the CPU of a Colab instance (Intel Xeon, 2.0 GHz, single thread) over all frames, with frame-by-frame code that reproduces the boxes of the vectorized code used for all results. Detector inference was timed on a T4 GPU (FLIR-aligned images, batch 16, half precision, including pre- and post-processing).
In the implementation, the RGB and thermal branches stay separate from the fusion module. Either branch can therefore be evaluated independently or replaced later, provided that the output coordinate representation and class semantics remain compatible with the fusion interface. This modularity matters in surveillance deployments, where sensor quality and model behavior may vary between environments.
3.9. Computational and Deployment Characteristics
The reliability-aware component is a rule-based post-inference controller rather than a learned fusion network. Consequently, the fusion stage adds zero trainable parameters to the detector system and requires no fusion-specific optimizer, gradient computation, or backpropagation. Its runtime inputs are limited to the predicted boxes, class labels, confidence scores, and the fixed scalar operating parameters defined above. No intermediate RGB or thermal feature maps are required by the fusion stage.
Let and denote the numbers of RGB and thermal detections of a frame, and let and denote the corresponding numbers that pass the thresholds for class c. Computing the branch-level operational cues, top-class agreement, dominance score, dynamic thresholds, and effective per-detection weights requires linear work in the number of detections. The additional reliability-aware control relative to fixed fusion is therefore
Both fixed and reliability-aware fusion also require spatial matching. Because clustering is performed within predicted classes over the detections of both branches, the number of overlap tests is
where is the set of predicted classes. The complete post-inference fusion complexity is therefore
with a worst-case pairwise term of . Under the detector setting of at most 300 detections per branch, the loose worst-case bound is candidate pairs before class partitioning and before considering that the confidence filter normally reduces and . This value is an analytical upper bound, not a measured per-frame operation count.
The controller itself maintains only branch-level scalar quantities and per-detection adjusted thresholds/weights. It does not require feature-map storage. A practical implementation may store only the retained detections and the match/cluster relations needed for box fusion; a dense overlap matrix is needed only within one class at a time. Thus, the reliability-specific memory overhead is linear in the retained detections apart from the data structure used to represent the clusters.
This analysis separates the cost of the arbitration logic from the cost of the two base detectors. Table 3b quantifies it: the controller’s decision takes about 0.05 ms per frame, and the complete reliability-aware fusion 0.44–0.99 ms on average, against 9.7 ms (RGB) and 4.8 ms (thermal) per image for the two detectors on a T4 GPU, so that the fusion step adds roughly 3–7% to the detector time. These measurements do not cover power consumption or throughput on embedded hardware, so no real-time or energy-efficiency claim is made for such platforms.
Table 3.
Analytical and measured cost of the fusion stage. (a) Analytical characteristics; the entries characterize the post-inference fusion module only and do not include the cost of the independently trained RGB and thermal detectors. (b) Measured time per frame of the fusion step (CPU, single thread; mean with the 95th percentile in parentheses).
4. Results
We first state which data were used at each stage and report the detector baselines (Section 4.1). Section 4.2 gives the primary results—the box-level metrics of the four settings on the registered M3FD pairs and the aligned FLIR-aligned pairs, together with the robustness checks on FLIR-aligned. Section 4.3 and Section 4.4 compare training-free fusion with other output-level operators and with published RGB–thermal detectors. Section 4.5 reports the secondary frame-level results, and Section 4.6 shows why the FLIR ADAS v2 results are secondary. Section 4.7, Section 4.8, Section 4.9 and Section 4.10 analyze the reliability-aware controller, and Section 4.11 shows qualitative examples.
4.1. Data Use and Detector Baselines
Table 4a lists the data used for detector training, for checkpoint and weight selection, for setting the controller parameters, and for evaluation. On FLIR ADAS v2, the evaluation frames were used twice. The validation split that contains the 872 evaluation pairs also selected the detector checkpoints and set the modality weights, and the controller parameters were set by hand on the same pairs (Section 3.5). The M3FD parameters were adjusted on the M3FD evaluation pairs in the same way. We checked how much this matters in four ways: First, the selected thermal checkpoint was the last epoch (30), so the selection made no difference, and the selected RGB checkpoint (epoch 28) had a validation mAP50 of 0.3642, against 0.3624 at epoch 30. Second, the thresholds act on the original detector confidence, so the modality weights cannot change which detections are kept. The frame-level class sets, and with them precision, recall, and F1, stay the same, and the weights only reorder fused scores and move fused boxes. With equal or swapped weights, frame-level micro-F1 stays the same on all three datasets, top-1 agreement changes by at most 0.0012, and box-level F1 at the operating point by at most 0.0008 (Supplementary Table S1). Box AP is more sensitive. It drops by up to 0.077 on FLIR ADAS v2, where more weight on the unregistered RGB boxes pulls the fused boxes away from the thermal annotations, by 0.015 on FLIR-aligned with swapped weights, and changes by at most 0.0011 on M3FD. Third, Section 4.9 selects the controller parameters by grouped cross-fitting and also applies the FLIR ADAS v2 configuration unchanged to M3FD. Fourth, on FLIR-aligned, the training, selection, and evaluation data are disjoint, and the controller keeps its FLIR ADAS v2 configuration (Section 4.2).
Table 4.
(a) Data used for detector training, checkpoint and weight selection, controller parameter setting, and evaluation. (b) FLIR ADAS v2 detector baseline results (Ultralytics validator on the full validation split of each modality).
Before applying RGB–thermal fusion, we evaluated the RGB-only and thermal-only detector branches on FLIR ADAS v2 as unimodal baselines [4]. For RGB-only detection, precision, recall, mAP50, and mAP50-95 were 0.560, 0.332, 0.364, and 0.211, respectively (Table 4b). For thermal-only detection, the corresponding values were 0.684, 0.375, 0.408, and 0.243. Overall, the thermal-only detector performed better than the RGB-only detector in this baseline evaluation. These values come from the Ultralytics validator on the full validation split of each modality and are not comparable with the fusion metrics on the 872 paired frames (Section 3.7).
This result suggests that thermal sensing can provide useful evidence when visible-light appearance is affected by illumination changes or other visual degradation. The thermal detector is the stronger of the two, but its performance is still limited, which motivates fusion.
For completeness, branch-level training/validation curves and normalized confusion matrices are provided as Supplementary Figures S1 and S2. The validation mAP50 per epoch (Supplementary Figure S3) shows that the RGB detector had leveled off by the end of training. Its best checkpoint was epoch 28 (mAP50 0.364), and it gained only 0.006 mAP50 over the last 10 epochs. The thermal detector was still improving slowly. Its best checkpoint was the last epoch (mAP50 0.408), and it gained 0.011 in both mAP50 and mAP50-95 over the last 10 epochs, so the thermal baseline was slightly undertrained. Section 4.2 examines what this means with detectors trained for 60 epochs on FLIR-aligned. These diagnostics document the two detectors; they are not evidence about the fusion itself.
4.2. Box-Level Results on Registered and Aligned Pairs
Box-level metrics on the registered or aligned pairs are the primary results of this study (Section 3.6). Table 5 gives COCO-style box-level metrics (Equations (19) and (20)) for all four settings at the operating threshold of 0.35, on the same paired frames. FLIR ADAS v2 outputs are scored against the thermal annotations (Supplementary Table S2 gives the results against the RGB annotations), and M3FD outputs against its registered annotations.
Table 5.
Box-level results at the operating threshold of 0.35: COCO-style AP (Equation (20)), and precision (P), recall (R), and F1 at IoU 0.5 from greedy one-to-one matching of same-class boxes; pycocotools returns identical AP50 and AP50:95 for every configuration that we cross-checked. The FLIR-aligned results are given in Table 6.
On the registered M3FD pairs, fusion localizes objects better than either single modality. AP50 rises from 0.3194 (thermal only) to 0.3766 (fixed fusion) and 0.3730 (reliability-aware fusion), and AP50:95 from 0.2006 to 0.2449 and 0.2414. On FLIR ADAS v2—a secondary result, because its pairs are not registered—the opposite happens. Fusion lowers AP50 against the thermal annotations from 0.3334 (thermal only) to 0.2545 and 0.2518, because the RGB boxes, normalized to within their own image, do not land on the thermal objects. Against the thermal annotations, the RGB-only detections reach an AP50 of only 0.0096, compared with 0.2641 against their own RGB annotations. Section 4.6 looks at this in detail.
At the box level, the controller shifts the operating point, as it does at the frame level. Compared with fixed fusion, it gains a little precision and loses a little recall (FLIR ADAS v2: +0.0023 and −0.0013; M3FD: +0.0044 and −0.0034; all 95% intervals exclude zero), while its F1 difference is not significant (+0.0008, 95% CI −0.0001 to +0.0023, on FLIR ADAS v2 and +0.0001, −0.0006 to +0.0007, on M3FD).
On FLIR-aligned, the RGB and thermal images are aligned, and the training, selection, and test pairs are disjoint (Section 3.2). We trained our RGB and thermal YOLOv8n detectors on its training pairs with the recipe of Section 3.8 and evaluated all systems with pycocotools on the 1013 test pairs, which contained 8591 person, car, and bicycle objects. Our own implementation gave the same AP50 and AP50:95, to four decimal places, in all 12 configurations of Table 6.
Table 6.
Output-level fusion on the FLIR-aligned test set (1013 pairs, 8591 objects; COCO AP from pycocotools). All operators fuse the same detections (confidence ≥ 0.001) of the same two YOLOv8n detectors (seed 0), with the same fusion IoU (0.55) and modality weights (RGB 0.425, thermal 0.575, from the held-out validation mAP50). The operators are our implementations with default parameters and a single-score approximation of ProbEn (Section 3.6); the table compares these implementations, not the best performance of each method. With all thresholds lowered by 0.349, the controller receives the same input detections, but its weaker branch keeps a threshold of 0.101 or 0.201 in 46 frames (Section 3.8). AP50: Difference from fixed fusion, computed from unrounded AP values, with a 95% cluster-bootstrap interval (1000 resamples of 15 blocks of 100 consecutive frame indices). The lower block gives the systems at the operating threshold of 0.35, with AP50 relative to fixed fusion at 0.35 and box-level F1 at IoU 0.5.
Table 6 repeats the comparison of output-level operators on these aligned pairs. All operators fused the same detections (confidence ≥ 0.001) with the same fusion IoU and modality weights, and all other parameters were left at their defaults. Fusion raised AP50 from 0.7238 (thermal only) to 0.7583, a difference of +0.0345 (95% CI +0.0261 to +0.0411), and AP50:95 from 0.3889 to 0.3988. AP75 stayed at 0.353, so the gain came from additional correct detections rather than from tighter boxes. At the operating threshold of 0.35, AP50 rose from 0.6233 (thermal only) to 0.6658 (+0.0425; 95% CI +0.0295 to +0.0542), and box-level F1 at IoU 0.5 from 0.7696 to 0.7784. On these pairs, fixed fusion was the best of the tested operators. Compared with it, AP50 changed by −0.0072 for NMS, −0.0471 for WBF, −0.0703 for Soft-NMS, and −0.0915 for the ProbEn-style rule, all with 95% intervals that exclude zero, although Soft-NMS had the highest AP75 (0.3633). When all detections were fused, the fusion step took 4.0 ms per frame for NMS, 8.8 to 9.6 ms for fixed and reliability-aware fusion, and 13.9 to 14.8 ms for Soft-NMS, the ProbEn-style rule, and WBF (runtime of the vectorized code divided by the number of frames). Table 3b gives the per-frame times at the operating threshold.
With all of its thresholds lowered by 0.349 (Section 3.8), the controller is 0.0020 below fixed fusion in AP50 (95% CI −0.0033 to 0.0000). At its published settings, it is 0.0030 below fixed fusion at the same threshold of 0.35 (−0.0055 to +0.0005). At that threshold, its box-level precision is 0.0006 higher and its recall 0.0007 lower than that of fixed fusion, and both reach an F1 of 0.7784 at IoU 0.5, against 0.7696 for thermal only. In Figure 4, the precision–recall curves of fixed fusion and of the controller with lowered thresholds lie almost on top of each other. With these detectors, the controller never changes the class set of a frame, and the frame-level micro-F1 is 0.9557 for both fusion settings and 0.9545 for thermal only.
Figure 4.
Precision–recall curves at IoU 0.5 on the FLIR-aligned test set (all classes pooled; AP50 from pycocotools in the legend). Fixed fusion (black) and reliability-aware fusion with all thresholds lowered by 0.349 (orange) practically coincide, and reliability-aware fusion at its published settings (star) lies just below the fixed-fusion curve. NMS and Soft-NMS are omitted for readability; their AP values are given in Table 6.
Because the training, validation, and test pairs of this benchmark are disjoint, we also used it for three robustness checks (Supplementary Tables S3 and S4, Figures S4 and S5, and Table 7). Over three training seeds, fixed fusion beats thermal-only detection in AP50 by 0.0198 to 0.0345 (mean 0.0271), with every interval above zero. The AP50 of the controller over all detections is 0.0002 to 0.0020 below that of fixed fusion, and none of these intervals excludes zero. At the operating threshold, the controller raises box precision by 0.0006 to 0.0031 and lowers box recall by 0.0005 to 0.0007, as on the other datasets. Its box-level F1 differs from that of fixed fusion by 0.0000 to +0.0015. Only for seed 1 does the interval exclude zero (+0.0015; 95% CI +0.0006 to +0.0028), and for this seed too, fixed fusion with a threshold on the fused score is more precise than the controller at the same recall (0.7614 against 0.7450; Section 4.7). For comparison, the AP50 of the thermal detector alone varies from 0.7238 to 0.7405 between seeds. When trained for 60 epochs, the thermal detector is still improving at the last epoch, and its test AP50 rises from 0.7238 to 0.7513, which is more than the spread between the three 30-epoch seeds. The RGB detector does not improve (0.6001 against 0.6130). Against these detectors, the AP50 gain of fusion is 0.0168 (95% CI +0.0100 to +0.0274), compared with 0.0345 for the 30-epoch detectors with the same seed and 0.0198 to 0.0345 over the three seeds. This is only slightly below the range of the seeds, and with a single 60-epoch run and overlapping intervals, it does not show that the gain of fusion shrinks as the thermal detector gets better. At the operating threshold of 0.35, fusion trades precision for recall, and for none of the four YOLOv8n detector pairs is its box-level F1 significantly different from that of thermal-only detection (differences from −0.0076 to +0.0088).
Table 7.
YOLOv8n and YOLOv8m detectors on FLIR-aligned (seed 0, 30 epochs, same recipe; 1013 test pairs). AP50 over all detections (confidence ≥ 0.001; the controller with all thresholds lowered by 0.349) and at the operating threshold of 0.35; box precision (P), recall (R), and F1 at IoU 0.5; 95% cluster-bootstrap intervals as in Table 6. The YOLOv8n column repeats the seed-0 results of Table 6 and Supplementary Table S3. Differences were computed before rounding.
The third check replaces both detectors by YOLOv8m detectors with 8.6 times as many parameters (25.9 M against 3.0 M per detector), trained with the same recipe, data, and seed (Table 7 and Supplementary Figure S7). The larger model helps the thermal detector more than longer training did: its AP50 over all detections rises from 0.7238 to 0.7970, against 0.7513 after 60 epochs. Fusion still beats it, by +0.0222 (95% CI +0.0124 to +0.0331), again with an interval above zero. This gain is smaller than that of the seed-0 YOLOv8n detectors (+0.0345) but lies within the range of the three YOLOv8n seeds (0.0198 to 0.0345). This single run therefore does not show that the gain of fusion decreases as the thermal detector improves. At the operating threshold of 0.35, fusion raises AP50 from 0.7220 to 0.7552 but trades precision for recall (−0.0403 and +0.0256), so that its box-level F1 is now 0.0112 below that of thermal-only detection (95% CI −0.0191 to −0.0034). This reduction was observed at one operating point: the threshold of 0.35, which all systems share, and which was taken over from FLIR ADAS v2. We did not select thresholds for each system on the 367 held-out pairs. The controller behaves as with the YOLOv8n detectors. Over all detections, its AP50 differs from that of fixed fusion by +0.0004 (−0.0002 to +0.0015). At its published settings, it raises box precision by 0.0014 and lowers box recall by 0.0001, which gives a small but significant gain in box F1 (+0.0008; +0.0002 to +0.0015), as for seed 1. At that recall, fixed fusion with a threshold on its fused score is again more precise (0.7514 against 0.7351), and its box F1 there, 0.802, is close to the 0.803 of thermal-only detection at 0.35. The F1 reduction at 0.35 therefore depends on the operating point and cannot be attributed to fusion alone.
4.3. Comparison with Output-Level Fusion Methods
Table 8 compares fixed fusion and the controller with WBF, cross-modal NMS, Soft-NMS, and the ProbEn-style Bayesian fusion. All of them work on the same saved detector outputs (every detection with a confidence of at least 0.05), the same 872 FLIR ADAS v2 and 4200 M3FD paired frames, the same fusion IoU threshold and modality weights, and the same evaluation code (Section 3.6). Because every operator fuses detections class by class, they all produce the same class set when they receive the same detections. For the frame-level comparison, we therefore threshold the fused scores. The threshold of every operator, and of each single modality, is selected by grouped cross-fitting, so no operator is tuned on its test frames.
Table 8.
Output-level fusion methods on identical detector outputs, frames, and evaluation code. The operators are our implementations with default parameters and a single-score approximation of ProbEn (Section 3.6); the table compares these implementations, not the best performance of each method. Micro-F1: frame level, with the threshold on the fused scores selected by grouped cross-fitting. AP50: box level over all detections with a confidence of at least 0.05, FLIR ADAS v2 against the thermal annotations, and M3FD against its registered annotations. Reliability-aware fusion is defined only at its operating point; its AP50 there is given in Table 5.
With thresholds chosen this way, all output-level operators reach a similar frame-level micro-F1 on FLIR ADAS v2, between 0.8797 (WBF) and 0.8822 (ProbEn-style fusion), whereas reliability-aware fusion at its published settings reaches 0.8649. On M3FD, the operators range from 0.8261 to 0.8382, against 0.8344. At the box level, with AP computed over all detections with a confidence of at least 0.05, WBF has the highest AP50 on the registered M3FD pairs (0.4350), followed by fixed fusion (0.4289) and NMS (0.4269), and on FLIR-aligned fixed fusion is the best of the tested operators (Table 6). On FLIR ADAS v2, no fusion operator reaches the thermal-only detector (AP50 0.4192, against at most 0.3031), for the reasons given in Section 4.6. At its published settings, the controller has a lower frame-level micro-F1 than every other output-level operator on FLIR ADAS v2 and lies within their range on M3FD.
4.4. Comparison with Published RGB–Thermal Detectors on FLIR-Aligned
Table 9 places the FLIR-aligned results of Section 4.2 next to the published FLIR-aligned results. Training-free fusion of two YOLOv8n detectors (about 3.0 M parameters each) reaches an AP50 of 75.8% and an AP50:95 of 39.9%. This is higher than CFR and GAFF, close to the AP50 reported for the re-implemented ProbEn (75.5%), which was obtained with another detector (Faster R-CNN) and other evaluation code, and only 0.3 points below CFT in AP50:95 (39.9% vs. 40.2%). On the same detections, our own ProbEn-style rule is 0.0915 below fixed fusion in AP50 (Table 6), so the published ProbEn value says little about how the two rules compare. In AP50, however, it is 2.9 to 10.8 points below CFT, CSSA, ICAFusion, Fusion-Mamba, and TFDet. Each paper computed its values with its own evaluation code, so differences of a few tenths of a point lie within the variation between evaluators; for our detectors, the Ultralytics evaluator and pycocotools differ by up to 0.4 AP50 points.
Table 9.
Published results on FLIR-aligned (4129 training and 1013 test pairs; COCO AP in %, as reported in each paper), and our results on the same test split with COCO-style metrics (our detectors were trained on 3762 of the training pairs). Last column: AP50 gain over the thermal-only detector reported in the same paper (– = no comparable thermal-only detector reported).
These methods train a dedicated fusion network on aligned pairs, mostly with larger backbones, so their absolute AP mixes the effect of fusion with the capacity and training of the detectors. The gain over each paper’s own thermal-only detector partly separates the two: +3.4 AP50 points for training-free fusion, +2.1 for ProbEn, and +4.8 to +12.0 for the feature-level networks. Some thermal-only detectors with larger backbones already reach 78.4% to 81.4% AP50 on this split [3], which shows that output-level fusion is limited by the detectors that it fuses. With two YOLOv8m detectors, training-free fusion reaches 81.9% AP50 and 43.3% AP50:95, within the range of the fusion networks, but its thermal-only detector alone already reaches 79.7%, and its gain of +2.2 points is smaller than that of any feature-level network in Table 9. The case for training-free fusion is not its accuracy but its practicality: it needs no paired training data and no fusion network, and either detector can be replaced without retraining the other.
4.5. Frame-Level Results (Secondary)
The frame-level metrics of Equations (14)–(18) look only at the class names in a frame and are secondary results (Section 3.6). On FLIR ADAS v2, the frame label is the union of the annotations of two images that are paired only through metadata and may show different parts of the scene or different moments (Section 4.6). A frame-level gain of fusion on this dataset therefore partially reflects the label and not only the detections, and Table 10b shows how much it depends on the label definition.
4.5.1. FLIR ADAS v2 Frame-Level Results
We evaluated frame-level detection on FLIR ADAS v2 across four settings: RGB-only, thermal-only, fixed RGB–thermal fusion, and reliability-aware RGB–thermal fusion. Table 10a reports the micro-averaged precision, recall, and F1 of Equation (16) with the pooled counts, the mean per-frame F1 of Equation (17), and the top-1 agreement of Equation (18). In the FLIR ADAS v2 evaluation, thermal detection provided stronger frame-level performance than RGB detection, with a micro-F1 of 0.756 for the RGB-only setting and 0.808 for the thermal-only setting (mean per-frame F1 of 0.733 and 0.788). With the union frame label, both fusion settings scored higher than the two single modalities.
Fixed fusion reached a micro-F1 of 0.8654, which is 0.0572 above thermal-only detection (95% CI 0.0467 to 0.0775). Almost all of this gain was recall. Recall rose from 0.6953 to 0.7968, while precision fell slightly, from 0.9648 to 0.9469, because the two detectors often recover different classes in the same frame and their union covers more of the annotated classes (Figure 2a). Reliability-aware fusion reached a micro-F1 of 0.8649. Compared with fixed fusion, it removed seven correct and six false class labels (2757 instead of 2764 true positives and 149 instead of 155 false positives). This raised precision from 0.9469 to 0.9487 and lowered recall from 0.7968 to 0.7948, while top-1 agreement stayed at 0.9897.
Averaging the per-frame values instead gives different numbers (for fixed fusion, a precision of 0.9438, a recall of 0.8152, and an F1 of 0.8589). For such per-frame means, F1 is not equal to of the averaged precision and recall, which would be 0.8748 here, whereas the micro-averaged values in Table 10 satisfy this identity exactly. Both averages put the two fusion settings well above the two single modalities. They disagree only on the sign of the tiny difference between fixed and reliability-aware fusion.
This is what the rule is designed to do: when the branches disagree, the weaker branch gets a stricter threshold and a lower weight. On FLIR ADAS v2, the controller therefore trades a little recall for a little precision, which is not an accuracy gain over fixed fusion, and Section 4.7 shows that a change in threshold has the same effect.
The FLIR ADAS v2 frame label is the union of the classes annotated in the RGB image and in the thermal image, so fusion gets credit for classes that only one camera’s annotation contains. Table 10b repeats the evaluation with three other frame labels: the RGB annotations alone, the thermal annotations alone, and the intersection of the two. Fusion remains the best setting under every definition, but its gain over the best single modality shrinks from +0.057 with the union label to +0.027 with the RGB labels and to only +0.007 with the thermal labels. The size of the frame-level gain on FLIR ADAS v2 thus depends on the label definition, and most of it comes from the two detectors finding different classes.
Table 10.
FLIR ADAS v2 fusion results (872 paired frames). (a) Micro-averaged precision (P), recall (R), and F1 (Equation (16)) with the pooled counts, mean per-frame F1 (Equation (17)), and top-1 agreement (Equation (18)). (b) Micro-F1 under alternative frame-label definitions; the union label is used everywhere else in this paper.
4.5.2. M3FD Frame-Level Results
On M3FD, whose pairs are registered [7], the frame-level results complement the box-level results of Section 4.2. In the unimodal comparison, the thermal-only branch achieved a higher frame-level micro-F1 than the RGB-only branch: 0.824 compared with 0.784 (mean per-frame F1 of 0.820 and 0.757).
On M3FD, fixed fusion reached a micro-F1 of 0.8341, and reliability-aware fusion reached 0.8344 (Table 11). Here, the gain of fixed fusion over thermal-only detection is smaller than on FLIR ADAS v2 and is not significant (+0.0098; 95% CI −0.0010 to +0.0198). Recall rises from 0.7639 to 0.8185, but precision falls from 0.8951 to 0.8503. As on FLIR ADAS v2, the controller mainly moves the operating point toward precision, and F1 barely changes. Precision increases from 0.8503 to 0.8549 (+0.0046), whereas recall changes from 0.8185 to 0.8149 (−0.0036). Micro-F1 changes by only +0.0003, and top-1 agreement changes from 0.9379 to 0.9376 (−0.0003).
Table 11.
M3FD fusion results (4200 registered pairs; metrics as in Table 10a).
Both fusion settings remain above the unimodal baselines. M3FD thus shows the same precision–recall behavior on a second dataset. Because its coefficients and thresholds were set on M3FD, this is a replication, not evidence of parameter-free transfer.
4.5.3. Behavioral Effect of Reliability Arbitration: Precision–Recall Trade-Off
The comparison between fixed and reliability-aware fusion reveals a consistent behavior across the two datasets (Table 12). In both FLIR ADAS v2 and M3FD, reliability-aware arbitration increases micro-averaged precision, by 0.0018 and 0.0046, respectively. This is accompanied by a small recall reduction of 0.0020 on FLIR ADAS v2 and 0.0036 on M3FD. Micro-F1 changes by −0.0004 (95% CI −0.0017 to +0.0018) and +0.0003 (−0.0015 to +0.0018), and a cluster sign-flip test on the per-frame F1 differences gives and , so neither difference is significant. Top-1 agreement is unchanged on FLIR ADAS v2 and differs by only 0.0003 on M3FD. With the per-frame means of Equation (17), precision rises by 0.0030 on both datasets, and F1 rises by 0.0005 and 0.0002.
Table 12.
Change in frame-level metrics produced by reliability-aware arbitration relative to fixed fusion. Values are differences (reliability-aware minus fixed) between the micro-averaged values of Table 10 and Table 11 (and between the per-frame means for the mean per-frame F1), computed before rounding, with 95% cluster-bootstrap intervals over the 12 FLIR ADAS v2 videos or the 84 blocks of 50 M3FD frames. No additional model inference is involved.
The direction of these changes is consistent with the design of the controller. When the modalities disagree, the weaker branch is filtered with a stricter confidence threshold and can receive a reduced effective weight, whereas the dominant branch can be reinforced. Such a rule is expected to suppress some lower-support detections and, therefore, to move the operating point toward precision, at the cost of a small amount of recall. The aggregate metrics do not establish that every suppressed detection was a false positive; Section 4.8 shows that the removed class labels are correct about as often as they are false.
In short, the reliability-aware stage changes the operating point of fixed fusion, not its accuracy. Later subsections test whether the change is more than a change in threshold (Section 4.7), look at what the controller removes and why (Section 4.8), and identify which of its components is responsible (Section 4.9).
4.6. Sensitivity to Cross-Modal Misregistration
Normalizing the box coordinates of each image to does not make the two views correspond geometrically. Table 13 shows how far apart the normalized RGB and thermal boxes are. On FLIR ADAS v2, only 5.7% of the RGB annotations whose class is also annotated in the thermal image overlap a same-class thermal annotation with IoU ≥ 0.5 (median best IoU 0.00). Fitting a robust scale-and-offset mapping for each RGB resolution raises this share only to 19.6%, or 14.65% for the images, which hold 83% of these annotations. For these images, the fit gives a horizontal scale of 1.09 and a vertical scale of 1.20, as expected from the wider field of view of the RGB camera. Because even this fit leaves most annotations unmatched, the frames paired through the metadata must also differ in viewpoint and possibly in timing. As a result, only 4.3% of the thermal detections have a same-class RGB detection with IoU ≥ 0.55, and only 2.4% of the fused FLIR ADAS v2 boxes combine both modalities, against 54.2% and 45.0% on M3FD. All other fused boxes are single-modality outputs (Section 3.5). On FLIR ADAS v2, the frame-level gain of fusion comes from the union of the two class sets and not from box-level fusion, and fusion lowers the box-level AP50 against the thermal annotations (0.2545, against 0.3334 for thermal-only detection). Even an RGB mapping estimated on other videos by grouped cross-fitting raises it only to 0.2696.
Table 13.
Cross-modal geometry of the two datasets (detections and boxes at the operating threshold of 0.35).
On the registered M3FD pairs, we simulated field-of-view, registration, and synchronization errors by scaling, shifting, and jittering the RGB boxes (Figure 5). Shifting them by 1%, 2%, and 5% of the image width lowers the fused AP50 from 0.377 to 0.345, 0.328, and 0.283, so fusion falls below the thermal-only detector (0.319) somewhere between 2% and 5%. A 10% field-of-view mismatch gives 0.299, and a per-box jitter of 0.25 box sizes gives 0.293. The frame-level micro-F1 stays at 0.8341 (fixed fusion) and 0.8344 (reliability-aware fusion) in every case, because the simulated errors move the RGB boxes but do not change which objects each image shows, and the metric ignores box geometry. This does not mean that frame-level results are unaffected by misregistration. When the two images of a pair differ in viewpoint or timing, as on FLIR ADAS v2, they can show different objects, and the union label then credits fusion with objects that only one camera saw. On FLIR ADAS v2, the frame-level gain of fusion over thermal-only detection shrinks from +0.057 with the union label to +0.007 with the thermal annotations alone (Table 10b). Misregistration thus changes what the frame label means, and box-level fusion needs registered or calibrated inputs, which FLIR ADAS v2 does not provide. This is why all FLIR ADAS v2 results are secondary.
Figure 5.
Controlled misregistration of the RGB boxes on the registered M3FD pairs: box-level AP50 of fixed fusion and of reliability-aware fusion under (a) a global shift, (b) a global scale change (field-of-view mismatch), and (c) per-box jitter. The dashed line marks the thermal-only detector. The frame-level micro-F1 stays at 0.8341 (fixed fusion) and 0.8344 (reliability-aware fusion) in every case.
4.7. Operating-Point Analysis
On the registered and aligned pairs, the box-level operating points of the controller lie on or below the precision–recall curve of fixed fusion. On FLIR-aligned, fixed fusion with a threshold on its fused score is more precise than the controller at the same recall for all three training seeds, by 0.008 to 0.021 (Supplementary Table S3), including seed 1, for which the controller has the slightly higher box F1 at the operating threshold (Section 4.2). With all of its thresholds lowered together, the controller traces almost the same box-level curve as fixed fusion (Figure 4), and on M3FD its box-level F1 differs from that of fixed fusion by only +0.0001. What the controller does at the box level can thus be reproduced by choosing a different threshold for fixed fusion.
The frame-level results lead to the same conclusion. A controller that raises precision and lowers recall may do nothing more than move the operating point. Figure 6 tests this directly at the frame level. It shows frame-level precision–recall curves of fixed fusion over its full threshold range (one common input threshold from 0.05 to 0.95) and over all static pairs of per-branch thresholds, with reliability-aware fusion as a single operating point. That point lies on the fixed-fusion curve. At its recall on FLIR ADAS v2 (0.7948), the interpolated fixed-fusion curve has the same precision (0.9487), and on M3FD the curve is even slightly more precise at the same recall (0.8564 against 0.8549). On both datasets, some static pair of per-branch thresholds is at least as precise at no lower recall (Table 14). Shifting all thresholds of the controller together traces almost the same curve as fixed fusion, with precision differences between −0.005 and +0.002 over the whole range.
Figure 6.
Frame-level precision–recall curves (micro-averaged) on FLIR ADAS v2 and M3FD. Reliability-aware fusion at its published settings (star) lies on the curve of fixed fusion with one common threshold (black), and shifting all of its thresholds together traces the same curve (orange). The square marks fixed fusion at 0.35, the dashed curves are the single modalities, and the gray points are all static pairs of per-branch thresholds; the insets enlarge the region around the operating point.
Table 14.
Operating-point analysis (frame level, micro-averaged). Intervals are 95% cluster-bootstrap intervals over the 12 FLIR ADAS v2 videos or the 84 blocks of 50 M3FD frames.
The threshold of 0.35 is not optimal for fixed fusion either. With a single input threshold selected by grouped cross-fitting, fixed fusion reaches a micro-F1 of 0.8797 on FLIR ADAS v2 and 0.8367 on M3FD (with a threshold on the fused scores instead, it reaches 0.8806 and 0.8366; Table 8). Reliability-aware fusion is 0.0148 below it on FLIR ADAS v2 (95% CI −0.0255 to −0.0018) and 0.0023 below it on M3FD (−0.0063 to +0.0020, not significant). What the controller does can thus be reproduced by choosing a different threshold.
4.8. Empirical Validation of the Reliability Proxies
The controller rests on two assumptions: that different top classes in the two branches signal a conflict, and that the branch with the higher dominance score is the more reliable one. Table 15a tests both. On FLIR ADAS v2, the two branches disagree on the top class in 220 of 872 frames, and in 206 of these (93.6%), both top classes are in the frame label. In most of these frames, the two branches simply see different objects. On M3FD, both top classes are correct in 263 of the 736 disagreement frames (35.7%), and only the dominant one in 309 (42.0%).
Table 15.
(a) Empirical checks of the reliability proxies at the frame level; ties are frames in which both branches have the same per-frame F1. (b) Decision audit of the controller at its published settings over all frames. A removed detection passes the fixed threshold of 0.35 but not the raised threshold; it is counted as correct when it matches an annotated object of the same class (IoU ≥ 0.5) in its own image. FLIR-aligned: seed-0 detectors. On FLIR ADAS v2, the fused boxes are scored against the thermal annotations, to which the RGB boxes are not registered, so that row is only indicative there. The per-frame traces of all frames are provided as Supplementary Data.
The second assumption holds only partly. Among the disagreement frames with a moderate or large gap in which the two branches differ in per-frame F1, the branch designated as dominant is the better one in 77% of the FLIR ADAS v2 frames () and 81% of the M3FD frames (). Over all frames in which both branches detect objects and differ in F1, this drops to 61% and 60%. In the frames where the controller acts, the top confidence alone separates the better branch as well as the full score of Equation (4) does (AUROC 0.857 against 0.861 on FLIR ADAS v2, and 0.859 against 0.858 on M3FD). The detection count is even negatively correlated with box-level precision (Spearman between −0.21 and −0.43), so more detections does not mean better ones. Across all frames, the dominance score is only weakly correlated with the per-frame F1 of its own branch on FLIR ADAS v2 ( for RGB and 0.16 for thermal), and it is not positively correlated at all on M3FD (−0.01 and −0.07; Figure 7). A single false positive can also win the arbitration. In the disagreement frames where the top thermal detection is a box-level false positive, the thermal branch is still designated as dominant in 33% (FLIR ADAS v2, ) and 58% (M3FD, ) of the cases, compared with 63% and 67% when its top detection is correct.
Figure 7.
Difference of the dominance scores of Equation (4), , against the difference in per-frame F1 between the RGB-only and thermal-only outputs on FLIR ADAS v2 (left) and M3FD (right). Each point is a frame (blue: top classes agree; orange: top classes disagree), the black line is the binned mean, and the dotted lines mark the gap boundaries and . A higher score predicts a better branch only weakly.
Table 15b audits every decision of the controller at its published settings on all three datasets. The rules act on few frames. A raised threshold removes at least one detection in 6.5% of the FLIR ADAS v2 frames, 7.4% of the M3FD frames, and 3.3% of the FLIR-aligned frames, and the class set changes in at most 1.7% of the frames. On FLIR ADAS v2 and M3FD, the raised thresholds remove correct and false class labels in similar numbers: 7 correct and 6 false labels on FLIR ADAS v2, and 30 correct and 48 false labels on M3FD. On FLIR-aligned, most removed detections are correct RGB detections (51 correct and 18 false) that had already been merged with thermal detections, so the fused output loses only six correct and nine false boxes and no class label. In general, fewer fused boxes change than detections are removed, because many removed detections had been merged with a detection of the other branch. The weight multipliers also move fused boxes and scores in frames where nothing is removed.
On M3FD, top-1 agreement drops from 0.9379 to 0.9376. This is 1 frame out of 4200, the net result of five changes (Table 16). In three frames, the weight multipliers swap two classes whose fused scores differ by 0.001 to 0.011, giving two gains and one loss. The other two frames are both losses. In each, the RGB branch is designated as dominant because of a “sign” detection (confidence 0.93 and 0.54)—a class that M3FD does not annotate. The raised thermal threshold then removes every remaining detection of an evaluated class, and the frame is left with no detection of an evaluated class at all. This exposes a weakness of the controller: the dominance score and the agreement test use detections of every detector class, including classes that are not evaluated.
Table 16.
All M3FD frames in which top-1 agreement differs between fixed and reliability-aware fusion. Scores are fused (weighted) scores.
Figure 8 and Figure 9 show how the decisions are made in real frames where the controller and fixed fusion differ. Each row shows the RGB detections, the thermal detections, both fused outputs, and the full trace of the frame: top class, top confidence, and detection count of each branch, the agreement test of Equation (5), the dominance scores of Equation (4), the gap band, the thresholds and weights applied, every removed detection, and the resulting class sets and box counts. The frames were picked by fixed rules. Rows (a) to (c) come from the frames in which the controller removes at least one detection, and row (d) from those in which top-1 agreement changes, which happens only on M3FD. In (a), a false class label is removed and no correct one. In (b), a correct class label is removed. Row (c) is a failure: the top detection of the branch designated as dominant is itself a false positive, and correct detections of the other branch are removed. In (d), top-1 agreement is lost. Within each category, we show the frame with the largest effect, preferring frames with 1 to 15 annotated objects.
Figure 8.
Decision traces on FLIR ADAS v2: three night frames in which reliability-aware fusion and fixed fusion differ. Rows: (a) a false class label is removed; (b) a correct class label is removed; (c) failure, in which the top detection of the branch designated as dominant is a false positive. Detections at the operating threshold of 0.35: green, correct (same class, IoU ≥ 0.5); red, false positive; orange dashed, missed object; pink dashed, removed by the controller. The RGB panel is scored against the RGB annotations, and the thermal and fused panels against the thermal annotations; because the RGB boxes are not registered to the thermal image, a correct RGB detection can appear there as a false box (Section 4.6). The trace on the right of each row gives the quantities of Equations (2)–(11) and the frame-level class sets that Table 10 evaluates.
In the FLIR ADAS v2 frame of Figure 8a, the thermal branch dominates ( and , gap 0.216). The RGB threshold rises to 0.55, three false RGB detections are removed, and the frame F1 rises from 0.80 to 1.00. In (b), the same rule removes three correct RGB detections and one false one, and the correct class “sign” is lost (frame F1 from 0.86 to 0.67). In (c), a false “sign” detection at 0.80 makes the thermal branch dominant, and a correct RGB car is removed; the class set survives only because the thermal branch also found a car. On M3FD (Figure 9), the RGB-dominant rule in (a) removes three false thermal detections, so the false boxes drop from 2 to 0 and the frame F1 rises from 0.67 to 1.00. In (b), the thermal branch dominates (bus at 0.78 against car at 0.56), and the RGB threshold of 0.60 removes a correct truck and a correct person. Both classes are lost (frame F1 from 1.00 to 0.67, correct boxes from 2 to 0). In (c), a false “car” at 0.93 makes the thermal branch dominant, and four correct RGB detections are removed (correct boxes from 5 to 1). In (d), nothing is removed, but the weight multipliers lift “truck” (0.481) above “car” (0.476). Since no truck is annotated in this frame, top-1 agreement is lost. In all of these cases, the dominance score tells us which branch is more confident, not which one is right.
4.9. Ablation and Sensitivity Analysis
Table 17 changes one component of the controller at a time. Because the thresholds act on the original confidence, the weight multipliers cannot change the predicted class set. As a result, the weights-only variant is identical to fixed fusion at the frame level (difference 0.0000 on both datasets), although the weights do change top-1 agreement in three M3FD frames (Table 16). The thresholds-only variant, in turn, is identical to the full controller. Compared with the full controller, removing the count term () changes micro-F1 by 0.0000 on FLIR ADAS v2 and +0.0001 on M3FD, removing the agreement test by −0.0017 and +0.0026, replacing top-class agreement with set-level agreement by −0.0006 and +0.0008, and keeping only the large-gap rule by +0.0002 and −0.0006. The largest gain of any variant over fixed fusion, +0.0029 on M3FD without the agreement test, comes with a loss of 0.0021 on FLIR ADAS v2. In frame-level micro-F1, the effect of the controller thus comes from the threshold adjustment alone, and no variant improves on fixed fusion on both datasets. This metric depends only on the predicted class sets, so it cannot show an effect of the weight multipliers. At the box level, both parts of the controller have an effect, and both are small. At the operating threshold, the weight multipliers alone lower AP50 by 0.0019 on FLIR ADAS v2 and by 0.0008 on M3FD, the raised thresholds alone by 0.0011 and 0.0028, and the full controller by 0.0027 and 0.0035, while box F1 changes by at most 0.0008. The base modality weights of fixed fusion matter more: with equal or swapped weights, AP50 over all detections drops by up to 0.077 on the unregistered FLIR ADAS v2 pairs (Supplementary Table S1). The thermal bias of the M3FD configuration does not help either: applying the FLIR ADAS v2 configuration unchanged to M3FD gives a difference from fixed fusion of +0.0001, against +0.0003 for the M3FD-specific configuration. An oracle that picks the best of the fused, RGB-only, and thermal-only outputs in every frame would gain +0.0112 on FLIR ADAS v2 and +0.0470 on M3FD. Frame-wise arbitration has room to help, but cues based on confidence and detection counts do not find it.
Table 17.
One-change-at-a-time ablation: differences in frame-level micro-F1 relative to fixed fusion at 0.35 and to the full controller with the published configuration of each dataset. Micro-F1 depends only on the predicted class sets, which the weight multipliers cannot change. The box-level differences of the thresholds-only and weights-only variants are given in the text.
Figure 10 varies the gap boundaries and the raised thresholds over 828 settings, using the same grid on both datasets. The micro-F1 difference from fixed fusion ranges from −0.0029 to +0.0005 on FLIR ADAS v2 (median −0.0005; 10% of the settings above fixed fusion) and from −0.0003 to +0.0008 on M3FD (median +0.0003), so no setting gains more than 0.001. Varying the count coefficient of Equation (4) between 0 and 0.30 and the count normalizer between 10 and 80 keeps the difference between −0.0008 and −0.0003 on FLIR ADAS v2 and between −0.0002 and +0.0004 on M3FD. Finally, we selected the parameters by grouped cross-fitting on other videos (FLIR ADAS v2) or 50-frame blocks (M3FD) and evaluated them on the held-out ones. The controller then reached a micro-F1 of 0.8655 on FLIR ADAS v2, against 0.8797 for fixed fusion tuned the same way (difference −0.0142, 95% CI −0.0248 to −0.0011), and 0.8345 against 0.8367 on M3FD (not significant).
Figure 10.
Sensitivity of the frame-level micro-F1 difference from fixed fusion (in units of ) to the raised thresholds and of the weaker branch, with the gap boundaries at their published values (a,b), and to the gap boundaries and , with the thresholds at their published values (c,d), on FLIR ADAS v2 (a,c) and M3FD (b,d). The published setting is boxed; n/a marks combinations outside the grid ( or ). The full grid of 828 settings is summarized in the text.
4.10. Behavior by Illumination
None of the three datasets comes with per-frame illumination labels that we could use. Instead, we measured the mean luminance of each RGB image and split each dataset at Otsu’s threshold [44] of its luminance histogram. This rule uses no annotation and no result (Supplementary Figure S6). On FLIR ADAS v2 and FLIR-aligned, the darker group consists mainly of night scenes. On M3FD, it also contains overcast and dusk scenes, so we call it “low light”. Other conditions, such as fog or rain, are not labeled in these datasets and could not be analyzed separately.
The controller does react to illumination (Table 18). In the dark, it designates the thermal branch as dominant more often on all three datasets (72% against 51% of the frames on FLIR ADAS v2, 79% against 68% on M3FD, and 97% against 74% on FLIR-aligned). On the two FLIR datasets, it also raises the RGB threshold more often (9.9% against 4.0%, and 11.5% against 0.7%), while on M3FD it does so about equally often (12.6% against 14.2%). Figure 11 shows the consequences. In low light, the controller helps a little on M3FD and FLIR-aligned: +0.0031 in frame-level micro-F1 on M3FD (95% CI +0.0008 to +0.0060), where most of the class labels it removes are false (20 false and 5 correct), and +0.0010 in box-level F1 on FLIR-aligned (+0.0002 to +0.0018), where the fused output loses nine false and two correct boxes. In daylight, on FLIR ADAS v2, it hurts a little (−0.0009; −0.0021 to −0.0002), because the raised thresholds remove three correct class labels and no false one. These are post hoc comparisons over six groups, without correction for multiple testing, and the effects are as small as the operating-point shifts of Section 4.7. We therefore treat them as exploratory.
Table 18.
Behavior of the controller by illumination (published settings, all frames of each group; groups split at Otsu’s threshold of the mean RGB luminance). “RGB threshold raised” includes frames in which the RGB branch has no detection, where the raise has no effect.
Figure 11.
Effect of the controller (a) and of fusion itself (b) by illumination. FLIR ADAS v2 and M3FD: frame-level micro-F1; FLIR-aligned: box-level F1 at IoU 0.5 at the operating threshold of 0.35 in both panels, because with these detectors the controller never changes the frame-level class sets. Intervals are 95% cluster-bootstrap intervals over videos (FLIR ADAS v2), 50-frame blocks (M3FD), or 100-frame blocks (FLIR-aligned).
On M3FD, illumination matters far more for fusion itself than for the controller. Fixed fusion is 0.0188 above thermal-only detection by day (95% CI +0.0087 to +0.0292) but 0.0198 below it in low light (−0.0472 to +0.0040, not significant). In low light, thermal-only detection scores highest (micro-F1 0.8974, against 0.8776 for fixed fusion and 0.8807 for reliability-aware fusion). On FLIR ADAS v2, by contrast, the gain of fusion over thermal-only detection is the same by day and by night (+0.057 and +0.058). Therefore, illumination does matter for fusion, but the dominance score picks it up only weakly.
4.11. Qualitative Results
Figure 12, Figure 13 and Figure 14 show example frames from each dataset. To avoid hand-picking favorable frames, we selected them by fixed rules from the per-frame counts of correct detections, false positives, and missed objects at the operating threshold of 0.35. Rule 1 takes the frame in which fixed fusion gains the most correct detections over the better single detector, with a small penalty for false positives (frames with 3 to 15 objects; ties go to the brighter frame). Rule 2, used on FLIR-aligned, takes the frame with the largest gain over the RGB detector among the darkest quarter of the frames (at least two objects). Rule 3 takes the frame in which fusion adds the most false positives (at least two objects) as a failure case. For M3FD, rows (a) and (b) are the two highest-ranked frames under rule 1. For FLIR ADAS v2, the two rows show the frame with the most complementary class sets and the frame with the most fused boxes that come from the RGB branch alone. Supplementary Table S5 gives the counts for every panel.
Figure 12.
Qualitative results on FLIR-aligned (aligned pairs, three classes). Rows: (a) both detectors contribute (rule 1); (b) dark scene (rule 2); (c) failure case (rule 3). Green: correct detection (same class, IoU ≥ 0.5); red: false positive; orange dashed: missed annotated object. The RGB-only panel is drawn on the RGB image, and all other panels on the thermal image.
Figure 13.
Qualitative results on M3FD (registered pairs). Rows: (a,b) both detectors contribute (the two highest-ranked frames under rule 1); (c) failure case (rule 3). Colors and panels as in Figure 12.
Figure 14.
Qualitative results on FLIR ADAS v2 (pairs matched through metadata, not registered). Rows: (a) the frame with the most complementary class sets; (b) the frame with the most fused boxes that come from the RGB branch alone, whose boxes are displaced from the thermal objects. The RGB-only panel is scored against the RGB annotations, and the other panels against the thermal annotations. Colors as in Figure 12.
On FLIR-aligned (Figure 12), fusion finds 8 of the 9 objects in (a) without a false positive, against 5 for the RGB and 6 for the thermal detector. In the night scene (b), the RGB detector finds 2 of 16 objects, and the thermal detector finds 14. Fusion keeps the 14 correct thermal detections and adds no false positives beyond the 2 of the thermal detector. In the failure case (c), fusion keeps the three correct thermal detections but adds three false positives from the RGB branch. Reliability-aware fusion gives the same counts as fixed fusion in all three frames. On M3FD (Figure 13), fusion finds all 12 objects in (a)—against 8 for RGB and 7 for thermal detection—and 13 of 14 in (b). Frame (a) happens to be one where the controller helps, because its raised threshold removes both false positives of fixed fusion. Over all M3FD frames, however, its fused output has 117 fewer correct and 241 fewer false boxes than fixed fusion (Table 15b), and its box-level F1 differs from that of fixed fusion by only +0.0001. In the failure case (c), fusion finds 15 of 20 objects, but with 13 false positives, compared with 6 for each detector.
On FLIR ADAS v2 (Figure 14), the RGB detector finds traffic lights and signs that the thermal detector misses, and the thermal detector finds people, bicycles, and cars. At the frame level, the union of the two class sets covers all five annotated classes of frame (a). At the box level, though, the RGB boxes do not fall on the thermal objects, because the pairs are not registered. Against the thermal annotations, the fixed-fusion output of (a) has the same nine correct detections as thermal-only detection, but 14 false positives instead of 2; in (b), fixed fusion adds 28 false positives. These examples show why box-level fusion helps on the FLIR-aligned pairs and the registered M3FD pairs but not on FLIR ADAS v2, where the gain comes from the two detectors covering different classes (Section 4.6).
5. Discussion
5.1. Interpretation of Results
To interpret the results, we compare the fusion outputs with the single-modality baselines. On the registered M3FD pairs and the aligned FLIR-aligned pairs, combining RGB and thermal detections improves box-level detection over either modality alone (Table 5 and Table 6). At the frame level, the gain over either modality (Table 10 and Table 11) is significant on FLIR ADAS v2 and not significant on M3FD.
Taken together, the results support three conclusions: Training-free late fusion helps, but how much depends on the data. Box-level fusion works only on registered or aligned pairs. At the operating threshold of 0.35, it raises AP50 on M3FD (from 0.319 to 0.377) and on FLIR-aligned (from 0.623 to 0.666, and from 0.724 to 0.758 over all detections), but it lowers AP50 on the unregistered FLIR ADAS v2 pairs (from 0.333 to 0.255), and a misregistration of 2–5% of the image width cancels its benefit on M3FD (Section 4.6). With better thermal detectors, the gain on FLIR-aligned was 0.0168 after 60 epochs of training and 0.0222 with YOLOv8m detectors. These are single runs, and the YOLOv8m gain lies within the range of the three YOLOv8n seeds (0.0198 to 0.0345), so they do not show whether the gain decreases as the detectors improve. With YOLOv8m, fusion lowered box-level F1 at the shared operating threshold of 0.35, but with a threshold on its fused score it reached practically the same F1 as the thermal detector (0.802 against 0.803; Section 4.2). The frame-level gain on FLIR ADAS v2—0.057 in micro-F1 under the union label—comes mostly from the two detectors covering different classes: it falls to 0.027 under the RGB labels and to 0.007 under the thermal labels (Table 10b), and the corresponding gain on M3FD (0.010) is not significant. Finally, the reliability-aware controller only shifts the operating point, and a change in the threshold of fixed fusion reproduces this shift (Section 4.7, Section 4.8 and Section 4.9).
The results support the complementary role of RGB and thermal sensing. RGB frames provide visual and semantic detail, while thermal sensing can provide useful evidence when visible-light appearance is weakened. The controller tries to exploit this complementarity by adjusting the thresholds and weights of the two branches frame by frame from their observable outputs, which keeps every decision traceable. As Section 4.8 shows, however, these outputs say little about which branch is correct.
As elsewhere in this paper, reliability is meant operationally. The experiments test the usefulness of the arbitration policy, not the calibration of detector confidence, and the dominance score of Equation (4) is a control variable for selecting thresholds and weights, not the probability that modality m is correct [9,10,11].
The controller was designed to make a strong fixed post-inference baseline adaptive without a jointly trained fusion network, not to beat it by a large margin. The most consistent empirical signature of that adaptation is the precision–recall redistribution summarized in Table 12. Micro-averaged precision increases by 0.0018 on FLIR ADAS v2 and by 0.0046 on M3FD, while recall decreases slightly, by 0.0020 and 0.0036. This is the expected effect of raising the threshold and lowering the weight of the weaker branch when the branches disagree. However, the operating-point analysis shows that moving the threshold of fixed fusion produces the same redistribution (Figure 6), and that a threshold selected by grouped cross-fitting gives a higher F1 on FLIR ADAS v2 (Table 14). The decision audit adds that the raised thresholds remove correct labels about as often as false ones (Table 15). The adaptation changes the operating point, not the accuracy.
F1 is nearly unchanged, so the frame-dependent arbitration does not destabilize the fixed-fusion operating point. Where F1 does change, as for one of the three FLIR-aligned training seeds (+0.0015 in box F1) and for the YOLOv8m detectors (+0.0008), fixed fusion with a different threshold reaches a point that is at least as good. We see three reasons for this: The weight multipliers act after thresholding and cannot change the class sets, so the whole effect on frame-level micro-F1 comes from the raised thresholds (Table 17); at the box level, the multipliers alone change AP50 at the operating threshold by less than 0.002 (Section 4.9). The dominance score is governed by the top confidence, which means that a single confident false positive can decide the arbitration (Figure 8 and Figure 9). On FLIR ADAS v2, different top classes usually mean complementary evidence rather than a conflict, so suppressing the weaker branch removes correct classes as often as false ones. The oracle analysis shows that frame-wise arbitration could help (+0.011 on FLIR ADAS v2 and +0.047 on M3FD), but only with cues that identify the correct branch rather than the more confident one.
Table 2 lists the intended role of each cue next to its measured behavior, and the ablation shows that removing the count term or the agreement test, or replacing the agreement test with set-level agreement, changes micro-F1 by at most 0.003. None of the cues brings a measurable benefit on its own.
The illumination analysis (Section 4.10) looks at the same question by condition. In the dark, the controller designates the thermal branch as dominant more often, and it helps slightly in low light on M3FD and FLIR-aligned. These effects are exploratory and are much smaller than the effect of illumination on fusion itself: on M3FD, fixed fusion beats thermal-only detection by day but not in low light.
From a deployment perspective, Section 3.9 shows that this adaptivity does not introduce a learned fusion network: the fusion stage has zero trainable parameters, and the reliability-specific operations are linear in the number of retained detections. The dominant algorithmic term remains the class-specific overlap matching that is already required by decision-level fusion. The measured times in Table 3b agree. The controller’s decision takes about 0.05 ms per frame, and the complete fusion takes 0.4–1.0 ms on a CPU—roughly 3–7% of the detector time on a T4 GPU—for detections with a confidence of at least 0.35. Fusing all detections down to a confidence of 0.001, as for AP over all detections, takes 8.8 to 9.6 ms per frame (Section 4.2). We did not measure power consumption or performance on embedded hardware.
5.2. Positioning Relative to Existing Fusion Families
The taxonomy in Table 1 provides the appropriate methodological comparison for this study. Learned feature-, attention-, target-aware-, and transformer-based methods pursue a different primary objective: they increase cross-modal representational capacity by modifying the multimodal detector and training the fusion mechanism jointly [2,3,5,14,17,31]. Training-free fusion instead preserves two completed detector branches and modifies only the post-inference decision. Its intended advantage is therefore modularity and inspectability, not greater representational power.
The closest methodological comparators are probabilistic and box-level late-fusion methods [32,33]. Like those approaches, the evaluated controller operates on completed detector outputs and does not require a shared feature space. Its distinguishing element is the explicit use of output-derived operational cues to change weaker-branch thresholds and modality weights according to frame-level agreement and dominance. This makes the fusion policy adaptive while keeping every control variable observable after inference. On identical detector outputs, however, the adaptation only shifts the operating point of fixed fusion, and a change in the fixed-fusion threshold reproduces the shift (Section 4.7). With fairly selected thresholds, our implementations of WBF, NMS, Soft-NMS, and ProbEn-style fusion reach practically the same frame-level micro-F1 as fixed fusion on FLIR ADAS v2, WBF reaches the highest box AP50 on M3FD, and fixed fusion is the best of the tested operators on FLIR-aligned (Section 4.2 and Section 4.3); with tuned parameters, the other operators might do better.
A direct numerical ranking against all published RGB–thermal methods would be misleading because the cited studies use different datasets, category mappings, training regimes, data splits, backbones, and metrics. FLIR-aligned is the exception, because the test split and the COCO-style metrics are shared. There, training-free fusion of two YOLOv8n detectors (75.8% AP50) is above CFR and GAFF, and it is 2.9 to 10.8 points below the fusion networks trained on aligned pairs, whose gains over their own thermal-only detectors are also larger (Table 9). These published values were obtained with other detectors and evaluation code, and our own ProbEn-style rule on the same detections is 0.092 below fixed fusion, so the comparison places training-free fusion in the range of published results but does not rank it precisely. Apart from this benchmark, the literature comparison in this paper is methodological, while the quantitative claims are restricted to the controlled comparisons reported on FLIR ADAS v2, M3FD, and FLIR-aligned. Within that scope, training-free fusion offers a different trade-off: it gives up learned cross-modal representation capacity in exchange for zero fusion-specific training, replaceable detector branches, and direct output-level traceability, and its accuracy is bounded by the detectors that it fuses.
5.3. Limitations
First, the reliability-aware controller only shifts the operating point of fixed fusion, which a change in the threshold reproduces, and its dominance score is only weakly related to detection quality. What this paper contributes is an evaluation of training-free fusion, not a better fusion rule.
Second, the evaluation data were also used for tuning. The controller parameters were set by hand on the evaluation frames of FLIR ADAS v2 and M3FD, and the FLIR ADAS v2 validation split—which contains the evaluation pairs—also selected the detector checkpoints and the modality weights (Table 4a). We checked the consequences with parameters selected by grouped cross-fitting, with the FLIR ADAS v2 configuration transferred unchanged to M3FD, with a test of the modality weights, and with the FLIR-aligned benchmark, whose training, selection, and evaluation data are disjoint. None of these checks changed the conclusions. The double use may have favored the controller, whose parameters were set on these frames, but because the same frames also selected the checkpoints and the modality weights, it may have affected fixed fusion and the single-modality baselines as well.
Third, box-level fusion needs registered or calibrated inputs. The FLIR ADAS v2 pairs are matched through metadata but not registered, so the box-level results on this dataset largely reflect the misregistration of the two views. Its frame label is also the union of two annotation sets, which credits fusion with classes that only one camera’s annotation contains, so the frame-level gain on FLIR ADAS v2 depends on how the label is defined (Table 10b). For these reasons, all FLIR ADAS v2 results are secondary in this paper, and the primary results come from the registered M3FD pairs and the aligned FLIR-aligned pairs.
Fourth, the gains of fusion in the main tables are measured against single-modality detectors trained for 30 epochs, and the FLIR ADAS v2 thermal detector was still improving slowly at its last epoch. On FLIR-aligned, the AP50 gain of fusion over the thermal detector was 0.0168 when the detectors were trained for 60 epochs and 0.0222 with YOLOv8m detectors, against 0.0198 to 0.0345 over three YOLOv8n training seeds. These single runs neither confirm nor exclude smaller gains against better detectors. With YOLOv8m, fusion also lowered box-level F1 at the shared operating threshold of 0.35, and we did not select thresholds for each system on held-out data. Apart from one pair of larger YOLOv8m detectors, all detectors were YOLOv8n, and we did not test another detector family. We ran the checks with further training seeds, longer training, and the larger detector only on FLIR-aligned, because retraining the FLIR ADAS v2 detectors would have exceeded the GPU time available to us.
Fifth, the datasets cover only part of the conditions that a surveillance system will meet. Our illumination analysis relies on a luminance split rather than on labeled conditions, and fog, rain, glare, or weak thermal contrast could not be analyzed separately. M3FD uses its own controller parameters, so its results are not a strict zero-adaptation transfer result, although the transferred FLIR ADAS v2 configuration performs just as well. Real deployments may also involve stronger sensor noise, motion blur, weather effects, different heat-contrast levels, and different object distributions.
Training-free fusion also depends on the quality of the underlying RGB and thermal detectors. Because the fusion module works after inference, it can only combine detections that the two branches have already produced. If both branches miss an object, assign an incorrect class, or localize the object poorly, the fusion module cannot recover the correct output. This limitation is most visible in difficult frames where both RGB appearance and thermal contrast are weak.
A further limitation is that the operational reliability proxy is rule-based and is not calibrated probabilistically. Detector confidence enters the dominance score together with the detection count, and the score, the agreement test, and the dominance gap together set the thresholds and weights. Neither the confidence values nor the score represent a probability of correctness. The controller therefore cannot quantify predictive uncertainty or calibration error. Finally, our ProbEn-style baseline only approximates ProbEn with single scores, because the class posteriors that ProbEn needs are not available after YOLO post-processing. All operators were also run with their default parameters, so Table 6 and Table 8 do not show the best performance that these methods can reach. The fusion times were measured on a server CPU, and we did not measure throughput, power consumption, or memory use on embedded hardware.
5.4. Future Research Directions
Future work should first test training-free fusion under more specific adverse conditions. Datasets with labeled conditions would make it possible to evaluate fusion separately under low light, glare, fog, weak thermal contrast, partial occlusion, or strong camera misalignment, and to see when fusion is most useful and when it still fails.
Additional RGB–thermal and visible–infrared datasets should also be used. LLVIP and other surveillance-oriented benchmarks would support a stronger external-transfer study [36]. In particular, future work should lock all detector-independent fusion parameters on a development benchmark and apply the complete arbitration rule unchanged to external datasets. Such a protocol would directly test parameter-free transfer and would show whether the gains of fusion, and any future arbitration rule, carry over to different sensors, categories, viewpoints, and environmental conditions.
The negative result also suggests what a useful arbitration cue would have to do, namely, identify the correct branch rather than the more confident one. This makes probabilistically grounded reliability estimation the most promising extension. A future extension could first calibrate detector confidences, estimate predictive uncertainty, or learn a reliability model and then feed those quantities into the same post-inference arbitration framework [9,10,11]. This would allow the system to retain modular decision-level fusion while giving the term reliability a probabilistically interpretable meaning, and its benefit could be measured with the evaluation protocol of this paper.
For unregistered data such as FLIR ADAS v2, the two views would have to be registered before their boxes are combined—for example, with a calibrated mapping or a homography estimated for each camera pair. Future work should also compare training-free fusion with feature-level, attention-based, target-aware, and transformer-based RGB–thermal fusion methods with the same training data and detector backbone. The FLIR-aligned comparison in this paper uses a shared test split and metric but not the same backbone, so a controlled experiment would give a clearer view of the trade-off among performance, complexity, interpretability, and modularity, including for detector families other than YOLOv8.
Training-free fusion could also be extended from frame-level fusion to video-level fusion. Surveillance systems usually process continuous video rather than isolated frames, and temporal consistency can provide useful cues about object persistence and motion. Temporal reliability cues may help reduce unstable frame-to-frame detections. Finally, the CPU timings reported here should be complemented by measurements of end-to-end frames per second, power consumption, and memory use on practical edge and GPU platforms, especially for real-time or near-real-time surveillance use.
6. Conclusions
This paper set out to test what training-free fusion of two independently trained detectors—one for RGB and one for thermal images—can achieve when it works only on their outputs, and whether a rule-based controller that adapts thresholds and modality weights frame by frame adds anything to it. We evaluated four settings with one protocol on M3FD, FLIR-aligned, and FLIR ADAS v2, at the box level (our primary measure) and at the frame level, with confidence intervals that account for correlated frames.
The benefit of late fusion depends on the data. Box-level fusion paid off only where the images were registered or aligned. At the operating threshold of 0.35, AP50 went up from 0.319 to 0.377 on M3FD and from 0.623 to 0.666 on FLIR-aligned (from 0.724 to 0.758 over all detections), but it fell from 0.333 to 0.255 on the unregistered FLIR ADAS v2 pairs, and shifting the RGB boxes by 2–5% of the image width was enough to cancel the benefit on M3FD. On FLIR-aligned, fusing two YOLOv8n detectors stayed 2.9 to 10.8 AP50 points behind fusion networks trained on aligned pairs, although these published values come from other detectors and evaluation code, and its gain over the thermal detector was 0.0198 to 0.0345 over three training seeds and 0.0168 when the detectors were trained for 60 instead of 30 epochs. With YOLOv8m detectors, which have 8.6 times as many parameters, the gain over all detections was 0.0222, within the range of the three seeds, so our runs do not show whether the gain decreases for better detectors. At the operating threshold of 0.35 used for all systems, fusion of the YOLOv8m detectors still raised AP50 but lowered box-level F1 below that of the thermal detector. This reduction depends on the operating point: with a threshold on its fused score, fixed fusion reached a box F1 of 0.802 at the recall of the controller, practically equal to the 0.803 of the thermal detector. At the frame level—a secondary measure—fixed fusion raised micro-F1 on FLIR ADAS v2 from 0.808 to 0.865, mostly because the two detectors find different classes in the same frame; scored against the thermal annotations alone, the gain shrinks to 0.007.
The reliability-aware controller moves the operating point along the precision–recall curve of fixed fusion, which a change in threshold does just as well (box-level F1 differences of +0.0001 on M3FD and between 0.0000 and +0.0015 over the three FLIR-aligned training seeds and +0.0008 with the YOLOv8m detectors; micro-F1 differences of −0.0004 on FLIR ADAS v2 and +0.0003 on M3FD). Its dominance score reflects which branch is more confident rather than which one is right, the class labels that it removes are correct about as often as they are false, and none of 828 parameter settings gained more than 0.001. We report this as a negative result. An oracle that picks the best output in each frame would gain 0.011 on FLIR ADAS v2 and 0.047 on M3FD, so there is room for frame-wise arbitration, but confidence and detection counts are not enough to exploit it.
The fusion stage has no trainable parameters, and in our measurements it took 0.4–1.0 ms per frame on a CPU for detections with a confidence of at least 0.35, and 8.8–9.6 ms when all detections down to 0.001 were fused. Future work should look at registered inputs for FLIR ADAS v2, at conditions such as fog or glare that the datasets do not label, at other detector families, and at reliability cues that can tell which branch is correct—for example, calibrated confidences.
Supplementary Materials
The following supporting information can be downloaded at https://www.mdpi.com/article/10.3390/technologies14110720/s1: Figure S1: Training and validation curves of the FLIR ADAS v2 RGB and thermal detectors; Figure S2: Normalized confusion matrices of the two detectors; Figure S3: Validation mAP50 per epoch of the FLIR ADAS v2 detectors; Figure S4: Paired differences for the three training seeds, the 60-epoch detectors, and the YOLOv8m detectors on FLIR-aligned; Figure S5: Validation mAP50 per epoch of the FLIR-aligned detectors trained for 30 and 60 epochs; Figure S6: Illumination split of the three datasets; Figure S7: Validation mAP50 per epoch of the FLIR-aligned YOLOv8n and YOLOv8m detectors; Table S1: Effect of the modality weights; Table S2: Box-level results on FLIR ADAS v2 against the RGB annotations; Table S3: Results of the three detector pairs on FLIR-aligned; Table S4: FLIR-aligned detectors trained for 30 and 60 epochs; Table S5: Per-panel counts of the qualitative examples; Table S6: Columns of the per-frame decision traces; Data S1: Per-frame decision traces of FLIR ADAS v2, M3FD, and FLIR-aligned; Data S2: Controller configuration file and Graphviz sources and generating scripts of Figure 1 and Figure 3; Data S3: Analysis code, controller configuration, and instructions for reproducing the tables.
Author Contributions
Conceptualization, T.S.A., A.S.A. and Q.E.U.H.; methodology, T.S.A., A.S.A. and Q.E.U.H.; software, T.S.A. and A.S.A.; validation, A.S.A., Q.E.U.H. and T.M.K.; formal analysis, A.S.A., Q.E.U.H. and T.M.K.; investigation, A.S.A., Q.E.U.H. and T.M.K.; resources, Q.E.U.H. and T.M.K.; data curation, T.S.A. and A.S.A.; writing—original draft preparation, T.S.A. and A.S.A.; writing—review and editing, Q.E.U.H. and T.M.K.; visualization, A.S.A. and Q.E.U.H.; supervision, Q.E.U.H.; project administration, Q.E.U.H. All authors have read and agreed to the published version of the manuscript.
Funding
This research was funded by Naif Arab University for Security Sciences under grant No. NAUSS-26-R06.
Institutional Review Board Statement
Not applicable.
Informed Consent Statement
Not applicable.
Data Availability Statement
The FLIR ADAS v2 dataset is available from Teledyne FLIR at https://www.flir.com/oem/adas/dataset/ (accessed on 23 May 2026). The M3FD benchmark and download information are available through the official TarDAL repository at https://github.com/JinyuanLiu-CV/TarDAL (accessed on 23 May 2026). The FLIR-aligned subset is described in [12]. The datasets remain subject to the terms of their respective providers. The per-frame decision traces are provided as Supplementary Data S1, and the analysis code, the controller configuration, and the instructions for reproducing the tables as Supplementary Data S3. The saved detector outputs and the per-frame result tables used for all analyses are available from the corresponding author upon reasonable request.
Acknowledgments
The authors would like to express their deep thanks to the Vice Presidency for Scientific Research at Naif Arab University for Security Sciences for their kind encouragement of this work.
Conflicts of Interest
The authors declare no conflicts of interest.
Abbreviations
The following abbreviations are used in this manuscript:
| AP | Average precision |
| AUROC | Area under the receiver operating characteristic curve |
| CI | Confidence interval |
| COCO | Common Objects in Context benchmark and evaluation protocol |
| CPU | Central processing unit |
| F1 | Harmonic mean of precision and recall |
| FLIR | Forward-looking infrared |
| FN | False negative |
| FP | False positive |
| GPU | Graphics processing unit |
| IoU | Intersection over union |
| M3FD | Multi-scenario multi-modality fusion dataset |
| mAP | Mean average precision |
| NMS | Non-maximum suppression |
| RGB | Red, green, and blue visible-light image modality |
| RGB–thermal | Visible and thermal paired sensing |
| TP | True positive |
| WBF | Weighted boxes fusion |
| YOLO | You Only Look Once object detector family |
References
- Yaseen, M. What is YOLOv8: An in-depth exploration of the internal features of the next-generation object detector. arXiv 2024, arXiv:2408.15857. [Google Scholar]
- Lee, S.; Kim, T.; Shin, J.; Kim, N.; Choi, Y. INSANet: INtra-INter spectral attention network for effective feature fusion of multispectral pedestrian detection. Sensors 2024, 24, 1168. [Google Scholar] [CrossRef] [Scilit]
- Zhang, X.; Zhang, X.; Wang, J.; Ying, J.; Sheng, Z.; Yu, H.; Li, C.; Shen, H.-L. TFDet: Target-aware fusion for RGB-T pedestrian detection. IEEE Trans. Neural Netw. Learn. Syst. 2025, 36, 13276–13290. [Google Scholar] [CrossRef] [Scilit]
- Teledyne FLIR. Teledyne FLIR ADAS Thermal Dataset v2. Available online: https://www.flir.com/oem/adas/dataset/ (accessed on 23 May 2026).
- Xing, Y.; Yang, S.; Wang, S.; Zhang, S.; Liang, G.; Zhang, X.; Zhang, Y. MS-DETR: Multispectral pedestrian detection transformer with loosely coupled fusion and modality-balanced optimization. IEEE Trans. Intell. Transp. Syst. 2024, 25, 20628–20642. [Google Scholar] [CrossRef] [Scilit]
- Cao, Y.; Luo, X.; Yang, J.; Cao, Y.; Yang, M.Y. Locality guided cross-modal feature aggregation and pixel-level fusion for multispectral pedestrian detection. Inf. Fusion 2022, 88, 1–11. [Google Scholar] [CrossRef] [Scilit]
- Liu, J.; Fan, X.; Huang, Z.; Wu, G.; Liu, R.; Zhong, W.; Luo, Z. Target-aware dual adversarial learning and a multi-scenario multi-modality benchmark to fuse infrared and visible for object detection. In Proceedings of the IEEE/CVF Conference on Computer Vision and Pattern Recognition (CVPR), New Orleans, LA, USA, 18–24 June 2022; pp. 5802–5811. [Google Scholar] [CrossRef] [Scilit]
- Zhao, Y.; Gao, Y.; Yang, X.; Yang, L. Multispectral target detection based on deep feature fusion of visible and infrared modalities. Appl. Sci. 2025, 15, 5857. [Google Scholar] [CrossRef] [Scilit]
- Küppers, F.; Haselhoff, A.; Kronenberger, J.; Schneider, J. Confidence calibration for object detection and segmentation. In Deep Neural Networks and Data for Automated Driving: Robustness, Uncertainty Quantification, and Insights Towards Safety; Fingscheidt, T., Gottschalk, H., Houben, S., Eds.; Springer: Cham, Switzerland, 2022; pp. 225–250. [Google Scholar] [CrossRef] [Scilit]
- Küppers, F.; Kronenberger, J.; Shantia, A.; Haselhoff, A. Multivariate confidence calibration for object detection. In Proceedings of the IEEE/CVF Conference on Computer Vision and Pattern Recognition Workshops (CVPRW), Seattle, WA, USA, 14–19 June 2020; pp. 1322–1330. [Google Scholar] [CrossRef] [Scilit]
- Kuzucu, S.; Oksuz, K.; Sadeghi, J.; Dokania, P.K. On calibration of object detectors: Pitfalls, evaluation and baselines. In Computer Vision—ECCV 2024; Lecture Notes in Computer Science; Springer: Cham, Switzerland, 2025; Volume 15079, pp. 185–204. [Google Scholar] [CrossRef] [Scilit]
- Zhang, H.; Fromont, E.; Lefèvre, S.; Avignon, B. Multispectral fusion for object detection with cyclic fuse-and-refine blocks. In Proceedings of the IEEE International Conference on Image Processing (ICIP), Abu Dhabi, United Arab Emirates, 25–28 October 2020; pp. 276–280. [Google Scholar] [CrossRef] [Scilit]
- Wang, Z.; Zhang, Q. Real-time aerial multispectral object detection with dynamic modality-balanced pixel-level fusion. Sensors 2025, 25, 3039. [Google Scholar] [CrossRef] [Scilit]
- Zhou, K.; Chen, L.; Cao, X. Improving multispectral pedestrian detection by addressing modality imbalance problems. In Computer Vision—ECCV 2020; Lecture Notes in Computer Science; Springer: Cham, Switzerland, 2020; Volume 12363, pp. 787–803. [Google Scholar] [CrossRef] [Scilit]
- Das, A.; Das, S.; Sistu, G.; Horgan, J.; Bhattacharya, U.; Jones, E.; Glavin, M.; Eising, C. Revisiting modality imbalance in multimodal pedestrian detection. In Proceedings of the IEEE International Conference on Image Processing (ICIP), Kuala Lumpur, Malaysia, 8–11 October 2023; pp. 1755–1759. [Google Scholar] [CrossRef] [Scilit]
- Zhang, H.; Fromont, E.; Lefèvre, S.; Avignon, B. Guided attentive feature fusion for multispectral pedestrian detection. In Proceedings of the IEEE/CVF Winter Conference on Applications of Computer Vision (WACV), Waikoloa, HI, USA, 3–8 January 2021; pp. 72–80. [Google Scholar] [CrossRef] [Scilit]
- Shen, J.; Chen, Y.; Liu, Y.; Zuo, X.; Fan, H.; Yang, W. ICAFusion: Iterative cross-attention guided feature fusion for multispectral object detection. Pattern Recognit. 2024, 145, 109913. [Google Scholar] [CrossRef] [Scilit]
- Yang, Y.; Xu, K.; Wang, K. Cascaded information enhancement and cross-modal attention feature fusion for multispectral pedestrian detection. Front. Phys. 2023, 11, 1121311. [Google Scholar] [CrossRef] [Scilit]
- Liu, Z.; Zhu, C.; Li, Y.; Ye, P. A novel implicit cross-attention framework for RGB-T object detection. Expert Syst. Appl. 2026, 314, 131570. [Google Scholar] [CrossRef] [Scilit]
- Qu, Z.; Yang, J.; Xia, S. GCMF-Net: Global-aware cross-attention and mask-guided fusion for multispectral object detection. Expert Syst. Appl. 2026, 298, 129679. [Google Scholar] [CrossRef] [Scilit]
- Zhang, J.; Song, X.; Li, Y.; Liang, D.; Zhang, Z.; Cai, J. Adaptive dual cross-attention network for multispectral object detection in autonomous driving. Expert Syst. Appl. 2026, 318, 132012. [Google Scholar] [CrossRef] [Scilit]
- Xie, J.; Anwer, R.M.; Cholakkal, H.; Nie, J.; Cao, J.; Laaksonen, J.; Khan, F.S. Learning a dynamic cross-modal network for multispectral pedestrian detection. In Proceedings of the 30th ACM International Conference on Multimedia, Lisboa, Portugal, 10–14 October 2022; pp. 4043–4052. [Google Scholar] [CrossRef] [Scilit]
- Feng, Y.; Luo, E.; Lu, H.; Zhai, S. Cross-modality feature fusion for night pedestrian detection. Front. Phys. 2024, 12, 1356248. [Google Scholar] [CrossRef] [Scilit]
- He, X.; Tang, C.; Zou, X.; Zhang, W. Multispectral object detection via cross-modal conflict-aware learning. In Proceedings of the 31st ACM International Conference on Multimedia, Ottawa, ON, Canada, 29 October–3 November 2023; pp. 1465–1474. [Google Scholar] [CrossRef] [Scilit]
- Jang, J.; Park, C.; Kim, H.; Lee, J.; Paik, J. Multispectral object detection enhanced by cross-modal information complementary and cosine similarity channel resampling modules. In Proceedings of the IEEE/CVF Winter Conference on Applications of Computer Vision (WACV), Tucson, AZ, USA, 28 February–4 March 2025; pp. 9419–9428. [Google Scholar]
- Ning, L.; Liu, X.; Zhou, L.; Zou, X. Cross-modal object detection based on content-guided feature fusion and self-calibration. Sensors 2025, 25, 3392. [Google Scholar] [CrossRef] [Scilit]
- Han, S.; Chai, C.; Hu, M.; Wang, Y.; Jiao, T.; Wang, J.; Lv, H. TCCDNet: A multimodal pedestrian detection network integrating cross-modal complementarity with deep feature fusion. Sensors 2025, 25, 2727. [Google Scholar] [CrossRef] [Scilit]
- Fang, Q.; Han, D.; Wang, Z. Cross-modality fusion transformer for multispectral object detection. arXiv 2021, arXiv:2111.00273. [Google Scholar]
- Cao, Y.; Bin, J.; Hamari, J.; Blasch, E.; Liu, Z. Multimodal object detection by channel switching and spatial attention. In Proceedings of the IEEE/CVF Conference on Computer Vision and Pattern Recognition Workshops (CVPRW), Vancouver, BC, Canada, 17–24 June 2023; pp. 403–411. [Google Scholar] [CrossRef] [Scilit]
- Dong, W.; Zhu, H.; Lin, S.; Luo, X.; Shen, Y.; Liu, X.; Zhang, J.; Guo, G.; Zhang, B. Fusion-Mamba for cross-modality object detection. arXiv 2024, arXiv:2404.09146v1. [Google Scholar]
- Guo, J.; Gao, C.; Liu, F.; Meng, D.; Gao, X. DAMSDet: Dynamic adaptive multispectral detection transformer with competitive query selection and adaptive feature fusion. In Computer Vision—ECCV 2024; Lecture Notes in Computer Science; Springer: Cham, Switzerland, 2025; Volume 15085, pp. 464–481. [Google Scholar] [CrossRef] [Scilit]
- Chen, Y.-T.; Shi, J.; Ye, Z.; Mertz, C.; Ramanan, D.; Kong, S. Multimodal object detection via probabilistic ensembling. In Computer Vision—ECCV 2022; Lecture Notes in Computer Science; Springer: Cham, Switzerland, 2022; Volume 13669, pp. 139–158. [Google Scholar] [CrossRef] [Scilit]
- Solovyev, R.; Wang, W.; Gabruseva, T. Weighted boxes fusion: Ensembling boxes from different object detection models. Image Vis. Comput. 2021, 107, 104117. [Google Scholar] [CrossRef] [Scilit]
- Bodla, N.; Singh, B.; Chellappa, R.; Davis, L.S. Soft-NMS—Improving object detection with one line of code. In Proceedings of the IEEE International Conference on Computer Vision (ICCV), Venice, Italy, 22–29 October 2017; pp. 5562–5570. [Google Scholar] [CrossRef] [Scilit]
- Dobrzycki, A.D.; Bernardos, A.M. To fuse or not to fuse: Enhancing military operation object detection with multimodal late fusion and color space optimization. Appl. Intell. 2026, 56, 100. [Google Scholar] [CrossRef] [Scilit]
- Jia, X.; Zhu, C.; Li, M.; Tang, W.; Zhou, W. LLVIP: A visible-infrared paired dataset for low-light vision. In Proceedings of the IEEE/CVF International Conference on Computer Vision Workshops (ICCVW), Montreal, QC, Canada, 11–17 October 2021; pp. 3489–3497. [Google Scholar] [CrossRef] [Scilit]
- Xu, S.; Yang, S.; Ding, W.; Wang, H.; Fan, M.; Sun, Y.; Li, S. MeniOmni: A structured multimodal benchmark for holistic meniscus injury assessment. arXiv 2026, arXiv:2605.28161. [Google Scholar]
- Jocher, G.; Chaurasia, A.; Qiu, J. Ultralytics YOLOv8, Version 8.0.0. 2023. Available online: https://github.com/ultralytics/ultralytics (accessed on 23 May 2026).
- Terven, J.; Córdova-Esparza, D.-M.; Romero-González, J.-A. A comprehensive review of YOLO architectures in computer vision: From YOLOv1 to YOLOv8 and YOLO-NAS. Mach. Learn. Knowl. Extr. 2023, 5, 1680–1716. [Google Scholar] [CrossRef] [Scilit]
- Field, C.A.; Welsh, A.H. Bootstrapping clustered data. J. R. Stat. Soc. Ser. B Stat. Methodol. 2007, 69, 369–390. [Google Scholar] [CrossRef] [Scilit]
- Roberts, D.R.; Bahn, V.; Ciuti, S.; Boyce, M.S.; Elith, J.; Guillera-Arroita, G.; Hauenstein, S.; Lahoz-Monfort, J.J.; Schröder, B.; Thuiller, W.; et al. Cross-validation strategies for data with temporal, spatial, hierarchical, or phylogenetic structure. Ecography 2017, 40, 913–929. [Google Scholar] [CrossRef] [Scilit]
- Lin, T.-Y.; Maire, M.; Belongie, S.; Hays, J.; Perona, P.; Ramanan, D.; Dollár, P.; Zitnick, C.L. Microsoft COCO: Common objects in context. In Computer Vision—ECCV 2014; Lecture Notes in Computer Science; Springer: Cham, Switzerland, 2014; Volume 8693, pp. 740–755. [Google Scholar] [CrossRef] [Scilit]
- Padilla, R.; Netto, S.L.; da Silva, E.A.B. A survey on performance metrics for object-detection algorithms. In Proceedings of the International Conference on Systems, Signals and Image Processing (IWSSIP), Niterói, Brazil, 1–3 July 2020; pp. 237–242. [Google Scholar] [CrossRef] [Scilit]
- Otsu, N. A threshold selection method from gray-level histograms. IEEE Trans. Syst. Man Cybern. 1979, 9, 62–66. [Google Scholar] [CrossRef] [Scilit]
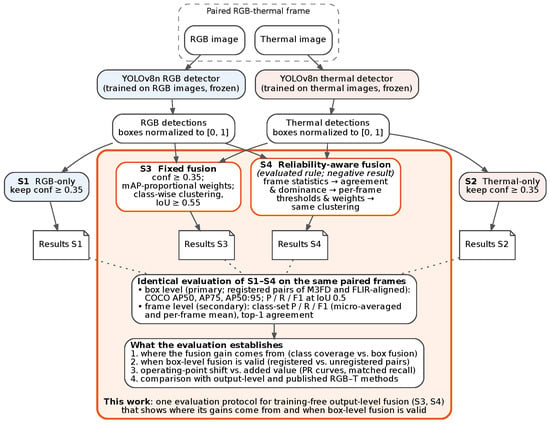
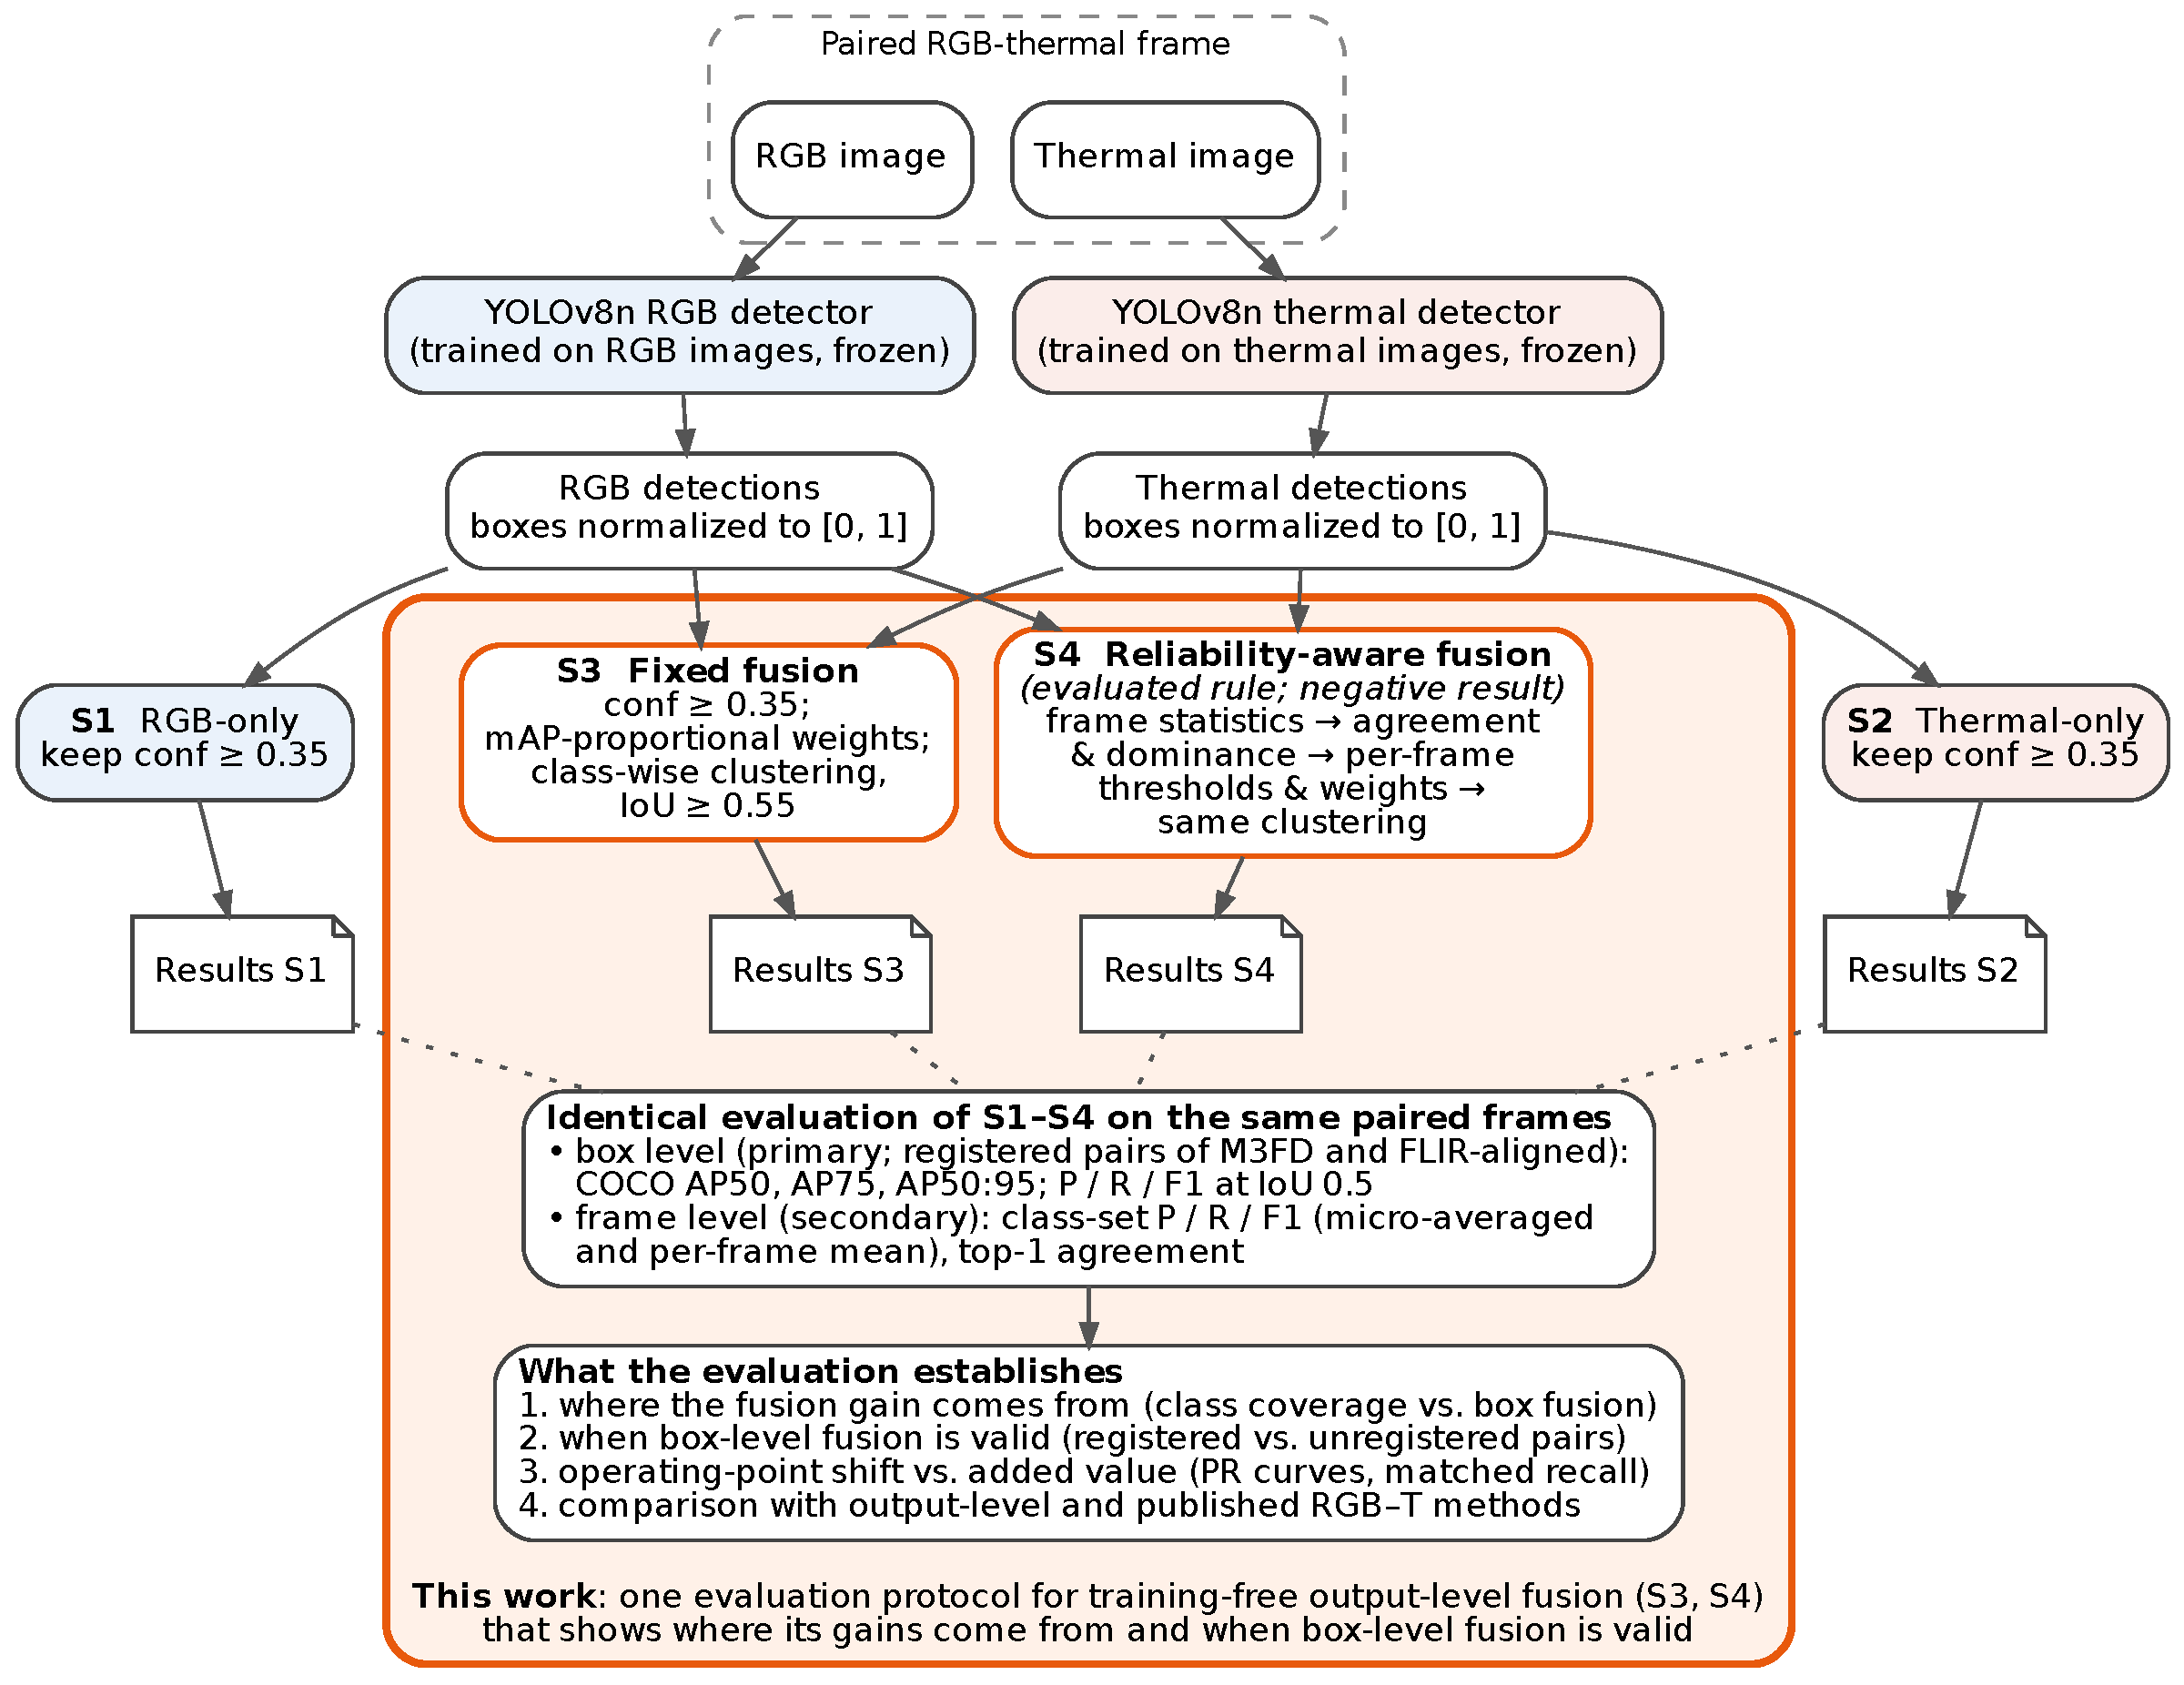
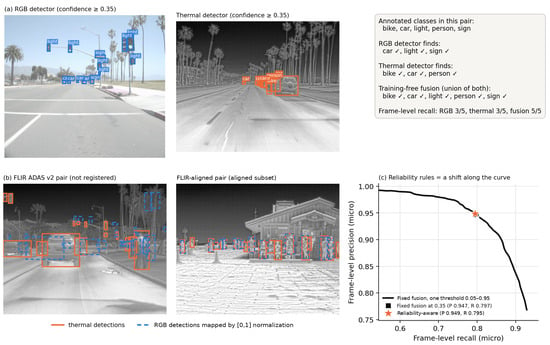
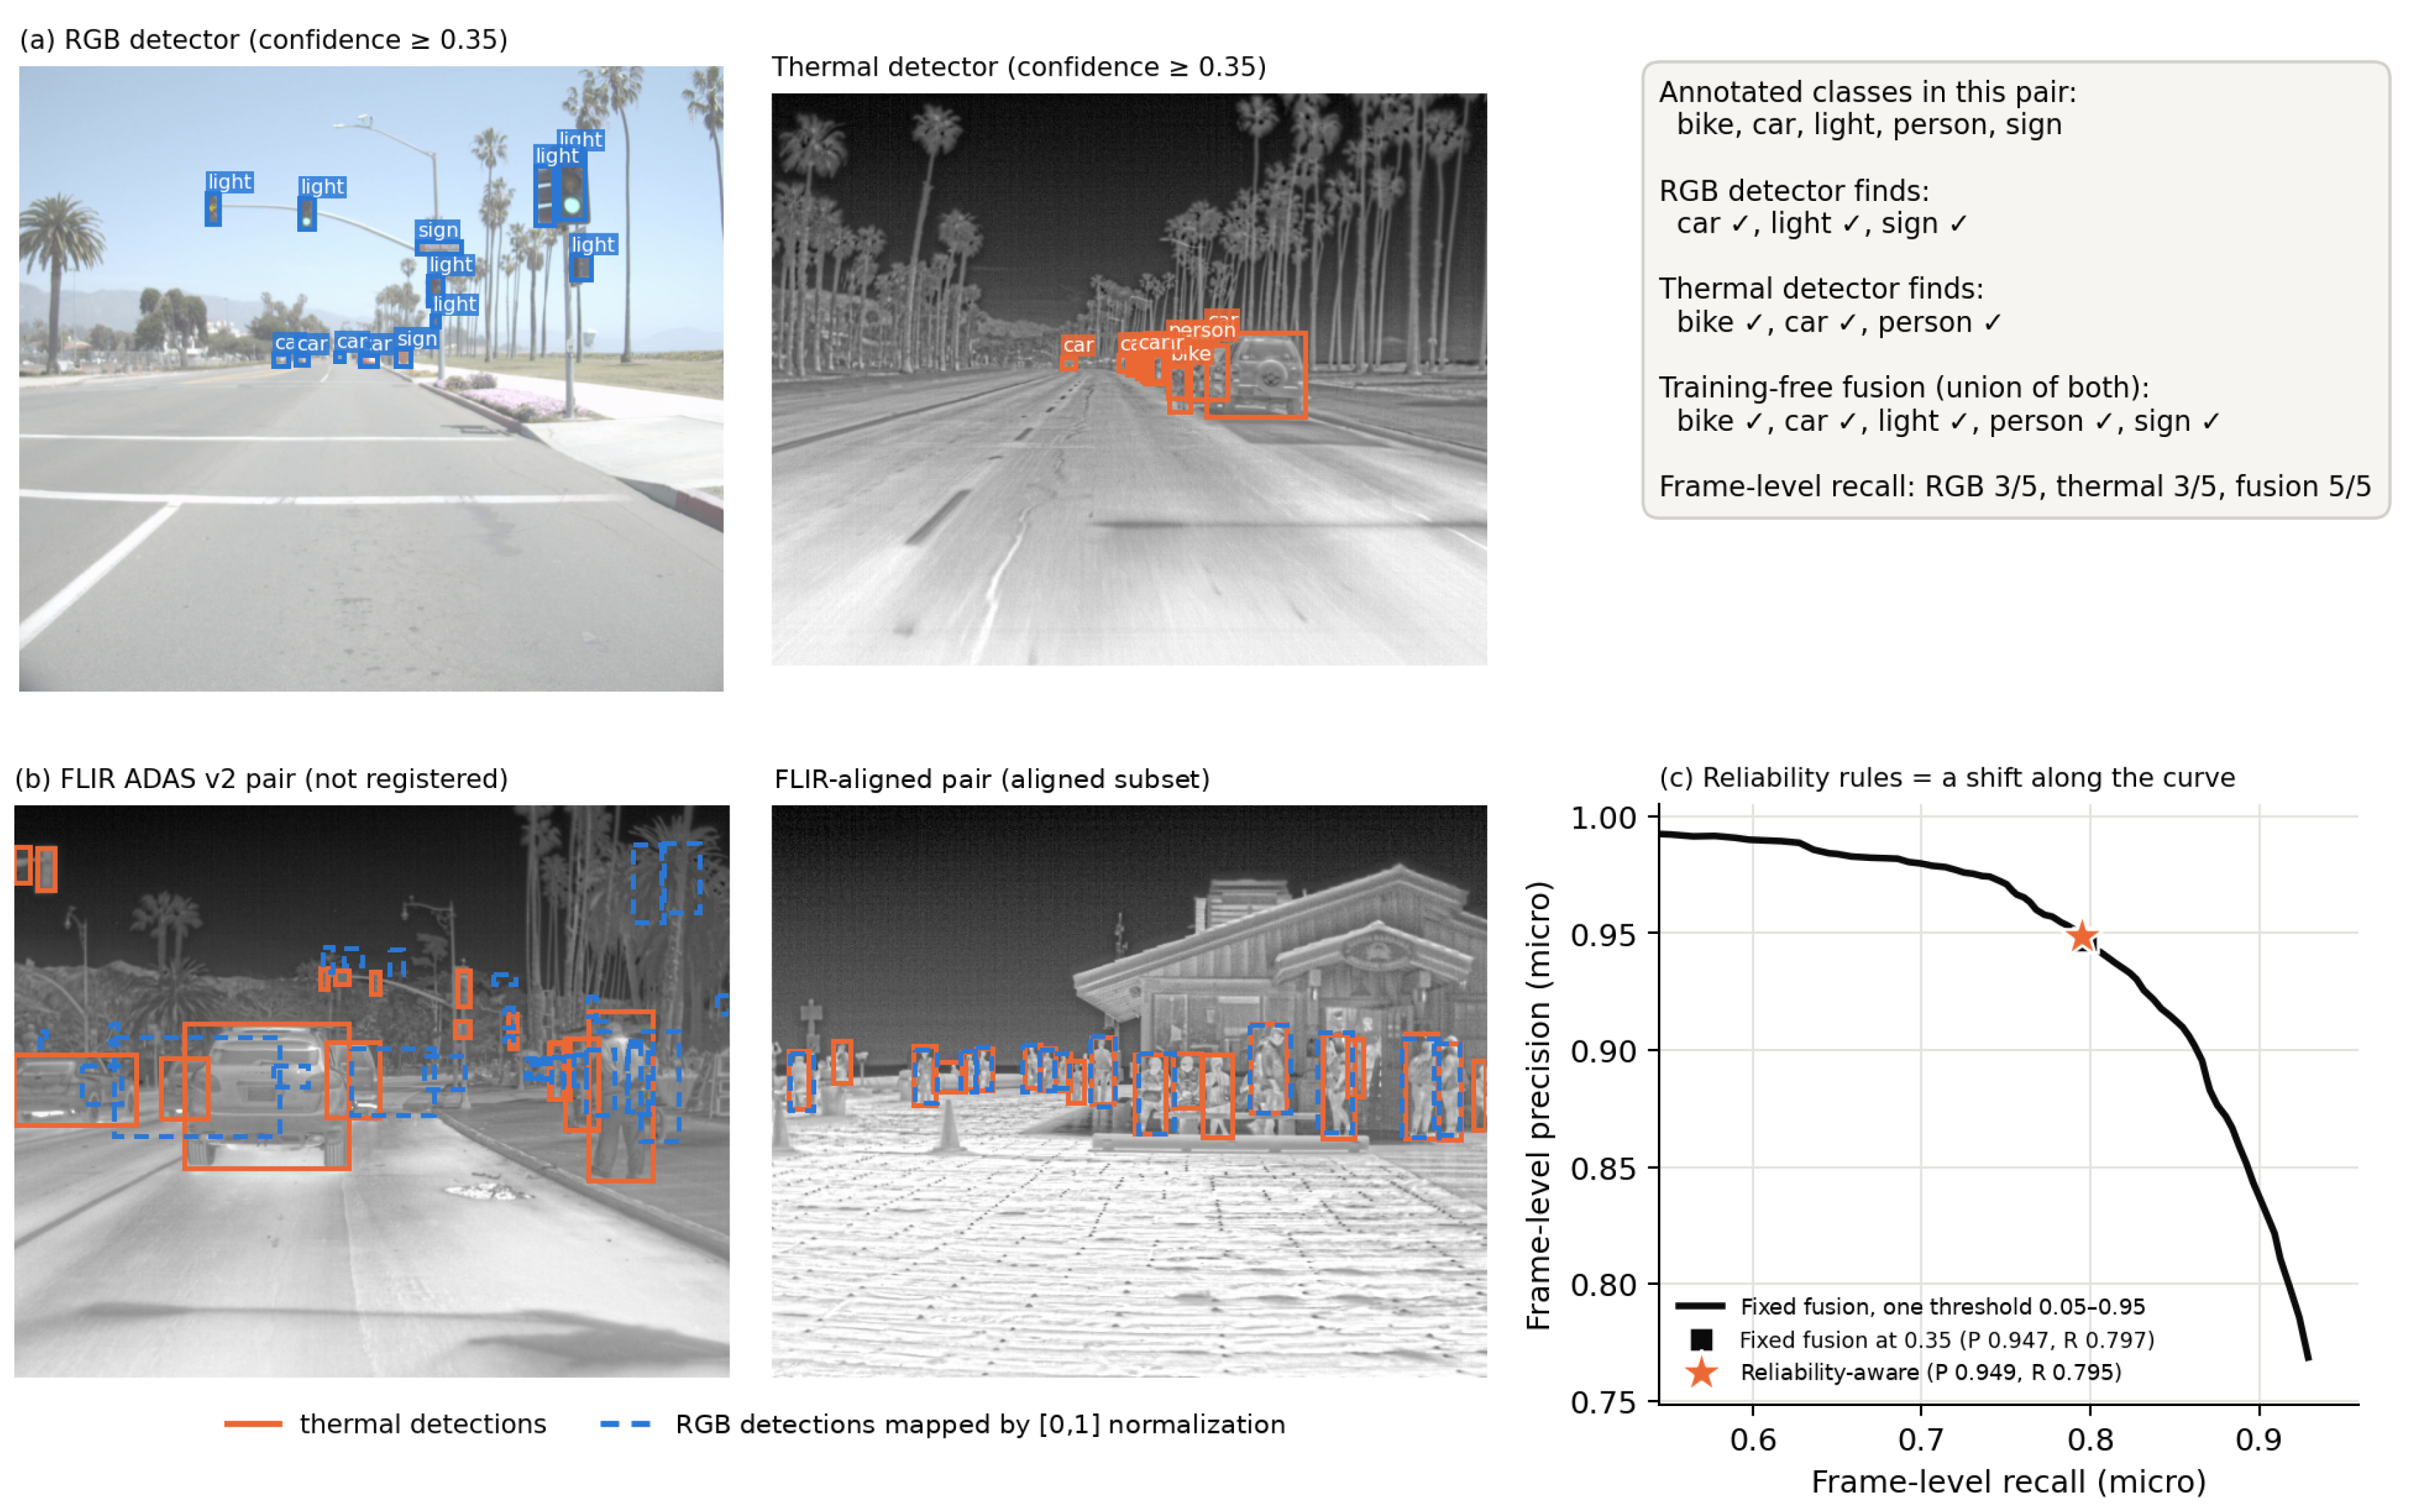
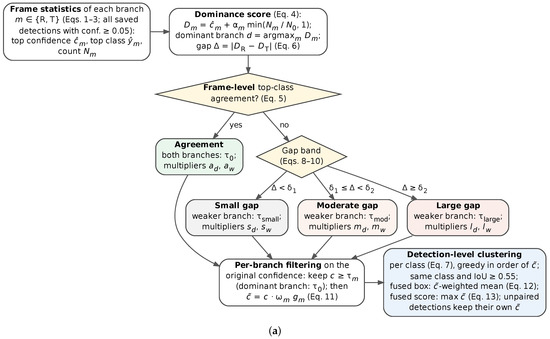
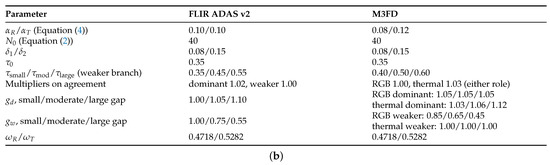
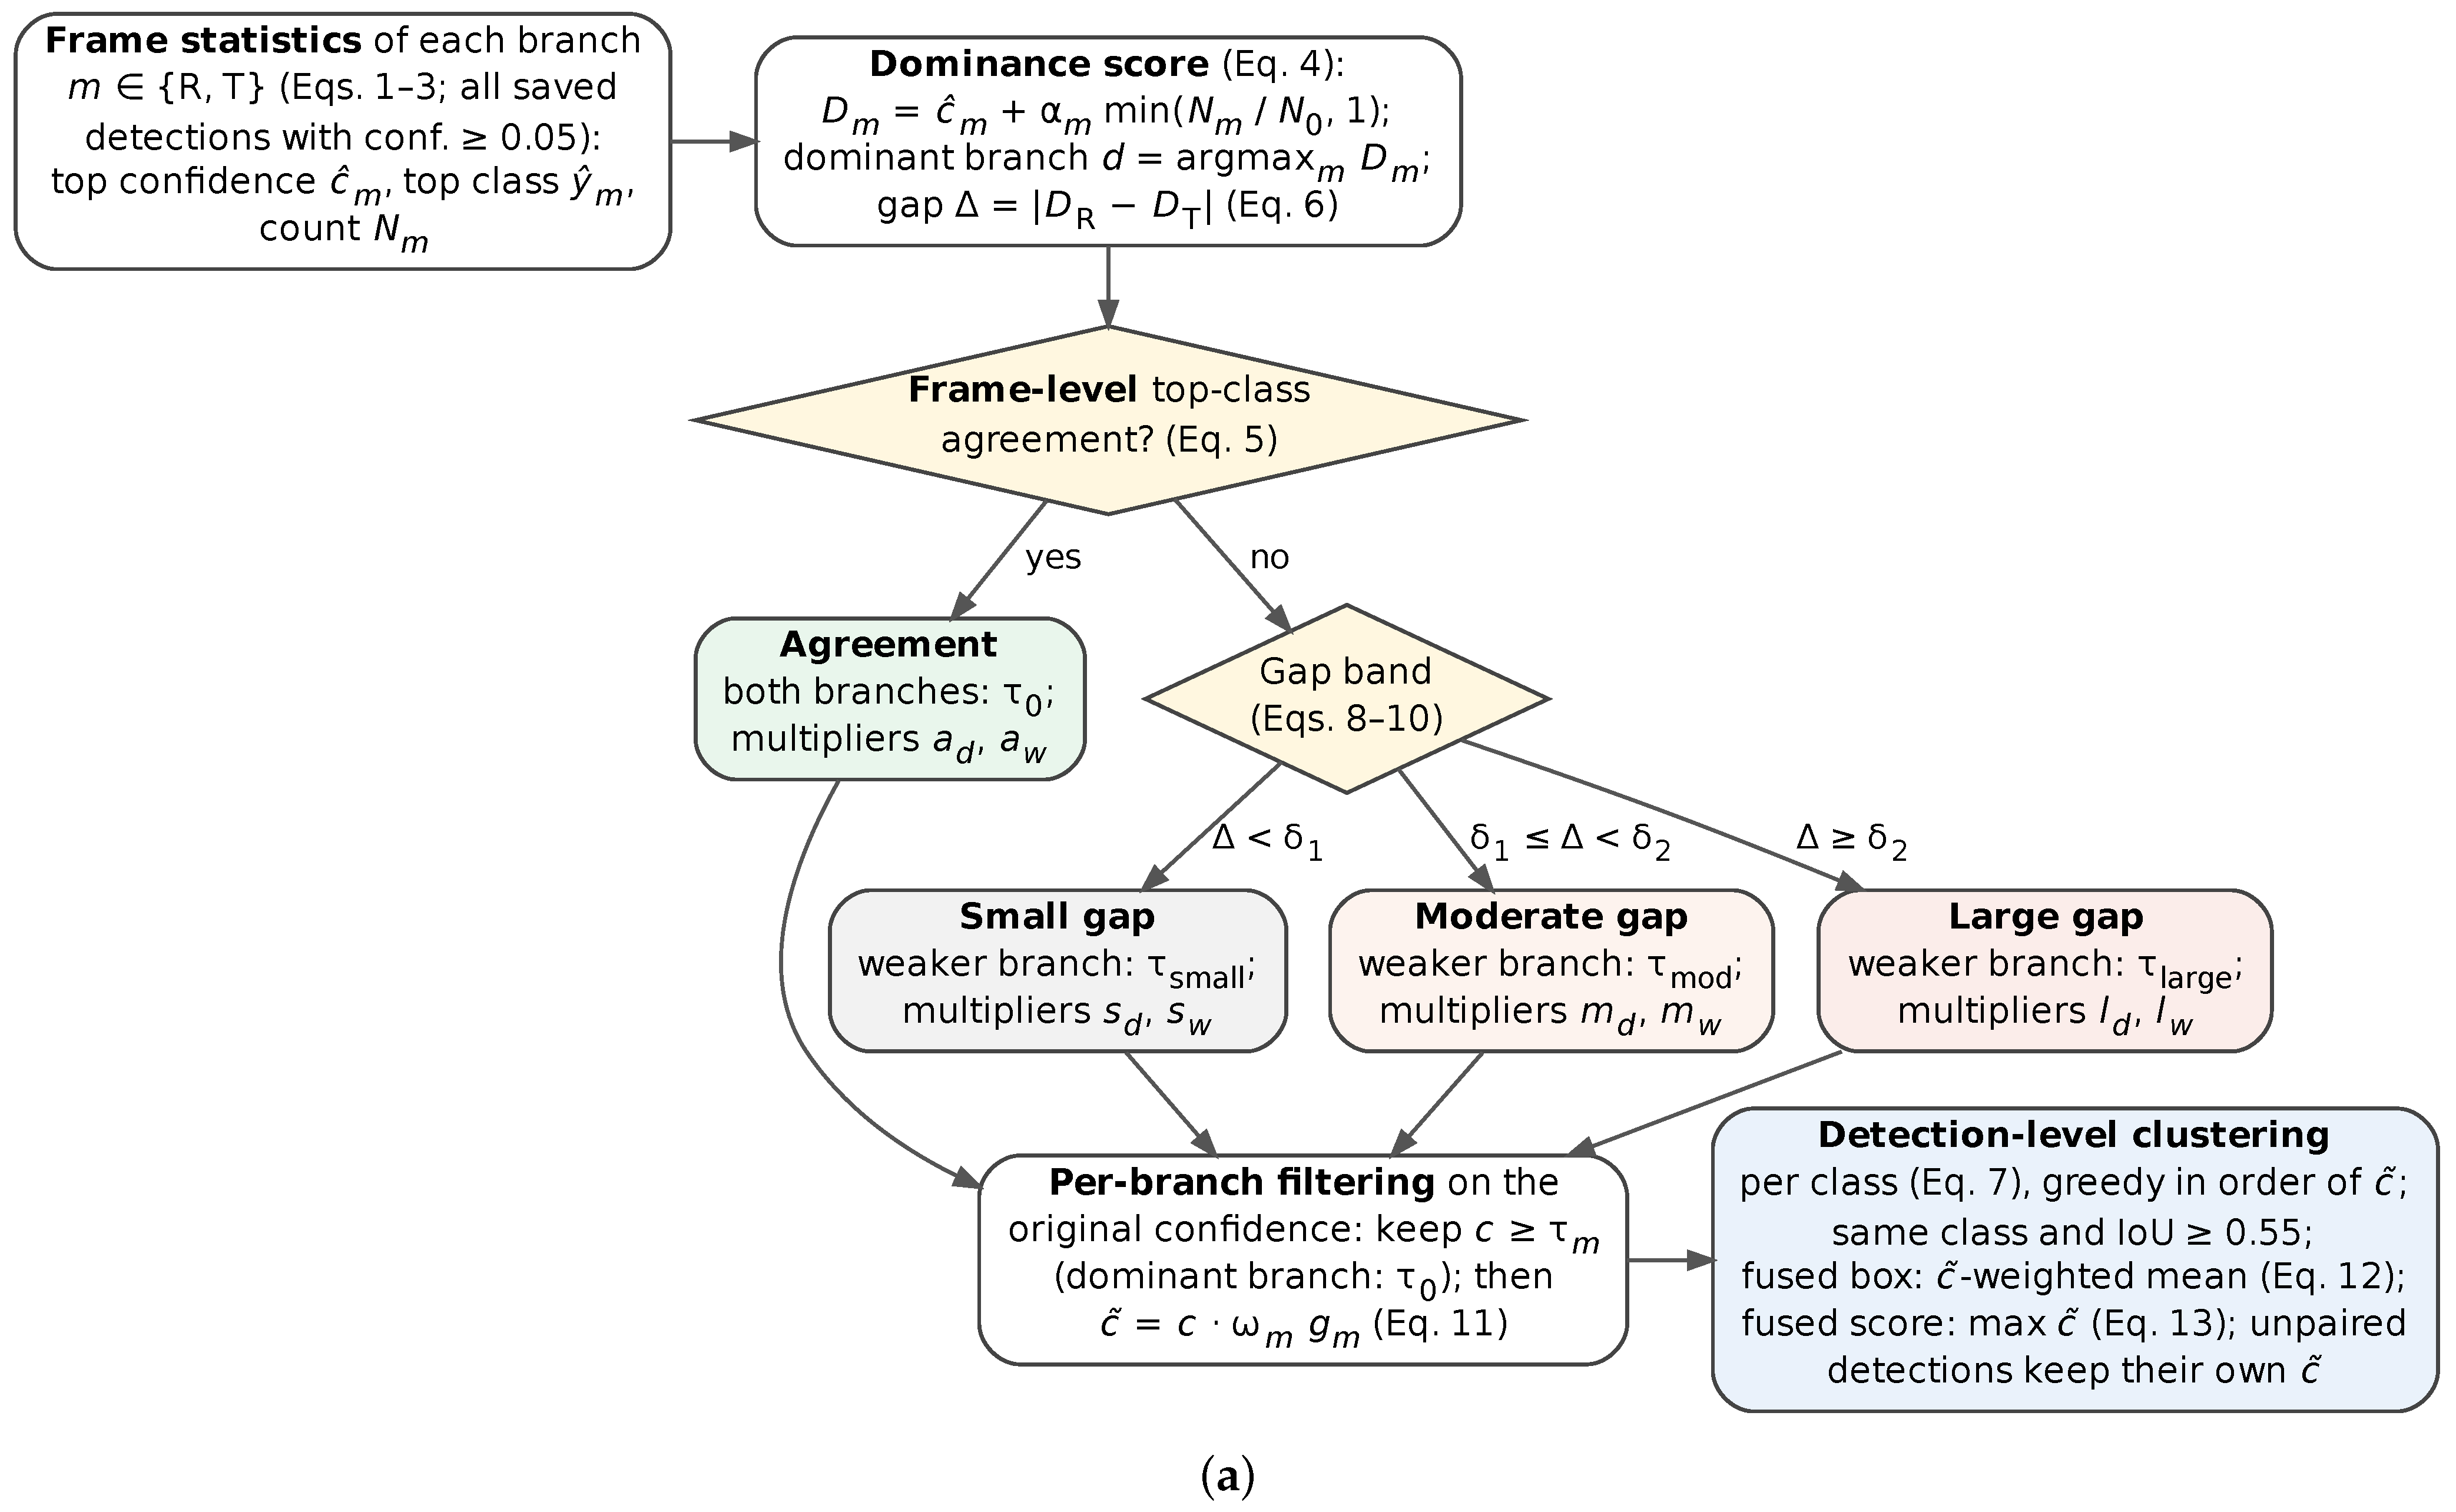
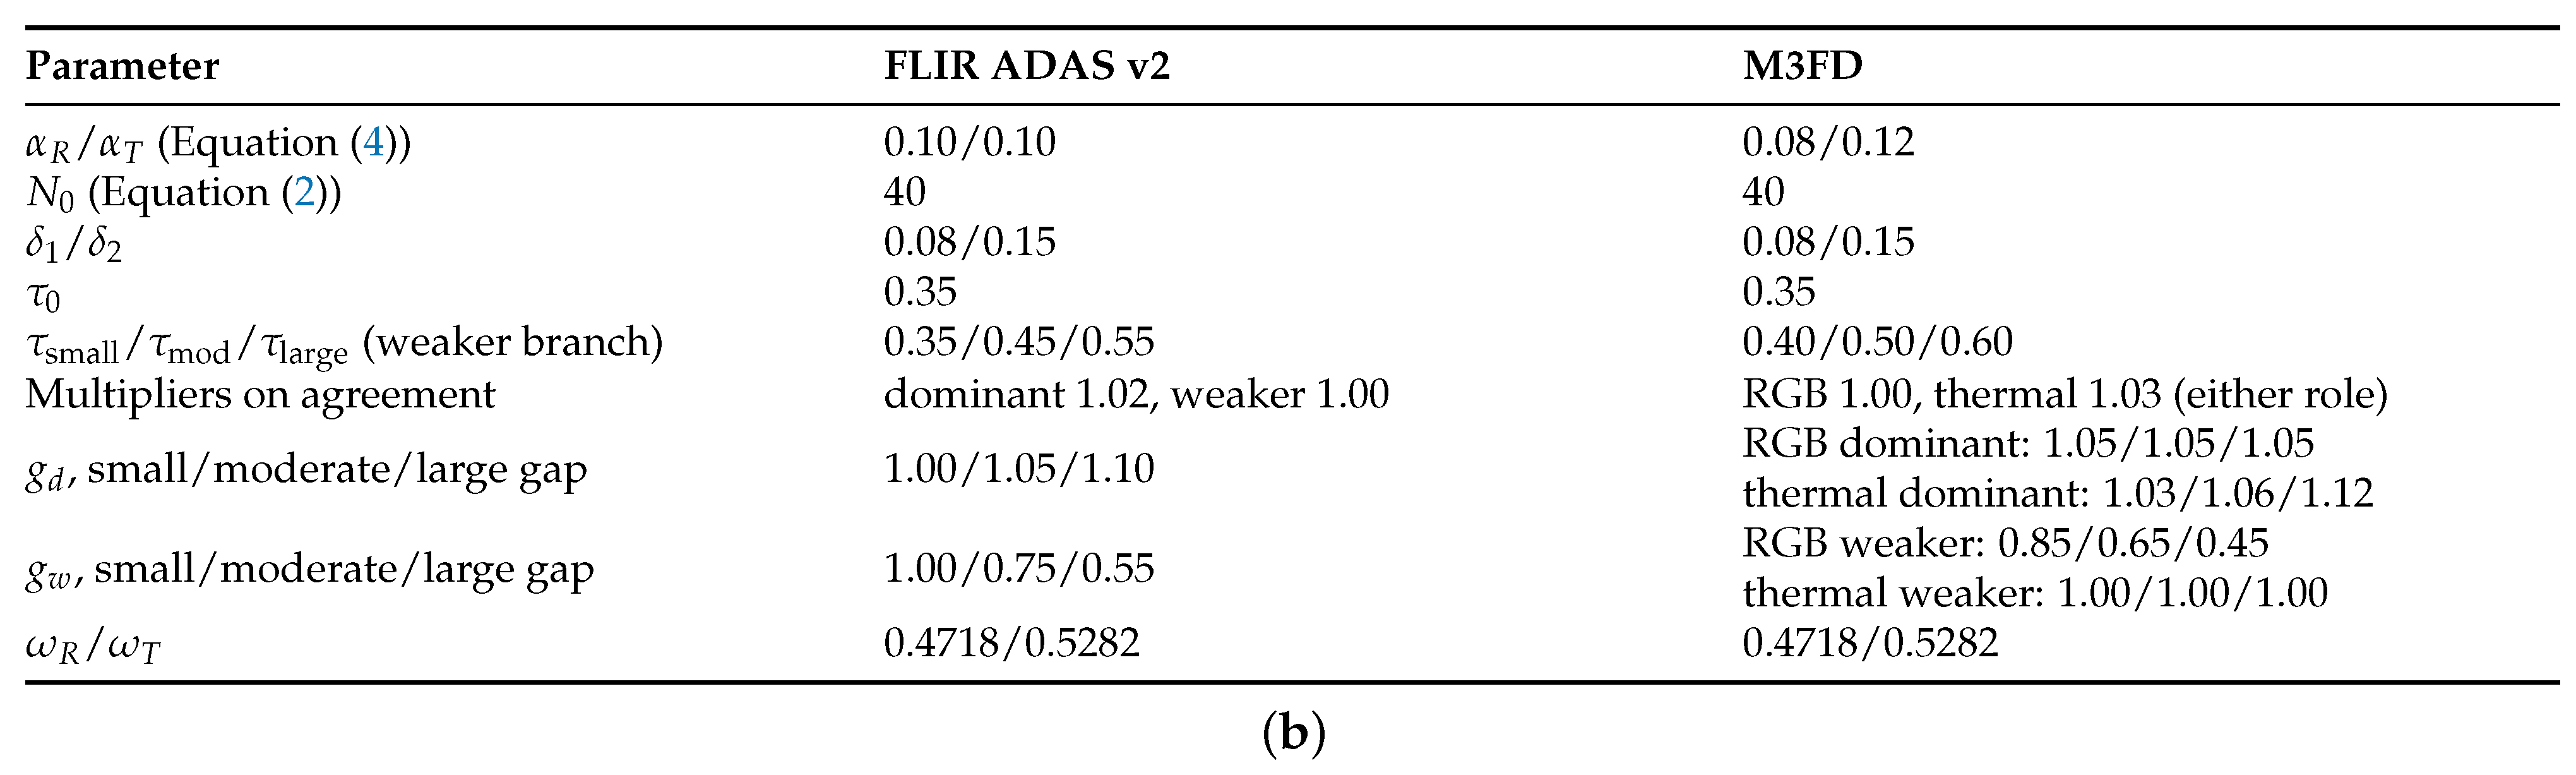
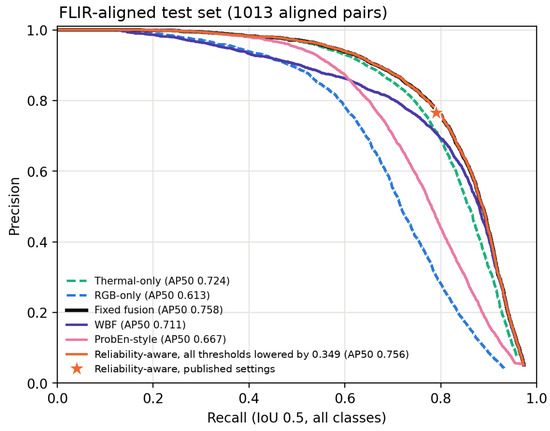
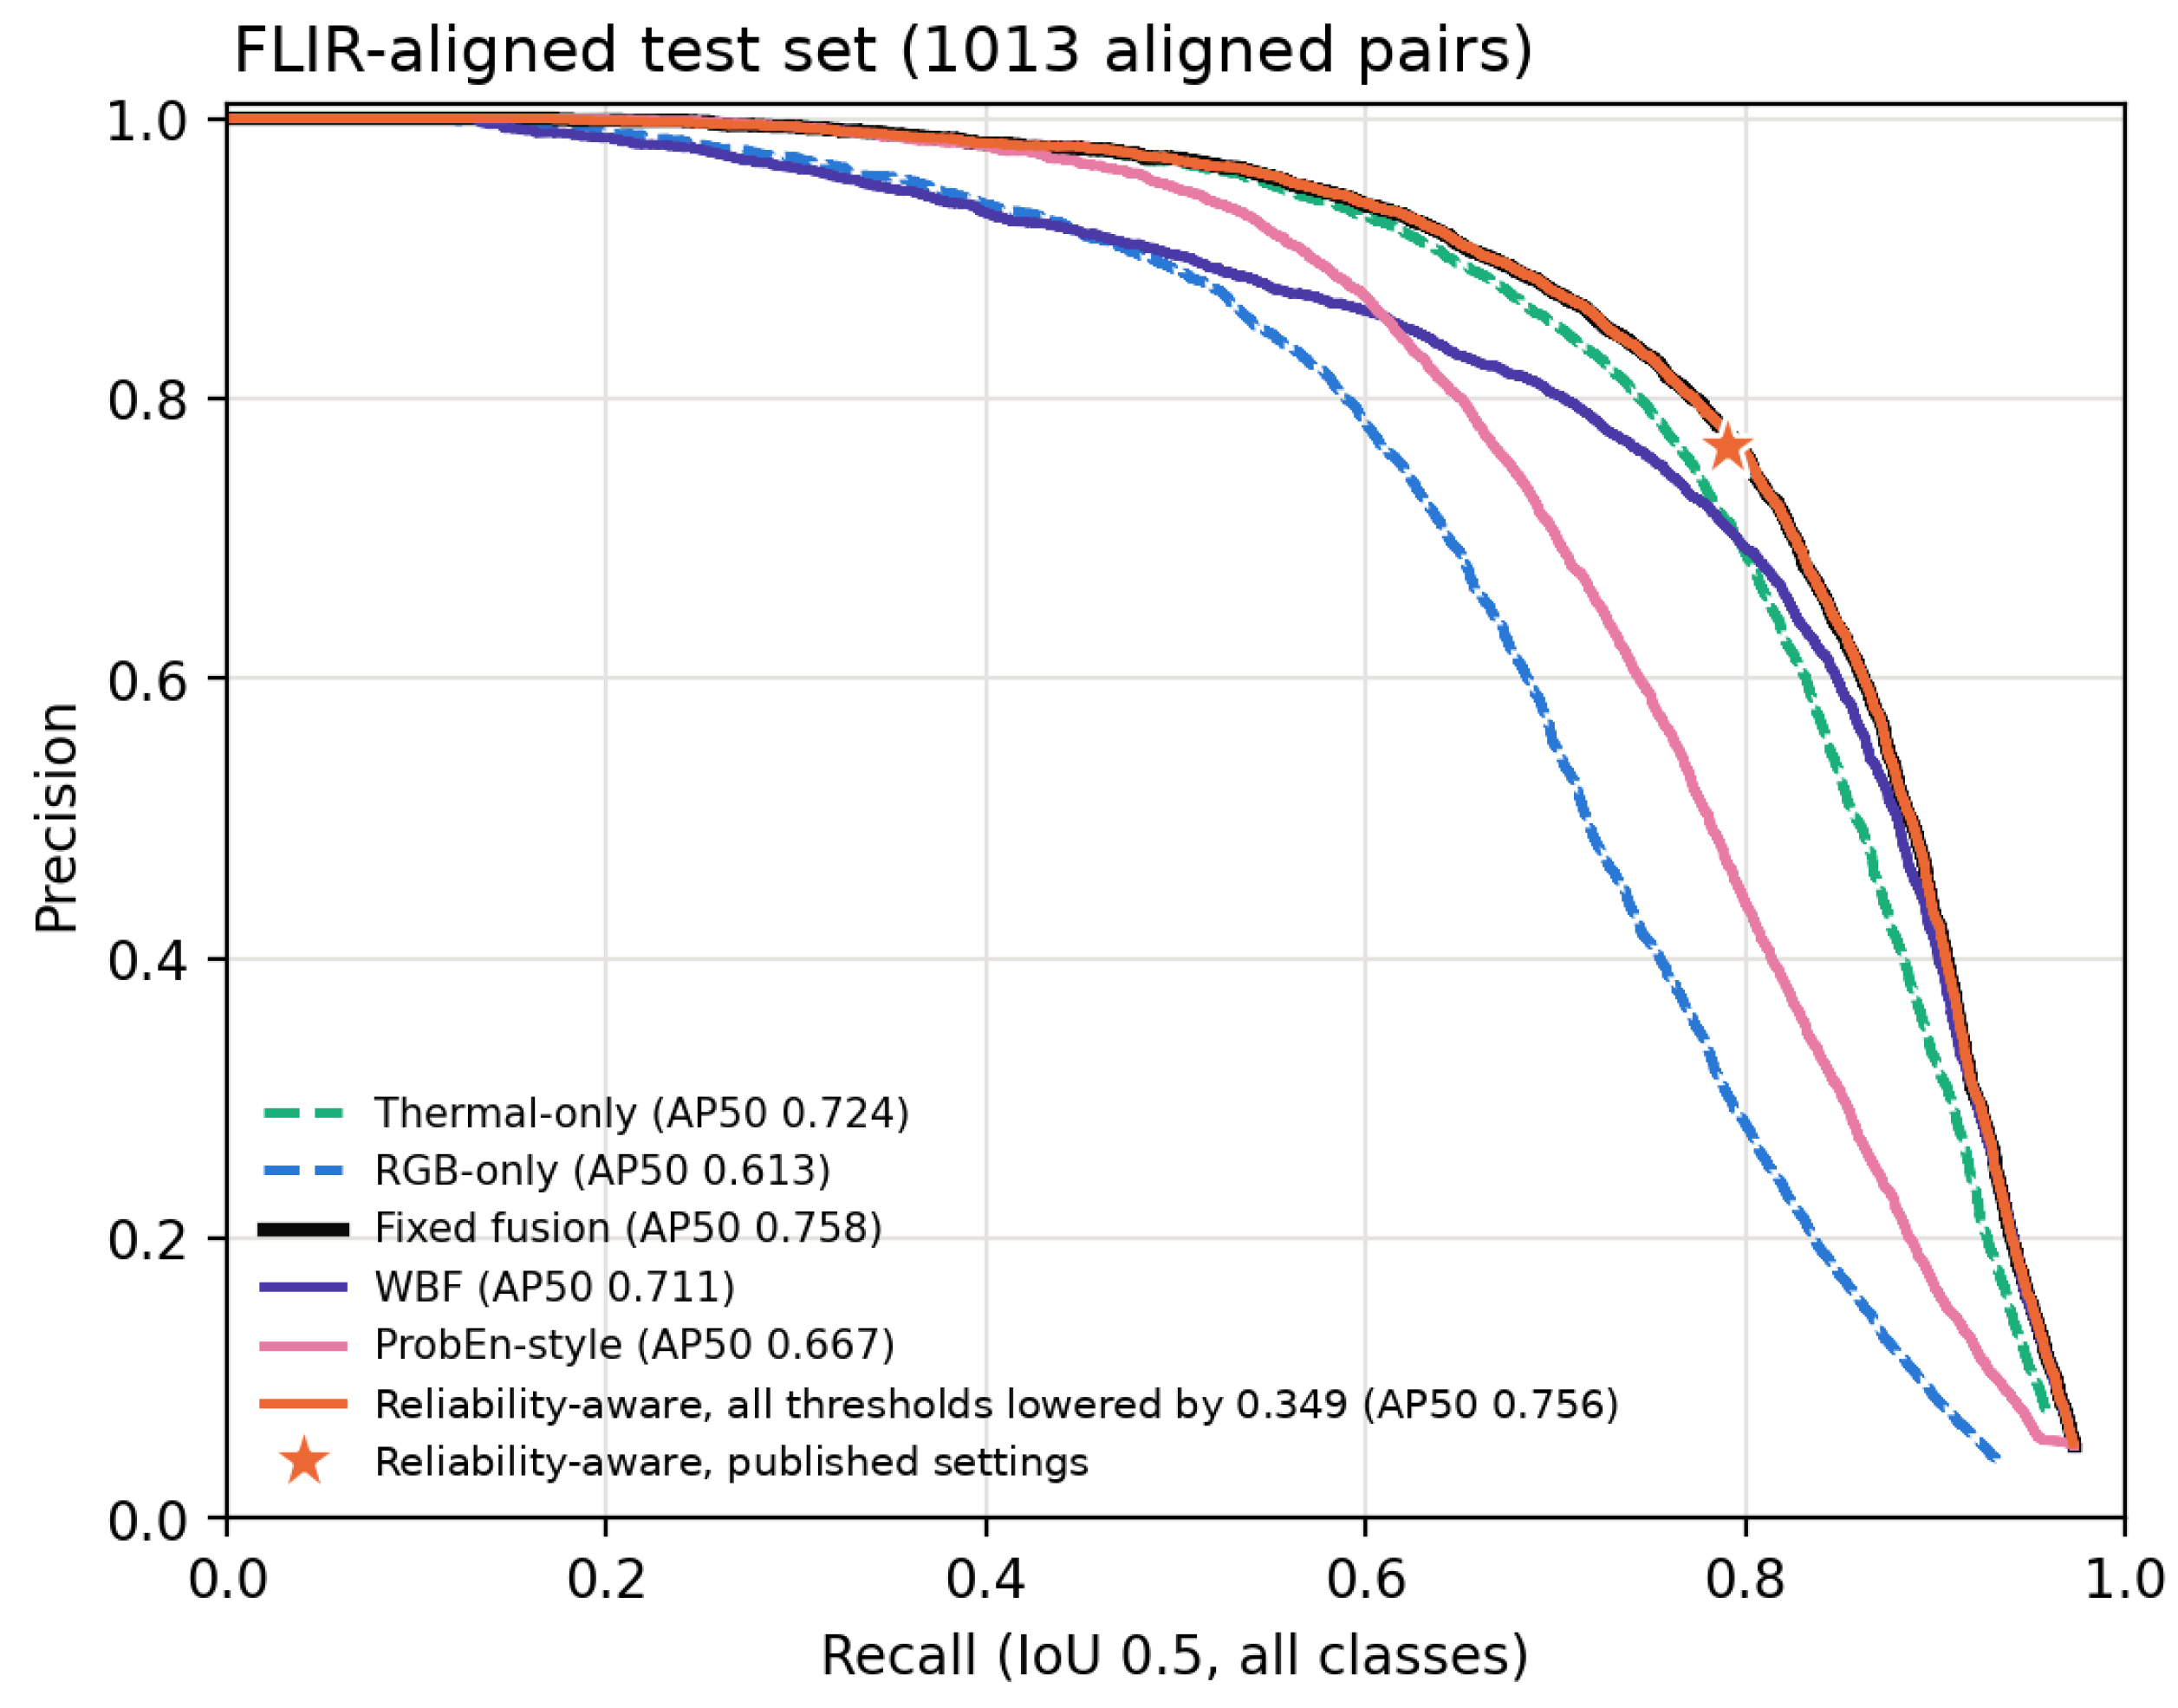
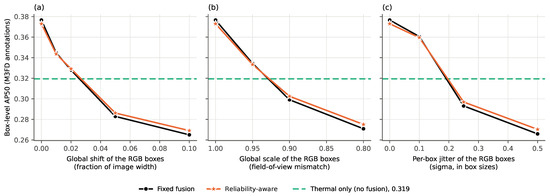
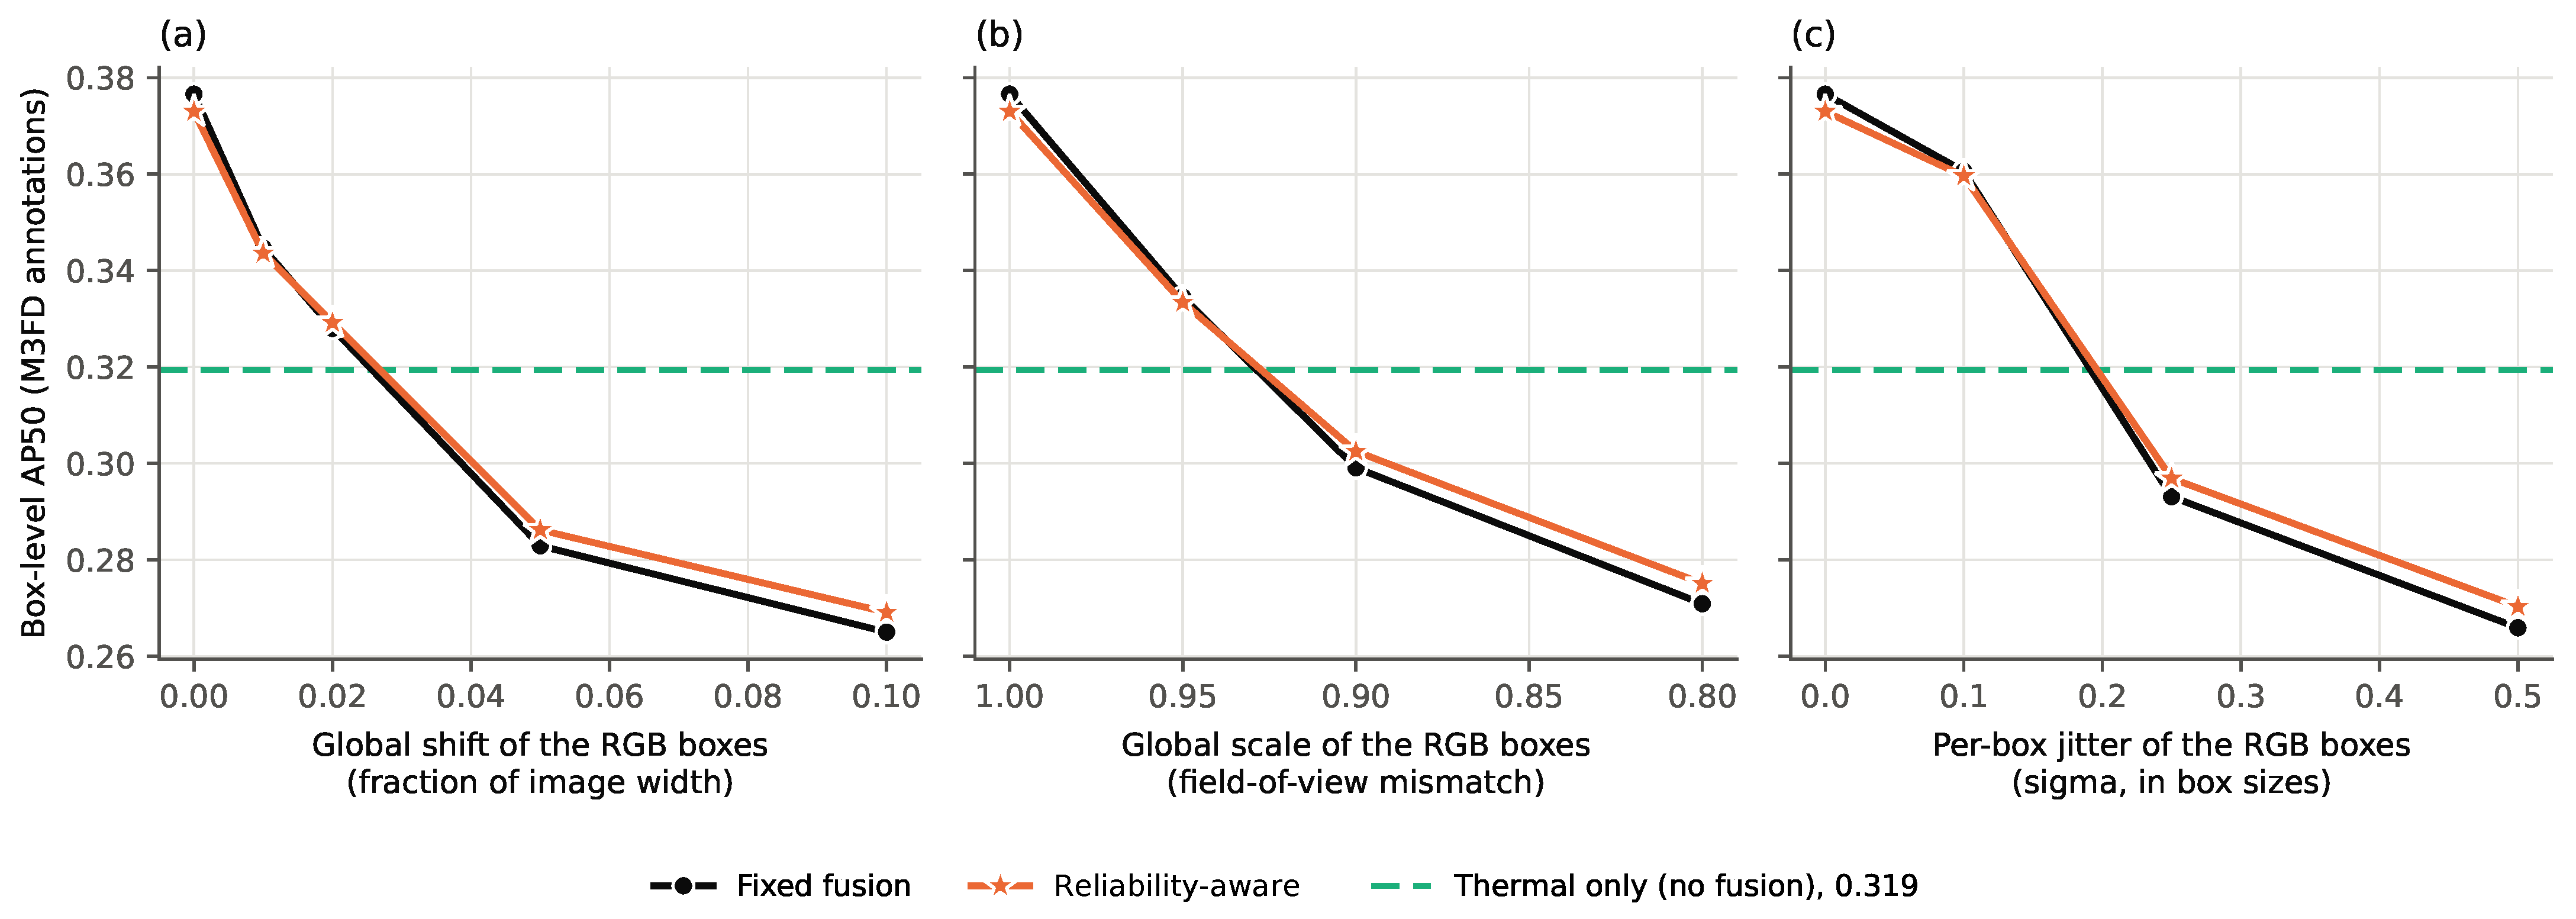
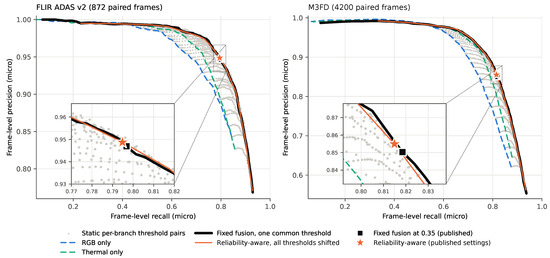
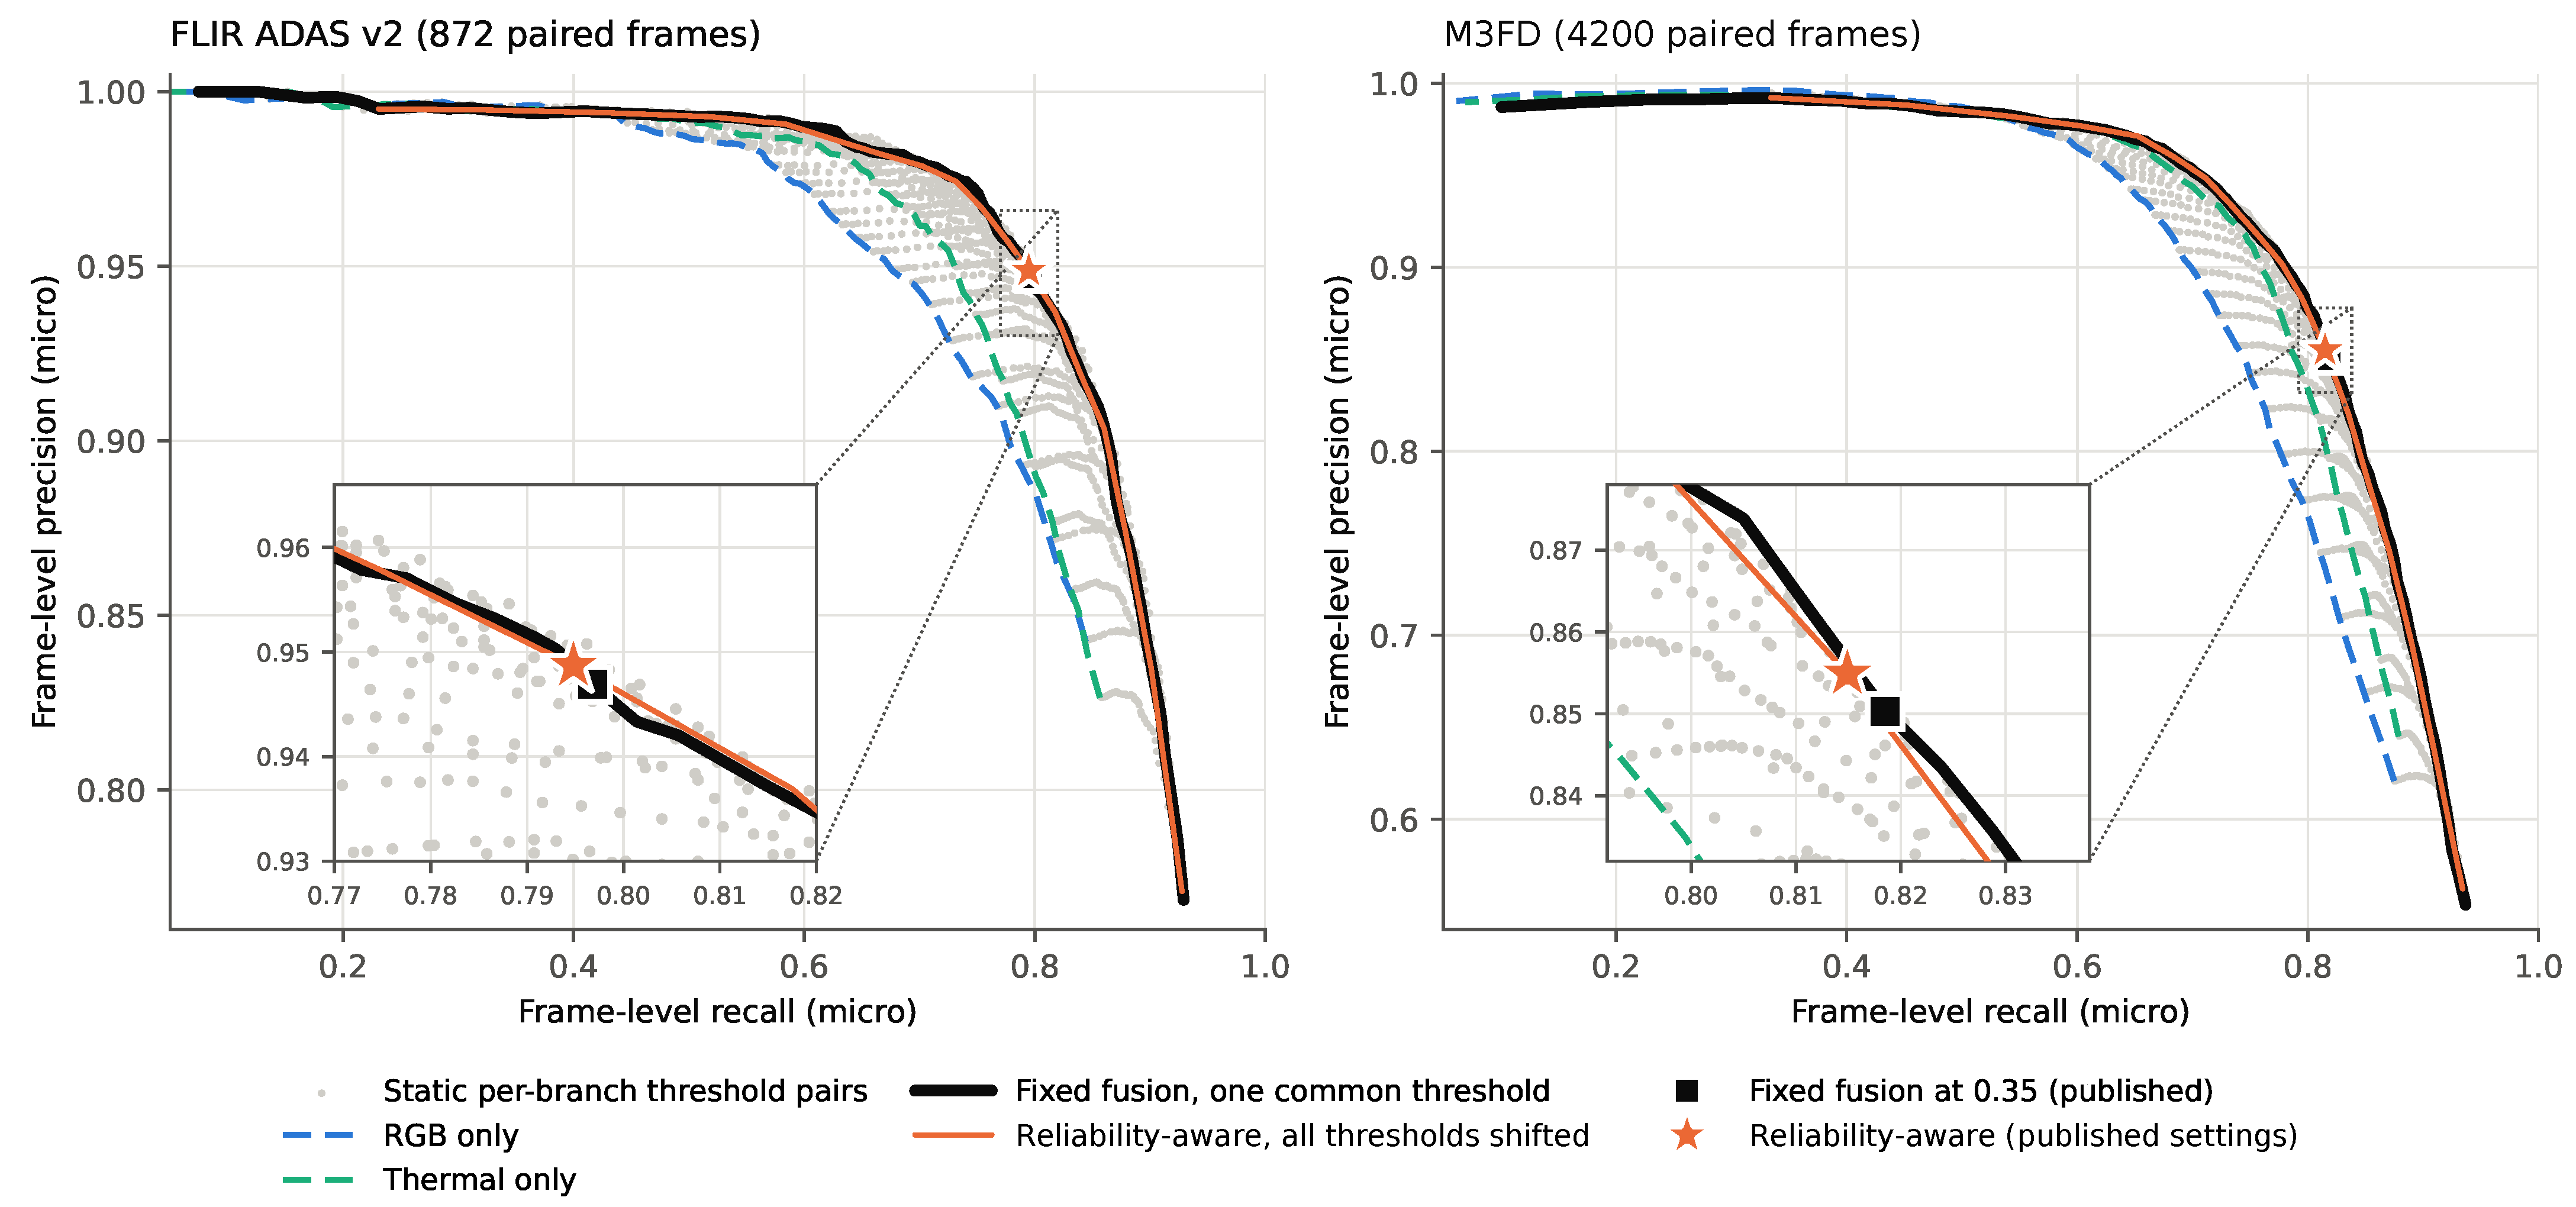
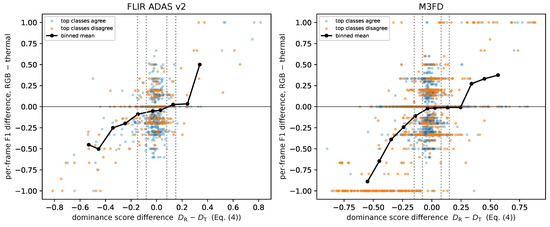
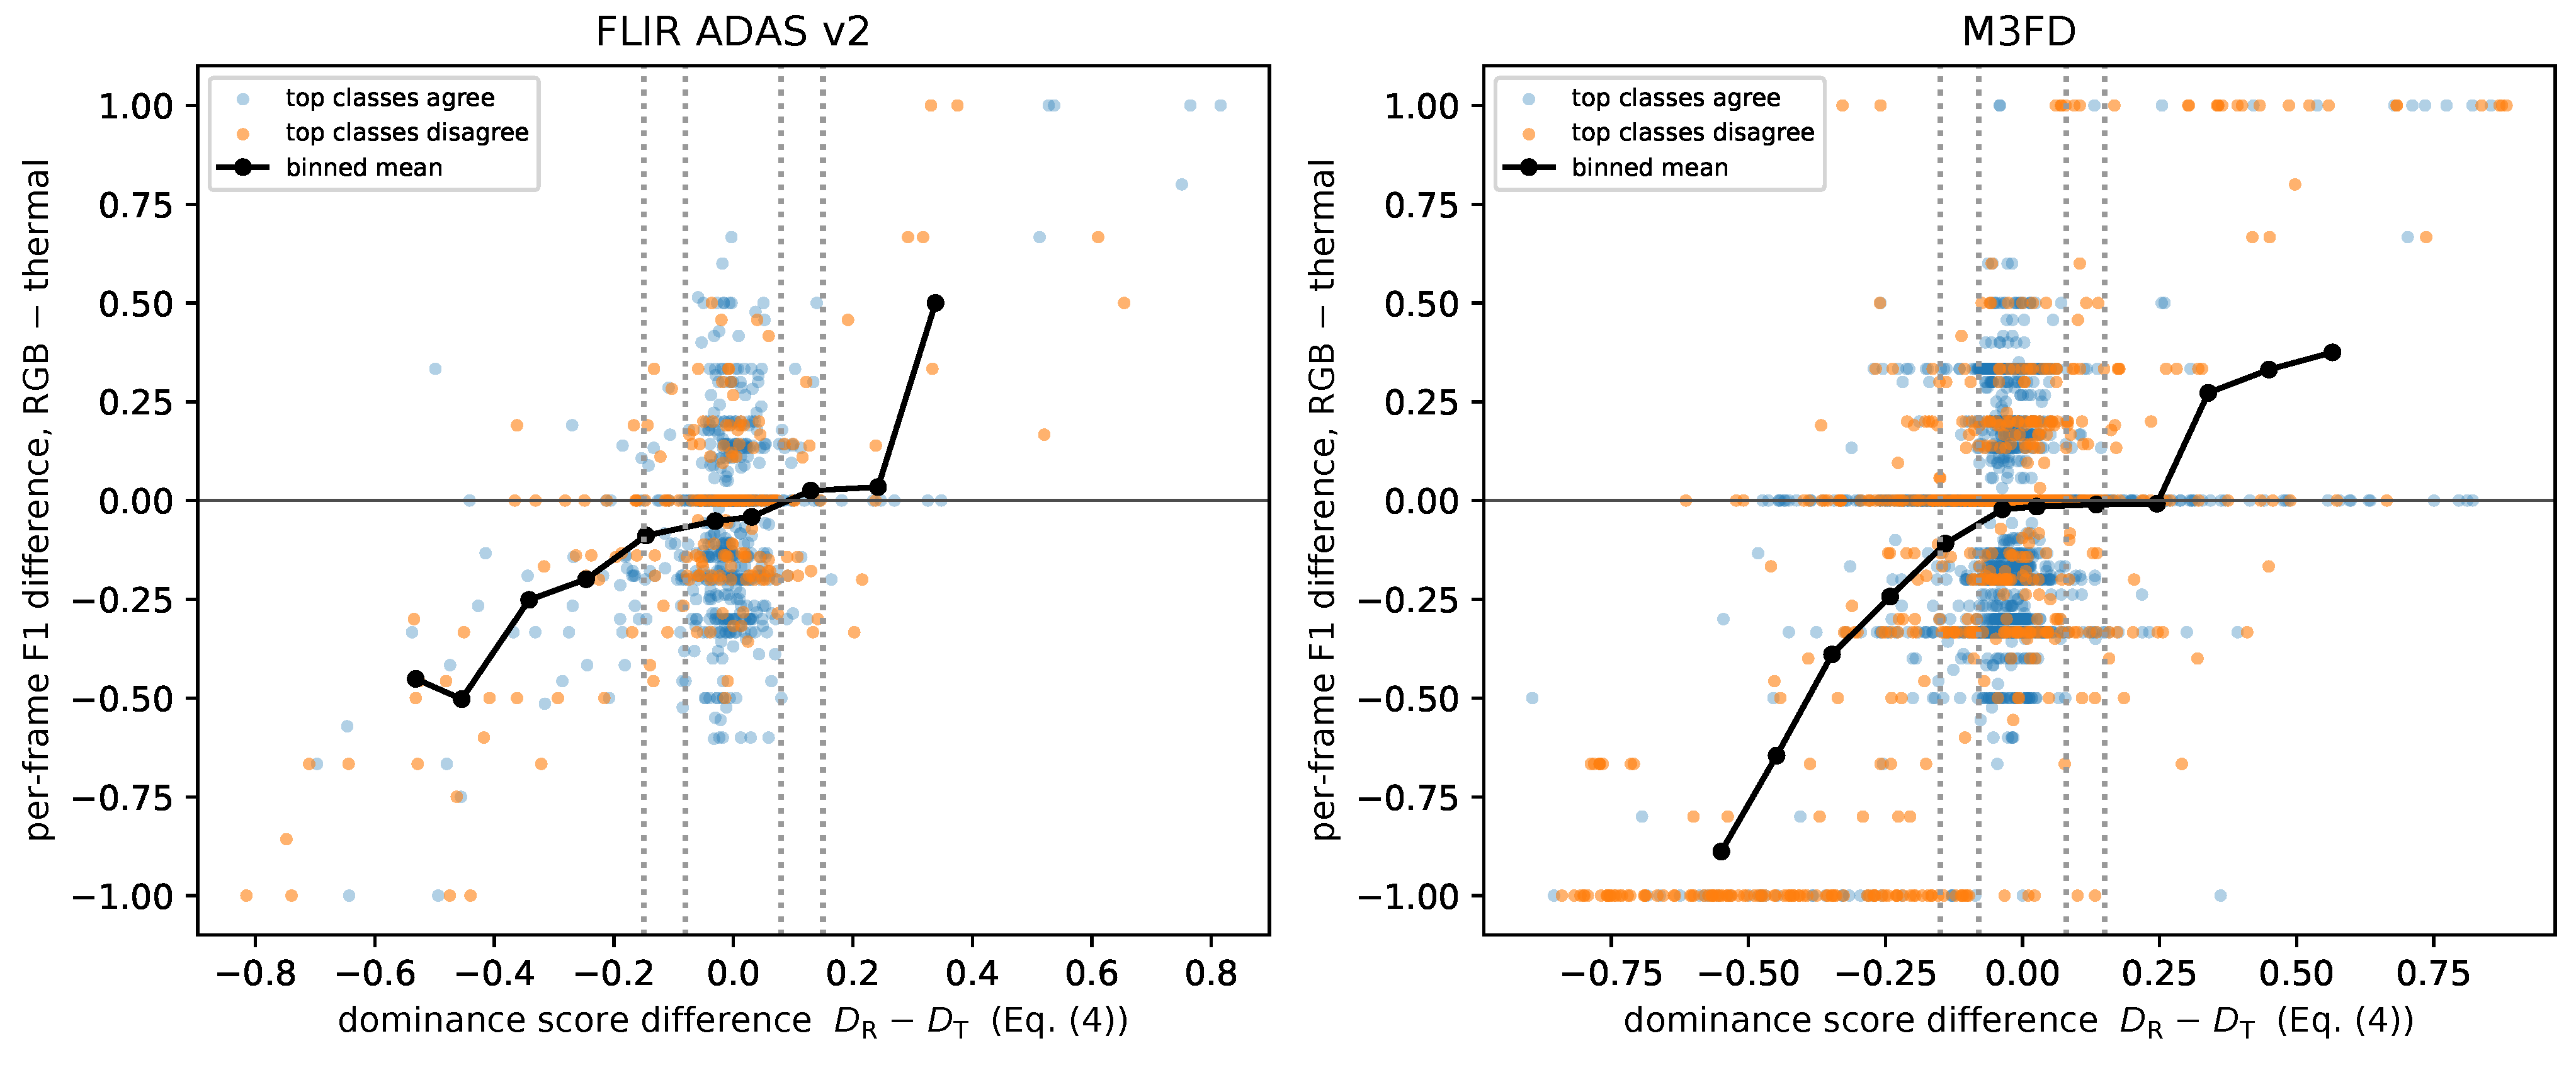
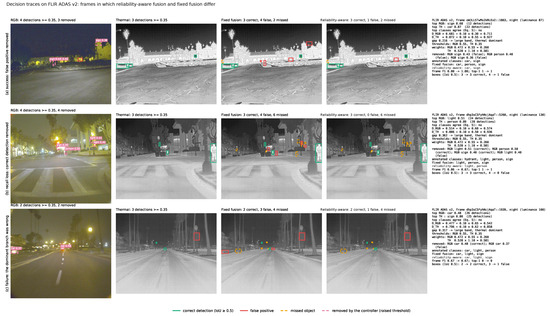
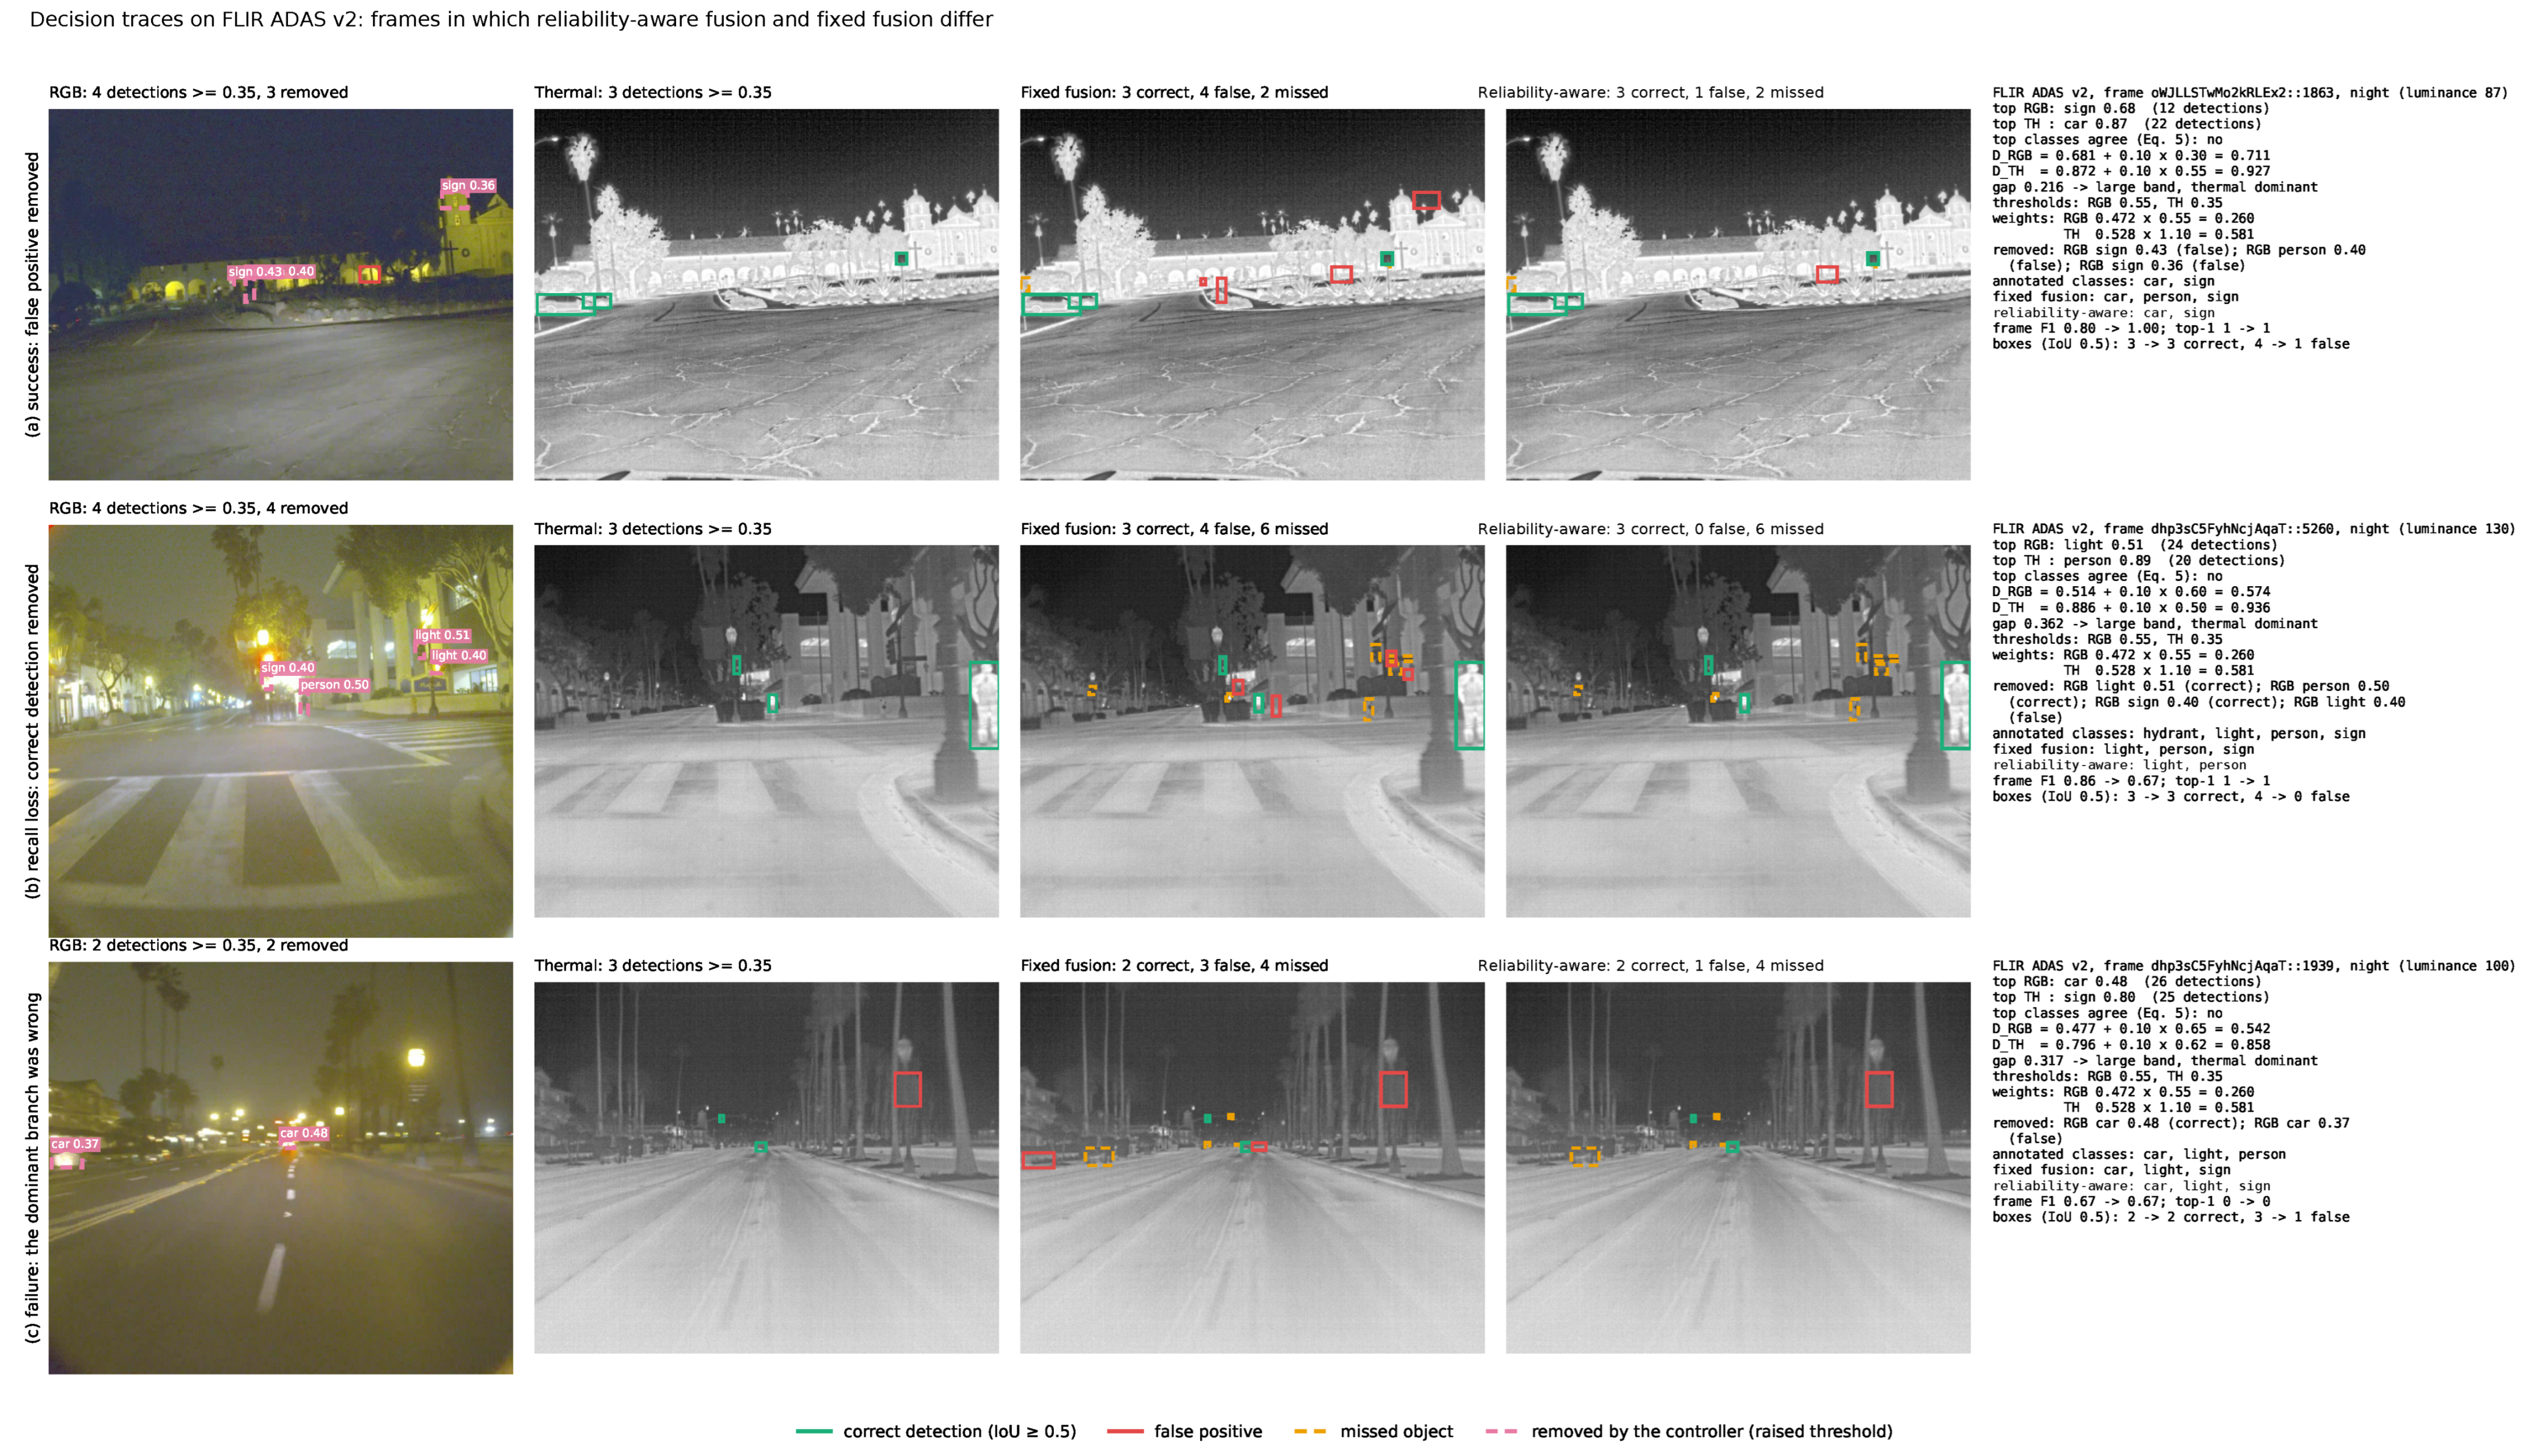
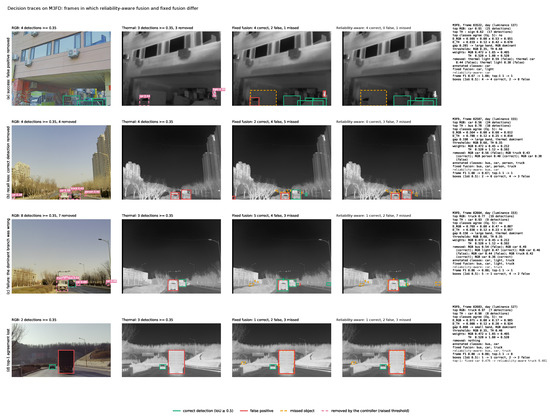
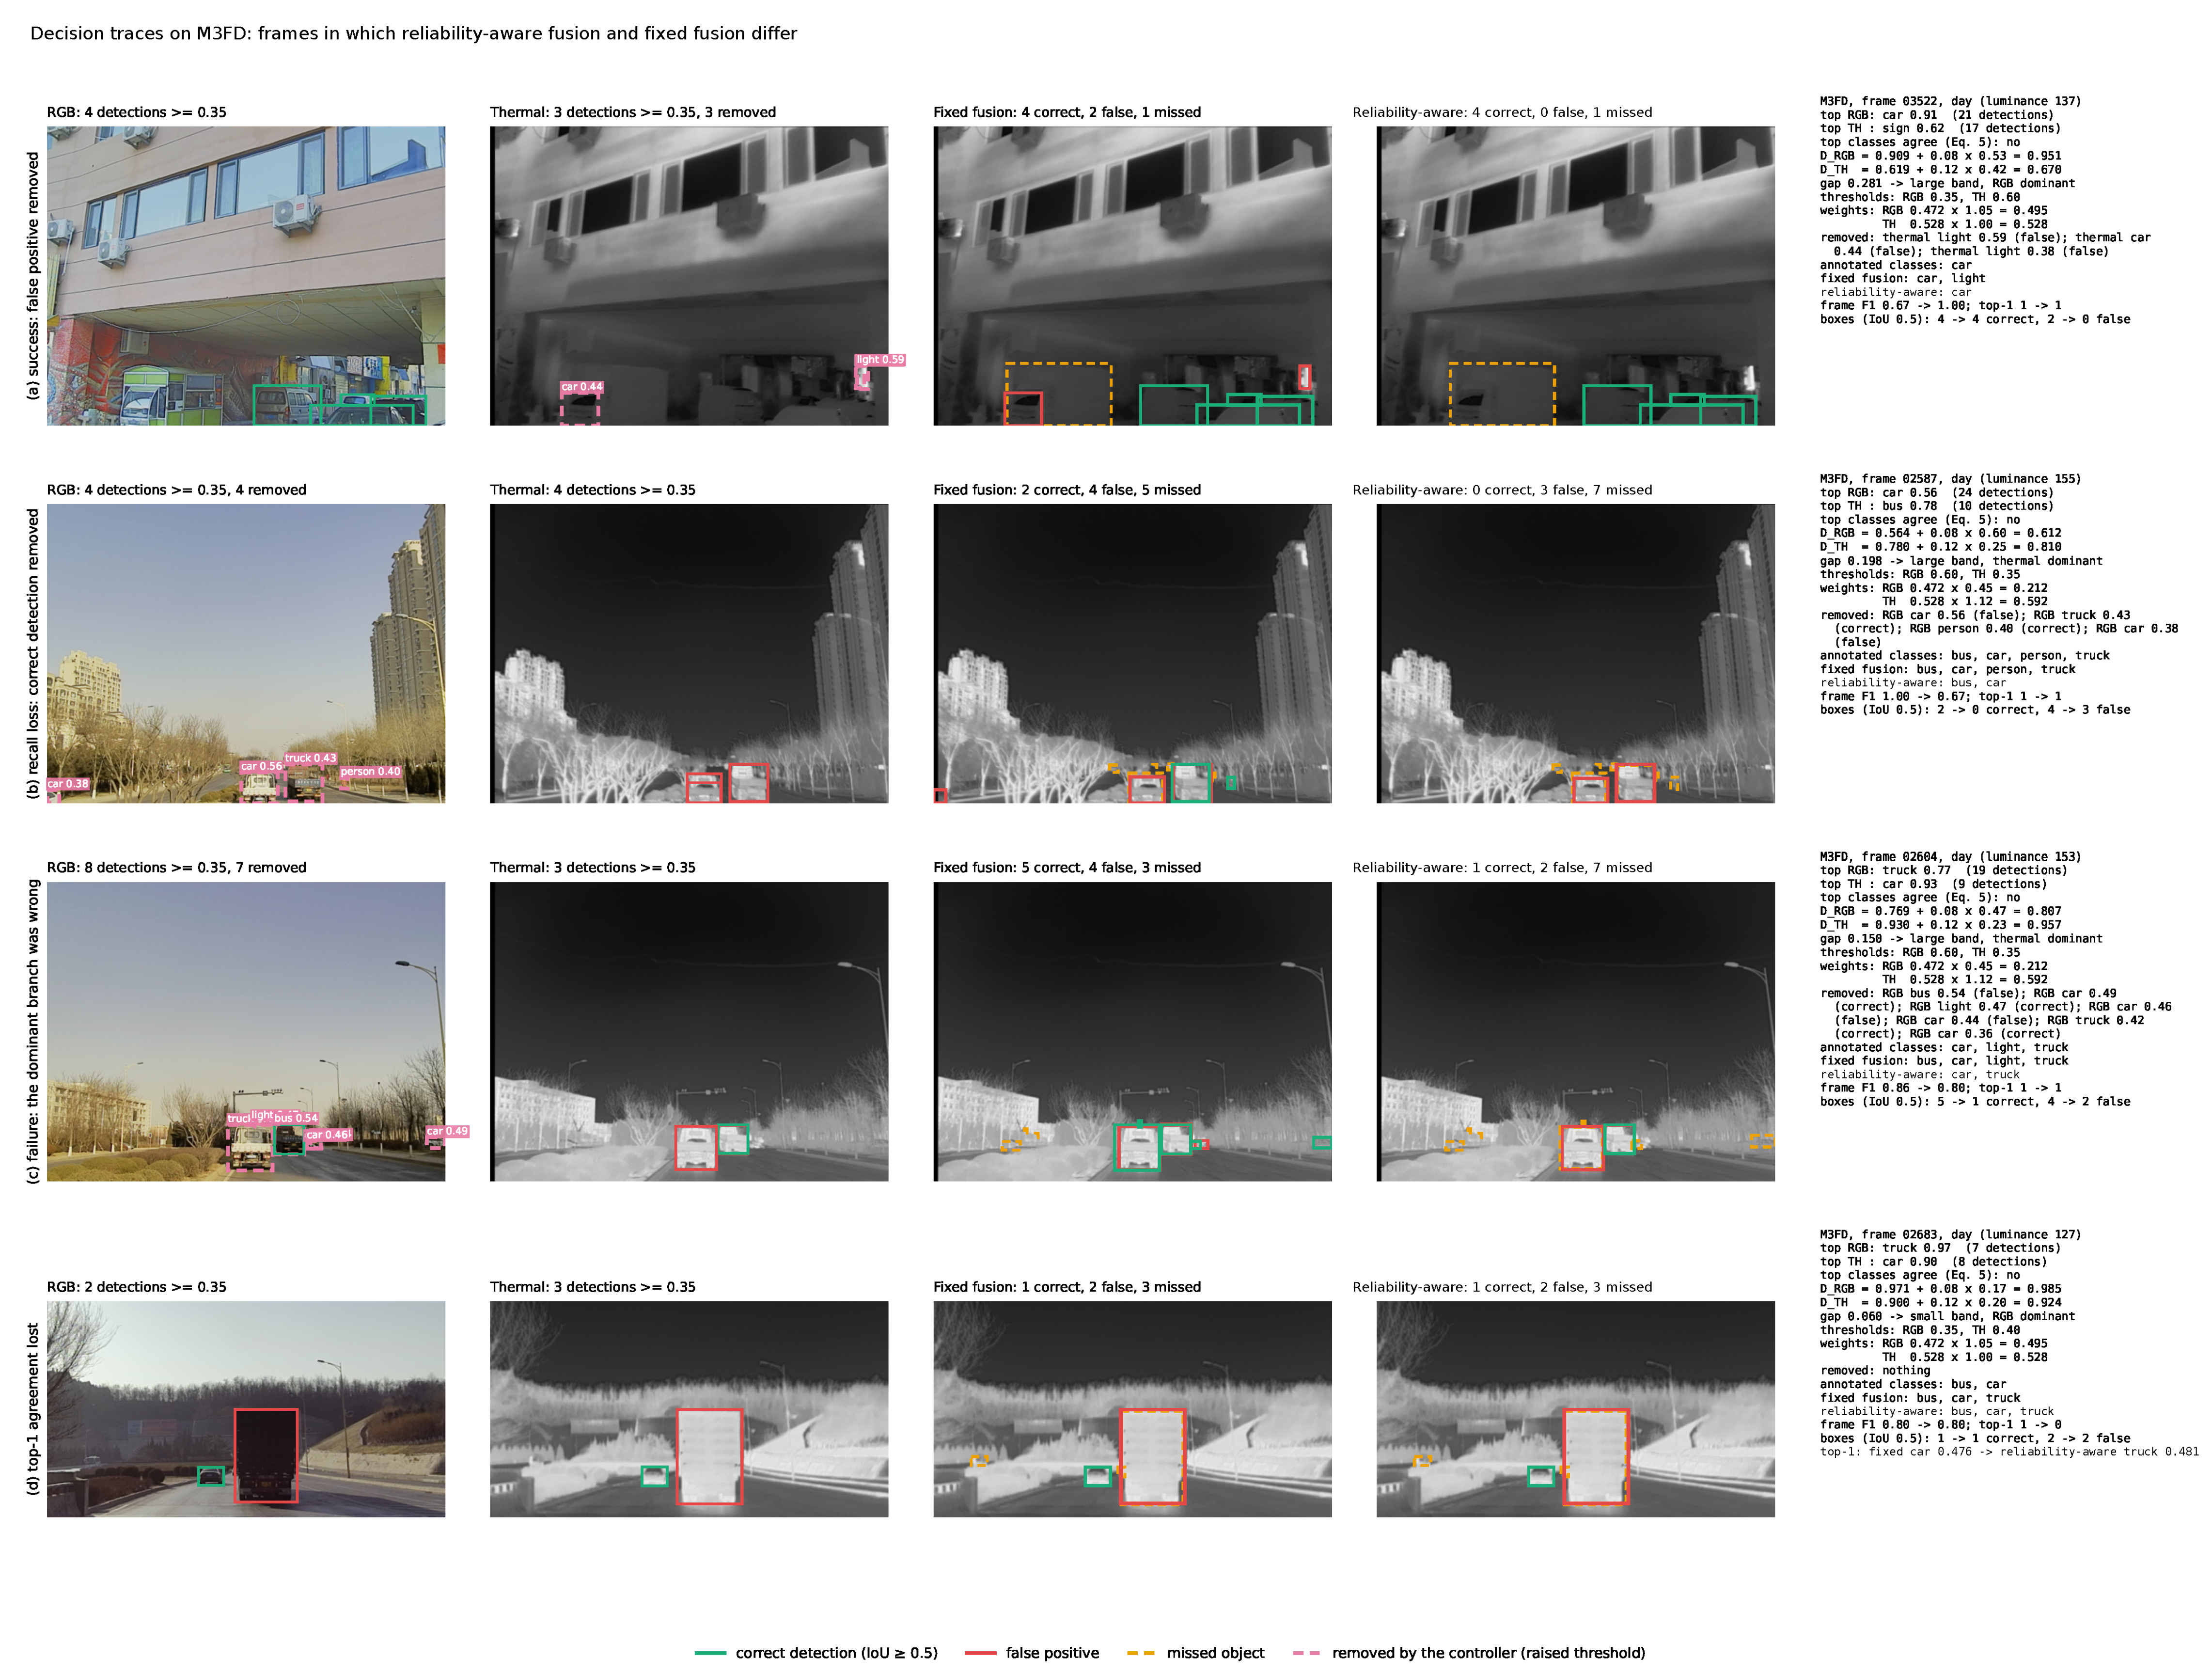
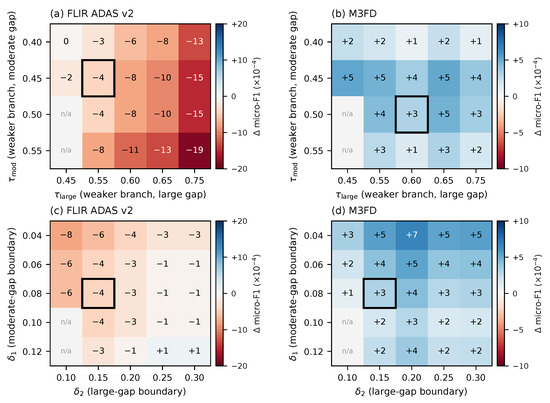
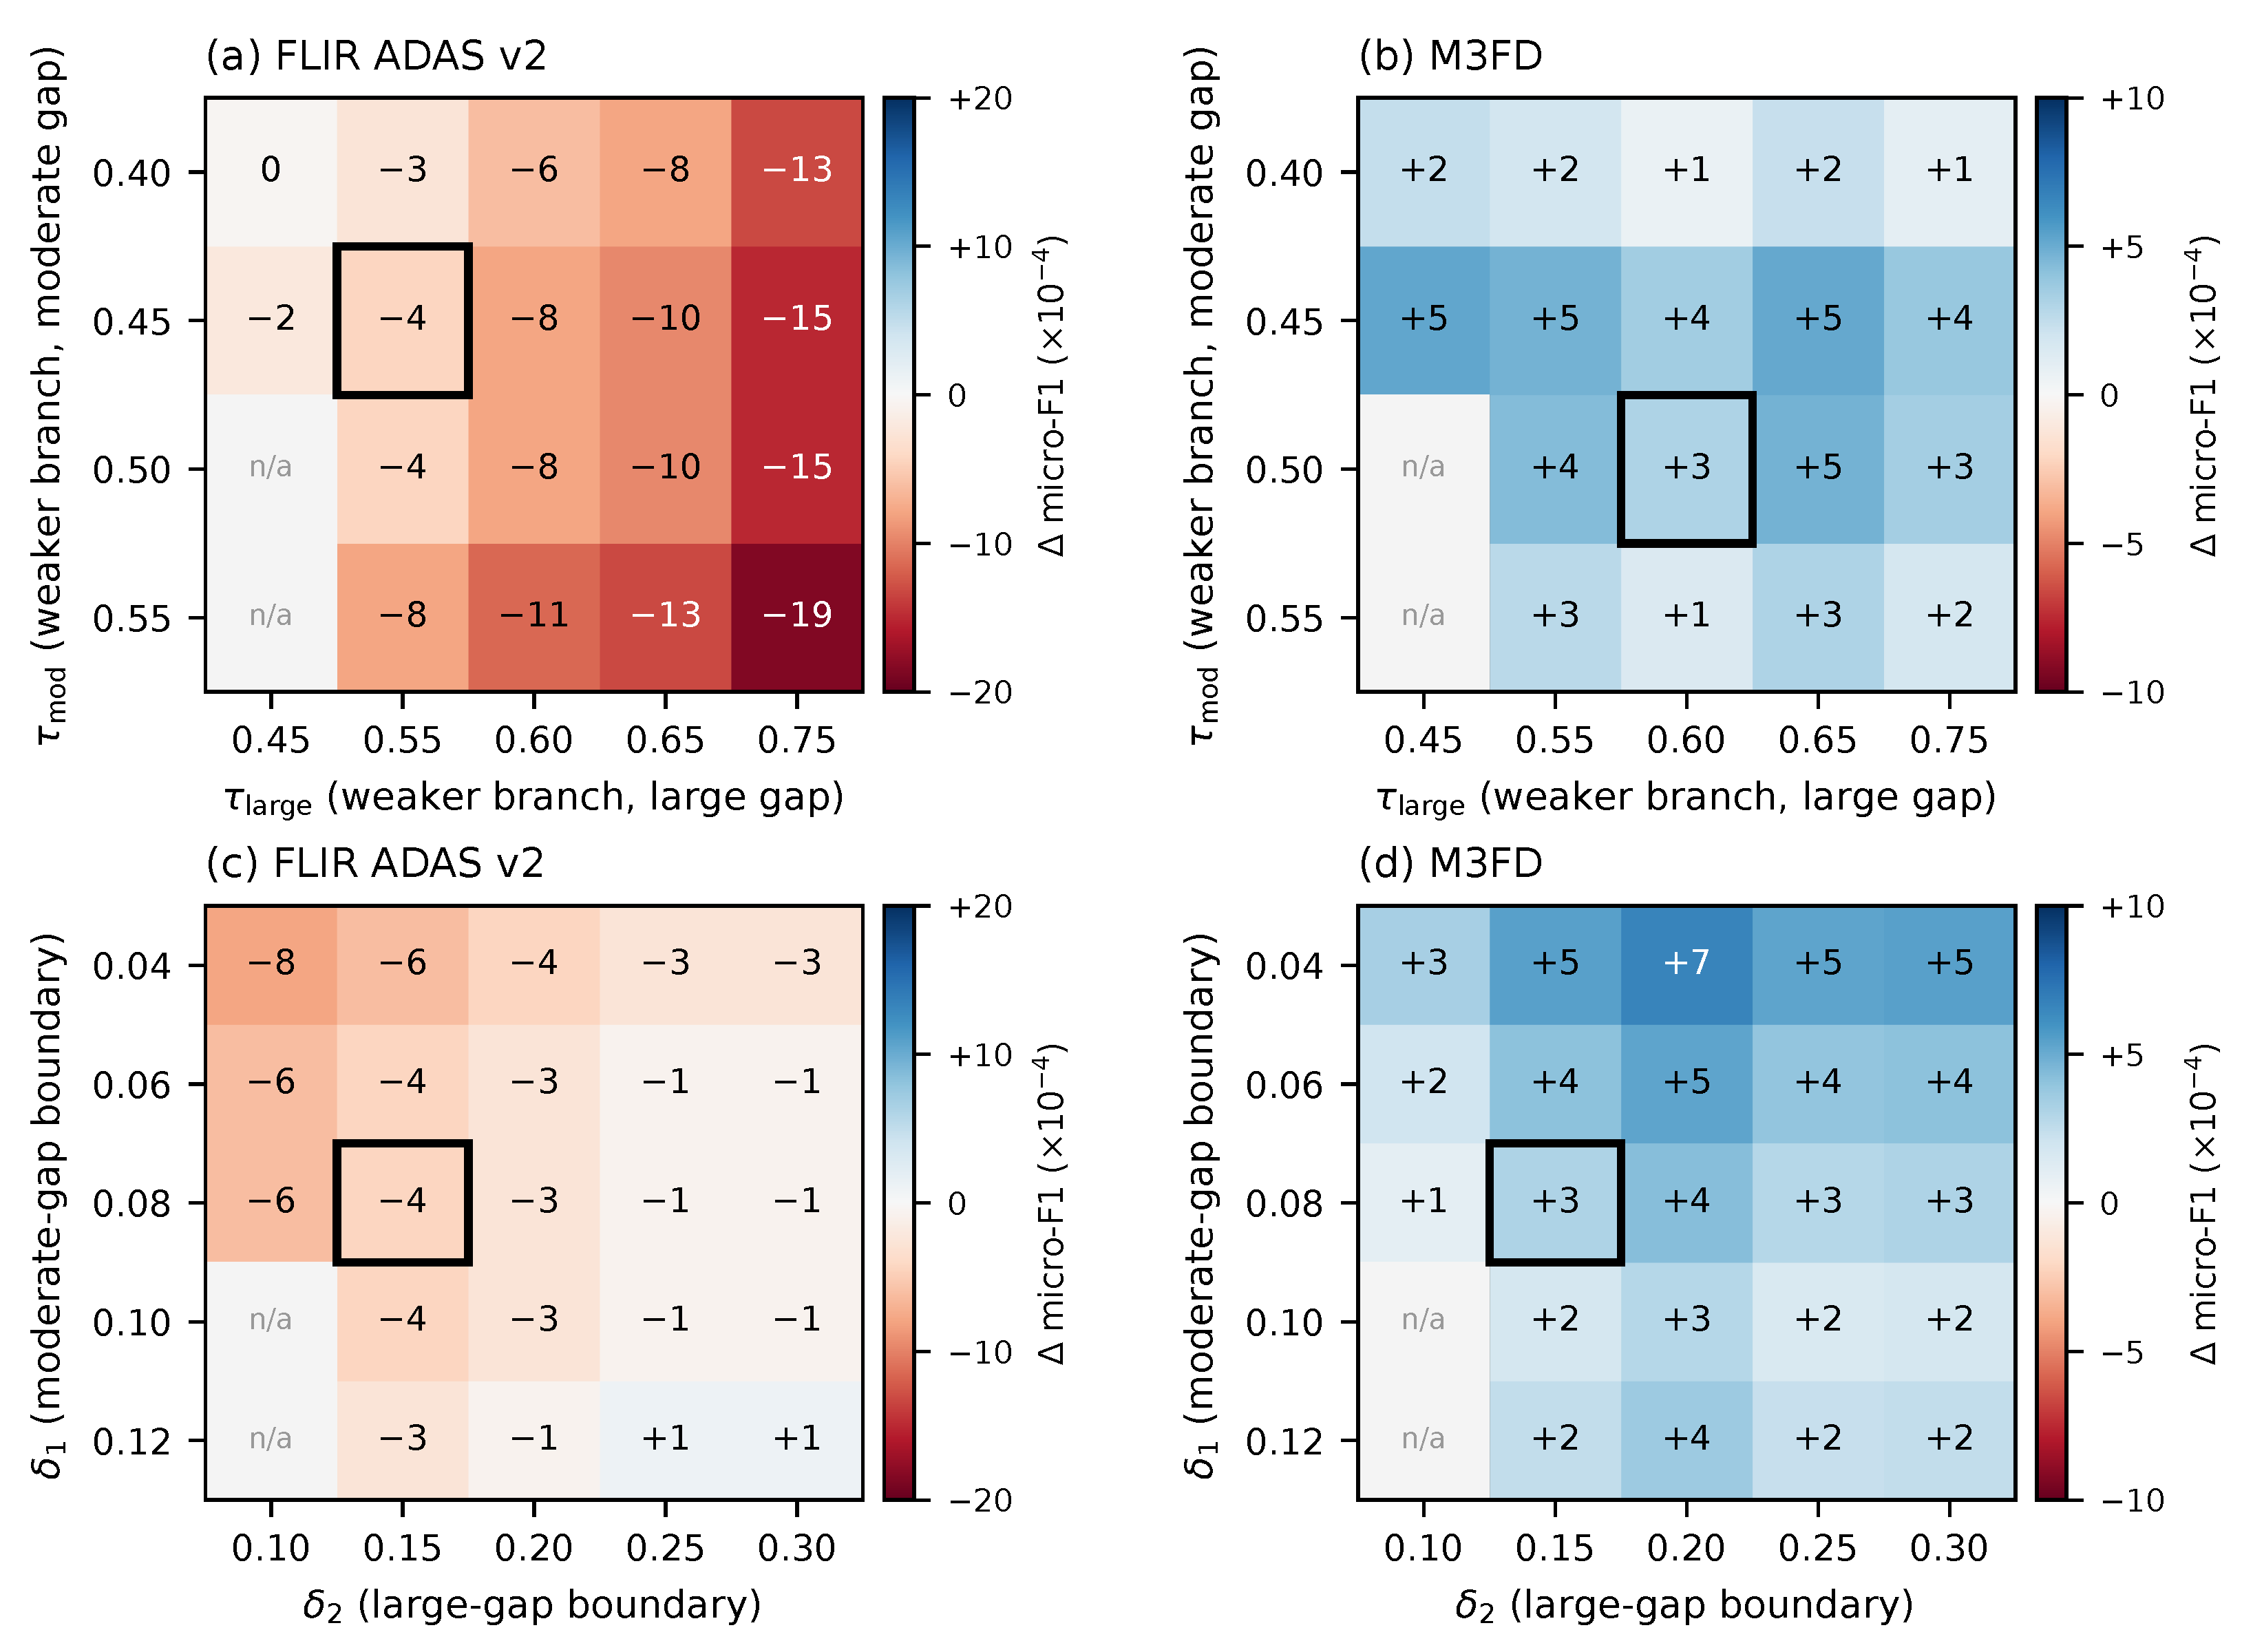
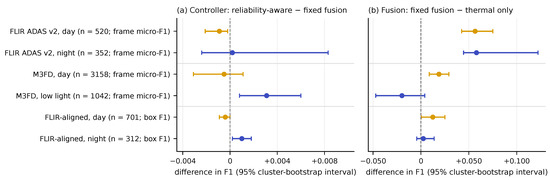
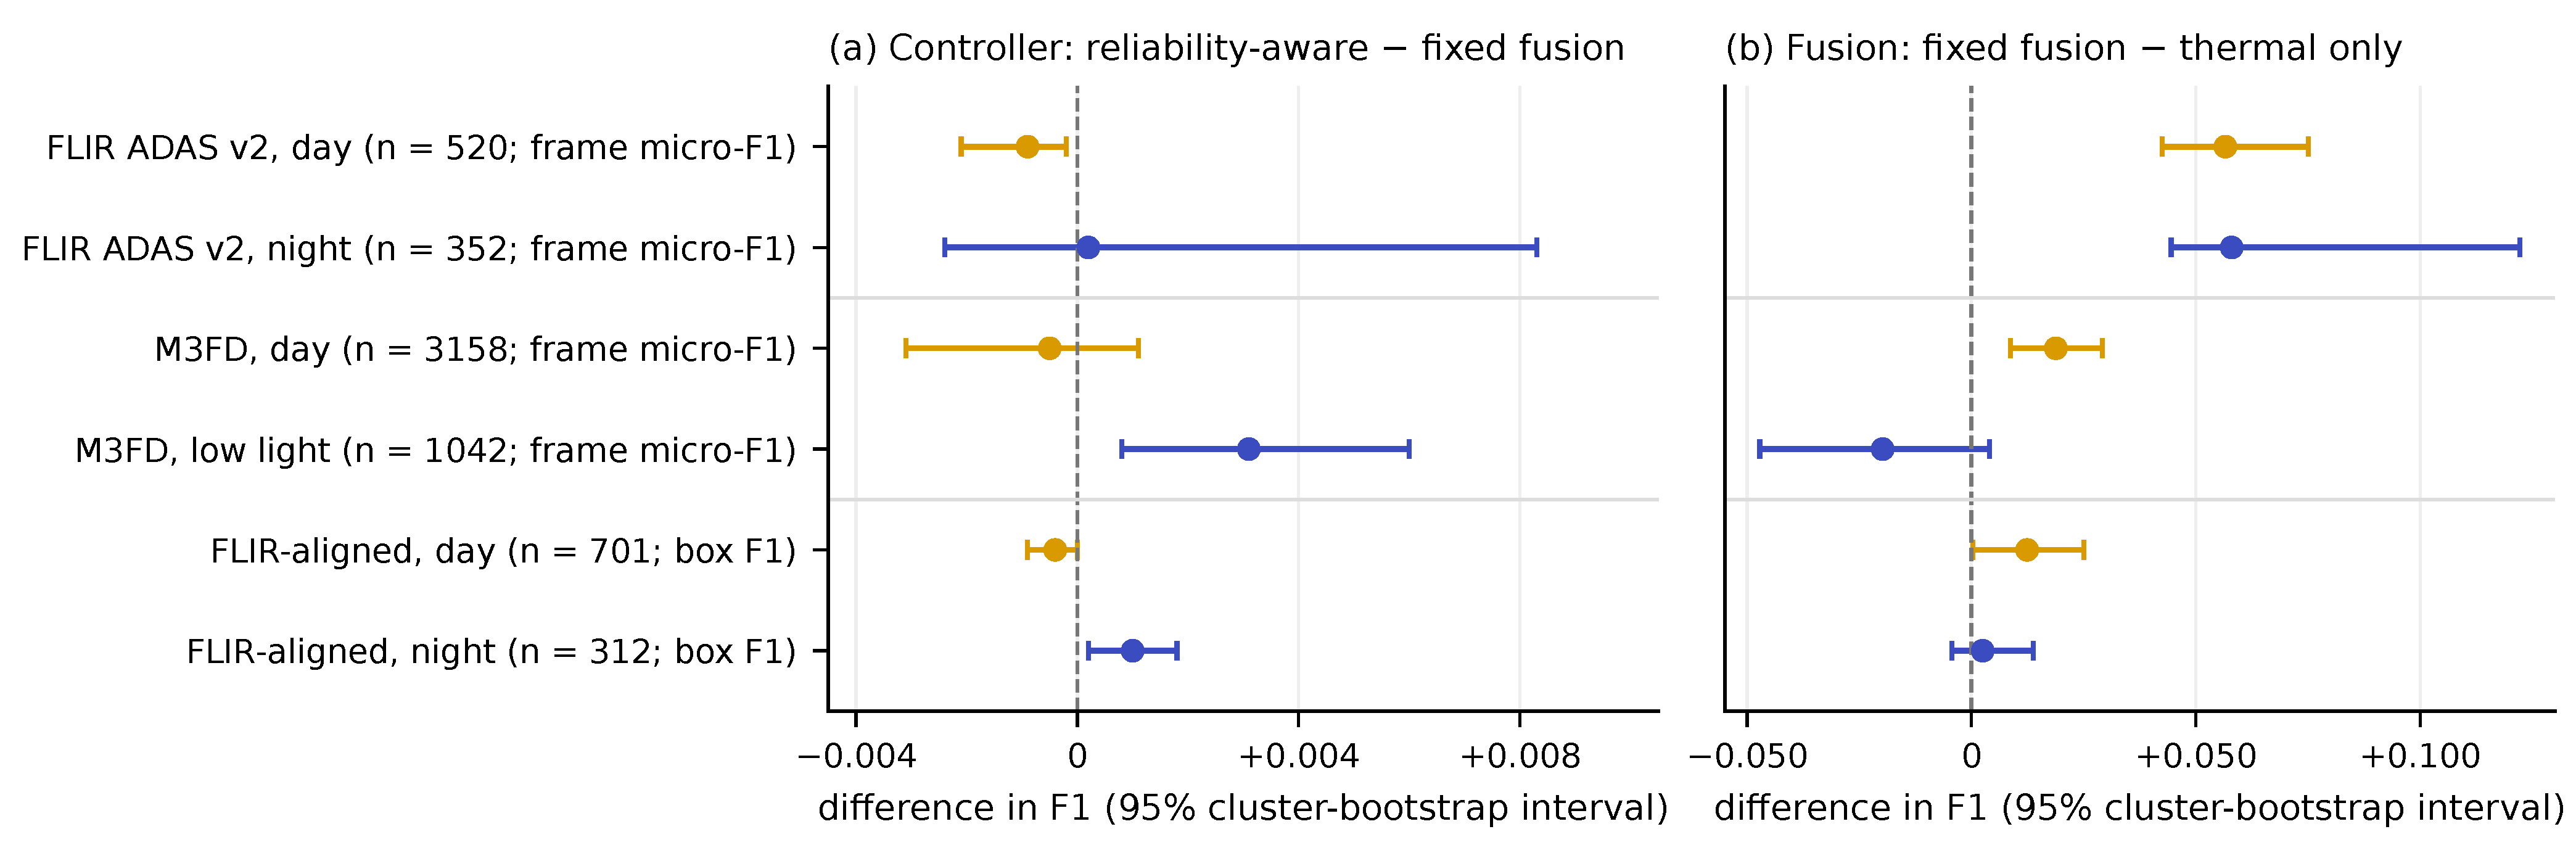
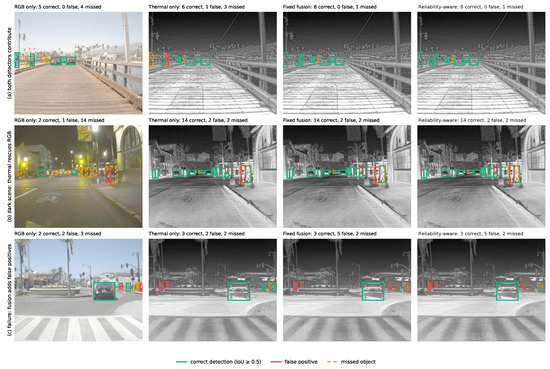
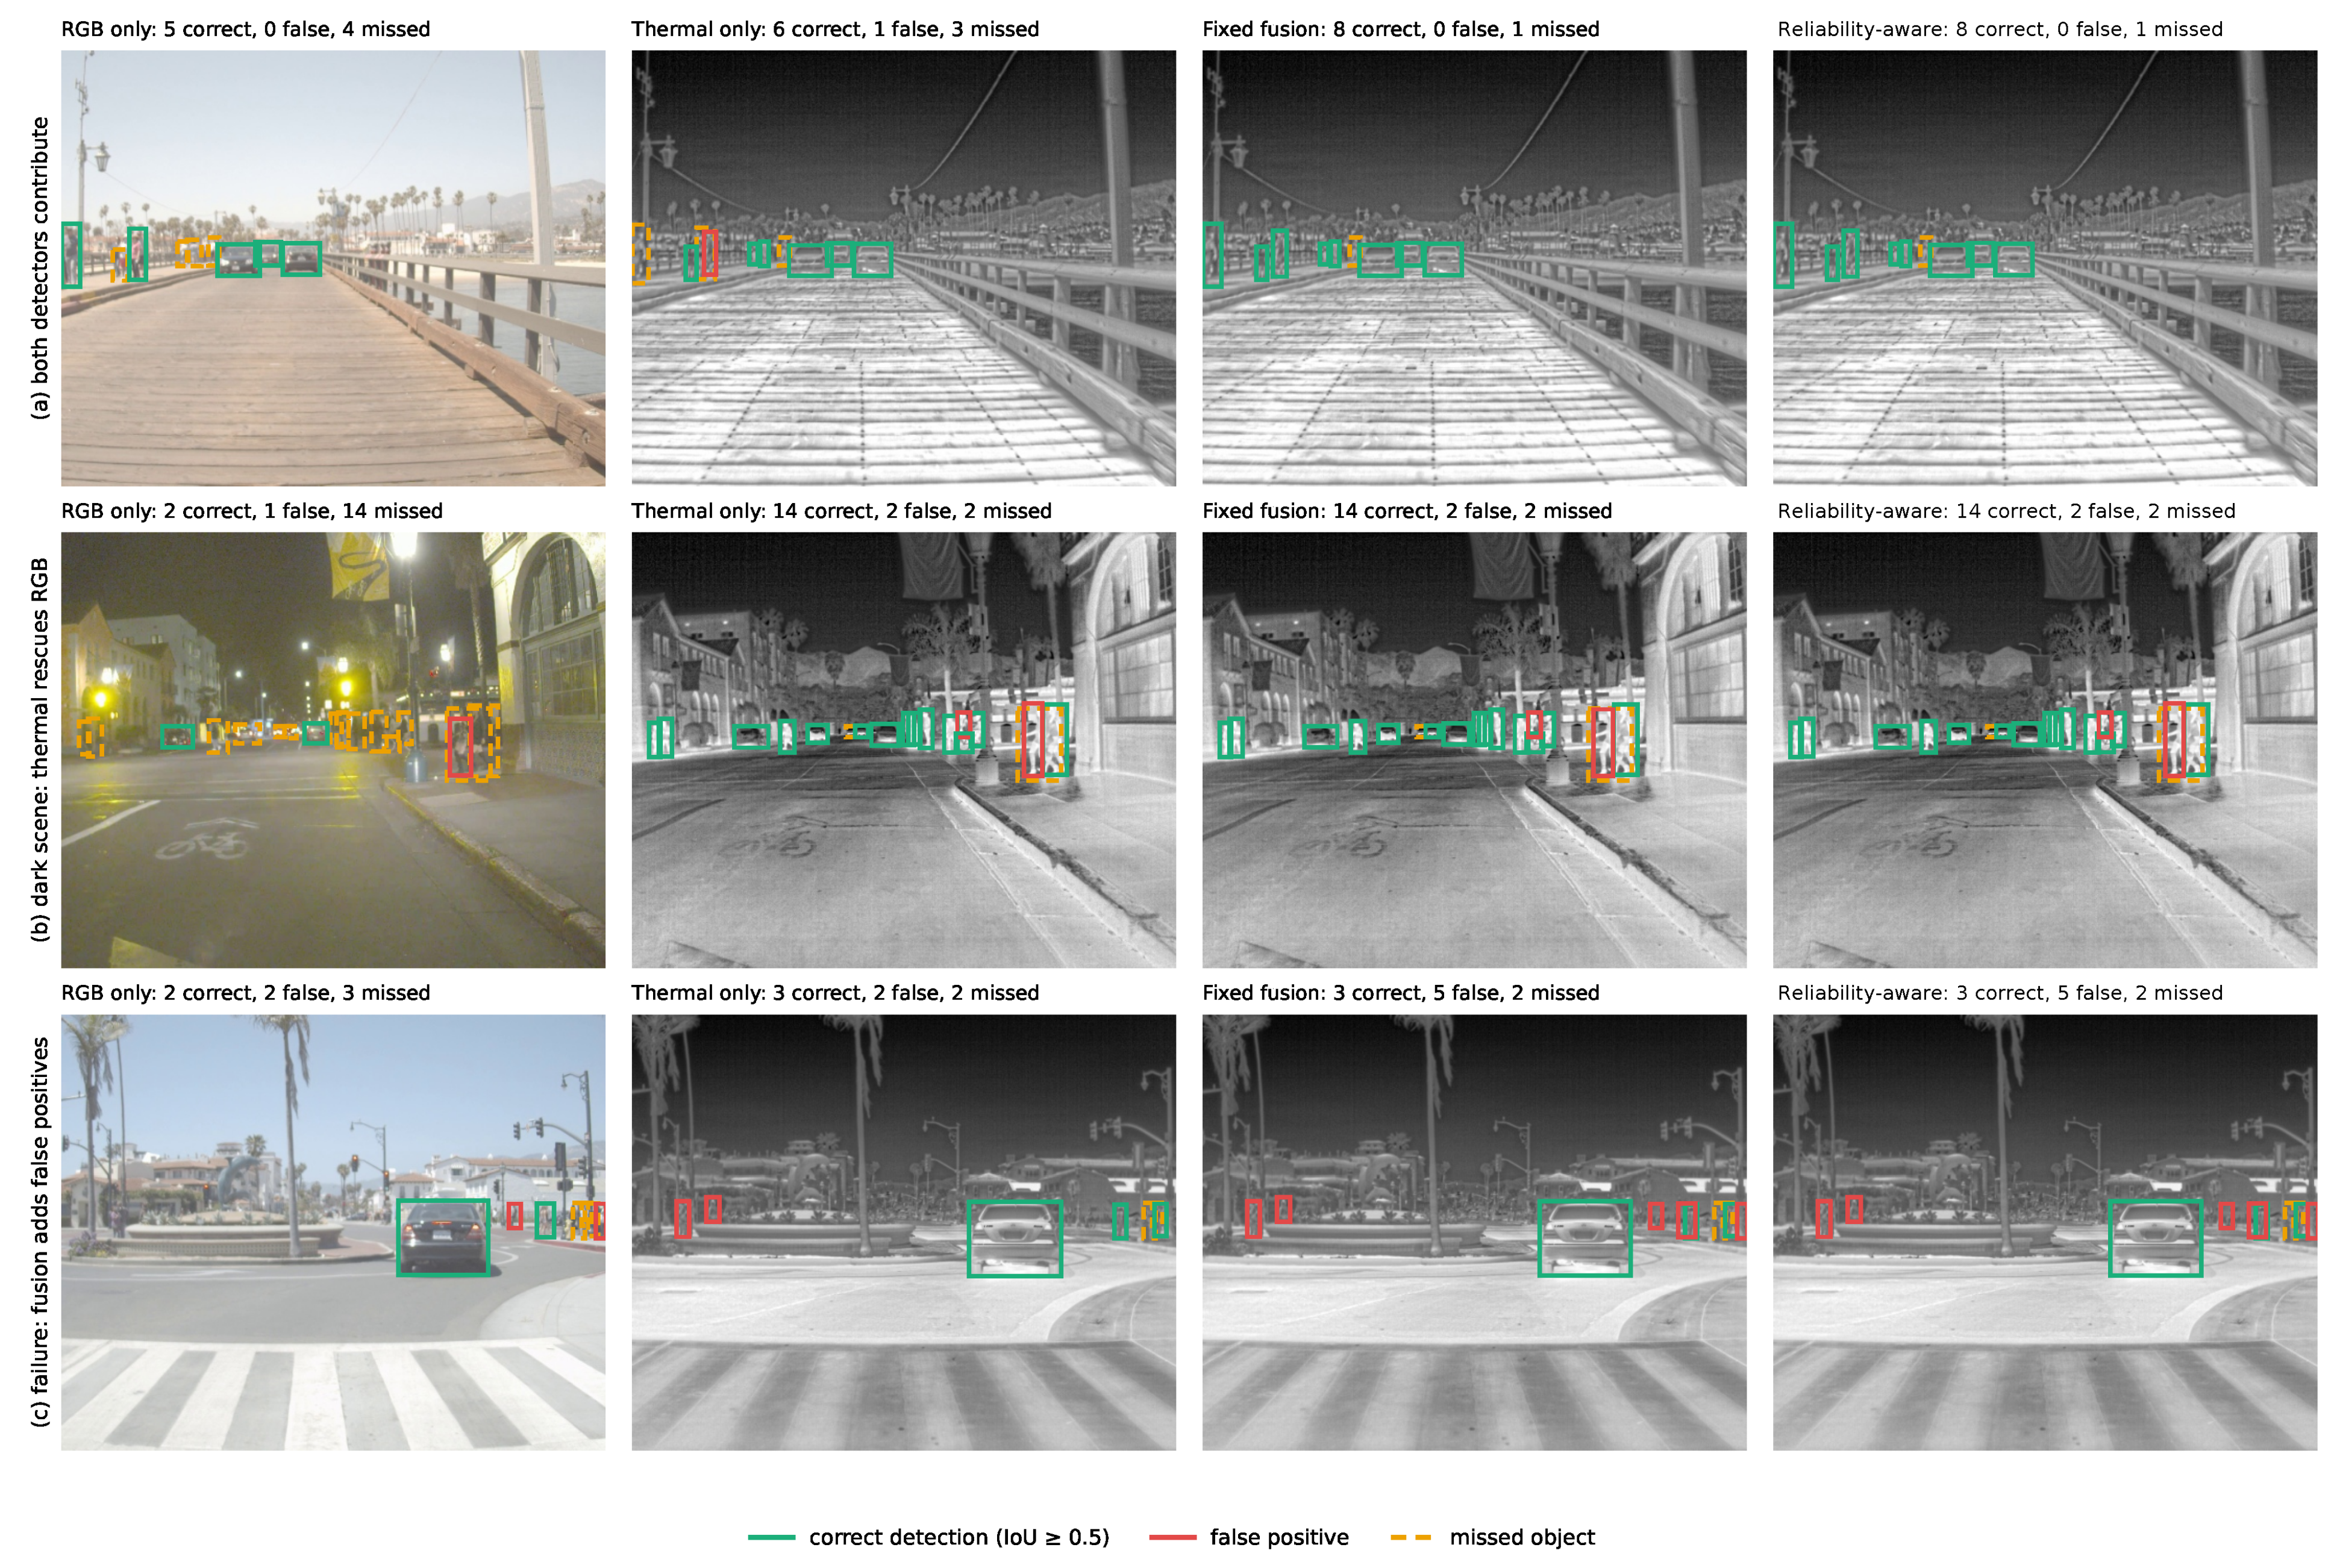
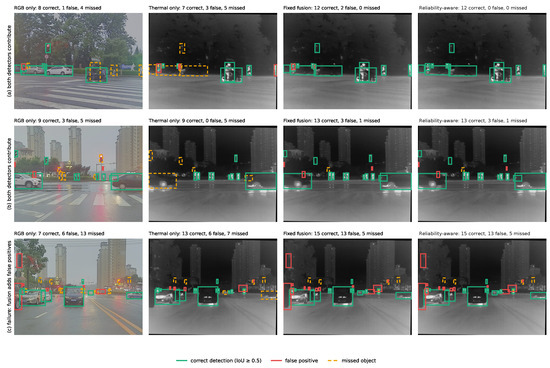
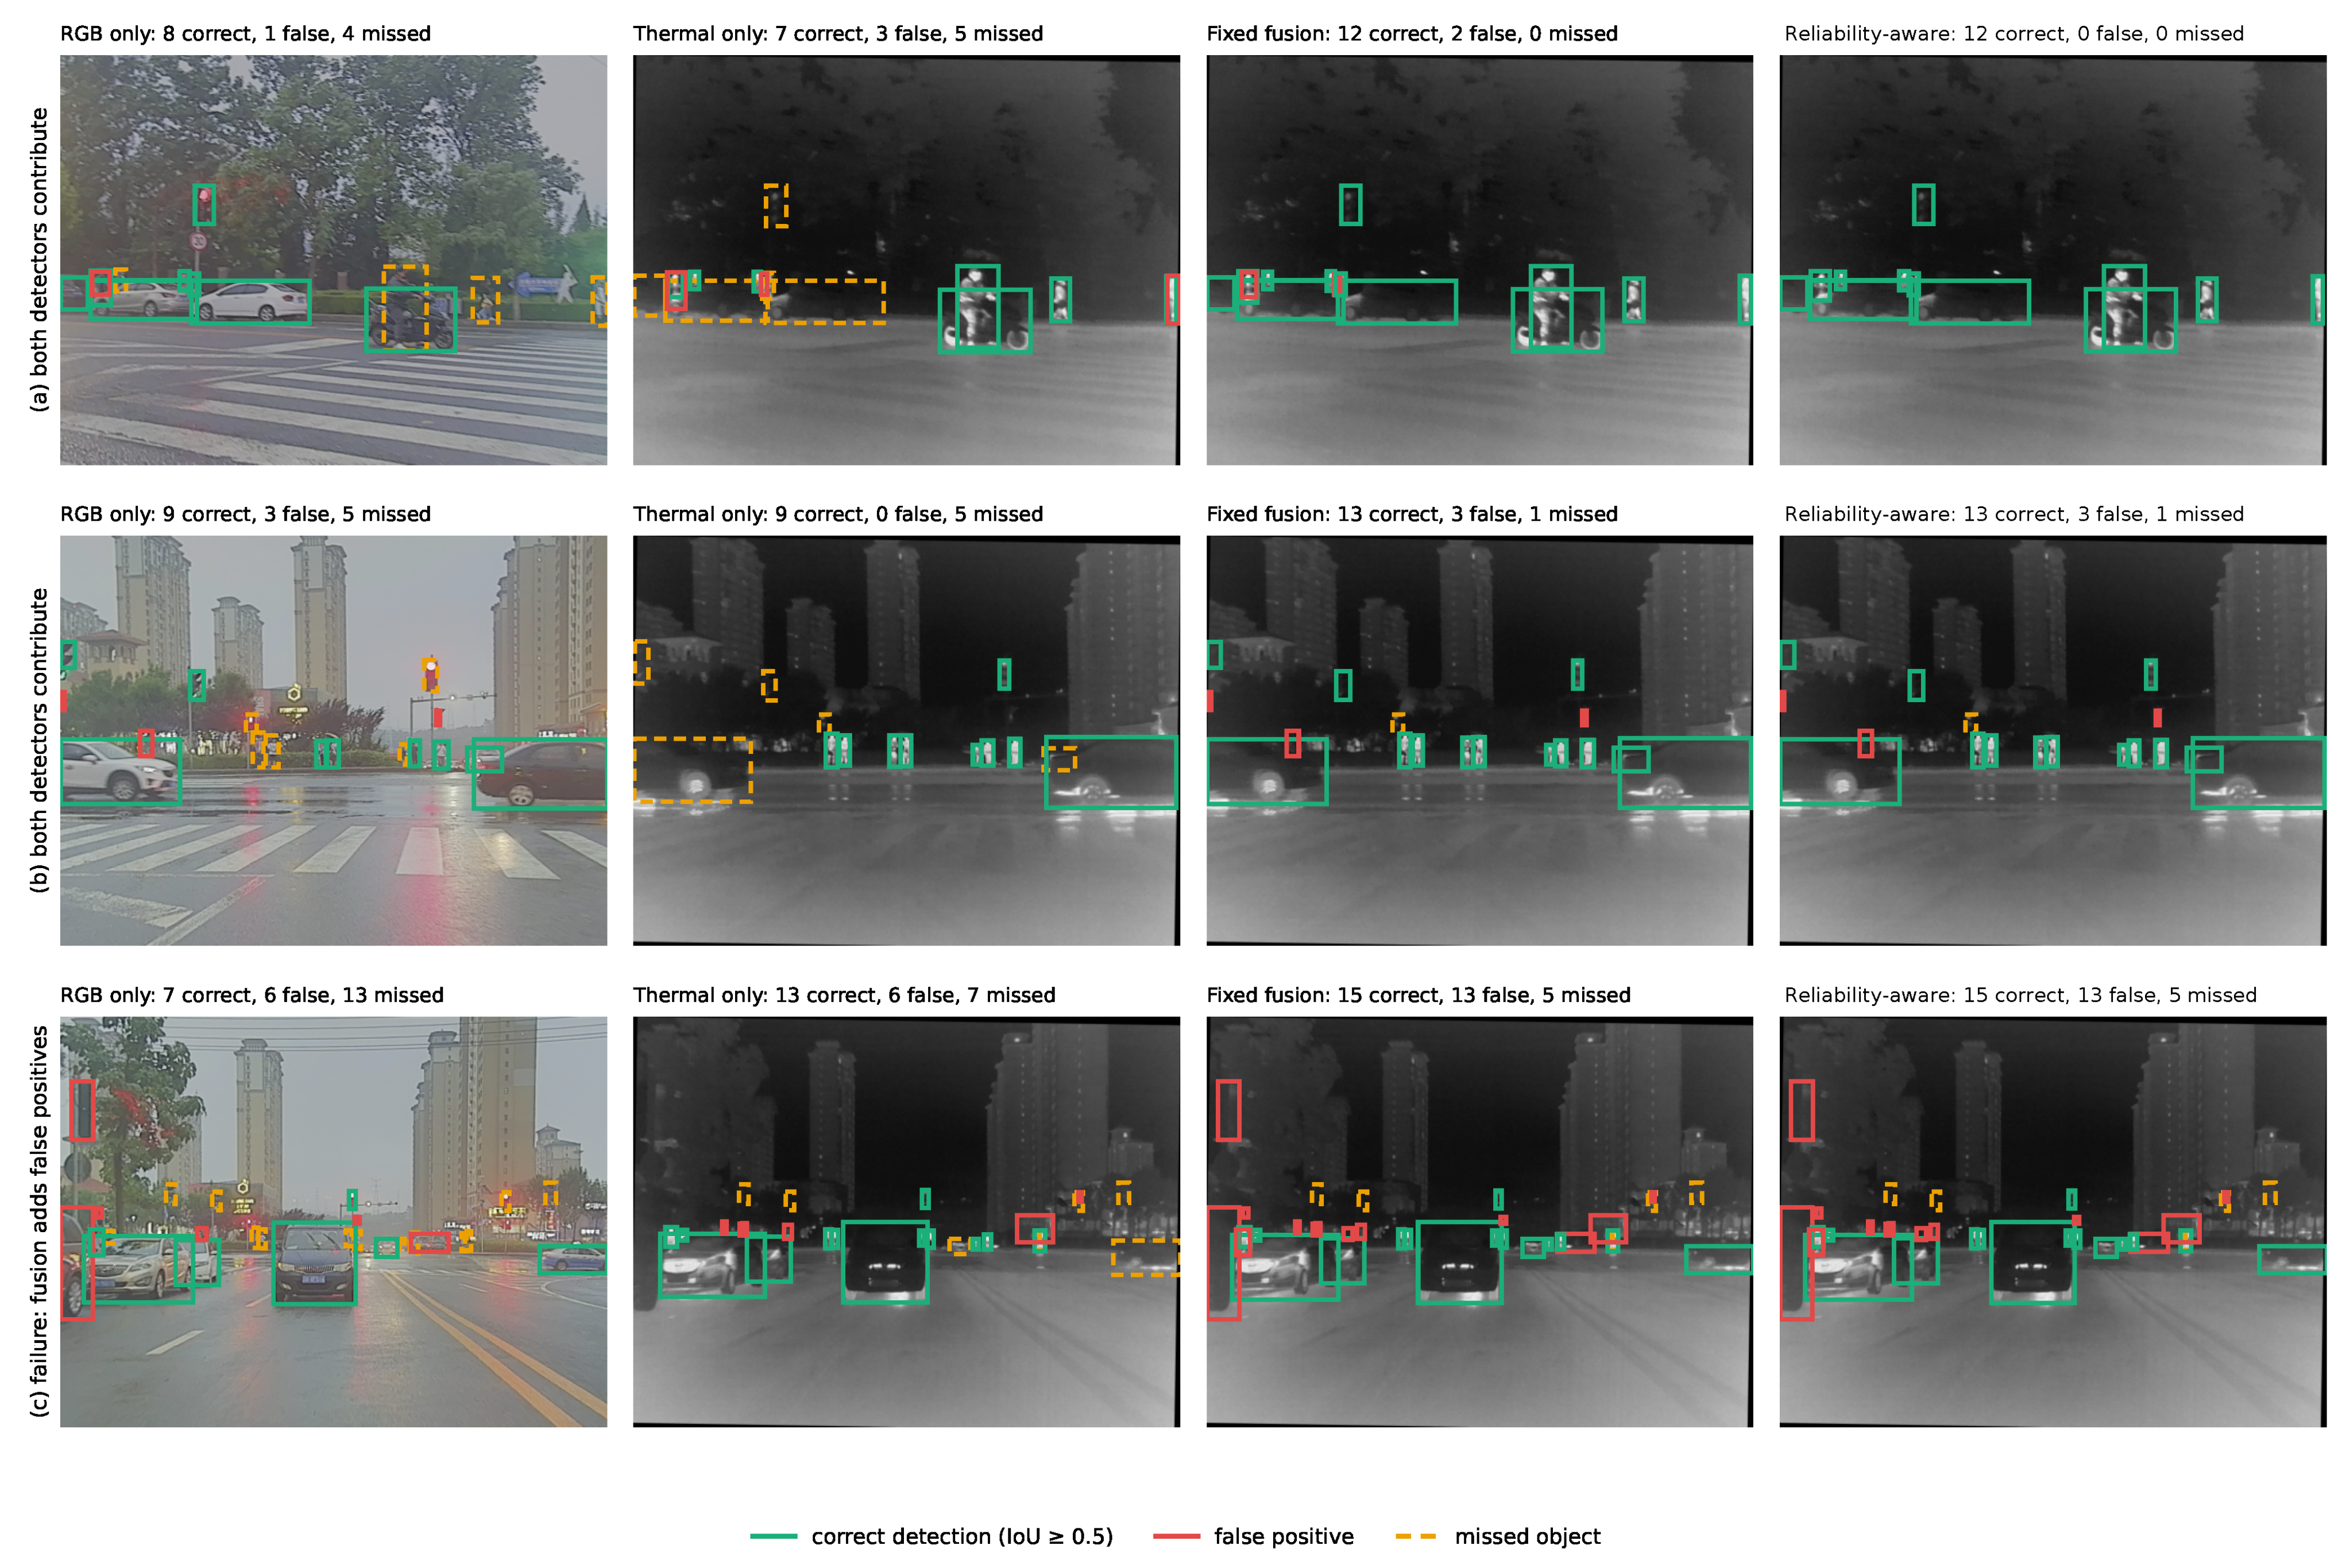
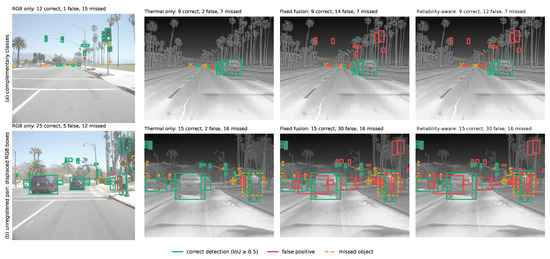
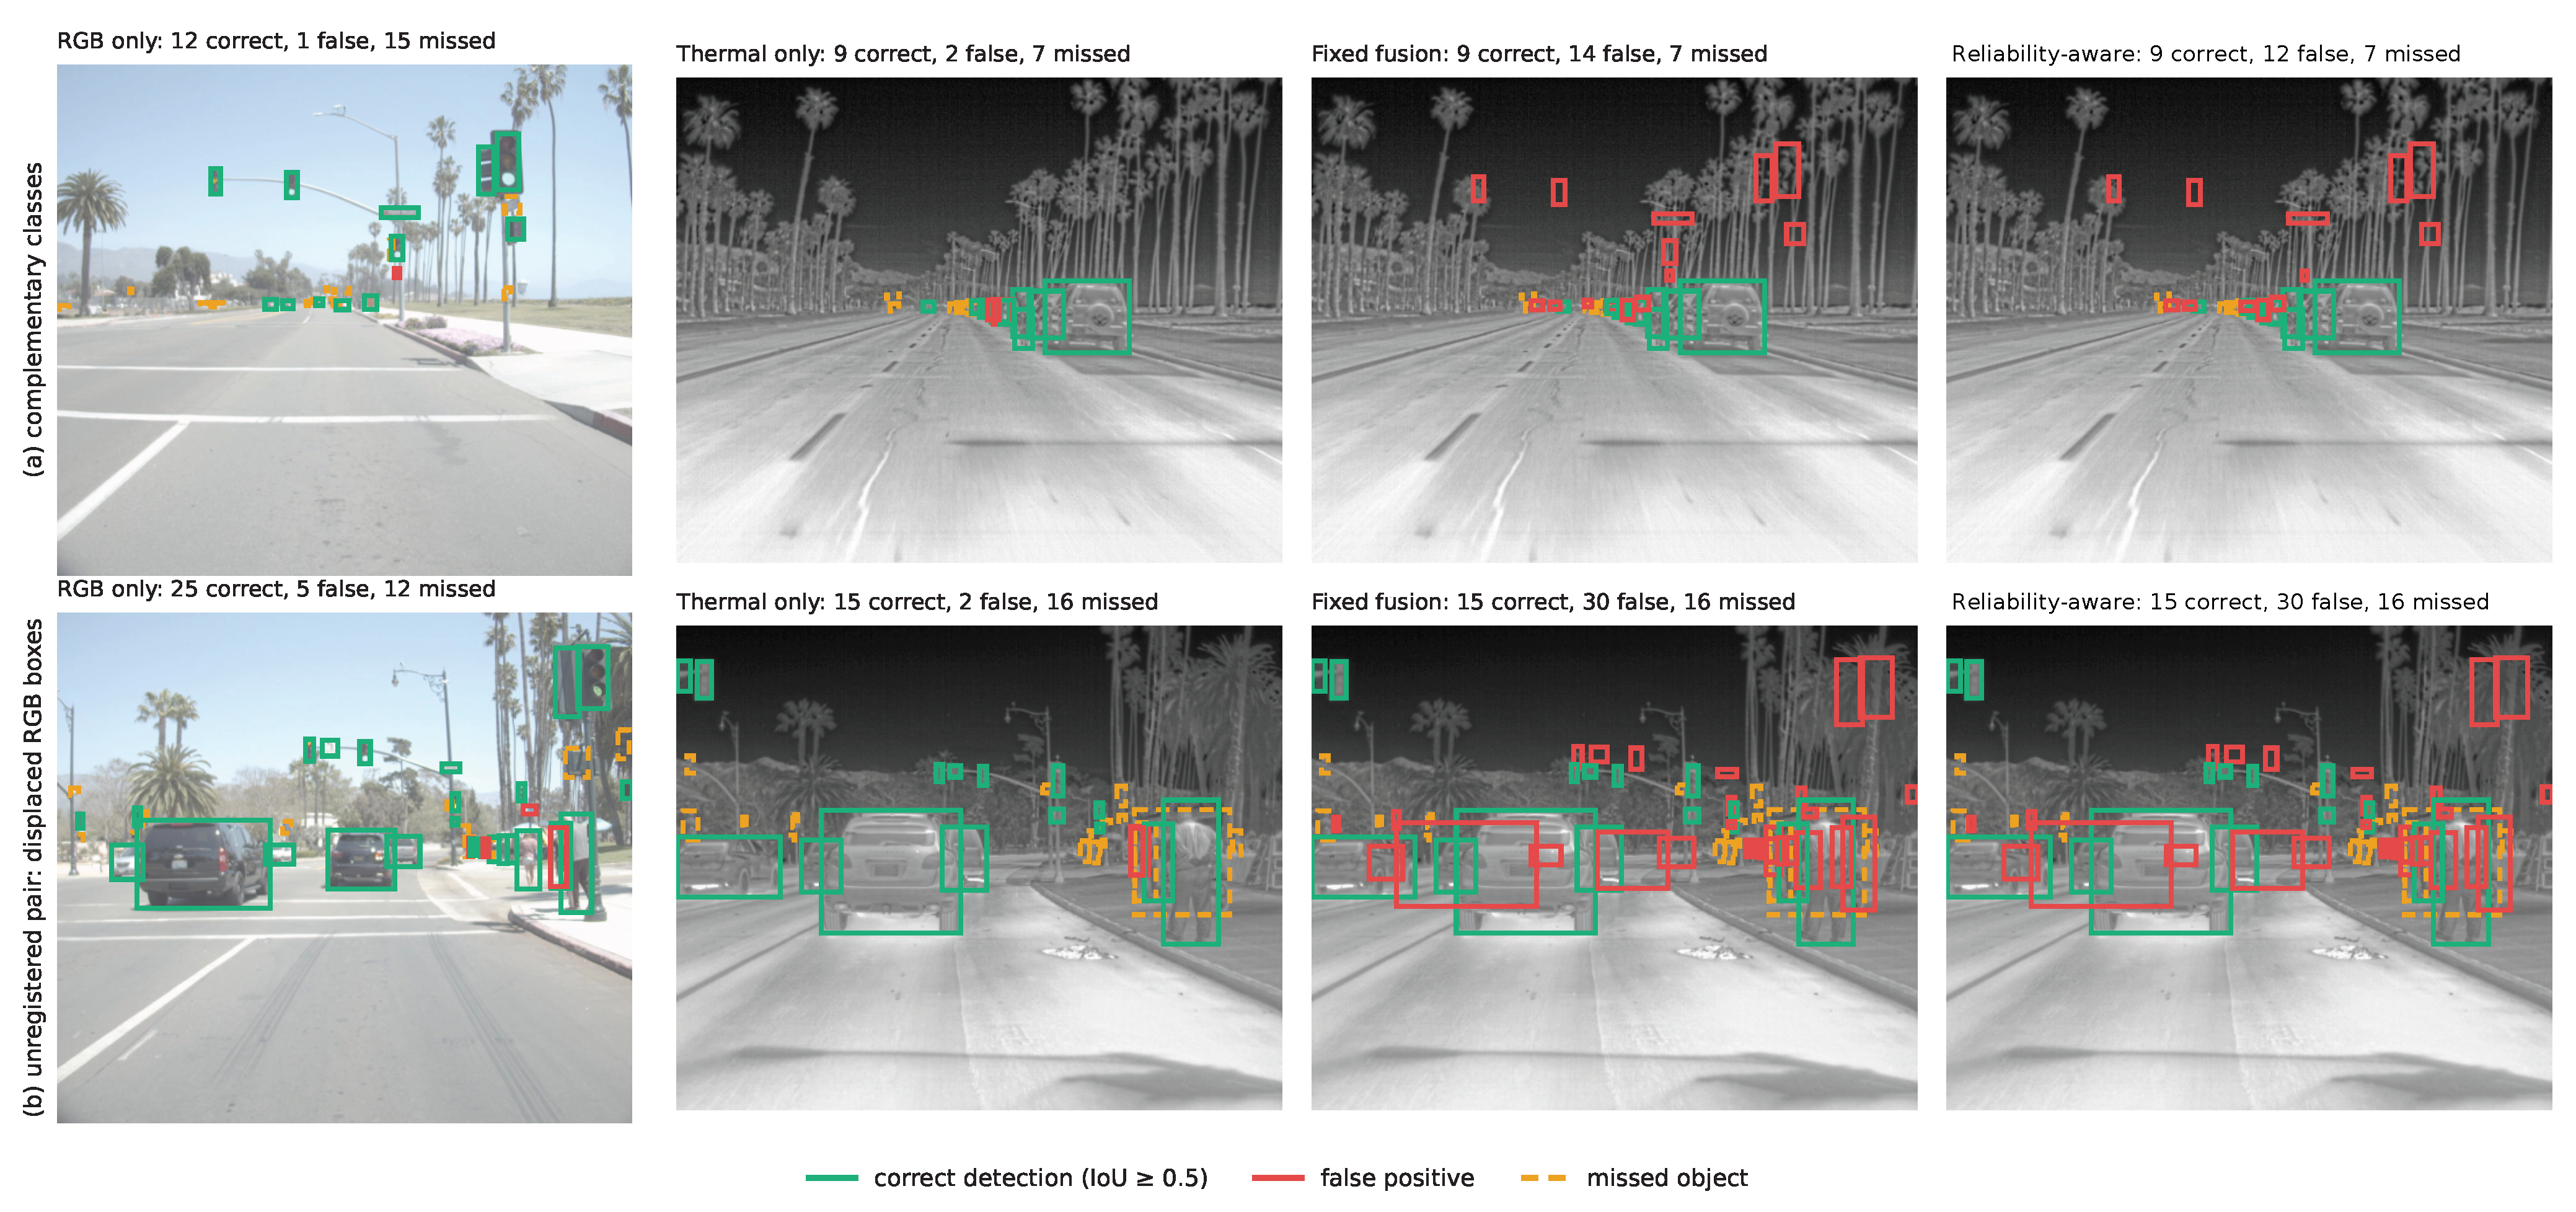

Disclaimer/Publisher’s Note: The statements, opinions and data contained in all publications are solely those of the individual author(s) and contributor(s) and not of MDPI and/or the editor(s). MDPI and/or the editor(s) disclaim responsibility for any injury to people or property resulting from any ideas, methods, instructions or products referred to in the content. |
© 2026 by the authors. Licensee MDPI, Basel, Switzerland. This article is an open access article distributed under the terms and conditions of the Creative Commons Attribution (CC BY) license.