Abstract
This paper investigates the application of graph theory and variants of greedy graph coloring algorithms for the optimization of distributed peer-to-peer networks, with a special focus on private blockchain networks. The graph coloring problem, as an NP-hard problem, presents a challenge in determining the minimum number of colors needed to efficiently allocate resources within the network. The paper deals with the influence of different graph density, i.e., the number of links, on the efficiency of greedy algorithms such as DSATUR, Descending, and Ascending. Experimental results show that increasing the number of links in the network contributes to a more uniform distribution of colors and increases the resistance of the network, whereby the DSATUR algorithm achieves the most uniform color saturation. The optimal configuration for a 100-node network has been identified at around 2000 to 2500 links, which achieves stability without excessive redundancy. These results are applied in the context of a private blockchain network that uses optimal connectivity to achieve high resilience and efficient resource allocation. The research findings suggest that adapting network configuration using greedy algorithms can contribute to the optimization of distributed systems, making them more stable and resilient to loads.
1. Introduction
The question of the complexity of algorithms is one of the key ones in the theory of computing, and all problems that can be solved in polynomial time belong to class P [1]. On the other hand, the set of all problems for which we can check the correctness of the solution in polynomial time is denoted by NP. One of the most important open questions in the theory of computing is the following: is P = NP? Among the most famous NP problems is the problem of coloring graphs, which asks the following question: with how many colors can we color the vertices of the graph so that no edge has ends of the same color? The smallest number of colors satisfying this condition is called the chromatic number of the graph [2].
Graph coloring is widely used in computer science, especially in optimization and resource scheduling. For example, when allocating registers in compilers, graph coloring enables the efficient allocation of registers to variables in order to minimize the number of required registers and avoid collisions between variables [3]. In task scheduling, graph coloring helps to allocate tasks to a limited number of processors without conflicts, which is crucial for the optimization of parallel systems. Also, in network theory, graph coloring enables the allocation of frequencies to base stations in telecommunication networks to avoid interference between neighboring stations, thus optimizing spectrum utilization. It is also widely used in distributed computer networks [4] such as blockchain networks [5]. Furthermore, graph coloring is also used in exam scheduling, ensuring that students taking the same subjects do not overlap in terms [6].
One of the basic approaches to solving graph coloring problems is greedy algorithms, which work by assigning to each vertex the first available color that does not cause a conflict with neighboring vertices. Greedy algorithms are popular due to their simplicity and speed, which makes them suitable for application in situations where a fast response is required, such as task scheduling or register allocation [3,6]. However, they often use more colors than is optimal, making them suboptimal when trying to minimize the number of colors needed to color a graph [7].
Existing blockchain solutions such as VeDB [8] and LedgerDB [9] enable high resistance to data changes and superior performance through advanced mechanisms such as Trusted Execution Environment (TEE) and verification structures such as VSA (Verifiable Shrubs Array); their implementation often requires specialized hardware and significant resource capacities. Since the goal is to develop a cost-effective private blockchain network of small to medium size, the paper focuses on the application of graph theory and variants of greedy coloring algorithms to optimize connectivity and stability in distributed systems. Those variants are used because they are widely recognized for their simplicity and computational efficiency. The goal of the research is to also identify the optimal connectivity configuration that allows for even resource distribution, reduced congestion, and increased network resilience to failures. The results have practical applications in the design of private blockchain networks, where the stability and efficiency of communication between nodes play a key role in maintaining a reliable and scalable network.
While this study provides valuable insights into the optimization of distributed peer-to-peer blockchain networks using greedy graph coloring algorithms, several limitations should be noted. Greedy algorithms, while computationally efficient, may not always achieve the theoretically minimal number of colors, potentially leading to suboptimal resource allocation in some cases. Additionally, the results presented here are based on simulations for a network of 100 nodes with a specific range of link densities, which may limit their generalizability to networks of different sizes or configurations. Finally, the conclusions are derived from theoretical models, and real-world implementation might introduce unforeseen challenges related to dynamic network behavior or external factors.
In the second chapter of this paper, the greedy algorithm will be described, and its basic algorithm will be given, and then, the most frequently mentioned types will be processed. In the third chapter, related work will be described, that is, a comparison of algorithms. In the fourth chapter, the results of testing subtypes of greedy algorithms on graphs of different density will be analyzed. The fifth chapter will describe how to apply graphs in network design, followed by the sixth chapter, which will describe how to determine the optimal number of links in computer networks using variants of greedy algorithms.
The main contributions of this paper can be summarized as follows:
- The paper investigates how different variants of greedy graph coloring algorithms, including DSATUR, Descending, and Ascending, can optimize the stability and resilience of distributed peer-to-peer networks;
- An optimal connectivity threshold for networks of 100 nodes (2000–2500 edges) has been identified, which balances resilience and efficiency without excessive redundancy;
- The concept of evenness of color distribution as a metric of network stability is introduced, providing a new way to assess node saturation and connectivity;
- The paper contributes to a better understanding of the efficiency of various greedy algorithms in distributed systems, extending their applications to blockchain technology.
2. Greedy Algorithms
The graph coloring problem is NP-hard, which means that computing the optimal solution is very complex, especially for larger graphs [10]. One of the simplest and most widely used approaches to solving the graph coloring problem is the greedy algorithm. This algorithm processes vertices one by one, assigning them the smallest possible color that is not already used by neighboring vertices. The greedy algorithm for solving the graph vertex coloring problem works as follows:
- The vertices of the graph are arranged in an arbitrary sequence;
- The first peak in the series is colored with color 1;
- Other vertices are colored with the color of the smallest number for which it is valid that this vertex is not connected to another vertex of the same color;
- It returns to step 3 until all vertices are painted.
Although the greedy algorithm is simple, it often uses more colors than is optimal, which means that it does not always find the best solution. However, its speed and ease of use make it useful in many practical situations. In practice, the order in which the vertices are processed significantly affects the efficiency of the greedy algorithm. Some strategies include sorting the vertices by degree (the number of edges connecting them) in ascending or descending order or using a random order [3]. Sorting vertices in descending order is also called the Welsh–Powell algorithm [11]. In addition to this, the DSATUR algorithm is also popular, which colors vertices according to the degree of saturation, that is, it looks at how many neighboring vertices are already colored [12].
2.1. Descending (Welsh–Powell) Algorithm
Welsh–Powell is a variant of the greedy algorithm that uses descending order to color the vertices of a graph. The vertices are first sorted according to their degree, i.e., the number of neighbors they have, so that the vertices with the most neighbors are colored first. After the vertices are sorted, coloring takes place in the standard greedy way: each vertex is assigned the first available color that does not cause a conflict with its neighbors.
The advantage of this algorithm is that it often uses fewer colors than the basic greedy algorithm, because it colors the most connected vertices first, which reduces the number of colors needed for the rest of the vertices. Its main disadvantage is that it requires additional time to sort the vertices before coloring, but overall gives better results compared to random or unordered greedy algorithms [11].
2.2. Ascending Algorithm
In the ascending greedy variant, the vertices are sorted according to the ascending order of degrees, that is, the number of neighbors each vertex has. The vertices with the smallest number of neighbors are colored first. After sorting, coloring takes place according to the standard greedy algorithm, where each vertex is assigned the first available color that does not cause a conflict with neighboring vertices.
The advantage of this variant is its simplicity and quick application. Vertices with a lower degree are processed first, which can facilitate coloring in specific situations. The disadvantage is using more colors than other variants because it leaves more complex vertices for later, when most colors are already occupied, which can lead to suboptimal coloring [13].
2.3. DSATUR Algorithm
The DSATUR (Degree of Saturation) algorithm also uses a greedy method but relies on the degree of saturation of the peak. The degree of saturation measures how many neighbors of a given vertex are already colored with different colors. In each step of the algorithm, the vertex with the highest degree of saturation is selected for coloring, i.e., the vertex with the most colored neighbors. If several vertices have the same degree of saturation, then the vertex with the highest degree (number of neighbors) is selected.
The advantage of this algorithm is that it often gives better solutions than other variants of greedy algorithms because it intelligently chooses vertices with the highest degree of saturation, which reduces conflicts and enables more efficient coloring. The disadvantage of this algorithm is that it requires more computation due to monitoring the degree of saturation, which makes it somewhat more complex and slower than classical greedy algorithms [12].
2.4. Random Algorithm
In this variant of the greedy algorithm, instead of sorting the vertices according to some strategy (such as the degree of the vertex in ascending or descending order), the vertices are colored in a random order. After the order of vertices is randomly selected, the algorithm proceeds with coloring using the classic greedy method: each vertex is assigned the first available color that does not cause a conflict with its neighbors. The advantage of this method is that it is very simple to implement and can quickly generate solutions. Due to the random selection of the order of vertices, the random greedy algorithm often gives suboptimal results and uses more colors than variants that use strategic ordering (e.g., Welsh–Powell) and this is the biggest flaw. However, due to its simplicity, it can be useful in situations where speed is more important than optimality [14].
3. Related Work
The graph coloring problem has wide applications in computer science, including resource optimization, task scheduling, and frequency allocation. Over the years, scientists have developed numerous methods and algorithms to improve the efficiency of the solution. The research of different approaches and variants of greedy algorithms is a key part of this work.
Some papers, such as [15] from 2013, focus on developing new heuristics for specific types of graphs, such as interval graphs. This paper introduces an optimal greedy heuristic that ensures that graphs are colored with the optimal number of colors using a properly chosen coloring order. The authors conclude that such optimization enables better performance in specific graph structures, thereby significantly reducing the complexity of the algorithm in real scenarios. Similarly, Ref. [3] explores the complexity of graph partitioning using the greedy approach. The authors conclude that greedy methods are particularly useful in large and complex graphs where speed optimization is key and suggest their application in graphs with specific partitioning requirements.
Other papers, such as [16] from 2024, explore variants of greedy algorithms such as b-greedy and z-greedy. The authors conclude that these variants provide better results in graphs with a high degree of connectivity, where classical greedy algorithms are not efficient. These variants help in the more accurate coloring of complex graph structures, where the balance between the number of colors and the density of vertices plays a key role. Also, the paper [17] from 2016 compares several variants of greedy algorithms, including DSATUR and Welsh–Powell. It was concluded that the DSATUR algorithm is most suitable for graphs with high density, while Welsh–Powell achieves the best results in situations where the speed of the algorithm is key.
Papers like [7] from 2021 provide a comprehensive comparison of various methods, including First Fit, DSATUR, and Welsh–Powell, and analyze their performance in different graphs. The authors conclude that DSATUR is the most efficient for complex graphs with high density, while the Welsh–Powell algorithm is the fastest for solving simpler graphs. This paper emphasizes the importance of choosing an appropriate algorithm in accordance with the characteristics of graphs, thereby contributing to the understanding of the relationship between graph structure and algorithm efficiency. On the other hand, the paper [18] offers an overview of different algorithms on graphs from the DIMACS benchmark, and concludes that DSATUR consumes the least colors, while Welsh–Powell is the fastest. The authors recommend using these algorithms depending on priorities such as time optimization or the number of colors.
In addition to these studies, the paper [19] from 1992 offers a deeper insight into the limitations of greedy algorithms, especially in the context of finding complex structures such as cliques in large graphs. The authors conclude that greedy algorithms, although fast, fail to effectively detect such structures, which indicates the need for more complex methods in specific cases.
In conclusion, these papers provide a comprehensive overview of different variants of greedy algorithms, highlighting their applicability in different contexts, from specialized types of graphs, such as interval graphs, to more complex structures with a large number of vertices. The papers also emphasize the importance of comparison between algorithms in terms of efficiency and applicability on different types of graphs.
4. Testing Variants of Greedy Algorithm and Analysis of Results
To test the impact of graph density on the efficiency of graph coloring with greedy methods, 10 cases were used. In all 10 cases, a graph with 100 vertices was used, while the number of edges, i.e., their density, increased. The smallest number of edges is 500. In each subsequent iteration, the number of edges increased by 500, and this method of incrementing reached 4500. The largest number of edges between 100 vertices is 4950, and this is singled out as a special case.
The following variants of the greedy algorithm were used: Descending (Welsh–Powell), Ascending, Random, and DSATUR. For each edge density, each variant was tested a thousand times. The average of the colors was calculated, and the results are included in Table 1.

Table 1.
Average number of colors used by greedy algorithm variants.
After processing the data from the table, some of the test conclusions are presented graphically on the graph shown in Figure 1.
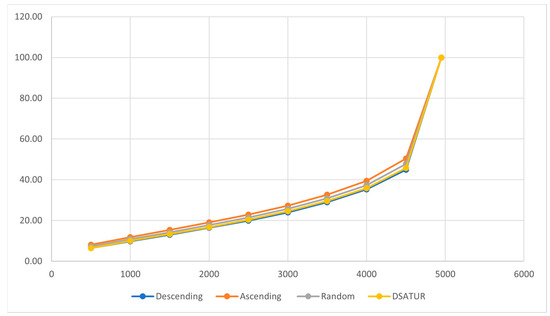
Figure 1.
Impact of graph density on greedy algorithm variants.
Based on the presented graph, several key conclusions can be drawn about the influence of graph density on variants of greedy algorithms:
- General trend and linear growth: All curves show an almost linear growth in the number of colors needed to color the graph as the number of edges increases, that is, as the graph becomes denser. This linear growth indicates that all algorithms have a proportional increase in the number of required colors with increasing graph density. As the number of adjacent vertices increases, more colors need to be used to avoid conflicts.
- Descending consistently outperforms other variants by requiring fewer colors, as prioritizing highly connected vertices minimizes conflicts. This strategy is efficient because the most connected vertices receive colors before they are assigned to their neighbors, thus reducing the need for additional colors.
- The Ascending Algorithm is the least efficient: The Ascending Algorithm almost always uses the largest number of colors. Sorting vertices in ascending order, where the vertices with the smallest number of neighbors are colored first, turns out to be an inefficient approach because it leaves more complex vertices for later, when most of the colors are already occupied.
- Random and DSATUR algorithms: Random and DSATUR algorithms show average results, being placed between the Descending and Ascending variants. The DSATUR algorithm is generally closer to Descending in efficiency because it uses the degree of saturation to select vertices, which allows it to better optimize the number of colors. The Random algorithm, although less consistent, also offers relatively good results.
- Extreme density: It is interesting to note that all algorithms use the maximum number of colors (100% coloring) at a very high density of the graph, that is, when the graph has 4950 edges. This means that, in such a dense graph, each vertex must have its own unique color because all vertices are directly or indirectly connected.
Although the Ascending variant turned out to be the worst, its percentage reduction is still visible with regard to the best variant for a particular case. In the first variant, with the sparsest graph, the difference was 20.56%, while at the end of the test, with the densest graph (except for the special case with 4950 edges), that difference dropped to 10.91%. Figure 2 shows a drop in the percentage difference, but it can be seen that this drop is not linear.
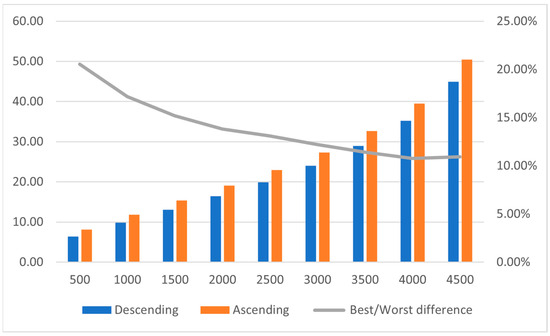
Figure 2.
Percentage difference between best and worst case.
It can be concluded that the Descending algorithm is the most efficient in most cases, while the Ascending algorithm is the least efficient. Random and DSATUR algorithms offer a balance between the speed and number of colors, depending on the density of the graph. The almost linear growth of the curves for all algorithms shows that the number of colors needed for graph coloring is proportional to the density of the graph, but also that the type of greedy algorithm can significantly affect the number of colors needed for efficient coloring.
5. Application of Graphs in Blockchain Network Design
The private distributed network of 100 nodes represents a blockchain system in which each node has the possibility of direct communication with other nodes, and the purpose of the network is to enable the safe and efficient exchange of information. In the blockchain architecture, each node participates in the maintenance of a distributed database, ensuring high fault tolerance and preserving data integrity. This kind of network is designed as a peer-to-peer (P2P) system without a central server, which achieves decentralization and increases security [20].
In this chapter, it will be explained how graph theory and vertex coloring with variants of the greedy algorithm can help in modeling such a network. Nodes are represented as vertices, and connections between nodes as edges of the graph. According to [21] the maximum number of edges between nodes is given by Equation (1):
5.1. The Effect of the Number of Edges on the Performance of the Blockchain Network
In blockchain networks, there is no strictly defined minimum number of links (edges) that would automatically make the network decentralized and distributed. Decentralization in the blockchain architecture results from the independence of nodes and the distribution of data among nodes in the network. A network can be considered distributed and decentralized when nodes function independently of each other, data and tasks are evenly distributed, and nodes are sufficiently connected to allow information exchange and fault tolerance [22].
5.1.1. Problems with Too Few Links
Too few links in a network can significantly affect blockchain performance, creating communication bottlenecks, overloading certain nodes, and reducing fault tolerance. Namely, when nodes do not have enough links to other nodes, the risk of congestion increases because all information is transmitted through a limited number of channels, which reduces efficiency and increases network latency [23].
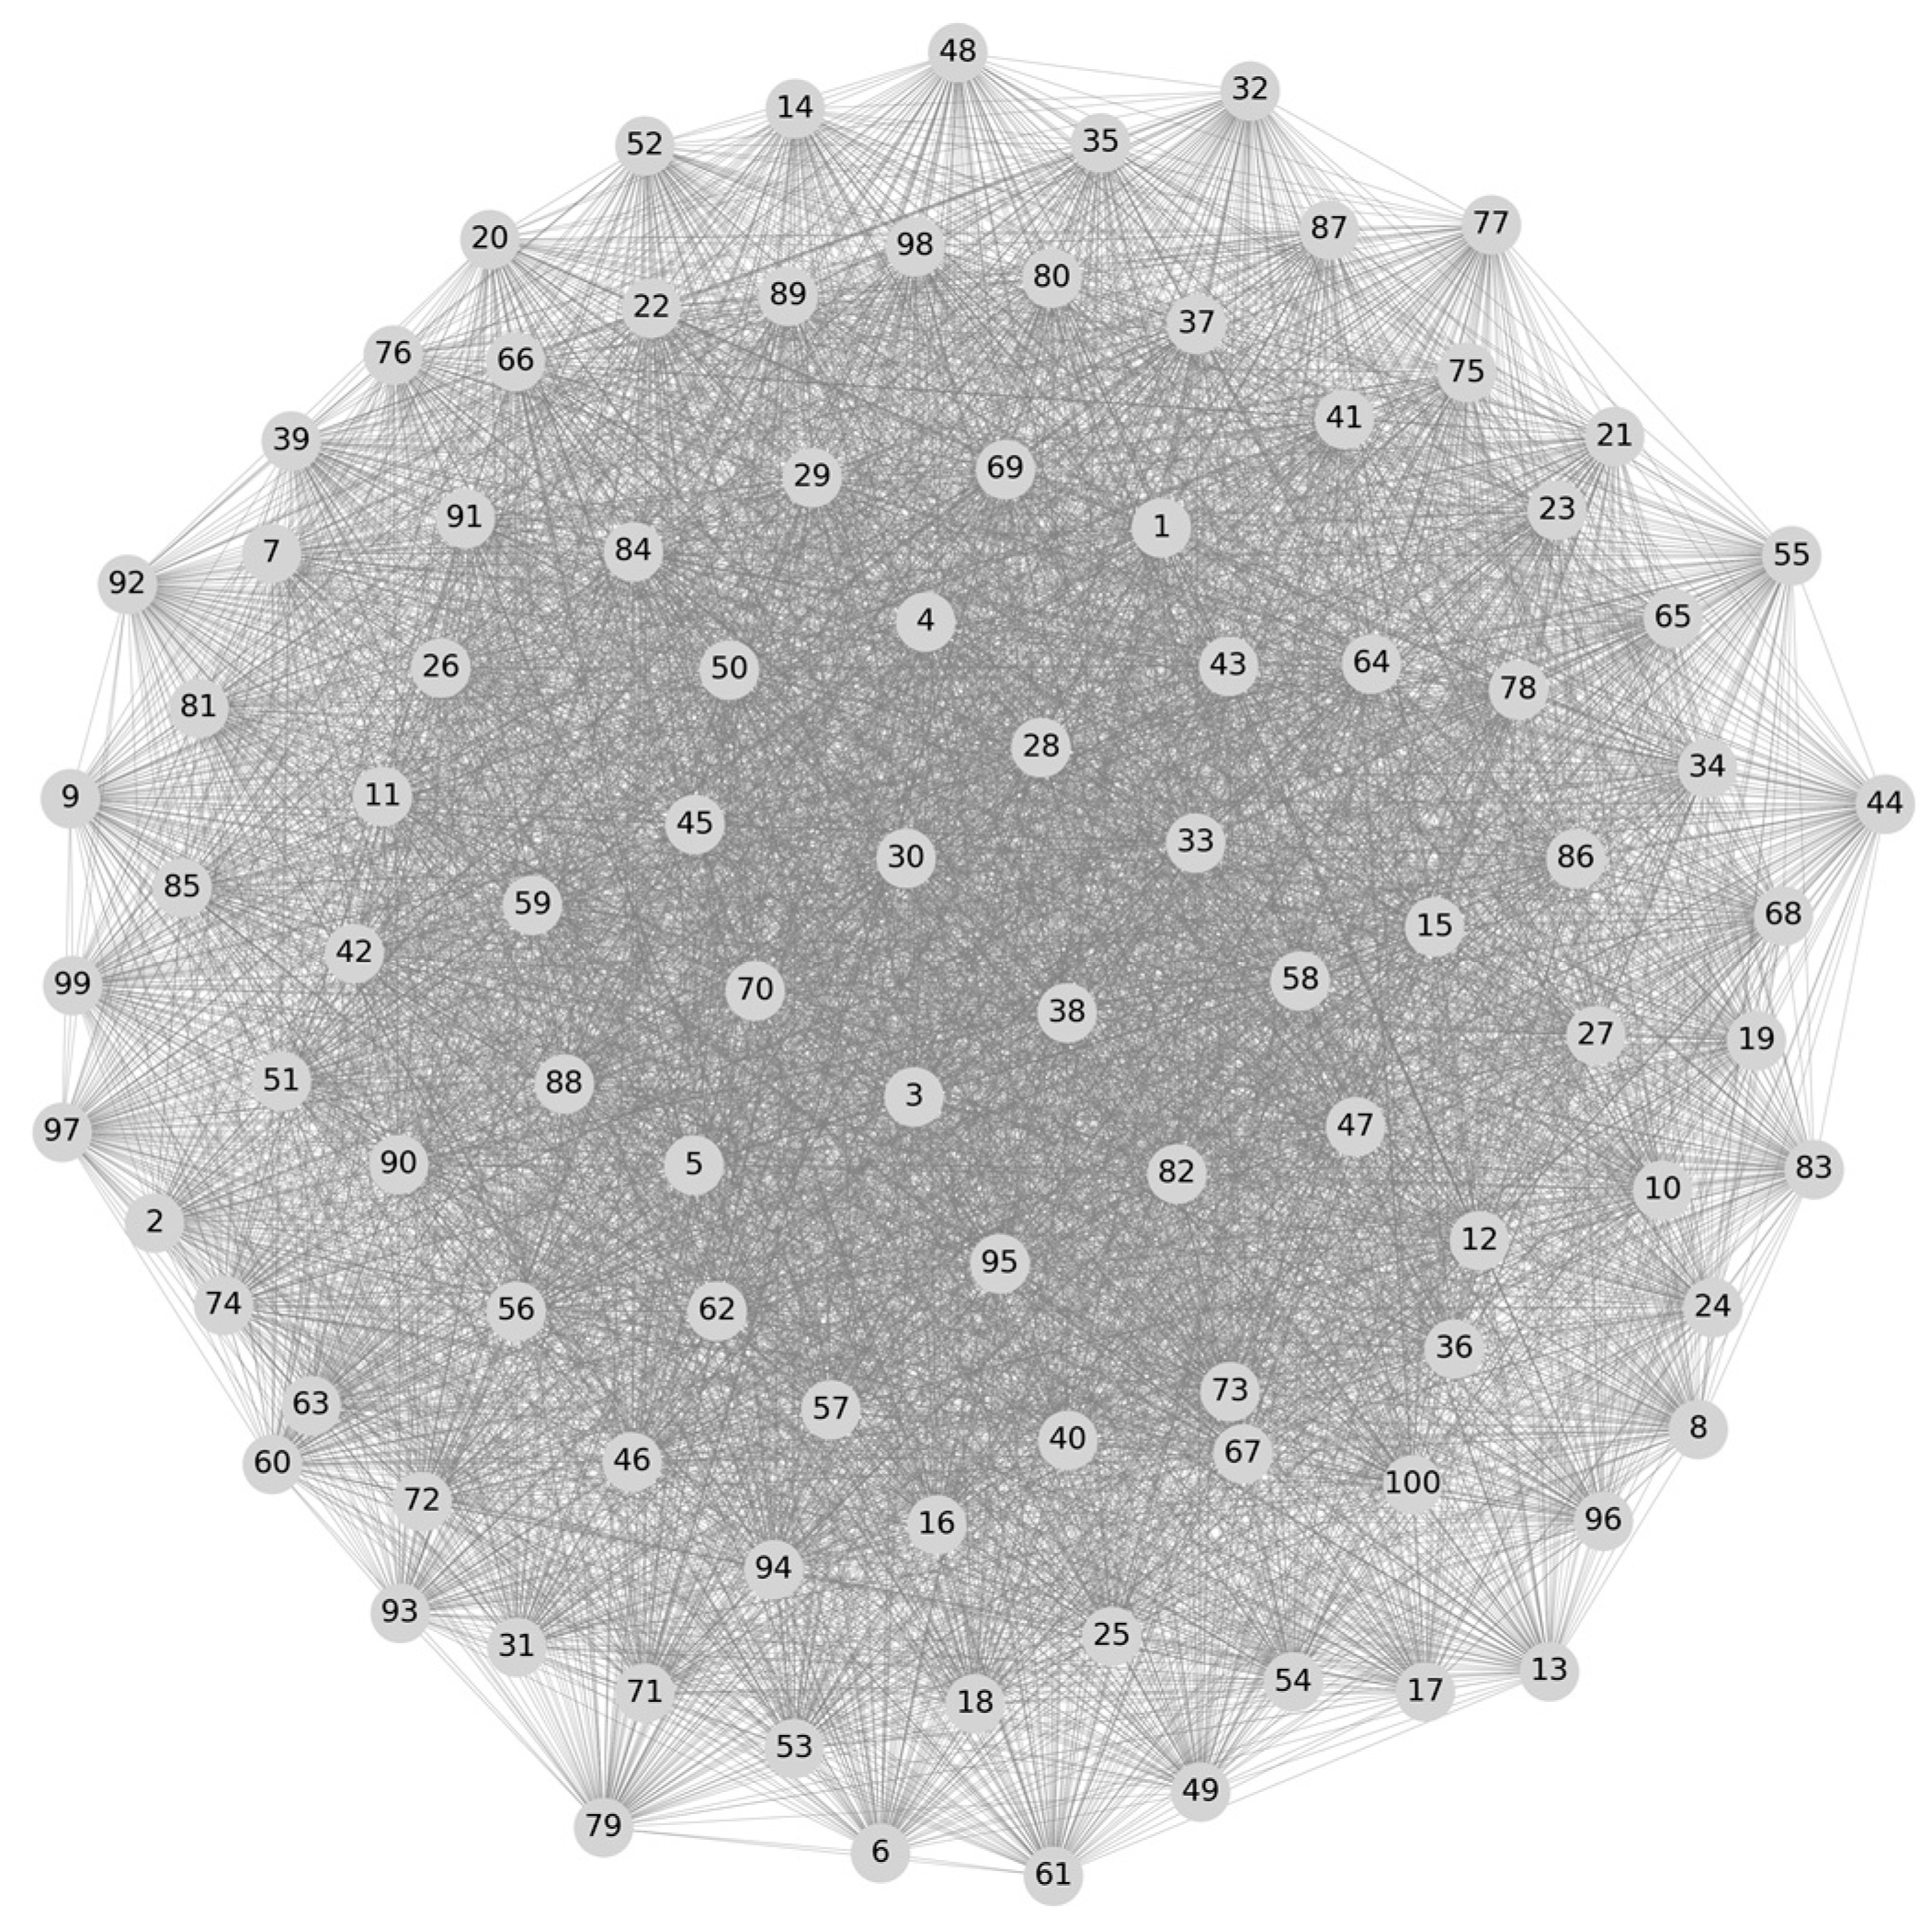
In a distributed network with too few links, the load becomes unevenly distributed, with some nodes overloaded by the need for multiple data transfers, while other nodes remain underutilized. This imbalance can compromise data security and integrity, as a lack of links makes it difficult to transfer data quickly and synchronize between nodes [22]. Figure 3 shows the worst-case scenario of the connected network. The minimum number of links was used in the network, which for this network of 100 nodes is 99. In the picture, the nodes with only one link are colored red. In such a network, there is no redundancy, and it is not resistant to failures.
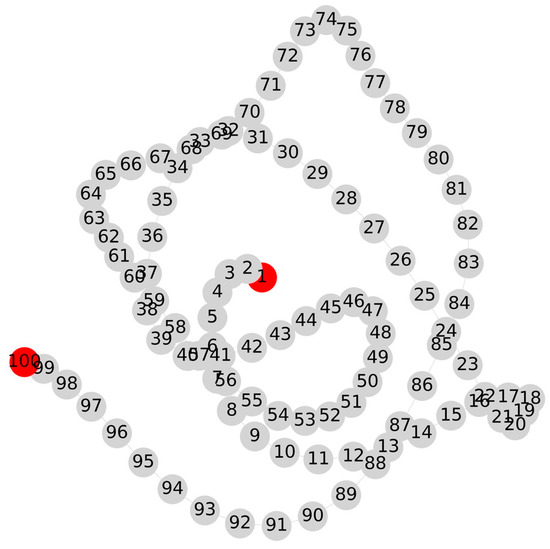
Figure 3.
A network with 100 nodes and 99 links.
5.1.2. Advantages and Disadvantages of Too Many Links
The excessive number of links in the blockchain network has its advantages, but it also brings certain disadvantages. On the one hand, a larger number of links increases the network’s resistance to failures because data can be redirected through alternative channels in the event of a failure of certain nodes. More links enable better load balancing between nodes, which avoids bottlenecks and reduces data transfer latency [24].
However, networks with too many links increase the complexity of data routing and burden the system with unnecessary communications. Increased connectivity can also mean greater exposure to security risks, as more links provide more potential points of attack. In private blockchain networks, which require security and resilience, an excessive number of links can create additional security vulnerabilities and increase network maintenance costs due to the exponential growth of the number of links with the growth of nodes [22]. Figure 4 shows a fully connected network with 100 nodes and 4950 links.

Figure 4.
Fully connected network with 100 nodes and 4950 links.
5.1.3. Optimal Number of Links
In order to achieve the optimal number of links, it is necessary to balance network resilience with performance economy. Graph theory suggests that a network with a moderate number of links can maintain fault tolerance and security without unnecessary redundancy. Partial mesh or small-world topologies in practice enable a relatively small number of edges that ensure a high resistance and efficiency of data transmission. In these topologies, the nodes are connected enough that data can circulate quickly through the network, but there are not an excessive number of edges to create congestion or increase complexity. The optimal number of links can vary. According to [25,26], for a network of 100 nodes, 4950 links are not needed. According to [27], an approximation is 30–50% of that number, which is about 1500–2500 links. This is a rough recommendation that often provides a good balance between resilience and avoiding excessive redundancy in large networks, but the exact optimal number of edges depends on the specific requirements of the network, such as security, throughput, and resilience. The next chapter will reduce this rough approximation to more concrete numbers.
6. Determining the Optimal Number of Links Using Variants of the Greedy Algorithm
While existing systems such as VeDB and LedgerDB offer exceptional performance and tamper resistance through advanced mechanisms like Trusted Execution Environments (TEEs) and verifiable structures such as the Verifiable Shrubs Array (VSA), their implementation often requires specialized hardware and substantial resource investments. These requirements make them less suitable for small to medium-sized private blockchain networks, where cost-efficiency and scalability are critical. This study focuses on a simpler and more cost-effective approach by leveraging graph coloring algorithms, specifically variants of greedy algorithms, to optimize node connectivity and resource distribution. The results demonstrate that it is possible to achieve network stability and efficient resource allocation without relying on advanced hardware infrastructures.
Greedy graph coloring algorithms, such as Descending and DSATUR, can effectively optimize the distribution of links among nodes by allocating links based on the current load and degree of connectivity of the nodes. This optimal configuration enhances network resilience, ensures efficient data transmission, and minimizes the likelihood of bottlenecks. These variants are particularly relevant because greedy algorithms are widely recognized for their simplicity and computational efficiency, making them well-suited for scenarios requiring rapid optimization, such as distributed systems. This study leverages their ability to optimize node connectivity and resource distribution within distributed peer-to-peer blockchain networks.
6.1. Insights into Network Structure Properties from Graph Coloring Algorithms
In networks that use different coloring strategies, some variants of greedy algorithms have specific effects on the color distribution and structure of the network. DSATUR minimizes conflicts in blockchain networks by prioritizing nodes with the most differently colored neighbors, ensuring balanced color distribution. If all the colors used in the DSATUR algorithm appear an equal number of times throughout the network, this means that each node has a similar number of neighbors with different colors, which suggests balanced connectivity and a consistent distribution of colors throughout the network. Such uniform color saturation helps stabilize the network and increases resilience to overloads, reducing the risk of bottlenecks.
In blockchain networks, the Descending algorithm efficiently colors densely connected nodes first, reducing conflicts and optimizing central node connectivity. If all the colors used in the Descending algorithm occur equally, this means that the links in the network are evenly distributed. Uniformity in the repetition of colors in this case indicates that there are no nodes with a dominantly large number of one color, which allows the network to achieve a balanced degree of connectivity and avoid congestion in densely connected nodes. This pattern of color distribution contributes to the stability of the network, making it more resistant to overload and congestion.
The Ascending algorithm allocates fewer colors to sparsely connected nodes, balancing color usage across the network. After coloring the nodes with fewer neighbors, the algorithm moves on to nodes with more neighbors, which then have a limited range of colors due to the already colored neighbors. The ascending approach results in a greater variety of colors in the edges of the network, while the central parts, with more links, remain balanced because they have enough options to avoid conflicts with the colors of their neighbors.
The application of the DSATUR algorithm ensures network stability because evenly distributed color saturation allows for balanced connectivity and reduces the risk of overload. The descending algorithm provides additional stability in networks with densely connected central parts because it allows for optimal color distribution among nodes with a high number of links. The ascending approach is useful for networks that require optimal color distribution in the edge parts, thus reducing the load on the central nodes. The combination of these algorithms can ensure network stability and resilience, adapting to different configurations and requirements of network systems, such as distributed and blockchain networks.
6.2. Coloring of a Network with 100 Nodes with Variants of the Greedy Algorithm for the Purpose of Optimization
For this paper, a computer-generated network of 100 nodes was used, and different amounts of edges were used. For this testing, a vertex represents a node in the blockchain network, while an edge acts as a link. Different link densities were tested.
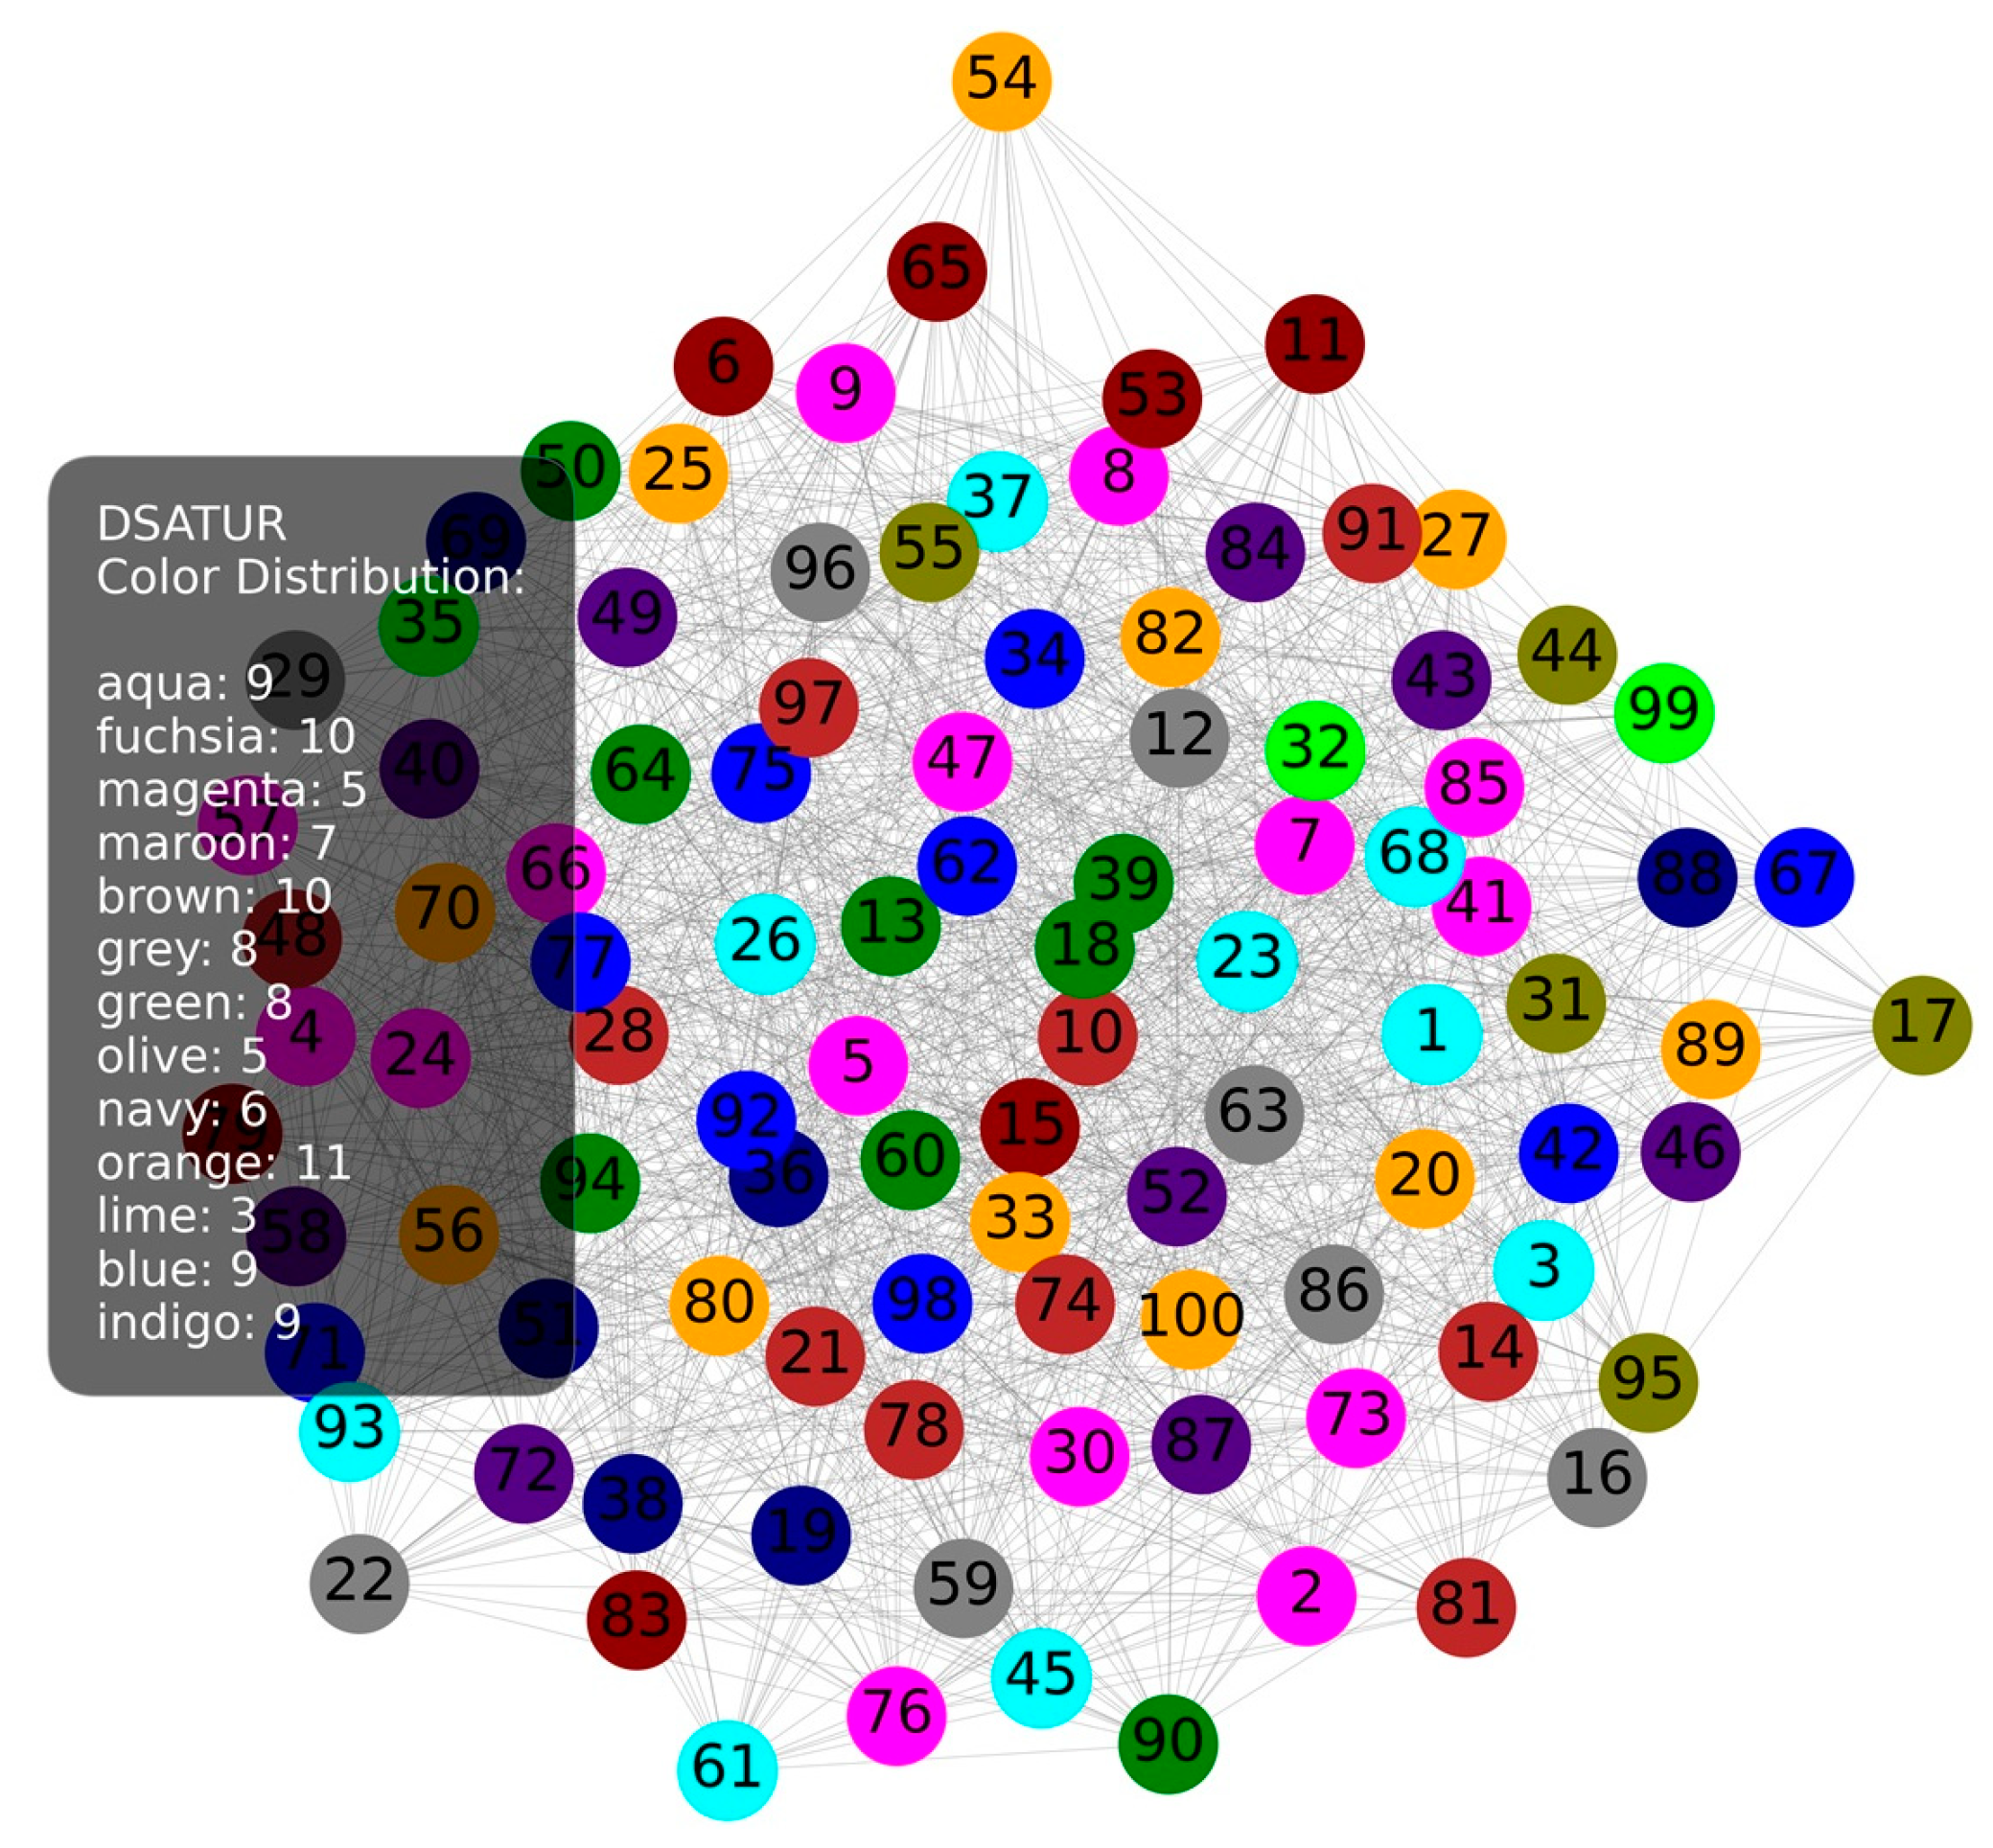
6.2.1. 1500 Links
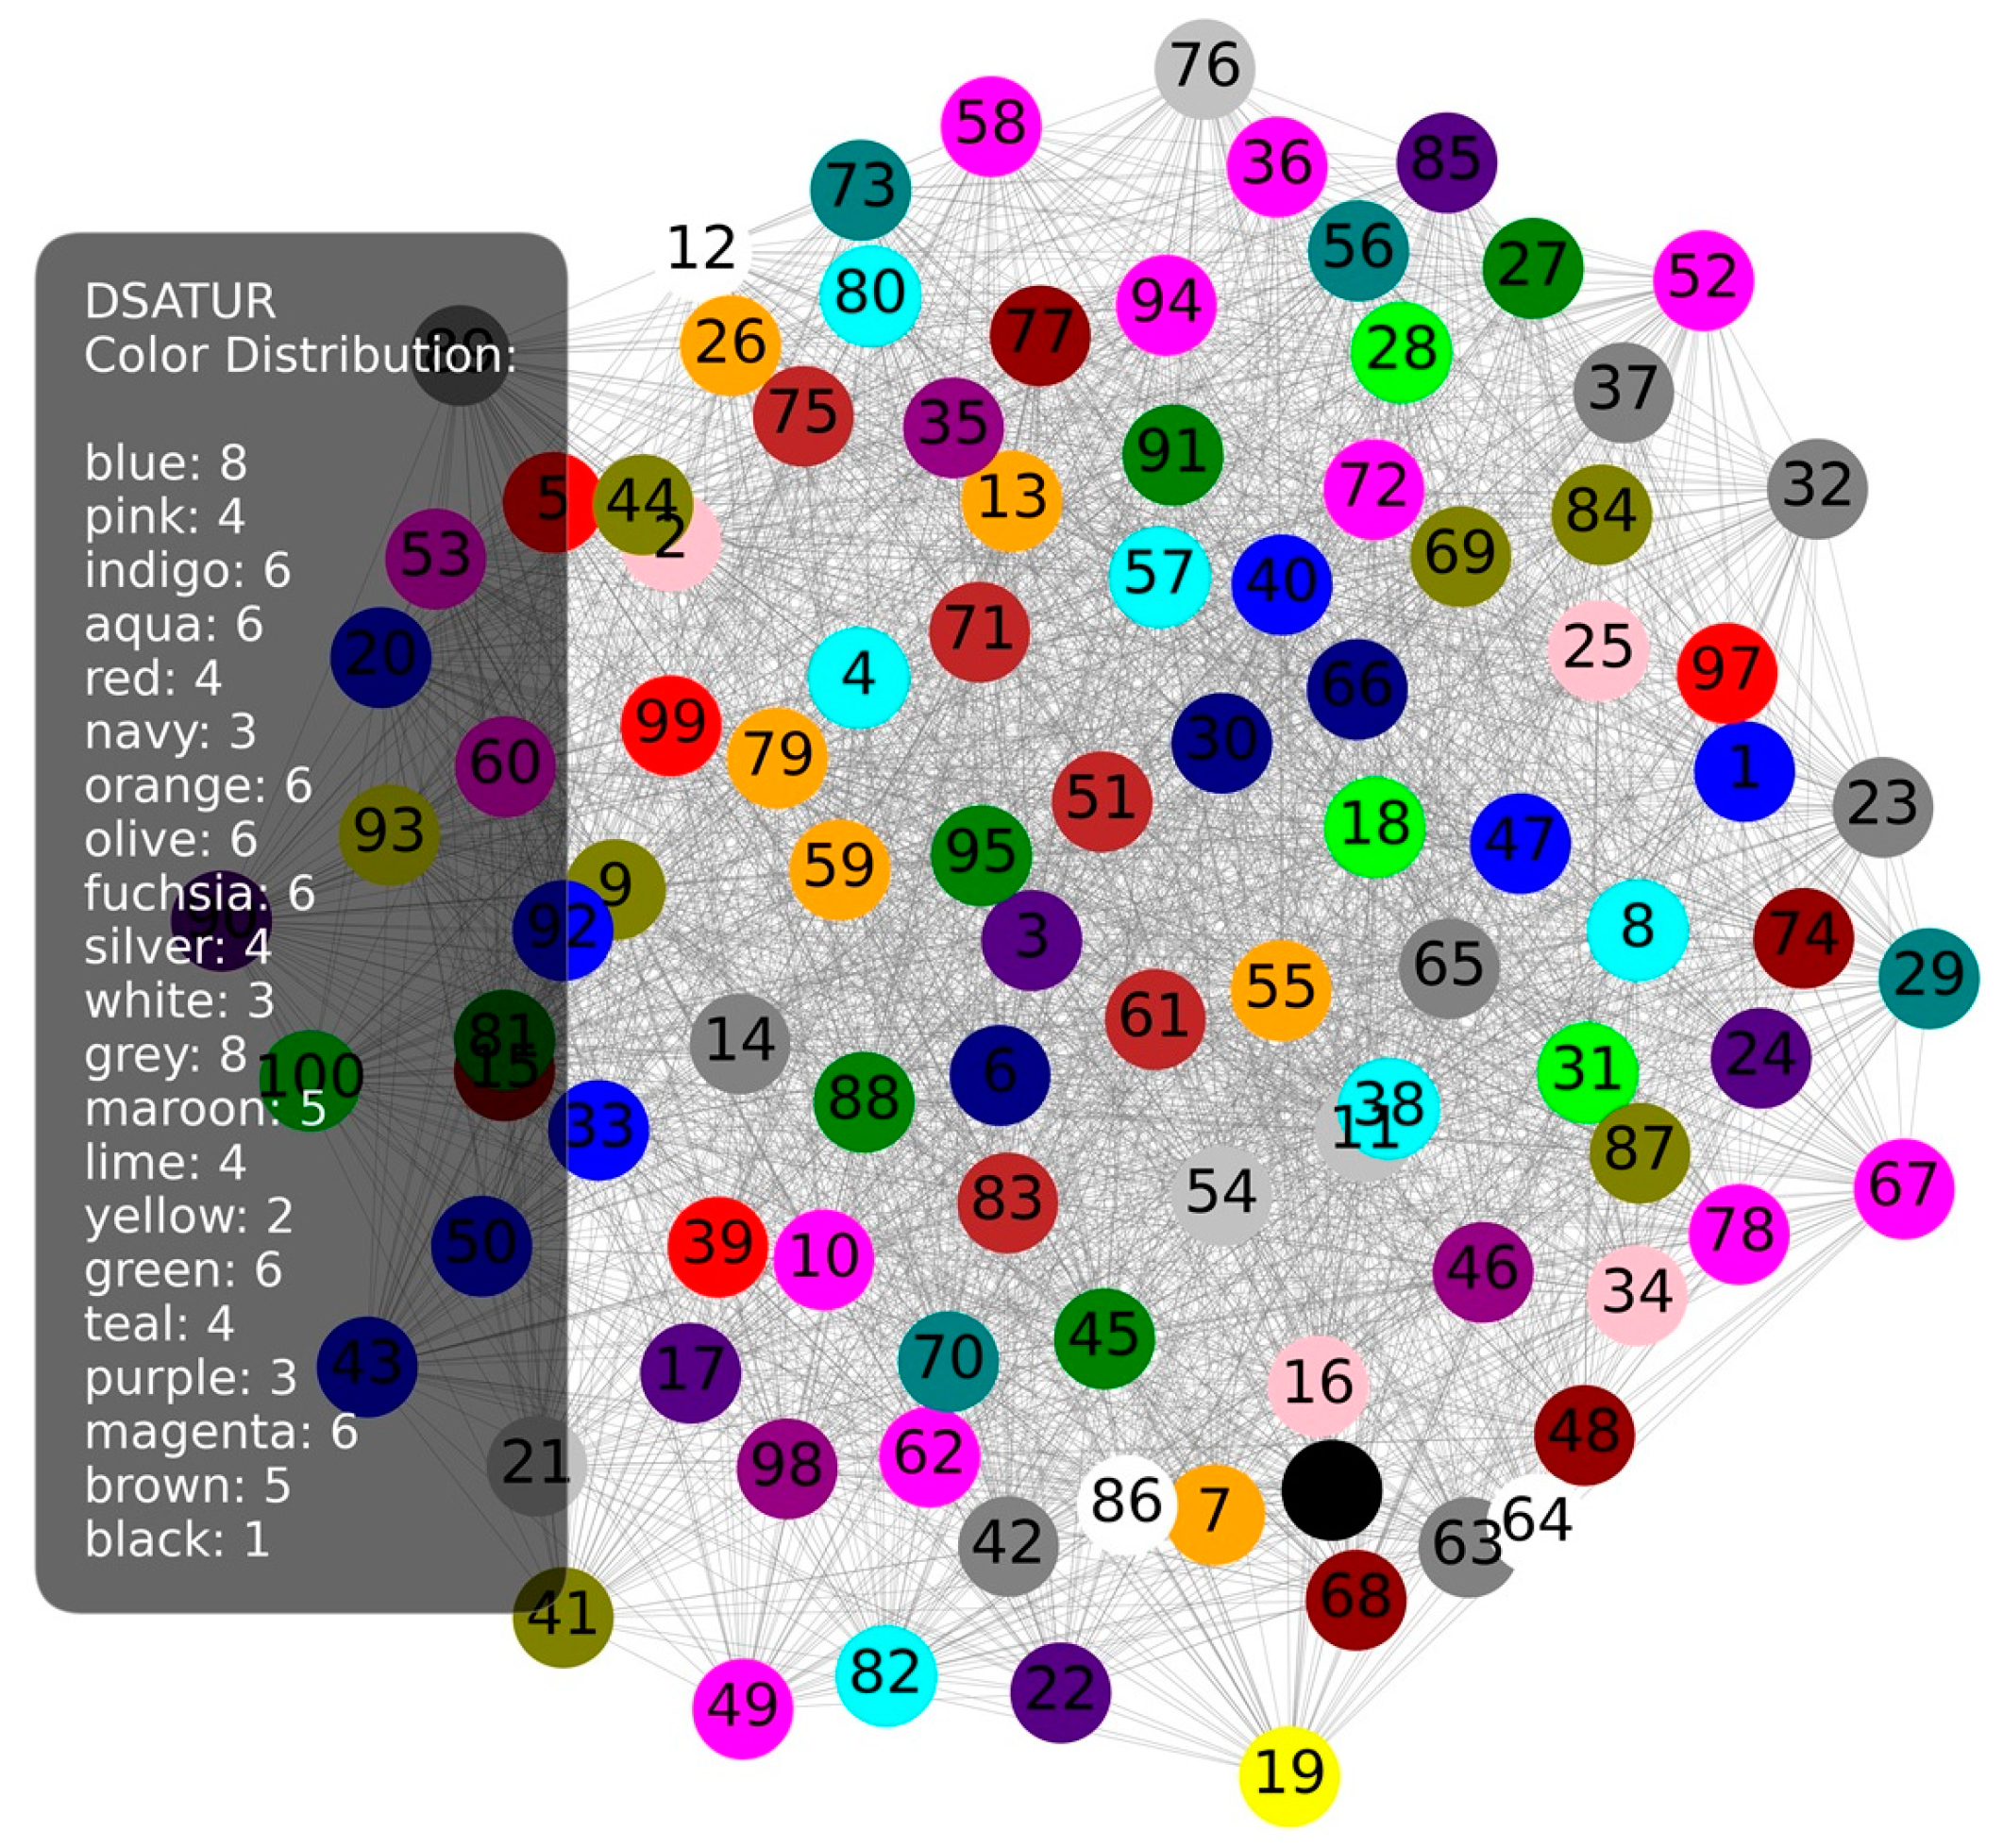
Figure 5 shows a graph with 1500 links colored according to the DSATUR variation. Coloring by saturation shows diversity in the use of colors, but this concentration of colors is not uniform throughout the network. Nodes with higher saturation use specific colors at the beginning. Since such vertices are colored first, these colors are first in the list. The colors are relatively uniform, but there are parts with a concentration of specific colors, indicating an uneven saturation of the network.

Figure 5.
DSATUR 100 nodes 1500 links.
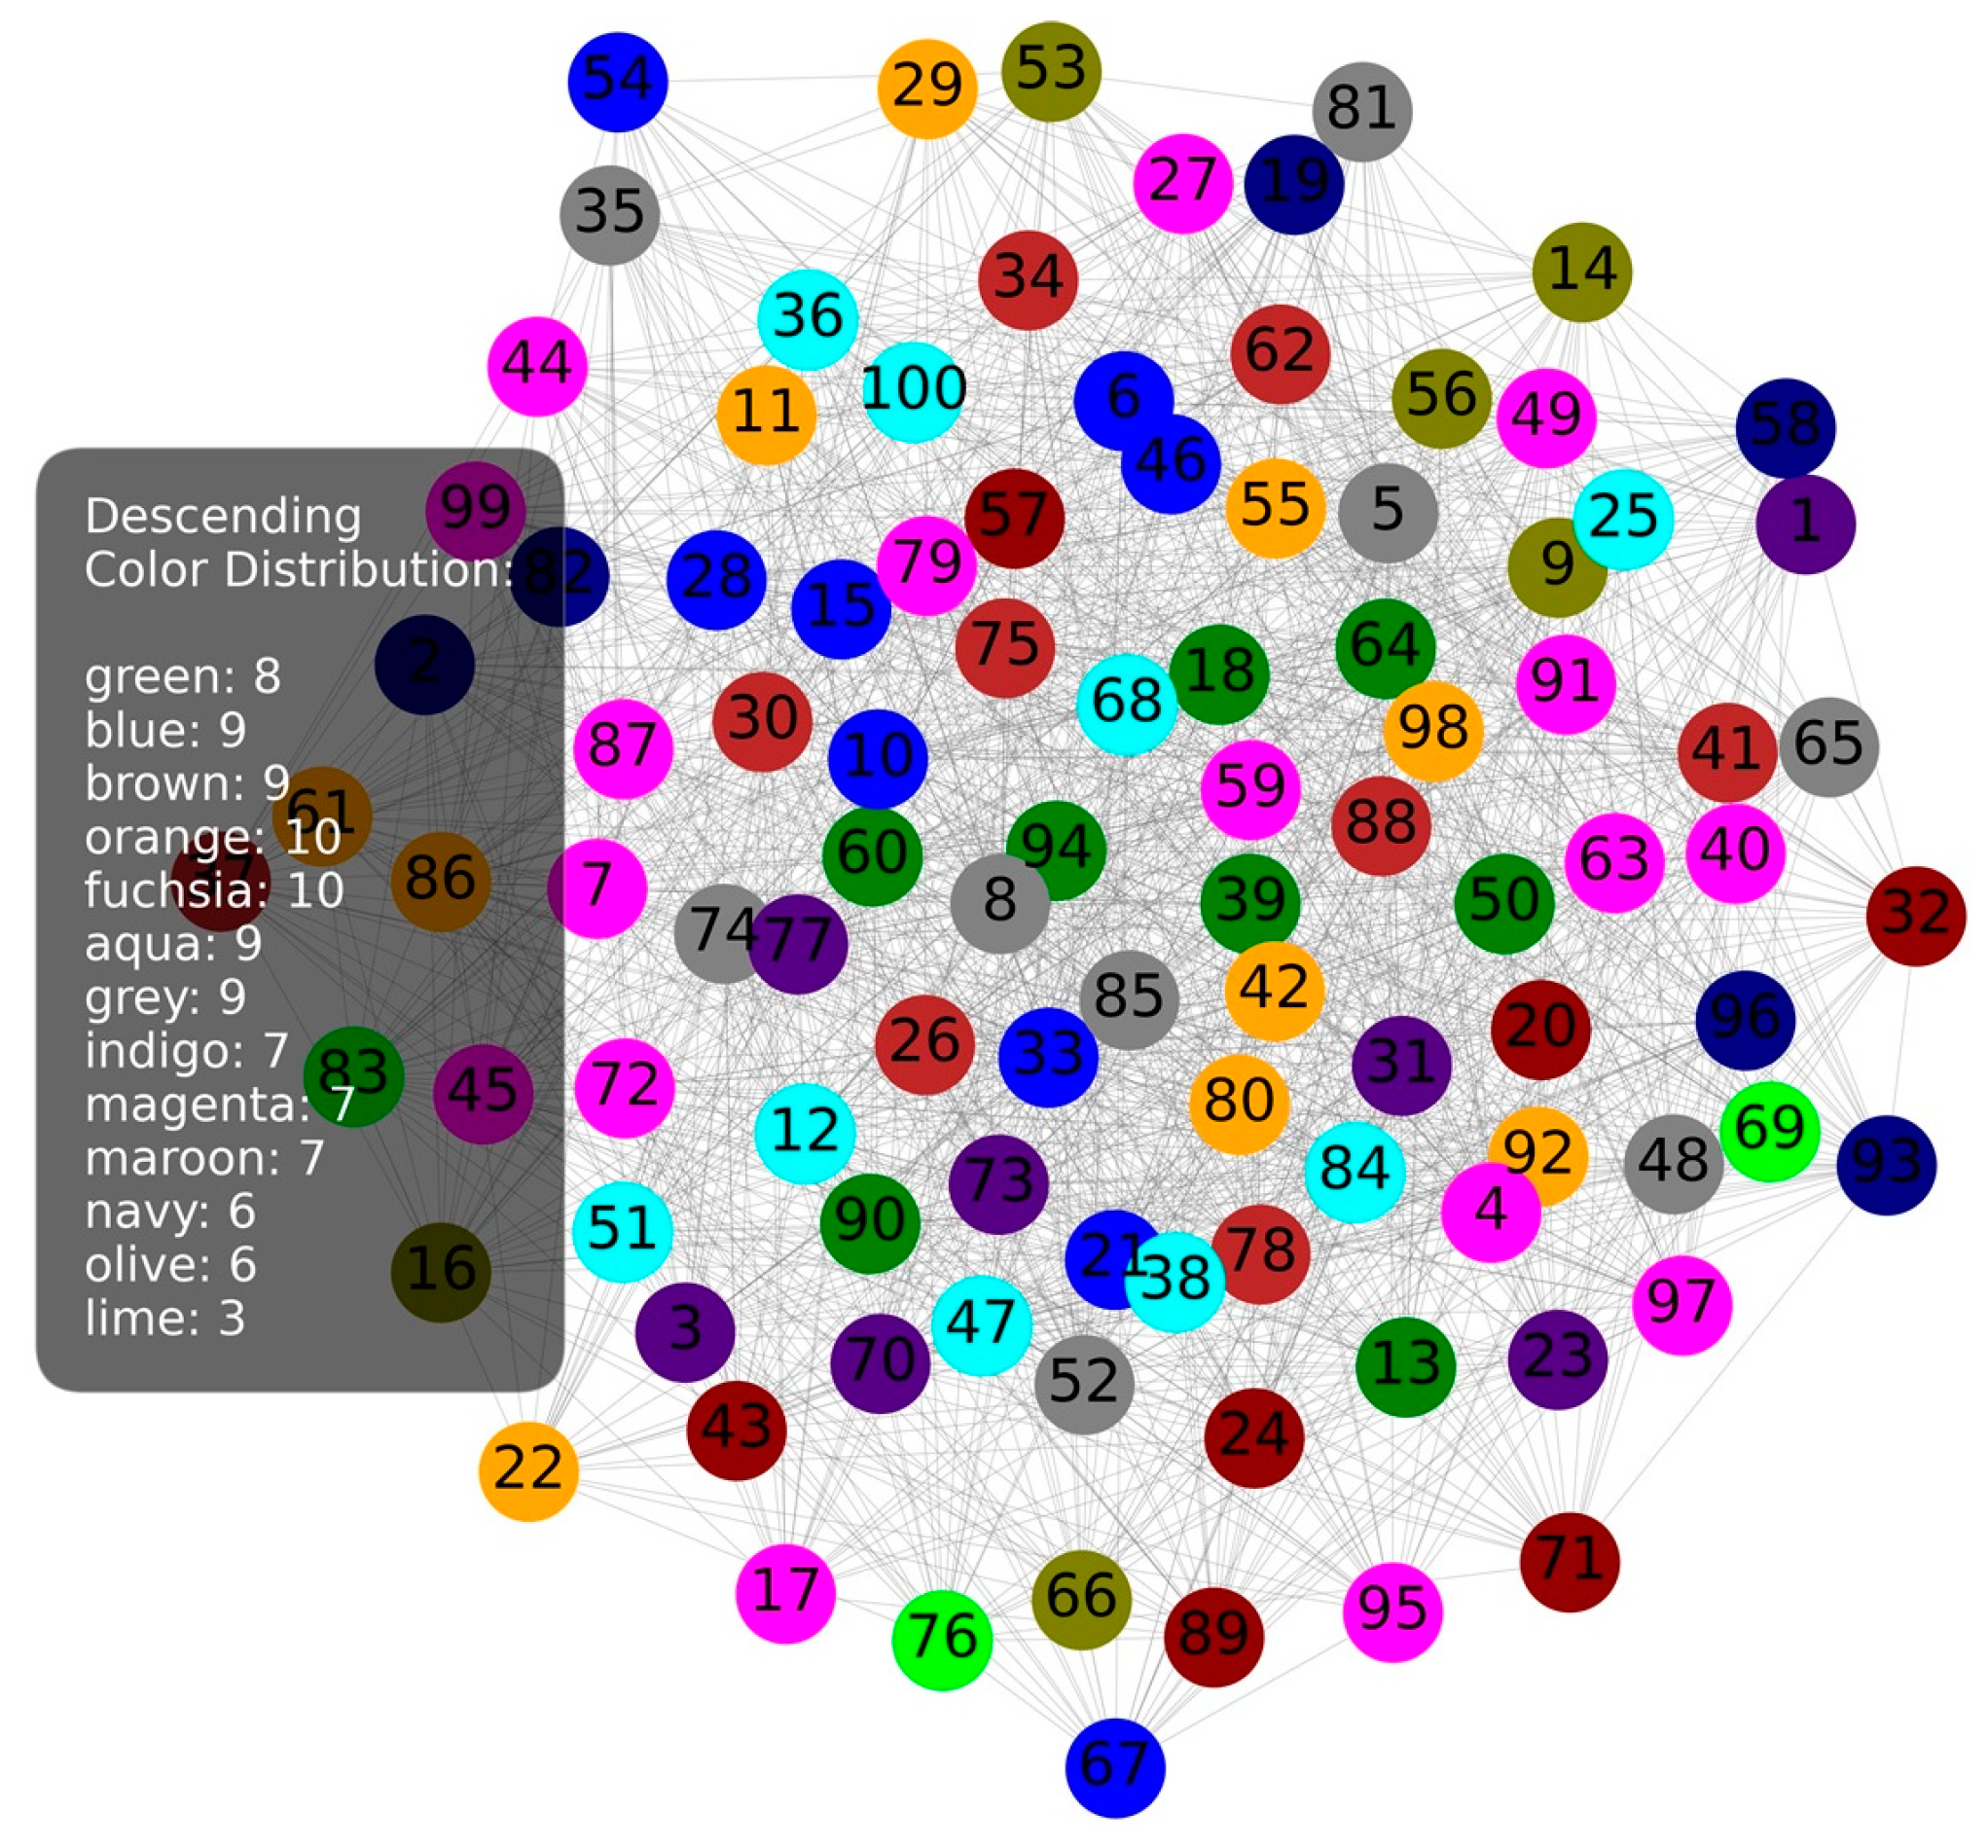
Figure 6, colored using the Descending variant, shows more colors in the very center of the network. Since this approach colors the nodes with the most neighbors first, it is evident that the nodes in the middle have more neighbors, that is, that the central nodes are more densely connected.
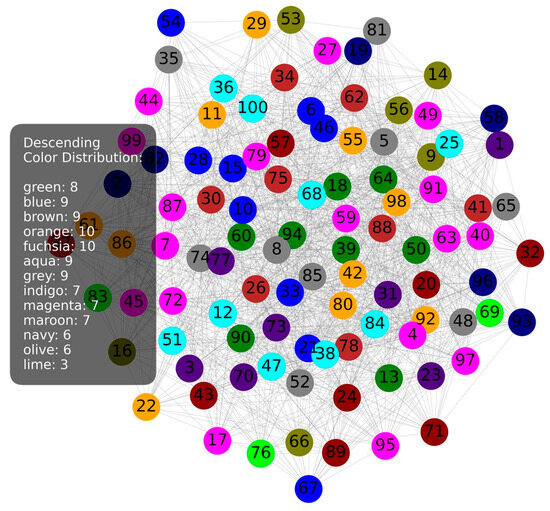
Figure 6.
Descending 100 nodes 1500 links.
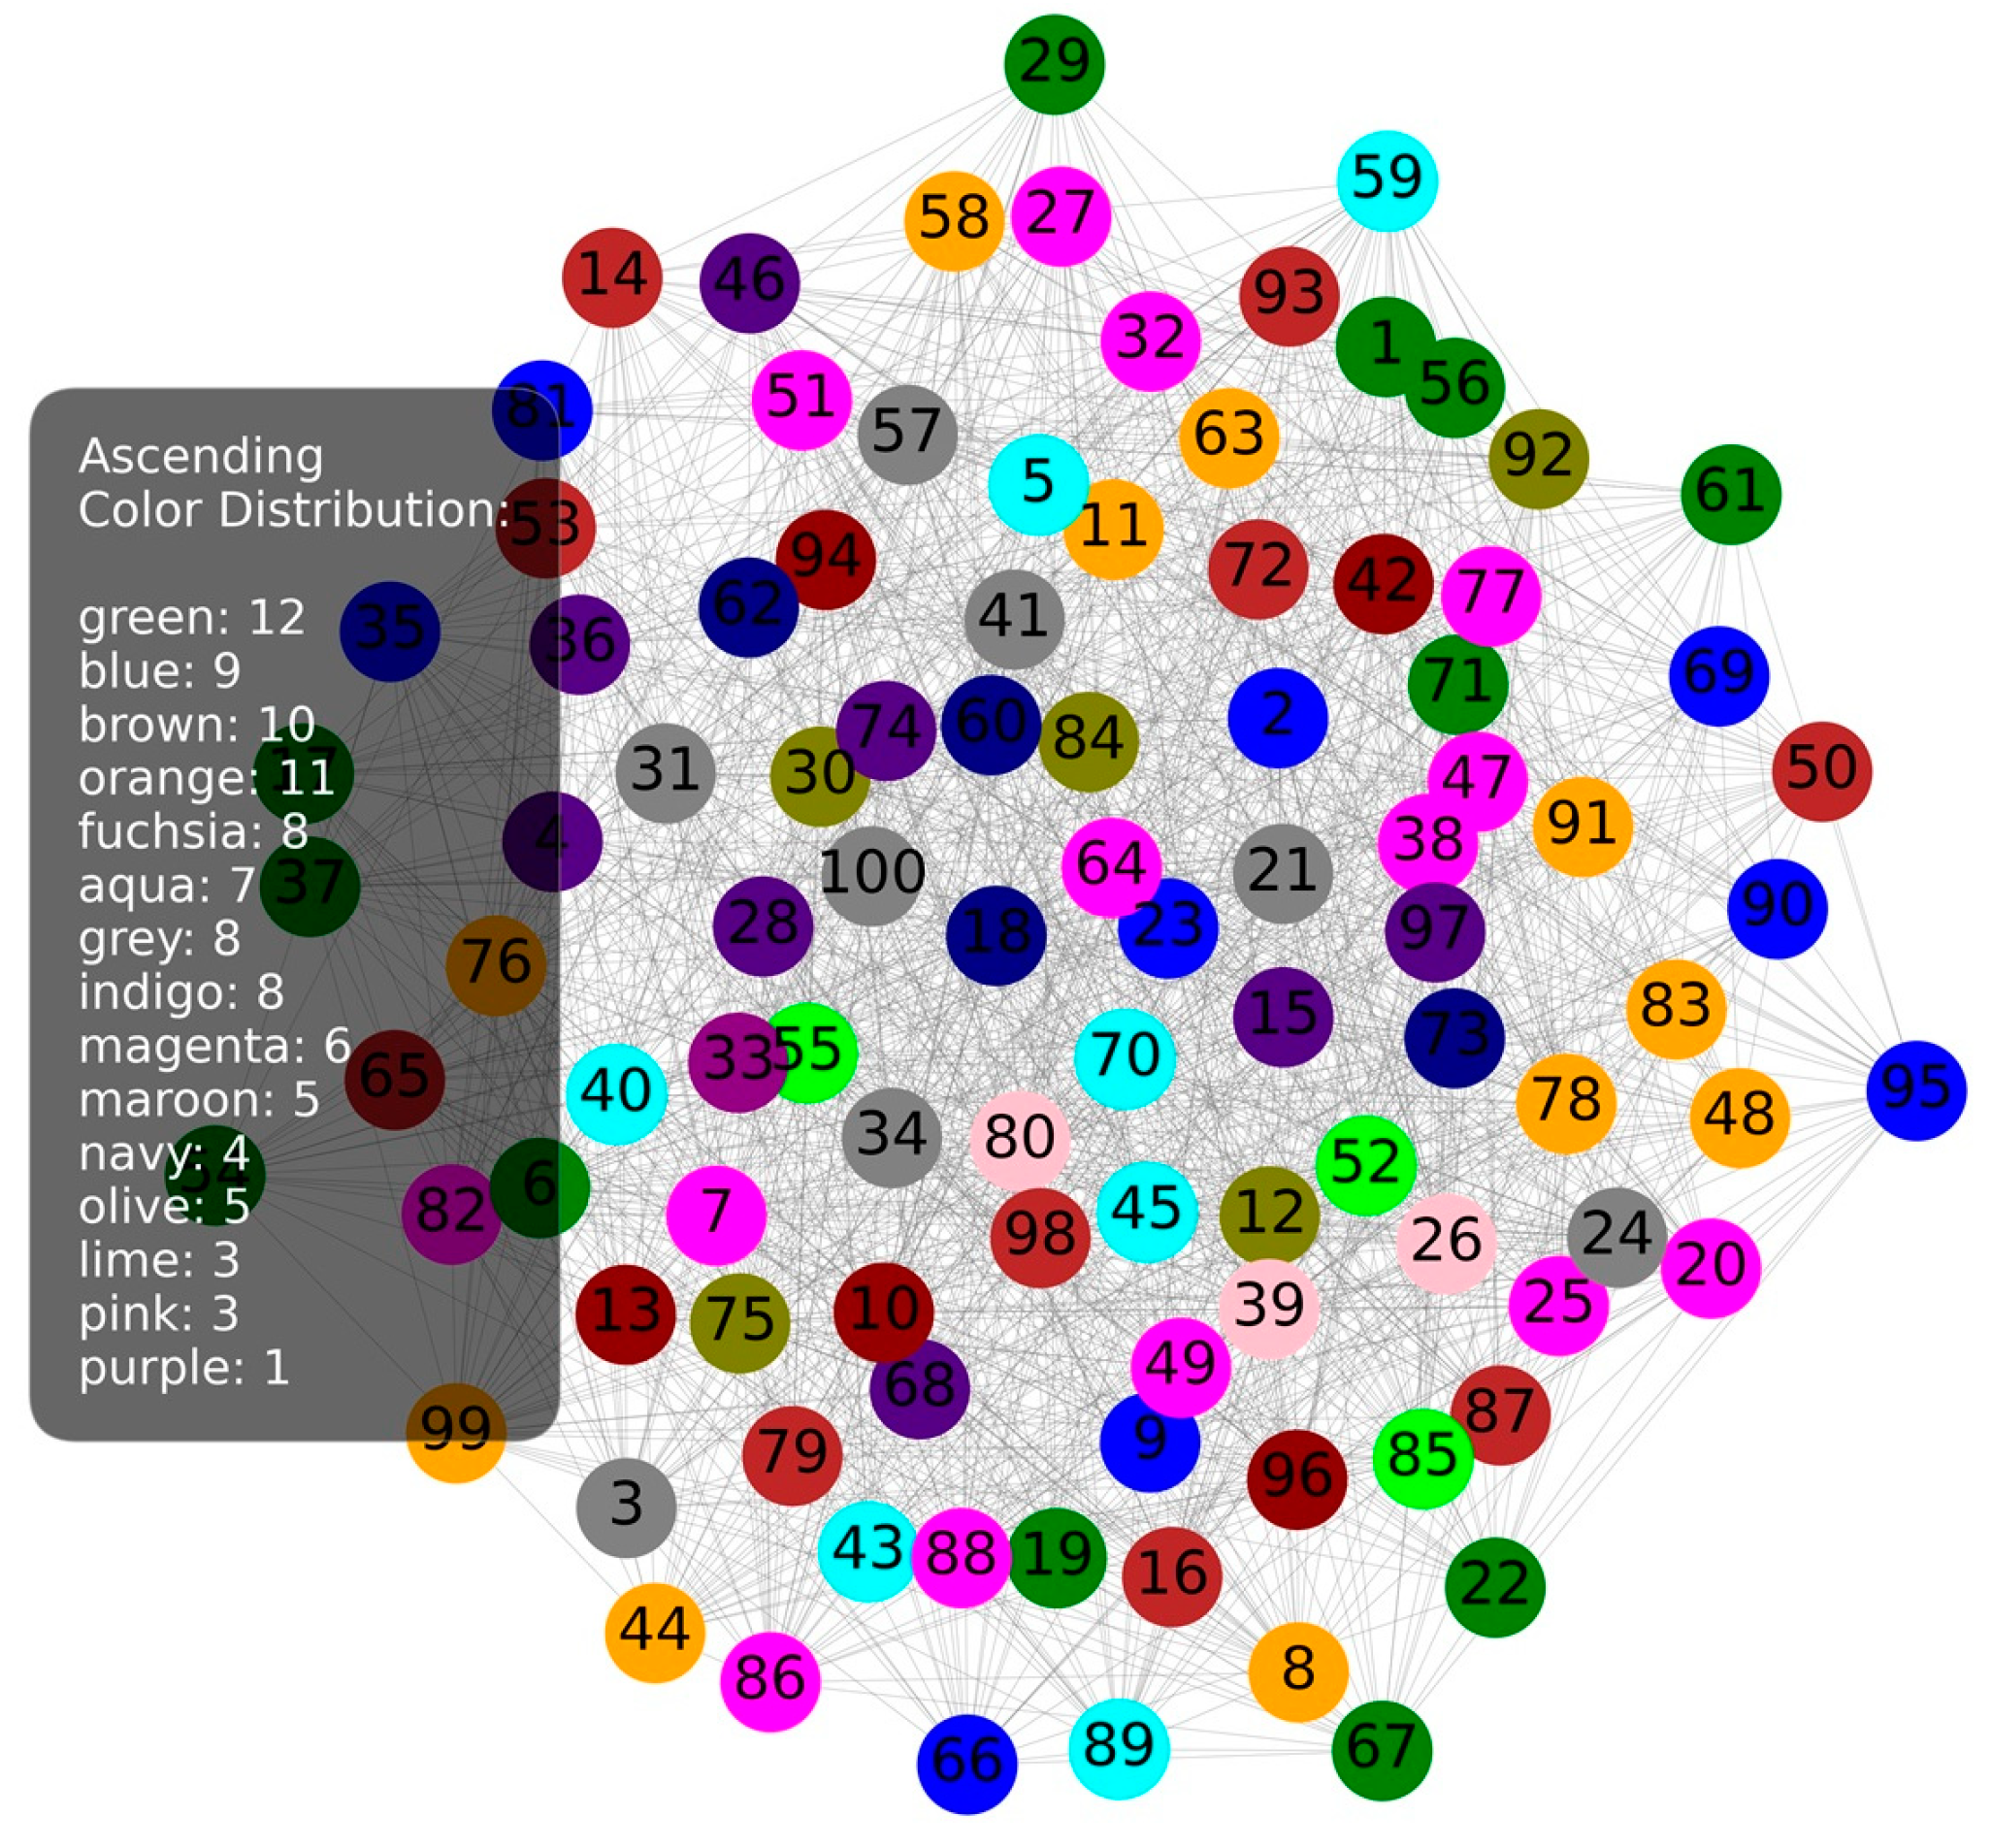
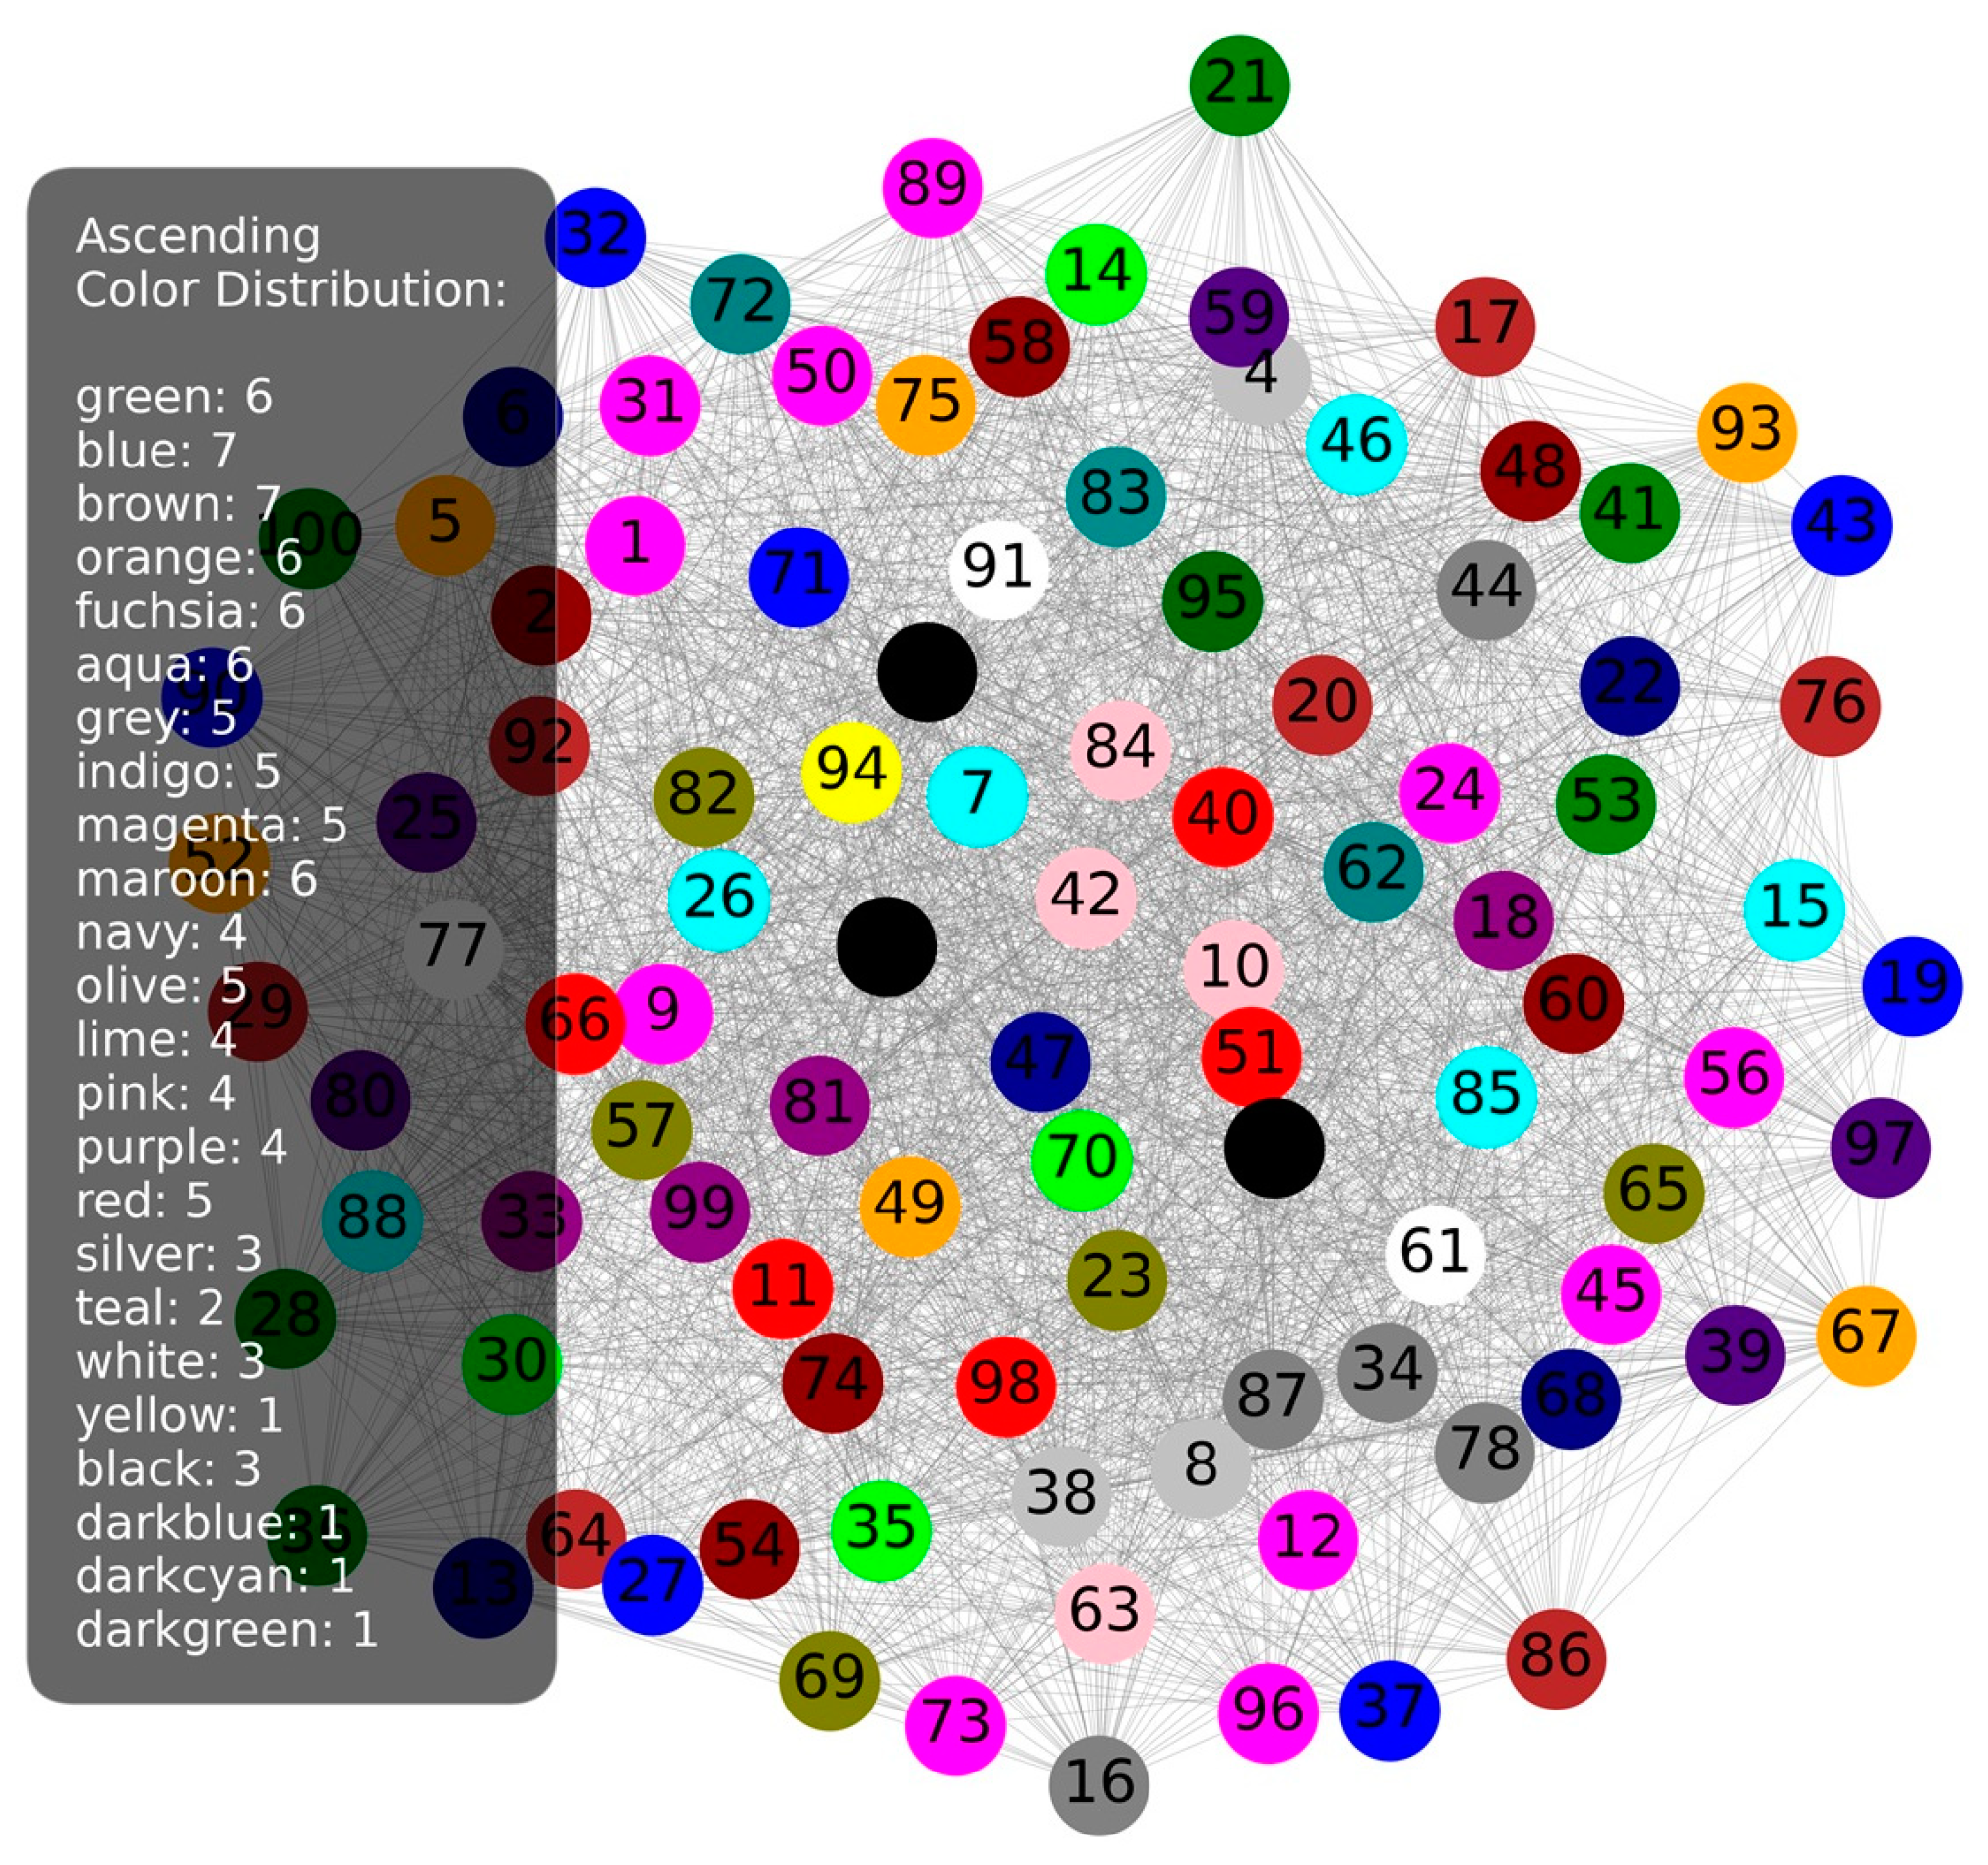
Figure 7 shows a larger number of different colors on the edge parts which can lead to a less uniform distribution in densely connected parts. In this example, the ascending variant of coloring was used.
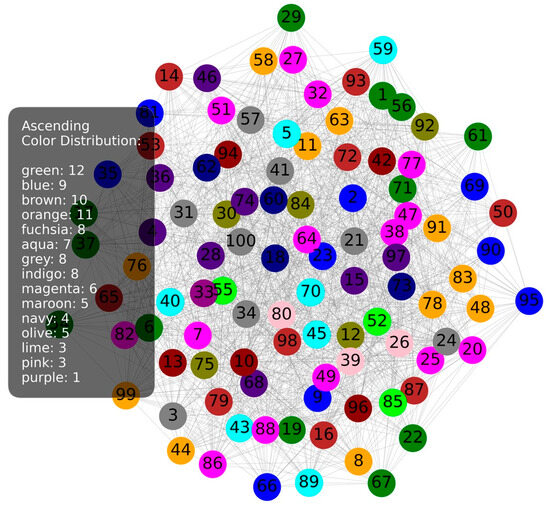
Figure 7.
Ascending 100 nodes 1500 links.
These examples most clearly demonstrate the possibility of improving the network by pulling more links from peripheral nodes towards the center of the network.
6.2.2. 2000 Links
As the number of links increases, the DSATUR approach in Figure 8 shows a more uniform distribution of colors throughout the network. This approach manages to keep the colors more evenly distributed in the central and peripheral parts of the network, indicating stability and resilience in the network.
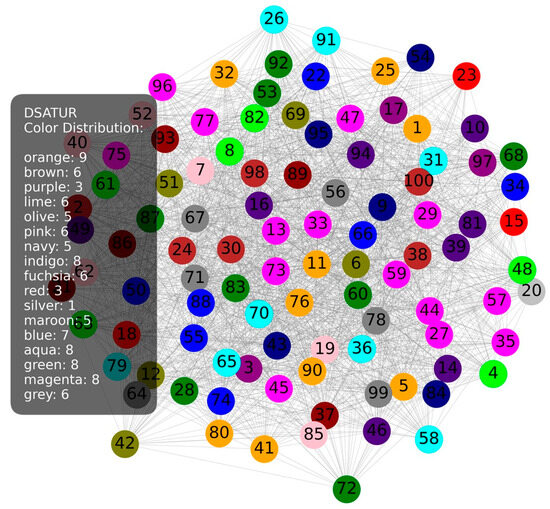
Figure 8.
DSATUR 100 nodes 2000 links.
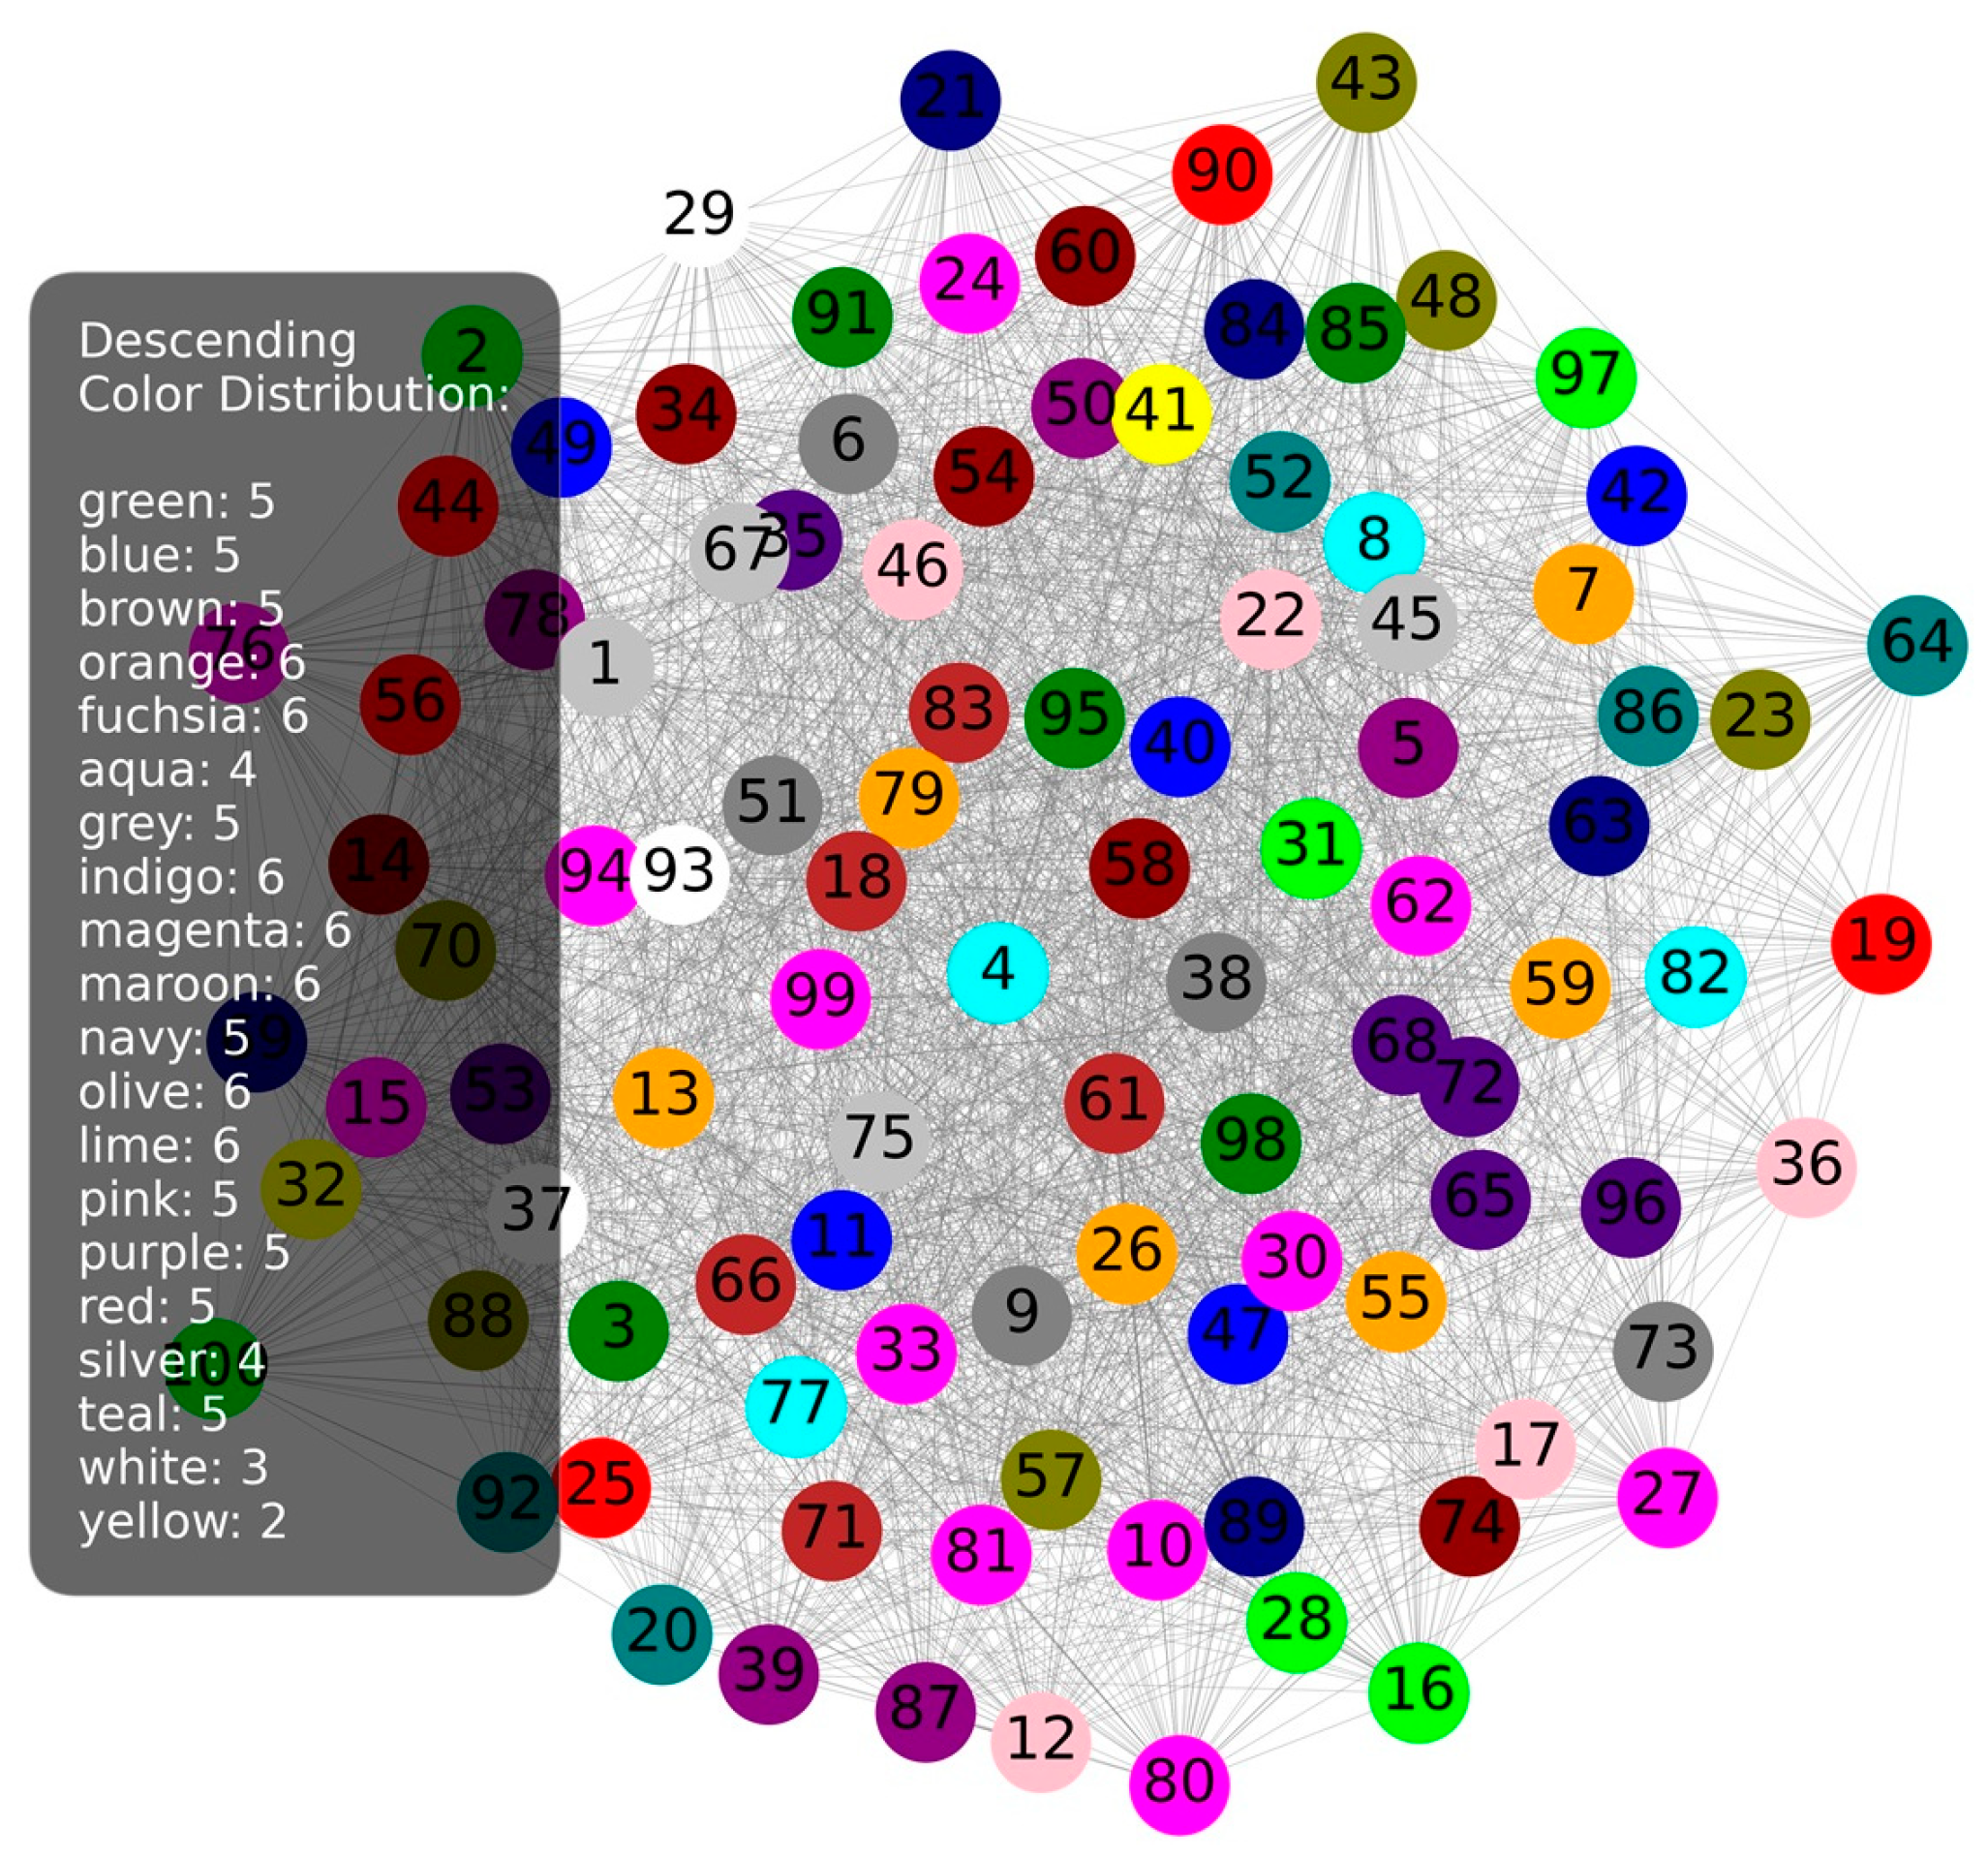
The descending variant in Figure 9 shows greater color uniformity compared to the previous case. This approach now uses fewer colors in the central part of the network, which would mean that the network is more uniformly loaded.
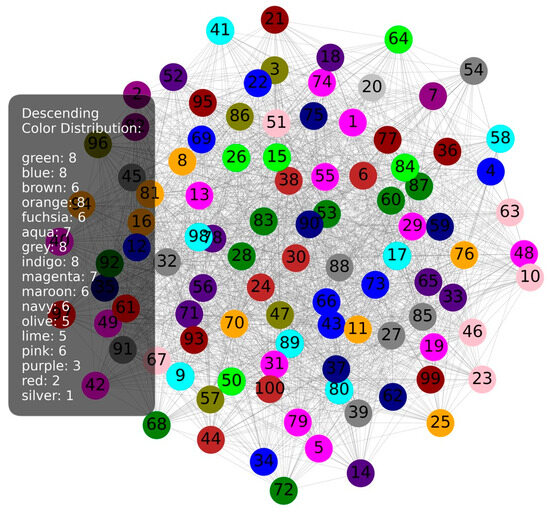
Figure 9.
Descending 100 nodes 2000 links.
In Figure 10, the larger deviations in the use of colors at the edges of the network shown by the ascending variant are still visible. A greater variety of color usage on the peripheral parts indicates a weaker distribution towards those parts of the network.

Figure 10.
Ascending 100 nodes 2000 links.
When using 2000 links, slight improvements are visible in the form of less saturation of the central part of the network. The central part of the network is more evenly connected, which means that very few nodes stand out with a higher number of links than others. The peripheral part of the network still shows weaker connectivity.
6.2.3. 2500 Links
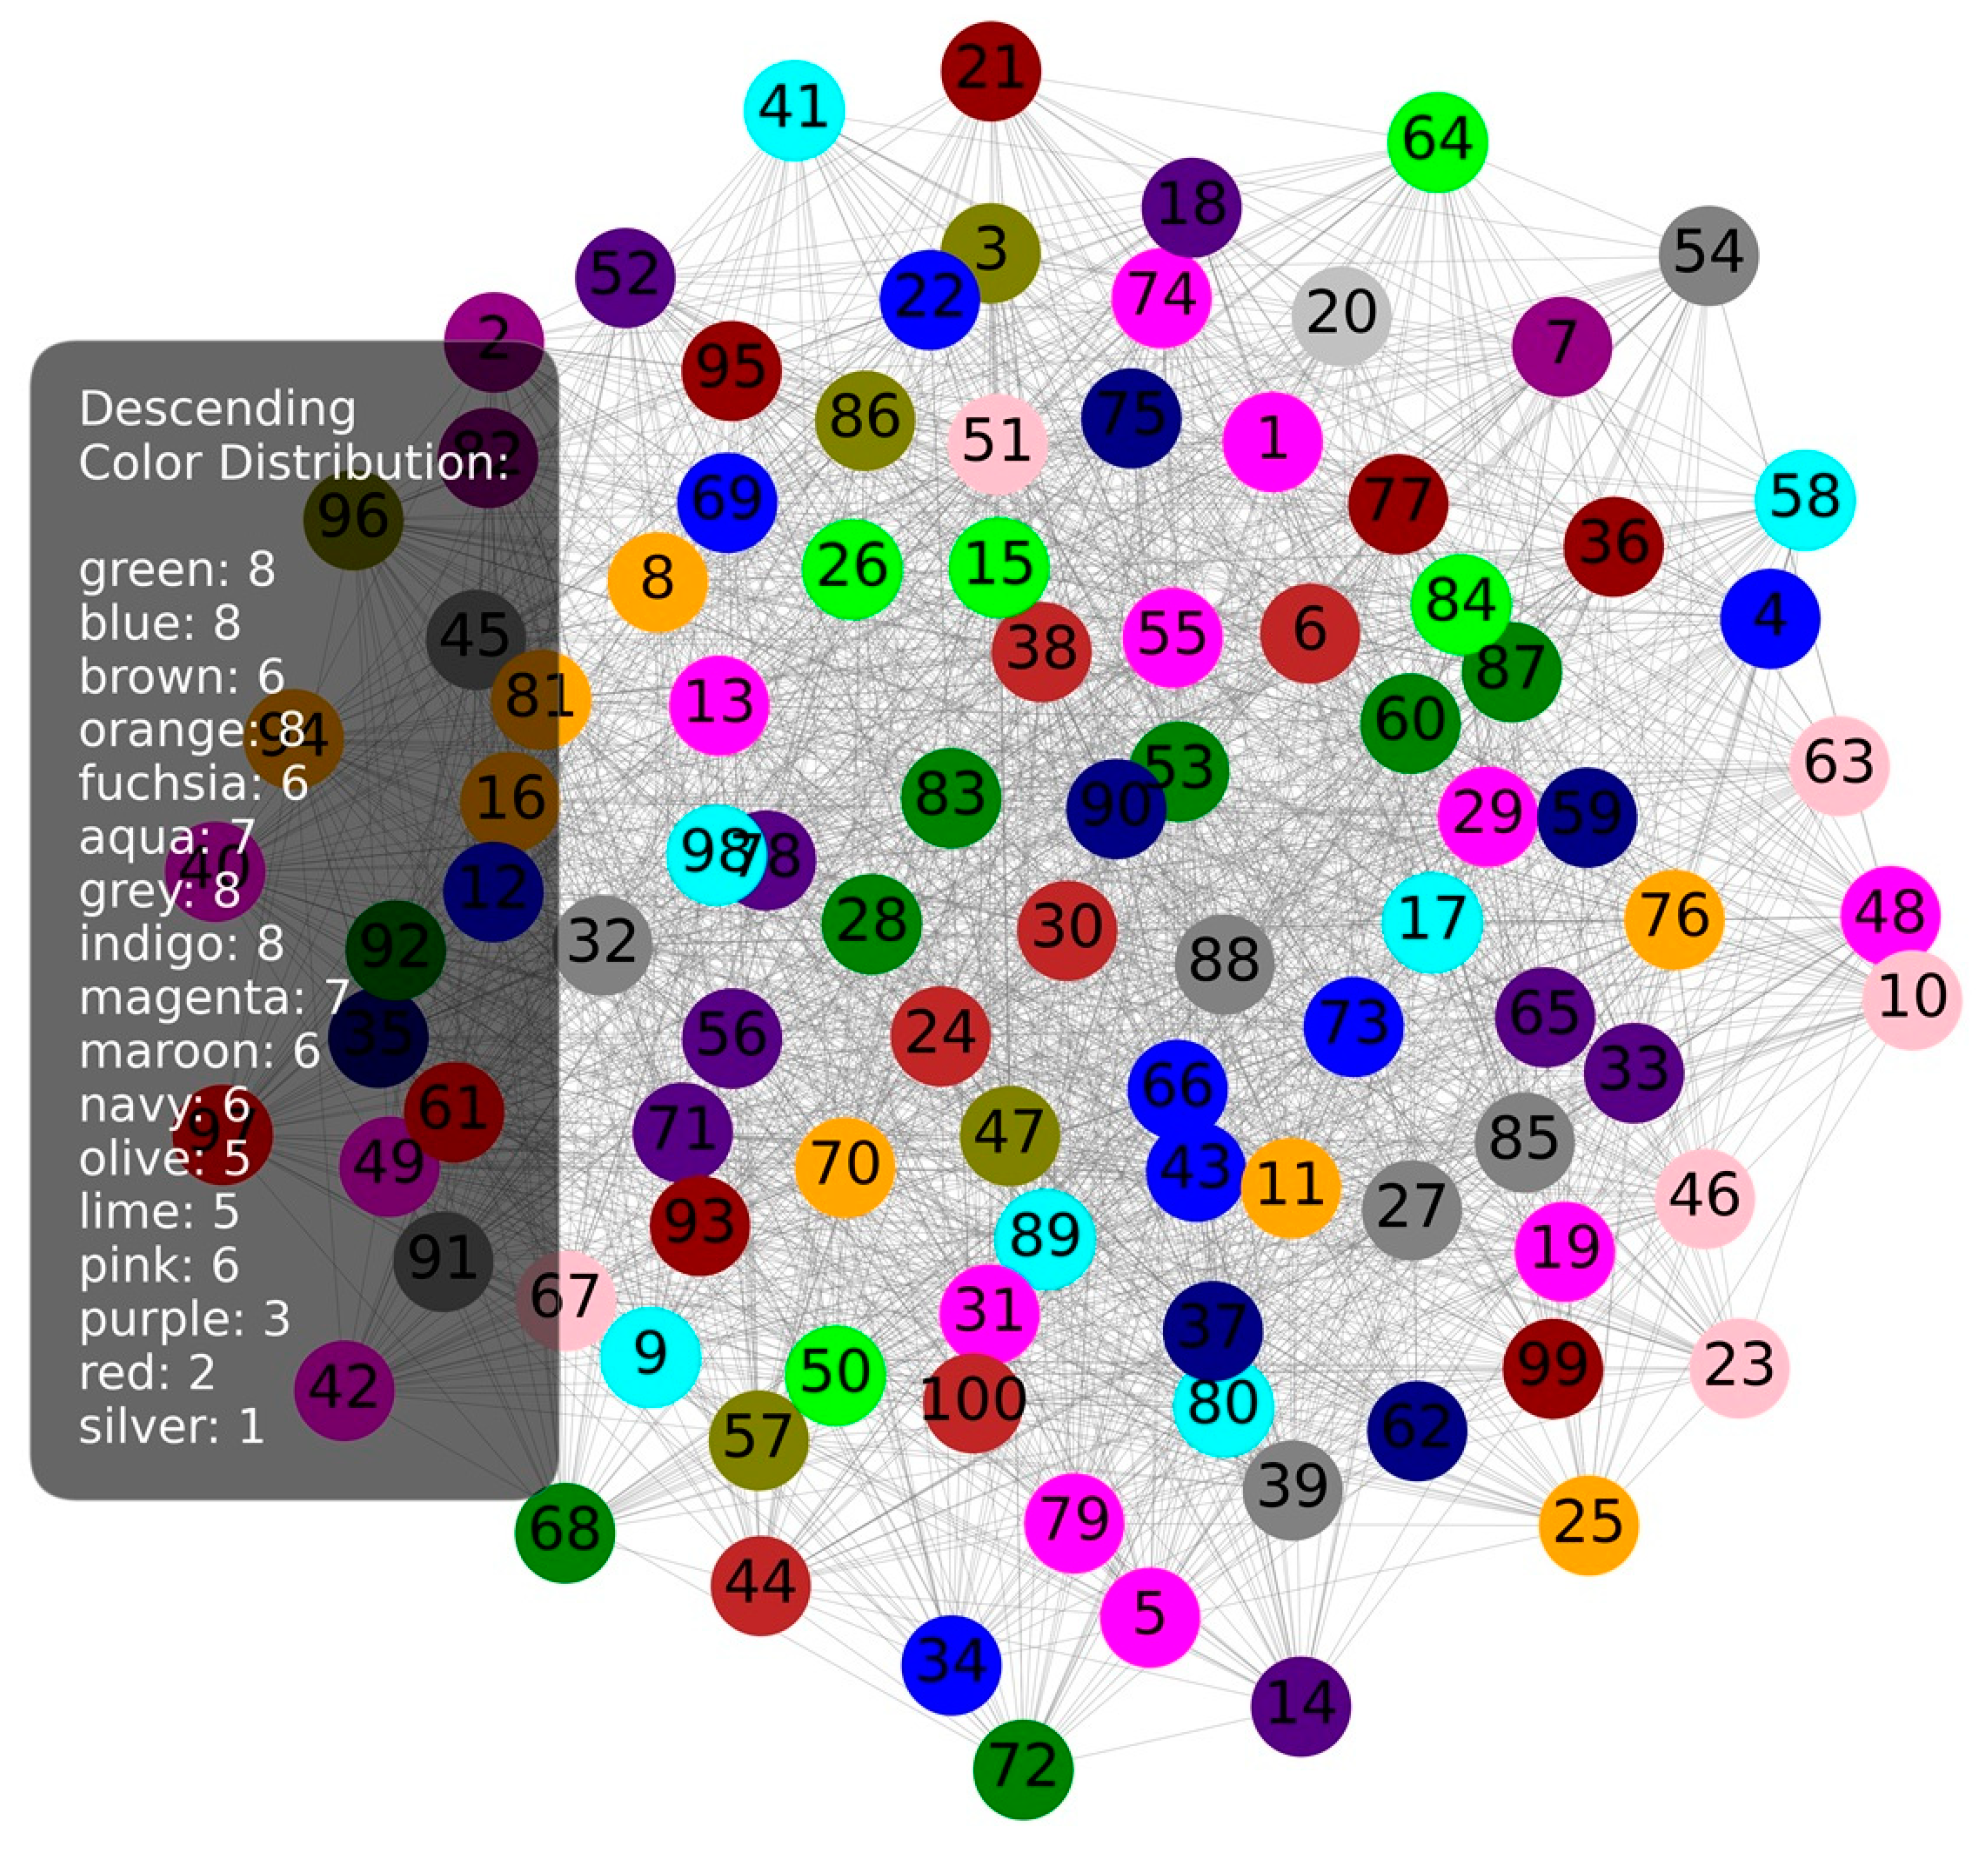
Increasing the number of links further improves the uniformity of coloring with the DSATUR algorithm. In Figure 11, the color is distributed even more evenly throughout the network, with balanced color usage in all parts. This case shows the highest stability.
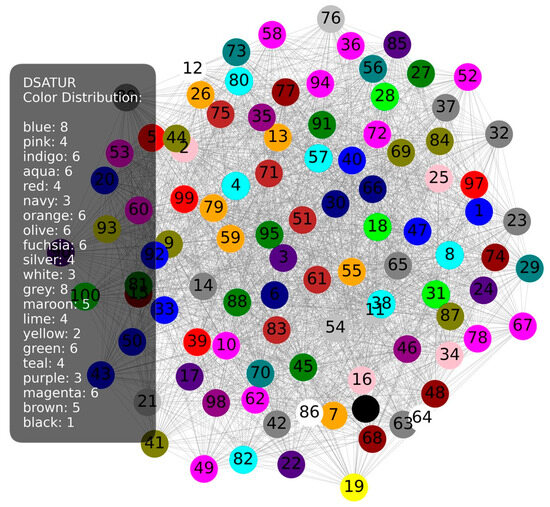
Figure 11.
DSATUR 100 nodes 2500 links.
In the configuration shown in Figure 12, the Descending variant, even fewer colors are used in the central nodes. The color distribution is relatively uniform, with less clustering of specific colors in individual zones. This case shows the lowest level of saturation.

Figure 12.
Descending 100 nodes 2500 links.
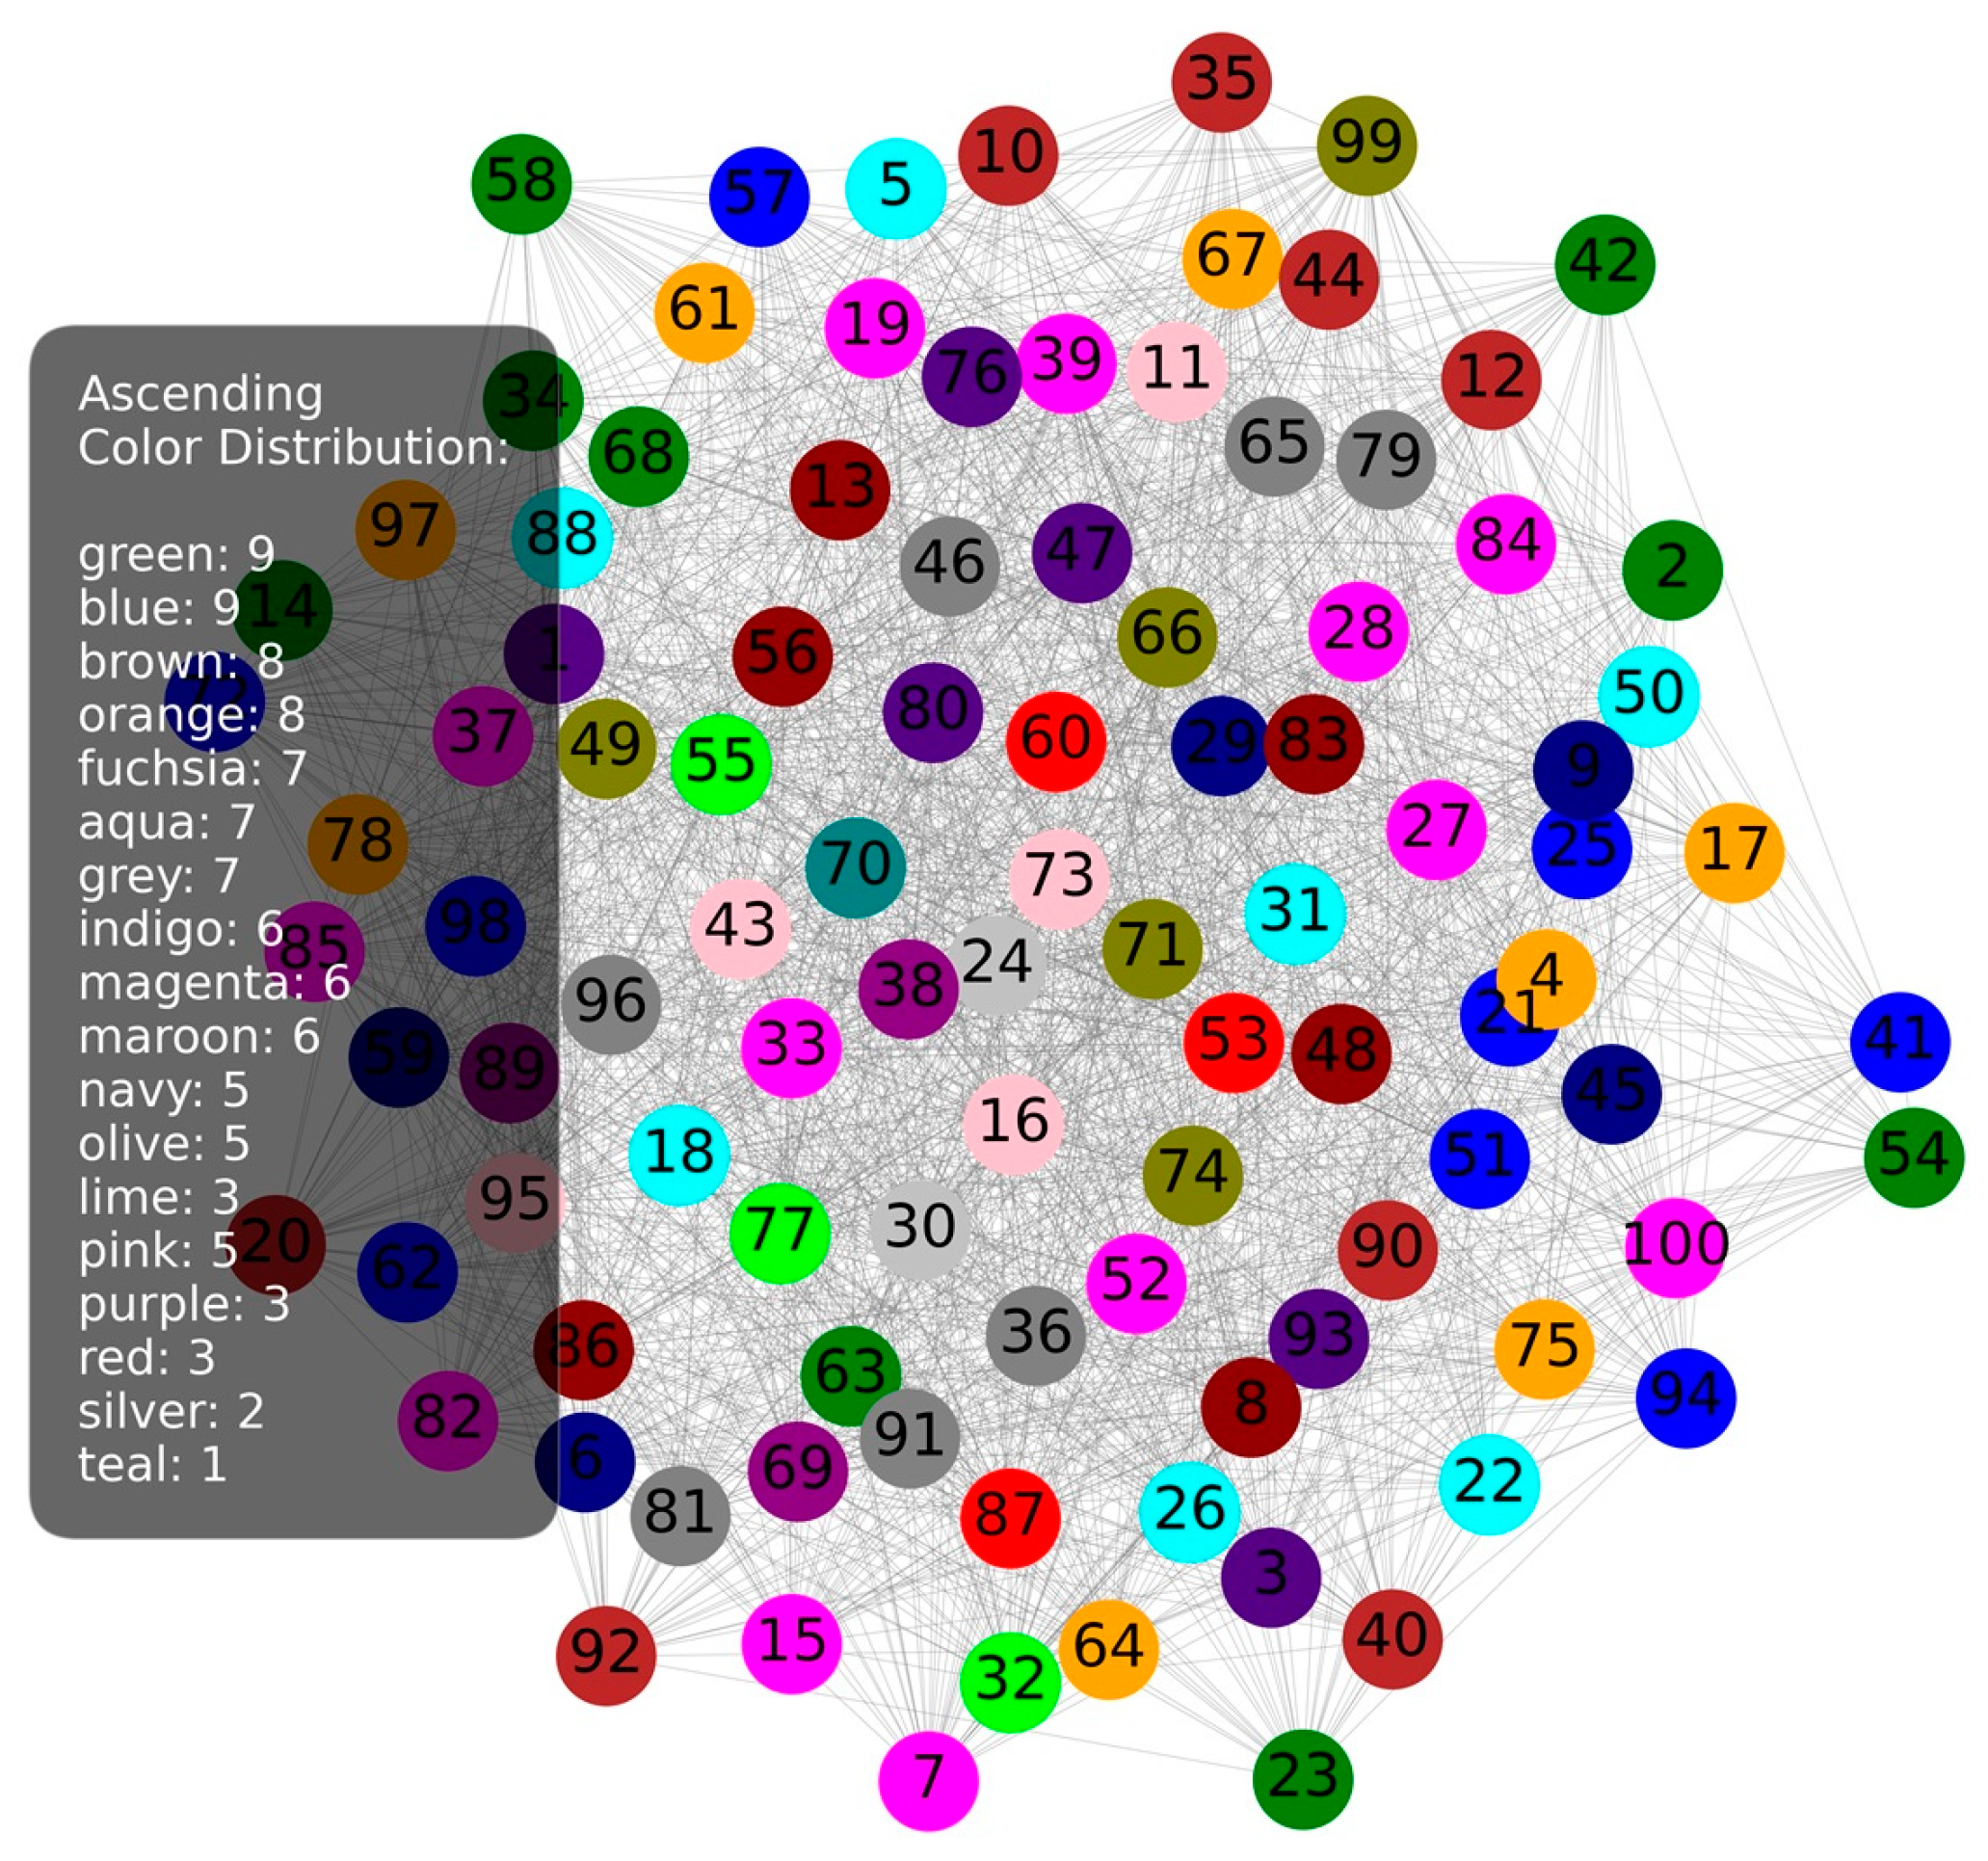
The ascending variant in the case of Figure 13 also shows better uniformity in the color distribution compared to the smaller number of links. The colors are present in a larger number of edge parts, but now with reduced contrast between the central and edge parts of the network.

Figure 13.
Ascending 100 nodes 2500 links.
6.3. Analysis of Results
Based on the analysis of each coloring approach for different numbers of links, several conclusions are drawn about the effects of using a larger number of links in the network and the optimal variants of the coloring algorithms. Using 2500 links results in the most balanced color distribution, especially when the DSATUR algorithm is applied. This approach achieves network stability and uniform color saturation among nodes, which indicates optimal connectivity without overloading individual nodes. In the DSATUR algorithm, all nodes have an equal number of neighbors with different colors, which reduces the risk of congestion and ensures stability.
A number of 2000 links can already provide enough connectivity for a 100-node network and be very close to optimal in many cases, especially when the goal is to balance resilience and efficiency. With 2000 links, the network should achieve high resilience and relatively good coloring uniformity, especially for algorithms like DSATUR and Descending.
From a coloring perspective, increasing to 2500 links does not provide a significant improvement over 2000 links. An additional 500 links may improve color uniformity somewhat, but this is usually a minimal improvement. Moreover, a larger number of links may increase redundancy and additional resource burden without a significant positive effect on coloring stability.
Thus, the number of 2000 links can be considered an optimal compromise, providing high resistance and efficiency, while 2500 links can be an option for networks that require an additional safety net, but with minimal improvement in terms of coloring. This conclusion will be taken into account when creating the actual network.
Although the focus of this study is on private blockchain networks, the proposed methodology can be applied to other types of networks with similar topological characteristics. Examples include transport networks [28], where resource allocation and route optimization are critical, or power distribution networks [29], where balanced load distribution and fault tolerance are essential. This flexibility highlights the broader applicability of the presented approach.
7. Conclusions
This paper investigates the impact of graph density on the efficiency of greedy vertex coloring algorithms in solving the NP-hard graph coloring problem, with a special emphasis on applications in distributed peer-to-peer networks such as private blockchain systems. The results show that increasing the number of edges in the network can significantly improve the uniformity of color distribution, with the DSATUR algorithm emerging as the most efficient for achieving stability and uniform color saturation.
The research found that increasing the number of edges from 1500 to 2000 led to significant improvements in the stability and uniformity of coloring, making the network more resilient and less prone to overload. However, increasing to 2500 edges did not result in proportional improvements, indicating that 2000 edges may be the optimal balance point between connectivity and efficiency. This number of edges ensures network stability and sufficient resilience without excessive redundancy.
These conclusions have practical value as they provide insights into achieving stable and efficient resource allocation in private blockchain networks. Future empirical tests on a real private blockchain network are planned to further explore and validate the applicability of these recommendations in practical scenarios.
8. Future Work
In this paper, the foundations for the creation of a real private blockchain network were laid, whereby the simulation results were used to define the optimal configurations. In the future, a private blockchain network based on these conclusions will be implemented. After the network is built, tests will be conducted under real conditions to evaluate performance, including fault tolerance, latency, and throughput.
Author Contributions
Conceptualization, T.R. and M.Š.; methodology, T.R. and M.Š.; software D.I. and M.Š.; validation, T.R. and I.L.; formal analysis, M.Š.; investigation, M.Š.; resources, D.I. and M.Š.; writing—original draft preparation, M.Š.; writing—review and editing, I.L., T.R. and D.I.; supervision and funding acquisition, I.L. All authors have read and agreed to the published version of the manuscript.
Funding
This research was funded and is a part of research for the activities to be carried out for the project “Researching advanced algorithms and innovative business intelligence solutions in the cloud—NPOO.C3.2.R3-I1.04.0128”.
Institutional Review Board Statement
Not applicable.
Informed Consent Statement
Not applicable.
Data Availability Statement
The original data presented in the study are openly available in FigShare at https://figshare.com/s/446f3f4d5933e37dae4b (accessed on 6 November 2024).
Conflicts of Interest
The authors declare no conflicts of interest.
References
- Kapron, B.M. Logic, Automata, and Computational Complexity: The Works of Stephen A. Cook; Morgan & Claypool: San Rafael, CA, USA, 2023; ISBN 9798400707803. [Google Scholar]
- Erickson, J. Algorithms; University of Illinois, Urbana-Champaign: Champaign, IL, USA, 2019. [Google Scholar]
- Borowiecki, P. Computational Aspects of Greedy Partitioning of Graphs. J. Comb. Optim. 2018, 35, 641–665. [Google Scholar] [CrossRef]
- Barenboim, L.; Elkin, M. Distributed Graph Coloring: Fundamentals and Recent Developments; Synthesis Lectures on Distributed Computing Theory; Springer International Publishing: Cham, Switzerland, 2013; ISBN 978-3-031-00881-8. [Google Scholar]
- Jayabalasamy, G.; Pujol, C.; Latha Bhaskaran, K. Application of Graph Theory for Blockchain Technologies. Mathematics 2024, 12, 1133. [Google Scholar] [CrossRef]
- Nurmalika, K.; Prihandini, R.; Jannah, D.; Makhfurdloh, I.; Agatha, A.; Wulandari, Y. Graph Coloring Application Using Welch Powell Algorithm on Radio Frequency in Australia. Available online: https://www.researchgate.net/publication/381511913_Graph_Coloring_Application_Using_Welch_Powell_Algorithm_On_Radio_Frequency_In_Australia (accessed on 26 November 2024).
- Postigo, J.; Soto-Begazo, J.; Fiorela, V.R.; Picha, G.M.; Flores-Quispe, R.; Velazco-Paredes, Y. Comparative Analysis of the Main Graph Coloring Algorithms. In Proceedings of the 2021 IEEE Colombian Conference on Communications and Computing (COLCOM), Cali, Colombia, 26–28 May 2021; pp. 1–6. [Google Scholar]
- Yang, X.; Zhang, R.; Yue, C.; Liu, Y.; Ooi, B.C.; Gao, Q.; Zhang, Y.; Yang, H. VeDB: A Software and Hardware Enabled Trusted Relational Database. Proc. ACM Manag. Data 2023, 1, 1–27. [Google Scholar] [CrossRef]
- Yang, X.; Zhang, Y.; Wang, S.; Yu, B.; Li, F.; Li, Y.; Yan, W. LedgerDB: A Centralized Ledger Database for Universal Audit and Verification. Proc. VLDB Endow. 2020, 13, 3138–3151. [Google Scholar] [CrossRef]
- Ryan, C. Computer Algorithms. In Encyclopedia of Physical Science and Technology, 3rd ed.; Academic Press: San Diego, CA, USA, 2003; pp. 507–523. [Google Scholar]
- Olariu, S.; Randall, J. Welsh-Powell Opposition Graphs. Inf. Process. Lett. 1989, 31, 43–46. [Google Scholar] [CrossRef]
- San Segundo, P. A New DSATUR-Based Algorithm for Exact Vertex Coloring. Comput. Oper. Res. 2012, 39, 1724–1733. [Google Scholar] [CrossRef]
- Wang, Y. Review on Greedy Algorithm. Theor. Nat. Sci. 2023, 14, 233–239. [Google Scholar] [CrossRef]
- Dobzinski, S.; Mor, A. On the Greedy Algorithm for Combinatorial Auctions with a Random Order. arXiv 2015, arXiv:1502.02178. [Google Scholar]
- Olariu, S. An Optimal Greedy Heuristic to Color Interval Graphs. Inf. Process. Lett. 1991, 37, 21–25. [Google Scholar] [CrossRef]
- Costa Ferreira da Silva, J.; Havet, F. On B-Greedy Colourings and z-Colourings. Discret. Appl. Math. 2024, 359, 250–268. [Google Scholar] [CrossRef]
- Aslan, M.; Baykan, N. A Performance Comparison of Graph Coloring Algorithms. Int. J. Intell. Syst. Appl. Eng. 2016, 4, 1–7. [Google Scholar] [CrossRef]
- Wadsungnoen, B.; Puphasuk, D.P. Permutation-Based Optimization Method for Solving Graph Coloring Problems. Proceedings of PMO25 Conference, Khon Kaen University, Thailand; 2019; pp. 1–12. Available online: https://api.semanticscholar.org/CorpusID:160008219 (accessed on 26 October 2024).
- Jerrum, M. Large Cliques Elude the Metropolis Process. Random Struct. Algorithms 1992, 3, 347–359. [Google Scholar] [CrossRef]
- Blockchain for Committing Peer-to-Peer Transactions Using Distributed Ledger Technologies. Available online: https://www.researchgate.net/publication/352455679_Blockchain_for_committing_peer-to-peer_transactions_using_distributed_ledger_technologies (accessed on 25 October 2024).
- Wilson, R.J. Introduction to Graph Theory; Longman: London, UK, 2010; ISBN 978-0-273-72889-4. [Google Scholar]
- Wu, T.; Ren, H.; Li, P.; Leskovec, J. Graph Information Bottleneck. In Advances in Neural Information Processing Systems; Curran Associates Inc.: New York, NY, USA, 2020; Volume 33, pp. 20437–20448. [Google Scholar]
- Meghanathan, N. (Ed.) Graph Theoretic Approaches for Analyzing Large-Scale Social Networks, 1st ed.; Information Science Reference: Hershey, PA, USA, 2017; ISBN 978-1-5225-2814-2. [Google Scholar]
- Alon, U.; Yahav, E. On the Bottleneck of Graph Neural Networks and Its Practical Implications. arXiv 2021, arXiv:2006.05205. [Google Scholar]
- Networks, Crowds, and Markets: A Book by David Easley and Jon Kleinberg. Available online: https://www.cs.cornell.edu/home/kleinber/networks-book/ (accessed on 30 October 2024).
- Graph Theory and Complex Networks: An Introduction: Van Steen, Maarten: 9789081540612: Amazon.Com: Books. Available online: https://www.amazon.com/Graph-Theory-Complex-Networks-Introduction/dp/9081540610 (accessed on 30 October 2024).
- Cohen, R.; Havlin, S. Complex Networks: Structure, Robustness and Function; Cambridge University Press: Cambridge, UK, 2010; ISBN 978-0-521-84156-6. [Google Scholar]
- Rindone, C.; Russo, A. A Network Analysis for HSR Services in the South of Italy. In Proceedings of the Computational Science and Its Applications—ICCSA 2024 Workshops, Hanoi, Vietnam, 1–4 July 2024; Gervasi, O., Murgante, B., Garau, C., Taniar, D., Rocha, A.M.A.C., Faginas Lago, M.N., Eds.; Springer Nature Switzerland: Cham, Switzerland, 2024; pp. 217–232. [Google Scholar]
- Beecroft, D.; Restrepo, J.G.; Angulo-Garcia, D. Greedy Optimization for Growing Stable Power Grids. arXiv 2021. arXiv-2109. [Google Scholar]


Disclaimer/Publisher’s Note: The statements, opinions and data contained in all publications are solely those of the individual author(s) and contributor(s) and not of MDPI and/or the editor(s). MDPI and/or the editor(s) disclaim responsibility for any injury to people or property resulting from any ideas, methods, instructions or products referred to in the content. |
© 2025 by the authors. Licensee MDPI, Basel, Switzerland. This article is an open access article distributed under the terms and conditions of the Creative Commons Attribution (CC BY) license (https://creativecommons.org/licenses/by/4.0/).