


Abstract
Between 28 February and 31 March 2026, the closure of the Strait of Hormuz raised Brent crude from approximately $72 to $118 per barrel and the European and Asian gas benchmarks by roughly 70 percent. We examine a consequence that the energy-shock and public-debt literatures have rarely studied together: partially unanticipated, supply-driven inflation erodes the real value of nominal sovereign liabilities. Using data through 15 August 2026, we decompose the 1.73 percentage-point acceleration in United States headline CPI between February and its May peak: energy contributed 1.44 points (83 percent) and core effects 0.28 points, most of which had reversed by July. We then replace single-figure erosion arithmetic with a maturity-structured accounting model of the Treasury debt stock: under the realized inflation path, first-year erosion is $241 billion—$204 billion excluding Federal Reserve holdings—roughly 40 percent below the $400 billion upper bound computed on gross debt. Finally, we specify falsifiable criteria under which the observed tolerance of above-target inflation would constitute the initial phase of a financial-repression regime; at the cutoff, at most one of six criteria is partially met, and market-implied expectations remain anchored at approximately 2.3 percent. The erosion channel is real but, on present evidence, transitory.
Keywords:
liquefied natural gas; Strait of Hormuz; supply shocks; inflation; public debt; financial repression; fiscal dominance JEL Classification:
E31; E63; H63; Q41; Q43
1. Introduction
From 2022 to 2025, the world economy appeared to have absorbed its second energy crisis of the decade. Europe had replaced Russian pipeline gas with seaborne LNG, the United States had become the world’s largest LNG exporter (EIA, 2026c), and headline inflation in the OECD area was converging toward target (OECD, 2026). On 28 February 2026, the United States and Israel launched an air campaign against Iran; Iran responded by declaring the Strait of Hormuz closed to tanker traffic (EIA, 2026a). Within five weeks, Brent crude had risen more than 60 percent, European gas prices had risen 73 percent, and Qatar—supplier of roughly one fifth of globally traded LNG—had declared force majeure on a substantial share of its exports (QatarEnergy, 2026; EIA, 2026a).
The distinguishing feature of the 2026 shock was gas rather than oil. Oil benefits from strategic reserves, a deep tanker market and substitute routes; LNG has none of these in comparable measure. The missile strikes of 18–19 March on the Ras Laffan complex damaged two liquefaction trains totaling 12.8 million tonnes per annum—approximately 17 percent of Qatar’s export capacity—with repairs officially estimated at up to five years owing to gas-turbine procurement lead times of two to four years (QatarEnergy, 2026).
A second, less visible consequence is the subject of this article. Three days before the first airstrikes, the Institute of International Finance reported global debt of $348 trillion at end-2025, an increase of $29 trillion in a single year, with general government debt near 121 percent of GDP in the United States, roughly 89 percent in the euro area, and above 200 percent in Japan (IIF, 2026; IMF, 2026). For a sovereign with a large stock of long-term, fixed-rate, own-currency debt, inflation in excess of the expectations embedded in bond prices at issuance reduces the real value of its liabilities—a mechanism documented for the 1945–1980 period by Reinhart and Sbrancia (2015) and quantified for the postwar United States by Aizenman and Marion (2011).
Contribution. This paper connects the energy-shock literature and the debt-liquidation literature through a single event, and does so with three elements that, to our knowledge, have not been combined for the 2026 episode: (i) a channel-level accounting decomposition of the shock’s contribution to headline inflation, using realized subindex data through a stated cutoff; (ii) a maturity-structured model of inflation-induced debt erosion calibrated to the official composition of United States marketable debt, which quantifies how much the widely cited single-figure arithmetic overstates the effect; and (iii) an operational set of criteria and a testing protocol that make the financial-repression hypothesis falsifiable rather than rhetorical. The closest antecedents are Hilscher et al. (2022) on the maturity structure of debt erosion, and the pre-2026 scenario literature on Hormuz disruptions (CRS, 2019); we differ in applying both to a realized episode and in reporting an explicit ex-post reconciliation of scenario assumptions against outcomes.
Nature of the exercise and data cutoff. The episode was still unfolding at the time of writing: the strait remained partially closed in mid-August 2026, and prices firmed again after attacks on shipping on 10–12 August (Al Jazeera, 2026c, 2026d). We therefore present the analysis explicitly as scenario analysis with ex-post validation, not as forecasting: all realized data run through 15 August 2026, all scenario assumptions are labeled as such, and Section 6.3 reports side by side what the original scenario assumed and what has occurred.
The objective of this paper is to quantify the erosion of the real value of nominal sovereign debt produced by the inflationary episode that followed the 2026 Hormuz LNG disruption and to assess whether the observed configuration of fiscal and monetary policy meets the operational criteria of a financial repression regime. Three questions organize the analysis. First, how much of the 2026 inflation acceleration is attributable to the energy shock and how much to second-round effects? Second, how large is the resulting transfer from bondholders to the sovereign once the maturity structure, the indexed share and the repricing profile of the debt are taken into account? Third, do the policy responses observed through the data cutoff satisfy the criteria that the literature associates with financial repression, or are they consistent with a standard monetary response to a supply shock? The paper answers the first two questions with quantitative decompositions and the third with an explicit, falsifiable assessment framework.
Section 2 reviews the two literatures; Section 3 sets out the data and methods; Section 4 reconstructs the shock and quantifies its transmission; Section 5 examines the monetary-policy response; Section 6 presents the erosion model; Section 7 assesses the repression hypothesis against operational criteria; Section 8 specifies a testing protocol; Section 9 discusses distributional and policy implications; and Section 10 concludes with limitations.
2. Two Literatures That Rarely Meet
2.1. Energy Supply Shocks and Inflation
The macroeconomic implications of energy shocks have a long history that goes back to Hamilton (1983) and Kilian (2009). Kilian explained that fluctuations in oil prices are not all alike; a disruption of supply has different effects from a change in demand. The 2026 event is one of the most significant pure supply shocks since the 1973 and 1979 episodes (Blinder & Rudd, 2013). On the geopolitical dimension, Caldara and Iacoviello (2022) provide a standard index, while Olanipekun and Alola (2020) use a nonlinear autoregressive distributed lag model over 1975–2018 to show that rising geopolitical risk reduces crude production in the Persian Gulf in the short term—a pattern repeated in March 2026.
On the natural gas side, the European crisis of 2022 generated literature with direct implications. Emiliozzi et al. (2024) study how Europe’s forced shift to LNG transformed the global gas market, linking the TTF benchmark to Asian spot prices. Albrizio et al. (2025) show how the burden of a total Russian shut-off would be distributed and that trade integration reduces individual importers’ losses; in 2026, that buffer evaporated because the shock hit a common supplier, Qatar. Auclert et al. (2023) make a point that is central to Section 5: in heterogeneous-agent models with realistic substitution elasticities, an energy price shock is recessionary for importers, and unilateral monetary tightening has little traction over imported inflation. Coccia and Russo (2025) show that contractionary responses to a supply shock deepen recessions and inequality. We return to these distributional results in Section 9.
2.2. Debt Liquidation and Financial Repression
The second pillar concerns how states have reduced debt burdens without formal default. Reinhart and Rogoff (2009) catalog the strategies; Reinhart and Sbrancia (2012, 2015) identify the least visible one. Financial repression—holding real interest rates negative or below market for a captive set of bondholders—is most effective in reducing debt when combined with inflation. Becker and Ivashina (2017) document a modern captive audience: domestic banks’ holdings of their own sovereign’s bonds during the euro crisis, at the cost of reduced corporate lending.
Two critical qualifications temper the argument. Hilscher et al. (2022) show, using the maturity distribution of privately held US debt and option-implied inflation, that unanticipated inflation erodes the debt burden far less than intuition suggests because much of the stock is short-dated and reprices quickly. Teles and Tristani (2024) reach a parallel conclusion in optimal-policy terms: for very large fiscal shocks the optimal inflation response is moderate, persistent and anticipated only slowly, and its effectiveness depends on realistically long debt maturities. The implication of both results is that debt liquidation through inflation is not an event but a process: it requires real interest rates that remain below inflation for a sustained period, which in turn requires either persistent inflation surprises or institutional arrangements that prevent nominal rates from adjusting.
On fiscal dominance, Dufrénot et al. (2018) show that such a regime need not produce hyperinflation; Bianchi and Melosi (2022) analyze inflation as a fiscal limit; Cochrane (2023) provides the general framework in which the price level performs fiscal adjustment.
The two literatures rarely intersect on a single event. Energy economists typically stop at the inflationary consequences of a supply shock; public-debt economists typically take the inflation path as given. The 2026 Hormuz shock provides an unusually clean setting in which to connect them, and we are not aware of a prior study that traces this specific episode from the physical disruption through to its sovereign-balance-sheet consequences.
3. Data and Methods
This paper is an event study of a single, datable shock, combined with an accounting decomposition and a scenario model validated ex post. It does not estimate a structural or causal model, and no claim of causal identification is made. The analysis proceeds in four steps: we document the shock and its market transmission with primary indicators; we decompose the observed acceleration of United States headline inflation into its energy, food and core components using published index weights; we compute the erosion of the real value of nominal sovereign debt under alternative inflation paths, first with the single-figure arithmetic and then with a maturity-structured model; and we assess, against explicit criteria, whether the observed policy configuration meets the standard definition of a financial repression regime. All calculations are reproducible from public sources; data and code are deposited at Zenodo (DOI 10.5281/zenodo.21762186).
The data cutoff is 15 August 2026, except where a later observation is explicitly dated. Market indicators come from the U.S. Energy Information Administration (Brent, WTI), ICE Endex (TTF) and S&P Global Platts (S&P Global, 2026a) (JKM). Shipping indicators come from Lloyd’s List Intelligence (transits) and from the Lloyd’s Market Association and Marsh (war-risk premiums). Price indices come from the U.S. Bureau of Labor Statistics via FRED (CPIAUCSL, CPIENGSL, CPIUFDSL, CPILFESL), and inflation expectations from FRED (T10YIE, T5YIE, T5YIFR). Federal Reserve holdings of Treasury securities come from the H.4.1 statistical release (via FRED: WSHONBNL, WSHOBL, WSHONBIIL). Debt data come from the U.S. Treasury (Debt to the Penny and the Monthly Statement of the Public Debt, consulted 28 August 2026) and, for cross-country comparison, from the IMF Fiscal Monitor. Every figure reported in Table 1 and Table 2 carries its source and reference date and is labeled by data type: Observed (published outturn), Preliminary (published but subject to revision), Estimate (computed by the authors from published series) or Projection (model or institutional forecast). No figure in the final tables relies on unverified or approximate values.
The contribution of component i to the change in headline inflation between two months is the product of its relative importance weight and the change in its year-over-year rate. Weights are the CPI-U relative importance weights published by the BLS for December 2025. Because those weights are updated periodically and the CPI is a chained index, component contributions need not reproduce the aggregate exactly; the aggregation residual is reported as an explicit row rather than distributed across components. All differences are computed from unrounded series.
Throughout the paper, D denotes federal debt held by the public, which is the concept relevant to inflationary erosion: intragovernmental holdings are claims of the government on itself and generate no transfer to private creditors. Section 6.1 reports the composition of the stock and isolates the base actually exposed to an inflation surprise by removing indexed securities and instruments that reprice within a year. The single-figure arithmetic is an upper bound, not a realized transfer, because it assumes the entire stock is nominal, fixed-rate and does not reprice within the horizon.
The inflation surprise is defined as realized inflation minus the inflation expectation embedded in the debt at issuance, proxied by the average ten-year breakeven inflation rate over the issuance window (2.30 percent; FRED T10YIE, average 2 January 2024 to 27 February 2026). Two caveats apply and are carried into the limitations. First, debt issued before 2024 embodies different inflation expectations, so a single benchmark understates the surprise on older tranches and overstates it on the most recent ones; because the surviving pre-2021 tranches are the longer-dated ones, on which erosion is largest, the net effect is that our estimate is conservative. Second, the five-percentage-point figure used in the severe scenario is a scenario assumption, not an estimate of 2026 outcomes, and is labeled as such wherever it appears.
4. Anatomy of the 2026 Shock
4.1. Five Weeks in Spring—And the Five Months After
On 28 February 2026, the United States and Israel launched an air campaign against Iran (EIA, 2026a). QatarEnergy suspended production across the Ras Laffan complex on 2 March following Iranian drone strikes, in a precautionary shutdown of a facility supplying roughly one-fifth of global LNG (Al Jazeera, 2026a). Iran declared the strait closed and began attacks on shipping; commodity-carrier transits collapsed by approximately 95 percent—116 crossings between 1 and 19 March, against a norm of roughly 120 vessel transits per day (Kpler data, via Gulf News, 2026). Brent surpassed $100 per barrel on 12 March and finished the quarter at $118 (EIA, 2026a). On 18–19 March, missiles struck the Ras Laffan liquefaction facilities, damaging Trains 4 and 6; QatarEnergy declared long-term force majeure, with repairs estimated at up to five years (QatarEnergy, 2026). A partial de-escalation announced on 5 May did not hold; renewed attacks on shipping on 10–12 August kept the strait partially closed at our data cutoff (Al Jazeera, 2026c, 2026d). The undamaged portions of Ras Laffan restarted in phases from May, with all twelve operable trains expected back by late August 2026; the two damaged trains remain under force majeure (The National, 2026a). Table 1 summarizes the key indicators, each labeled as realized or scenario based.
Table 1.
The 2026 Hormuz shock: key market indicators (data cutoff: 15 August 2026).
Two features distinguish this shock from 1973 and 1979. First, gas rather than oil was the binding constraint: oil found substitute barrels and routes within months, while the damaged liquefaction capacity is measured in years (QatarEnergy, 2026). Second, the demand side: under the 19th sanctions package adopted by the Council of the European Union in October 2025, imports of Russian LNG under short-term contracts were prohibited from 25 April 2026 and under long-term contracts from 1 January 2027 (Council of the European Union, 2025). The EU thus entered March 2026 having restricted its second-largest LNG supplier shortly before the conflict removed its largest. Energy-security policy designed against one supplier reduced resilience against the loss of another.
4.2. Transmission Channels, with a Quantitative Accounting Decomposition
The shock propagated through four channels. (a) Logistics and insurance: war-risk premiums for Gulf transits rose from approximately 0.25 percent of hull value before the war to between 3 and 10 percent by July 2026—for a $100 million tanker, from roughly $250,000 to $3–10 million per transit—after Lloyd’s Joint War Committee redesignated the Arabian Gulf as a conflict zone; much of the remaining traffic diverted around the Cape of Good Hope (The National, 2026b; Al Jazeera, 2026b). Palaios et al. (2024) had documented before the war how tightly geopolitical uncertainty and LNG freight rates are connected. (b) LNG supply and cargo competition: with Ras Laffan down, Asian importers entered the spot market against European buyers. Japan entered March with approximately 4.4 million tonnes of LNG in storage—some two to four weeks of stable demand—and South Korea, with approximately 3.5 million tonnes, reported no immediate shortage risk while accelerating procurement (S&P Global, 2026b); Vivoda (2019) ranks precisely these countries by import-portfolio concentration. The bidding contest diverted Atlantic cargoes, which is how a Persian Gulf conflict raised the price of gas in Rotterdam by 73 percent. (c) Fertilizers and food: natural gas is the feedstock of ammonia, and fertilizer represents a substantial share of food production costs—Gnutzmann and Spiewanowski (2016) estimate 44 percent of food commodity cost, identifying through the oil–gas spread. The Gulf producers—Bahrain, Iran, Oman, Qatar and Saudi Arabia—have supplied approximately one-quarter of globally traded ammonia in recent years, and shipments out of the Middle East halted completely from 12 March (Atlantic Council, 2026); US anhydrous ammonia rose from $843 per ton on 20 February to $1116 in late April (DTN, 2026). (d) Expectations and second-round effects: the channel through which a relative-price shock becomes a nominal one, visible in the acceleration of core consumer prices documented in Table 2 and in the upward revisions of the ECB’s inflation projection between March and June (ECB, 2026a, 2026b).
To quantify the channels’ relative importance—within the limits of an accounting decomposition, which we state explicitly is not causal identification—Table 2 decomposes the acceleration of US headline CPI between February 2026 (2.43 percent year on year) and its May peak (4.17 percent), using BLS subindices and CPI-U relative-importance weights. All differences are computed from unrounded series: the acceleration is 1.73 percentage points. (Differencing the rounded figures, 4.2 minus 2.4, yields 1.8 points; the discrepancy is one of rounding, not of calculation). Because relative-importance weights are updated periodically and the CPI is a chained index, the component contributions need not reproduce the aggregate exactly; we report the aggregation residual as an explicit row rather than distributing it across components. Figure 1 plots the resulting monthly contributions of the energy, food and core components from February to July 2026.
Table 2.
Accounting decomposition of the US headline CPI acceleration, February–May 2026.
Figure 1.
Accounting contributions of the energy, food and core components to US headline CPI inflation (year on year), February–July 2026. Bars: contribution of each component (subindex YoY inflation times CPI-U relative-importance weight); line: headline CPI. Source: BLS (2026) via FRED (2026); data cutoff 15 August 2026.
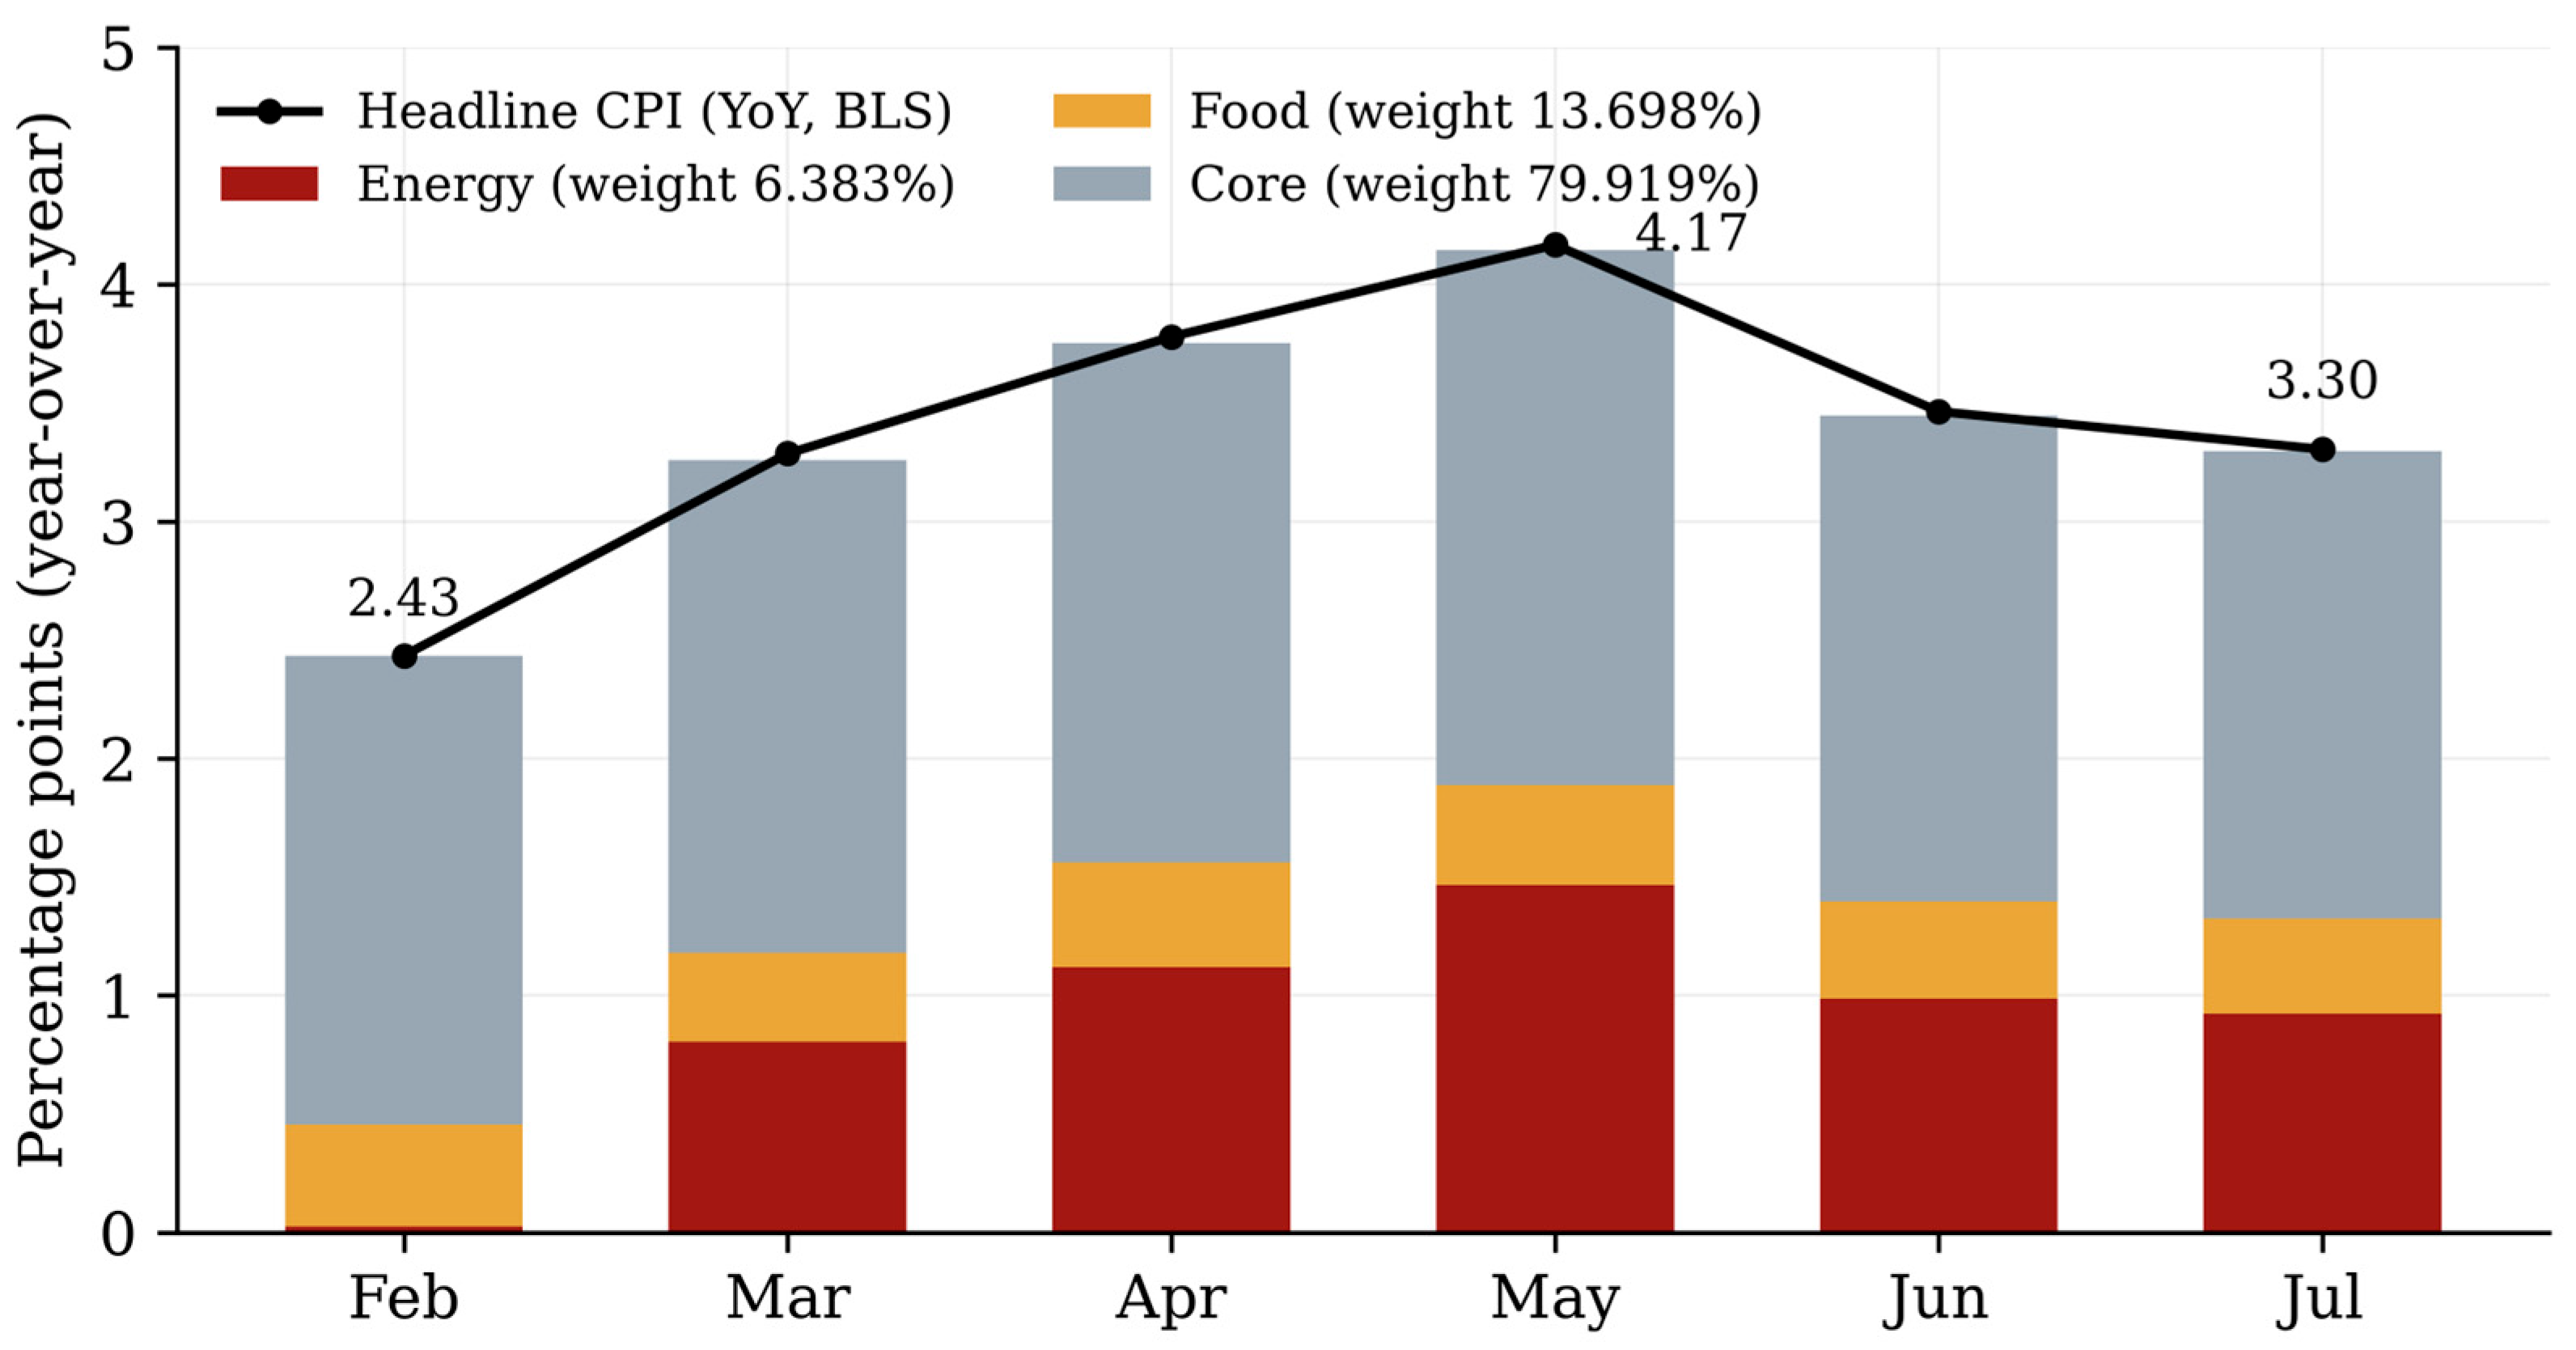
Three implications follow. First, the inflationary impulse at the cutoff was overwhelmingly the direct energy component—the classic signature of a supply shock. Second, the fertilizer-food channel, though visible in producer prices, had not passed through to US consumer food prices by the cutoff, consistent with the lagged and transitory pass-through documented by Vatsa et al. (2023); its consumer-price effect may appear with a lag rather than having failed to operate. Third, second-round effects were modest and, at the cutoff, receding—a fact that constrains the financial-repression interpretation examined in Section 7.
4.3. Winners and Losers
The distribution of gains was determined by the net export position in hydrocarbons. The United States, whose LNG export capacity was rising from about 17 billion cubic feet per day at end-2025 to slightly more than 19 in 2026 as Golden Pass started its first trains (EIA, 2026b, 2026c), sold incremental cargoes at crisis prices; Norway, Australia and Canada shared the windfall. Vivoda (2022) shows that the five largest exporters already accounted for three-quarters of global supply before the war; the crisis concentrated the rent further. On the losing side stand Japan, South Korea, Taiwan, India and the European Union—and, more severely, energy-importing emerging economies without reserve currencies, to which we return in Section 9.
5. The Monetary Policy Response of 2026
Central banks met the shock with the instruments of demand management, and the mismatch was visible within weeks. On 19 March 2026, the European Central Bank held its three key rates unchanged and revised its 2026 headline inflation projection up to 2.6 percent, citing higher energy prices from the Middle East war; by its 11 June meeting, the 2026 projection had risen to 3.0 percent (ECB, 2026a, 2026b). The Federal Reserve held rates as markets priced out cuts; the ten-year Treasury yield reached 4.44 percent on 27 March (FRED, series DGS10). The Bank of England’s mid-2026 projections showed CPI inflation somewhat above 3 percent through late 2026 (Bank of England, 2026).
As Section 2 anticipates, this reflects the nature of the shock rather than a lack of resolve. Higher policy rates lower domestic demand but neither clear bottlenecks nor restore liquefaction capacity. In Auclert et al. (2023), unilateral tightening has little effect on imported inflation, and coordination among importers was politically infeasible in 2026 given the divergent positions of the United States (a net beneficiary) and Europe (a large loser). Coccia and Russo (2025) document the recessionary and distributional costs of tightening into a supply shock. Both major central banks chose patience, effectively accepting a period of inflation between 3 and 4 percent rather than forcing it to 2 percent at the cost of recession.
The standard reading of these choices is that both central banks correctly judged the shock to be one that tightening could not reverse, and that the costs of rapid disinflation exceeded the costs of temporary overshooting. We emphasize that the observed 2026 policy path is fully consistent with this conventional interpretation. The remainder of this article examines a complementary hypothesis—that tolerance of above-target inflation also relieves the budget constraint of highly indebted sovereigns—and, rather than asserting it, specifies what evidence would distinguish it from the conventional reading. The two interpretations have identical observable implications for the 2026 policy-rate path; they diverge in the institutional criteria of Section 7 and the bond-return outcomes of Section 8.
6. From Arithmetic to a Maturity-Structured Erosion Model
6.1. Why the Single-Figure Arithmetic Overstates
The mechanical calculation—debt stock times unanticipated inflation—treats all liabilities as fixed-rate, unindexed and perpetual. None of this holds, and the choice of stock matters as much as the treatment of its components. Gross federal debt stood at $40.07 trillion on 26 August 2026, of which $7.76 trillion was intragovernmental—claims of the government on itself, which generate no transfer to private creditors—leaving $32.31 trillion held by the public, the measure used throughout this paper. Within that stock, $2.15 trillion of Treasury Inflation-Protected Securities carry indexed principal and do not erode, and $7.64 trillion of bills and floating-rate notes reprice within a year. The base actually exposed to an inflation surprise is therefore $22.51 trillion, and each cohort is eroded only while it remains outstanding (US Treasury, 2026b, 2026c). Table 3 reports the arithmetic at each successive definition of the base, so that the adjustment rests on observed composition rather than on an assumed fraction.
Table 3.
The erosion arithmetic at alternative definitions of the debt base (USD, per 1 pp inflation surprise).
6.2. The Model
Let the inflation surprise in year t be the difference between realized (or scenario) inflation and the market-implied expectation prevailing over the issuance window, proxied by the average ten-year breakeven inflation rate from January 2024 to 27 February 2026: 2.30 percent (FRED, 2026, series T10YIE, n = 538 daily observations). The real transfer from bondholders to the Treasury in year t is the sum, across maturity buckets, of the surviving stock times the surprise. Survival profiles are calibrated to bucket-level average remaining maturities (bills: half-year exposure in year one; notes: approximately 12.5 percent annual runoff; bonds: approximately 3 percent), consistent with the Treasury’s published maturity distribution. Maturing debt is assumed to reprice at rates that embed observed inflation, so no cohort is eroded beyond its life. Model code and all input data are deposited in the article’s data repository (DOI 10.5281/zenodo.21762186).
6.3. Scenarios and Ex-Post Validation
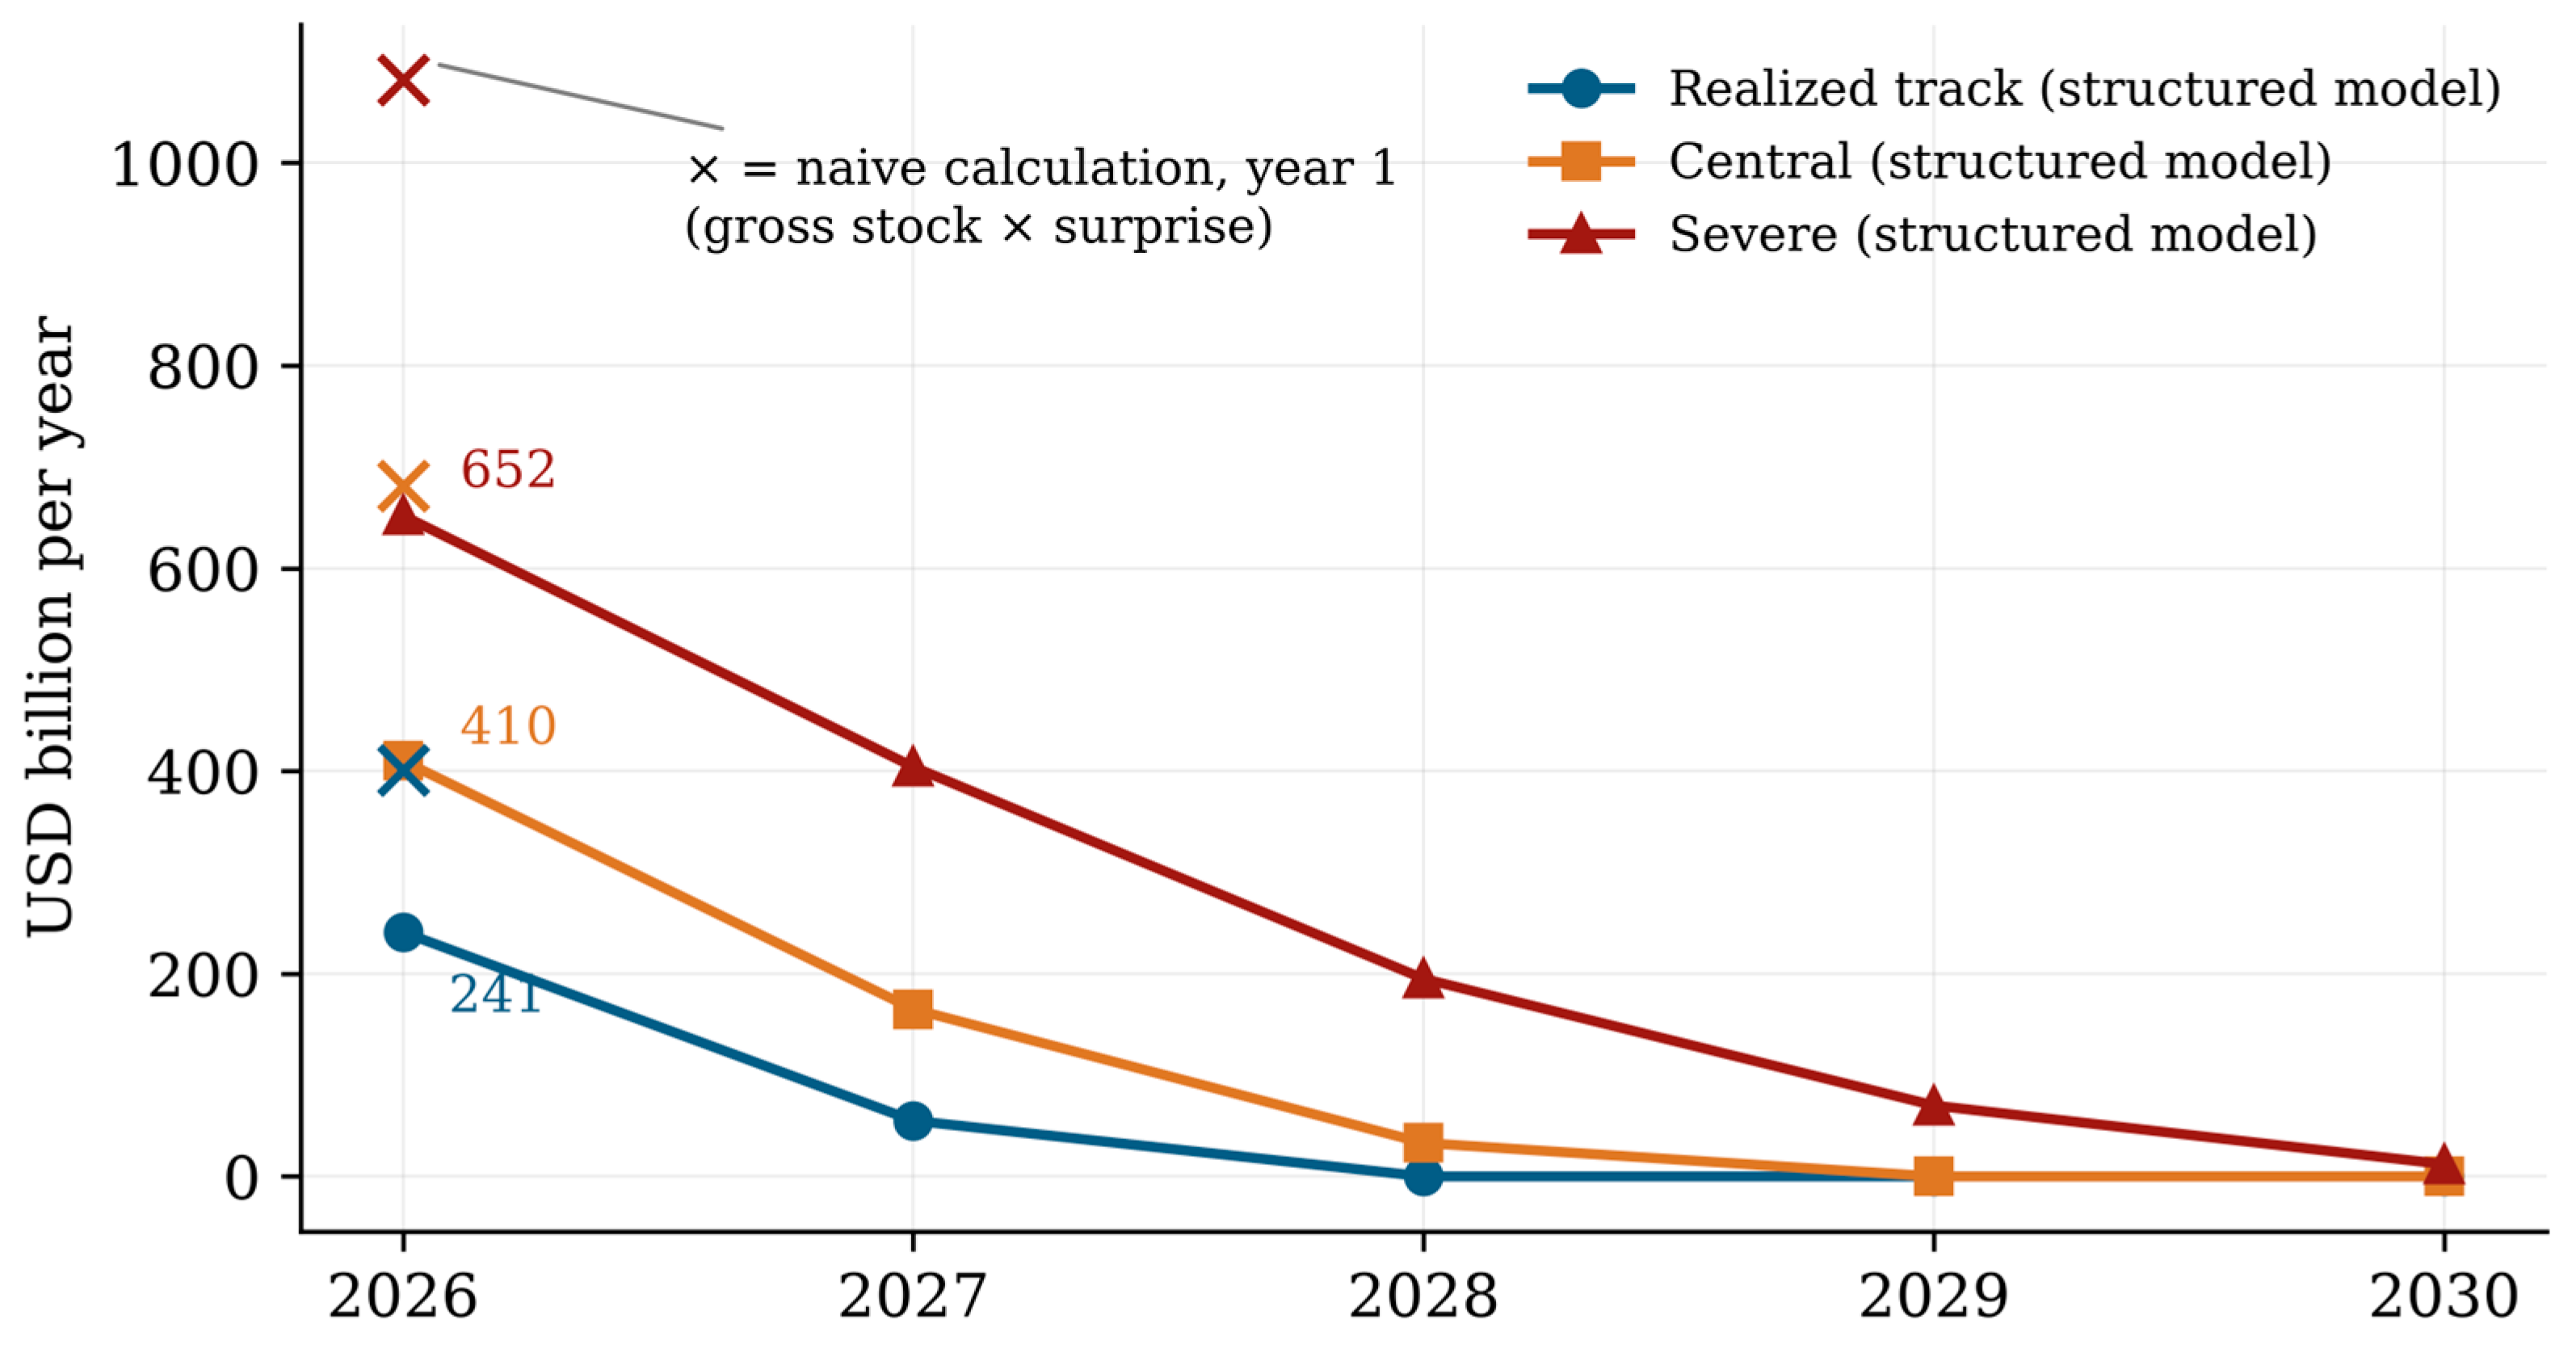
The ex-post reconciliation is direct. Under the inflation path realized through the cutoff, the naive arithmetic applied to gross debt reproduces the figure of approximately $400 billion that headlined the original version of this article—a figure we now report as an upper bound rather than as a realized transfer; the structured model shows that the first-year transfer consistent with the same surprise is $241 billion—approximately 40 percent smaller—and that, absent renewed surprises, the annual flow declines toward zero within roughly three years as the stock reprices. This is the quantitative content of the qualification in Hilscher et al. (2022), applied to 2026 stocks. First-approximation figures for the euro area (EUR ~138 billion per percentage point on a EUR ~13.8 trillion stock) and Japan (JPY ~12.4 trillion per point) are retained for scale only and are labeled as unadjusted upper bounds; extending the structured model to those jurisdictions is left for future work (IMF, 2026; IIF, 2026). Table 4 sets out the three inflation scenarios and the erosion each implies, and Figure 2 plots the annual flow under each of them.
Table 4.
Inflation scenarios and erosion of US Treasury debt (USD billion).
Figure 2.
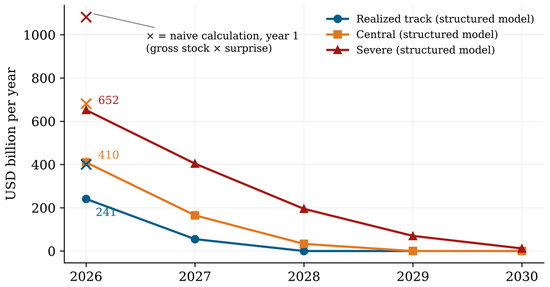
Annual real erosion of US marketable Treasury debt under the three inflation scenarios of Table 4, structured model (lines) versus the naïve first-year calculation (crosses). The flow decays as maturing debt reprices. Source: authors’ model on US Treasury (2026c) and FRED (2026).
The euro area figure requires a caveat that does not apply to the United States or Japan: the euro area is not a single sovereign borrower, and the aggregate conceals a dispersion that is of first order for the mechanism analyzed here. Gross general government debt in 2026 ranges from 44.4 percent of GDP in the Netherlands and 67.0 percent in Germany to 119.1 percent in France, 137.9 percent in Greece and 138.5 percent in Italy (IMF, World Economic Outlook). Member states also differ in maturity structure, in the share of debt held domestically and in sovereign risk premia. An inflation surprise common to the currency area therefore produces heterogeneous fiscal transfers across member states, largest where the stock is largest and the maturity longest. The area-wide figure should be read as an accounting magnitude and not as the position of a representative sovereign; it is presented for comparability with the single-issuer cases and is not used to support any claim about the fiscal position of an individual member state.
6.4. Sensitivity
Across the ranges examined—inflation surprises between 0.5 and 3.0 percentage points, notes runoff between 10 and 15 percent per year, and a bills share between 20 and 25 percent of marketable debt—first-year structured erosion remains between roughly $120 billion and $700 billion, and always between 55 and 65 percent of the corresponding naïve figure. The conclusion that single-figure arithmetic overstates first-year erosion by roughly 40 percent is robust to the calibration choices.
7. Is This Financial Repression? An Operational Assessment
The term financial repression denotes a policy regime, not an outcome. Following Reinhart and Sbrancia (2012, 2015), we assess six operational criteria against the evidence at our cutoff (Table 5).
Table 5.
Repression criteria and 2026 evidence (cutoff: 15 August 2026).
At the cutoff, at most one of six criteria is partially met. Two readings of the 2026 configuration must therefore be distinguished. What the evidence establishes is the liquidation outcome: an inflation surprise of one percentage point relative to the expectations embedded in the outstanding stock, which mechanically reduced the real value of nominal federal debt by an estimated $241 billion in the first year. What the evidence does not establish is a repression regime. The United States imposes no interest rate ceilings, no forced holdings and no capital controls; the Federal Reserve raised its policy rate once inflation materialized; and the ex post real rate on the stock was negative in only three of seven months, returning to positive territory in July. A standard monetary response to a supply shock accounts for the observed policy path at least as well as a repression hypothesis, and this paper does not claim otherwise.
Financial repression is therefore advanced here as a conditional hypothesis about the future, not as a finding about the past. The conditions that would make it operative are identifiable and observable: a debt ratio above the threshold at which repression becomes fiscally attractive; a maturity structure short enough that each policy rate increase imposes an immediate budgetary cost; and an institutional configuration in which the sovereign’s largest creditors are captive. The protocol set out in Section 8 specifies which observations over 2026–2031 would corroborate this hypothesis and which would refute it. Treating the question as falsifiable, rather than as settled, is what distinguishes an assessment framework from an assertion.
8. A Testing Protocol, 2026–2031
Hypothesis H1 (erosion): nominal Treasury securities of the 2024–2026 issuance vintage will earn a cumulative real total return of −2 percent or less by end-2028, the level implied by the central scenario of Table 4. Falsification: a cumulative real return of zero or above at end-2028 rejects H1. Hypothesis H2 (repression as a regime): any observed erosion is attributable to a repression regime only if at least two institutional criteria of Table 5 are additionally activated before December 2028; erosion without institutional activation must be attributed to the transitory supply shock. Confounders: attribution requires a panel specification for advanced economies over 2019–2031 in which the vintage real return is regressed on the inflation surprise with controls for growth surprises relative to consensus forecasts, the primary deficit path, the deviation of the policy rate from a standard Taylor rule, and the imported-energy share of GDP; the surprise term must retain significance under these controls. We note that the evidence at our own cutoff—anchored breakevens and decelerating core inflation—currently favors the conventional supply-shock reading over H2.
9. Discussion
The erosion channel operates only for sovereigns that borrow long-term, in their own currency, from holders who cannot rapidly exit—conditions met by the United States, Japan and the euro-area core. Energy-importing emerging economies experience the same shock with the opposite sign: imported inflation raises local-currency rates, depreciates the exchange rate, and increases the real burden of foreign-currency debt. Structural energy-access constraints compound this asymmetry: economies with wide energy accessibility gaps face the shock from a position of pre-existing vulnerability (Khoso et al., 2025), and early modeling of the 2026 shock for import-dependent African economies points the same way (Ahinsah-Wobil, 2026). The distributive geography of an LNG shock is therefore triple: from importers to exporters across countries; from savers to treasuries inside the debtor economies; and from wage earners to indexed claimants inside every importing economy. The literature has treated these separately; they are one event. This asymmetry is, however, a proposition drawn from the cited literature, not a finding of the present analysis: no sample of emerging economies is examined in this paper, the quantitative exercise is confined to the arithmetic of domestic nominal debt in the United States, and the countervailing revaluation of foreign-currency obligations is not modeled here. The proposition is added to the testing protocol as one to be evaluated with country-level data on currency composition.
The analysis has concentrated on the sovereign balance sheet, but the absorption of an external shock of this kind is mediated by the banking system and by credit conditions, and a brief widening of the frame is warranted; the three channels sketched below are stated qualitatively, as directions for future research rather than as results of this paper. First, banks are among the principal domestic holders of sovereign debt, so the same inflation surprise that erodes the real value of the government’s liability erodes the real value of the banks’ assets; where prudential regulation privileges sovereign exposure as risk-free, this transfers part of the adjustment to intermediaries and, ultimately, to depositors—the captive-audience mechanism that Reinhart and Sbrancia (2015) document as the operational core of historical repression episodes. Second, an energy shock that raises input costs and compresses margins deteriorates the credit quality of firms in energy-intensive sectors, so the fiscal relief obtained through inflation coexists with a deterioration of bank asset quality—a composition effect that aggregate debt-to-GDP ratios do not capture. Third, deposit rates adjust more slowly than lending rates and far more slowly than inflation, so the household sector absorbs a further share of the adjustment through negative real returns on deposits. These channels do not alter the arithmetic of sovereign erosion presented above, but they qualify its welfare interpretation: the transfer measured from the sovereign’s perspective is not a costless gain for the economy as a whole since part of it is a redistribution within the private sector rather than from the private sector to the state. Quantifying these intermediation channels—bank holdings of the eroding vintages, sectoral credit quality, and the deposit-rate pass-through—is a natural extension of the erosion model and is left for future work.
For the European Union, the 2026 experience carries an institutional lesson. The Russian-LNG phase-out and the Qatari outage were independent decisions by independent actors, but they reached the same import portfolio within sixty days. Diversification metrics of the kind Vivoda (2019) computes were treated in the 2025 policy debate as evidence that the phase-out was affordable; they were static metrics, and the shock was dynamic. Energy-security policy that optimizes against the last adversary can finance the vulnerability the next one exploits—an argument developed in general terms by Goldthau and Youngs (2023) and consistent with the sequence of events documented in Section 4. Kim et al. (2025) draw the forward-looking conclusion: the only diversification robust to chokepoint geopolitics is a smaller share of gas and oil in the energy mix.
Finally, the incentive structure deserves a sober statement. No committee decided in March 2026 to reduce debt through inflation. But when 4 percent inflation saves large treasuries tens of billions while bondholders and pensioners bear the corresponding loss, the burden of proof shifts to those who maintain that the tolerance is temporary. Bianchi and Melosi (2022) formalize the mechanism; whether 2026 instantiates it is exactly what the protocol of Section 8 will reveal.
10. Conclusions
The 2026 Hormuz crisis exposed liquefied natural gas as a critical constraint of the present energy system: harder to store than oil, harder to reroute, and with a fifth of world supply concentrated in a single exporter whose facilities proved vulnerable to attack. Within weeks, the disruption moved European gas prices, Asian inventories, ammonia markets and—through the energy component almost exclusively, as Table 2 shows—consumer prices, while central banks faced a shock their instruments could not reverse.
Read against the record $348 trillion global debt stock reported days before the first airstrikes, the episode’s fiscal arithmetic is real but smaller and shorter-lived than single-figure calculations suggest: under the realized inflation path, first-year erosion of US Treasury liabilities is approximately $241 billion rather than the approximately $400 billion implied by applying the surprise to gross debt, and the flow decays as the stock reprices. On the evidence available at our cutoff, the 2026 policy stance does not meet the operational criteria of a financial-repression regime; the hypothesis remains open and is now falsifiable under the protocol of Section 8.
Limitations. (i) The episode was unresolved at the data cutoff, and all realized figures may be revised. (ii) The channel decomposition is an accounting exercise, not causal identification. (iii) The erosion model is an accounting model with stylized survival profiles; it abstracts from endogenous yield responses. (iv) Breakevens embed liquidity and risk premia, so the issuance-expectation proxy is imperfect. (v) The euro-area and Japan figures are unadjusted first approximations. (vi) The discussion of emerging economies and of banking-sector transmission channels is qualitative and rests on the cited literature, not on analysis conducted here. Future work: structured erosion models for the euro area and Japan; a euro-area HICP channel decomposition; execution of the Section 8 protocol as data accrue; and country-level quantification of the opposite-sign transmission in energy-importing emerging economies.
Author Contributions
Conceptualization, J.A.R.-M.; methodology, J.A.R.-M. and E.A.G.B.; investigation, E.A.G.B.; data curation and software, J.A.R.-M.; validation, E.A.R.F. and M.A.S.P.; writing—original draft preparation, J.A.R.-M.; writing—review and editing, E.A.R.F. and M.A.S.P.; supervision, J.A.R.-M. All authors have read and agreed to the published version of the manuscript.
Funding
This research received no external funding.
Institutional Review Board Statement
Not applicable.
Informed Consent Statement
Not applicable.
Data Availability Statement
The data presented in this study, the model code (Python 3.11), and all input series (FRED, US Treasury MSPD, BLS) are openly available in Zenodo under the concept DOI https://doi.org/10.5281/zenodo.21762186, which resolves to the latest version; the version accompanying this revision is https://doi.org/10.5281/zenodo.22285091. Data and code are available under a Creative Commons Attribution 4.0 International license, the license declared in the Zenodo record.
Acknowledgments
During the preparation of the original version of this manuscript, the authors used an AI-based writing assistant for drafting and language editing. For the present revised version, all data collection, verification against primary sources, model construction and computations were carried out and checked by the authors, and the prose was thoroughly re-edited. The authors take full responsibility for the content of this publication.
Conflicts of Interest
The authors declare no conflicts of interest.
References
- Ahinsah-Wobil, I. (2026). Systemic risk assessment of geopolitical energy shocks: A macroprudential stress-test framework for Strait of Hormuz disruption and cross-border transmission to sovereign debt markets. SSRN working paper. Available online: https://papers.ssrn.com/sol3/results.cfm (accessed on 8 September 2026).
- Aizenman, J., & Marion, N. (2011). Using inflation to erode the US public debt. Journal of Macroeconomics, 33, 524–541. [Google Scholar] [CrossRef] [Scilit]
- Albrizio, S., Bluedorn, J., Brasier, R., Koch, C., Pescatori, A., & Stuermer, M. (2025). Trade integration and supply disruptions: Sharing the pain from a Russian gas shut-off to Europe. The Energy Journal, 46, 1–24. [Google Scholar] [CrossRef] [Scilit]
- Al Jazeera. (2026a). Gas prices soar as QatarEnergy halts LNG production after Iran attacks. 2 March. Available online: https://www.aljazeera.com/news/2026/3/2/qatarenergy-worlds-largest-lng-firm-halts-production-after-iran-attacks (accessed on 8 September 2026).
- Al Jazeera. (2026b). How shipping insurance rates are rising, as Hormuz, Bab al-Mandeb shut down. 23 July. Available online: https://www.aljazeera.com/economy/2026/7/23/how-shipping-insurance-rates-are-rising-as-hormuz-bab-al-mandeb-shut-down (accessed on 8 September 2026).
- Al Jazeera. (2026c). Oil prices rise as attacks dent hopes for Strait of Hormuz reopening. 12 August. Available online: https://www.aljazeera.com/economy/2026/8/12/oil-prices-rise-as-attacks-dent-hopes-for-strait-of-hormuz-reopening (accessed on 8 September 2026).
- Al Jazeera. (2026d). Oil prices, stocks surge as Hormuz closure drags on. 10 August. Available online: https://www.aljazeera.com/economy/2026/8/10/oil-prices-stocks-surge-as-hormuz-closure-drags-on (accessed on 8 September 2026).
- Atlantic Council. (2026). How the US can use its natural gas abundance to ease rising fertilizer prices. EnergySource. Atlantic Council Global Energy Center. [Google Scholar]
- Auclert, A., Monnery, H., Rognlie, M., & Straub, L. (2023). Managing an energy shock: Fiscal and monetary policy (NBER Working Paper 31543). NBER. [Google Scholar]
- Bank of England. (2026). Monetary policy report, April and June 2026. Bank of England. [Google Scholar]
- Becker, B., & Ivashina, V. (2017). Financial repression in the European sovereign debt crisis. Review of Finance, 22, 83–115. [Google Scholar] [CrossRef] [Scilit]
- Bianchi, F., & Melosi, L. (2022). Inflation as a fiscal limit (Paper presented at the Jackson Hole Economic Policy Symposium, Jackson Hole, WY, USA). Federal Reserve Bank of Chicago. [Google Scholar]
- Blinder, A. S., & Rudd, J. B. (2013). The supply-shock explanation of the great stagflation revisited. In The great inflation: The rebirth of modern central banking (pp. 119–175). University of Chicago Press. [Google Scholar]
- BLS (U.S. Bureau of Labor Statistics). (2026). Consumer price index, table 1: Relative importance of components in the consumer price indexes, 2024 weights. BLS. Available online: https://www.bls.gov/cpi/tables/relative-importance/ (accessed on 8 September 2026).
- Board of Governors of the Federal Reserve System. (2026). Factors affecting reserve balances (H.4.1), statistical release, week ending 26 August 2026. Board of Governors. Available online: https://www.federalreserve.gov/releases/h41/ (accessed on 8 September 2026).
- Caldara, D., & Iacoviello, M. (2022). Measuring geopolitical risk. American Economic Review, 112, 1194–1225. [Google Scholar] [CrossRef] [Scilit]
- Coccia, S., & Russo, A. (2025). Inflation, inequality and financial vulnerability: Monetary vs. fiscal policy in the face of an energy shock. Energy Economics, 143, 108222. [Google Scholar] [CrossRef] [Scilit]
- Cochrane, J. H. (2023). The fiscal theory of the price level. Princeton University Press. [Google Scholar]
- Council of the European Union. (2025). 19th package of restrictive measures against Russia (Russian LNG import prohibition). Available online: https://www.consilium.europa.eu/en/press/press-releases/2025/10/23/19th-package-of-sanctions-against-russia-eu-targets-russian-energy-third-country-banks-and-crypto-providers/ (accessed on 8 September 2026).
- CRS (Congressional Research Service). (2019). The Strait of Hormuz: Security developments and impacts on oil, gas, and other commodities (Report R45281). Congressional Research Service. [Google Scholar]
- DTN. (2026). Retail fertilizer trends: UAN, anhydrous lead fertilizer prices higher in last week of April. DTN. [Google Scholar]
- Dufrénot, G., Jawadi, F., & Khayat, G. A. (2018). A model of fiscal dominance under the Reinhart Conjecture. Journal of Economic Dynamics and Control, 93, 332–345. [Google Scholar] [CrossRef] [Scilit]
- ECB (European Central Bank). (2026a). Monetary policy decisions. 19 March. ECB. [Google Scholar]
- ECB (European Central Bank). (2026b). Monetary policy decisions. 11 June. ECB. [Google Scholar]
- EIA (U.S. Energy Information Administration). (2026a). Crude oil and petroleum product prices increased sharply in the first quarter of 2026. Today in energy, 7 April. Available online: https://www.eia.gov/todayinenergy/detail.php?id=67424 (accessed on 8 September 2026).
- EIA (U.S. Energy Information Administration). (2026b). The 9th U.S. liquefied natural gas export terminal, Golden Pass, ships first cargo. Today in energy. Available online: https://www.eia.gov/todayinenergy/detail.php?id=67564 (accessed on 8 September 2026).
- EIA (U.S. Energy Information Administration). (2026c). U.S. natural gas exports to grow nearly 30% by 2027 as LNG facilities ramp up. Today in energy. Available online: https://www.eia.gov/todayinenergy/detail.php?id=67484 (accessed on 8 September 2026).
- Emiliozzi, S., Ferriani, F., & Gazzani, A. (2024). The European energy crisis and the consequences for the global natural gas market. The Energy Journal, 46, 119–145. [Google Scholar] [CrossRef] [Scilit]
- FRED (Federal Reserve Bank of St. Louis). (2026). Federal reserve economic data: Series T10YIE, T5YIE, DGS10, CPIAUCSL, CPIENGSL, CPIUFDSL and CPILFESL. Federal Reserve Bank of St. Louis. Available online: https://fred.stlouisfed.org/ (accessed on 8 September 2026).
- Gnutzmann, H., & Spiewanowski, P. (2016). Fertilizer fuels food prices: Identification through the oil-gas spread (SSRN Working Paper). SSRN. [Google Scholar] [CrossRef] [Scilit]
- Goldthau, A. C., & Youngs, R. (2023). The EU energy crisis and a new geopolitics of climate transition. JCMS: Journal of Common Market Studies, 61, 115. [Google Scholar] [CrossRef] [Scilit]
- Gulf News. (2026). 95% drop in Hormuz traffic as war disrupts oil route (Kpler data). Available online: https://gulfnews.com/world/mena/95-drop-in-hormuz-traffic-as-war-disrupts-oil-route-1.500481217 (accessed on 8 September 2026).
- Hamilton, J. D. (1983). Oil and the macroeconomy since World War II. Journal of Political Economy, 91, 228–248. [Google Scholar] [CrossRef] [Scilit]
- Hilscher, J., Raviv, A., & Reis, R. (2022). Inflating away the public debt? An empirical assessment. Review of Financial Studies, 35, 1553–1595. [Google Scholar] [CrossRef] [Scilit]
- IIF (Institute of International Finance). (2026). Global debt monitor. IIF. [Google Scholar]
- IMF (International Monetary Fund). (2026). Fiscal monitor: Fiscal policy under pressure—High debt, rising risks. IMF. [Google Scholar]
- Khoso, W. M., Akher, M. J., Laghari, A. A., Jamali, R., Tunio, R. A., & Laghari, M. A. (2025). Energy accessibility gap: A key barrier to human development. International Journal of Sustainable Development & World Ecology, 32(7), 827–841. [Google Scholar] [CrossRef] [Scilit]
- Kilian, L. (2009). Not all oil price shocks are alike: Disentangling demand and supply shocks in the crude oil market. American Economic Review, 99, 1053–1069. [Google Scholar] [CrossRef] [Scilit]
- Kim, J., Jaumotte, F., Panton, A. J., & Schwerhoff, G. (2025). Energy security and the green transition. Energy Policy, 198, 114409. [Google Scholar] [CrossRef] [Scilit]
- OECD. (2026). Consumer prices, OECD monthly release, February 2026. OECD. [Google Scholar]
- Olanipekun, I. O., & Alola, A. A. (2020). Crude oil production in the Persian Gulf amidst geopolitical risk, cost of damage and resources rents: Is there asymmetric inference? Resources Policy, 69, 101873. [Google Scholar] [CrossRef] [Scilit]
- Palaios, P., Triantafyllou, A., & Zombanakis, G. (2024). Economic and geopolitical uncertainty vs energy variables: Exploring connectedness in the LNG freight market. Maritime Policy & Management, 52, 287–308. [Google Scholar] [CrossRef] [Scilit]
- QatarEnergy. (2026). Official statement on the damage from the missile attacks on Ras Laffan industrial city. Doha. [Google Scholar]
- Reinhart, C. M., & Rogoff, K. S. (2009). This time is different: Eight centuries of financial folly. Princeton University Press. [Google Scholar]
- Reinhart, C. M., & Sbrancia, M. B. (2012). The return of financial repression. Financial Stability Review, 16, 37–48. [Google Scholar]
- Reinhart, C. M., & Sbrancia, M. B. (2015). The liquidation of government debt. Economic Policy, 30, 291–333. [Google Scholar] [CrossRef] [Scilit]
- S&P Global. (2026a). Platts JKM (Japan Korea Marker) LNG price assessments, February–March 2026. S&P Global. [Google Scholar]
- S&P Global. (2026b). South Korea sees no LNG shortages despite Middle East supply disruptions. 5 March. S&P Global. [Google Scholar]
- Teles, P., & Tristani, O. (2024). The monetary financing of a large fiscal shock. Journal of Monetary Economics, 147, 103630. [Google Scholar] [CrossRef] [Scilit]
- The National. (2026a). Qatar’s Ras Laffan LNG site may not be fully back online for months. 9 April. The National. [Google Scholar]
- The National. (2026b). Shipping insurance surges again as attacks intensify over Strait of Hormuz. 17 July. The National. [Google Scholar]
- US Treasury. (2026a). Average interest rates on U.S. Treasury securities, monthly series. Bureau of the Fiscal Service. Available online: https://fiscaldata.treasury.gov/datasets/average-interest-rates-treasury-securities/ (accessed on 8 September 2026).
- US Treasury. (2026b). Debt to the Penny, daily series, 26 August 2026. Bureau of the Fiscal Service. Available online: https://fiscaldata.treasury.gov/datasets/debt-to-the-penny/ (accessed on 8 September 2026).
- US Treasury. (2026c). Monthly statement of the public debt of the United States, 31 July 2026. Bureau of the Fiscal Service. Available online: https://fiscaldata.treasury.gov/datasets/monthly-statement-public-debt/summary-of-treasury-securities-outstanding (accessed on 8 September 2026).
- Vatsa, P., Miljkovic, D., & Baek, J. (2023). Linkages between natural gas, fertiliser and cereal prices: A note. Journal of Agricultural Economics, 74, 935–940. [Google Scholar] [CrossRef] [Scilit]
- Vivoda, V. (2019). LNG import diversification and energy security in Asia. Energy Policy, 129, 967–974. [Google Scholar] [CrossRef] [Scilit]
- Vivoda, V. (2022). LNG export diversification and demand security: A comparative study of major exporters. Energy Policy, 170, 113218. [Google Scholar] [CrossRef] [Scilit]

Disclaimer/Publisher’s Note: The statements, opinions and data contained in all publications are solely those of the individual author(s) and contributor(s) and not of MDPI and/or the editor(s). MDPI and/or the editor(s) disclaim responsibility for any injury to people or property resulting from any ideas, methods, instructions or products referred to in the content. |
© 2026 by the authors. Licensee MDPI, Basel, Switzerland. This article is an open access article distributed under the terms and conditions of the Creative Commons Attribution (CC BY) license.