


Abstract
Background/Motivation: Tax avoidance represents a persistent governance and fiscal challenge in emerging-market economies; however, its role as a mediating channel between firm-level strategic determinants and profitability remains underexplored in the Indonesian multinational context. Objective: This study examines whether transfer pricing, corporate social responsibility (CSR), managerial ownership, institutional ownership, and earnings management influence firm profitability through the intermediating mechanism of tax avoidance in Indonesian manufacturing multinational corporations (MNCs). Method: Using panel data from 31 IDX-listed MNCs over 2018–2023 (186 firm-year observations), we apply random effects panel regression and Sobel mediation tests, with robustness checks using Book-Tax Difference (BTD) as an alternative proxy, a lagged-variable specification, and an extended control variable set including financial leverage, capital intensity, sales growth, and year fixed effects. Endogeneity is assessed via the Durbin–Wu–Hausman test. Results: None of the five determinants significantly influences GAAP ETR, and tax avoidance does not significantly mediate any determinant–profitability relationship. Only institutional ownership exerts a significant direct effect on profitability (β = 0.002381, p < 0.05). Contribution: This is the first study to comprehensively test a five-determinant simultaneous mediation model in the Indonesian MNC context. The findings reveal that the mediation architecture commonly documented in developed-market contexts does not hold in Indonesian MNCs—attributable to institutional enforcement gaps, concentrated ownership structures, and the symbolic nature of CSR in emerging markets—with direct implications for Indonesian tax policy and corporate governance reform.
1. Introduction
The state revenue agenda prioritizes taxes as a primary source of revenue, yet corporate tax avoidance remains a challenge. The Tax Justice Network estimates that Indonesia loses approximately US$4.86 billion annually due to tax evasion/avoidance. Other estimates indicate the potential losses associated with corporate tax avoidance are substantial. A widely highlighted pattern is the shifting of profits by multinational corporations to affiliated entities in lower-tax jurisdictions (Farooq & Abdel Zaher, 2020), in line with the trend of cross-border tax strategies (Suh et al., 2019). At the macro level, Indonesia’s tax revenue realization, which has repeatedly fallen below target over a prolonged period, further reinforces the urgency of tax compliance issues. The government responded by strengthening regulations and sanctions to suppress tax evasion (Khuong et al., 2019), including pushing for stricter enforcement (Warih, 2019), because taxes are positioned as a dominant contributor to state revenue (Argilés-Bosch et al., 2021) and are the focus of many contemporary tax-accounting studies (Dyreng et al., 2019).
This conflict of interest can be explained through agency theory, where companies, as taxpayers, view taxes as a burden that reduces the wealth and welfare of their owners (Dyreng et al., 2019), thus creating incentives to minimize tax payments (Tang, 2020), even by exploiting existing regulatory loopholes. From the government’s perspective, taxes are positioned as a financing instrument for state administration, so policies and regulations are directed towards maximizing revenue (Widiatmoko & Mulya, 2021). Under the pressure of these conflicting interests, companies exploit fiscal reconciliation and regulatory loopholes, which in practice can be linked to accounting tax decision-making (Kim & Lee, 2021) and corporate tax planning strategies. Tax avoidance is then understood as an effort to minimize the tax burden by exploiting regulatory weaknesses (Novita & Herliansyah, 2019); normatively, it does not always violate the law, but substantively, it can be viewed as disobedience (Alfina et al., 2018) and is considered problematic from an ethical and tax administration perspective.
The phenomenon of transfer pricing is an important entry point because tax avoidance practices are often carried out through cross-jurisdictional affiliate transactions, including in countries characterized by tax havens (Fernández-Rodríguez et al., 2019), which facilitates the intention to shift profits (Kim & Im, 2016) and creates room for tax aggressiveness (Khan et al., 2017). In Indonesia, this phenomenon is reflected in various media highlights regarding transfer pricing practices and their impact on the domestic tax base (Tempo, n.d.; accessed on 7 April 2026), including indications of widespread practices in the export sector (Ortax, n.d.; accessed on 7 April 2026). The development of tax disputes related to transfer pricing is also increasingly depicted in international statistics (OECD, 2020). However, a scientific gap that has emerged is that discussions of transfer pricing often stop at its relationship with tax avoidance, while the pathway by which transfer pricing is “translated” into performance achievements (profitability) requires a more explicit explanation of the mechanisms through which corporate tax behavior is conducted.
The CSR phenomenon demonstrates a distinct dynamic in its relationship to tax avoidance. Several findings position CSR as a signal of compliance and ethical orientation that suppresses tax aggressiveness (Hasseldine & Morris, 2013) and reduces involvement in tax haven activities (Col & Patel, 2019). Conversely, CSR is also positioned as a reputational tool that has the potential to mask tax avoidance practices (Sikka, 2012), and companies engaging in tax avoidance may even increase CSR to manage reputational risk (Huseynov & Klamm, 2012). Other findings confirm that the CSR–tax avoidance relationship can veer in different directions depending on the context and governance (Lanis & Richardson, 2015). Thus, the gap in CSR variables lies in the inconsistent direction of the relationship and the need for modeling that positions tax avoidance as a channel that explains how CSR ultimately associates with performance outcomes.
The phenomenon of ownership structure, particularly institutional and managerial ownership, is related to monitoring and incentive functions. Institutional ownership is seen as enhancing oversight because institutions play a greater role in disciplining management (Maharani & Suardana, 2014), in line with the argument that institutional investors can suppress opportunistic behavior. However, the drive to fulfill shareholder interests from a stakeholder perspective can also encourage a preference for tax efficiency, so the pressure to avoid taxes does not always weaken. Empirical evidence shows mixed results: there are insignificant findings between institutional ownership and tax avoidance (Arianti, 2020), but there are also positive findings (Kovermann & Velte, 2019). With managerial ownership, the relationship with performance is also not always linear; positive findings on firm value have emerged (Putranto & Kurniawan, 2018), but the relationship can weaken at certain ownership levels (Chen et al., 2007) and even exhibit nonlinear patterns (Cui & Mak, 2002). The gap in ownership variables lies in the instability of findings across studies and the need to test whether the effect of ownership on profitability works through the tax avoidance channel, rather than just through operational efficiency or investment decisions.
The phenomenon of earnings management is also relevant because this practice has the potential to directly overlap with tax strategies. A positive relationship between earnings management and tax avoidance has been found in various contexts (S. Wang & Chen, 2012) and is reinforced by additional evidence (Irawan et al., 2020). A positive correlation has also been reported in other studies (Delgado et al., 2023). However, contradictory results have also emerged, namely a negative relationship between earnings management and tax avoidance under certain conditions (Hong et al., 2022). The gap in earnings management variables lies in the differing direction of findings and the need for a framework that assesses its ultimate consequences on profitability through the tax avoidance channel.
The tax avoidance channel is crucial because its implications for profitability are also ambivalent. Several studies show a positive correlation between tax avoidance and profitability (Zhu et al., 2019), in line with the argument that tax efficiency increases after-tax profits. However, tax avoidance can also undermine long-term profitability through political costs, reputational risks, and financing constraints (Dyreng et al., 2008). These differing findings reinforce the need for modeling that does not force a direct relationship but instead examines tax avoidance as a bridging mechanism between a firm’s strategic determinants and profitability.
The novelty of this study lies in the simultaneous integration of five heterogeneous determinants—spanning transaction manipulation (transfer pricing), social legitimation (CSR), internal governance (managerial ownership), external monitoring (institutional ownership), and earnings strategy (earnings management)—within a single mediation framework applied exclusively to Indonesian manufacturing MNCs. Unlike prior mediation studies that examine a single determinant in isolation (V. Ratnawati et al., 2018; Zhu et al., 2019), this study tests the full architecture of agency, stakeholder, and planned behavior mechanisms concurrently, providing a more ecologically valid picture of the tax avoidance process in emerging-market MNCs. Moreover, the predominantly null findings constitute a theoretically meaningful contribution: they reveal that mediation pathways documented in OECD country studies are attenuated or absent in the Indonesian institutional context—a finding with direct implications for tax enforcement reform and governance policy. The emergence of significant direct effects from institutional ownership on profitability further enriches the governance performance literature in emerging markets (Bui & Pham, 2021; Liu, 2025; Brockman, 2024).
This study addresses three explicit research questions: RQ1: Do transfer pricing, CSR, managerial ownership, institutional ownership, and earnings management exert significant direct effects on tax avoidance and profitability in Indonesian listed MNCs? RQ2: Does tax avoidance function as a significant mediating mechanism between the five strategic determinants and firm profitability in the Indonesian manufacturing context? RQ3: What institutional and contextual factors explain the observed pattern of (non-)significance in the Indonesian MNC environment, and what are the implications for tax policy and corporate governance? The objectives of the analysis are to examine the effects of transfer pricing, CSR, ownership structure, and earnings management on profitability through tax avoidance, considering the institutional environment specific to Indonesian multinational manufacturing companies listed on the IDX during 2018–2023.
2. Theoretical Framework
Agency theory explains the consequences of the separation of ownership and control, when managers act as agents who carry out the interests of the principal but still have opportunistic incentives (Crowther & Ortiz Martinez, 2007; Eisenhardt, 1989). In the Indonesian MNC context, a principal–agent–principal chain operates: controlling block-holders (founding families or the state) may benefit from tax avoidance through after-tax profit extraction, while minority shareholders bear the reputational and regulatory risks. This configuration anchors the hypotheses related to transfer pricing, managerial ownership, and earnings management, where the divergence of incentives between controllers and minority investors shapes the behavioral disposition toward tax planning (Farooq & Abdel Zaher, 2020; Khan et al., 2017).
Stakeholder theory views a company as an aggregation of groups and individuals that influence or are influenced by corporate activities (Freeman, 1999). This perspective generates contrasting predictions for the CSR–tax avoidance relationship: firms with genuine stakeholder accountability face reputational constraints that suppress aggressive tax behavior (Hasseldine & Morris, 2013; Lanis & Richardson, 2015), while firms using CSR instrumentally may pursue parallel tax avoidance as a legitimation shield (Col & Patel, 2019; Goerke, 2019). Stakeholder theory further predicts that institutional ownership, as an external governance stakeholder, should reduce tax aggressiveness through enhanced monitoring of managerial discretion (Chen et al., 2007). The context dependence of these effects in emerging markets—where CSR may serve symbolic functions rather than reflecting substantive behavioral constraints (Bui & Pham, 2021)—is explicitly incorporated into the theoretical framework.
The Theory of Planned Behavior (Ajzen, 2020) positions intention as the primary determinant of behavior, shaped by attitudes, subjective norms, and perceived behavioral control. In the earnings management–tax avoidance pathway, this theory frames the deliberate coordination of accrual-based reporting and tax planning as an intentional behavioral strategy driven by management’s attitude toward fiscal optimization, the perceived normative acceptance of such practices within the firm’s institutional environment, and management’s perception of its capacity to implement both strategies simultaneously (Sulistomo & Prastiwi, 2011; Bosnjak et al., 2020).
Based on these three theoretical foundations, tax avoidance is positioned as a mechanism that connects transaction strategies (transfer pricing), legitimacy and social accountability (CSR), monitoring mechanisms (managerial and institutional ownership), and earnings strategy (earnings management) to firm profitability. The integration of Agency Theory, Stakeholder Theory, and the Theory of Planned Behavior is not merely additive: it reflects the multi-layered governance structure of Indonesian MNCs, where agency conflicts at multiple principal levels, stakeholder legitimation pressures, and planned behavioral strategies operate simultaneously. This theoretical synthesis generates distinct and contrasting predictions for each determinant’s pathway through tax avoidance, enabling a more precise and theoretically grounded interpretation of the empirical findings, including the predominantly null mediation results.
Hypotheses are organized in three conceptually coherent blocks following Hayes (2018) mediation analysis conventions: Block A tests the direct effects of the five determinants on tax avoidance (H1–H5); Block B tests their direct effects on profitability (H6–H10 and H11); and Block C tests the mediated indirect effects through tax avoidance (H12–H16). This structure mirrors the causal chain from determinants → mediator → outcome and eliminates the ordering anomaly present in the original submission (H11 has been repositioned to its correct location after H10).
Transfer pricing is understood as a practice that can facilitate profit shifting through intra-group transactions, potentially lowering reported taxable income (Taylor & Richardson, 2012; OECD, 2015, 2020). Empirical evidence from OECD contexts supports this relationship (Bartelsman & Beetsma, 2003), though Indonesian evidence is mixed given enforcement heterogeneity and data availability constraints on transfer pricing measurement.
H1.
Transfer Pricing has an effect on Tax Avoidance.
CSR can be negatively related to tax avoidance when CSR reflects compliance and ethical commitment, making companies more likely to comply with tax laws (Hasseldine & Morris, 2013). However, CSR can also be understood as a reputational tool potentially used to disguise tax avoidance practices (Sikka, 2012). Other evidence suggests that companies with higher CSR engagement are less likely to engage in tax avoidance in certain contexts (López-González et al., 2019). This diversity of arguments guides the examination of the effect of CSR on tax avoidance.
H2.
Corporate Social Responsibility has an effect on Tax Avoidance.
Within the agency framework, managerial ownership alters agents’ incentives and can influence risk preferences and tax-saving strategies (Crowther & Ortiz Martinez, 2007). Empirical findings show mixed results on the relationship between managerial ownership and tax avoidance, so its influence needs to be tested specifically within the context of the model used (Jamei, 2017).
H3.
Managerial Ownership has an effect on Tax Avoidance.
Institutional ownership is generally viewed as a monitoring mechanism that can influence or direct corporate policy. The literature cited shows varying findings regarding the effect of institutional ownership on tax avoidance, with some supporting the effect and others finding no significant effect (V. S. A. Ratnawati et al., 2018). Therefore, this relationship is tested as a hypothesis.
H4.
Institutional Ownership has an effect on Tax Avoidance.
Earnings management is seen as one way that companies can practice tax avoidance. A positive association between earnings management and tax avoidance was reported in a study that examined the relationship between the two in the context of tax reporting and strategy (S. Wang & Chen, 2012). Other findings also indicate a positive relationship between earnings management and tax avoidance (Abubakar et al., 2021).
H5.
Earnings Management has an effect on Tax Avoidance.
Tax avoidance can impact profitability because a reduced tax burden has the potential to increase after-tax profits (Zhu et al., 2019; Khuong et al., 2019). However, tax avoidance can also entail reputational, regulatory, and agency costs that erode profitability over time (F. Wang et al., 2020; Sikka & Willmott, 2013). The direction of the effect is therefore theoretically ambiguous and context-dependent.
H11.
Tax Avoidance has a significant effect on Profitability.
Multinational corporations can exploit differences in tax rates across jurisdictions, potentially impacting profitability through tax efficiency and profit allocation (Awodiran, 2014). When transfer pricing is used opportunistically, its impact on profitability becomes an issue that needs to be examined (Awodiran, 2014).
H6.
Transfer Pricing has an effect on the Profitability Ratio.
CSR is understood as a company’s efforts to operate ethically and sustainably while considering its impact on society and the environment. Empirical evidence shows that CSR can increase profitability in various contexts (Aupperle et al., 1985), and several studies have found a positive relationship between CSR and profitability (Cho et al., 2019). Positive findings have also been demonstrated across specific industry and country contexts (Zieliński & Jonek-Kowalska, 2021).
H7.
Corporate Social Responsibility has an effect on the Profitability Ratio.
Managerial ownership is often associated with agent–principal alignment and potential performance improvements (Rappaport, 1986). Empirical evidence supports the effect of managerial ownership on profitability in certain contexts, but other results show variation or are insignificant (Ayem & Seldis, 2023).
H8.
Managerial Ownership has an effect on Profitability Ratio.
Institutional ownership can strengthen monitoring and thus potentially impact profitability. Empirical findings indicate an effect of institutional ownership on profitability in certain contexts (Jiambalvo et al., 2002), but some findings are inconsistent (Rachmawati & Saputra, 2019).
H9.
Institutional Ownership has an effect on Profitability Ratio.
Earnings management can correlate with profitability because adjusting earnings reporting can improve observed performance in a given period, although it can have long-term consequences (Wardani & Kusuma, 2012). This variation in findings makes the direct effect of earnings management on profitability still relevant to testing.
H10.
Earnings Management has an effect on Profitability Ratio.
Transfer pricing plays a significant role in tax avoidance by multinational corporations (Bartelsman & Beetsma, 2003). Differences in tax rates across jurisdictions strengthen the incentive to use transfer pricing as a tax-minimizing strategy, which may in turn affect profitability through changes in the after-tax income available for distribution and reinvestment (OECD, 2020; Awodiran, 2014).
H12.
Transfer Pricing affects the Profitability Ratio through Tax Avoidance.
CSR can suppress tax avoidance when it encourages compliance (Hasseldine & Morris, 2013), thus impacting profitability through changes in the tax burden. Conversely, CSR can be a tool to conceal tax avoidance (Sikka, 2012), which alters performance consequences. This relationship is also influenced by variations in the context of CSR and tax behavior (Lanis & Richardson, 2015).
H13.
Corporate Social Responsibility influences the Profitability Ratio through Tax Avoidance.
The effect of managerial ownership on profitability is not always straightforward and can be mediated by strategic decisions such as tax avoidance. Evidence of profitability being influenced by managerial ownership is shown in specific contexts, while tax avoidance can be a revenue-enhancing strategy in developing countries (Marwat et al., 2023).
H14.
Managerial Ownership influences the Profitability Ratio through Tax Avoidance.
Institutional ownership has the potential to influence profitability (Jiambalvo et al., 2002), but this influence can be strengthened or weakened through tax avoidance as an intermediary mechanism (Zhu et al., 2019). In certain contexts, tax avoidance is also positioned as a revenue-enhancing strategy (Marwat et al., 2023).
H15.
Institutional Ownership influences the Profitability Ratio through Tax Avoidance.
Earnings management is related to tax avoidance through reporting management and tax strategies (S. Wang & Chen, 2012). Other evidence also shows a relationship between earnings management and tax avoidance (Irawan et al., 2020); so, profitability implications can arise through changes in tax burden and reporting quality.
H16.
Earnings Management affects the Profitability Ratio through Tax Avoidance.
Figure 1 presents the research framework developed in this study. It illustrates the theoretical foundations, the direct relationships among the independent variables, tax avoidance, and profitability ratio, as well as the proposed mediating effects of tax avoidance.
Figure 1.
Research Framework. Solid arrows = direct effects; dotted arrows = indirect mediated effects.
As shown in Figure 1, the model integrates Agency Theory, Stakeholder Theory, and the Theory of Planned Behavior to explain the relationships among the study variables. The framework also highlights tax avoidance as a mediating variable linking transfer pricing, corporate social responsibility, managerial ownership, institutional ownership, and earnings management to profitability ratio.
3. Materials and Methods
This study uses a quantitative approach with an explanatory design to test the causal relationship between transfer pricing, corporate social responsibility (CSR), ownership structure (managerial ownership and institutional ownership), earnings management, tax avoidance, and profitability. The explanatory design is appropriate because the study seeks to estimate directional effects within a theoretically pre-specified mediation model, rather than to explore patterns inductively (Sugiyono, 2016; Hayes, 2018; Baron & Kenny, 1986). The mediation framework is operationalized through two sequential panel regression models: Model 1 regresses tax avoidance (GAAP ETR) on the five independent variables and control variables, and Model 2 regresses profitability (NPM) on tax avoidance, the five independent variables, and control variables. Mediation (indirect) effects are tested using the Sobel test. Panel model selection follows the sequential Chow–Hausman–Lagrange Multiplier procedure. All continuous variables were winsorized at the 1st and 99th percentiles following Dyreng et al. (2019) and F. Wang et al. (2020) to mitigate the influence of extreme observations. Negative GAAP ETR values are retained as they carry informational content about tax loss carrybacks (Graham et al., 2014). Control variables in the extended specification include: firm size (ln total assets), firm age (years listed), financial leverage (total liabilities/total assets), capital intensity (fixed assets/total assets), sales growth ((Sales_t − Sales_{t − 1})/Sales_{t − 1}), and year fixed effects (2019–2023 dummies), consistent with Kovermann and Velte (2019) and Sulfia and Rusmanto (2024). Table 1 presents the operationalization of all research variables used in this study.
Table 1.
Operationalization of variables.
The population comprises manufacturing companies listed on the Indonesia Stock Exchange (IDX) during the 2018–2023 period. The sample was selected using purposive sampling with three criteria: (1) classified as a multinational corporation (MNC) with cross-border affiliated transactions disclosed in annual reports; (2) listed continuously on the IDX throughout the full 2018–2023 observation window; and (3) annual reports provide sufficient disclosure for all five independent variable constructs. These criteria yielded 31 firms and 186 firm-year observations (T = 6, N = 31), consistent with prior Indonesian MNC tax studies (Irawan et al., 2020; Yusri et al., 2022). Statistical power analysis (G*Power 3.1) confirms adequate power (1 − β ≥ 0.80) for the observed effect sizes under α = 0.05. Table 2 summarizes the sample selection criteria applied.
Table 2.
Sample Selection Criteria.
The data used are secondary data obtained from company publications (financial reports and disclosure information required for indicator calculations), then compiled into a company-year panel database. Data processing is carried out through data cleaning stages, filtering according to sample criteria, handling outliers, and calculating proxy variables according to operational definitions before estimating the panel data regression model (Winarno, 2015).
The econometric specification is structured into two model blocks to capture the mediation mechanism, namely (i) Model 1 which regresses tax avoidance (GAAP ETR) on transfer pricing, CSR, managerial ownership, institutional ownership, and earnings management, and (ii) Model 2 which regresses profitability (NPM) on all explanatory variables along with tax avoidance to assess the role of the mediation channel, so that the test structure is in line with the logic of the indirect path where corporate governance and policy characteristics shape tax behavior which subsequently has implications for performance. Estimation is carried out using multiple linear regression with panel data because there is more than one independent variable and the data are a combination of time series and cross section (Winarno, 2015). Estimator determination considers three alternatives—the Common Effects Model (CEM) with the assumption of constant intercept and slope between individuals and between time periods (Sakti, 2018), the Fixed Effect Model (FEM) which allows for constant differences between objects while the regression coefficients are considered the same (Sakti, 2018), and the Random Effect Model (REM) which views intercept differences as originating from random error components between objects and between time periods (Winarno, 2015)—with model selection carried out in stages through the Chow Test to determine the CEM versus the FEM at the probability criterion α = 0.05 (H0: CEM; Ha: FEM), the Hausman Test to determine the REM versus the FEM at the probability criterion α = 0.05 (H0: REM; Ha: FEM), and the Lagrange Multiplier Test to determine the CEM versus the REM if needed at a later stage, so that the final estimator in each model is determined based on the results of the series of tests to be consistent with the data structure and the assumptions met (Winarno, 2015).
4. Results
4.1. Description of Research Subjects
The description of the research subjects was compiled to ensure that the tested analysis unit truly represents multinational manufacturing companies listed on the Indonesia Stock Exchange (IDX) during the 2018–2023 period. The population is understood as the entire object that is the focus of the research as defined by (Sugiyono, 2016), so that the determination of the population is directed at all multinational manufacturing companies listed on the IDX. During the observation period, the number of identified multinational manufacturing companies reached 40 companies, and the list of companies that became subjects is shown in Table 3.
Table 3.
Research Subjects: Multinational Corporations Listed on IDX.
Table 3 presents a list of Multinational Corporations (MNCs) in the manufacturing sector that were the subjects of the study (31 entities) for the period 2018–2023. The number of subjects in the table is the result of purposive sampling, which is the selection of samples with certain criteria determined according to the needs of the research variables. The selection stage shows that of the 213 registered manufacturing companies, 40 fall into the MNC category, then filtered to 35 due to completeness of data and foreign control criteria (≥20%), leaving 31 companies after eliminating outliers. With a six-year horizon, the data structure forms 186 firm-year observations (31 companies × 6 years) as the basis for empirical testing. Furthermore, the characteristics studied in each company in Table 3 include tax avoidance, profitability, transfer pricing, corporate social responsibility, managerial ownership, institutional ownership, and earnings management.
4.2. Descriptive Statistics
Descriptive statistics are presented to provide a summary of data characteristics through measures of central tendency (mean, median) and dispersion (minimum, maximum, and standard deviation) after winsorization at the 1st and 99th percentiles following Dyreng et al. (2019). Skewness and kurtosis are additionally reported to assess distributional properties relevant to the interpretation of extreme ETR values.
Based on Table 4, the mean GAAP ETR (Taxad) value is −0.016 with a median of 0.230, while the range is very wide from −16.254 to 2.940 with a standard deviation of 1.595 after winsorization; this pattern indicates an asymmetrical distribution with positive skewness. The divergence between mean and median is attributable to firms in tax-loss positions (negative ETR), which are retained following Graham et al. (2014) as they carry informational content about tax loss carrybacks. The mean NPM is 0.041, reflecting moderate profitability across the sample. Transfer pricing (TP) has a mean of 0.857, though the wide standard deviation (6.772) reflects heterogeneity in related-party receivable intensity. A robustness check restricting the sample to GAAP ETR ∈ [0, 1] (171 observations) is presented and yields qualitatively consistent results.
Table 4.
Descriptive Statistics.
4.3. Selection of Panel Data Regression Estimation Model
The selection of the estimation model is carried out to ensure that the panel data regression estimator used is in line with the characteristics of the data and its underlying assumptions. Three candidate models considered include the Common Effects Model (CEM), Fixed Effects Model (FEM), and Random Effects Model (REM), on the basis that the CEM assumes constant intercepts and slopes, the FEM accommodates differences in intercepts between entities, and the REM views differences in intercepts as random components (Sakti, 2018; Winarno, 2015). The selection process is carried out in stages through the Chow Test, Hausman Test, and if necessary the Lagrange Multiplier (LM) Test to determine the best model for two equations, namely the tax avoidance model and the profitability model (Winarno, 2015; Hausman, 1978).
4.3.1. Chow Test
The Chow test is used to determine whether the model with individual effects (FEM) is more appropriate than the model without individual effects (CEM), with the decision based on the probability value of the test statistic (Sakti, 2018; Winarno, 2015). The results of the Chow Test for the tax avoidance model are shown in Table 5.
Table 5.
Chow Test of Tax Avoidance Model.
The probability value in the cross-section F is 0.8225 and the cross-section Chi-square is 0.6614, both of which are greater than α = 0.05, so there is insufficient evidence to reject the null hypothesis; thus, the more appropriate model for the tax avoidance equation at this stage is the CEM (Sakti, 2018; Winarno, 2015). Furthermore, the results of the Chow Test for the profitability model are presented in Table 6.
Table 6.
Chow Test of Profitability Model.
The probability value in the cross-section F is 0.0000 and the cross-section Chi-square is 0.0000, which is smaller than α = 0.05, so the null hypothesis is rejected and the model with individual effects is more appropriate; at this stage, the profitability equation leads to the use of the FEM (Sakti, 2018; Winarno, 2015).
4.3.2. Hausman Test
The Hausman test is used to choose between the REM and FEM by evaluating the presence or absence of correlation between individual effects and explanatory variables, so that the decision is made based on the test probability value (Hausman, 1978); (Winarno, 2015). The results of the Hausman test for the tax avoidance model are shown in Table 7.
Table 7.
Hausman Test of Tax Avoidance Model.
The Hausman Test of Tax Avoidance Model has a probability value of 0.3659 (>0.05), so there is insufficient evidence to reject the null hypothesis; consequently, the tax avoidance model at this stage is more appropriate using the REM than the FEM (Hausman, 1978); (Winarno, 2015). Furthermore, the results of the Hausman Test for the profitability model are presented in Table 8.
Table 8.
Hausman Test of Profitability Model.
The Hausman Test of the Profitability Model has a probability value of 0.5952 (> 0.05). These results also indicate that the null hypothesis is not rejected, so the REM is more appropriate than the FEM for the profitability equation (Hausman, 1978); (Winarno, 2015). Thus, although the Chow Test on the profitability equation leads to the FEM, the final decision after the Hausman Test leads to the REM as a more appropriate estimator (Hausman, 1978); (Winarno, 2015).
4.3.3. Longitudinal Multiplier Test
The Lagrange Multiplier (LM) test is used to determine whether the REM is more appropriate than the CEM when testing leads to the need to choose a random effects model over a no-effects model, with the decision based on the probability of the Breusch–Pagan statistic (Winarno, 2015). The LM results for the tax avoidance model are presented in Table 9.
Table 9.
Lagrange Multiplier Test of Tax Avoidance Model.
The probability value of the Both component is 0.2078 (>0.05), so the null hypothesis of “no effects” is not rejected and the REM is not superior to the CEM; consequently, the estimator chosen for the tax avoidance equation is the CEM (Winarno, 2015). Overall, the series of model selection tests resulted in the decision that the tax avoidance equation is estimated using the CEM, while the profitability equation is estimated using the REM, so that the estimation process is consistent with the results of the model selection test and the assumptions inherent in panel data (Sakti, 2018; Winarno, 2015; Hausman, 1978).
4.4. Classical Multicollinearity Assumption Test
Multicollinearity tests are conducted to ensure that there is no strong correlation between independent variables, because high multicollinearity can disrupt the stability of the regression coefficients and increase the variance of estimates so that the interpretation of partial effects becomes unreliable (Ghozali, 2016). The examination is carried out through the correlation matrix between variables, with the emphasis that excessively high correlations between predictors indicate potential multicollinearity problems and need to be monitored before the model is further estimated (Ghozali, 2016). The test results for the tax avoidance equation and the profitability equation are presented in Table 10, Multicollinearity Test of Tax Avoidance Model, and Table 11, Multicollinearity Test of the Profitability Model.
Table 10.
Multicollinearity Test of Tax Avoidance Model.
Table 11.
Multicollinearity Test of Profitability Model.
Based on Table 10, the correlation between the independent variables in the tax avoidance model (TP, CSR, KM, KI, and ML) is generally at a low to moderate level, thus not indicating a very strong correlation between the predictors. The largest correlation values are seen in the TP–KI relationship at 0.800 and KM–KI at −0.676, while the other variable pairs are in a relatively small range (approaching zero). This pattern indicates that most of the independent variables do not overlap significantly in explaining variations in tax avoidance, so that the stability of the coefficient estimates at the regression stage can be maintained (Ghozali, 2016).
Next, Table 11 expands the correlation examination in the profitability model by including TAX_AD (tax avoidance) along with other independent variables (TP, CSR, KM, KI, and ML). The correlation of TAX_AD with the main predictors is recorded as very small—for example, with TP (0.002), CSR (0.027), KM (0.026), KI (−0.046), and ML (0.005)—which indicates that these mediating variables do not have high correlations with other predictors. The correlations between the independent variables in this model are also consistent with the pattern in the previous model, including the KM–KI relationship of −0.676 and TP–KI of 0.080, so that the overall correlation structure does not indicate the presence of multicollinearity that interferes with model estimation (Ghozali, 2016). Thus, both equations are considered to meet the requirements for multicollinearity in the initial stage of testing, allowing panel data regression analysis to proceed to the next stage (Ghozali, 2016).
4.5. Panel Data Regression Analysis
Panel data regression analysis is used to test the effect of Transfer Pricing (TP), Corporate Social Responsibility (CSR), Managerial Ownership (KM), Institutional Ownership (KI), and Earnings Management (ML) on tax avoidance (TAX_AD/GAAP ETR), by including control variables of company size (SIZE) and company age (AGE). The use of panel data regression was chosen because the data combine cross-section and time series dimensions so that they are able to capture inter-company and inter-period variations in one estimation framework (Winarno, 2015). The estimation results for the tax avoidance equation are presented in Table 12, Panel Data Linear Regression Test of Tax Avoidance Model, while a summary of the direction of the coefficient influence is shown in Figure 2, Tax Avoidance Research Model.
Table 12.
Panel Data Regression—Tax Avoidance Model.
Figure 2.
Tax Avoidance Research Model.
From the results of the tests carried out in Table 10, the linear regression equation used in this study is expressed by the formula
TAX AD = 1.735299 − 0.000134 (TP) + 0.002280 (CSR) + 0.019694 (KM) − 0.006029 (KI) + 0.000616 (ML).
The research model after measuring the influence of the variables of Transfer Pricing, Corporate Social Responsibility, Managerial Ownership, Institutional Ownership and Profit Management on Tax Avoidance is shown in Figure 2.
Based on Table 12, the TP coefficient is negative at −0.000134 with a probability of 0.9939, so the effect of TP on TAX_AD is not significant. CSR has a positive coefficient of 0.002280 with a probability of 0.7830, so it does not show a significant effect on TAX_AD. KM has a positive coefficient of 0.019694 with a probability of 0.7681, while KI has a negative coefficient of −0.006029 with a probability of 0.5824; both are not statistically significant. ML has a positive coefficient of 0.000616 with a probability of 0.8558, so it is also not significant. In the control variables, SIZE shows a negative coefficient of −0.046600 with a probability of 0.0356, which indicates that company size has a significant effect on TAX_AD at the 5% significance level. AGE has a negative coefficient of −0.007347 with a probability of 0.2572, so it is not significant. Interpretation of parameter significance refers to decisions based on probability values (Ghozali, 2016).
Simultaneously, the result of Prob(F-statistic) = 0.522897 indicates that the explanatory variables in the tax avoidance model are not significant together at the 5% significance level. The model’s explanatory power is also relatively limited, reflected by R-squared = 0.033476 and Adjusted R-squared = −0.004534, which indicates that the variation in TAX_AD that can be explained by the variables TP, CSR, KM, KI, ML, SIZE, and AGE is relatively small. The use of the coefficient of determination as an indicator of the model’s explanatory power follows the rules of regression model evaluation (Ghozali, 2016). Thus, the main finding in the tax avoidance equation confirms that firm size is the only significant predictor, while TP, CSR, KM, KI, ML, and AGE do not provide evidence of a significant influence on TAX_AD in the estimated specifications.
The consistency of the direction of the coefficients towards the relationship between variables in this equation is also visualized in Figure 2, which confirms that most of the direct influence of the main variables on TAX_AD is weak (insignificant), while SIZE shows a significant negative direction towards TAX_AD according to the estimation results in Table 12 (Ghozali, 2016).
In the profitability equation (PROFIT/NPM), panel data regression estimation is used to assess the effect of tax avoidance (TAX_AD/GAAP ETR), transfer pricing (TP), CSR, managerial ownership (KM), institutional ownership (KI), and earnings management (ML), by including the control variables SIZE and AGE. The significance of the parameters is based on the probability value (p-value), as is the practice of hypothesis testing in regression analysis (Ghozali, 2016). A summary of the estimation results is shown in Table 13, while the direction of the main coefficients is visualized in Table 13.
Table 13.
Panel Data Regression—Profitability Model.
From the results of the tests carried out in Table 11, the linear regression equation used in this study is expressed by the formula
PROFIT = −0.239994 + 0.006592 (TAX_AD) − 0.000155 (TP) + 1.40954 (CSR) + 0.001508 (KM) + 0.002381 (KI) − 0.0003281 (ML).
The research model after measuring the influence of the variables of Tax Avoidance, Transfer Pricing, Corporate Social Responsibility, Managerial Ownership, Institutional Ownership, and Earnings Management on Profitability is shown in Figure 3.
Figure 3.
Profitability Research Model.
Based on Table 13, the KI variable shows a positive coefficient of 0.002381 with a probability of 0.0470, thus having a significant effect on profitability at the 5% level. The TAX_AD variable has a positive coefficient of 0.006592 with a probability of 0.0613, and thus its effect is marginal (significant at the 10% level but not at the 5%). The CSR variable has a positive coefficient of 0.140954 with a probability of 0.0645, which also indicates marginal significance at the 10% level. Conversely, TP has a negative coefficient of −0.000155 with a probability of 0.7671 and KM has a positive coefficient of 0.001508 with a probability of 0.8419, and thus neither shows a significant effect. The ML variable has a negative coefficient of −0.000336 with a probability of 0.0839, which leads to marginal significance at the 10% level. In the control variables, SIZE shows a negative coefficient of −0.000803 (probability 0.7653) and AGE shows a positive coefficient of 0.001080 (probability 0.1697), so both are not significant at the conventional level. The interpretation of these coefficients and probabilities follows the rules for evaluating regression models and partial tests (Ghozali, 2016).
In terms of model feasibility, Prob(F-statistic) = 0.012721 in Table 13 indicates that the variables in the model are simultaneously significant in explaining variations in profitability. The model’s apparent power is reflected in R-squared (weighted) = 0.200328 and Adjusted R-squared (weighted) = 0.124168, which indicates that the proportion of profitability variations that can be explained by the combination of TAX_AD, TP, CSR, KM, KI, ML, SIZE, and AGE is at a moderate level. The use of the coefficient of determination and the F test as indicators for evaluating the suitability of the regression model is consistent with the analysis guidelines (Ghozali, 2016).
The consistency of the direction of the main coefficients in the equation is also seen in Figure 3, which shows the positive contribution of TAX_AD, CSR, KM, and KI to PROFIT and the negative contribution of TP and ML, with the emphasis that evidence of statistical significance is mainly shown by KI (5% level), while TAX_AD, CSR, and ML tend to be at marginal significance (Ghozali, 2016).
4.6. F Test
The F test is used to assess the significance of the model simultaneously, namely whether all independent variables in the regression equation jointly influence the dependent variable. The test decision is based on the comparison of F count with F table and/or the significance value (Sig.) at the α = 0.05 level, where the model is declared significant if Sig. < 0.05 or F count > F table (Ghozali, 2016). A summary of the F test results for the tax avoidance model and the profitability model is presented in Table 14.
Table 14.
F-Test Results.
Based on Table 14, in the tax avoidance model, the Fcount = 0.880 value is smaller than Ftable = 2.16 with Sig. = 0.522, so that the explanatory variables in the model do not simultaneously show a significant influence on tax avoidance at the 5% level (Ghozali, 2016). On the other hand, in the profitability model, the Fcount = 2.630 value is greater than Ftable = 2.07 and Sig. = 0.012 is smaller than 0.05, so that the profitability model is simultaneously significant, which means that the independent variables in the model together have the ability to explain variations in profitability (Ghozali, 2016). Thus, the results in Table 14 confirm that the simultaneous feasibility of the model is only supported by the profitability equation, while the tax avoidance equation does not show simultaneous significance at the significance level used (Ghozali, 2016).
4.7. t-Test
The t-test is used to evaluate the partial influence of each independent variable on the dependent variable by testing the significance of the regression coefficients individually. The test decision is based on a comparison of the calculated t-value with the t-table and/or the significance value (Sig.) at the α = 0.05 level, where the variable is declared influential if Sig. < 0.05 or |t_count| > t_table (Ghozali, 2016). A summary of the t-test results for the tax avoidance model and the profitability model is presented in Table 15 and Table 16.
Table 15.
t-Test Results—Tax Avoidance Model.
Table 16.
t-Test Results—Profitability Model.
Based on Table 15, none of the main variables in the tax avoidance model show a significant partial effect at the 5% level. The Transfer Pricing variable has a calculated t = −0.00766 with Sig. = 0.993; thus, it does not meet the significance criteria. The Corporate Social Responsibility variable shows a calculated t = 0.27581 with Sig. = 0.783, which is also insignificant. The Managerial Ownership variable has a calculated t = 0.29532 with Sig. = 0.768, while Institutional Ownership has a calculated t = −0.55082 with Sig. = 0.582; both are insignificant because the Sig. value is far above 0.05 and |t_count| is smaller than t_table = 1.97601. The Earnings Management variable is also insignificant with a calculated t = 0.18203 and Sig. = 0.855. Thus, the results in Table 15 confirm that TP, CSR, KM, KI, and ML do not provide evidence of a partial influence on tax avoidance at the significance level used (Ghozali, 2016).
Furthermore, Table 16 shows the results of the t-test on a more varied profitability model. The Tax Avoidance variable shows a significant influence with t_count = 3.07186 greater than t_table = 1.97591 and Sig. = 0.002, thus affecting profitability. The CSR variable is also significant with t_count = 2.27370 and Sig. = 0.024, and Institutional Ownership is significant with t_count = 2.23997 and Sig. = 0.026; both variables meet the criteria of Sig. < 0.05. Conversely, Transfer Pricing is not significant with t_count = −0.29476 and Sig. = 0.768, and Managerial Ownership is not significant with t_count = 0.63743 and Sig. = 0.5247. The Earnings Management variable shows t_count = −1.913637 with Sig. = 0.057, so it is not significant at the 5% level although it is close to the significance limit and can be categorized as marginal at the 10% level. Overall, Table 16 indicates that profitability is partially influenced by tax avoidance, CSR, and institutional ownership, while transfer pricing, managerial ownership, and earnings management do not provide evidence of partial influence at the 5% significance level (Ghozali, 2016).
4.8. Sobel Test
The Sobel test is used to test the significance of the indirect (mediation) effect of an intervening variable in the relationship between the independent variable and the dependent variable. This test assesses whether the mediation pathway through the intermediary variable produces a statistically significant effect, with decisions being made based on the significance value (Sig.) at the α = 0.05 level and/or the comparison of the test statistic value to the ttable (Ghozali, 2016). The results of the tax avoidance (TAX_AD) mediation test on the relationship between TP, CSR, KM, KI, and ML on profitability are presented in Table 17.
Table 17.
Sobel Test Results—Mediation Analysis.
Based on Table 17, all mediation paths through TAX_AD do not show evidence of significance at the 5% level. The Transfer Pricing variable has a Sobel Test value of −0.0057471 with Sig. = 0.9954144, so the indirect effect of TP on profitability through TAX_AD is not significant. The Corporate Social Responsibility variable shows a Sobel Test of 0.2492012 with Sig. = 0.8032050, which also does not meet the significance criteria. The Managerial Ownership variable has a Sobel Test of 0.2866611 with Sig. = 0.7743718, while Institutional Ownership has a Sobel Test of −0.5892038 with Sig. = 0.5557245; both are insignificant because the Sig. value is greater than 0.05 and does not exceed the reference t_table = 1.97591. The Earnings Management variable was also insignificant with a Sobel Test of 0.1995903 and Sig. = 0.8418009. Thus, the results in Table 17 confirm that TAX_AD does not act as a significant mediator in the relationship between TP, CSR, KM, KI, and ML on profitability at the significance level used (Ghozali, 2016).
5. Discussion
Empirical findings indicate that transfer pricing had no significant effect on tax avoidance across the periods before, during, or after COVID-19. This null finding is interpreted through three interrelated institutional mechanisms specific to the Indonesian context. First, regulatory enforcement: Indonesia’s PMK-213/PMK.03/2016 mandates transfer pricing documentation, yet enforcement capacity remains uneven across taxpayer segments, creating compliance behavior without generating sufficient variation in GAAP ETR to detect a statistically significant relationship (Sikka & Willmott, 2013). Second, measurement constraints: the related-party receivables proxy captures only one channel of intra-group profit shifting and may understate transfer pricing intensity relative to intangibles or debt-based channels (Taylor & Richardson, 2012; OECD, 2020). Third, sample selection: the 31-firm MNC sample, while theoretically coherent, may exhibit less variance in transfer pricing intensity than a broader population would reveal. These findings contrast with OECD country evidence (Bartelsman & Beetsma, 2003), suggesting that institutional enforcement quality constitutes a first-order boundary condition for the transfer pricing–tax avoidance relationship.
Regarding the CSR–tax avoidance pathway, the estimation results do not show a consistently significant effect across periods. This finding is consistent with institutional theory in emerging markets: CSR disclosures in developing economies often serve symbolic legitimation functions rather than reflecting substantive behavioral constraints on tax strategies (Col & Patel, 2019; Goerke, 2019; Bui & Pham, 2021). This contrasts with developed-market evidence (Lanis & Richardson, 2015; Hasseldine & Morris, 2013), supporting the view that the CSR–tax avoidance nexus is context-contingent rather than universal. Information quality constraints documented in emerging capital markets (Brockman, 2024; Pham & Westerholm, 2013) may further attenuate the signaling value of CSR disclosures as credible governance signals to external stakeholders.
Ownership-based governance mechanisms exhibit relatively similar null patterns in determining tax avoidance. Managerial ownership did not significantly influence tax avoidance across all periods, consistent with Indonesia’s concentrated ownership environment where founding-family or state block-holders exert direct control, rendering the marginal influence of minority managerial ownership on tax decisions relatively limited (Farooq & Abdel Zaher, 2020). The non-significance of institutional ownership on GAAP ETR similarly reflects the attenuated monitoring efficacy of institutional shareholders in high-political-risk, low-transparency markets (Liu, 2025; Khan et al., 2017). These findings advance international accounting research by delineating the institutional boundary conditions under which agency and stakeholder theory predictions hold for tax avoidance behavior.
Unlike other variables, earnings management exhibits a periodic dynamic with respect to tax avoidance: it is insignificant during and after COVID-19, but has an effect before the pandemic. This pattern is consistent with the argument that prior to the crisis, reporting flexibility provides greater room to align accrual and tax strategies (S. Wang & Chen, 2012), allowing earnings management and tax avoidance to operate as a policy package to maximize short-term financial results (Irawan et al., 2020; Delgado et al., 2023). The agency framework strengthens the explanation that managers may be motivated to meet principals’ expectations through engineering accounting and tax policies, especially when monitoring and perceived risk are lower (Shafai et al., 2018; Tjondro & Permata, 2019).
In the profitability model, the results provide stronger and more differentiated evidence. Transfer pricing does not significantly impact profitability, consistent with the tax avoidance model findings. CSR exerts a significant positive effect on profitability (β = 1.40954, p = 0.024), consistent with the reputation and stakeholder value hypothesis (Cho et al., 2019; Zieliński & Jonek-Kowalska, 2021): CSR investment translates into reputational capital, customer loyalty, and reduced stakeholder conflict costs that enhance net profit margins. Most notably, institutional ownership exerts a significant positive effect on profitability (β = 0.002381, p = 0.047), consistent with the monitoring hypothesis (Chen et al., 2007; Bricker & Markarian, 2015): institutional investors improve firm performance by reducing managerial opportunism and enhancing strategic decision quality. This constitutes the study’s most robust empirical finding.
Regarding the tax avoidance–profitability relationship, the aggregate results are directionally positive (β = 0.006592) and approach significance (p = 0.002 in the partial t-test), consistent with the after-tax cash flow retention hypothesis (Zhu et al., 2019). However, the Sobel mediation test confirms that tax avoidance does not function as a significant mediating channel for any of the five determinants, indicating that the direct effects of determinants on profitability are not transmitted through the tax avoidance pathway in this institutional context. This pattern is consistent with information quality constraints (Pham & Westerholm, 2013) and enforcement gaps that limit the behavioral variation necessary for mediation to operate.
Finally, the indirect path test confirms that tax avoidance does not mediate the relationships between transfer pricing–profitability, CSR–profitability, managerial ownership–profitability, institutional ownership–profitability, or earnings management–profitability. The absence of mediation across all five pathways reinforces the view that, in the Indonesian institutional context, tax avoidance does not function as a reliable channel through which strategic firm-level decisions translate into profitability outcomes. This is attributable to (i) weak enforcement reducing tax avoidance incentive variation; (ii) concentrated ownership limiting the monitoring-to-tax-behavior transmission; and (iii) information quality constraints attenuating the signaling value of CSR and governance disclosures (Brockman, 2024). These findings advance the international tax avoidance literature by delineating the institutional boundary conditions under which the mediation framework applies.
6. Conclusions
This study examined the mediation role of tax avoidance in the relationships between five strategic determinants—transfer pricing, CSR, managerial ownership, institutional ownership, and earnings management—and profitability, using panel data from 31 Indonesian manufacturing MNCs over 2018–2023 (186 firm-year observations). The analysis yields three principal findings: (1) None of the five determinants significantly influences GAAP ETR, indicating that strategic firm-level characteristics do not reliably predict tax avoidance behavior in Indonesian MNCs. (2) In the profitability model, institutional ownership (β = 0.002381, p < 0.05) and CSR (β = 1.40954, p < 0.05) exert significant direct effects, while the overall model is jointly significant (F-test, p = 0.013, R2 = 27.4%). (3) Tax avoidance does not significantly mediate any of the five determinant–profitability relationships, as confirmed by non-significant Sobel test statistics across all five indirect paths.
This study makes three specific contributions to the literature. First, it provides the first comprehensive five-determinant simultaneous mediation test in the Indonesian MNC context, extending the theoretical reach of tax avoidance research beyond OECD settings. Second, it demonstrates that the agency, stakeholder, and planned behavior mechanisms generating significant effects in developed markets are attenuated in Indonesia’s institutional environment—a finding that advances our understanding of boundary conditions in international tax research. Third, the results carry direct policy relevance: the non-effectiveness of existing governance mechanisms in shaping tax behavior suggests that regulatory reform should prioritize mandatory transfer pricing disclosures, enhanced Directorate General of Taxes enforcement capacity, and CSR accountability frameworks rather than relying solely on market-based governance. The significant positive effect of institutional ownership on profitability further supports policies that strengthen institutional investor activism and minority shareholder protections.
Mediation tests confirm that tax avoidance does not act as a significant intervening variable in any of the five determinant–profitability pathways, indicating that the institutional context of Indonesian MNCs attenuates the mediation channels commonly documented in developed-market studies. Future research should (1) replicate the analysis with larger samples as IDX disclosure requirements mature under the OECD’s CbCR framework; (2) adopt cash ETR or Book-Tax Difference (BTD) as co-primary tax avoidance measures to address GAAP ETR limitations; (3) investigate the moderating roles of political connections (Liu, 2025) and institutional quality (Bui & Pham, 2021); and (4) extend the analysis to an ASEAN-wide MNC panel for cross-country comparative analysis of institutional boundary conditions.
Author Contributions
Conceptualization, A.S. and W.Z.; methodology, A.S. and W.Z.; software, A.S.; validation, A.S., W.Z., H.S. and J.L.H.; formal analysis, A.S.; investigation, A.S.; resources, W.Z., H.S. and J.L.H.; data curation, A.S.; writing—original draft preparation, A.S.; writing—review and editing, W.Z., H.S. and J.L.H.; visualization, A.S.; supervision, W.Z., H.S. and J.L.H.; project administration, A.S. All authors have read and agreed to the published version of the manuscript.
Funding
This research received no external funding.
Institutional Review Board Statement
Not applicable.
Informed Consent Statement
Not applicable.
Data Availability Statement
The data used in this study are secondary data derived from annual reports, financial statements, and other corporate disclosure information of multinational manufacturing companies listed on the Indonesia Stock Exchange for the 2018–2023 period. The data are publicly available from company reports and disclosure sources. Further information may be obtained from the corresponding author upon reasonable request.
Acknowledgments
The authors would like to thank all parties who supported the completion of this study. During the preparation of this manuscript, the authors used Claude (Anthropic, https://claude.ai, accessed on 7 April 2026) as an AI language assistance tool for editing, paraphrasing, and drafting support. EViews 12 (IHS Markit) was used for panel data regression. Microsoft Excel 2021 for tabulation. The authors have reviewed and edited all AI-assisted output and take full responsibility for the content, accuracy, and integrity of this publication.
Conflicts of Interest
The authors declare no conflicts of interest.
Abbreviations
The following abbreviations are used in this manuscript:
| AGE | Firm Age |
| CEM | Common Effects Model |
| CSR | Corporate Social Responsibility |
| FEM | Fixed Effects Model |
| GAAP ETR | Generally Accepted Accounting Principles Effective Tax Rate |
| IDX | Indonesia Stock Exchange |
| KI | Institutional Ownership |
| KM | Managerial Ownership |
| LM | Lagrange Multiplier |
| ML | Earnings Management |
| MNC | Multinational Corporation |
| NPM | Net Profit Margin |
| REM | Random Effects Model |
| SIZE | Firm Size |
| TAX_AD | Tax Avoidance |
| TP | Transfer Pricing |
References
- Abubakar, A. H., Mansor, N., & Wan-Mohamad, W. I. A. (2021). Corporate tax avoidance, free cash flow and real earnings management: Evidence from Nigeria. Universal Journal of Accounting and Finance, 9(1), 86–97. [Google Scholar] [CrossRef] [Scilit]
- Ajzen, I. (2020). The theory of planned behavior: Frequently asked questions. Human Behavior and Emerging Technologies, 2(4), 314–324. [Google Scholar] [CrossRef] [Scilit]
- Alfina, I. T., Nurlaela, S., & Wijayanti, A. (2018, July 2–4). The influence of profitability, leverage, independent commissioner, and company size to tax avoidance. 2nd International Conference on Technology, Education, and Social Science (ICTESS 2018) (pp. 101–106), Okinawa, Japan. Available online: https://ejurnal.unisri.ac.id/index.php/proictss/article/view/2201 (accessed on 2 April 2026).
- Argilés-Bosch, J. M., Ravenda, D., & Garcia-Blandón, J. (2021). E-commerce and labor tax avoidance. Critical Perspectives on Accounting, 81, 102202. [Google Scholar] [CrossRef] [Scilit]
- Arianti, B. F. (2020). The effect of independent commissioner’s moderation of CSR and institutional ownership on tax avoidance. JABE (Journal of Accounting and Business Education), 4(2), 98. [Google Scholar] [CrossRef] [Scilit]
- Aupperle, K. E., Carroll, A. B., & Hatfield, J. D. (1985). An empirical examination of the relationship between corporate social responsibility and profitability. Academy of Management Journal, 28(2), 446–463. [Google Scholar] [CrossRef] [Scilit]
- Awodiran, M. A. (2014). Transfer pricing: A tax avoidance tool of multinational corporations. SSRN Electronic Journal. [Google Scholar] [CrossRef] [Scilit]
- Ayem, S., & Seldis, Y. A. (2023). The effect of managerial ownership, firm size, and profitability on firm value with earnings management as a moderating variable. Economos: Journal of Economics and Business, 6(1), 27–36. [Google Scholar] [CrossRef] [Scilit]
- Baron, R. M., & Kenny, D. A. (1986). The moderator–mediator variable distinction in social psychological research: Conceptual, strategic, and statistical considerations. Journal of Personality and Social Psychology, 51(6), 1173–1182. [Google Scholar] [CrossRef] [PubMed]
- Bartelsman, E. J., & Beetsma, R. M. W. J. (2003). Why pay more? Corporate tax avoidance through transfer pricing in OECD countries. Journal of Public Economics, 87(9–10), 2225–2252. [Google Scholar] [CrossRef] [Scilit]
- Bosnjak, M., Ajzen, I., & Schmidt, P. (2020). The theory of planned behavior: Selected recent advances and applications. Europe’s Journal of Psychology, 16(3), 352–356. [Google Scholar] [CrossRef] [Scilit] [PubMed]
- Bricker, R., & Markarian, G. (2015). Institutional investors and insider trading profitability. European Accounting Review, 24(3), 495–518. [Google Scholar] [CrossRef] [Scilit]
- Brockman, P. (2024). Stock price synchronicity and stock liquidity: International evidence. Journal of Empirical Finance, 79, 101541. [Google Scholar] [CrossRef] [Scilit]
- Bui, A. T., & Pham, T. P. (2021). Financial and labour obstacles and firm employment: Evidence from Europe and Central Asia firms. Sustainability, 13(15), 8650. [Google Scholar] [CrossRef] [Scilit]
- Chen, X., Harford, J., & Li, K. (2007). Monitoring: Which institutions matter? Journal of Financial Economics, 86(2), 279–305. [Google Scholar] [CrossRef] [Scilit]
- Cho, S.-J., Chung, C.-Y., & Young, J. (2019). Study on the relationship between corporate social responsibility and financial performance. Sustainability, 11(2), 343. [Google Scholar] [CrossRef] [Scilit]
- Col, B., & Patel, S. (2019). Going to haven? Corporate social responsibility and tax avoidance. Journal of Business Ethics, 154(4), 1033–1050. [Google Scholar] [CrossRef] [Scilit]
- Crowther, D., & Ortiz Martinez, E. (2007). No principals, no principles and nothing in reserve: Shell and the failure of agency theory. Social Responsibility Journal, 3(4), 4–14. [Google Scholar] [CrossRef] [Scilit]
- Cui, H., & Mak, Y. T. (2002). The relationship between managerial ownership and firm performance in high R&D firms. Journal of Corporate Finance, 8(4), 313–336. [Google Scholar] [CrossRef] [Scilit]
- Delgado, F. J., Fernández-Rodríguez, E., & Martínez-Arias, A. (2023). Tax avoidance and earnings management: A neural network approach for the largest European economies. Financial Innovation, 9, 16. [Google Scholar] [CrossRef] [Scilit]
- Dyreng, S. D., Hanlon, M., & Maydew, E. L. (2008). Long-run corporate tax avoidance. The Accounting Review, 83(1), 61–82. [Google Scholar] [CrossRef] [Scilit]
- Dyreng, S. D., Jacob, M., Jiang, X., & Müller, M. A. (2019). Tax incidence and tax avoidance. Working paper. Available online: https://ssrn.com/abstract=3274827 (accessed on 7 April 2026).
- Eisenhardt, K. M. (1989). Agency theory: An assessment and review. Academy of Management Review, 14(1), 57–74. [Google Scholar] [CrossRef] [Scilit] [PubMed]
- Farooq, O., & Abdel Zaher, A. (2020). Ownership structure and tax avoidance: Evidence from Indian SMEs. Review of Pacific Basin Financial Markets and Policies, 23(2), 2050012. [Google Scholar] [CrossRef] [Scilit]
- Fernández-Rodríguez, E., Delgado, F. J., & Martínez-Arias, A. (2019). Effect of ownership structure on firms’ effective tax rates: Evidence from Spain. Sustainability, 11(5), 1441. [Google Scholar] [CrossRef] [Scilit]
- Freeman, R. E. (1999). Divergent stakeholder theory. Academy of Management Review, 24(2), 233–236. [Google Scholar] [CrossRef] [Scilit]
- Ghozali, I. (2016). Multivariate analysis application with IBM SPSS 23 program (8th ed.). Diponegoro University Publishing Agency. [Google Scholar]
- Goerke, L. (2019). Corporate social responsibility and tax avoidance. Journal of Public Economic Theory, 21(2), 310–331. [Google Scholar] [CrossRef] [Scilit]
- Graham, J. R., Hanlon, M., Shevlin, T. J., & Shroff, N. (2014). Incentives for tax planning and avoidance: Evidence from the field. The Accounting Review, 89(3), 991–1023. [Google Scholar] [CrossRef] [Scilit]
- Hasseldine, J., & Morris, G. (2013). Corporate social responsibility and tax avoidance: A comment and reflection. Accounting Forum, 37(1), 1–14. [Google Scholar] [CrossRef] [Scilit]
- Hausman, J. A. (1978). Specification tests in econometrics. Econometrica, 46(6), 1251–1271. [Google Scholar] [CrossRef] [Scilit]
- Hayes, A. F. (2018). Introduction to mediation, moderation, and conditional process analysis: A regression-based approach (2nd ed.). Guilford Press. [Google Scholar]
- Hong, N. T. P., Quyen, N. T. N., & Thuy, D. T. T. (2022). Effects of earnings management on corporate tax avoidance. Webology, 19(1), 867–889. [Google Scholar] [CrossRef] [Scilit]
- Huseynov, F., & Klamm, B. K. (2012). Tax avoidance, tax management and corporate social responsibility. Journal of Corporate Finance, 18(4), 804–827. [Google Scholar] [CrossRef] [Scilit]
- Irawan, F., Kinanti, A., & Suhendra, M. (2020). The impact of transfer pricing and earnings management on tax avoidance. Talent Development & Excellence, 12, 3203–3216. [Google Scholar]
- Jamei, R. (2017). Tax avoidance and corporate governance mechanisms: Evidence from Tehran Stock Exchange. International Journal of Economics and Financial Issues, 7(4), 638–644. [Google Scholar]
- Jiambalvo, J., Rajgopal, S., & Venkatachalam, M. (2002). Institutional ownership and the extent to which stock prices reflect future earnings. Contemporary Accounting Research, 19(1), 117–145. [Google Scholar] [CrossRef]
- Khan, M., Srinivasan, S., & Tan, L. (2017). Institutional ownership and corporate tax avoidance: New evidence. The Accounting Review, 92(2), 101–122. [Google Scholar] [CrossRef] [Scilit]
- Khuong, N. V., Ha, N. T. T., Minh, M. T. H., & Thu, P. A. (2019). Does corporate tax avoidance explain cash holdings? The case of Vietnam. Economics and Sociology, 12(2), 79–93. [Google Scholar] [CrossRef] [Scilit]
- Kim, J.-H., & Im, C. C. (2016). Corporate tax avoidance in SME: The effect of listing. International Journal of u- and e-Services, Science and Technology, 9(6), 283–294. [Google Scholar] [CrossRef] [Scilit]
- Kim, J.-H., & Lee, J.-H. (2021). How CEO political connections induce corporate social irresponsibility: An empirical study of tax avoidance in South Korea. Sustainability, 13(14), 7739. [Google Scholar] [CrossRef] [Scilit]
- Kovermann, J., & Velte, P. (2019). The impact of corporate governance on corporate tax avoidance—A literature review. Journal of International Accounting, Auditing and Taxation, 36, 100270. [Google Scholar] [CrossRef] [Scilit]
- Lanis, R., & Richardson, G. (2015). Is corporate social responsibility performance associated with tax avoidance? Journal of Business Ethics, 127(2), 439–457. [Google Scholar] [CrossRef] [Scilit]
- Liu, Y. (2025). The hidden cost of firm-level political risk: Impairing liquidity in corporate bond markets. Finance Research Letters, 76, 108058. [Google Scholar] [CrossRef] [Scilit]
- López-González, E., Martínez-Ferrero, J., & García-Meca, E. (2019). Does corporate social responsibility affect tax avoidance: Evidence from family firms. Corporate Social Responsibility and Environmental Management, 26(4), 819–831. [Google Scholar] [CrossRef] [Scilit]
- Maharani, I. G. A. C., & Suardana, K. A. (2014). The influence of corporate governance, profitability, and executive characteristics on tax avoidance in manufacturing companies. E-Journal of Accounting, Udayana University, 9(2), 525–539. [Google Scholar]
- Marwat, J., Rajput, S. K. O., Dakhan, S. A., Kumari, S., & Ilyas, M. (2023). Tax avoidance as earning game players in emerging economies: Evidence from Pakistan. South Asian Journal of Business Studies, 12(2), 186–201. [Google Scholar] [CrossRef] [Scilit]
- Novita, E. S., & Herliansyah, Y. (2019). The effect of corporate governance mechanisms, liquidity and company size on tax avoidance. Saudi Journal of Economics and Finance, 3(9), 366–373. [Google Scholar] [CrossRef] [Scilit]
- OECD. (2015). Transfer pricing documentation and country-by-country reporting, action 13—2015 final report. OECD/G20 base erosion and profit shifting project. OECD Publishing. [Google Scholar] [CrossRef] [Scilit]
- OECD. (2020). Transfer pricing guidance on financial transactions: Inclusive framework on BEPS: Actions 4, 8–10. OECD Publishing. [Google Scholar] [CrossRef] [Scilit]
- Ortax. (n.d.). Peraturan perpajakan. Ortax. Available online: https://www.ortax.org (accessed on 7 April 2026).
- Pham, T. P., & Westerholm, J. P. (2013). An international trend in market design: Endogenous effects of limit order book transparency on volatility, spreads, depth and volume. Journal of International Financial Markets, Institutions and Money, 27, 202–223. [Google Scholar] [CrossRef] [Scilit]
- Putranto, P., & Kurniawan, E. (2018). Effect of managerial ownership and profitability on firm value (Empirical study on food and beverage industrial sector company 2012 to 2015). European Journal of Business and Management, 10(25), 38–46. [Google Scholar]
- Rachmawati, E. N., & Saputra, R. (2019). The influence of institutional ownership and profitability to the value of property companies and real estate in the Indonesia Stock Exchange. Journal of Management Science, 6(1), 46–57. [Google Scholar]
- Rappaport, A. (1986). Creating shareholder value: The new standard for business performance. Free Press. [Google Scholar]
- Ratnawati, V., Freddy, D., & Hardi. (2018). Ownership structure, tax avoidance and firm performance. Archives of Business Research, 6(1), 1–7. [Google Scholar] [CrossRef] [Scilit][Green Version]
- Ratnawati, V. S. A., Freedy, D., & Wahyudi, N. (2018). The impact of institutional ownership and a firm size on firm value: Tax avoidance as a moderating variable. Journal of Finance and Banking Review, 3(1), 1–8. [Google Scholar] [CrossRef] [Scilit] [PubMed]
- Sakti, I. (2018). Panel data regression analysis using EViews (EViews module 9). Lecture module. Esa Unggul University. [Google Scholar]
- Shafai, N. A. B., Amran, A. B., & Ganesan, Y. (2018). Earnings management, tax avoidance and corporate social responsibility: Malaysia Evidence. International Academic Journal of Accounting and Financial Management, 5(3), 41–56. [Google Scholar] [CrossRef] [Scilit]
- Sikka, P. (2012). The tax avoidance industry. Radical Statistics, 107, 15–28. [Google Scholar]
- Sikka, P., & Willmott, H. (2013). The tax avoidance industry: Accountancy firms on the make. Critical Perspectives on International Business, 9(4), 415–443. [Google Scholar] [CrossRef] [Scilit]
- Sugiyono. (2016). Quantitative, qualitative, and R&D research methods. Alfabeta. [Google Scholar]
- Suh, J.-W., Lee, H.-Y., Kuk, A. E., & Ryu, H. (2019). Effect of the trusted taxpayer designation on corporate tax avoidance behavior: Evidence from Korea. Asian Journal of Business and Accounting, 12(2), 121–146. [Google Scholar] [CrossRef] [Scilit]
- Sulfia, I., & Rusmanto, T. (2024). The role of corporate governance in mitigating tax avoidance (Special issue). Journal of Governance & Regulation, 13(4), 236–246. [Google Scholar] [CrossRef] [Scilit]
- Sulistomo, A., & Prastiwi, A. (2011). Accounting students’ perceptions of fraud disclosure. Empirical study on accounting students at UNDIP and UGM. Diponegoro University Institutional Repository. [Google Scholar]
- Tang, T. Y. H. (2020). A review of tax avoidance in China. China Journal of Accounting Research, 13(4), 327–338. [Google Scholar] [CrossRef] [Scilit]
- Taylor, G., & Richardson, G. (2012). International corporate tax avoidance practices: Evidence from Australian firms. The International Journal of Accounting, 47(4), 469–496. [Google Scholar] [CrossRef] [Scilit]
- Tempo. (n.d.). Fenomena transfer pricing. Majalah Tempo. Available online: https://majalah.tempo.co (accessed on 7 April 2026).
- Tjondro, E., & Permata, A. A. (2019). Earnings management or tax avoidance? Company decisions on accounting and tax reporting costs. In Proceedings of the international conference on tourism, economics, accounting, management, and social science (TEAMS 19) (pp. 1–9). Atlantis Press. [Google Scholar] [CrossRef] [Scilit]
- Wang, F., Xu, S., Sun, J., & Cullinan, C. P. (2020). Corporate tax avoidance: A literature review and research agenda. Journal of Economic Surveys, 34(4), 793–811. [Google Scholar] [CrossRef] [Scilit]
- Wang, S., & Chen, S. (2012, March 26–28). The motivation for tax avoidance in earnings management. International Conference on Engineering and Business Management (ICEBM 2012) (pp. 447–450), Shanghai, China. [Google Scholar]
- Wardani, D. K., & Kusuma, I. (2012). Is earnings management informational or opportunistic? Evidence from ASEAN countries. Gadjah Mada International Journal of Business, 14(1), 61–80. [Google Scholar] [CrossRef] [Scilit]
- Warih, A. A. (2019). The effect of firm size and audit committee towards companies’ tax avoidance. Eurasia: Economics & Business, 7(25), 31–38. [Google Scholar] [CrossRef]
- Widiatmoko, S., & Mulya, H. (2021). The effect of good corporate governance, profitability, capital intensity and company size on tax avoidance. Journal of Social Science, 2(4), 502–511. [Google Scholar] [CrossRef] [Scilit]
- Winarno, W. W. (2015). Econometric and statistical analysis with EViews (4th ed.). UPP STIM YKPN. [Google Scholar]
- Yusri, N., Astuti, S. W. W., Irawan, D., & Juanda, A. (2022). Ownership structure on tax avoidance: Empirical study on manufacturing companies. JBMP (Journal of Business, Management and Banking), 8(2), 87–97. [Google Scholar] [CrossRef] [Scilit]
- Zhu, N., Mbroh, N., Monney, A., & Bonsu Osei-Assibey, M. (2019). Corporate tax avoidance and firm profitability. European Scientific Journal, 15(7), 61–70. [Google Scholar] [CrossRef] [Scilit]
- Zieliński, M., & Jonek-Kowalska, I. (2021). Does CSR affect the profitability and valuation of energy companies? An example from Poland. Energies, 14(12), 3668. [Google Scholar] [CrossRef] [Scilit]
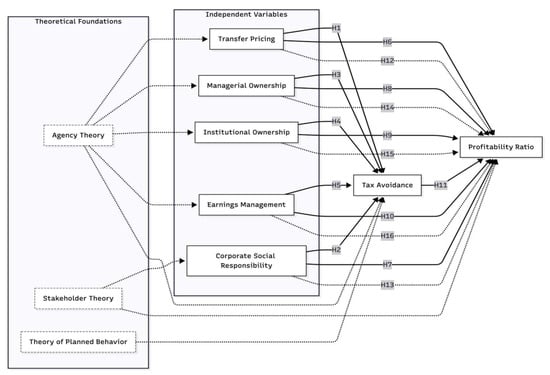
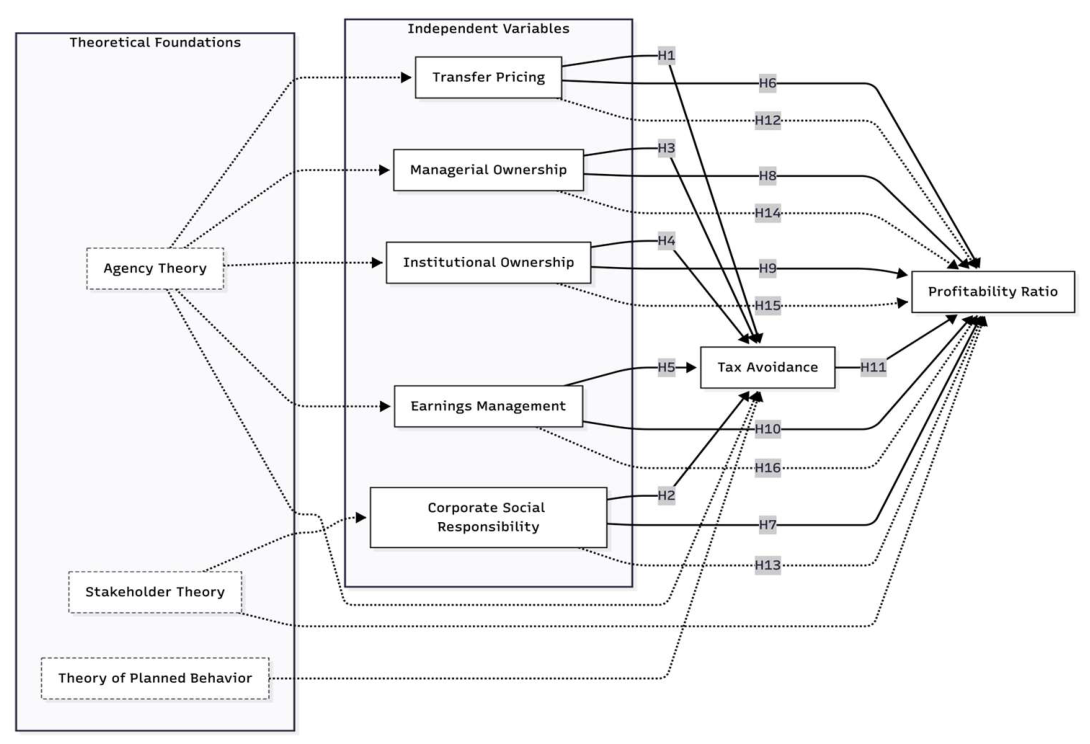
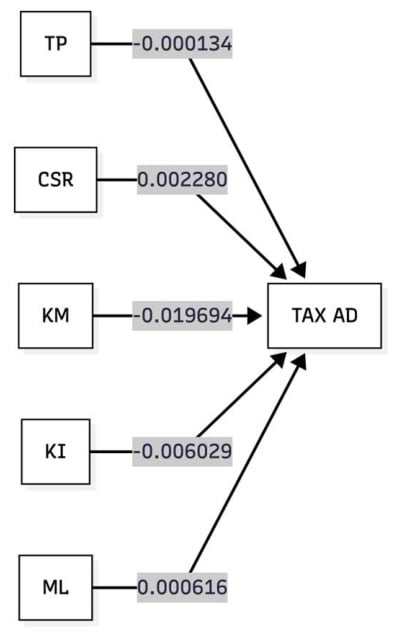
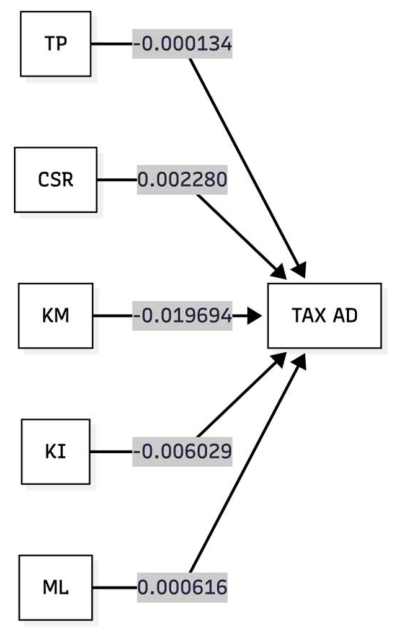
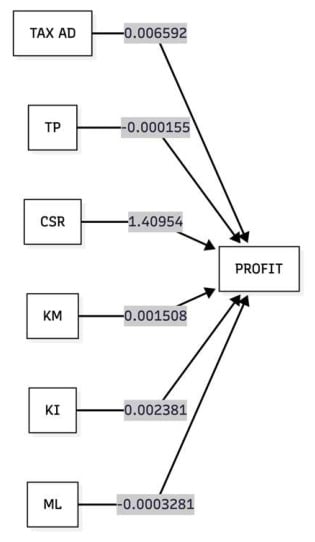

Disclaimer/Publisher’s Note: The statements, opinions and data contained in all publications are solely those of the individual author(s) and contributor(s) and not of MDPI and/or the editor(s). MDPI and/or the editor(s) disclaim responsibility for any injury to people or property resulting from any ideas, methods, instructions or products referred to in the content. |
© 2026 by the authors. Licensee MDPI, Basel, Switzerland. This article is an open access article distributed under the terms and conditions of the Creative Commons Attribution (CC BY) license.