


Abstract
The film industry presents one of the most capital-intensive and financially uncertain environments within cultural markets. While prior research has predominantly measured success through box office revenue, return on investment (ROI) offers a more meaningful lens for producers and investors operating under conditions of extreme distributional skewness and limited predictability. This study examines which observable film- and audience-related characteristics determine whether a film generates above- or below-median ROI, using a dataset of 3153 films drawn from The Movie Database (TMDB, 1916–2017). Drawing on ensemble learning methods and SHAP-based decomposition to identify the direction and magnitude of variable effects, the study compares Random Forest, XGBoost, and CatBoost models, with Random Forest achieving the strongest predictive performance. We find that audience engagement volume, proxied by total vote count, is the strongest signal of realised investment efficiency in the classification framework, ranking ahead of production budget and content characteristics; in a continuous-outcome robustness check, the ordering of engagement and budget is reversed, so that the two emerge as the joint leading predictors while their relative rank depends on the specification. Because engagement metrics become observable only after theatrical release, the framework is explanatory rather than pre-release predictive in nature and speaks primarily to post-release investment decisions. SHAP analysis further indicates non-linear threshold effects, suggesting that audience engagement and production budget influence investment outcomes differently across value ranges. In the fitted model, the contribution of production budget diminishes beyond an approximate log-budget value corresponding to 25 million USD, a pattern indicating that higher expenditure is associated with lower investment efficiency within this sample rather than a causally identified turning point. Genre, by contrast, contributes relatively little to investment outcomes once audience visibility and financial scale are accounted for. These findings have implications for the economics of cultural markets: financial performance in film appears at least as strongly tied to audience reach as to production scale, and more strongly than to content type, which qualifies budget-centric investment heuristics prevalent in the industry.
1. Introduction
The film industry has long occupied a distinct position in cultural economics research as an investment environment in which standard competitive market conditions—predictable demand, stable cost–return relationships, and symmetric information—break down in systematic ways. De Vany and Walls (1999) demonstrated that box office revenues exhibit effectively infinite variance, suggesting that the notion of a “typical” film carries little financial meaning. Rosen (1981) showed that in certain economic activities, output tends to concentrate among a small number of producers, income distributions exhibit pronounced right-skewness, and rewards at the top grow disproportionately large. This superstar economics framework finds its counterpart in the motion picture industry, where a handful of exceptional productions appear to capture a disproportionate share of both audience attention and financial returns. Caves (2003) argued that cultural industries are shaped by the contractual arrangements between creative talent and ordinary inputs, and that demand uncertainty is a structural rather than incidental feature of these markets. Hadida (2009) similarly found that success in the motion picture industry operates simultaneously across commercial, artistic, and sociological dimensions, complicating financial prediction. When these distributional properties are combined with large-scale sunk costs and irreversible production expenditures, film investment emerges as one of the more analytically demanding domains within cultural economics (Eliashberg et al., 2006; Filson, 2026).
One question that remains incompletely resolved in film economics research concerns the relationship between financial scale and investment efficiency. The existing literature has leaned heavily on box office revenue as the primary measure of commercial success, yet revenue taken in isolation does not account for the production expenditure that generated it. A film with substantial gross receipts may still deliver poor returns to its investors if the underlying budget was proportionally large. Ravid (1999), in one of the few studies to examine ROI directly, found that the signals producers and investors typically rely on, budget and star power, failed to reliably predict investment returns. Yoong Hon and Yen (2023) extended this line of inquiry to ancillary markets, with comparable findings on budget and investment efficiency. Patrocínio et al. (2024) raised a related methodological concern, showing that conclusions about financial performance can shift depending on how ROI is defined.
A second unresolved question concerns the relative weight of audience engagement metrics compared to content characteristics in shaping investment outcomes. The spread of digital platforms has made audience interaction data (ratings, vote counts, engagement scores) observable at a scale that was previously unavailable, yet the relationship between these metrics and financial returns in cultural markets remains incompletely understood. Liu (2006) identified word-of-mouth volume, independent of tone, as a key audience-driven signal for box office performance. Duan et al. (2008) identified a similar self-reinforcing dynamic between engagement volume and sales performance. Castillo et al. (2021) confirmed similar engagement effects across different national market contexts.
A review of the existing literature points to several gaps that motivate the present study. First, the majority of studies evaluate commercial success through box office revenue, with limited attention paid to return on investment as a performance measure that is arguably more meaningful from an investor’s perspective. Second, while the associations between film performance and variables such as production budget, critical reviews, online engagement, and social media indicators have been examined in various combinations, no clear consensus has emerged on which factors most reliably account for investment success. Third, existing work has concentrated largely on linear relationships and predictive accuracy, leaving non-linear effects and potential threshold values in investment outcomes relatively underexplored. Finally, despite the growing use of machine learning methods in film performance research, the economic mechanisms underlying model predictions and their theoretical implications for cultural markets have received limited attention. The question of whether investment success in cultural product markets is more closely tied to production scale or to audience attention and engagement therefore remains open.
This study addresses these questions by examining the determinants of film-level ROI using a sample of 3153 films spanning the period 1916–2017. Rather than treating financial prediction as an end in itself, the analysis is framed as a means of identifying which observable characteristics are associated with above- or below-median investment returns, and how these associations vary across different value ranges. Because several of the variables examined, most notably audience engagement metrics, become observable only after theatrical release, the study is explicitly explanatory rather than pre-release predictive in orientation: the objective is to identify the characteristics that distinguish films with high and low realised investment efficiency, not to forecast returns at the greenlighting stage. Ensemble learning algorithms and SHAP-based variable decomposition are employed as analytical instruments for uncovering the economic mechanisms at work; the contribution of this study lies not in the methodological tools themselves but in what they reveal about the economics of film investment.
The study makes four contributions to the cultural economics literature. First, it shifts the outcome measure from box office revenue, which has dominated film success research, to return on investment, and adopts a median-based binary classification framework that directly addresses the extreme distributional skewness documented by De Vany and Walls (1999), thereby extending Ravid’s (1999) foundational ROI analysis with substantially larger data and more recent analytical tools. Second, it establishes that audience engagement volume stands alongside production budget as a leading signal of investment efficiency on a cost-normalised outcome measure, ranking first in the classification framework and second in the continuous specification. This is a stronger test than the revenue-based associations reported in the word-of-mouth literature, since attention is itself partly financed by expenditure and its explanatory standing would be expected to attenuate once returns are normalised by cost. Third, it identifies non-linear threshold effects that linear specifications cannot recover: in the fitted model, the estimated contribution of production budget declines across the upper part of the budget range and becomes negative in the region corresponding to roughly 25 million USD, while audience engagement contributes sharply above a comparatively modest volume of accumulated attention, so that scale and attention operate in opposite directions across their respective ranges.
2. Literature Review
The financial structure of the film industry exhibits characteristics that sit uneasily with standard investment theory. De Vany and Walls (1999), drawing on a sample of over 2000 motion pictures, found that box office revenues follow an asymptotic Pareto distribution with effectively infinite variance. This distributional form, in which the mean is dominated by a small number of exceptional productions, suggests that constructing a meaningful expectation of typical performance in film investment is statistically untenable. Eliashberg et al. (2006), in a broad review of research in the field, noted that the motion picture industry encompasses a wide range of unresolved analytical problems spanning demand forecasting, distribution strategy, and beyond, while also observing that the richness of available data makes this industry an unusually fertile ground for financial analysis at the individual project level. Hadida (2009), synthesising film performance research published between 1977 and 2006, found that success in the motion picture industry operates simultaneously across commercial, artistic, and sociological dimensions, and that the production structure theorised by Caves (2003) through the concept of “humdrum inputs” appears to deepen rather than resolve this underlying uncertainty.
The limitations of revenue-based analysis in this uncertain environment have received growing recognition. Basuroy et al. (2003), analysing eight weeks of box office data, found that critics played both an influencing and a predictive role, that negative reviews carried stronger effects than positive ones, and that high production budgets appeared to serve a protective function only for films receiving unfavourable critical responses. This suggests that the signalling argument, whereby budget size functions as a quality guarantee, may hold only under specific conditions. Ravid (1999), examining ROI directly using a sample of films produced in the 1990s, found that neither production budget nor star power reliably predicted investment returns, and that the informational content of the signals on which producers and investors typically rely appeared to be considerably more variable than commonly assumed. Lauria and Phillips (2021) argued that a return-oriented rather than revenue-oriented framework is necessary for film investment to be evaluated in terms comparable to other asset classes. Along similar lines, Kim et al. (2020) positioned ROI as a more appropriate performance measure for film investment decisions, while Patrocínio et al. (2024) showed that conclusions about financial performance can shift substantially depending on how ROI is defined and computed, underscoring the importance of definitional consistency in comparative analyses. Yoong Hon and Yen (2023), focusing on ancillary markets, found that higher-budget productions tended to underperform lower-budget counterparts on investment efficiency metrics despite their advantage in absolute sales volumes. Given the pronounced right-skewness of the ROI distribution and the asymmetric influence of a small number of exceptional performers, a binary classification framework may offer a more statistically tractable approach than continuous dependent variable modelling (Filson, 2026; e Souza et al., 2023).
Early systematic attempts to forecast film financial performance relied primarily on regression-based statistical methods, though the identification of areas where these approaches fell short contributed to a gradual shift towards machine learning classification frameworks. A significant turning point in this transition was the work of Sharda and Delen (2006), who moved away from the point estimation approach that had dominated film research and instead classified films into nine categories ranging from flop to blockbuster based on box office revenue ranges. Testing their neural network model using 10-fold cross-validation, they both established a methodological benchmark and demonstrated the applicability of classification approaches to film performance prediction. Ghiassi et al. (2015), employing a dynamic artificial neural network in the pre-release period, incorporated variables including budget, advertising expenditure, runtime, and seasonality, and achieved meaningful improvements in predictive accuracy relative to existing methods. Mahmud et al. (2020) noted that only 36% of films released in the United States between 2000 and 2010 recovered their production costs through box office revenue, and compared logistic regression, support vector machines, and multilayer perceptron models across success categories. Lash and Zhao (2016) structured profitability prediction around the questions of who, what, and when, examining how different types of pre-release information, including cast, subject matter, and release timing, contribute to early-stage investment decisions.
The advantages of ensemble learning methods in this context have received growing empirical support. Ahmad et al. (2020b), in a systematic review covering 36 relevant studies, found that regression and classification approaches dominated the literature, with multiple linear regression and support vector machines among the most frequently used techniques. Lee et al. (2020), using a sample of 1439 films, found that decision tree ensembles—including random forests, bagging, and boosting variants—outperformed both k-nearest neighbour and linear regression-based ensemble methods in predicting box office revenue across multiple post-release windows. e Souza et al. (2023), using inflation-adjusted profit as the dependent variable across a sample of 3167 films, compared Random Forest, support vector machines, and neural networks, and found that Random Forest consistently produced the strongest results across different sampling strategies. Ni et al. (2022) evaluated multi-model ensemble approaches, while Tang (2024) assessed an optimised XGBoost model in the context of box office forecasting, with both studies suggesting that these algorithms can achieve competitive performance on large and complex datasets. Leukel et al. (2026) argued that the primary challenge in this domain lies not in data availability but in constructing variables with sufficient predictive content to drive model performance.
The role of social media engagement and online discourse in shaping film financial performance has attracted considerable research attention. Liu (2006), analysing more than 12,000 messages from Yahoo Movies discussion boards, found that word-of-mouth volume carried meaningful explanatory power for both weekly and cumulative box office revenue, while the valence of that communication, whether positive or negative, contributed comparatively little additional explanatory value. Moul (2007) estimated the effect of word-of-mouth on theatrical admissions econometrically, finding that approximately 10% of the variation in consumer expectations could be attributed, directly or indirectly, to the spread of information, and that this information reached consumers relatively quickly. Dellarocas et al. (2007) developed diffusion models integrating online review metrics into film revenue forecasting and found that these metrics improved predictive accuracy when used alongside pre-release marketing variables and professional critical assessments, suggesting that online audience engagement may carry informational content beyond what traditional variables capture. Duan et al. (2008) modelled the relationship between word-of-mouth volume and box office revenues using a dynamic simultaneous equations system, finding evidence of a self-reinforcing dynamic whereby engagement volume and sales performance appeared to mutually reinforce one another, independently of content quality assessments. Castillo et al. (2021), using a sample of 966 films released in the United Kingdom and Spain, found that both personal and interactive social media engagement were positively associated with opening-week revenues, and that these effects appeared to amplify one another. Elberse and Eliashberg (2003) showed that film attributes and advertising expenditure tended to influence revenues indirectly through exhibitors’ screen allocation decisions rather than directly, pointing to the potential endogeneity of audience engagement variables in this setting. Fan et al. (2021), drawing on signal theory and a sample of 80 Chinese films, found that internal signals, star and director power, appeared more influential during the opening week, while eWOM volume tended to be more determinative in subsequent weeks. Eliashberg and Shugan (1997) found that critical reviews were not meaningfully associated with early box office performance but were strongly related to later and cumulative revenues, suggesting that critics may function more as leading indicators of underlying quality than as active shapers of audience behaviour, and that quality signals may offer more limited immediate predictive relevance compared to engagement volume. Uncertainty regarding the non-linear and time-dependent patterns through which these variables relate to film revenue nonetheless persists in the literature (McKenzie, 2023; Ahmad et al., 2020a).
As the predictive accuracy of machine learning models has improved, the interpretability of their decision-making mechanisms has become an increasingly prominent concern in the research agenda. Arrieta et al. (2020), in a comprehensive examination of the explainable artificial intelligence field spanning concepts, taxonomies, and applications, systematically categorised model-agnostic and post hoc interpretability techniques and argued that these techniques constitute a prerequisite for responsible and trustworthy AI deployment. The SHAP framework (Lundberg & Lee, 2017), grounded in Shapley values from cooperative game theory, decomposes each variable’s contribution to an individual prediction in terms of both direction and magnitude, thereby supporting both global and local interpretability. Mammadov et al. (2025) noted that while machine learning models have improved predictive accuracy in film profitability research, the interpretability gap remains a substantial unresolved limitation in this area, and proposed a multi-layered explainability framework combining XGBoost, CatBoost, and artificial neural network models with SHAP, permutation feature importance, and feature importance ranking measure techniques. Behrens et al. (2021), drawing on conceptual frameworks spanning script analytics, talent analytics, and audience analytics, observed that the integration of data-driven approaches into film production decisions remains an emerging rather than mature area of practice. In the present study, SHAP analysis is applied to interpret the predictive mechanism of the Random Forest model at the variable level, decompose the direction and magnitude of individual effects, and identify potential threshold values in the relationships between predictors and investment outcomes.
3. Materials and Methods
3.1. Dataset
This study draws on a publicly available film dataset compiled from The Movie Database (TMDB) and accessed through the Kaggle platform (https://www.kaggle.com/datasets/tmdb/tmdb-movie-metadata; accessed on 19 March 2026). The raw dataset covers 4803 films released between 1916 and 2017. Following data cleaning and preprocessing, the final sample comprises 3153 films; the steps involved in this process are described in detail in Section 3.2. The dependent variable is return on investment (ROI), a measure that expresses the gain generated by an investment relative to its cost (Phillips, 1998; Botchkarev & Andru, 2011). ROI is calculated by subtracting the production budget from total box office revenue to obtain net profit, and then dividing this figure by the production budget.
ROI is a relative performance measure indicating the extent to which an investment generates profit, expressed as a return relative to the initial cost of that investment (Botchkarev & Andru, 2011; Phillips, 1998). Compared to absolute revenue measures, ROI more accurately reflects the financial efficiency of productions that achieve high gross receipts but carry proportionally large production costs (Kim et al., 2020; Lauria & Phillips, 2021). The independent variables were selected on the basis of empirical findings in the film economics literature. The genre variable was incorporated into the model using binary coding, given that a single film may belong to multiple categories simultaneously. The eight genres included—Action, Adventure, Comedy, Crime, Drama, Horror, Science Fiction, and Thriller—were selected as the categories with the highest representation in the dataset and sufficient thematic distinctiveness from one another. Table 1 presents the variables included in the analysis, along with their descriptions and corresponding measurement units.
Table 1.
Description and measurement of variables.
3.2. Data Preprocessing
The 4803 observations in the raw dataset were filtered on an incremental basis according to specific eligibility criteria, with the aim of improving the reliability and economic meaningfulness of the analysis. Only films with positive values for both production budget and box office revenue were retained, and observations in which either of these variables fell below 1000 USD were excluded from the analysis. This threshold was adopted to limit the distorting influence of non-commercial amateur productions and records assessed as containing erroneous data entries on ROI calculations. Following these filtering and data quality checks, the final sample comprised 3153 films.
Preliminary analyses indicated that the budget, popularity, runtime, and vote_count variables exhibited pronounced positive skewness. To address this distributional issue, a natural logarithmic transformation [ln(x)] was applied to each of these variables. Natural log transformation is a widely used preprocessing technique for normalising right-skewed financial and count variables; it reduces the disproportionate influence of extreme values on model predictions and has been applied in comparable film performance research (e Souza et al., 2023).
Although ROI is a continuous variable, it exhibited extreme right-skewness in the dataset (skewness coefficient: 54.998). Given the highly skewed nature of film revenue distributions, which are known to follow a Pareto-like structure (De Vany & Walls, 1999; Sharda & Delen, 2006), estimating precise ROI values is difficult. For this reason, ROI was converted into a binary classification problem for the purposes of modelling. Observations were assigned to one of two classes- low ROI or high ROI- using a median threshold calculated from the training data. Similar binarisation approaches have been employed in the film profitability literature (e Souza et al., 2023). To guard against data leakage, the median threshold was calculated exclusively from the training set and applied without modification to the test set. In addition, to evaluate the impact of the binary classification approach on the findings, an extra Random Forest regression analysis was performed using the continuous values of the ROI. This analysis served as a robustness check to assess whether different definitions of the dependent variable altered the obtained findings.
The dataset was partitioned into training (80%) and test (20%) subsets to allow evaluation of generalisation performance. A fixed random seed was used in the partitioning process to ensure reproducibility. All analyses were conducted in R. The following packages were used in the preprocessing and modelling stages: caret, randomForest (Liaw & Wiener, 2002), xgboost (Chen & Guestrin, 2016), catboost (Prokhorenkova et al., 2018), pROC (Robin et al., 2011), and fastshap (Greenwell, 2024).
3.3. Machine Learning Algorithms
Prediction problems relating to the financial performance of film investments have remained difficult to model using standard statistical methods, given their tendency to involve non-linear relationships, high variance, and complex variable interactions (De Vany & Walls, 1999; Eliashberg et al., 2006). In response to these challenges, machine learning algorithms have found growing application in film research, and the effectiveness of classification-based approaches in this context has been documented from early studies onwards (Sharda & Delen, 2006; Ghiassi et al., 2015). The present study employs Random Forest, XGBoost, and CatBoost for the ROI classification task. While all three belong to the ensemble learning family, they differ in their learning mechanisms, regularisation strategies, and variance-bias trade-offs. Evaluating the three algorithms together allows for a comparative assessment of predictive performance across models with different structural properties, rather than committing to a single model selection.
3.3.1. Random Forest
Random Forest is an ensemble learning method developed by Breiman (2001) that combines a large number of decision trees. Each tree is constructed independently on a different bootstrap sample, and in classification tasks the final prediction is determined by majority vote across all trees. Because each node split is based on a randomly selected subset of variables, the correlation among trees is reduced and the model’s resistance to overfitting is strengthened. As the number of trees increases, the generalisation error converges to a limit, and this structure allows the algorithm to produce more stable predictions compared to individual decision trees (Breiman, 2001).
Random Forest’s capacity to model non-linear relationships and complex variable interactions supports strong performance on datasets characterised by high variance and skewness. Its contribution to classification problems in the film domain has been documented in several studies: Lee et al. (2020) found that decision tree ensembles tended to offer more balanced predictive performance than k-nearest neighbour and linear regression-based methods, while e Souza et al. (2023) reported that Random Forest outperformed both support vector machines and neural networks in film profit classification. Yan (2025) similarly identified vote count and budget as the dominant predictors in a comparable machine learning framework. The selection of this algorithm in the present study was informed by the expectation that Random Forest’s robustness to noise and outliers would offer a meaningful advantage given the high variance and extreme skewness of the ROI variable. The algorithm also produces variable importance scores through MeanDecreaseAccuracy and MeanDecreaseGini criteria, a feature that supports variable-level interpretation of the predictive mechanism.
3.3.2. XGBoost
XGBoost (Extreme Gradient Boosting) is a high-performance and scalable gradient boosting algorithm developed by Chen and Guestrin (2016). The method improves predictive performance incrementally by adding new decision trees at each iteration in a way that minimises the residual errors of the preceding model. Through this sequential learning mechanism, the algorithm is able to progressively capture non-linear relationships and complex variable interactions.
A key feature distinguishing XGBoost from other gradient boosting implementations is the regularisation term incorporated directly into the objective function. This term penalises model complexity and thereby limits the risk of overfitting, while additional mechanisms such as shrinkage and column subsampling further strengthen generalisation performance (Chen & Guestrin, 2016). The effectiveness of XGBoost in predicting film financial performance has been supported by several studies. Tang (2024) found that an optimised XGBoost model performed competitively among alternative approaches in a box office forecasting context, while Yan (2025) similarly identified vote count and budget as the dominant predictors in a comparable machine learning framework. Mammadov et al. (2025), comparing XGBoost against CatBoost and artificial neural networks in a film profitability prediction task, found that the algorithm produced strong accuracy values. The selection of XGBoost in the present study was informed by the expectation that its built-in regularisation mechanisms and capacity to capture non-linear interactions would offer advantages given the high variance and extreme values present in the ROI variable.
3.3.3. CatBoost
CatBoost (Categorical Boosting) is an ensemble learning algorithm developed by Prokhorenkova et al. (2018) that operates within the gradient boosting framework. The algorithm improves predictive performance incrementally by combining decision trees in sequence, and is distinguished from other gradient boosting implementations primarily by two features.
The first is its approach to handling categorical variables. Whereas standard gradient boosting implementations typically convert categorical variables into numerical form through external preprocessing steps such as one-hot encoding, CatBoost performs this conversion internally in a manner designed to prevent target leakage. This reduces the risk of information leakage that could otherwise compromise classification accuracy in film datasets where categorical variables such as genre are prominent. The second distinguishing feature is Ordered Boosting. In this approach, the residual error for each observation is computed using only the observations that precede it in the sequence, which minimises prediction shift during training and strengthens the model’s generalisation performance (Prokhorenkova et al., 2018).
While the use of CatBoost in film performance prediction is a relatively recent development, Mammadov et al. (2025), comparing XGBoost, CatBoost, and an artificial neural network, reported that CatBoost achieved balanced and consistent classification performance. The selection of CatBoost in the present study was informed by the categorical structure of the genre variables in the dataset and the algorithm’s built-in capacity to handle such variables.
3.4. Model Evaluation Metrics
Evaluating the performance of classification models requires a multidimensional approach that considers contextual factors such as data distribution and error costs, rather than relying on a single metric (Fawcett, 2006; Hossin & Sulaiman, 2015). Although the median-based binary ROI classification used in this study produces a relatively balanced class distribution, multiple complementary performance measures were employed in recognition of the fact that different error types may carry different costs in investment decision contexts.
The metrics used are derived from the confusion matrix, which summarises the relationship between model predictions and actual class labels through four components: true positives (TP), true negatives (TN), false positives (FP), and false negatives (FN). Accuracy reflects the overall proportion of correct classifications, though it may produce misleading results when used in isolation on imbalanced datasets. Recall (sensitivity) indicates the proportion of actual positive observations correctly identified, while specificity reflects the proportion of actual negative observations correctly classified. Precision measures the proportion of predicted positive observations that are genuinely positive, and the F1 score evaluates overall classification performance as the harmonic mean of precision and recall (Hossin & Sulaiman, 2015). Balanced accuracy accounts for performance across both classes by averaging sensitivity and specificity, which is particularly relevant in investment decision contexts where different error types may carry asymmetric costs (Brodersen et al., 2010).
ROC (Receiver Operating Characteristic) curves and AUC values were also used to assess the discriminative performance of the models. The ROC curve plots the relationship between the true positive rate and the false positive rate across different classification thresholds. The AUC value reflects the model’s ability to rank a randomly selected positive observation above a randomly selected negative one, with values approaching 1 indicating stronger discriminative performance (Fawcett, 2006; Hossin & Sulaiman, 2015).
3.5. SHAP Analysis
SHAP (SHapley Additive exPlanations), grounded in Shapley values from cooperative game theory, is a unified interpretability approach that assigns each variable an individual contribution score for a given prediction (Lundberg & Lee, 2017).
SHAP is widely used for interpreting algorithms with black-box properties, including Random Forest, XGBoost, and CatBoost. While these tree-based algorithms are capable of capturing non-linear relationships and complex variable interactions, their predictive mechanisms are not directly interpretable. SHAP addresses this by decomposing variable contributions in terms of both direction and magnitude. The method indicates not only the relative importance of each variable but also whether its effect on a given prediction is positive or negative.
In the present study, SHAP analysis was applied to the Random Forest model, which achieved the strongest classification performance in the model comparison. This allowed for an examination of not only the relative importance of variables but also the direction, magnitude, and value-range variation in their contributions to ROI classification. Two visualisation tools were used. The SHAP summary plot presents the global importance ranking of variables alongside the distribution of SHAP values across observations, capturing both the direction and magnitude of each variable’s contribution. The SHAP dependence plot illustrates the marginal effect of a given variable on model predictions across different value ranges and allows for an examination of how interactions between variables are reflected in predictions. Used together, these two visualisations supported a detailed analysis of variable effect directions, magnitudes, and potential interaction patterns.
4. Results
This section presents the findings on the ROI classification performance of the Random Forest, XGBoost, and CatBoost algorithms. Descriptive statistics for the dataset are presented first, followed by the model performance comparison, variable importance analysis, and SHAP-based interpretation findings.
Table 2 reports descriptive statistics for the variables used in the study. Despite a median ROI of 1.30, the maximum value reaches 8,499,999, and the standard deviation is exceptionally large (SD = 152,535.30), consistent with the extreme right-skewness (skewness coefficient: 54.998) that motivated the median-based binary classification approach described in Section 3.2. Descriptive statistics for all variables used in the study are presented in Table 2.
Table 2.
Descriptive statistics.
4.1. Model Performance Comparison
The performance of Random Forest, XGBoost, and CatBoost on the ROI classification task was compared using AUC, accuracy, recall (sensitivity), specificity, precision, F1 score, and balanced accuracy. Results are presented in Table 3.
Table 3.
Model performance comparison metrics.
Random Forest demonstrated superior overall classification performance compared with the other algorithms. Balanced results across different performance metrics indicate that the model does not favour a particular class but instead distinguishes between high- and low-ROI films with comparable success. This finding suggests that Random Forest provides a more balanced and reliable prediction framework for ROI classification.
While XGBoost exhibited strong discriminative performance, it demonstrated a relatively balanced ability to classify both high- and low-ROI films. Although its overall performance remained below that of Random Forest, it achieved a stable trade-off between sensitivity and specificity.
CatBoost produced a relatively balanced performance profile but remained consistently below Random Forest across all evaluation metrics.
The ROC curves for all three models are presented comparatively in Figure 1. All models lie above the diagonal reference line (represented by the grey dashed line) representing random classification, suggesting meaningful discriminative capacity with respect to the ROI classes. Random Forest’s ROC curve maintains a more consistent distance from the diagonal across different threshold values, pointing to a more stable sensitivity–specificity balance across classification scenarios.
Figure 1.
Comparison of ROC curves of the models.
Following the comparative evaluation of the three algorithms, Random Forest demonstrated the strongest overall classification performance and was selected for further stability assessment. Repeated 10-fold cross-validation with five repetitions was subsequently conducted on the training set to assess the robustness of the selected model. AUC served as the primary optimisation metric, with sensitivity and specificity reported alongside it. Table 4 presents the average performance metrics obtained across all folds and repetitions.
Table 4.
Repeated 10-fold cross-validation results for the random forest model.
As shown in Table 4, the Random Forest model yielded a mean AUC of 0.8247 across the repeated 10-fold cross-validation procedure, with relatively low variation across resamples (SD = 0.0226). The sensitivity and specificity estimates were also broadly comparable to those obtained from the hold-out test-set evaluation. Overall, the consistency of the performance estimates across the cross-validation and hold-out test-set evaluations provides additional evidence of the stability of the Random Forest model.
4.2. Random Forest Variable Importance Analysis
The contribution of each variable to ROI classification in the Random Forest model was assessed using the MeanDecreaseAccuracy and MeanDecreaseGini criteria. Results are presented in Table 5.
Table 5.
Results of random forest variable importance analysis.
Table 5 shows that the vote_count_log variable is the most important predictor according to both variable importance criteria. This finding indicates that the total number of votes, representing audience engagement, plays a more important predictive role in ROI classification compared to production budget, popularity, and content attributes.
The budget_log variable is among the most important predictors according to both variable importance measures. However, the difference in its relative ranking across the two variable importance measures suggests that the relationship between production budget and ROI may be more complex than that of the other variables. This nonlinear relationship is examined in more detail through SHAP analysis in Section 4.3.
popularity_log ranks third in the variable importance analysis. This finding suggests that a film’s visibility and level of audience interest on online platforms are closely associated with its ROI classification. While vote_average also contributes to ROI classification, its predictive relevance is more limited than that of vote_count_log and popularity_log.
runtime_log exhibited moderate variable importance, whereas the genre variables generally showed the lowest importance values. Although the relative ranking of the genre variables varied slightly between the two importance measures, they consistently ranked below the numerical variables. This finding suggests that audience engagement and visibility indicators carry greater predictive relevance for ROI classification than content-related characteristics.
4.3. SHAP Analysis and Examination of Variable Effects
SHAP analysis was applied to examine the predictive mechanism of the Random Forest model at the variable level. The SHAP summary plot is presented in Figure 2.
Figure 2.
SHAP Summary Plot.
Figure 2 indicates that vote_count_log, budget_log, and popularity_log exhibit the widest SHAP value distributions in relation to model predictions, in that order. This ranking is consistent with the variable importance analysis results presented in Section 4.2. SHAP values for the genre variables are largely concentrated around zero, while runtime_log shows low variation. This pattern suggests that numerical audience engagement metrics may carry substantially more predictive information for ROI classification than content-based variables.
The marginal effects of variables across different value ranges and potential threshold values were examined through SHAP dependence plots, the results of which are presented in Figure 3. In these plots, the red curves represent LOESS (Locally Estimated Scatterplot Smoothing) non-parametric regression trend lines, illustrating the nonlinear relationship between feature values and their corresponding SHAP values.
Figure 3.
SHAP dependence plots and the effects of variables on ROI.
budget_log: SHAP values remain limited at low budget levels and move into positive territory across mid-range budget values. Around a log value of 17.03 (corresponding to roughly 25 million USD), SHAP values begin to decline and eventually become negative. This pattern indicates that the fitted model assigns a less positive contribution to ROI predictions at higher budget levels. When the interaction with vote_count_log is examined, higher audience engagement appears to be associated with more positive SHAP values for budget.
vote_count_log: The SHAP dependence plot indicates a marked change in the contribution of vote count to the model predictions. Beyond an approximate threshold of 6.2 on the log scale- corresponding to roughly 493 votes- SHAP values rise sharply into positive territory. This positive effect is more pronounced in films with high popularity scores, and this interaction is effectively captured by the fitted model.
popularity_log: This variable exhibits a positive and non-linear association with ROI. Around a log value of 3.09 (corresponding to approximately 22 popularity points), SHAP values begin to shift into positive territory, indicating that the fitted model assigns increasingly positive contributions to ROI predictions as popularity increases.
vote_average: SHAP values tend to be negative at lower rating levels. Above an approximate threshold of 6.4 out of 10, SHAP values become predominantly positive, though the rate of increase appears to slow at higher rating values. This pattern indicates that higher audience ratings receive increasingly positive SHAP contributions in the fitted model.
runtime_log: The concentration of SHAP values largely around zero suggests that film runtime contributes relatively little to the fitted model’s predictions. Mild negative effects were observed in the mid-length range, though the overall SHAP variation for this variable remains low.
4.4. Robustness Analysis Using Continuous ROI
To assess the robustness of the findings, an additional Random Forest regression model was constructed using continuous ROI as the dependent variable. Since the continuous ROI variable exhibited substantial right skewness, a natural logarithmic transformation, ln(1 + ROI), was applied prior to the analysis to reduce the influence of extreme values and improve the distributional properties of the outcome variable. The results regarding model performance are presented in Table 6.
Table 6.
Metrics of Random Forest Regression Analysis.
As shown in Table 6, the performance of the Random Forest regression model was evaluated using the coefficient of determination (R2), Root Mean Squared Error (RMSE), and Mean Absolute Error (MAE), with RMSE and MAE providing complementary measures of prediction error. The R2 value of 0.403 indicates that the model explains a moderate proportion of the variation in the log-transformed ROI. To evaluate whether using ROI as a binary or continuous outcome variable affects the variable importance ranking, the variable importance rankings obtained from the classification and regression models were compared. Since the classification and regression models use different permutation-based variable importance measures (Mean Decrease Accuracy and %IncMSE, respectively), the comparison focuses on the relative ranking of the predictors rather than numerical importance values. The rankings obtained for each method for the top five variables are given in Table 7.
Table 7.
Comparison of the five most important predictors identified by the Random Forest classification and regression models.
Table 7 shows that the most important predictors in both models consist of the same variables. Only the positions of the budget_log and vote_count_log variables in the top two positions have changed, indicating that the relative contribution of these two variables to the model can show small differences depending on the modelling approach. However, the fact that the most important predictors generally remain consistent supports the robustness of the study’s findings against treating ROI as a binary or continuous outcome variable.
5. Discussion
The model performance findings of this study broadly support the effectiveness of ensemble learning methods in film investment classification and are consistent with patterns documented in the existing literature. Random Forest outperformed both XGBoost and CatBoost on the classification task, a result in line with prior findings on the relative advantages of decision tree ensembles on structured data problems of this kind (Lee et al., 2020; e Souza et al., 2023). The economic interpretation of this performance matters more than its magnitude. In an industry characterised by structurally limited financial predictability (De Vany & Walls, 1999), the fact that a small set of observable variables separates above- and below-median ROI films with meaningful accuracy indicates that uncertainty in cultural markets is not entirely random and that investment outcomes retain at least some systematic structure. Equally informative is where the models fail: XGBoost identified high-ROI films almost without exception but classified low-ROI films poorly at the default threshold, meaning that the observable characteristics examined here distinguish commercial success more sharply than they distinguish commercial failure. This asymmetry is itself substantively meaningful for investors, since it is exposure to loss rather than participation in success that governs portfolio construction in hit-driven industries, and it suggests that threshold optimisation or class weighting would be a necessary calibration step before any applied use of such a model.
The most striking finding of the variable importance and SHAP analyses is that audience engagement volume represented by vote_count_log ranks first among all variables in the classification framework, with SHAP values rising sharply into positive territory beyond an approximate threshold of 493 votes. From a cultural markets perspective, this suggests that audience participation may function not only as an indicator of demand but also as a leading signal of investment success. Liu (2006) found that word-of-mouth volume, independent of whether its content was positive or negative in tone, served as the primary audience-driven signal for box office performance, while Duan et al. (2008) identified a self-reinforcing dynamic between engagement volume and sales performance. Moul’s (2007) econometric estimate that roughly 10% of consumer expectation variation traces back to information diffusion lends further support to this pattern. The present findings suggest that this dynamic may extend beyond the revenue level to the level of investment returns. Viewed through the lens of information asymmetry and signalling theory in cultural economics, this pattern suggests that traditional quality signals circulating among producers and distributors- including genre, cast, and critical ratings- may carry comparatively weaker predictive relevance than audience visibility. Fan et al. (2021) similarly found that external signals tended to outweigh internal ones in post-opening periods, while Castillo et al. (2021) confirmed the positive association between audience engagement and box office revenues across different market contexts. Dellarocas et al. (2007) reached a similar conclusion using diffusion models that incorporated online review metrics into revenue forecasting. Viewed through Rosen’s (1981) superstar economics framework, the top ranking of vote_count_log is perhaps unsurprising: the concentration of audience attention on a small number of productions, and the disproportionate shaping of financial returns by that concentration, is a defining feature of cultural markets. Elberse and Eliashberg’s (2003) finding on exhibitors’ screen allocation decisions points to a similar two-way relationship between performance and audience accessibility.
An important qualification concerns the temporal availability of the variables that emerge as the strongest signals in this analysis. Both vote count and popularity are recorded after theatrical release, and ROI is likewise realised ex post. The framework developed here should therefore be understood as an explanatory decomposition of realised investment outcomes rather than as a pre-release forecasting instrument. Of the variables examined, only production budget, runtime, and genre are known at the greenlighting stage, whereas audience engagement metrics become observable only as demand realises itself in the market. This distinction carries direct implications for how the findings should be used. The practical relevance of the engagement finding lies less in ex ante project selection than in decisions taken during and after the theatrical window, including screen retention and release-window extension, the reallocation of marketing expenditure, the valuation of ancillary and streaming rights, and sequel or franchise commitments. Read in this way, the result that engagement volume dominates production budget does not imply that investors are able to anticipate returns before production begins; it indicates that once a film has entered the market, the volume of audience attention it accumulates carries more information about its eventual investment efficiency than the scale of expenditure committed to it. This does not imply that pre-release prediction is infeasible. Studies restricting themselves to information available before a film reaches audiences have in fact achieved strong results, but they do so by constructing features considerably richer than standard production metadata: cast collaboration networks and plot topic distributions (Lash & Zhao, 2016), screen counts at release alongside budget and seasonality (Ghiassi et al., 2015), or sentiment and purchase intention extracted from pre-release trailer reviews (Ahmad et al., 2020a). Lash and Zhao (2016) report that removing such constructed features reduces the AUC of their pre-production model from 0.921 to 0.707, which indicates that the predictive content of ex ante designs rests precisely on the kind of variables the present dataset lacks. The explanatory orientation adopted here is therefore a property of the available data rather than a claim about the limits of pre-release prediction, and it reinforces the case for treating the construction of pre-release engagement proxies as the natural extension of this work.
The findings on the effect of production budget on investment returns may represent the most distinctive contribution of this study from a cultural markets economics perspective. In the fitted model, the SHAP contribution of budget declines across the upper part of the budget range and becomes negative in the region corresponding to roughly 25 million USD. This describes how the model distributes contributions across the observed range rather than identifying a point at which the underlying relationship changes sign, and the particular value should be read as approximate and sample-specific. The cultural economics literature has proposed that budget functions as a signalling mechanism, with high production expenditure interpreted as a quality assurance (Ravid, 1999). The findings of the present study indicate, however, that within this sample the association between expenditure and investment efficiency weakens at higher budget levels. This is consistent with the possibility that budget growth translates into cost pressure rather than proportionate return growth, although the design does not permit that mechanism to be identified directly. This pattern is consistent with Yoong Hon and Yen’s (2023) finding of a high-budget, low-ROI relationship in ancillary markets. Given the extreme right-skewed income distribution documented by De Vany and Walls (1999), the interpretation that high budgets may sometimes amplify rather than reduce uncertainty in this environment gains some support; Filson (2026) similarly found that the majority of project-level ROI variation in film stems from structural uncertainties tied to the development process rather than post-release demand discovery. Einav (2007) showed that the largest productions tend to concentrate strategically around periods of peak demand, yet found that this strategic timing does not automatically translate into improved investment efficiency. From a cultural markets’ perspective, this threshold finding provides some empirical basis for questioning whether the budget-centric investment decision-making prevalent in film financing may carry systematic inefficiencies. The assumption that increasing production scale secures investment success appears, at least within the context of this dataset, to lack consistent empirical support.
The third-place ranking of popularity_log and the shift in SHAP values into positive territory beyond an approximate threshold of 22 popularity points suggest that platform-specific visibility may be meaningfully associated with investment success in cultural markets. This is broadly consistent with the literature on the growing role of digital platforms in shaping the financial performance of cultural products (Castillo et al., 2021; Ahmad et al., 2020a). From a cultural economics perspective, the emergence of popularity metrics as investment signals may point to a dynamic that extends beyond conventional signalling theory: a film’s visibility in the cultural marketplace could function both as a reflection of audience demand and as an independent factor that reinforces that demand.
The limited effect of vote_average- which shifts into positive territory only above an approximate threshold of 6.4 out of 10 and remains weaker than vote_count_log and popularity_log- suggests that the translation of perceived content quality into financial success may follow an indirect rather than direct path in cultural markets. Liu’s (2006) finding that engagement volume carries stronger signal value than valence finds broad support in the present results: how widely a film is discussed appears to be more closely tied to investment returns than how favourably it is assessed. Eliashberg and Shugan’s (1997) view of critics as signals that trail quality rather than drive audience behaviour fits this pattern: the failure of vote_average to match vote_count_log in predictive relevance- the quality signal yielding to the volume signal- is consistent with both Liu (2006) and Eliashberg and Shugan (1997). Basuroy et al.’s (2003) budget-as-shield finding limited to films facing unfavourable reviews points in the same direction. This suggests that investment in content quality may translate into financial returns only under specific conditions. From a cultural economics standpoint, the limited effectiveness of content quality investment across cast, script, and production value in securing financial returns may serve as an empirical indication that value creation mechanisms in cultural markets operate differently from standard production quality models.
The emergence of genre variables as the lowest-ranked group raises questions about the role commonly attributed to content characteristics in the cultural economics literature. Ahmad et al. (2020b) noted that while genre is widely used in film performance research, its explanatory power has varied considerably across studies. The present findings suggest that genre carries relatively limited predictive relevance for investment returns once audience visibility and financial scale are accounted for, pointing to a more circumscribed role for film category in shaping financial performance than is typically assumed among producers and investors.
This study contributes to the cultural economics literature in several respects. The first concerns the shift from box office revenue as the dominant outcome measure in film success research towards ROI as the dependent variable. It has been argued that an investment efficiency framework is necessary for understanding producer and investor behaviour in cultural markets, given the limited informational content of absolute revenue measures (Lauria & Phillips, 2021; Kim et al., 2020). The median-based binary classification approach adopted to address the extreme distributional skewness documented by De Vany and Walls (1999) directly engages with this methodological gap and extends Ravid’s (1999) foundational ROI analysis using more recent analytical tools. Caves’s (2003) characterisation of demand uncertainty as a structural feature of cultural industries, and Hadida’s (2009) comprehensive synthesis of the multi-layered nature of film success, provide theoretical grounding for this study and support the case for ROI-oriented approaches in film research.
The second contribution concerns the non-linear form of the association between production scale and investment efficiency. The existence and limits of scale economies in cultural markets remain a contested issue. The present findings describe a pattern in which the estimated contribution of budget weakens at higher expenditure levels rather than increasing monotonically, which is difficult to reconcile with the assumption that budget growth translates automatically into investment success. We would not characterise this as evidence that scale advantages give way to scale disadvantages at an identifiable point, since the analysis describes the behaviour of a model fitted to a single observational sample and cannot isolate the mechanism responsible. Read at this level of generality, the pattern indicates that the budget range over which additional expenditure improves investment efficiency may be narrower than budget-centric decision heuristics assume. Any policy reading should be correspondingly cautious: the result raises a question about incentive structures calibrated to budget size rather than providing a basis for redesigning them.
The third contribution concerns the standing of audience engagement volume among the determinants of investment efficiency. In the classification specification, engagement ranks first on both importance criteria, ahead of production scale and content characteristics; in the continuous specification, engagement and budget exchange the top two positions. Their relative order is therefore specification-dependent, while engagement remains among the leading predictors in both. The theoretical significance of this result lies in the outcome variable against which it is established rather than in the ordering itself. The existing word-of-mouth literature has demonstrated that engagement volume is associated with box office revenue (Liu, 2006; Duan et al., 2008; Dellarocas et al., 2007; Castillo et al., 2021), and this relationship is by now well documented. Revenue and investment efficiency, however, are not interchangeable outcomes, and a finding established on one does not transfer automatically to the other. Lash and Zhao (2016) report a correlation of only 0.077 between box office revenue and ROI in their sample, indicating that the two measures capture substantially different dimensions of financial performance. Audience attention is itself partly a product of expenditure: larger budgets purchase wider releases, heavier advertising, and more visible casts, all of which generate attention. On this reasoning, engagement and budget should co-move, and once returns are normalised by production cost the apparent advantage of engagement over budget should attenuate or disappear. The present findings indicate that it does not. Engagement retains its explanatory standing alongside budget on a cost-normalised outcome measure, which suggests that audience attention carries informational content that is not fully embodied in production expenditure.
Interpreted through Rosen’s (1981) superstar framework, this points to a mechanism that the revenue-based literature is not positioned to identify. Superstar economics explains why attention, and therefore revenue, concentrates among a small number of productions. It does not by itself establish that returns concentrate in the same way: if attention were anticipated at the financing stage, it would be capitalised into input prices (talent fees, acquisition costs, marketing commitments) and the resulting rents would accrue to the factors of production rather than to the investor. That engagement retains its explanatory strength after costs are netted out suggests that this capitalisation is incomplete, and that the attention a film ultimately attracts is imperfectly anticipated by the expenditure committed to it. This offers one empirically grounded reading of why demand uncertainty in cultural markets, as characterised by Caves (2003), persists as a structural rather than incidental feature: the uncertainty resides not only in whether audiences will attend, but in the weak correspondence between what producers can commit ex ante and the attention that materialises ex post.
Read together with the budget threshold, the two findings describe a single pattern rather than two separate ones. Expenditure exhibits diminishing and eventually negative marginal contributions to investment efficiency beyond an approximate threshold, while audience engagement contributes sharply above a comparatively modest level of accumulated attention. The two mechanisms therefore point in opposite directions across their respective ranges, which is consistent with Ravid’s (1999) finding that budget and star power failed to predict returns and with Yoong Hon and Yen’s (2023) evidence of high-budget underperformance in ancillary markets, while extending both by identifying where the reversal occurs and what displaces expenditure as the dominant signal. The practical implication for cultural economics is that the value creation mechanism in film appears to run through attention rather than through scale, and that these are separable: attention is not simply purchased. This provides empirical purchase on the questions of demand uncertainty and investor behaviour that Eliashberg et al. (2006) identified as unresolved, and indicates that investment decision frameworks in cultural markets require a more systematic treatment of audience visibility than budget-centric heuristics currently allow.
The robustness check reported in Section 4.4 indicates that the ranking of the leading predictors is largely invariant to whether ROI is treated as a binary or a continuous outcome, which suggests that the substantive conclusions drawn here are not artefacts of the median-based classification. The one difference worth noting is that budget and vote count exchange the first two positions between the specifications, so that engagement leads in the classification framework and budget in the continuous one. We therefore treat the two as joint leading predictors rather than claiming a stable ordering between them; what is invariant is their standing relative to popularity, audience rating, runtime, and genre, which indicates that the mechanisms identified operate across the ROI distribution rather than only at the median boundary. The binary specification is nonetheless retained as the primary framework, since the objective of the study is to distinguish films with high and low realised investment efficiency rather than to estimate ROI values precisely, and classification remains the appropriate design for that purpose.
Taken together, these findings carry practical implications that differ from prevailing industry heuristics in three respects. For producers and financiers, the weakening of the budget contribution at higher expenditure levels suggests that additional expenditure in this range is better understood as an increase in exposure than as an improvement in expected efficiency; where the objective is return rather than absolute revenue, a portfolio of moderately budgeted productions is indicated over a smaller number of large commitments. For distributors and rights holders, the strength of the engagement signal points to early accumulated audience attention as a more informative input for post-release decisions—screen retention, window extension, marketing reallocation, and ancillary and streaming valuation—than either budget or genre. For public agencies designing film support schemes, the weakening of the budget contribution at higher expenditure levels raises the question of whether incentive structures calibrated to budget size direct resources towards the range in which investment efficiency is weakest. We note this as a question the present design can raise but not settle.
Several limitations should be kept in mind when interpreting the findings of this study. The budget and revenue data used were drawn from TMDB’s publicly available dataset, which does not cover marketing expenditure and reflects only theatrical box office revenue. This means that ROI calculations may not fully capture actual investment costs or total revenues. Similar data constraints apply to the majority of existing studies in this area and are widely acknowledged in the literature (Mammadov et al., 2025; Leukel et al., 2026). The filtering criteria applied in this study, retaining only observations with budget and revenue values above zero and above 1000 USD, should be regarded as a methodological step taken to improve data quality. First, the dataset covers the period 1916–2017 and relies on a single platform-specific source. The exclusion of the post-2017 period, during which streaming platforms have become dominant, and revenue models have undergone substantial transformation, limits the generalisability of the findings to current cultural market conditions. As McKenzie (2023) has noted, the effects of digital transformation on the economic structure of the film industry remain incompletely documented, and examining how this transformation affects variable importance rankings represents a productive direction for future research. Second, variables that could have a strong bearing on financial performance in cultural markets including marketing expenditure, distribution width, and advertising investment are absent from the dataset. The absence of such variables is recognised in the cultural economics literature as one of the primary factors limiting model explanatory power (Leukel et al., 2026; Eliashberg et al., 2006). Their inclusion would likely enrich the interpretation of the relationship between audience engagement and budget. Third, the median-based binary classification approach partially obscures the nuances within the ROI distribution. A multi-class categorisation or a graduated approach could allow for a more detailed assessment of investment performance in cultural markets. This study is based on observational data and the associations identified are correlational in nature. The patterns among variables have been interpreted within a relational rather than causal framework, and causal claims have been systematically avoided. Testing the causal dimensions of these relationships through instrumental variable approaches, difference-in-differences designs, or natural experiment methods is suggested as a priority for future research. Finally, both the potential endogeneity and the ex post availability of the vote_count and popularity variables require that interpretations of these variables be treated with particular care. Films that perform strongly in the market attract more votes and greater platform visibility, so the association identified here is likely to operate in both directions; more importantly, because both variables are recorded only after release, they cannot serve as inputs to pre-release investment decisions. A genuinely ex ante framework would require pre-release proxies for anticipated audience engagement, such as trailer view counts, search volume trends, pre-sale ticket data, or social media activity in the weeks preceding release, none of which are available in the TMDB dataset. Constructing and testing such a design, alongside investigating the causal dimension of this relationship through instrumental variable approaches or natural experiment designs, would considerably strengthen the analytical basis for conclusions regarding the role of audience engagement in investment success in cultural markets.
6. Conclusions
The film industry represents one of the most capital-intensive and financially uncertain domains within cultural markets. This study aimed to contribute empirical evidence on the mechanisms of value creation in cultural markets by examining the determinants of return on investment across a sample of 3153 films. Ensemble learning algorithms and SHAP-based variable decomposition served as analytical instruments in this process, with the primary contribution sought not in the methodological tools themselves but in the economic findings they help surface.
The findings suggest that investment success in cultural markets is tied to audience visibility and engagement volume at least as closely as to production scale, and more closely than to content characteristics, which runs against common assumptions in the industry. Audience engagement volume, represented by vote count, stands among the leading determinants of investment efficiency, ranking first in the classification framework and second in the continuous specification. This suggests that demand uncertainty in cultural markets may exhibit at least some degree of systematic patterning. Since engagement metrics are realised only after a film reaches audiences, this finding speaks to the explanation of investment outcomes and to post-release decision-making rather than to pre-release project selection. The change in the direction of the budget contribution observed in the fitted model around 25 million USD provides some empirical basis for questioning whether budget-centric investment decision-making in cultural markets carries systematic inefficiencies and reinforces the line of inquiry built on Ravid’s (1999) foundational work with more recent data.
The primary contribution of this study to the cultural economics literature lies in the shift from the revenue-oriented perspective that has dominated film research towards an ROI-centred framework, supported by a methodological approach that directly addresses the distributional problem documented by De Vany and Walls (1999). The non-linear relationship identified between production scale and investment efficiency, and the standing of audience engagement alongside budget among the leading predictors, suggest that value creation mechanisms in cultural markets may operate differently from standard production quality models, pointing to the need for a more systematic empirical framework in this area. That audience engagement retains its explanatory strength once returns are normalised by production cost indicates that attention is not fully embodied in expenditure, and therefore that the concentration of attention documented in the superstar literature does not translate mechanically into a concentration of returns. In this respect, the findings suggest that financial success in cultural product markets may not be fully accounted for by production scale alone, and that visibility and audience engagement may occupy a central role in the value creation process. Given the fundamental transformation of revenue models and audience behaviour in the streaming era, testing the findings of this study against more recent data, across different market contexts, and using methods that more directly address the causal dimension represents a productive direction for cultural economics research.
Author Contributions
Conceptualization, M.E. and N.A.; methodology, M.E., N.A. and E.O.E.; software, N.A.; validation, E.O.E., E.D.-Ö. and Ş.Ö.; formal analysis, N.A. and M.E.; investigation, E.O.E., E.D.-Ö. and Ş.Ö.; resources, E.O.E., E.D.-Ö. and Ş.Ö.; data curation, E.O.E., M.E. and N.A.; writing—original draft preparation, E.O.E. and M.E.; writing—review and editing, M.E., N.A., E.D.-Ö. and Ş.Ö.; visualization, E.D.-Ö., Ş.Ö. and N.A.; supervision, M.E. and N.A. All authors have read and agreed to the published version of the manuscript.
Funding
This research received no external funding.
Institutional Review Board Statement
Not applicable.
Informed Consent Statement
Not applicable.
Data Availability Statement
The data presented in this study are derived from the publicly available TMDB movie metadata dataset, accessible at https://www.kaggle.com/datasets/tmdb/tmdb-movie-metadata (accessed on 19 March 2026).
Conflicts of Interest
The authors declare no conflicts of interest.
Abbreviations
The following abbreviations are used in this manuscript:
| AUC | Area Under the ROC Curve |
| CatBoost | Categorical Boosting |
| ROC | Receiver Operating Characteristic |
| ROI | Return on Investment |
| SHAP | SHapley Additive exPlanations |
| TMDB | The Movie Database |
| XGBoost | Extreme Gradient Boosting |
References
- Ahmad, I. S., Bakar, A. A., & Yaakub, M. R. (2020a). Movie revenue prediction based on purchase intention mining using YouTube trailer reviews. Information Processing & Management, 57(5), 102278. [Google Scholar] [CrossRef] [Scilit]
- Ahmad, I. S., Bakar, A. A., Yaakub, M. R., & Muhammad, S. H. (2020b). A survey on machine learning techniques in movie revenue prediction. SN Computer Science, 1(4), 235. [Google Scholar] [CrossRef] [Scilit]
- Arrieta, A. B., Díaz-Rodríguez, N., Del Ser, J., Bennetot, A., Tabik, S., Barbado, A., Garcia, S., Gil-Lopez, S., Molina, D., Benjamins, R., Chatila, R., & Herrera, F. (2020). Explainable Artificial Intelligence (XAI): Concepts, taxonomies, opportunities and challenges toward responsible AI. Information Fusion, 58, 82–115. [Google Scholar] [CrossRef] [Scilit]
- Basuroy, S., Chatterjee, S., & Ravid, S. A. (2003). How critical are critical reviews? The box office effects of film critics, star power, and budgets. Journal of Marketing, 67(4), 103–117. [Google Scholar] [CrossRef] [Scilit]
- Behrens, R., Foutz, N. Z., Franklin, M., Funk, J., Gutierrez-Navratil, F., Hofmann, J., & Leibfried, U. (2021). Leveraging analytics to produce compelling and profitable film content. Journal of Cultural Economics, 45, 171–211. [Google Scholar] [CrossRef] [Scilit]
- Botchkarev, A., & Andru, P. (2011). A return on investment as a metric for evaluating information systems: Taxonomy and application. Interdisciplinary Journal of Information, Knowledge, and Management, 6, 245–269. [Google Scholar] [CrossRef] [Scilit] [PubMed]
- Breiman, L. (2001). Random forests. Machine Learning, 45(1), 5–32. [Google Scholar] [CrossRef] [Scilit]
- Brodersen, K. H., Ong, C. S., Stephan, K. E., & Buhmann, J. M. (2010). The balanced accuracy and its posterior distribution. In Proceedings of the 20th ınternational conference on pattern recognition (ICPR), Istanbul, Türkiye, 23–26 August 2010 (pp. 3121–3124). IEEE. [Google Scholar] [CrossRef] [Scilit]
- Castillo, A., Benitez, J., Llorens, J., & Luo, X. R. (2021). Social media-driven customer engagement and movie performance: Theory and empirical evidence. Decision Support Systems, 145, 113516. [Google Scholar] [CrossRef] [Scilit]
- Caves, R. E. (2003). Contracts between art and commerce. Journal of Economic Perspectives, 17(2), 73–83. [Google Scholar] [CrossRef] [Scilit]
- Chen, T., & Guestrin, C. (2016). XGBoost: A scalable tree boosting system. In Proceedings of the 22nd ACM SIGKDD ınternational conference on knowledge discovery and data mining (pp. 785–794). ACM. [Google Scholar] [CrossRef] [Scilit]
- Dellarocas, C., Zhang, X. M., & Awad, N. F. (2007). Exploring the value of online product reviews in forecasting sales: The case of motion pictures. Journal of Interactive Marketing, 21(4), 23–45. [Google Scholar] [CrossRef] [Scilit]
- De Vany, A., & Walls, W. D. (1999). Uncertainty in the movie industry: Does star power reduce the terror of the box office? Journal of Cultural Economics, 23(4), 285–318. [Google Scholar] [CrossRef] [Scilit]
- Duan, W., Gu, B., & Whinston, A. B. (2008). The dynamics of online word-of-mouth and product sales—An empirical investigation of the movie industry. Journal of Retailing, 84(2), 233–242. [Google Scholar] [CrossRef] [Scilit]
- Einav, L. (2007). Seasonality in the U.S. motion picture industry. The RAND Journal of Economics, 38(1), 127–145. [Google Scholar] [CrossRef] [Scilit]
- Elberse, A., & Eliashberg, J. (2003). Demand and supply dynamics for sequentially released products in international markets: The case of motion pictures. Marketing Science, 22(3), 329–354. [Google Scholar] [CrossRef] [Scilit]
- Eliashberg, J., Elberse, A., & Leenders, M. A. A. M. (2006). The motion picture industry: Critical issues in practice, current research, and new research directions. Marketing Science, 25(6), 638–661. [Google Scholar] [CrossRef] [Scilit]
- Eliashberg, J., & Shugan, S. M. (1997). Film critics: Influencers or predictors? Journal of Marketing, 61(2), 68–78. [Google Scholar] [CrossRef] [Scilit]
- e Souza, T. L. D., Nishijima, M., & Pires, R. (2023). Revisiting predictions of movie economic success: Random Forest applied to profits. Multimedia Tools and Applications, 82, 38397–38420. [Google Scholar] [CrossRef] [Scilit] [PubMed]
- Fan, L., Zhang, X., & Rai, L. (2021). When should star power and eWOM be responsible for the box office performance?—An empirical study based on signaling theory. Journal of Retailing and Consumer Services, 62, 102591. [Google Scholar] [CrossRef] [Scilit]
- Fawcett, T. (2006). An introduction to ROC analysis. Pattern Recognition Letters, 27(8), 861–874. [Google Scholar] [CrossRef] [Scilit]
- Filson, D. (2026). Somebody knows something: Managerial ability, product development, and return-on-investment in a hit-driven industry. Journal of Economics & Management Strategy, 35(3), 424–436. [Google Scholar] [CrossRef] [Scilit]
- Ghiassi, M., Lio, D., & Moon, B. (2015). Pre-production forecasting of movie revenues with a dynamic artificial neural network. Expert Systems with Applications, 42(6), 3176–3193. [Google Scholar] [CrossRef] [Scilit]
- Greenwell, B. (2024). fastshap: Fast approximate shapley values (R package version 0.1.1). Available online: https://CRAN.R-project.org/package=fastshap (accessed on 3 May 2026).
- Hadida, A. L. (2009). Motion picture performance: A review and research agenda. International Journal of Management Reviews, 11(3), 297–335. [Google Scholar] [CrossRef] [Scilit]
- Hossin, M., & Sulaiman, M. N. (2015). A review on evaluation metrics for data classification evaluations. International Journal of Data Mining & Knowledge Management Process, 5(2), 1–11. [Google Scholar] [CrossRef] [Scilit]
- Kim, J.-M., Xia, L., Kim, I., Lee, S., & Lee, K.-H. (2020). Finding nemo: Predicting movie performances by machine learning methods. Journal of Risk and Financial Management, 13(5), 93. [Google Scholar] [CrossRef] [Scilit]
- Lash, M. T., & Zhao, K. (2016). Early predictions of movie success: The who, what, and when of profitability. Journal of Management Information Systems, 33(3), 874–903. [Google Scholar] [CrossRef] [Scilit]
- Lauria, D., & Phillips, W. P. (2021). Insuring hollywood: A movie returns index and the american stock market. Journal of Risk and Financial Management, 14(5), 189. [Google Scholar] [CrossRef] [Scilit]
- Lee, S., Kc, B., & Choeh, J. Y. (2020). Comparing performance of ensemble methods in predicting movie box office revenue. Heliyon, 6(6), e04260. [Google Scholar] [CrossRef] [Scilit] [PubMed]
- Leukel, J., Liu, Z., & Sugumaran, V. (2026). Potential overinterpretation of results in the abstracts of machine learning studies for movie box office revenue prediction: A systematic review. Journal of Revenue and Pricing Management, 25, 368–377. [Google Scholar] [CrossRef] [Scilit]
- Liaw, A., & Wiener, M. (2002). Classification and regression by randomForest. R News, 2(3), 18–22. [Google Scholar]
- Liu, Y. (2006). Word of mouth for movies: Its dynamics and impact on box office revenue. Journal of Marketing, 70(3), 74–89. [Google Scholar] [CrossRef] [Scilit]
- Lundberg, S. M., & Lee, S. I. (2017). A unified approach to interpreting model predictions. In Proceedings of the 31st ınternational conference on neural ınformation processing systems (NIPS’17). Curran Associates Inc. Available online: https://papers.nips.cc/paper_files/paper/2017/hash/8a20a8621978632d76c43dfd28b67767-Abstract.html (accessed on 30 March 2026).
- Mahmud, Q. I., Shuchi, N. Z., Tawsif, F. M., Mohaimen, A., & Tasnim, A. (2020). A machine learning approach to predict movie revenue based on pre-released movie metadata. Journal of Computer Science, 16(6), 749–767. [Google Scholar] [CrossRef] [Scilit]
- Mammadov, S., Abdulrashid, I., Khalafalla, M., & Delen, D. (2025). Identifying factors influencing box-office success of motion pictures with XAI. Journal of Computer Information Systems, 1–17. [Google Scholar] [CrossRef] [Scilit]
- McKenzie, J. (2023). The economics of movies (revisited): A survey of recent literature. Journal of Economic Surveys, 37(2), 480–525. [Google Scholar] [CrossRef] [Scilit]
- Moul, C. C. (2007). Measuring word of mouth’s impact on theatrical movie admissions. Journal of Economics & Management Strategy, 16(4), 859–892. [Google Scholar] [CrossRef] [Scilit]
- Ni, Y., Dong, F., Zou, M., & Li, W. (2022). Movie box office prediction based on multi-model ensembles. Information, 13(6), 299. [Google Scholar] [CrossRef] [Scilit]
- Patrocínio, T., Madaleno, M., & Nogueira, M. C. (2024). Does the way variables are calculated change the conclusions to be drawn? A study applied to the ratio ROI (Return on Investment). Journal of Risk and Financial Management, 17(7), 266. [Google Scholar] [CrossRef] [Scilit]
- Phillips, J. J. (1998). The return-on-investment (ROI) process: Issues and trends. Educational Technology, 38(4), 7–14. [Google Scholar]
- Prokhorenkova, L., Gusev, G., Vorobev, A., Dorogush, A. V., & Gulin, A. (2018). CatBoost: Unbiased boosting with categorical features. In Proceedings of the 32nd conference on neural ınformation processing systems (NeurIPS 2018). Curran Associates Inc. Available online: https://papers.nips.cc/paper_files/paper/2018/hash/14491b756b3a51daac41c24863285549-Abstract.html (accessed on 30 March 2026).
- Ravid, S. A. (1999). Information, blockbusters, and stars: A study of the film industry. The Journal of Business, 72(4), 463–492. [Google Scholar] [CrossRef] [Scilit] [PubMed]
- Robin, X., Turck, N., Hainard, A., Tiberti, N., Lisacek, F., Sanchez, J. C., & Müller, M. (2011). pROC: An open-source package for R and S+ to analyze and compare ROC curves. BMC Bioinformatics, 12(1), 77. [Google Scholar] [CrossRef] [Scilit] [PubMed]
- Rosen, S. (1981). The economics of superstars. The American Economic Review, 71(5), 845–858. [Google Scholar]
- Sharda, R., & Delen, D. (2006). Predicting box-office success of motion pictures with neural networks. Expert Systems with Applications, 30(2), 243–254. [Google Scholar] [CrossRef] [Scilit]
- Tang, S. (2024). The box office prediction model based on the optimized XGBoost algorithm in the context of film marketing and distribution. PLoS ONE, 19(10), e0309227. [Google Scholar] [CrossRef] [Scilit] [PubMed]
- Yan, M. (2025). Research on movie box office prediction model based on machine learning. Applied and Computational Engineering, 151, 82–89. [Google Scholar] [CrossRef] [Scilit]
- Yoong Hon, L., & Yen, R. S. (2023). Consumption patterns and returns in the US DVD market. Australasian Accounting, Business and Finance Journal, 17(2), 168–182. [Google Scholar] [CrossRef] [Scilit]
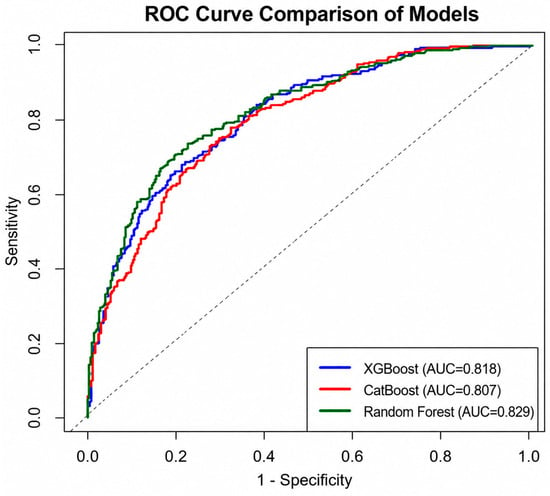
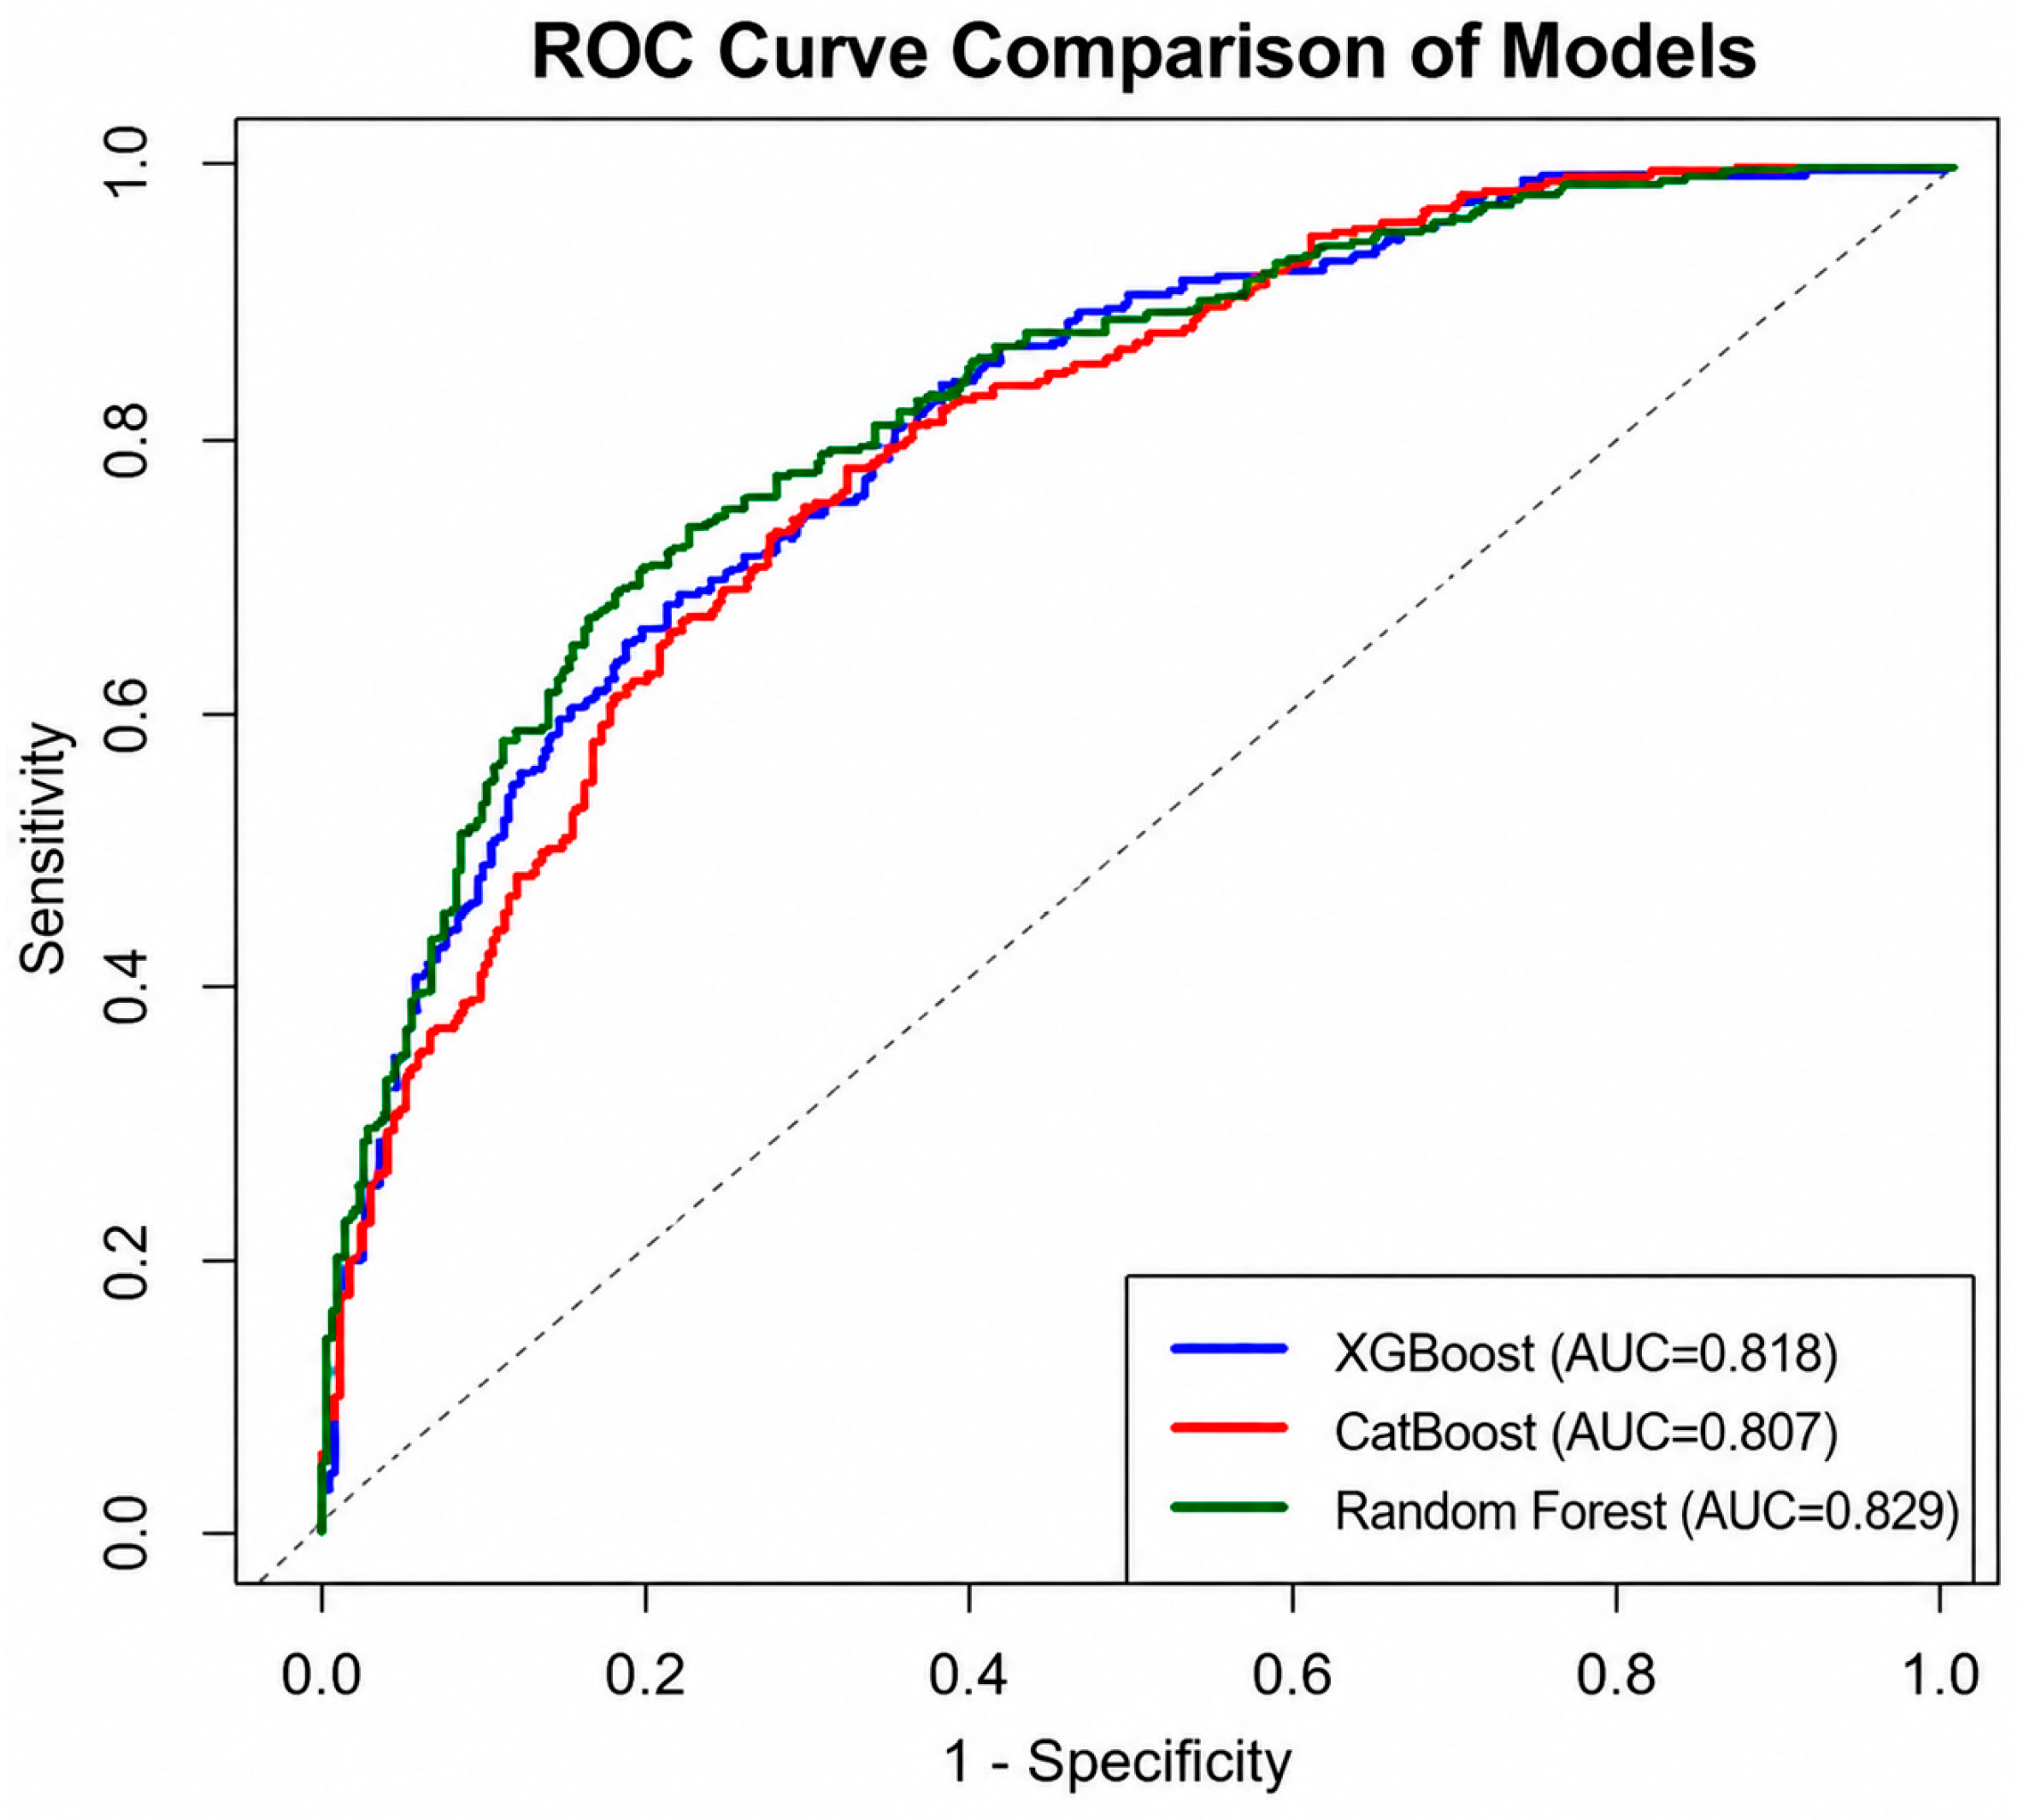
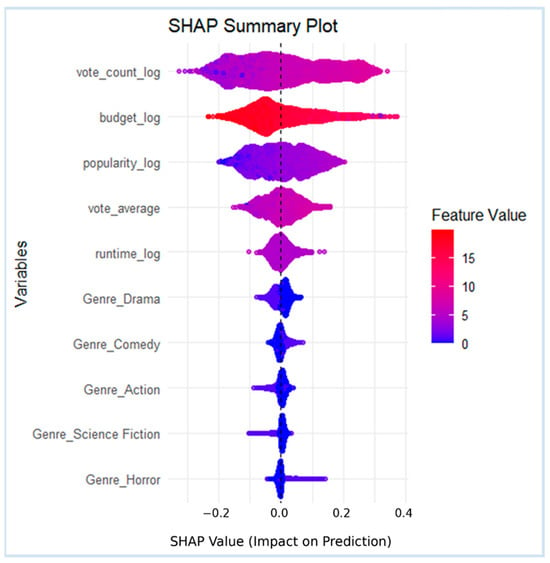
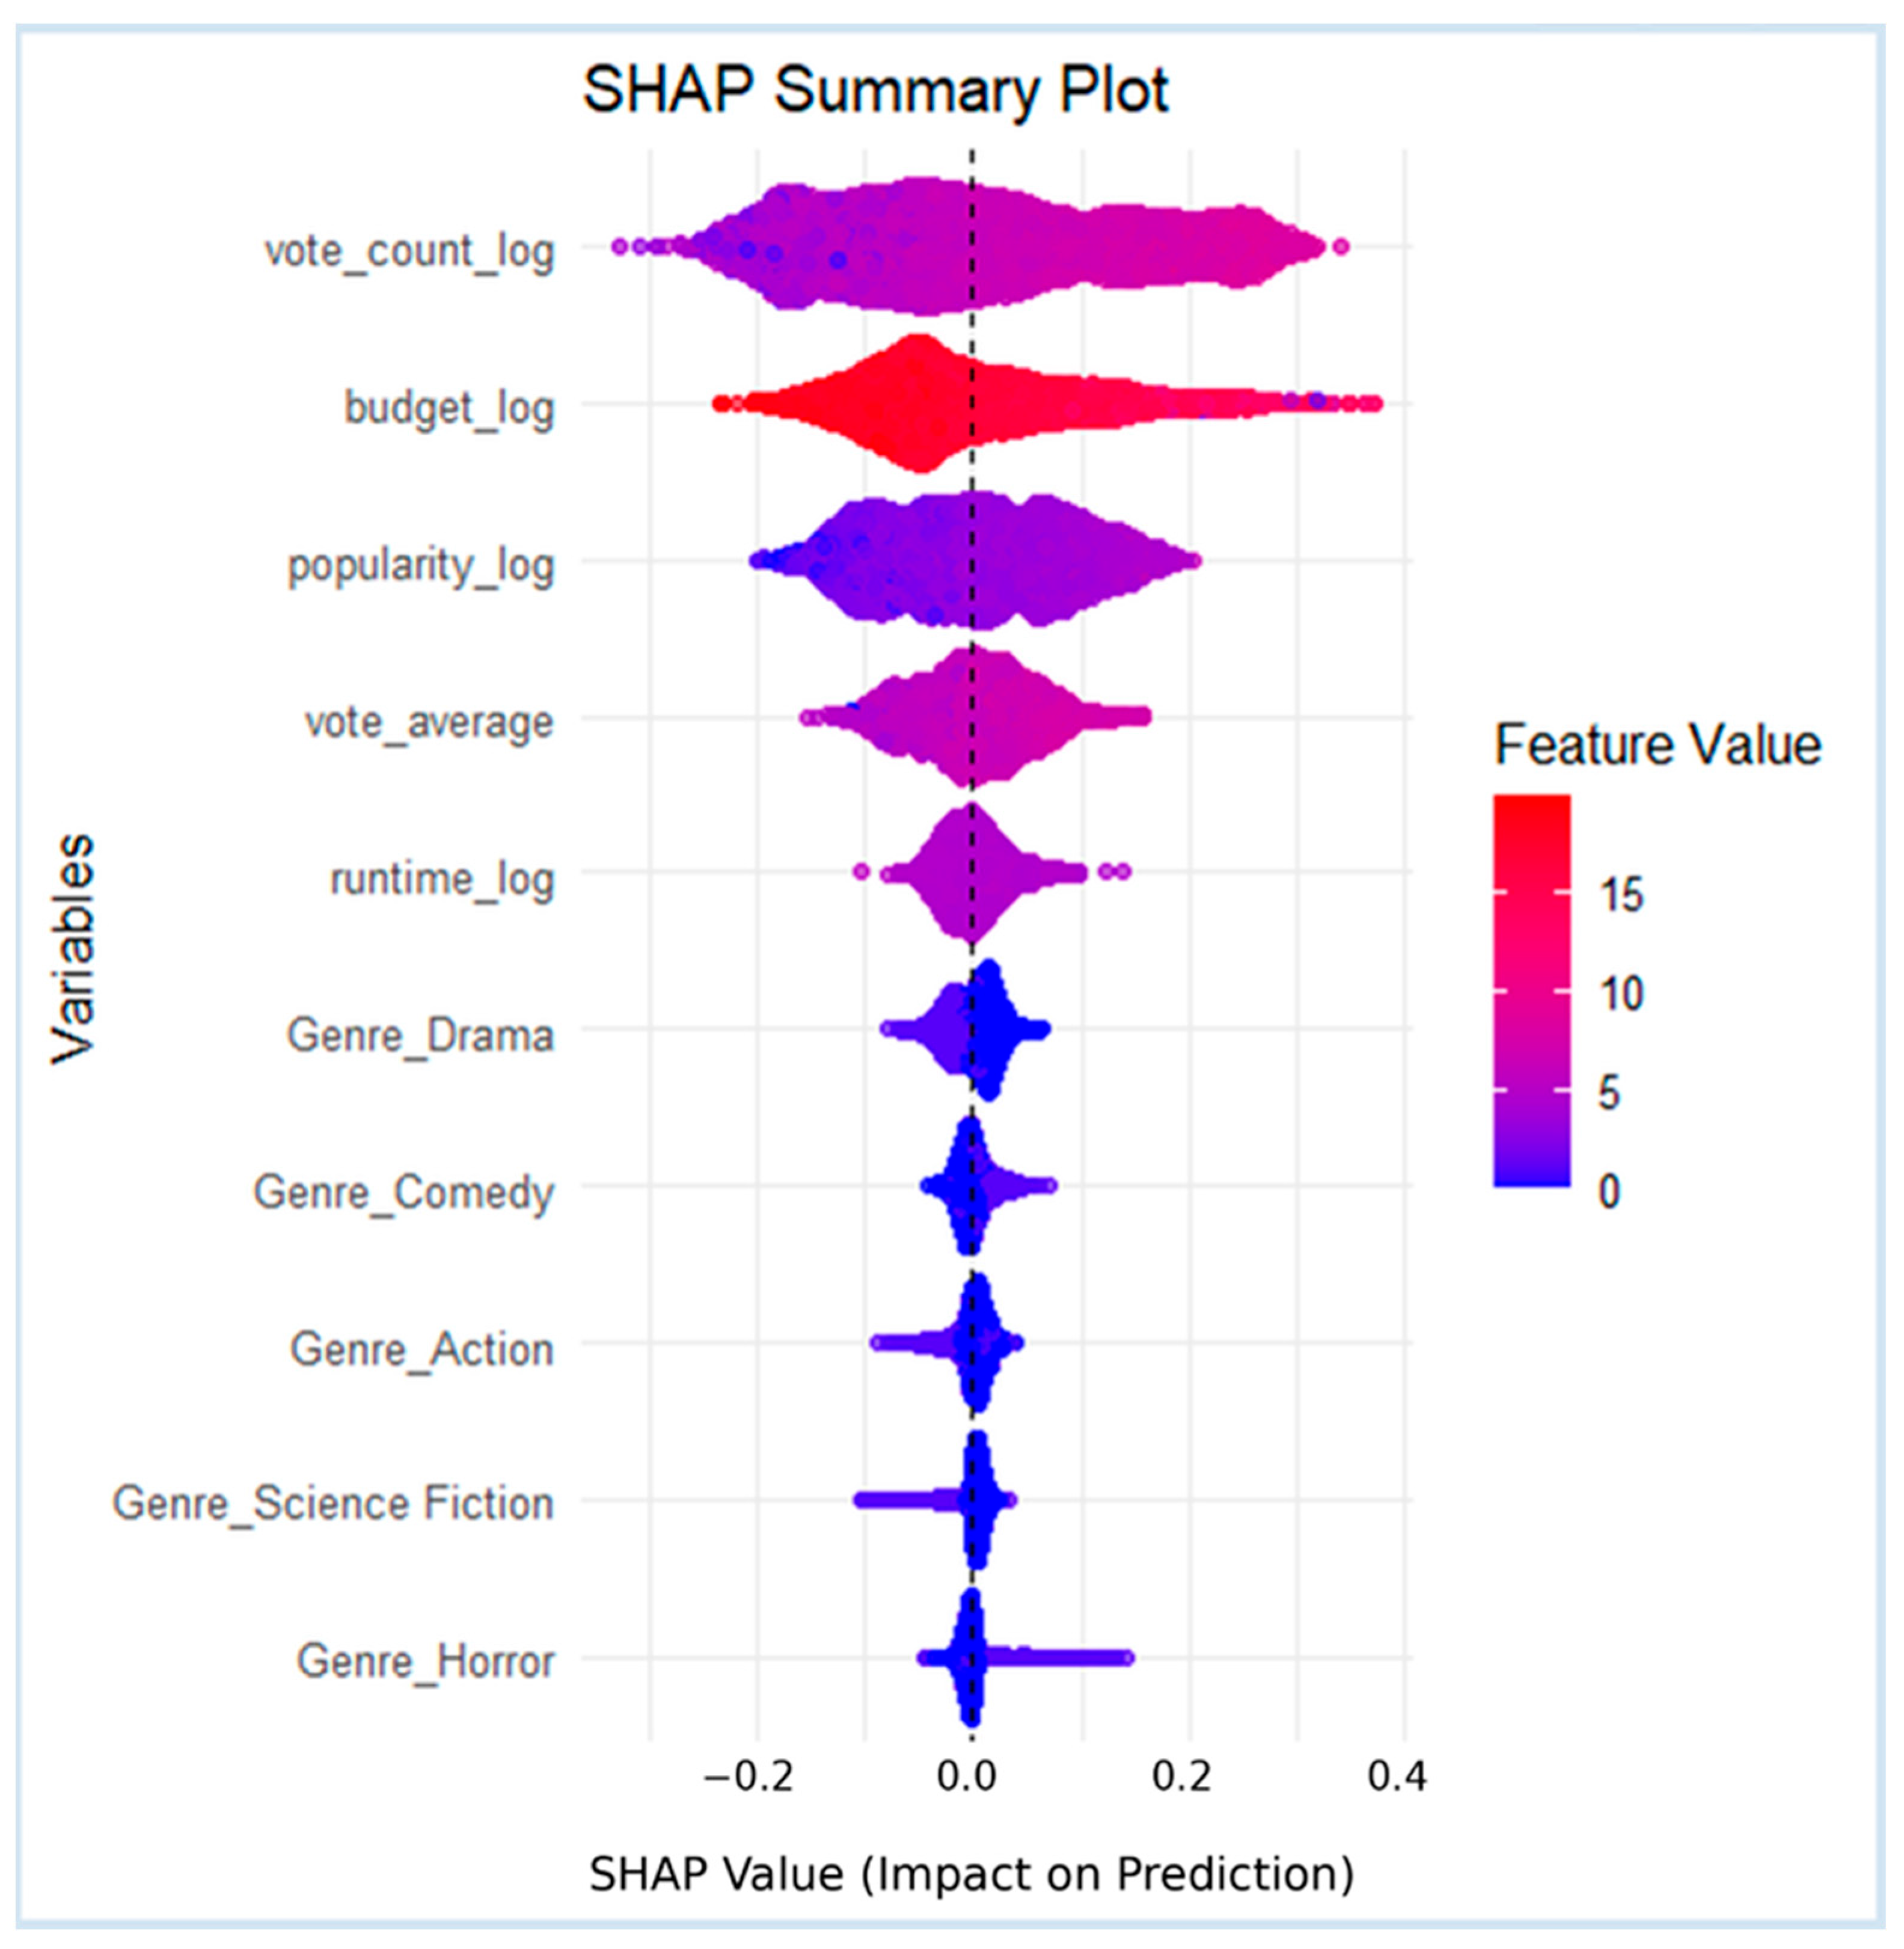
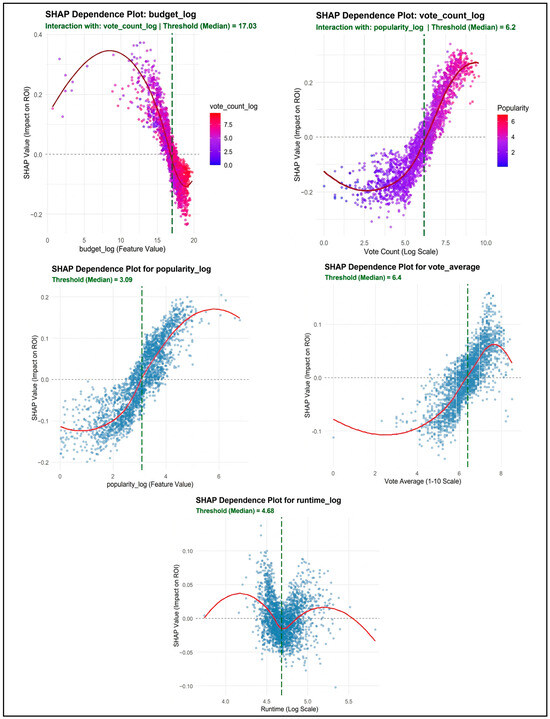
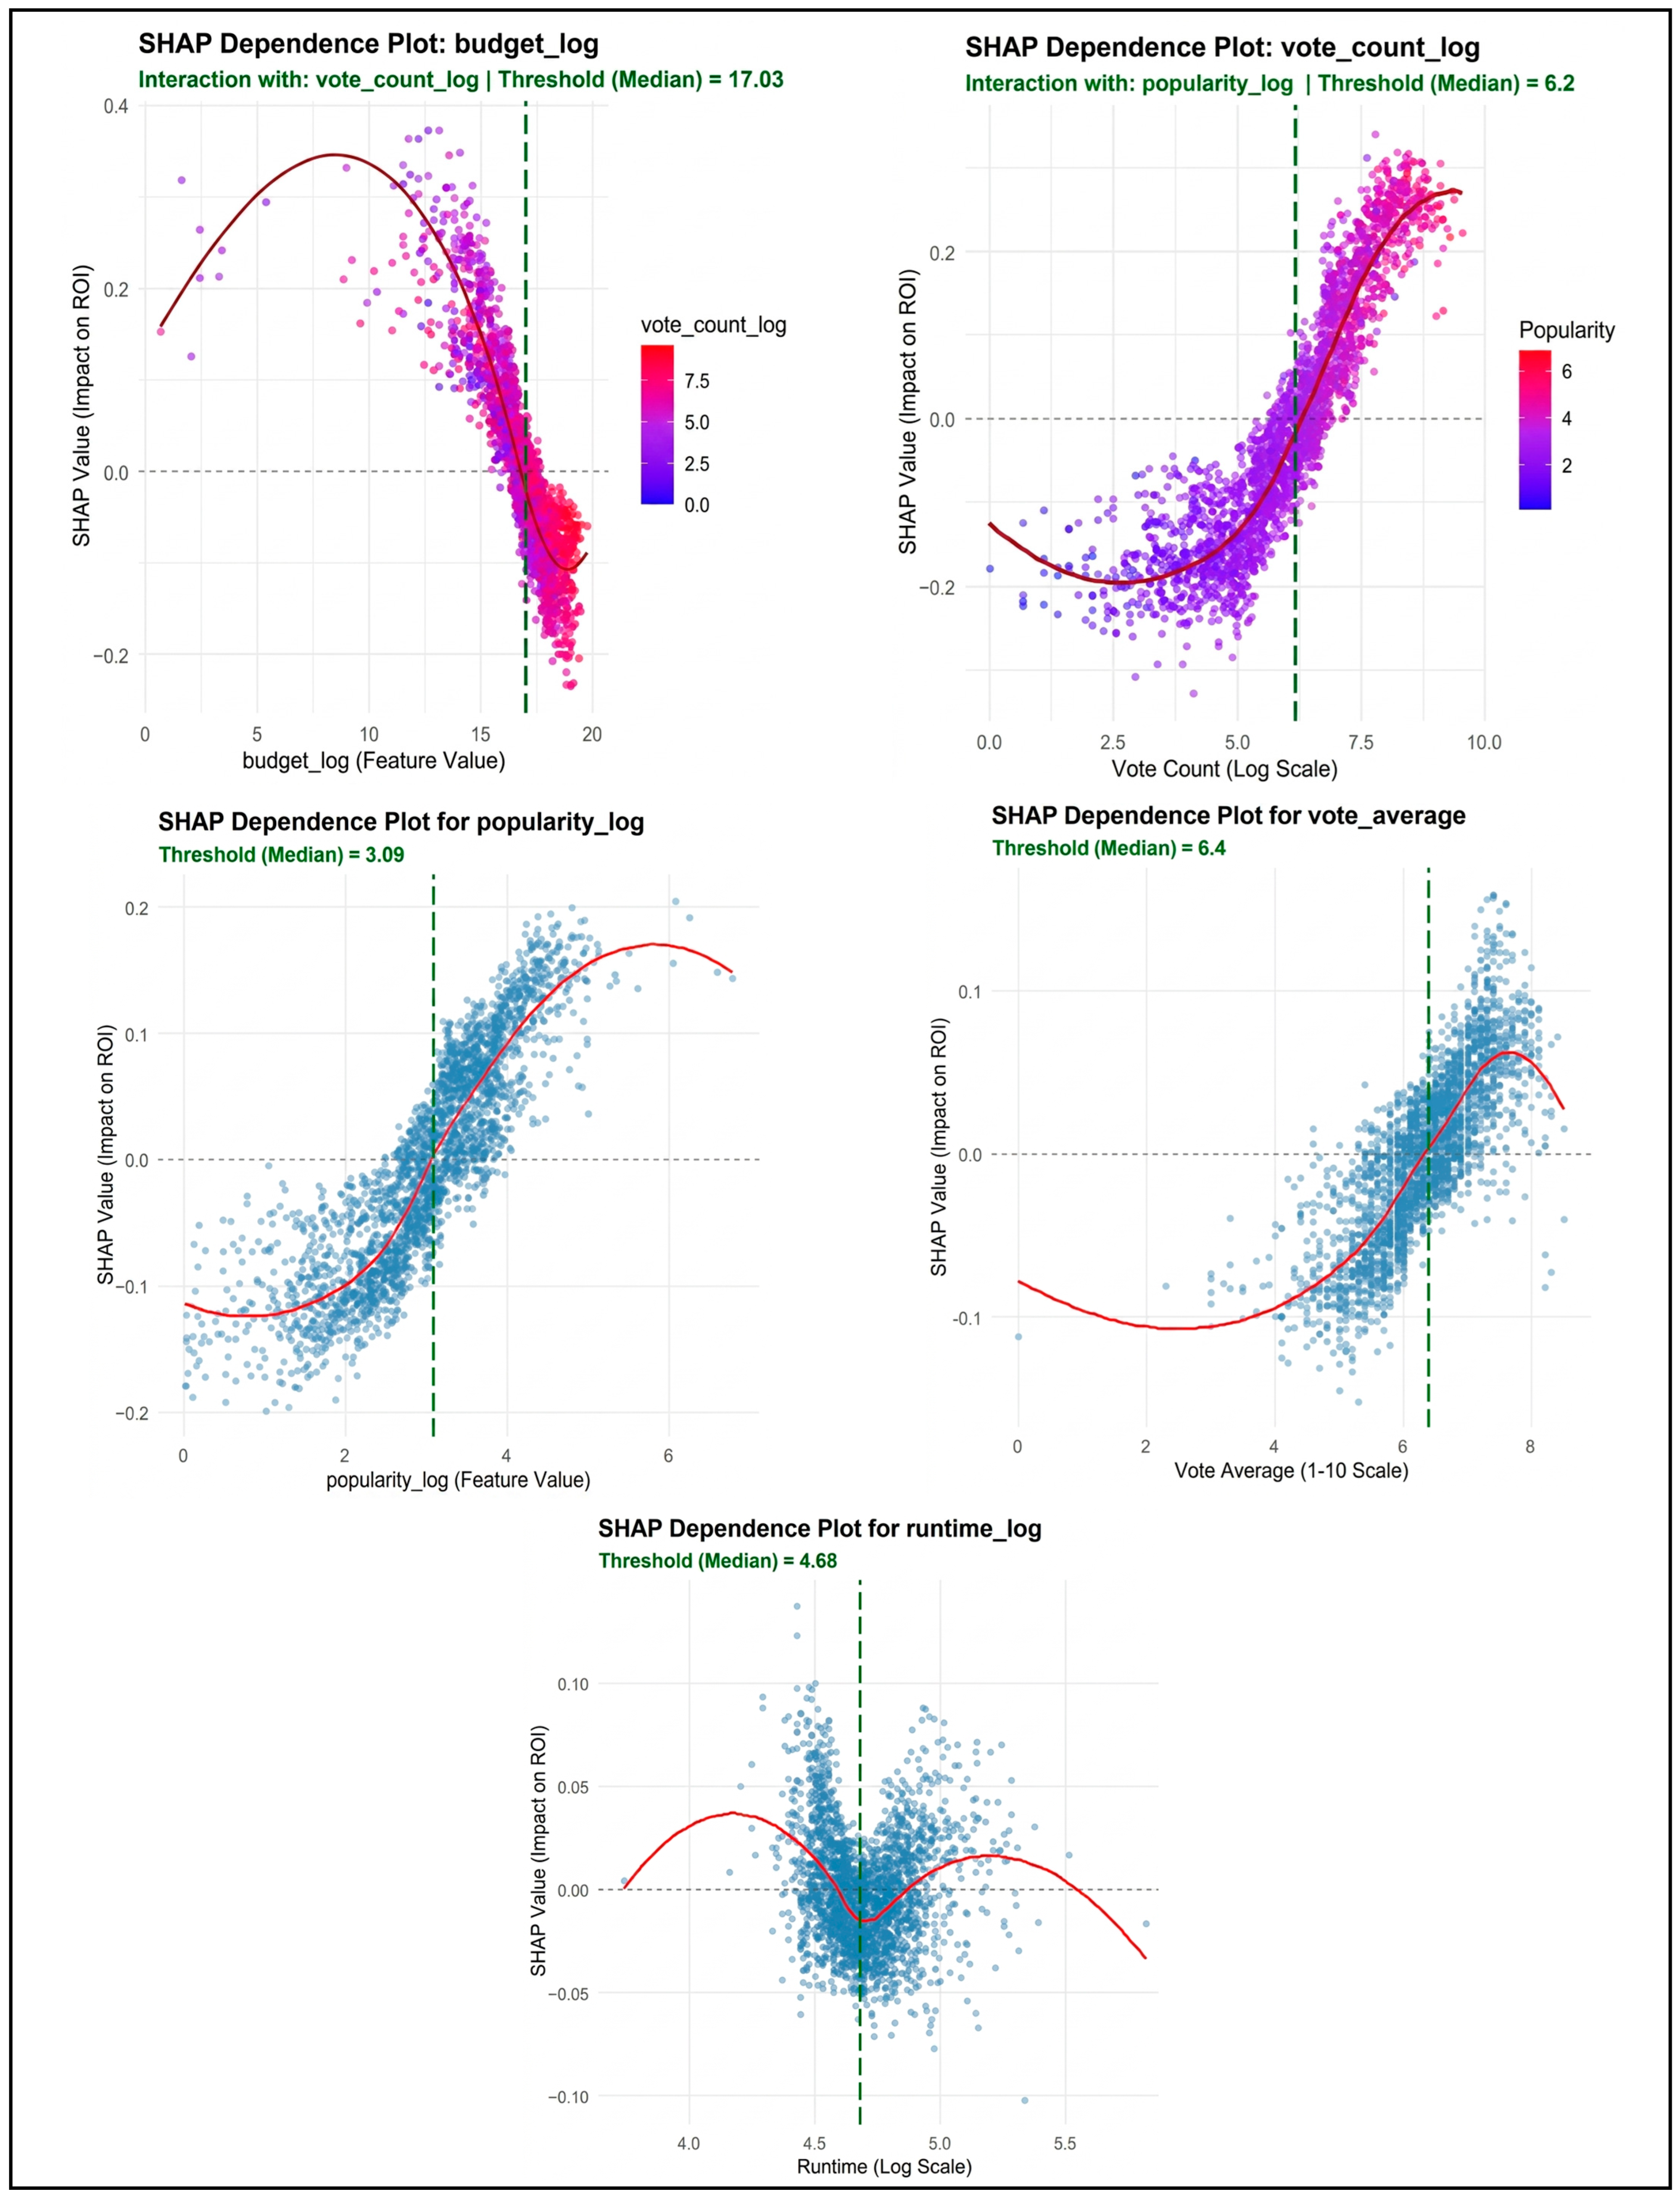

Disclaimer/Publisher’s Note: The statements, opinions and data contained in all publications are solely those of the individual author(s) and contributor(s) and not of MDPI and/or the editor(s). MDPI and/or the editor(s) disclaim responsibility for any injury to people or property resulting from any ideas, methods, instructions or products referred to in the content. |
© 2026 by the authors. Licensee MDPI, Basel, Switzerland. This article is an open access article distributed under the terms and conditions of the Creative Commons Attribution (CC BY) license.