


Abstract
Thermal protection is critical for solid rocket motor safety, yet ablation prediction of insulation layers remains a core challenge. To achieve rapid and accurate prediction, this study develops a Physics-Informed Neural Network (PINN) model for EPDM-based insulation materials. The model is constructed based on three submodels (flow, heat transfer, and mass transfer in the surface boundary layer of thermal insulation layers; flow, heat transfer, and diffusion in porous media; thermal decomposition and thermochemical ablation of insulation layers) along with two external modules (gas and particle erosion). Results show a maximum prediction error of 10.76%, in good agreement with experiments. Compared with traditional ablation models, the proposed prediction model achieves faster prediction speed while maintaining good accuracy, which is conducive to providing suggestions for thermal protection design.
1. Introduction
Solid rocket motors, as the power source of missile weapon systems, determine the capabilities of missile weapons in terms of maneuverability, penetration, and long-range delivery, with their performance and technological level serving as the foundation and prerequisite for exerting the operational effectiveness of weapon systems and even acting as the core technology driving the upgrading and generational replacement of missile weapons [1,2,3,4].
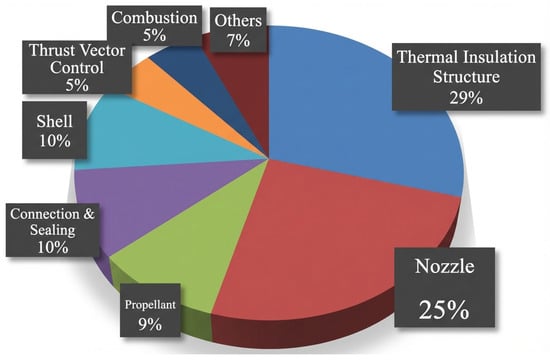
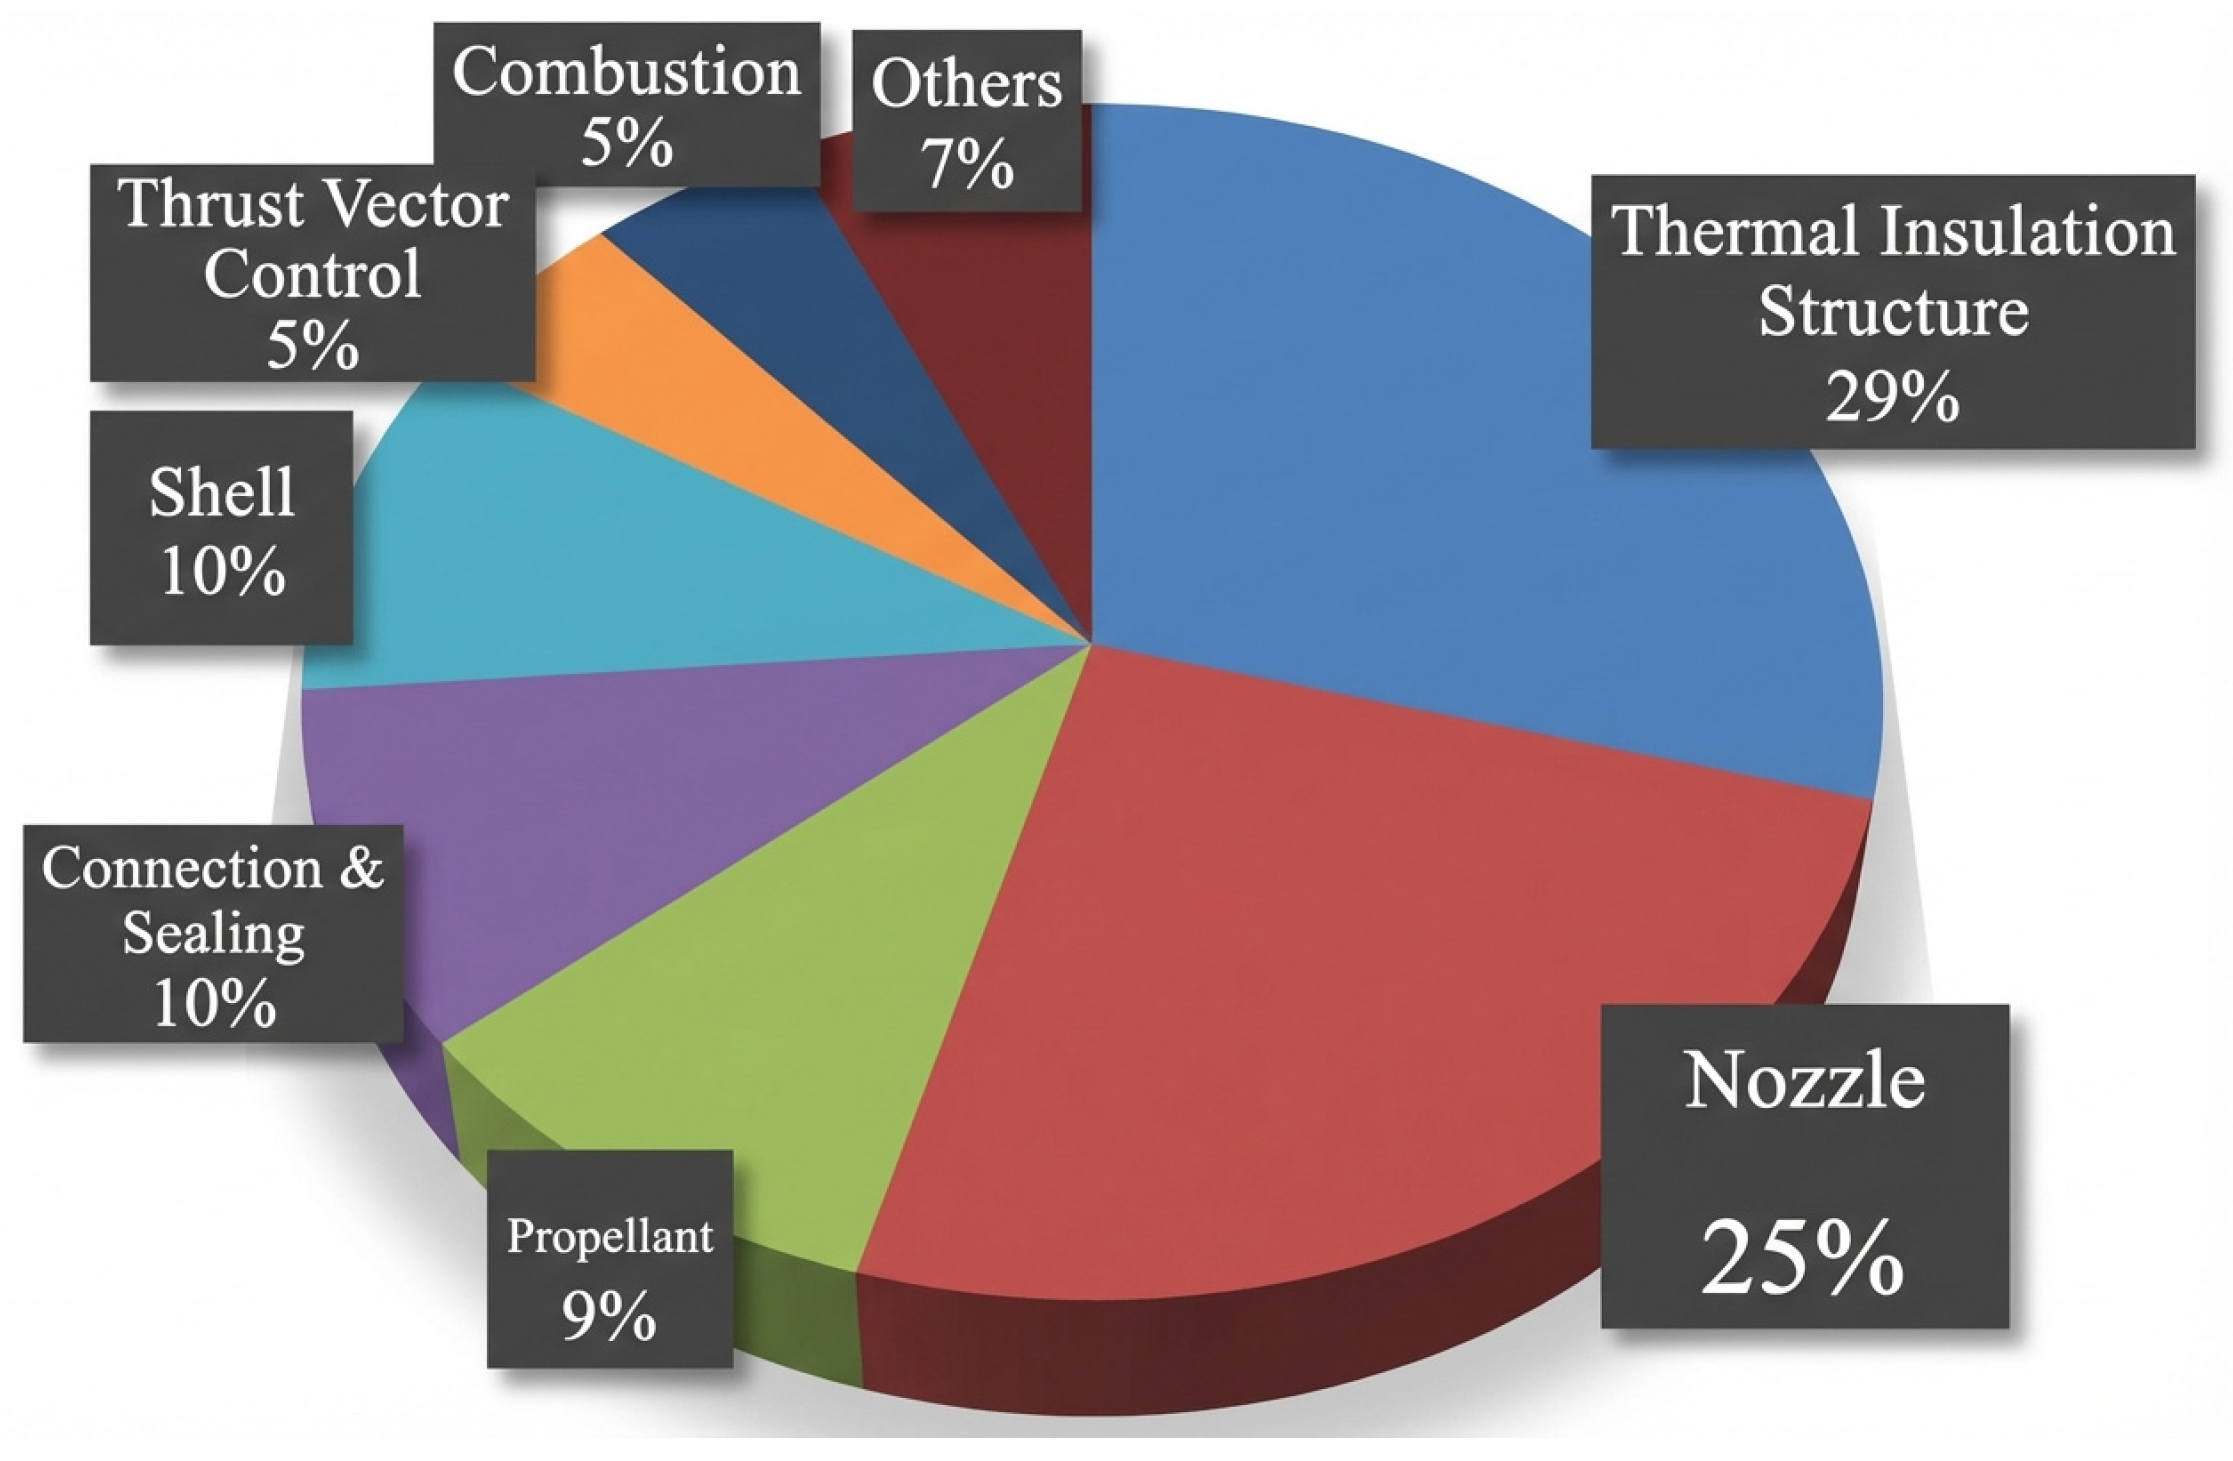
The combustor operates under extreme conditions during motor operation, featuring high temperatures (3000~4000 K) and high pressures (4~20 MPa). Consequently, a protective insulation layer is typically applied to the inner wall of the combustor to safeguard the motor casing. Currently, to increase motor specific impulse, aluminum-containing propellants are widely used in this field. Their combustion process generates a significant amount of aluminum oxide droplets [5]. Influenced by overload effects and the propellant fin slots of the charge grain structure, these aluminum oxide droplets within the two-phase flow tend to accumulate in localized areas of the combustor. This accumulation leads to a more severe thermal–structural working environment for the motor. Figure 1 presents statistics compiled by NASA experts on the failure factors of solid rocket motors [6], indicating that failures attributable to the insulation structure account for the highest proportion, reaching up to 29%.
Figure 1.
Proportion of failure factors for solid rocket motors [6].
The ablation process of the insulation layer in solid rocket motors involves multiple coupled physical–chemical processes, including heat transfer, thermochemical ablation, gas erosion, and particle erosion [7,8,9,10]. Since the 1960s, researchers have conducted extensive studies on the ablation mechanisms and modeling of charring insulation materials. Early theoretical work primarily focused on calculating the thermal response characteristics of insulation materials, which subsequently evolved into the development of thermochemical ablation models [11,12]. Entering the 1990s, with the deepening understanding of ablation mechanisms, traditional thermochemical ablation models could no longer meet the demands of engineering applications. To describe ablation phenomena more accurately, researchers began to construct more sophisticated models: D. M. Curry et al. [13] developed a relatively complex two-zone bulk ablation model; Yang S [14] analyzed the char layer characteristics of EPDM (ethylene propylene diene monomer) materials and, starting from the porous structure, established a porous media-based thermochemical ablation model; Wang S. X et al. [15] further considered deposition reactions based on this work and developed a porous media-based two-zone bulk ablation model; and Li Z.Y [16] established a particle erosion model based on the elastic–plastic indentation theory of brittle materials and coupled it with the thermochemical ablation model to obtain a coupled ablation/erosion calculation model applicable to EPDM insulation materials. However, the aforementioned traditional numerical ablation models all rely on processes such as mesh generation preprocessing and iterative computations, resulting in low computational efficiency.
Since the 21st century, the rapid advancement of high-performance computing and big data technologies has propelled the widespread application of artificial intelligence (AI) across numerous fields such as image recognition, autonomous driving, education, healthcare, and logistics, yielding remarkable results [17,18,19,20]. In the field of solid rocket motors, researchers have begun exploring the use of machine learning techniques to address damage detection during processes like motor manufacturing and propellant loading [21,22,23,24]. However, the sample size of experimental data obtainable from complex insulation layer ablation tests in engineering is typically limited. Under conditions of data scarcity, effectively training models and conducting meaningful learning based on machine learning methods becomes difficult, which further constrains the development of high-precision predictive models.
In 2019, Physics-Informed Neural Networks (PINNs) were formally proposed by a team led by academician George Em Karniadakis from Brown University [25]. Within just a few years, PINN technology began to develop rapidly and found applications across various industries and fields. Serving as a bridge connecting machine learning with physical modeling, Physics-Informed Neural Networks achieve a deep integration of data-driven approaches and physical priors by embedding physical constraints, such as Partial Differential Equations (PDEs), into the optimization process of the neural network. Furthermore, to date, PINNs have seen almost no application in the field of insulation layer ablation. The combination of an insulation layer ablation model and experimentally driven data within a PINN framework enhances the interpretability of purely data-driven neural networks.
Focusing on the ablation process of solid rocket motor insulation layers, this work develops a dynamic prediction model integrating three PINN-based submodels (incorporating PDEs) and two external modules (without PDEs). In contrast to traditional numerical approaches, this model avoids complex mesh generation and tedious preprocessing, thereby greatly enhancing computational efficiency. The proposed framework offers a new methodology for insulation layer design and performance evaluation, demonstrating considerable academic significance and practical engineering potential.
2. Establishment of a Prediction Model Framework and Database Architecture for Insulation Layer Ablation Rate
To construct a Physics-Informed Neural Network (PINN) model for predicting the ablation of solid rocket motor insulation layers, this study integrates the physical framework of porous media ablation with the PINN training mechanism. Addressing the challenges of high experimental costs and scarce effective data, the research systematically consolidates experimentally obtained data accumulated over the years to build a specialized database [7,16,26,27,28]. This database encompasses multidimensional parameters such as propellant formulation, gas parameters, motor operating conditions, and material ablation rates, providing crucial data support for the training and validation of the PINN ablation rate prediction model.
2.1. PINN-Based Framework for Predicting Ablation of Insulation Layer
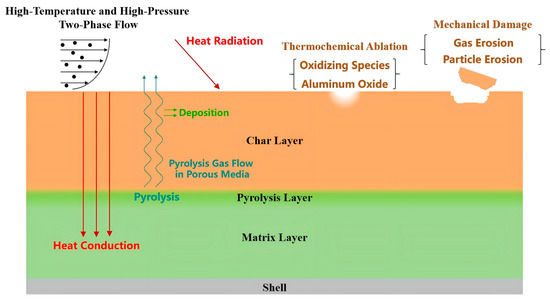
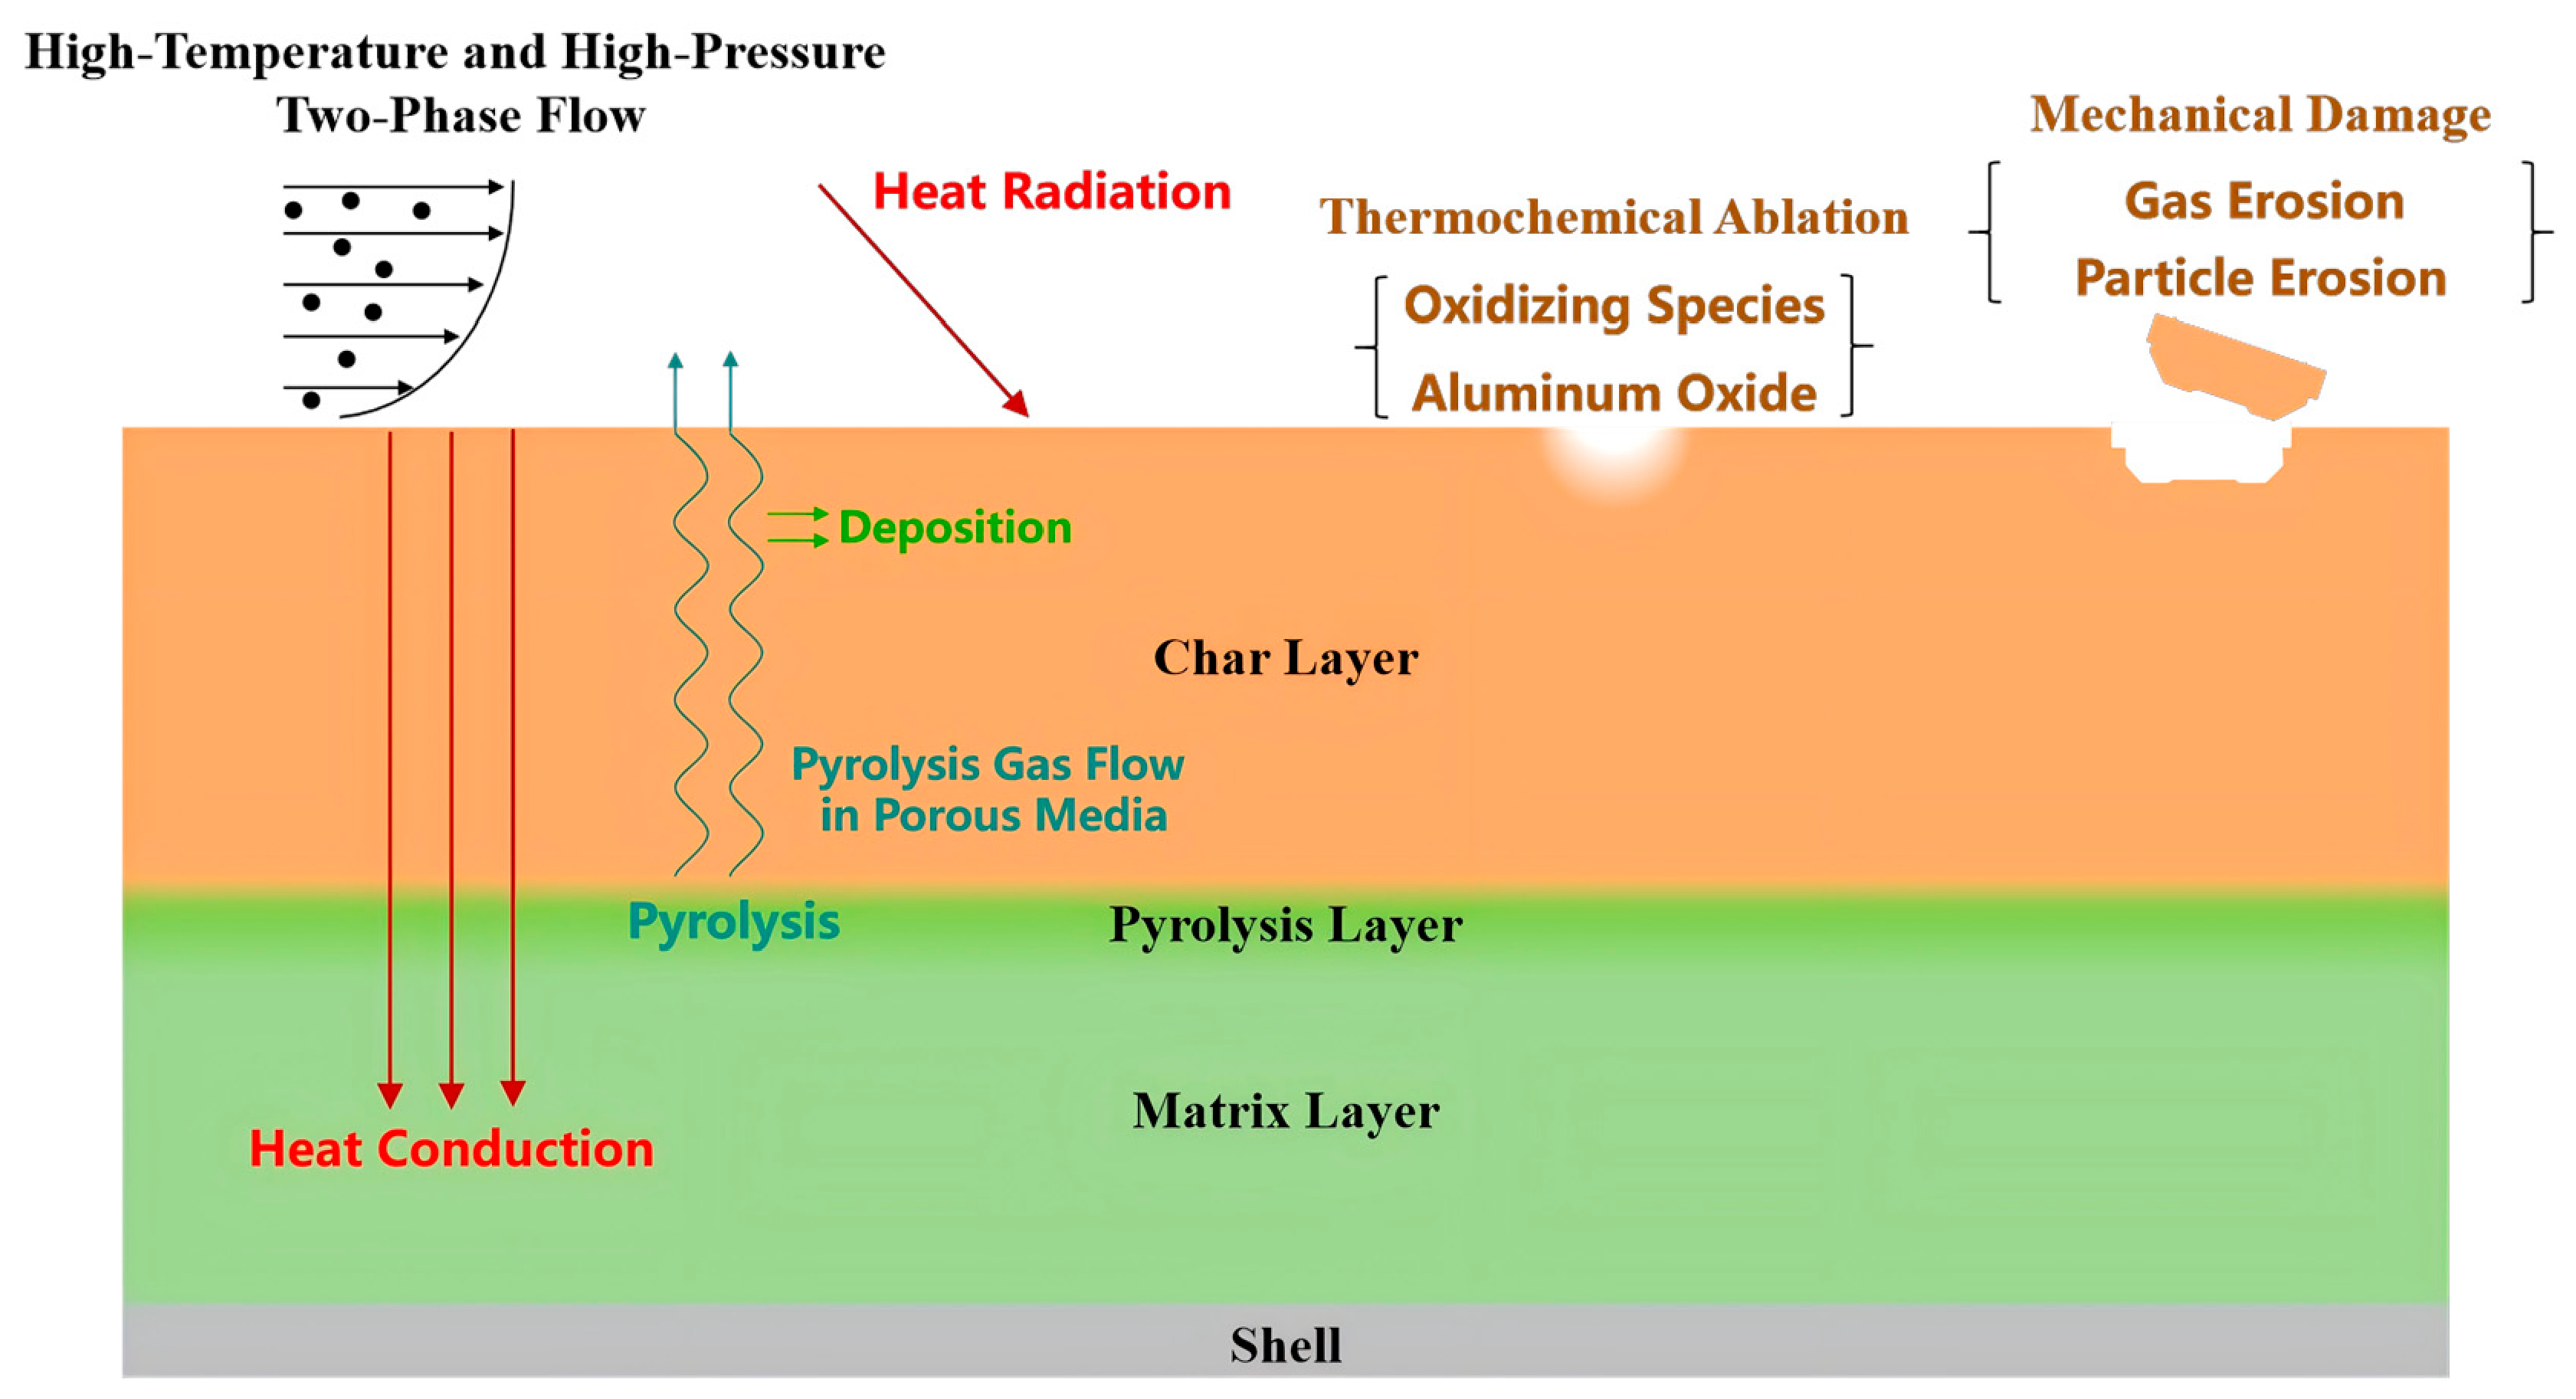
The ablation process of insulation layers is complex and coupled, involving phenomena such as flow, heat transfer, component diffusion, pyrolysis, and thermochemical ablation (Figure 2). Under certain specific operating conditions, additional factors like gas erosion and particle erosion must also be considered. This process encompasses numerous flow, heat transfer, diffusion, reaction models, and governing equations, as well as some inexact empirical formula models.
Figure 2.
Physico-chemical reactions involved in the ablation process of insulation materials.
Therefore, this paper establishes a fundamental bulk ablation model for insulation layers based on PINN by incorporating key processes and characteristics of thermal insulation material ablation. Here, is the surface temperature of the insulation material, is the pyrolysis temperature of the insulation material, and is the char temperature of the insulation material.
The first stage spans from the point when high-temperature gases act upon the surface of the thermal insulation material until the point when pyrolysis gas is generated within the heated thermal insulation material (). Since the thermal insulation material does not undergo linear ablation at this stage, only thermal conduction occurs throughout its interior. The heat flux at the surface of the thermal insulation material consists of convective heat transfer and radiative heat transfer.
The second stage begins when pyrolysis gas is generated from the insulation material until char just starts to occur on the upper surface (). At this stage, linear ablation of the insulation layer remains negligible, and material expansion processes may be disregarded. During pyrolysis, the density of the insulation material continuously decreases, forming an extremely fine pore structure within the pyrolysis layer while simultaneously releasing heat. This process involves pyrolysis gas escaping into the boundary layer, participating in convective diffusion with the boundary layer gas, and carrying away a portion of the heat. Due to the extremely small pore size at this stage, for computational simplicity in the model, the gas flow diffusion and enthalpy changes associated with this pyrolysis process are neglected, considering only the endothermic pyrolysis heat release.
The third stage begins after the char layer is formally formed and continues through the steady-state ablation process that forms the char layer, pyrolysis layer, and matrix layer (). During this process, pyrolysis gas from the pyrolysis layer within the insulating material diffuses into the gas stream through the porous structure of the char layer, transferring part of its enthalpy to the char layer. Under specific conditions, pyrolysis gas may deposit within the char layer, while gas in the boundary layer permeates into the char layer under forced convection. The oxidizing components within these gases undergo exothermic thermochemical reactions with the char layer, gradually increasing its porosity and loosening its structure. Typically, the char layer experiences greater consumption near its surface, at higher temperatures, and with higher concentrations of oxidizing components. The pores within the char layer exhibit non-uniform distribution. Under the combined effects of the gas erosion and particle erosion, spalling of the char layer occurs.
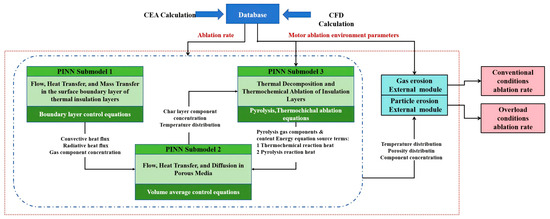
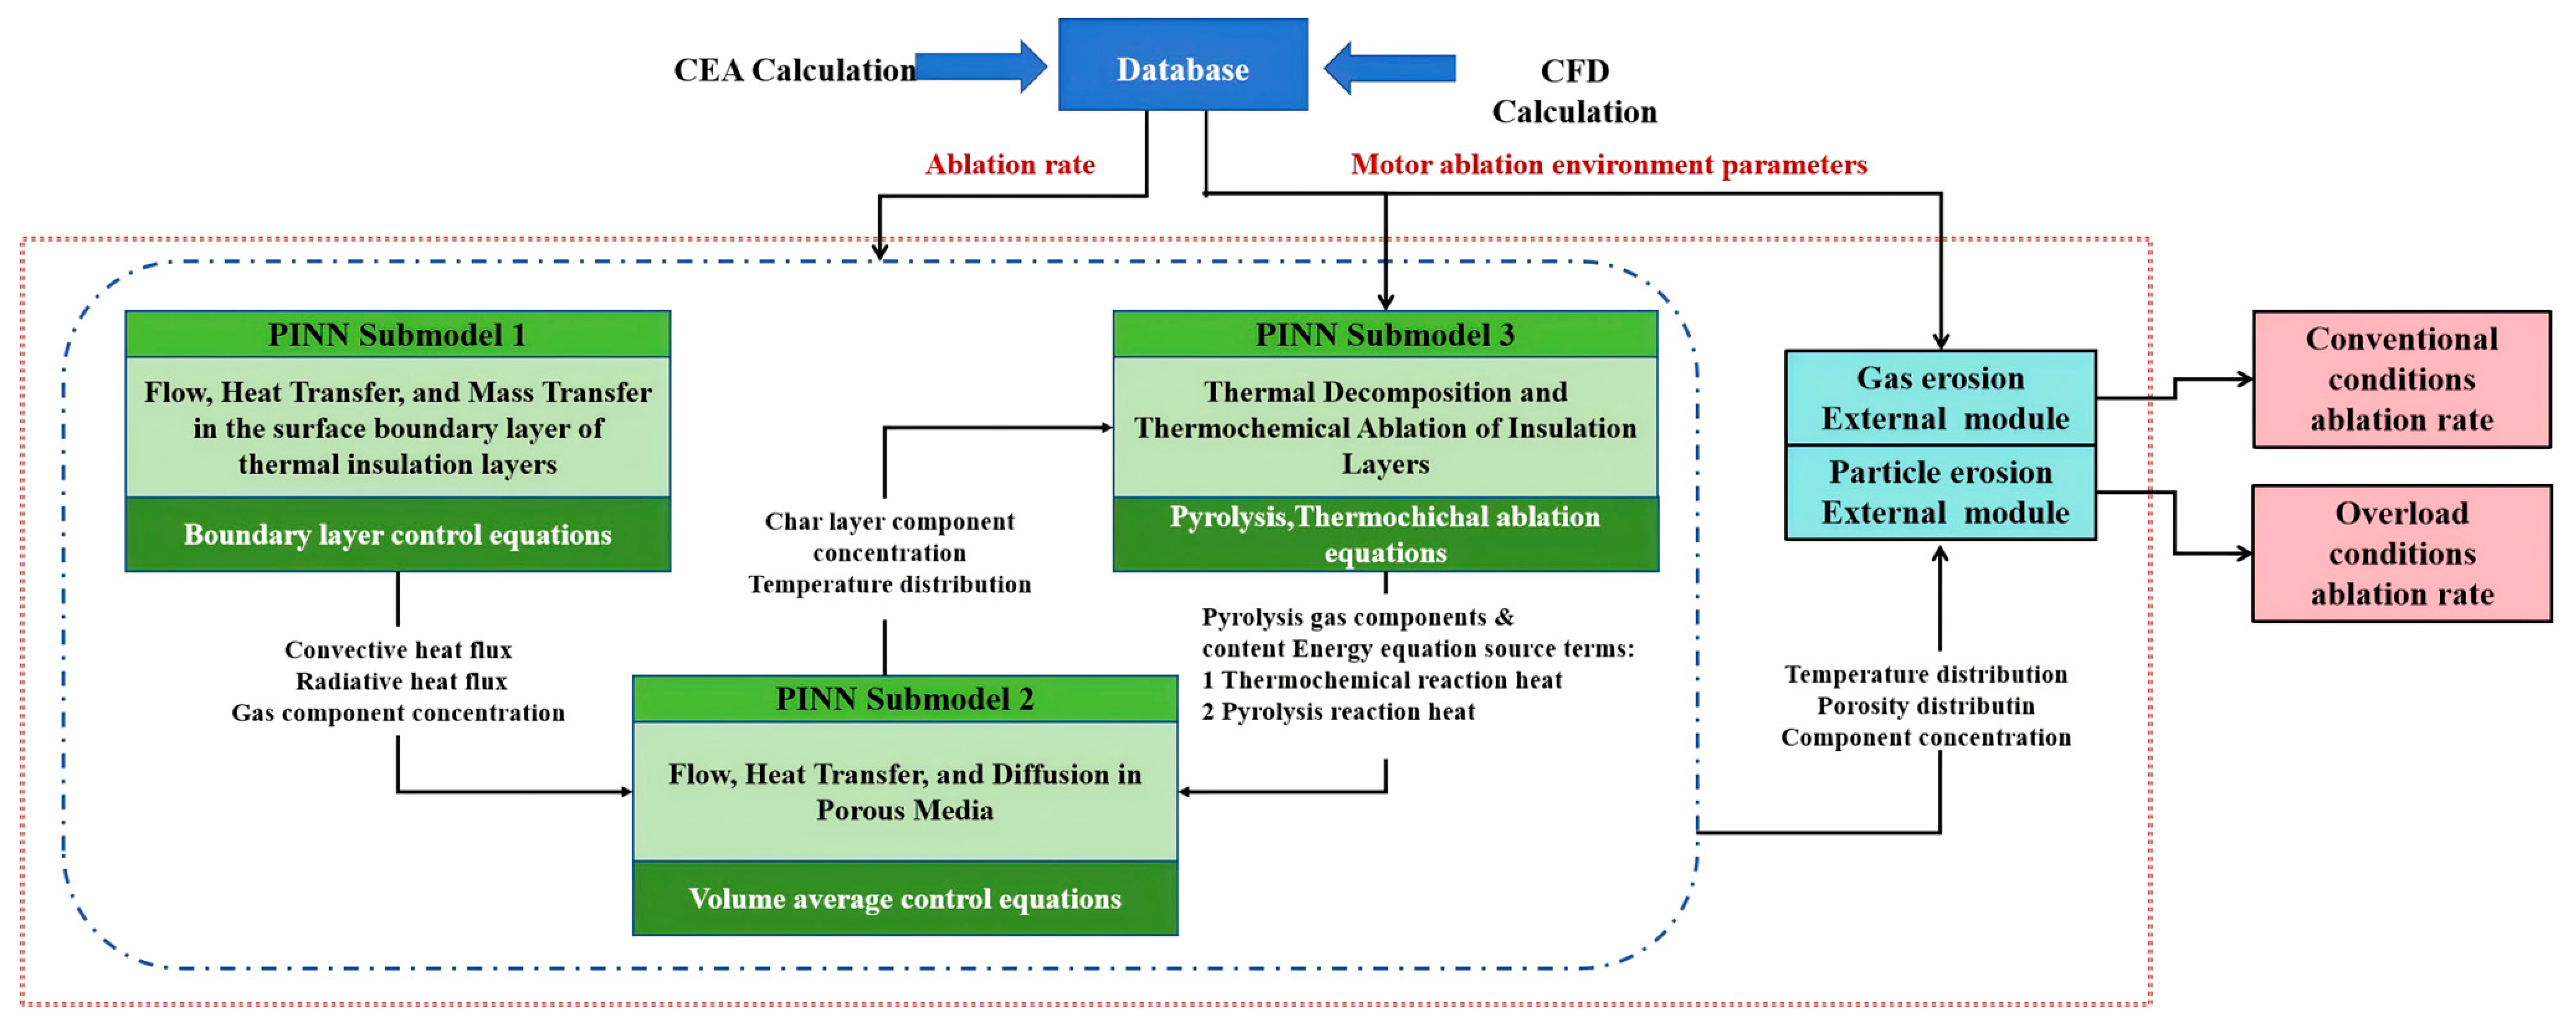
Based on the comprehensive reconstruction and analysis of the ablation process and characteristics of thermal insulation materials, three PINN submodels were first established to develop a PINN-based predictive model for the dynamic ablation process of thermal insulation layers (Figure 3):
Figure 3.
PINN-based model framework for predicting the dynamic ablation process of insulation layer.
- (1)
- PINN submodel for flow, heat transfer, and mass transfer in the surface boundary layer of thermal insulation layers.
- (2)
- PINN submodel for flow, heat transfer, and diffusion in porous media.
- (3)
- PINN submodel for thermal decomposition and thermochemical ablation of insulation layers.
Since gas erosion and particle erosion are implemented as modules with empirical formulas lacking PDE descriptions, they cannot be embedded into the PDE loss function of the PINN. Therefore, external gas erosion and particle erosion modules are developed for the PINN-based insulation layer ablation model.
2.2. Database Architecture
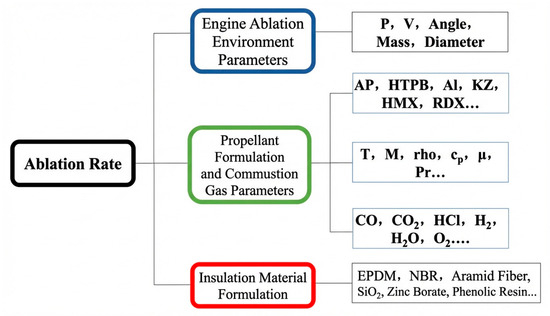
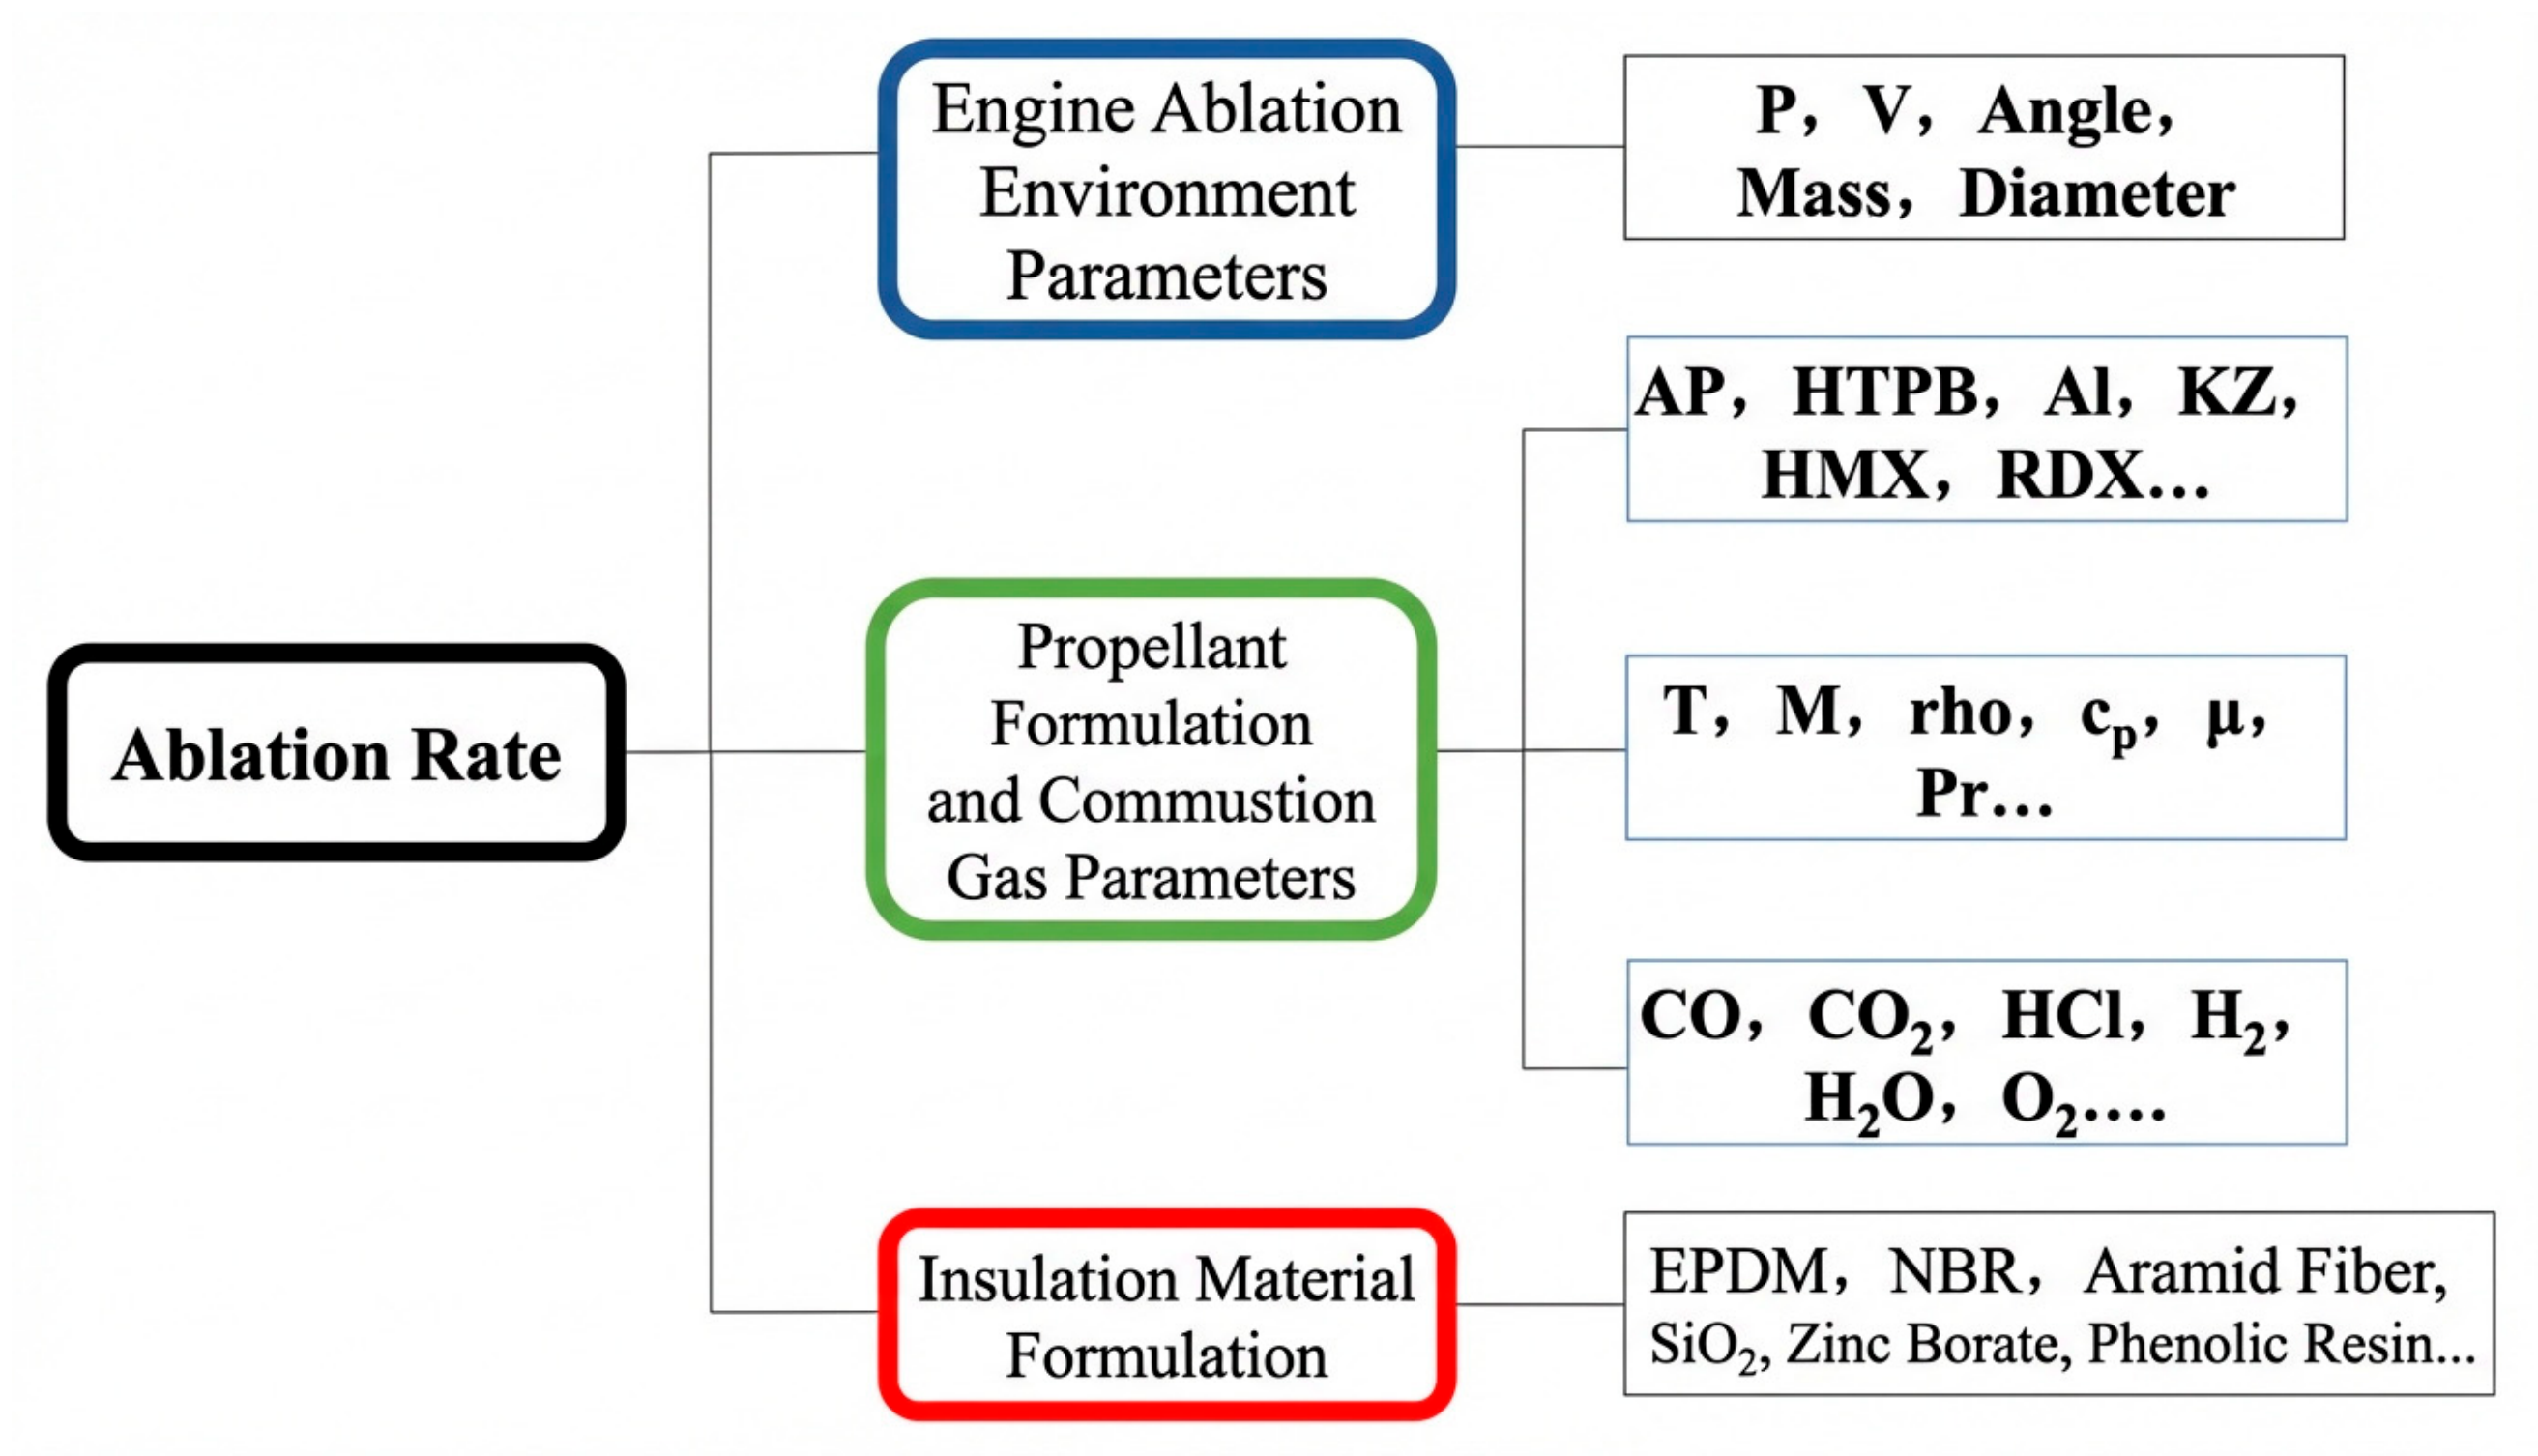
In the field of scientific research data management and analysis, the combined application of database technology and programming languages is becoming increasingly widespread. This study selected the MySQL 8.0 relational database management system, which is currently widely used in enterprise-level applications, to build a sample database of ablation experiment data. The database framework is illustrated in Figure 4.
Figure 4.
The structure of the sample library of ablation experimental data.
Based on the research team’s preliminary experimental results, an ablation database was constructed [7,16,26,27,28]. The established ablation experimental data sample repository collected ablation test data from 20 insulation layers under different operating conditions. Each experimental condition is independently reserved as a test case and excluded from training, while all remaining conditions constitute the training set. After training, predictions are made by inputting the reserved parameters and compared with experimental data. The feature columns in the database are propellant formulation and its gas parameters; motor ablation environmental parameters; and insulation material formulation. The label column data in the database is maximum char ablation rate. Table A1 shows the structure of the ablation experimental data sample repository.
3. PINN Prediction Submodel and External Modules
To address the challenge of predicting ablation in the thermal insulation layer of solid rocket motors—a complex process involving strong coupling—this study abandons the traditional approach of constructing a single integrated model. Instead, it adopts a modular modeling strategy. The core of this method lies in decomposing the ablation process. For each step of the process, a dedicated Physical Information Neural Network (PINN) submodel or external functional module is constructed based on its specific characteristics. Finally, these components are integrated into a complete prediction system through clearly defined variable relationships.
3.1. PINN Submodel for Flow, Heat Transfer, and Mass Transfer in the Surface Boundary Layer of Thermal Insulation Layers
Typically, the velocity of the gas flow within the combustor is not very high. For analytical convenience, the surface of the insulation layer can be assumed to experience laminar flow. Within the boundary layer, the velocity boundary layer thickness and the thermal boundary layer thickness are identical, and the laws governing heat and mass transfer are highly analogous, with their dimensionless solutions exhibiting similarity. Therefore, it is only necessary to solve the continuity and momentum equations to obtain the dimensionless velocity distribution. Subsequently, by applying a similarity transformation, the temperature and concentration distributions within the boundary layer are derived. Combining these with the gas-phase concentration and temperature boundary conditions provided by NASA CEA calculations, the oxidant species concentration and temperature at the surface of the insulation layer can be determined. This, in turn, allows for the calculation of the heat flux and oxidant species concentration at the insulation surface. This approach significantly reduces the solution complexity, simplifies the loss function of the PINN, and decreases the number of output parameters, thereby enhancing computational speed.
Based on the flow characteristics of the boundary layer, the following characteristic quantities are selected: the boundary layer outer boundary velocity U, the characteristic length L of the insulation layer, and the boundary layer thickness , namely
Substituting into the fundamental equations yields the dimensionless boundary layer flow equations:
The boundary conditions are as shown in Table 1:
Table 1.
Summary table of boundary conditions.
For convenience, all “~” symbols in the equations will be omitted in the remainder of this paper.
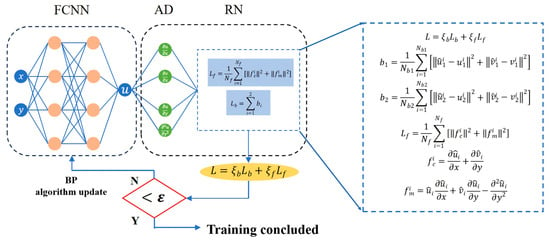
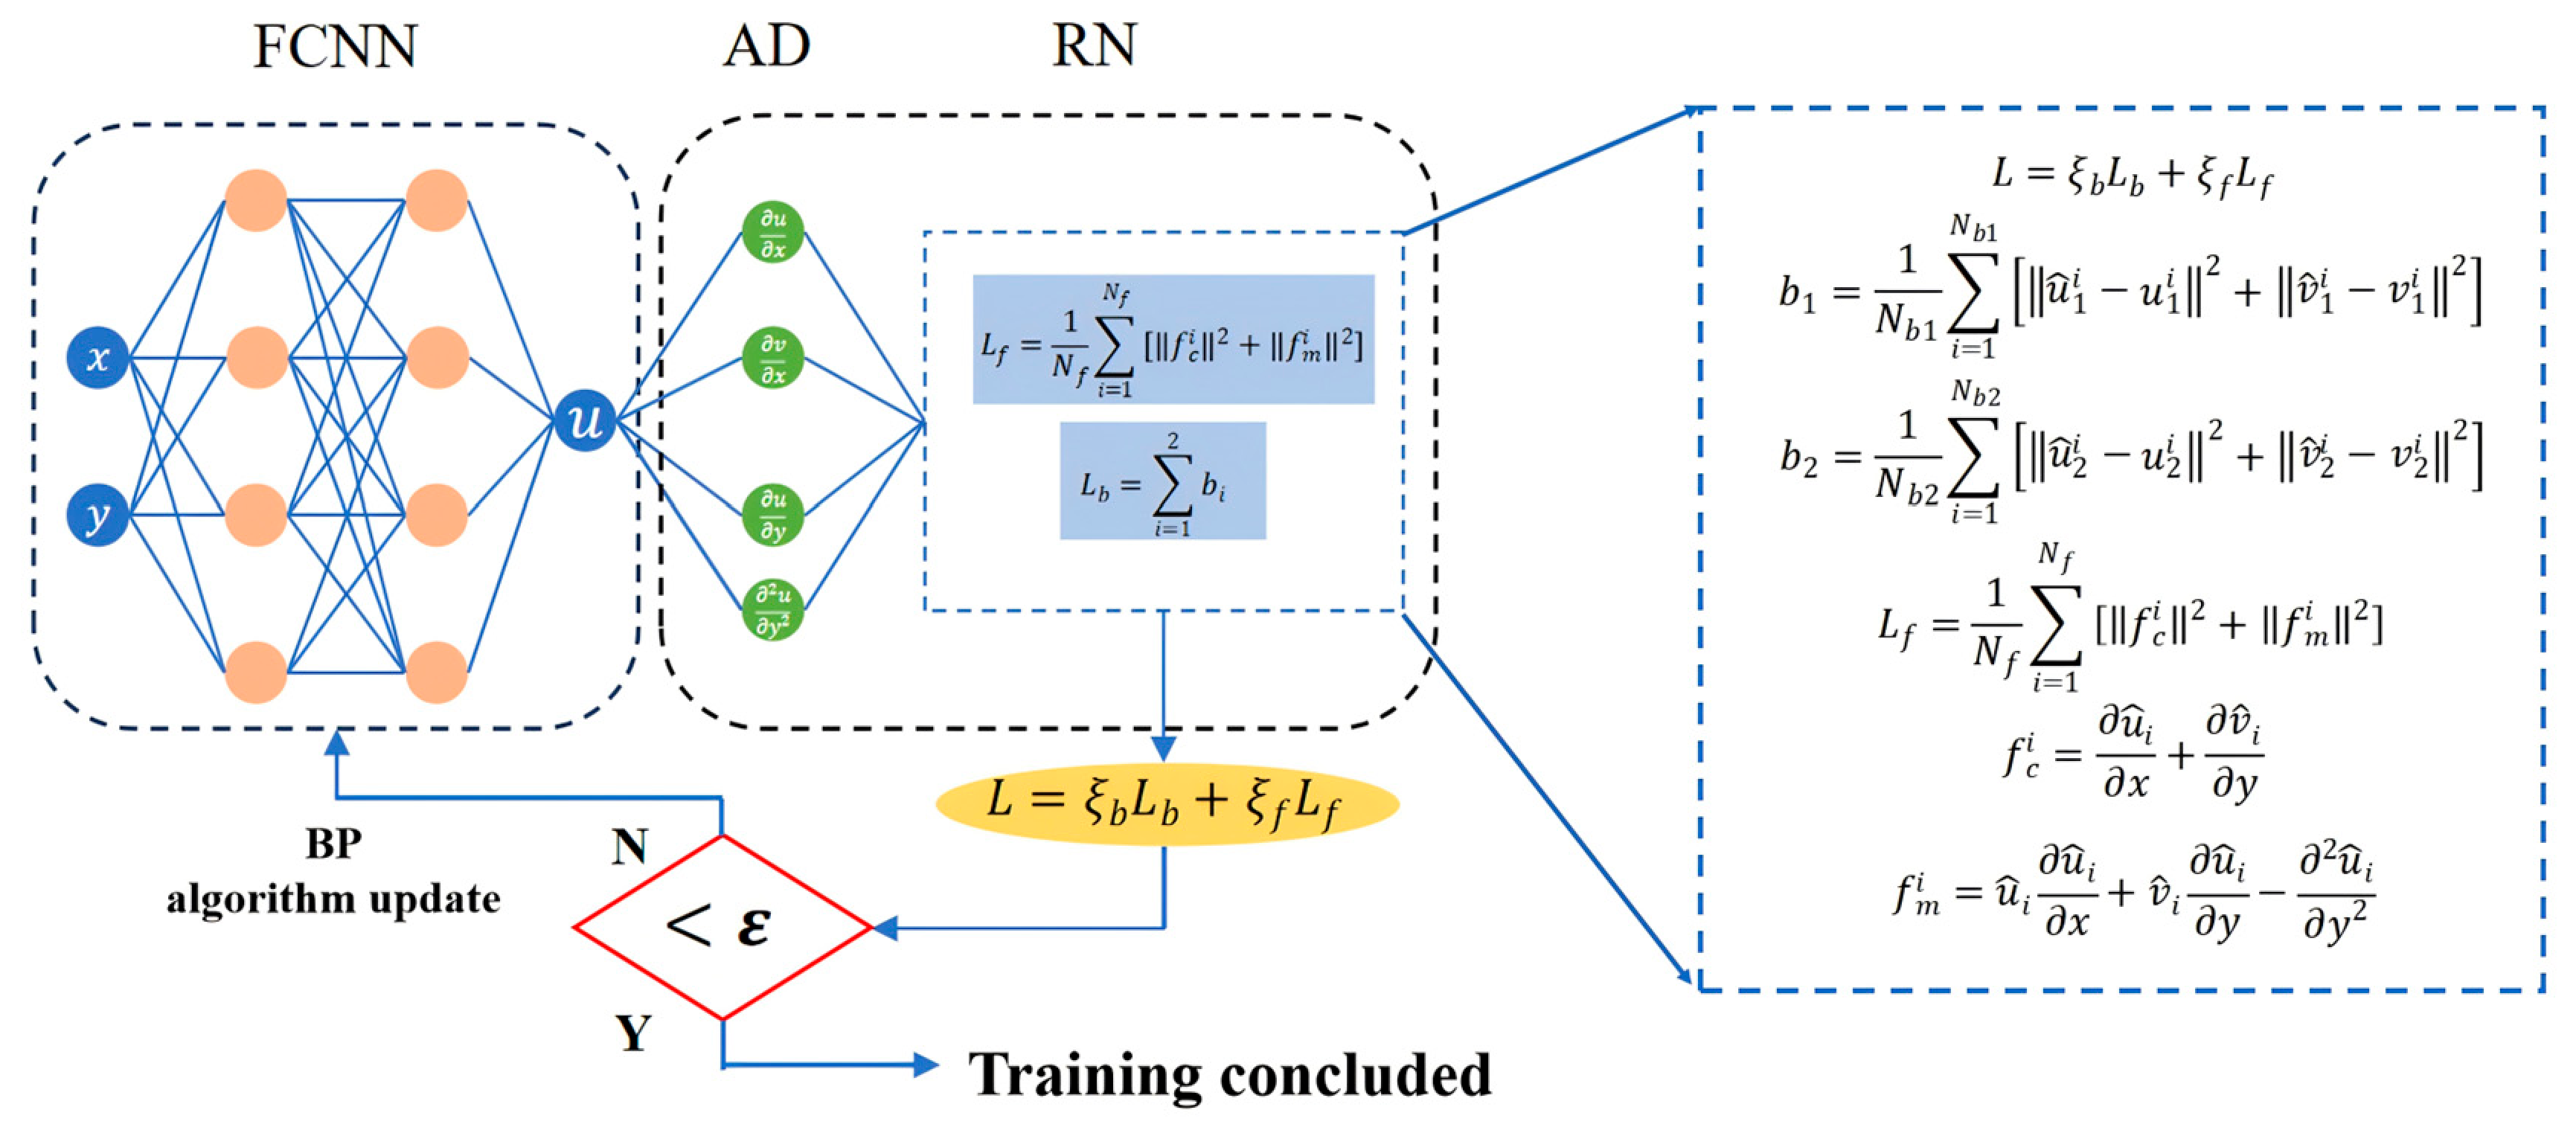
The spatial position coordinates (x, y) serve as the input to the neural network, while the boundary layer velocities , and constitute the network output. The boundary layer continuity equation, momentum equation, and velocity boundary conditions act as physical constraints. The cell is partitioned using the uniform sampling method. The training backend utilizes mainstream deep learning libraries PyTorch 2.6/PaddlePaddle-gpu 3.0.0b1. The network is configured with three hidden layers, each containing 20 neurons. The activation function is set to tanh, with Glorot uniform initialization. The learning rate is set to 0.0005. During the initial training phase, the Adam optimization algorithm accelerates training. When the loss value ceases to decrease significantly, L-BFGS is employed for fine-tuning. Training completion is defined as the loss value reaching the 1 × 10⁻⁷ magnitude and showing no further significant decrease.
The network structure diagram of the PINN prediction submodel for solving heat and mass transfer in boundary layer flow is shown in Figure 5 below.
Figure 5.
Boundary layer physical information neural network solution architecture.
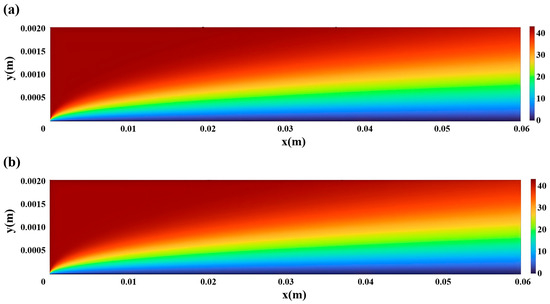
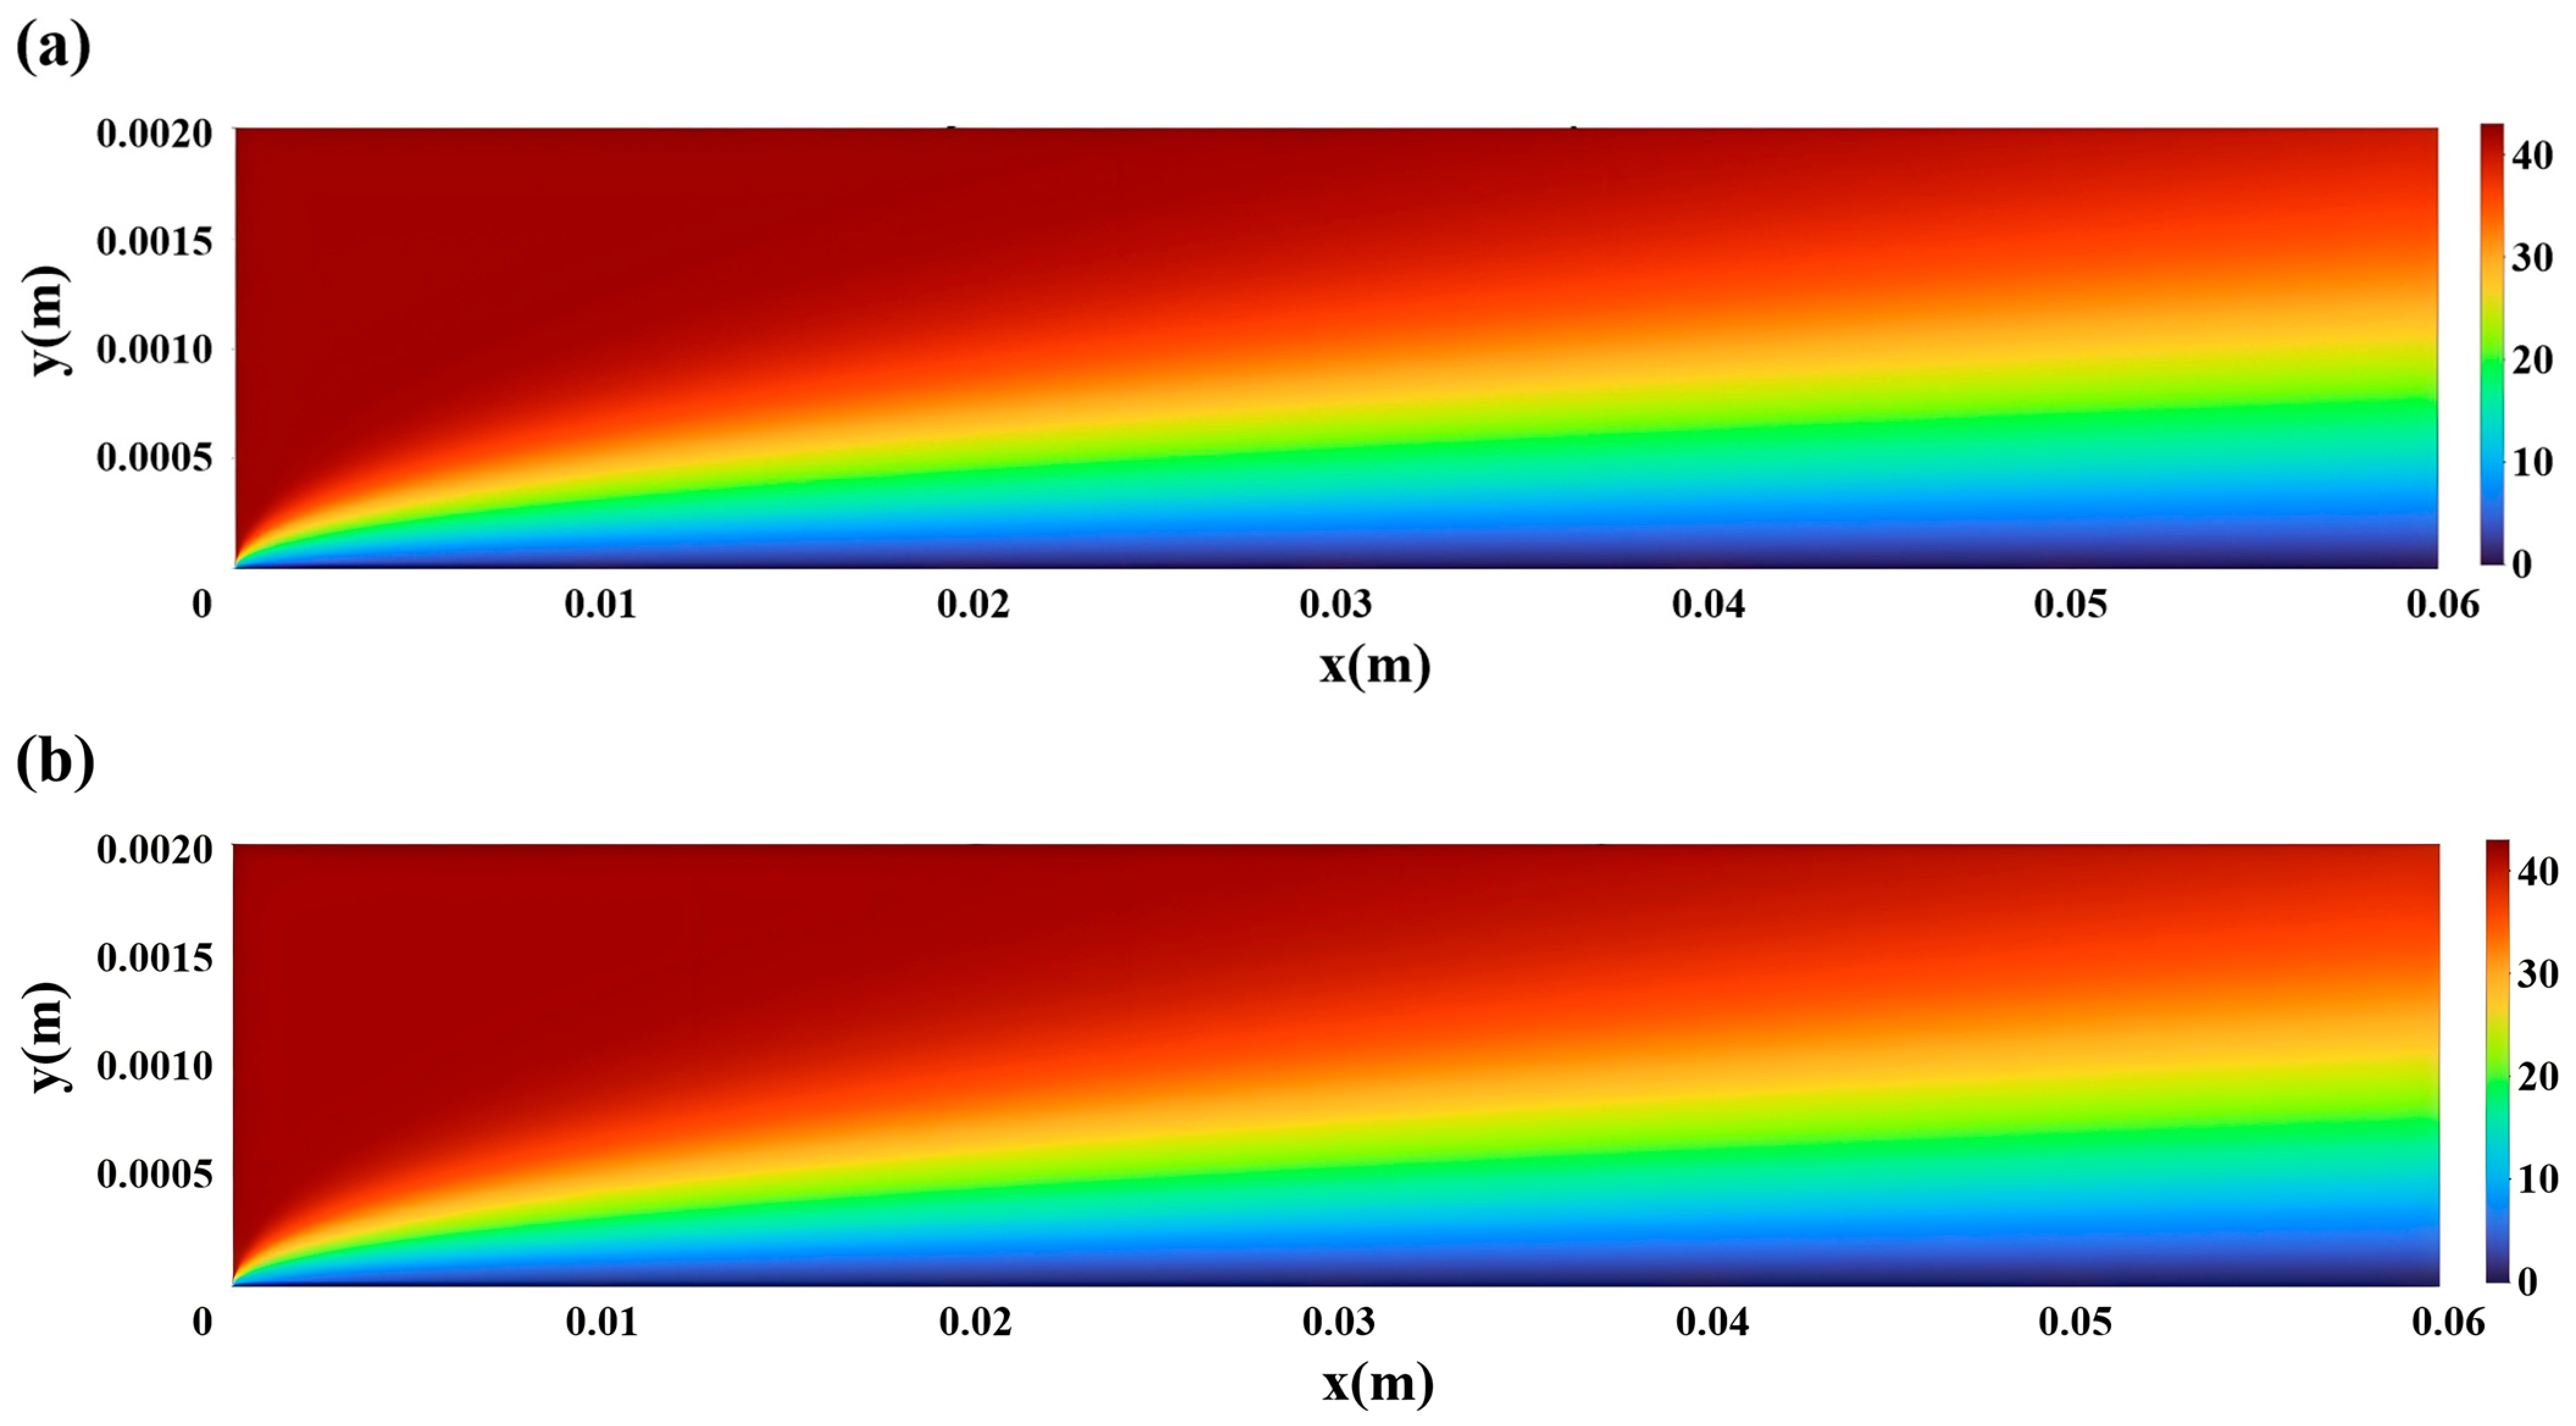
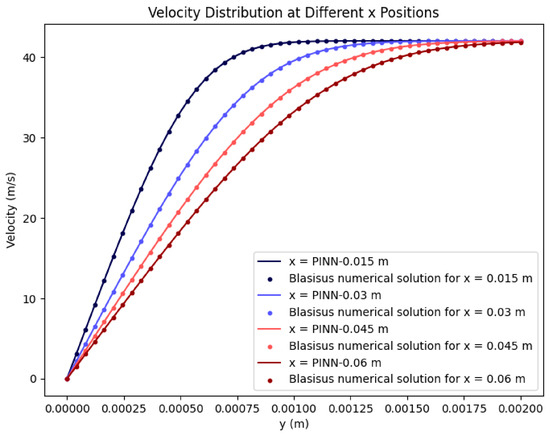
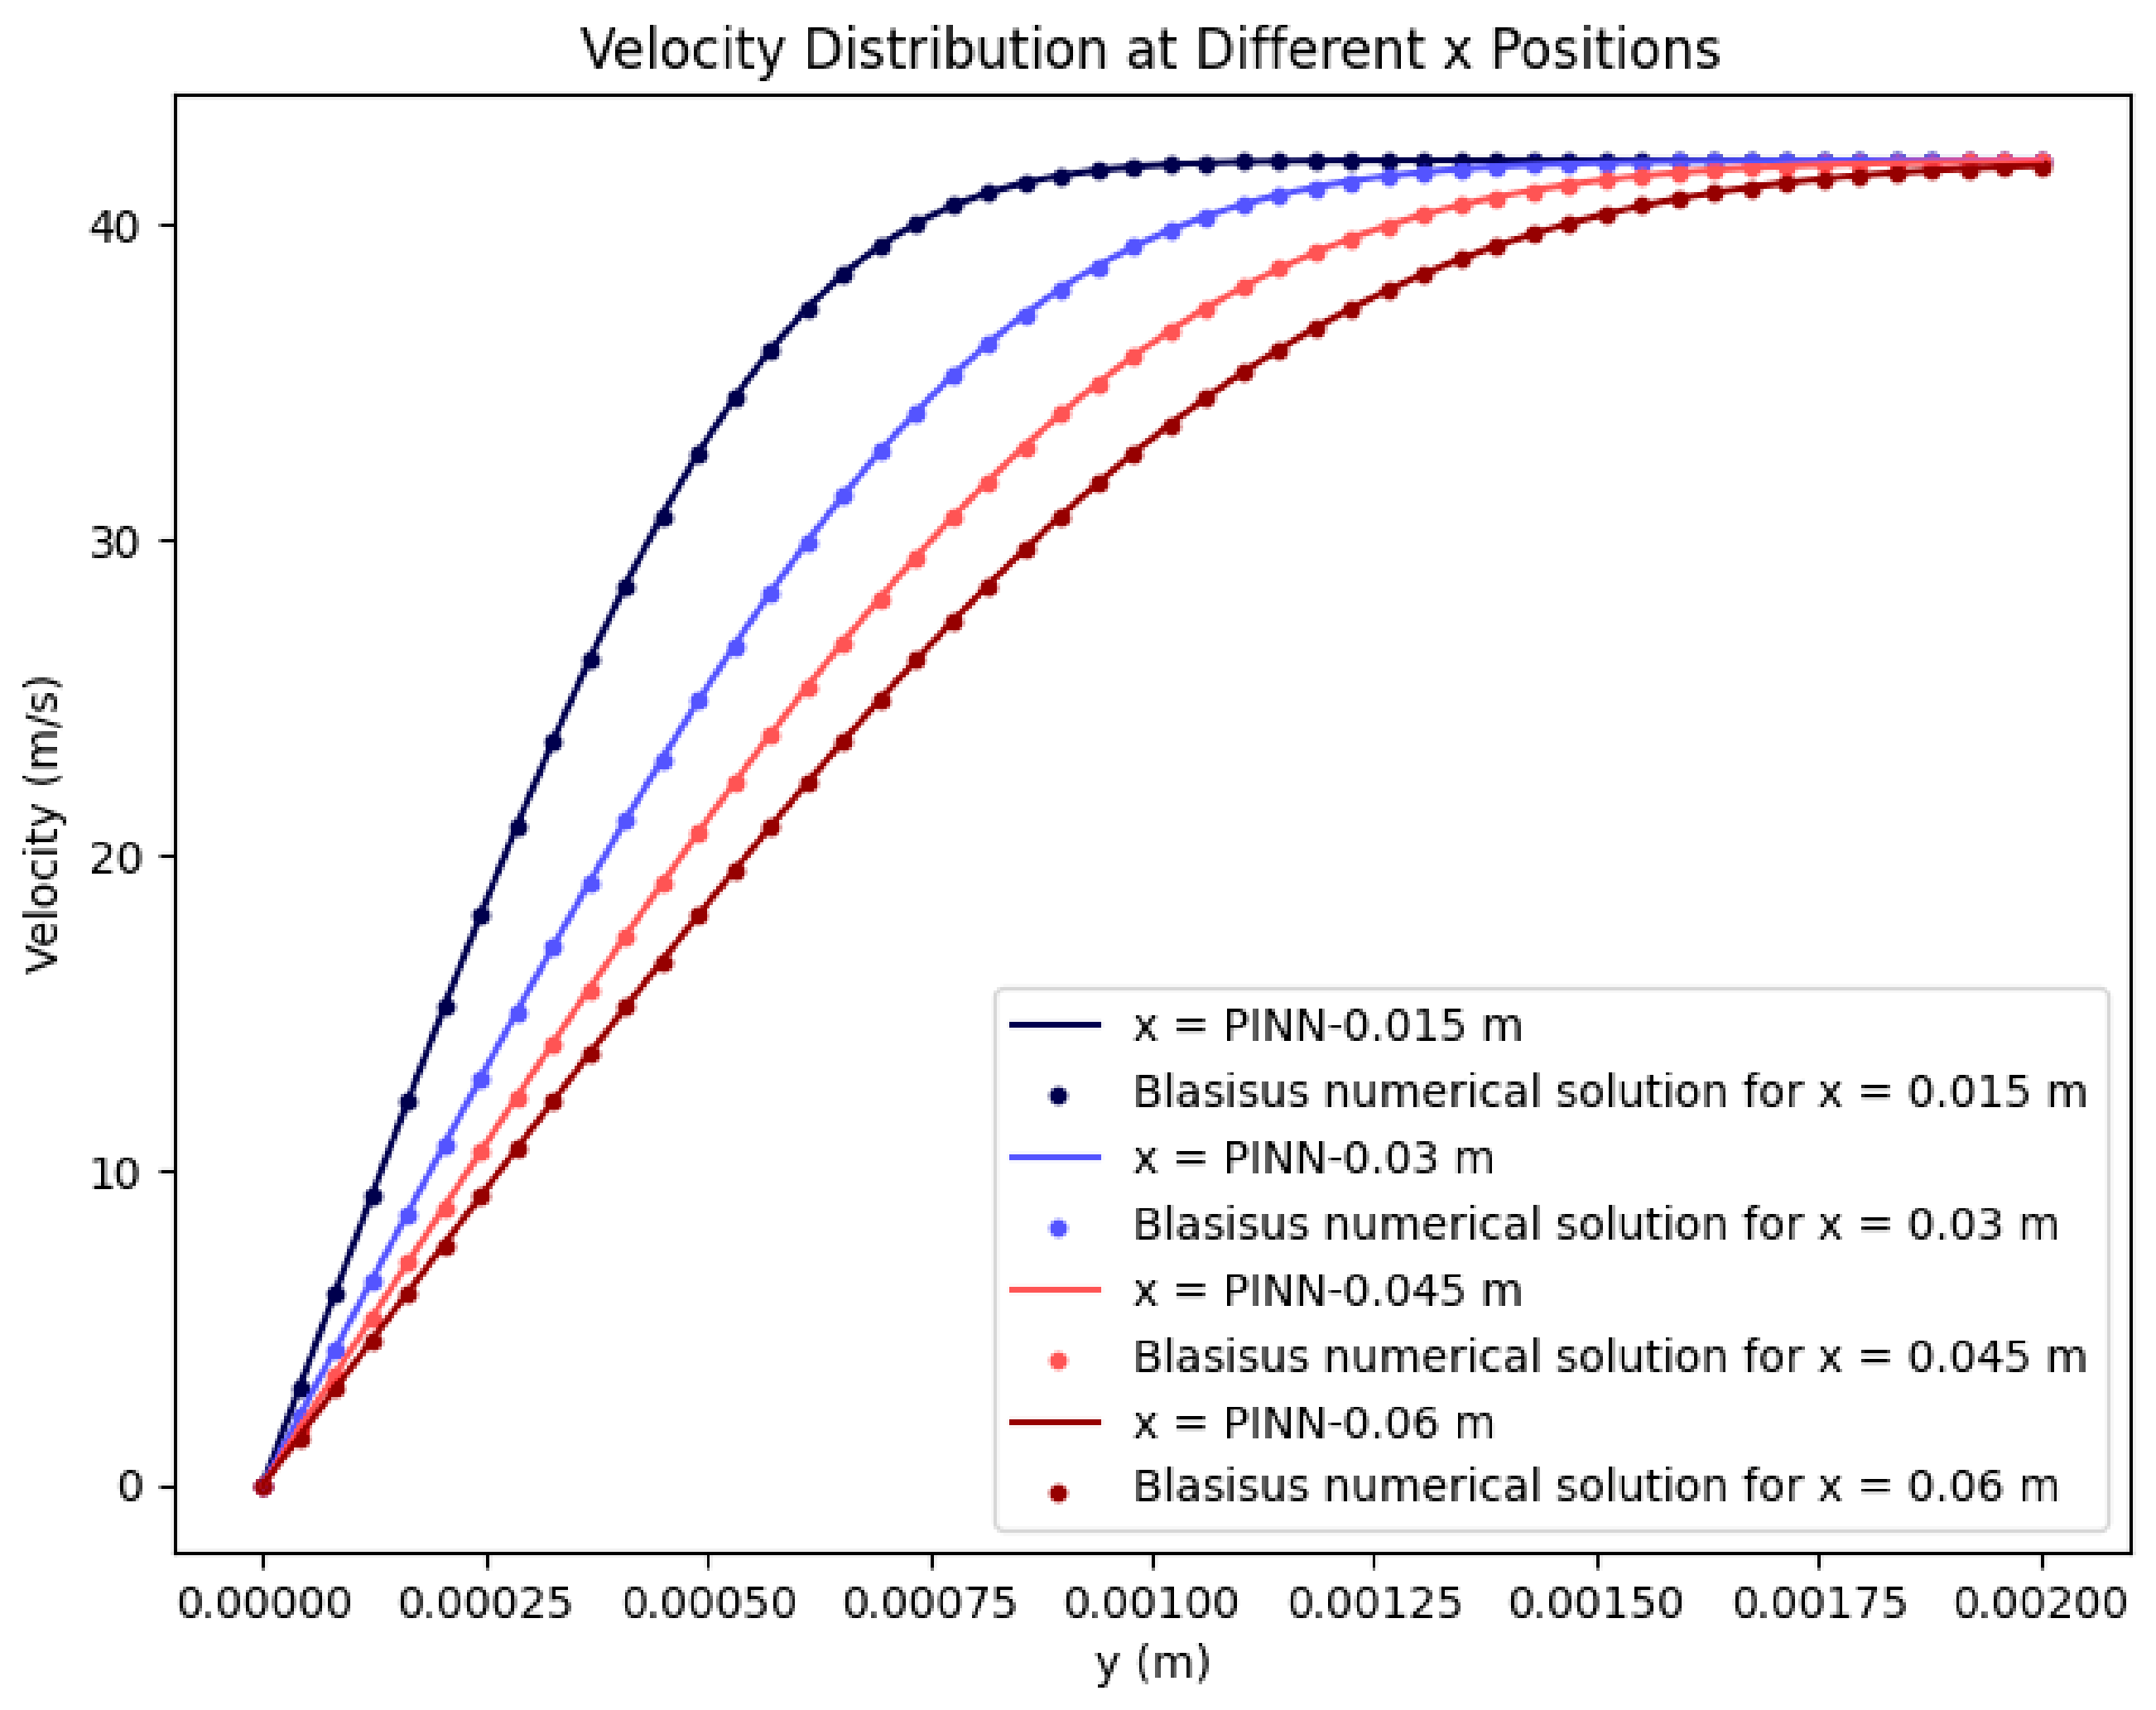
This section employs a fourth-order Runge–Kutta method to obtain a Brauchner-like numerical solution for the boundary layer over a flat plate, using mathematical software programming. The relative mean square error between the numerically accurate solution for the boundary layer velocity and the neural network prediction is calculated to evaluate the accuracy of the trained model. Flow conditions: velocity 42 m/s, kinematic viscosity 9.6985 × 10⁻³ m2/s. Figure 6 shows the velocity cloud maps for the boundary layer of the numerically exact solution results and the neural network prediction results; Figure 7 compares the velocity results at different locations. The relative mean square error for the validation calculation is 9.423 × 10⁻⁴.
Figure 6.
Comparison of velocity cloud maps: (a) PINN; (b) Blasius numerical solution.
Figure 7.
Velocity contrast distribution curve at different positions.
3.2. PINN Submodel for Flow, Heat Transfer, and Diffusion in Porous Media
Based on the volumetric ablation model and the physical model of the char layer in porous media, the volume-averaged energy, continuity, momentum equations, and component diffusion equations for the char layer, pyrolysis layer, and matrix layer of insulation layers are derived using the volumetric averaging theory for porous media. This PINN submodel is employed to compute the temperature field and component concentrations within the insulation materials. Subsequently, pyrolysis and char temperatures are determined by analyzing heating rates to identify the char layer, pyrolysis layer, and matrix layer. This prepares for subsequent pyrolysis and thermochemical calculations.
The char layer is a porous, permeable medium; thus, it is composed of both a solid skeleton and a diffused gas phase. The governing equations for this composite system require consideration of both solid and gas phase factors. This section applies the “volume-averaged” theory. Considering that the char layer’s framework permeates the entire volume it occupies, with interconnected pores filled by single-phase or multi-phase fluids, a control volume is selected within the porous medium. This control volume V is significantly larger than microscopic pore dimensions yet substantially smaller than the macroscopic porous medium volume. It is assumed to contain fluid volume Vf and solid volume Vs. Treating the char layer as a porous medium, the volume averaging method is applied to derive the mass, momentum, and energy conservation equations, along with the component diffusion equation. These can be integrated into unified governing equations for computational analysis [29].
Mass Conservation Equation:
where
is volume-averaged velocity of the gas phase in porous media.
Momentum Conservation Equation:
where
is gas phase density; is gas phase intrinsic mean pressure; is gas dynamic viscosity coefficient; is permeability of porous media.
Energy Conservation Equation:
where
is the ratio of specific heat capacity between permeable porous media and fluids; is effective thermal diffusion coefficient of porous media; is specific heat capacity of gas at constant pressure; is specific heat capacity of the char skeleton; is thermal conductivity of gas; is thermal conductivity of char skeleton; is char skeleton density; and is the heat source within the char layer.
Beyond the char layer, the energy equations for the pyrolysis layer and the initial material matrix layer can also be unified with that of the char layer by defining relevant parameters. The coefficients in the energy equations for each layer are shown in Table 2.
Table 2.
Energy equation coefficients.
Component Diffusion Conservation Equation:
Gas diffusion occurs within the char layer of porous media. Pyrolysis gas from the insulation layer and combustion gas from the boundary layer diffuse to the surface and interior of the char layer. Oxidizing components within these gases undergo thermochemical reactions with the char layer, consuming it. The concentration of oxidizing gases within the char layer drives the thermochemical ablation process. Therefore, diffusion models for each gas component must be established to calculate their concentration distributions.
where
is Density of the mixed gas; is the intrinsic average concentration of the component; is the mass generation rate per unit volume; and D is the component diffusion coefficient (). According to Fick’s diffusion law, μ is the dynamic viscosity coefficient of the gas, and Sc is the Schmidt number.
The backend utilizes mainstream deep learning libraries PyTorch/PaddlePaddle. The PINN neural network is constructed using the DeepXDE algorithm, which facilitates automatic differentiation of the control equations without requiring discrete steps. The activation function selected is Elu, and the initialization method chosen is He uniform. All other methods are identical to those of the submodel. The neural network solution architecture for physical information in porous media is the same as Submodel 1.
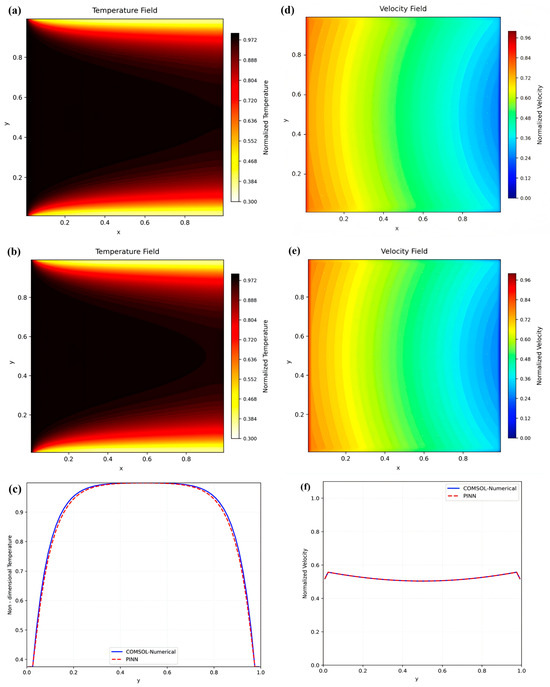
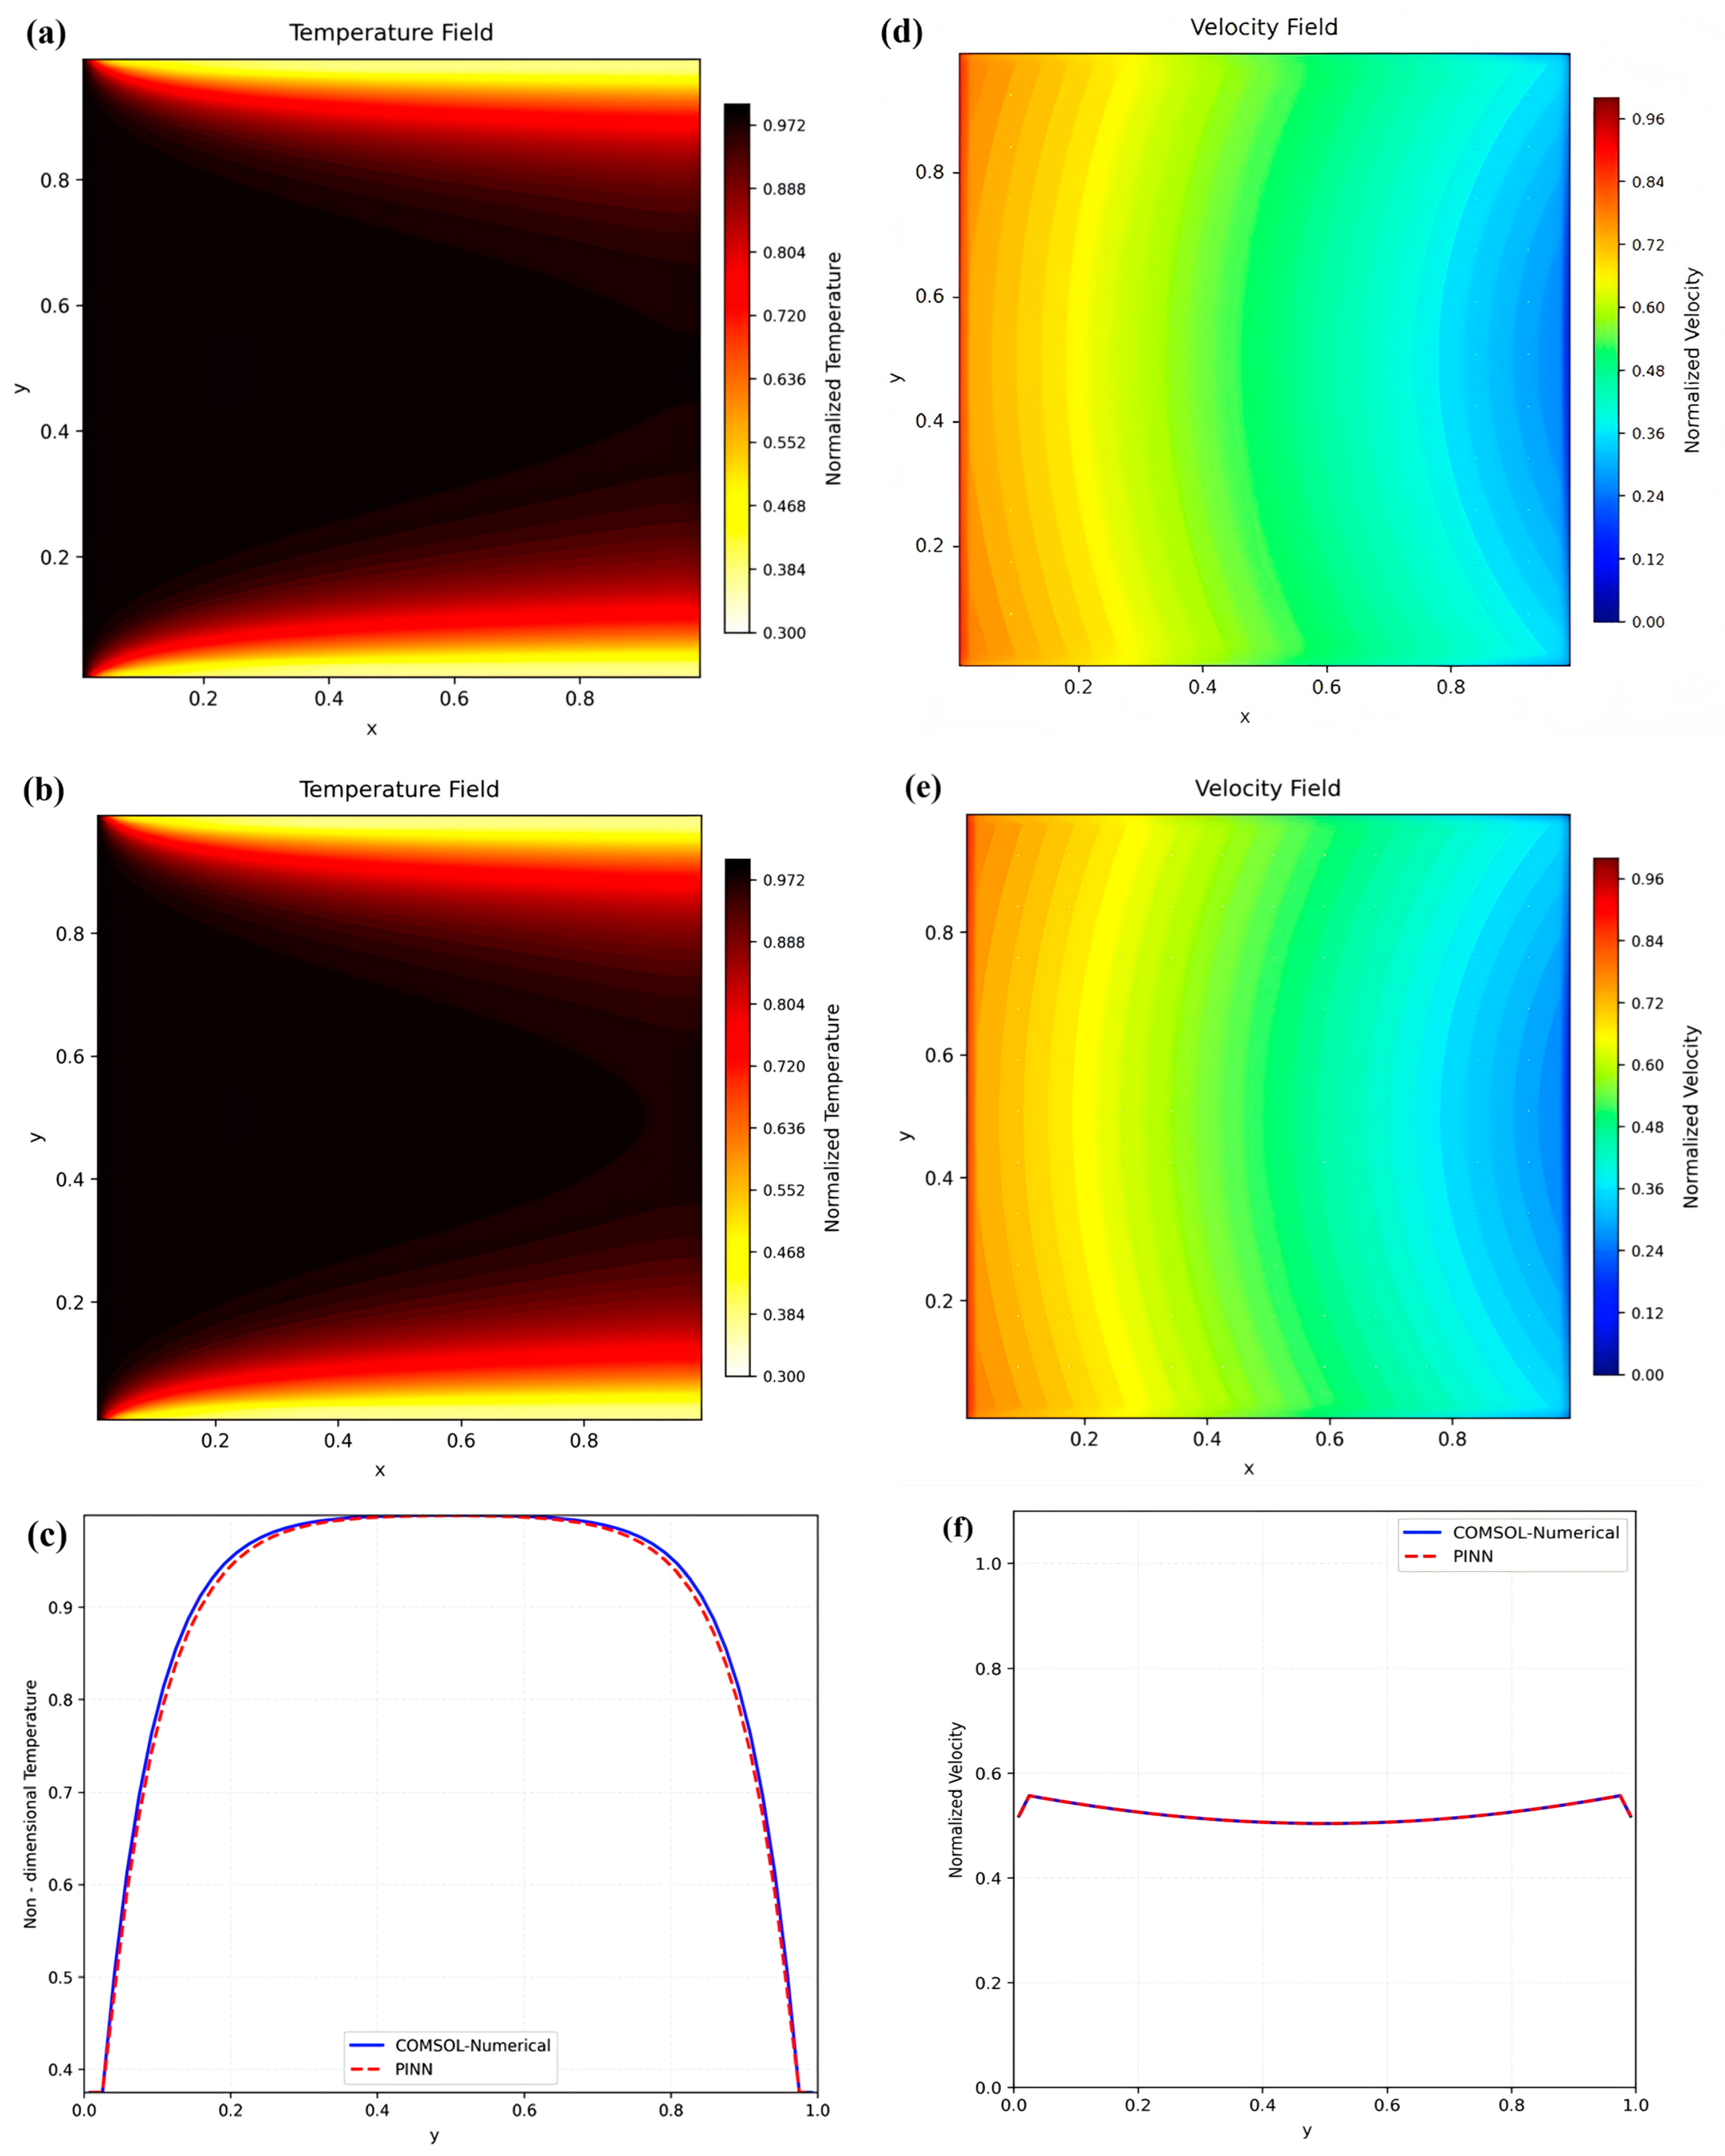
The validation case involves a dimensionless square computational domain, focusing solely on flow and heat transfer within a porous medium. The entire region consists of a uniformly distributed homogeneous porous medium. High-temperature gas enters from the left boundary with a velocity and temperature of 1 and a porosity of 0.85. The following two sets of figures present the dimensionless temperature field distribution and velocity field distribution, respectively. Figure 8a,d displays the computational results from COMSOL 6.2, while Figure 8b,e shows the prediction results from PINN Submodel 2 established in this paper, which does not account for thermochemical ablation and pyrolysis. The distribution curves of the dimensionless temperature and velocity along the Y-direction at the position x = 0.5 are shown in Figure 8c,f. It is evident that the computational results show good agreement, with a maximum error of 2.3% for the dimensionless temperature and 0.03% for the dimensionless velocity. For practical ablation calculations, this error has a negligible impact on the ablation process, thus remaining within an acceptable range overall. In summary, the accuracy of the PINN-based submodel for predicting flow, heat transfer, and diffusion in porous media established in this section has been preliminarily validated.
Figure 8.
Comparison of dimensionless temperature and velocity predicted by commercial software and PINN: (a) COMSOL calculate temperature; (b) PINN prediction model calculate temperature; (c) line graph of temperature error at x = 0.5; (d) COMSOL calculate velocity; (e) PINN prediction model calculate velocity; (f) line graph of velocity error at x = 0.5.
3.3. PINN Submodel for Thermal Decomposition and Thermochemical Ablation of Insulation Layers
Based on the temperature and concentration prediction results from Submodel 2, pyrolysis calculations are performed in the formed pyrolysis layer, while thermochemical ablation calculations are conducted in the char layer. Simultaneously, the generated pyrolysis gases diffuse and overflow into the char layer, carrying away enthalpy. The enthalpy associated with pyrolysis heat absorption, thermochemical reaction heat release, and the pyrolysis gases entering the char layer are incorporated into the porous medium’s fluid flow, heat transfer, and diffusion physical information neural network submodel for coupled calculation as diffusion terms and energy source terms, respectively.
During the ablation reaction process, EPDM thermal insulation material undergoes pyrolysis upon reaching the pyrolysis temperature, absorbing heat in the process. Simultaneously, pyrolysis gases escape from the surface of the char layer, resulting in mass loss of the insulation material. Treating the thermal insulation material as a unified system, the pyrolysis reaction kinetics equation for EPDM thermal insulation material is provided in Reference [30].
where R is the ideal gas law constant; T is the temperature recorded at this moment for the thermal insulation material; and α is the Reaction Degree of EPDM Insulation Material.
where is the initial density of thermal insulation material; is the current density of thermal insulation material.
According to the law of conservation of mass, assuming all products of the pyrolysis process of the insulation material are gases, and the generation rate of pyrolysis gases equals the pyrolysis rate of the insulation material, the mass generation rate of pyrolysis gases () is
Pyrolysis gases are not only emitted in gaseous form but also deposit within the char layer, causing it to form either a dense or porous structure. Experiments by Ma Chenyang [19] concluded that this structure is influenced by the phase state of SiO2 within the char layer during ablation. In regions where SiO2 exists as a liquid phase (mid-to-upper regions of the char layer, where temperatures exceed the melting point but remain below the boiling point), SiO2 promotes the discharge of pyrolysis gases. Therefore, a correction factor is introduced to account for the enhancing effect of liquid SiO2 on the deposition rate of pyrolysis gases.
The calculation method for the gas-phase deposition rate per unit area of the char layer pores is provided in Reference [19].
where is the Gas Partial Pressure in the Reaction Zone; T is the Reaction Zone Temperature. is the Liquid SiO2 Promotion Correction Factor.
Thermochemical ablation primarily describes how thermochemical reactions consume the char layer and calculates the reaction heat of the chemical process, thus requiring confirmation of the reaction components and reaction types. The thermochemical reaction kinetic parameters referenced in this paper are provided in [7].
The primary chemical reactions discussed in this paper are
C + CO2 → 2CO
C + H2O → CO + H2
Beyond determining the reaction type, it is more crucial to establish the heat released during the chemical reaction and the consumption rate of chemical reaction C. The reaction rate is calculated using the Arrhenius equation [7], thereby yielding the formation or consumption rates of each substance:
Further calculations yield the reaction heat for the primary thermochemical ablation reactions within the char layer:
The heat of chemical reaction per unit area of the char layer per unit time is calculated as follows:
The training backend employs mainstream deep learning libraries PyTorch/TensorFlow, with activation functions selected as ELU/ReLU. All other settings remain identical to Submodel 2.
The network architecture diagram for the PINN prediction submodel addressing pyrolysis of insulation materials and thermochemical ablation is the same as Submodel 1.
As mentioned earlier, Submodel 3 is strongly coupled with Submodel 2 and has a bidirectional relationship, making it difficult to verify independently. Therefore, Submodel 3 was validated by comparing the predicted insulation ablation results under conventional conditions with experimental data.
3.4. Gas Erosion External Module
The gas erosion of char layers in gas-phase environments is primarily influenced by factors such as gas flow velocity, ambient pressure, high-temperature structural strength of the char layer, and so on. Currently, the specific mechanisms of these factors remain incompletely understood, and the mechanical behavior characteristics of char layers under high-temperature operating conditions are still unclear. Consequently, it is challenging to establish quantitative evaluation criteria for gas-flow erosion from the perspective of material mechanical strength.
Experimental data indicate significant variations in surface porosity of char layers under different operating conditions, with gas flow velocity being the dominant influencing factor in the gas-flow erosion process [27]. Based on experimental observations, the measured surface porosity is defined as the critical porosity. A mechanism hypothesis proposes that delamination failure occurs when the char layer porosity reaches this critical value. Considering that gas flow velocity primarily drives erosion through shear stress generation, experimental data fitting yields the functional relationship between the critical surface porosity of the char layer and shear stress:
In the expression relating critical porosity to shear force, critical porosity is obtained through scanning electron microscope image analysis and defined as the ratio of pore area to total area on the observed surface (surface porosity). Characterizing the physical properties of the char layer requires volumetric porosity (the ratio of total pore volume to total volume of the porous medium), necessitating a reasonable mathematical conversion of surface porosity. A quantitative relationship between bulk porosity and surface porosity was established through theoretical derivation, with the specific derivation process as follows [27]:
where is the volume porosity; is the surface porosity.
The thermal driving force for char layer ablation comes from the thermal radiation and convective heat transfer from the high-temperature combustion gas in the motor to the insulation material. Among these is the radiative heat flux:
where is the effective radiation coefficient. ; is the gas temperature.
The convective heat transfer coefficient is calculated based on the similarity criterion for turbulent forced convection:
where is the specific heat capacity of the combustion gas at constant pressure; is the thermal conductivity of the gas; is the dynamic viscosity of the combustion gas; and is the mass flux at the calculated cross-section.
3.5. Particle Erosion External Module
The particle erosion external module developed in this paper comprises two core components: first, a particle erosion model based on the Oka model for predicting the erosion characteristics of insulation layer materials; second, a two-phase flow heat transfer model for analyzing the thermal environment of walls under high-temperature two-phase gas convective erosion conditions.
Since Lan Finnie established the Finnie particle erosion model in 1960 through theoretical analysis, which quantifies the relationship between material erosion rates and impact angle/velocity, numerous scholars have conducted systematic research on particle erosion phenomena. By considering the coupled effects of multiple factors, they have developed a series of targeted theories and computational models, such as the Bitter model, Neilson–Gilchrist model, Hutchings model, Haugen model, and Oka model. Among these, the Oka model, constructed based on empirical formulas, has gained widespread application and recognition due to its comprehensive parameter system and high computational accuracy. Wen XF. et al. [31] conducted numerical simulations of particle erosion characteristics in the insulation layer of solid rocket motors based on the Oka model. Their findings were validated against particle erosion test results from seven ground-simulated overload experiments. The results demonstrated that the Oka particle erosion model possesses reliable predictive capability and computational accuracy, effectively forecasting particle erosion characteristics in the insulation layer. In light of this, the Oka model is adopted as the foundation for constructing the PINN model in this paper.
The particle erosion rate Ef refers to the mass of insulation layer material eroded per unit area per unit time by particles such as Al2O3 impacting the insulation layer wall. Its calculation formula is
where Af is the unit erosion area; is the mass flow rate of particles; and is the erosion char layer. is the erosion ratio.
where is the erosion reference ratio; is the particle reference velocity; is the particle reference diameter; and is the relationship between erosion change and angle can be calculated as follows:
where is the erosion angle; HV is the Vickers hardness.
During the combustion of aluminum-based composite propellants, heat transfer between the high-temperature two-phase combustion gas and the wall under erosion conditions significantly deteriorates the thermal environment of the engine inner wall. Liu Y [32] developed a multifunctional experimental system to enable dynamic wall temperature measurements under two-phase flow scour conditions. The experiments revealed the dynamic evolution of wall temperature under two-phase flow erosion conditions. Combined with numerical simulations of heat transfer between the high-temperature two-phase gas and the wall, an empirical formula for the total heat transfer coefficient between the two-phase gas and the wall in solid rocket motors was obtained as follows:
where is the two-phase gas mass flow rate; is the two-phase gas duct cross-sectional area; and is the Particle Scour Angle.
4. Prediction of Dynamic Ablation Processes in Thermal Insulation Layer
Based on Submodels 1–3 and the external modules for gas erosion and particle erosion, this study integrates intrinsic physical mechanisms and variable correlations to construct an integrated PINN model for predicting ablation rates of thermal insulation layer in solid rocket motors under conventional conditions and two-phase flow scouring conditions.
4.1. PINN Prediction Model for Dynamic Ablation Process of Insulation Layers Under Conventional Conditions
Under conventional ablation conditions, different propellant types and gas velocities can best demonstrate the influence of various parameters on the predictive results of the PINN model. This paper selects four conventional ablation conditions from the database to validate the proposed prediction model (Table 3).
Table 3.
Comparison and validation of char ablation rates under standard ablation test conditions.
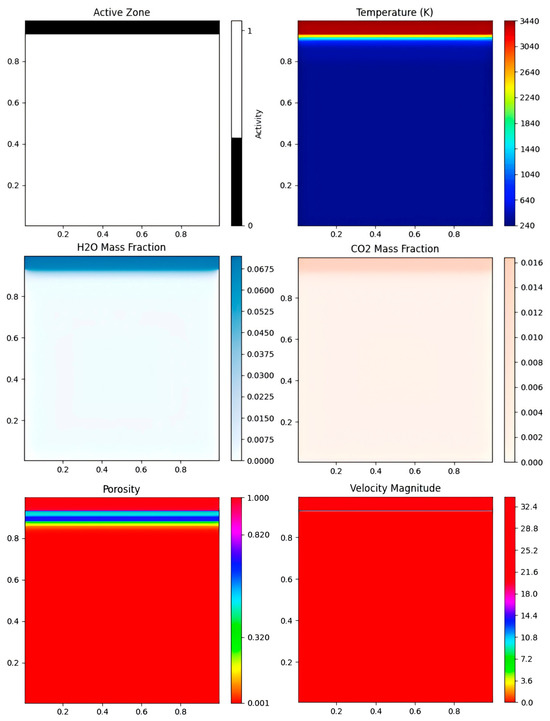
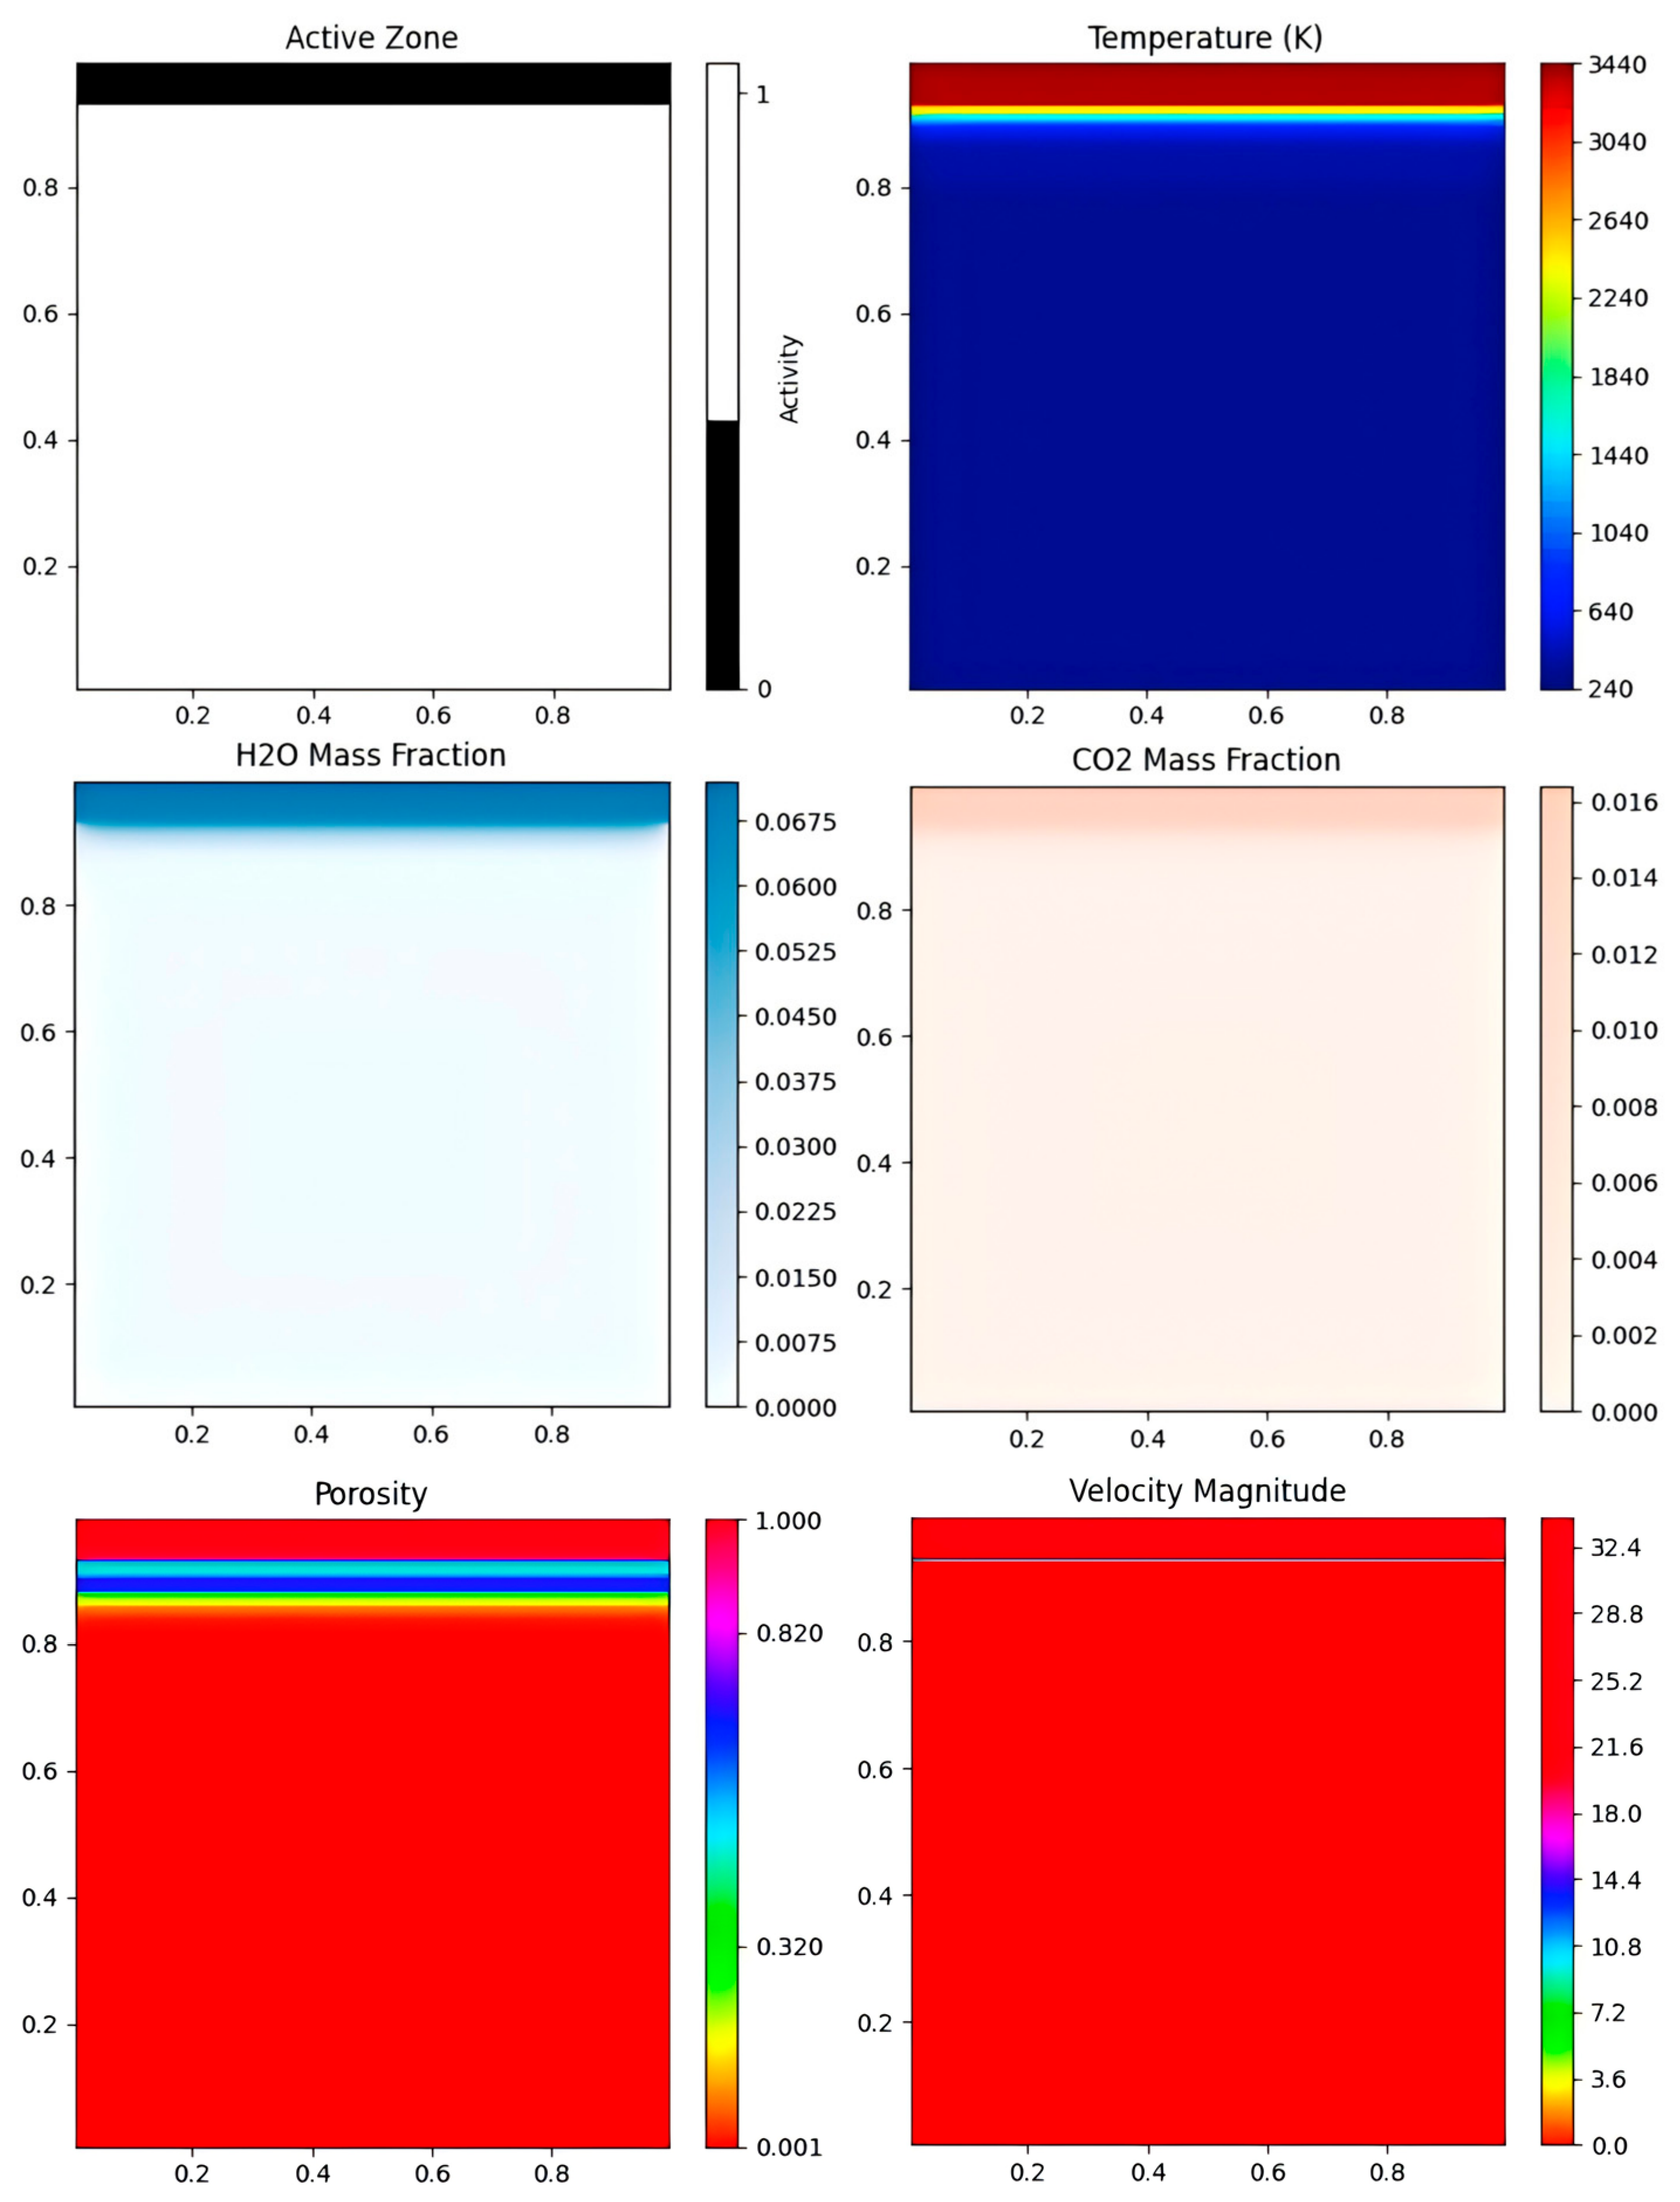
Figure 9 shows the ablation layer detachment cloud map, temperature cloud map, porosity cloud map, oxidizing component cloud map, and velocity cloud map at the end of ablation for Operating Condition 4. The displacement effect of gas flow erosion on the char layer is clearly visible. After the char layer detaches, the temperature in the occupied area is essentially consistent with the incoming gas temperature, and the porosity is 1. This indicates that the physical information neural network successfully predicted and captured the gas phase region. The mass percentage concentration cloud map of oxidizing components clearly reveals gas component diffusion caused by increased porosity due to char layer formation. Concentrations decrease progressively closer to the pyrolysis layer and substrate layer, exhibiting a distinct concentration gradient. Additionally, the velocity cloud map successfully captures boundary layer flow over the insulation material surface, validating the accuracy and superiority of the PINN prediction model established in this study.
Figure 9.
PINN prediction results cloud map (case 4).
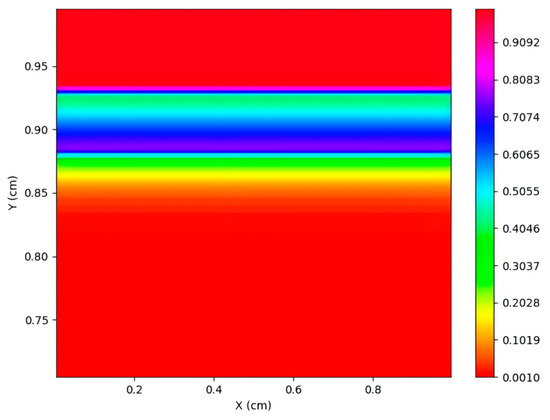
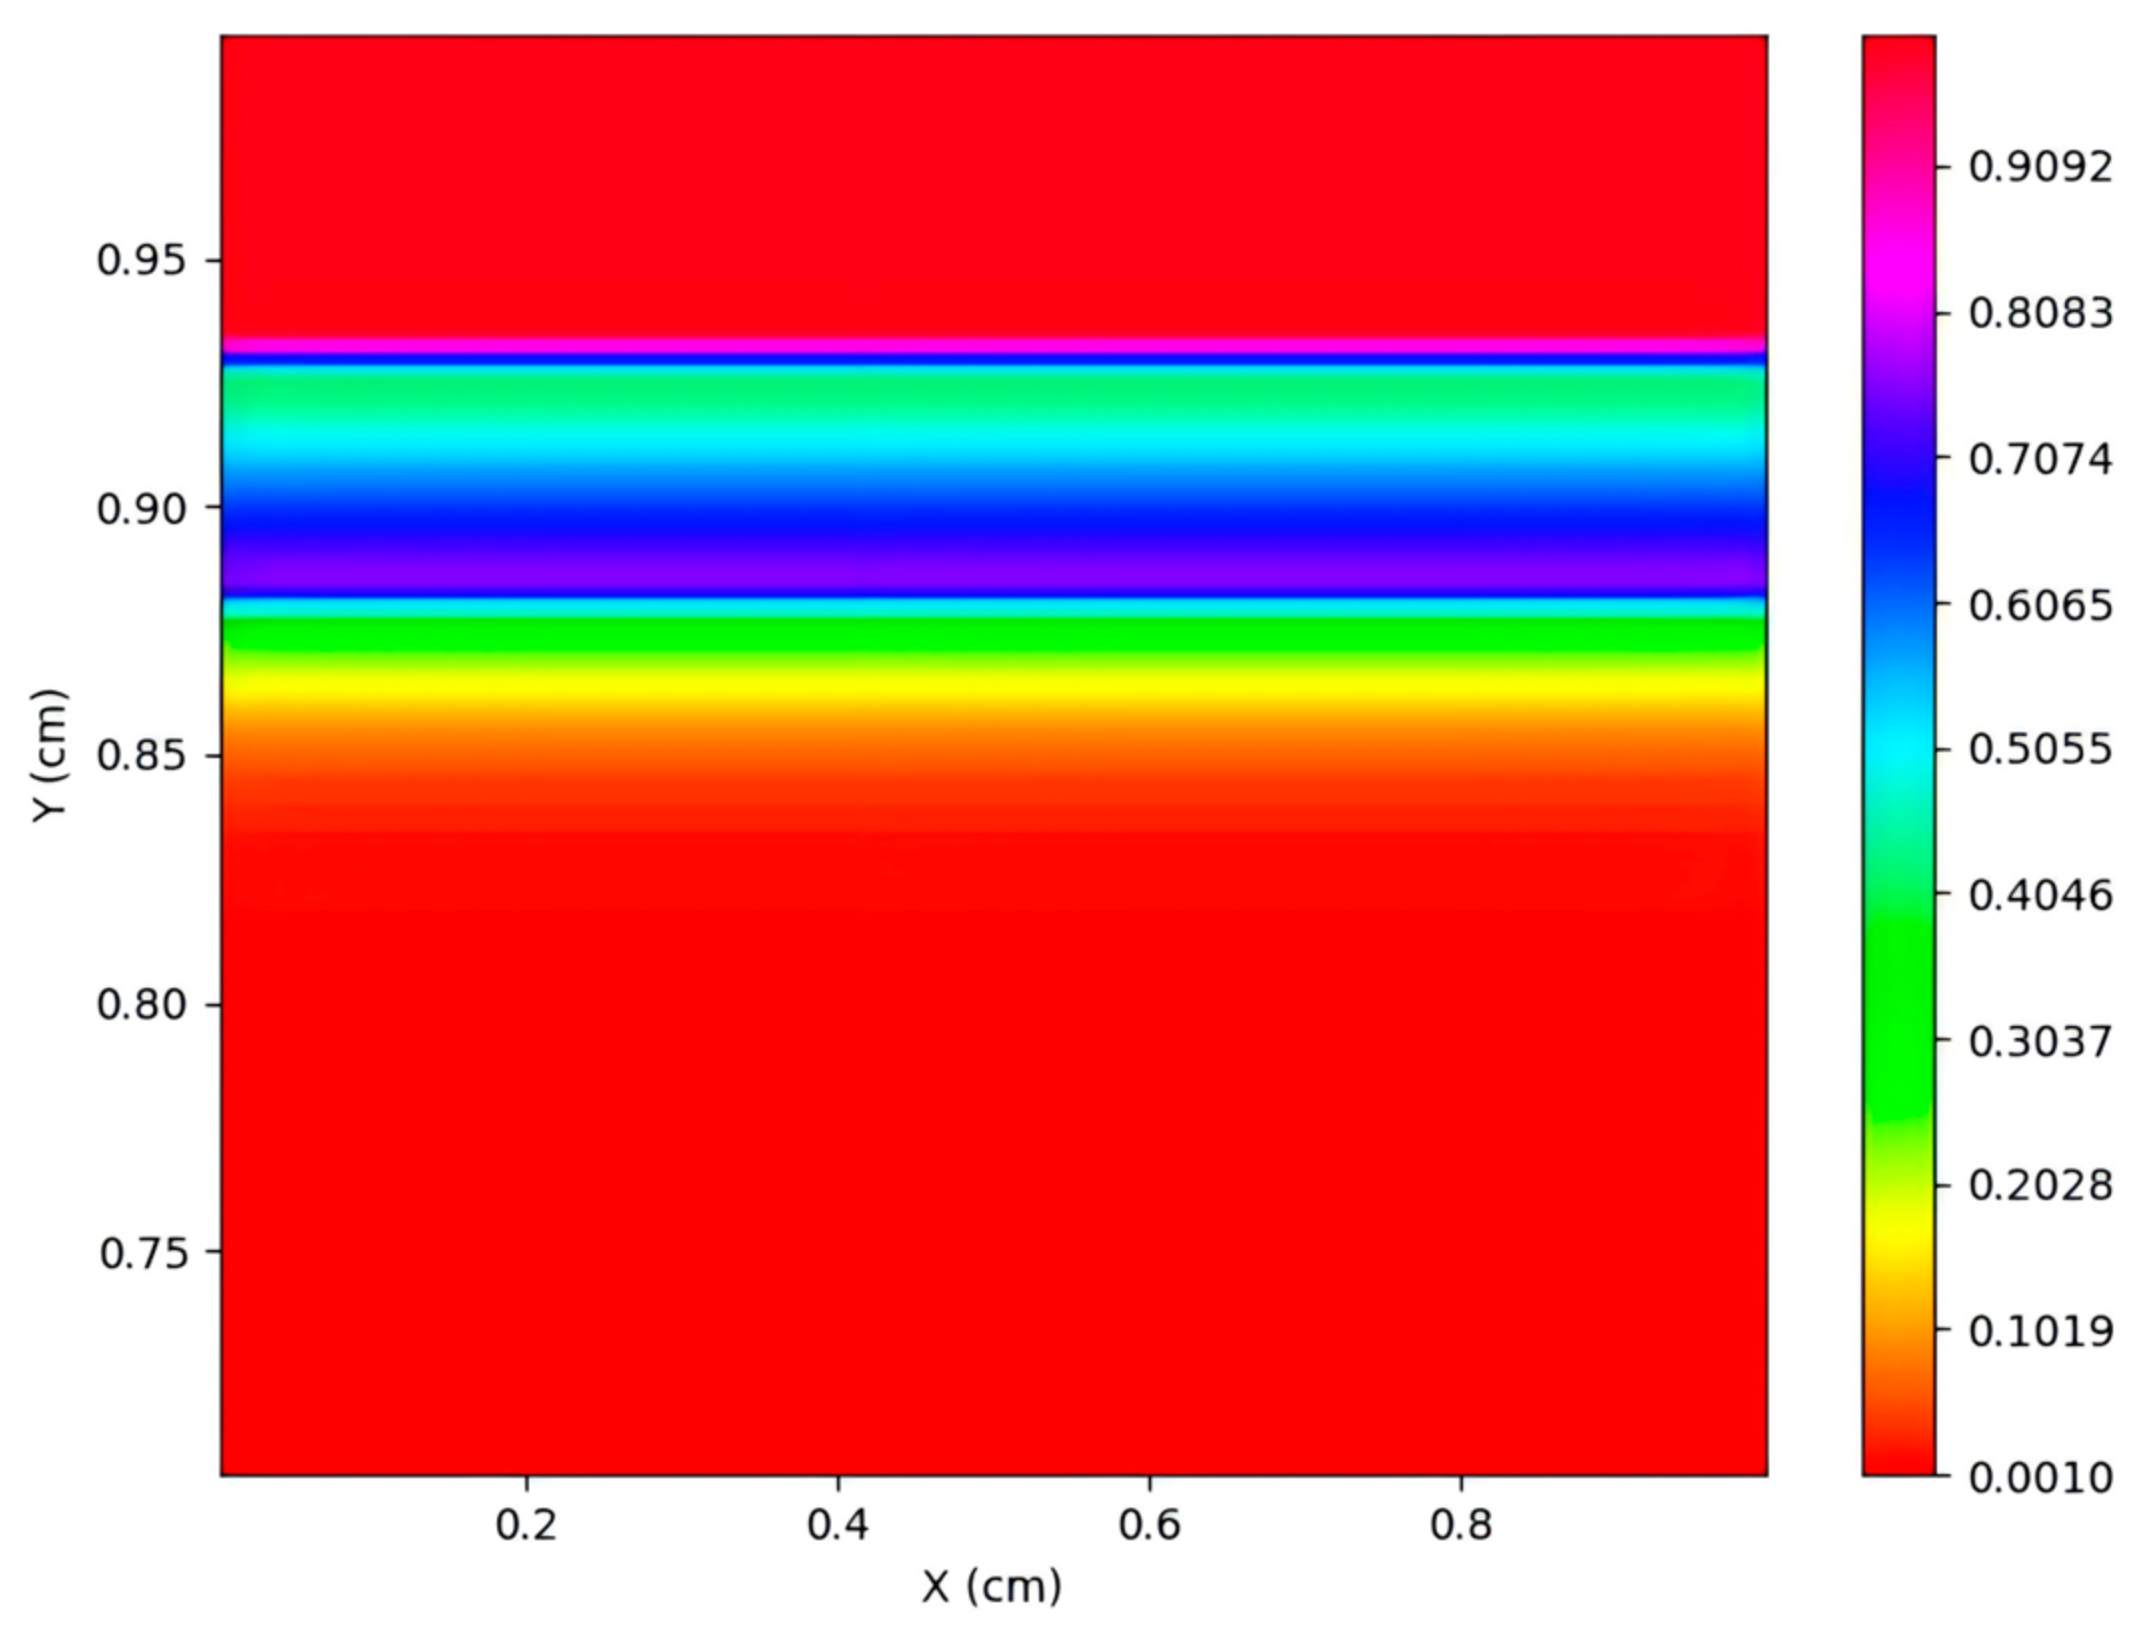
To better visualize the pore distribution within the char layer, the enlarged porosity cloud map of the char layer under case 4 is shown in Figure 10 below. The porosity cloud map clearly reveals the porosity distribution across the gas phase region, char layer, pyrolysis layer, and matrix layer. Due to the PINN prediction model’s coupling with the pyrolysis gas deposition model, the porosity of the char layer undergoes changes as pyrolysis gases deposit through reaction.
Figure 10.
Case 4: Localized porosity cloud of thermal insulation layer.
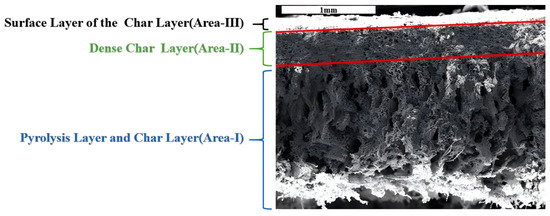
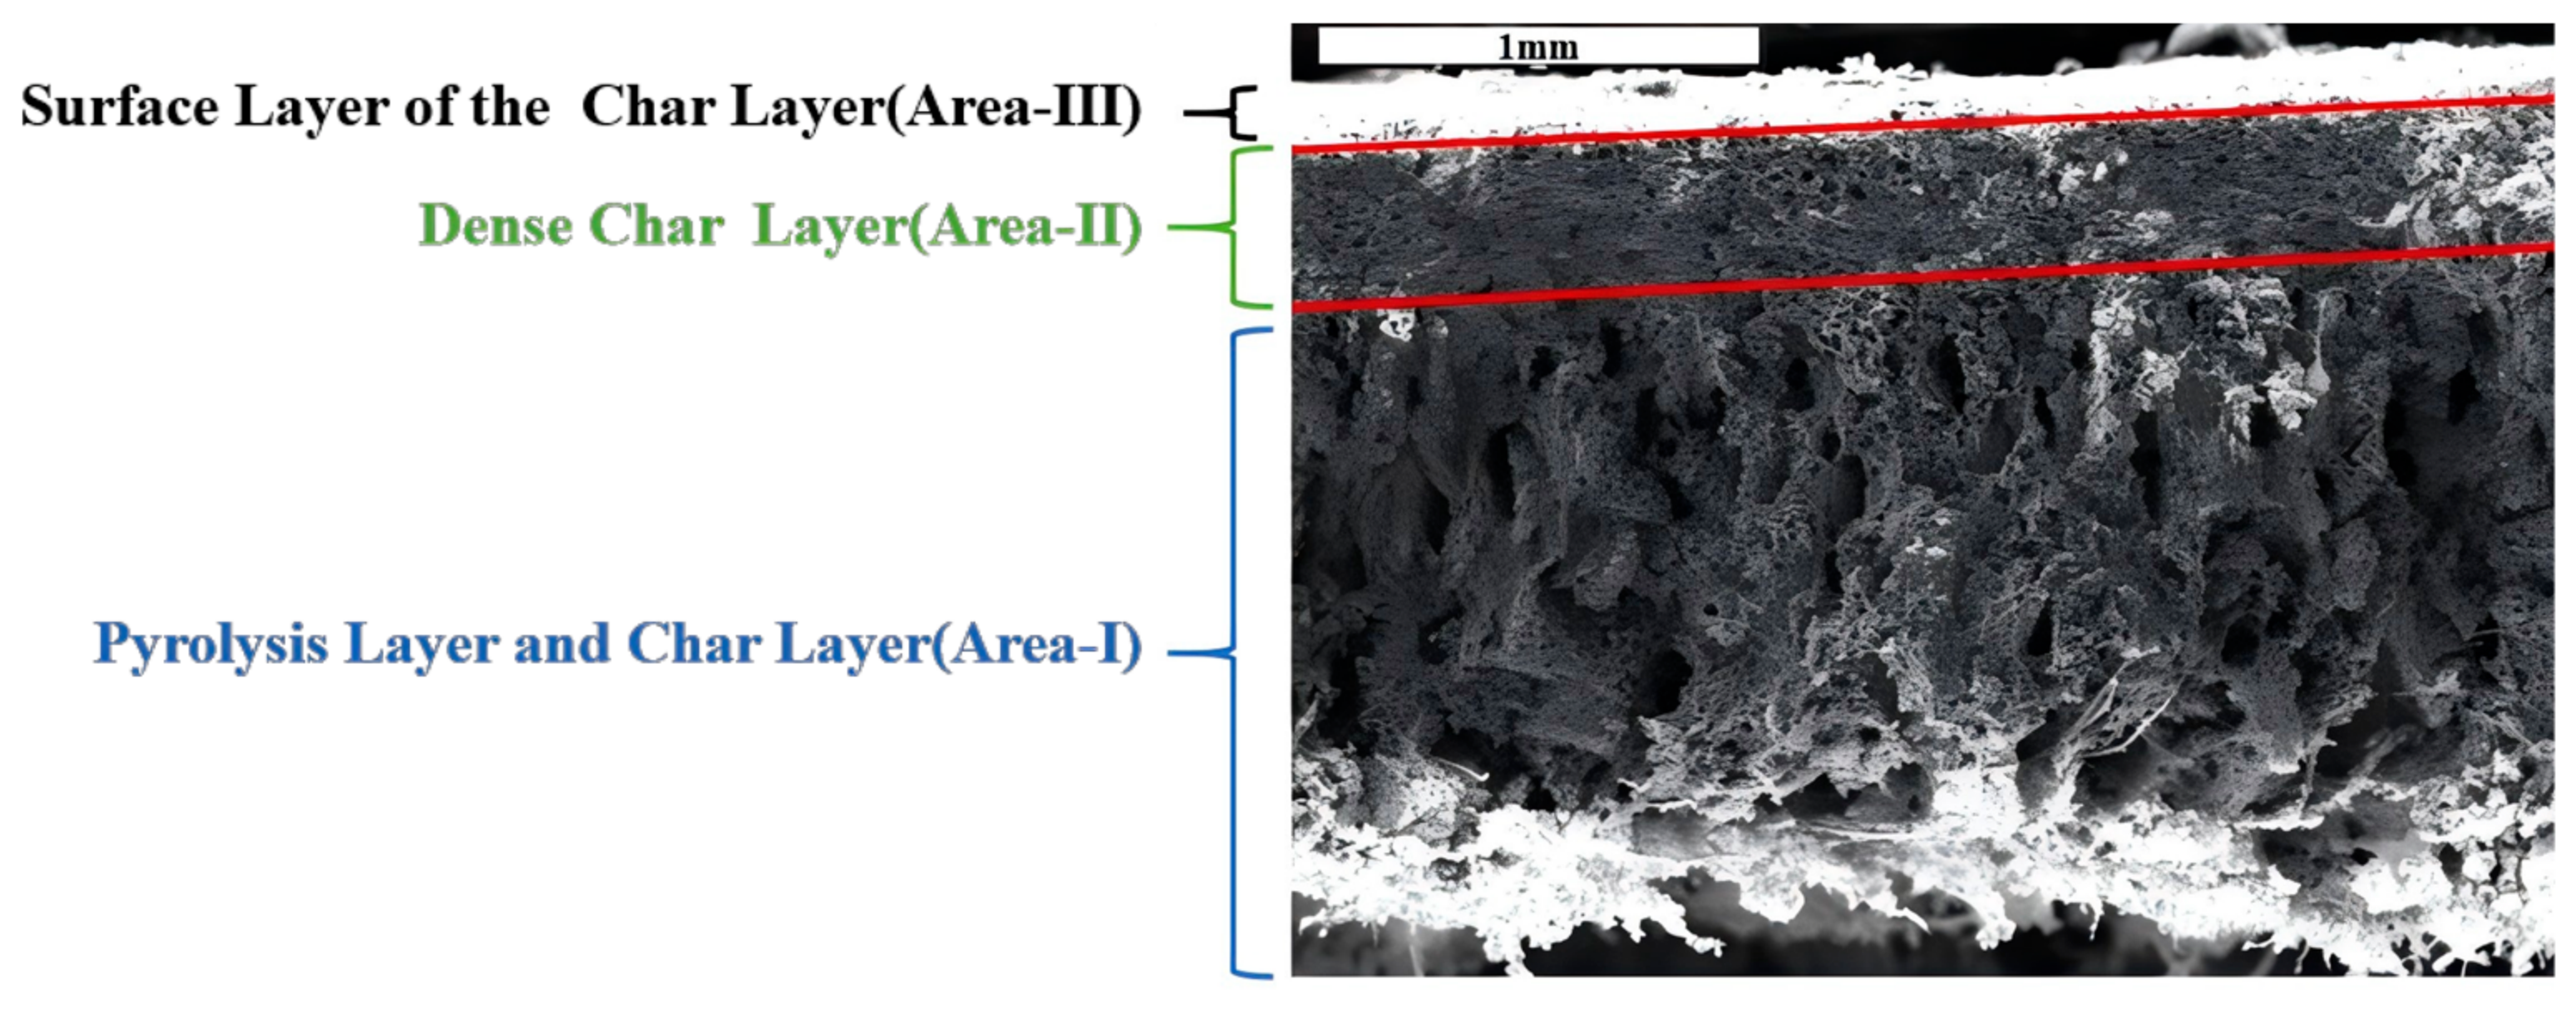
The char layer porosity in the predictive cloud diagram exhibits a structure characterized by a dense upper layer and a loose lower layer, with the dense upper zone being thinner than the loose lower area. Wang SX [20] captured micrographs of the vertical cross-section of the char layer after the gas-phase environment experiment using scanning electron microscopy, as shown in Figure 11. These images confirm the presence of a pore structure characterized by a dense upper layer and a loose lower layer, with the loose zone exhibiting a relatively thin thickness.
Figure 11.
Scanning electron microscope image of vertical cross-section of char layer.
Based on scanning electron microscope images of the char layer cross-section, regions are defined according to differing pore structures as shown in Figure 12. Area I: Thicker, encompassing part of the pyrolysis layer and the middle-lower portion of the char layer with higher porosity. Area II: Thinner, representing the dense zone in the middle-upper part of the char layer. Area III: Thinnest, exhibiting higher porosity and belonging to the most severely thermochemically eroded area.
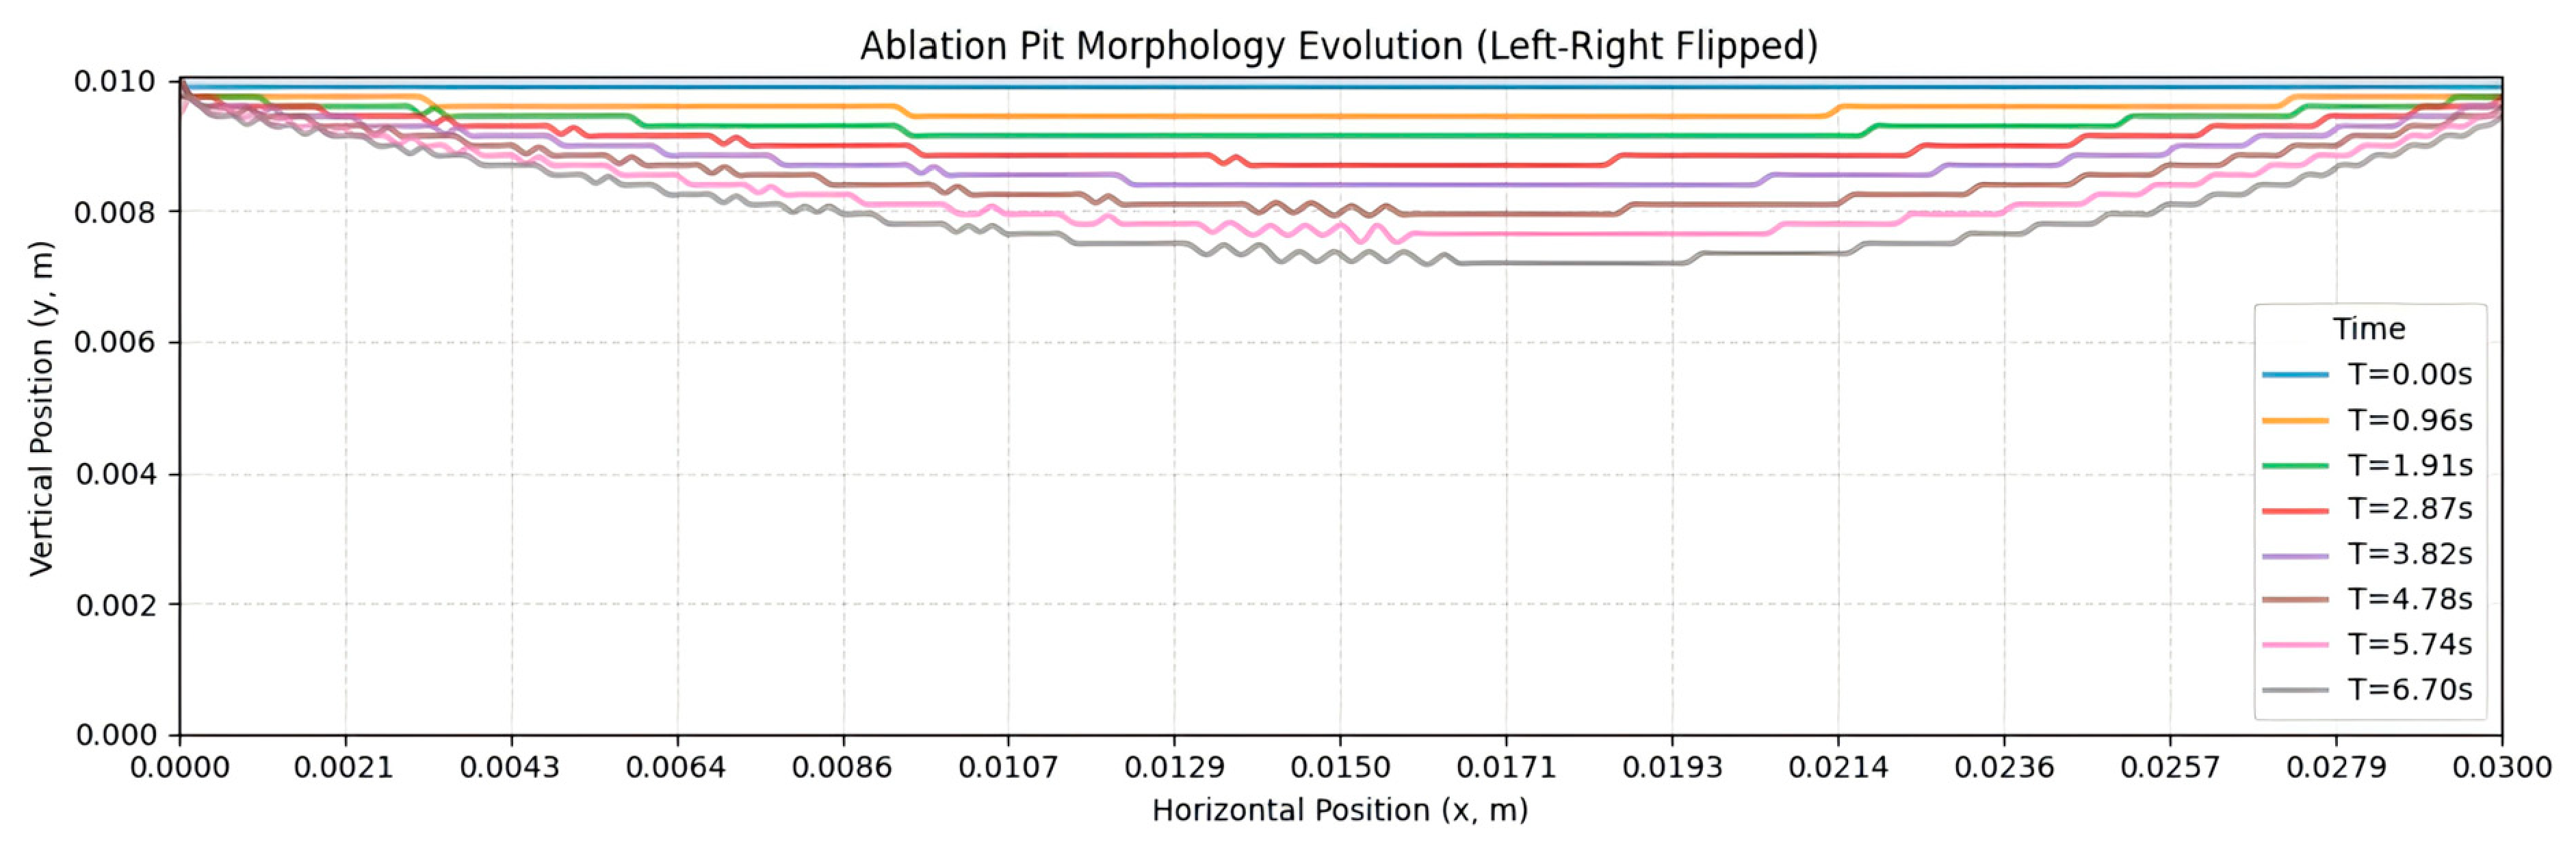
Figure 12.
Schematic diagram of calculation results for case 6.
4.2. PINN Prediction Model for Dynamic Ablation Process of Insulation Layers Under Two-Phase Flow Scouring Conditions
To demonstrate the PINN model’s ability to reflect the influence of different parameters on ablation prediction results and showcase its generalization capability, the ablation experimental data selected for comparative validation in this study were drawn from the established database. This includes experimental data using NEPE high-energy propellant, HTPB propellant (with 17% aluminum content) and a certain type of high-energy propellant. Additionally, particle incidence angle is a critical influencing parameter, with selected angles including 10°, 30°, 45°, and 60°. The particle concentration range is extensive. These conditions comprehensively evaluate the performance of the PINN prediction model. The test simulation conditions and comparison validation data are shown in Table 4.
Table 4.
Simulated operating conditions for overload simulation ablation engine tests.
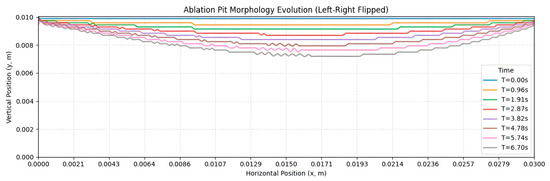
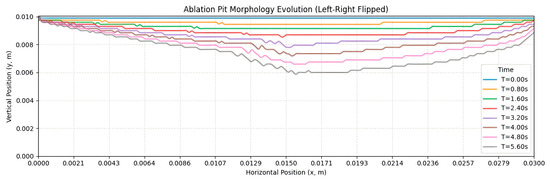
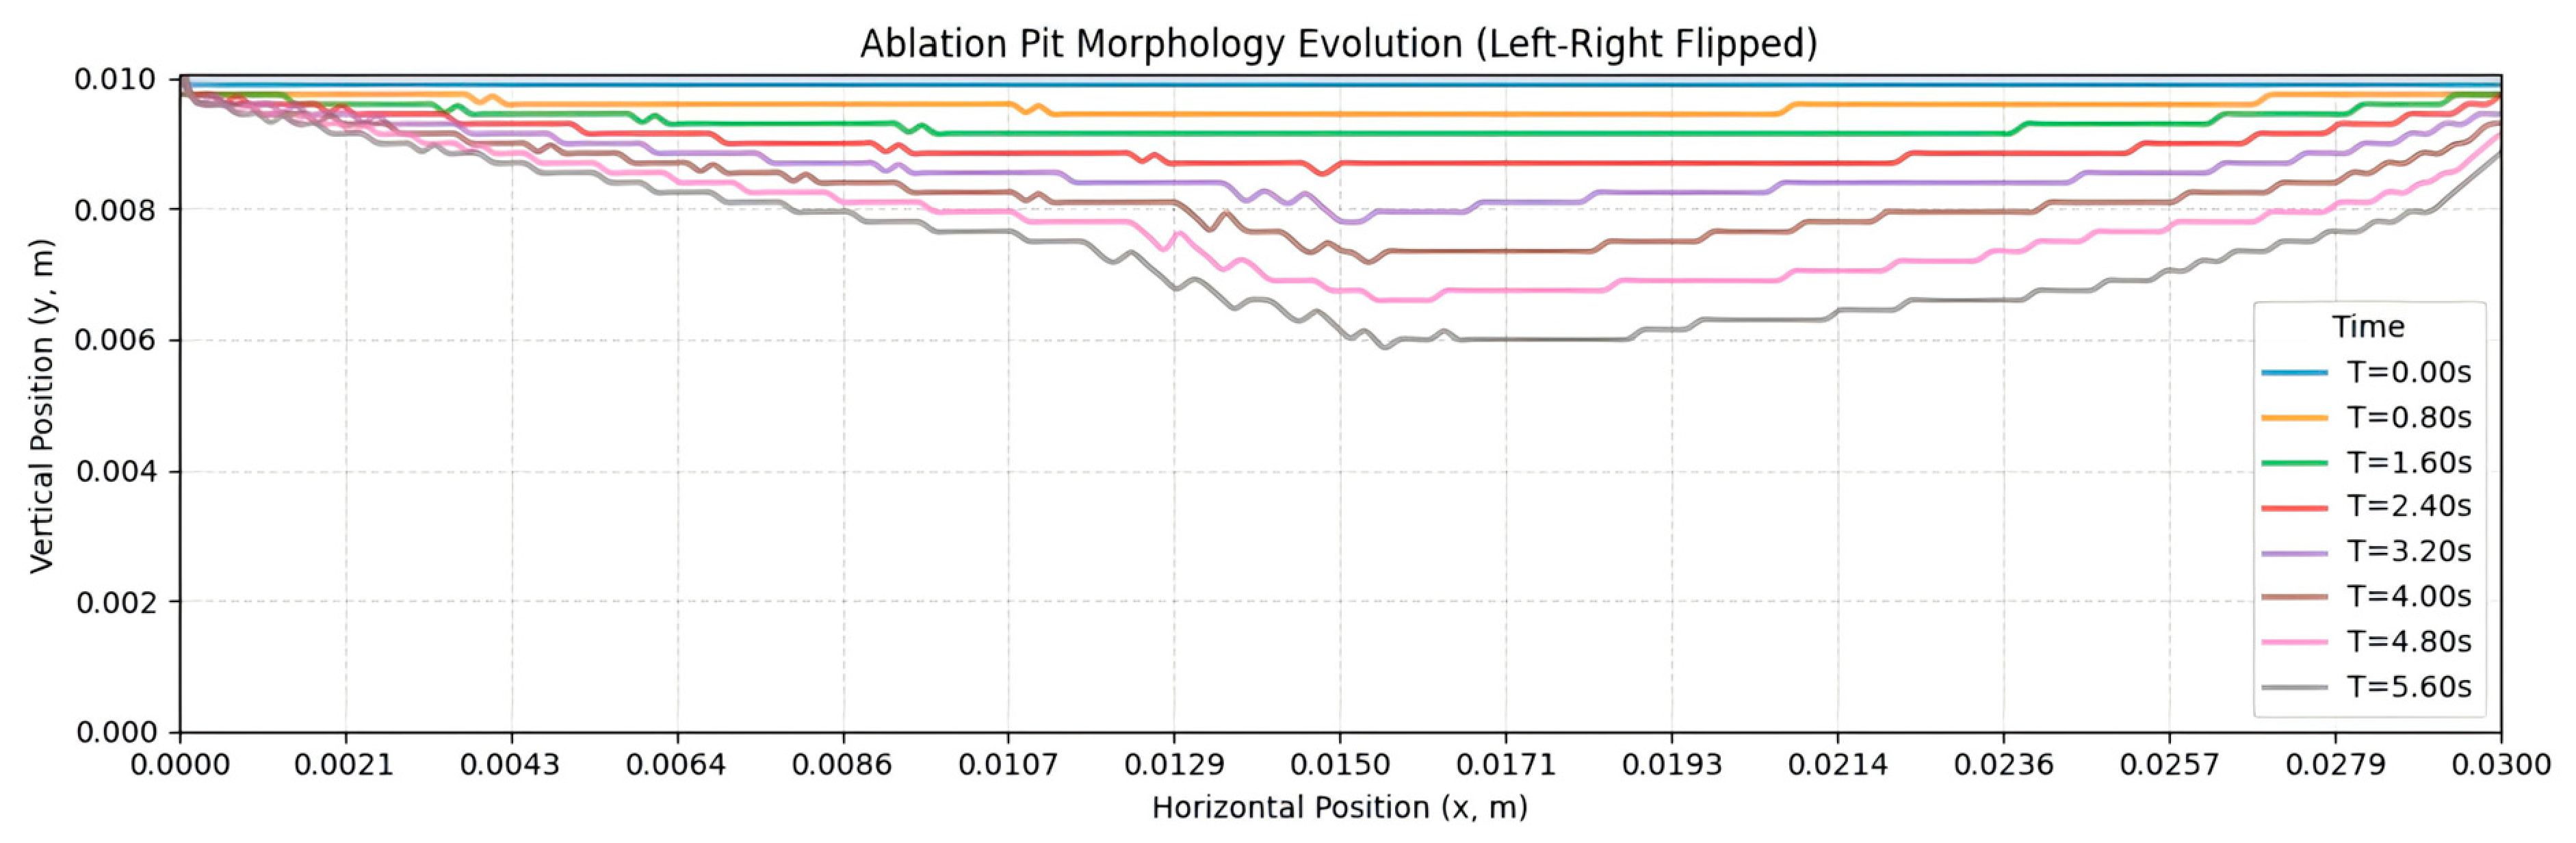
Evolution curves were obtained for the retreat process of the ablated surface of the thermal insulation material and the instantaneous char ablation rate. The calculation results for case 6 is shown in Figure 12, due to the lower erosion concentration and erosion velocity; although pits appeared on the ablated surface, the lowest point of the pits showed virtually no movement.
In case 8 (Figure 13), it can be seen that as time increases, the ablated surface of the insulation layer continues to recede, forming an asymmetric crater pattern and the lowest point of the crater continues to move to the right (in the direction of scouring).
Figure 13.
Schematic diagram of calculation results for case 8.
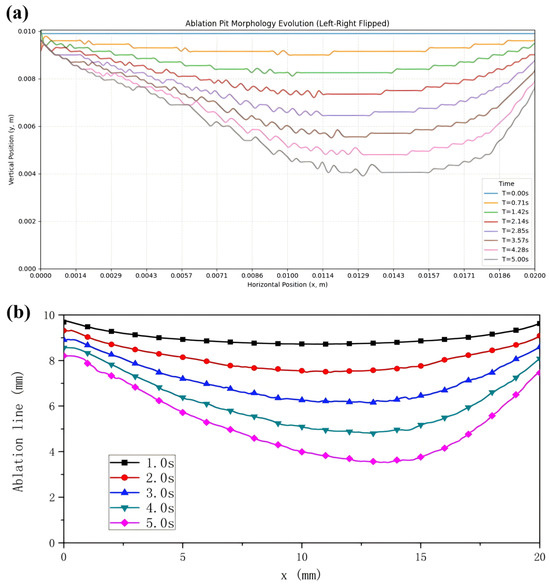
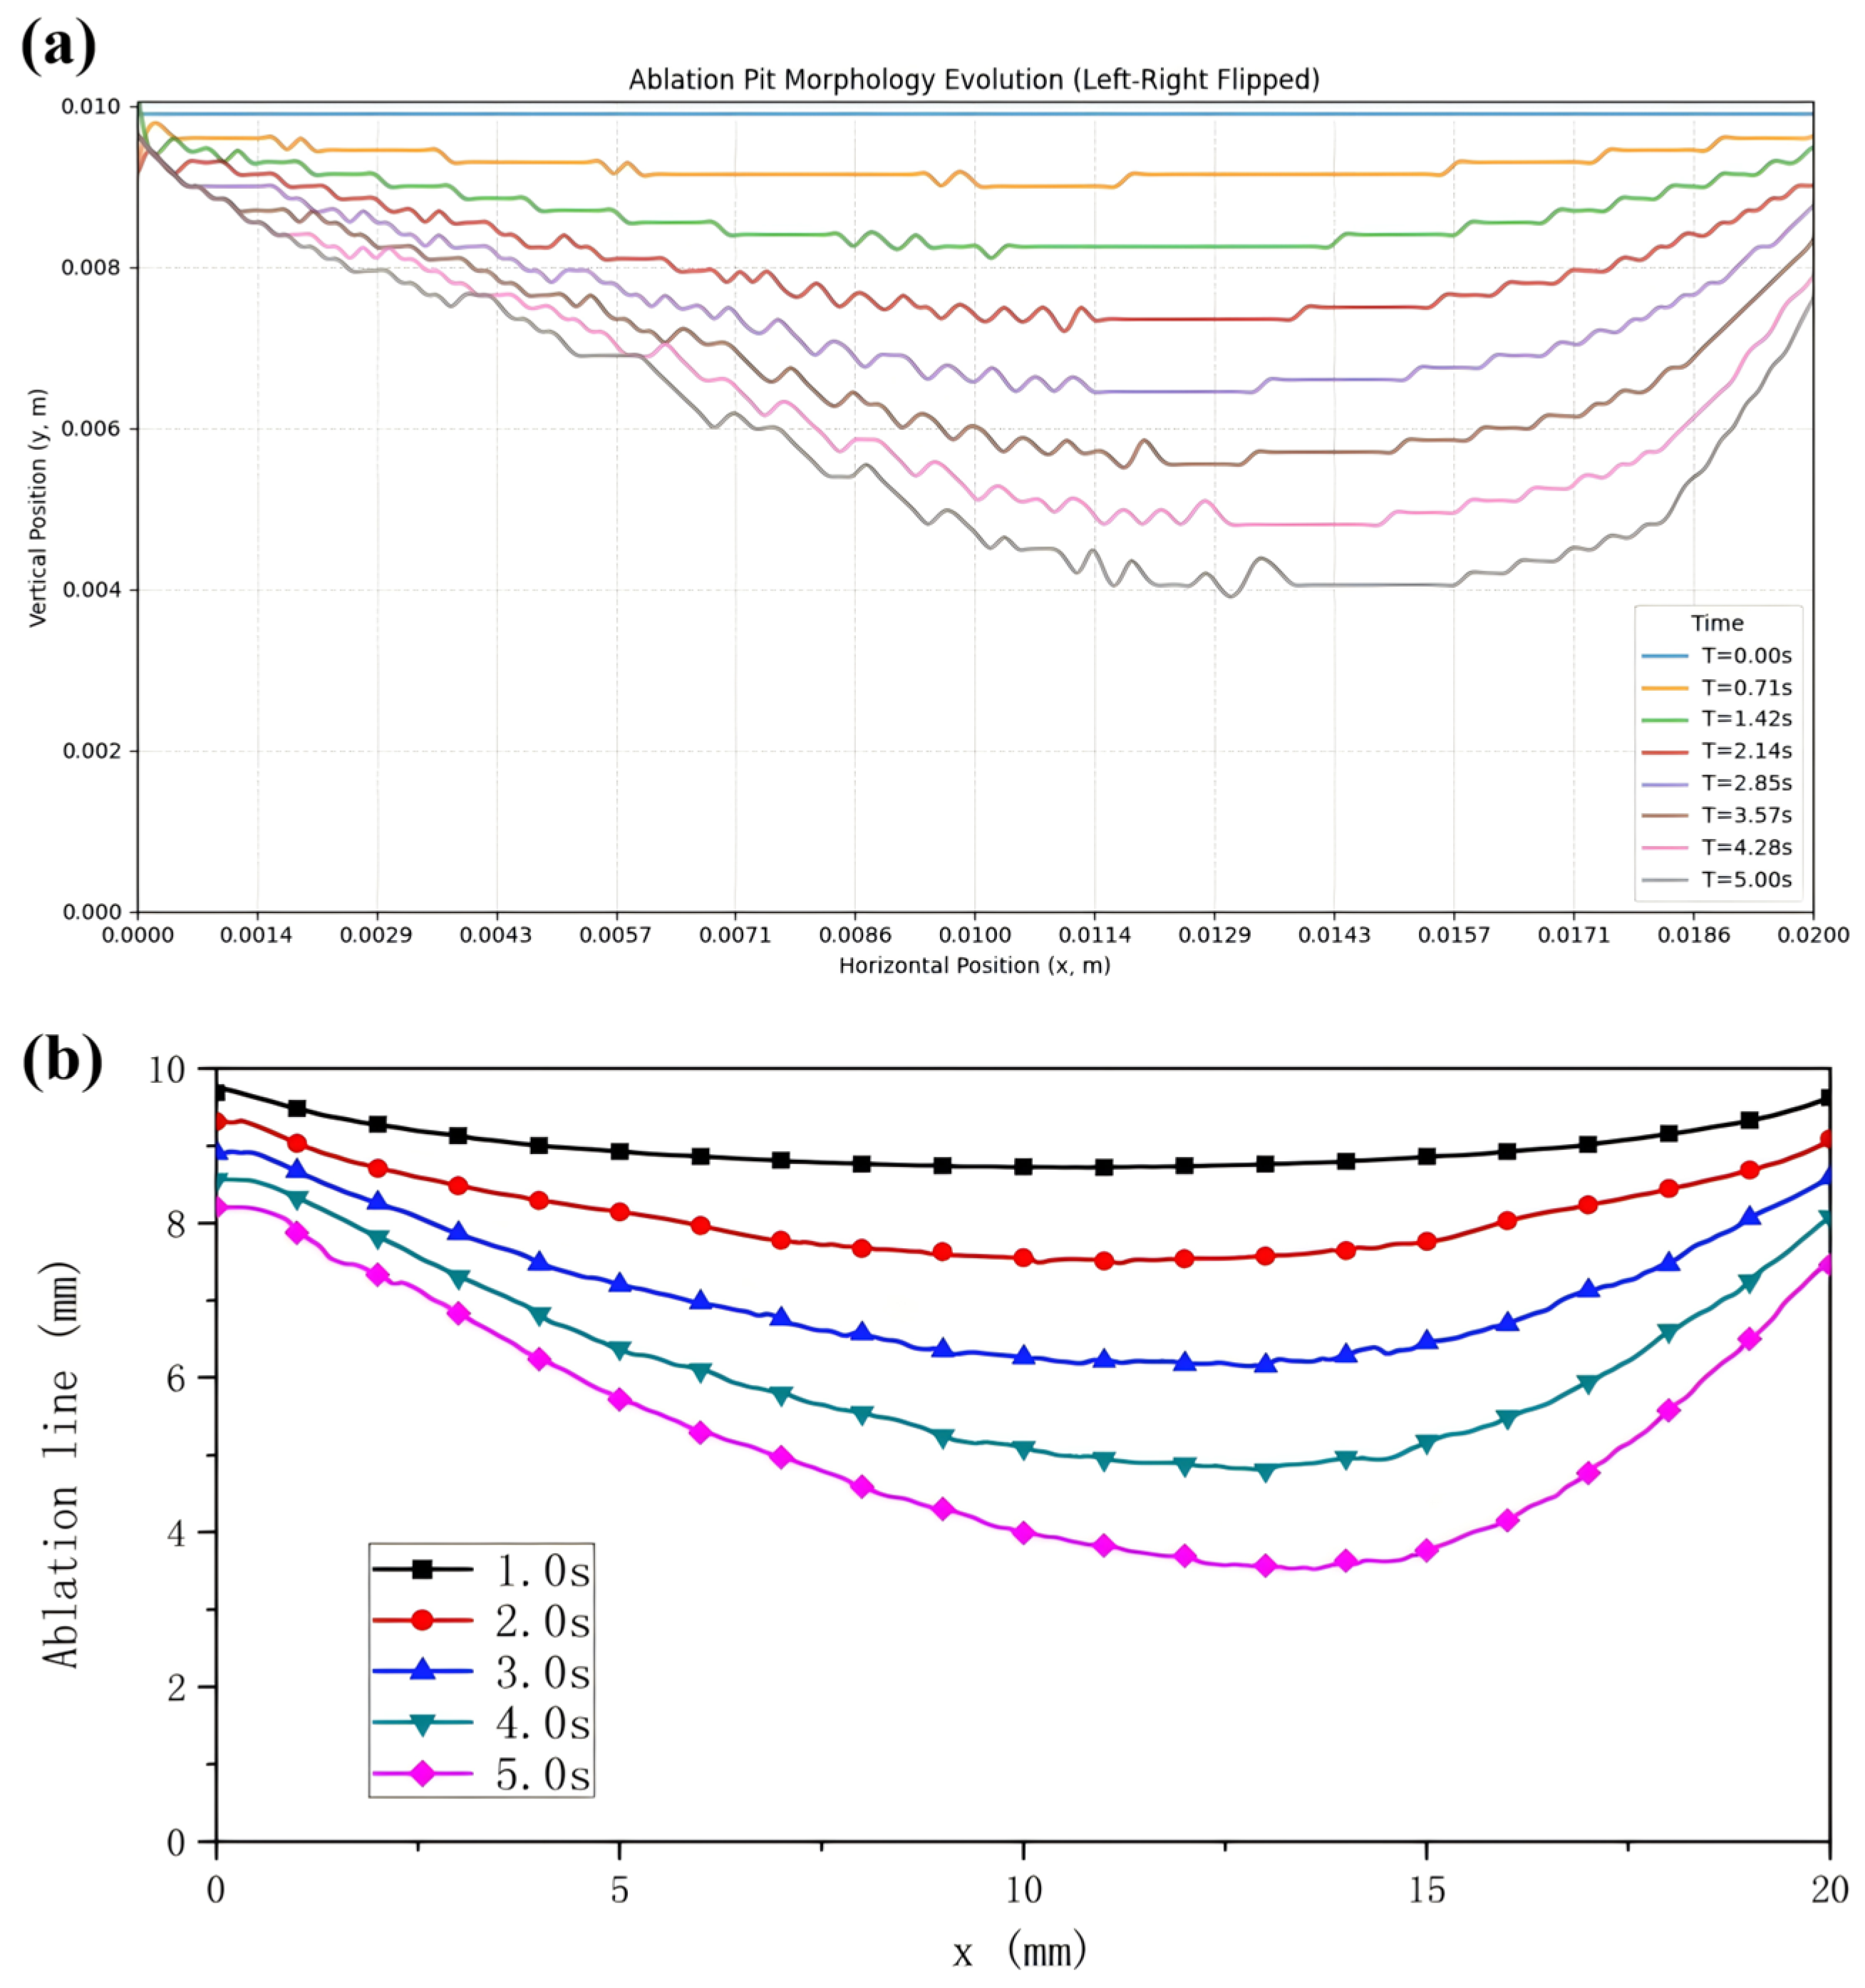
Li ZY [16] conducted research on erosion models for solid particles on insulation layers by neglecting the effects of gas erosion, establishing a coupled ablation/erosion computational model. Numerical calculations were performed to simulate the ablation process under operating case 9 in this paper.
To facilitate better comparison and validation, the computational domain dimensions were uniformly set to 10 mm × 20 mm. Figure 14 illustrates the surface retreat process of the thermal barrier layers for both cases. It can be seen that, as time progresses, the ablated surface of the thermal barrier layer continuously retreats, forming an asymmetrical crater morphology, with the lowest point of the crater continuously shifting to the right (in the direction of souring).
Figure 14.
Schematic line graph illustrating the surface migration process of the thermal insulation layer (a) PINN prediction model; (b) ablation/erosion computational model [16].
Both results are slightly underestimated but show good agreement. In computational efficiency, the model established in this paper achieves prediction times on the order of 101 s per operating condition. In contrast, numerical calculations for the ablation/erosion coupled model require times on the order of 102 s.
5. Conclusions
This paper addresses the multiphysics–chemistry coupling issues in the ablation process of solid rocket motor thermal insulation layers. By integrating PINN—suitable for small-sample learning and even unsupervised scenarios—to tackle ablation prediction challenges, we construct a loss network function for the ablation model. This exploration establishes a versatile and accurate PINN prediction model for thermal insulation ablation, pioneering a novel research approach to this problem. The primary research content and conclusions of this paper are as follows:
- (1)
- By integrating three PINN prediction submodels with gas erosion and particle erosion external modules, a PINN prediction model for the ablation rate of solid rocket motor insulation layers was established. This model not only predicts ablation rates but also forecasts the dynamic ablation process of the insulation layer.
- (2)
- This predictive model not only forecasts ablation rates of thermal insulation materials under conventional conditions but also anticipates the dynamic ablation process of the thermal insulation layer. It predicts changes in component concentration gradients within the char layer’s pores, temperature distribution, and porosity distribution within the thermal insulation layer. Simultaneously, it captures the dense/porous structures formed within the char layer due to pyrolysis gas deposition reactions, exhibiting high consistency with scanning electron microscope images of the char layer. Considering the impact of various parameters on thermal insulation layer ablation, validation was conducted using different gas flow rates and propellant operating conditions selected from the database. Results indicate that under conventional conditions, the maximum prediction error of the PINN ablation rate model for char ablation is 10.49%.
- (3)
- This predictive model not only forecasts the ablation rate of the insulation layer under two-phase flow erosion conditions but also anticipates the dynamic retreat process of the ablation surface morphology and the displacement of the minimum point of ablation pits caused by two-phase flow erosion. Predicting ablation of thermal insulation materials under multi-factor influences was conducted by validating different particle impingement velocities, angles, concentrations, and propellant conditions. Results indicate that the PINN ablation prediction model for thermal insulation layers under two-phase flow conditions exhibits a maximum prediction error of 10.76% for char ablation rates.
Author Contributions
Conceptualization, X.Y. and Y.L.; Methodology, Z.W. and Y.L.; Validation, T.C. and R.Z.; Investigation, Y.B. and L.L.; Data curation, Z.W. and T.C.; Writing—original draft, Z.W.; Writing—review & editing, X.Y. All authors have read and agreed to the published version of the manuscript.
Funding
This work was financially supported by the Shaanxi Province QinChuangyuan “Scientist Engineer” Team Construction Project, under grant number 2023KXJ-119.
Data Availability Statement
The original contributions presented in this study are included in the article. Further inquiries can be directed to the corresponding author.
Conflicts of Interest
Author Tao Cui was employed by the company ArkSpace Technology Corporation Ltd., Beijing, China. The remaining authors declare that the research was conducted in the absence of any commercial or financial relationships that could be construed as a potential conflict of interest.
Abbreviations
The following abbreviations are used in this manuscript:
| PINN | Physics-Informed Neural Net |
| PDEs | Partial Differential Equations |
| EPDM | Ethylene Propylene Diene Monomer |
Appendix A
Table A1.
Structure of the ablation experiment data sample repository.
References
- Ma, Z.B.; He, L.S. Development trend review of foreign heavy-lift launch vehicle. J. Solid Rocket Technol. 2012, 35, 14. [Google Scholar]
- Yang, Y.Q. New development and significance of foreign solid launch vehicle technology. J. Solid Rocket Technol. 2012, 35, 569–582. [Google Scholar]
- Huang, T.; Huang, D.; Yang, K.; Qin, X. Analysis of the development trends of new foreign main carrier rockets. Aerodyn. Missile J. 2020, 7, 72–76. [Google Scholar]
- Ren, Q.H.; Liu, S.; Zhang, H.L.; Liu, J. Status and evolution trend analysis of solid small launch rocket. Mod. Def. Technol. 2016, 44, 40–45. [Google Scholar]
- Li, K.; Li, J.; Zhu, G.; He, Z.P. Research on the collision model of high-temperature alumina droplets with cold wall for solid rocket motors. Aerosp. Sci. Technol. 2023, 133, 108126. [Google Scholar] [CrossRef] [Scilit]
- Li, J.; Liu, Y.; Shi, L.; Jing, T.; Wang, D.; Sun, B.; Chen, S. Basics of Thermal Protection for Space Propulsion; Northwestern Polytechnical University Press: Xi’an, China, 2024. [Google Scholar]
- He, G.Q.; Li, J.; Sun, X.Y. Ablation Mechanism and Model of Insulation Material in Solid Rocket Motors; Science Press: Beijing, China, 2022. [Google Scholar]
- Liu, Y.; Li, J.; Yang, S.; Chen, J.; He, G.-Q.; Sun, X.-Y.; Hu, S.F. Investigation on ablation mechanism and model of EPDM insulator under high acceleration condition(I)—Analysis of ablation mechanism. J. Solid Rocket Technol. 2011, 34, 229–233. [Google Scholar]
- Guan, Y.W.; Li, J.; Liu, Y. Experimental method research on ablation characteristic of insulation material under high temperature alumina droplet deposition condition. J. Propuls. Technol. 2017, 38, 208–214. [Google Scholar]
- Yang, S.; He, G.Q.; Li, J.; Liu, Y.; Li, Q.; Sun, X.Y.; Hu, S.F. Ablation model of EPDM insulator under high acceleration conditions(II)—Particle erosion model of ablative material considering the porous structure of charring layer hot launched missile. J. Solid Rocket Technol. 2011, 34, 349–353. [Google Scholar]
- Curry, D.M. An Analysis of a Charring Ablation Thermal Protection System; NASA-TN-D-3150; NASA: Washington, DC, USA, 1965.
- Moyer, C.B.; Rindal, R.A. Finite Difference Solution for the In-Depth Response of Charring Materials Considering Surface Chemical and Energy Balance; NASA CR-1061; NASA: Washington, DC, USA, 1968.
- Curry, D.M.; Tillian, D.J. Apollo thermal protection system revisited. In Proceedings of the 2006 National Space & Missile Symposium, Orlando, FL, USA, 26–30 June 2006. [Google Scholar]
- Yang, S.; He, G.; Li, Q.; Sun, X.; Hu, S. EPDM ablation model considering of porous/compact structure of charring layer. J. Aerosp. Power 2012, 27, 1172–1178. [Google Scholar]
- Wang, S.; Li, J.; Cai, X. Bulk ablation model with double zones for EPDM in gas phase environment. J. Propuls. Technol. 2016, 37, 378–385. [Google Scholar]
- Li, Z.Y. Erosion Model of Insulator Impacted by Particles in Solid Rocket Motor; Northwestern Polytechnical University: Xi’an, China, 2015. [Google Scholar]
- Thoemel, J.; Kanavouras, K.; Sachidanand, M.; Hein, A.; Ortiz del Castillo, M.; Pauly, L.; Rathinam, A.; Aouada, D. Lean demonstration of on-board thermal anomaly detection using machine learning. Aerospace 2024, 11, 523. [Google Scholar] [CrossRef] [Scilit]
- Nishi, Y.; Krumbein, A.; Knopp, T.; Probst, A.; Grabé, C. On the generalization capability of a data-driven turbulence model by field inversion and machine learning. Aerospace 2024, 11, 592. [Google Scholar] [CrossRef] [Scilit]
- Zhu, C.J.; Zhang, B.B. Research on the development of AI-based computer image recognition technology. J. Inf. Rec. Mater. 2025, 26, 148–150. [Google Scholar]
- Luo, L.; Zhao, N. A review of applications and development trends of artificial intelligence in the logistics industry. Logist. Mater. Handl. 2021, 26, 116–121. [Google Scholar]
- Wei, L.; Liu, L.; Liu, J.J.; Ma, Q. Intelligent interpretation of non-destructive testing data of solid rocket engines based on machine learning. Natl. Def. Technol. 2021, 42, 69–75. [Google Scholar]
- Ma, T.Z.; Zhang, Y.; Ma, H.; Sun, X. Application and prospects of rapid detection technologies in the formulation research of composite solid propellants. J. Solid Rocket Technol. 2025, 48, 524–534. [Google Scholar] [CrossRef]
- Xu, Z.G.; Zhang, H.; Han, X.; Wang, Z.; Wang, J. Data-driven modeling for key parameter prediction in the casting process of charging. J. Solid Rocket Technol. 2021, 44, 662–669. [Google Scholar]
- Zhu, X.L. Research on Fault Detection and Diagnosis Methods of Liquid-Propellant Rocket Engine Based on Convolutional Neural Network; National University of Defense Technology: Changsha, China, 2020. [Google Scholar]
- Raissi, M.; Perdikaris, P.; Karniadakis, G.E. Physics-informed neural networks: A deep learning framework for solving forward and inverse problems involving nonlinear partial differential equations. J. Comput. Phys. 2019, 378, 686–707. [Google Scholar] [CrossRef] [Scilit]
- Ma, C.Y. Refined Ablation Model of EPDM Thermal InsulationLayers for Complex Ablation Environments; Northwestern Polytechnical University: Xi’an, China, 2024. [Google Scholar]
- Wang, S.X.; He, G.Q.; Liu, P.J.; Li, J.; Liu, Z.X. Effects of gas-phase speed on EPDM insulator ablation. J. Solid Rocket Technol. 2010, 5, 235–239. [Google Scholar]
- Wang, J. Ablation Mechanism and Model of EPDM Ablative Materials on Acceleration Conditions; Northwestern Polytechnical University: Xi’an, China, 2010. [Google Scholar]
- Whitaker, S. Diffusion and dispersion in porous media. AIChE J. 1967, 13, 420–427. [Google Scholar] [CrossRef] [Scilit]
- Liu, Y.; Yu, X.J.; Ma, J.-M.; Guan, Y.-W.; Li, J.; Qiang, L.; Yang, S. A volumetric ablation model of EPDM considering complex physicochemical process in porous structure of char layer. Open Phys. 2017, 15, 344–353. [Google Scholar] [CrossRef] [Scilit]
- Wen, X.F.; Lou, Y.C.; Zhao, Y.; Ma, X.; Zhao, Z. Numerical simulation on particle erosion characteristics of solid rocket motor insulation. J. Solid Rocket Technol. 2023, 46, 779–786. [Google Scholar] [CrossRef]
- Liu, Y.; Dong, Z.C.; Wang, H.F.; Zou, Y.; Gao, Y.; Wang, Z. Study on heat transfer model of solid rocket motor combustor under high-temperature two-phase flow scour state. Int. Commun. Heat Mass Transf. 2023, 145, 106845. [Google Scholar] [CrossRef] [Scilit]

Disclaimer/Publisher’s Note: The statements, opinions and data contained in all publications are solely those of the individual author(s) and contributor(s) and not of MDPI and/or the editor(s). MDPI and/or the editor(s) disclaim responsibility for any injury to people or property resulting from any ideas, methods, instructions or products referred to in the content. |
© 2026 by the authors. Licensee MDPI, Basel, Switzerland. This article is an open access article distributed under the terms and conditions of the Creative Commons Attribution (CC BY) license.