


Abstract
The electric loading function of the active sidestick system introduces new safety risks, making the failure effects of the system uncertain. To clarify the failure effect characteristics of uncommanded oscillation signals in the active sidestick system, fault mechanism analysis and fault injection simulations were conducted. For the standalone active sidestick system, oscillation faults with different injection locations, waveforms, amplitudes, and frequencies were investigated, and their effects were evaluated from three aspects: surplus force, active sidestick deflection angle, and loading motor speed. The results show that oscillation faults cause the active sidestick deflection angle to oscillate, with the response amplitude depending on the fault injection location and signal characteristics. In addition, the pilot response to the fault was incorporated into the active sidestick system. The results show that the influence of pilot response on oscillation faults exhibits significant frequency dependent characteristics. When the fault frequency is lower than approximately 0.72 Hz, the additional pilot control force reduces the aircraft pitch angle tracking error and suppresses the oscillation fault. When the fault frequency is higher than 0.72 Hz, the pilot response increases the aircraft pitch angle tracking error, and its effect changes from a counteracting action to an amplifying action. Based on the standalone active sidestick system simulated by the experimental setup, a sinusoidal oscillation fault injection experiment was conducted at the torque sensor output. The variation trends observed in the experimental results were generally consistent with the corresponding simulation results, thereby providing indirect validation of the fault injection simulations.
1. Introduction
Modern civil aircraft employ fly-by-wire flight control systems, in which pilot commands and aircraft state information are transmitted and processed as electrical signals. Although this architecture improves system flexibility and control performance, signal transmission and processing may be affected by internal and external disturbances, resulting in uncommanded signals. Such signals may cause abnormal operation of the flight control system and lead to unacceptable responses, including control surface disconnection, jamming, hardover, and sustained oscillation, thereby threatening the continued safe flight and landing of the aircraft [1,2,3].
The active sidestick is an important flight control inceptor in modern fly-by-wire aircraft. Unlike a passive sidestick, it employs an electromechanical loading system to generate adjustable force displacement characteristics and transmit tactile information associated with the aircraft state to the pilot. Hanke and Herbst demonstrated that active sidestick feedback can provide an additional tactile information channel and improve pilot situation awareness [4]. Hosman et al. compared active and passive sidesticks in manual aircraft control and investigated the potential of feeding aircraft state information back through active sidestick motion to improve pilot tracking performance [5]. De Stigter et al. designed a haptic flight director that transmitted guidance commands through the control inceptor [6], while Van Baelen et al. employed active force feedback to convey flight envelope protection information to the pilot [7]. Rauer further demonstrated that the force gradient characteristics of an active sidestick are closely related to pilot control behavior and aircraft handling qualities [8]. However, the realization of these functions requires additional electronic and electromechanical components, including sensors, an electronic control unit, a motor driver, a loading motor, and a mechanical transmission mechanism [9]. Compared with a passive sidestick, the additional electronic, electromechanical, and closed loop control elements introduce more potential fault locations and fault propagation paths. An uncommanded signal generated in the active loading loop may affect not only the sidestick command transmitted to the flight control computer but also the feedback force applied to the pilot and the operating state of the loading motor.
Among the different forms of uncommanded signals, oscillatory signals require systematic failure effect analysis. When abnormalities occur in signal processing, transmission, or feedback elements, an uncommanded signal may appear as a periodic oscillation. Unlike a bias, drift, or stuck signal, an oscillatory signal periodically changes the magnitude and direction of the erroneous component and continuously excites the dynamic elements of the closed loop system. After entering the active sidestick system, the oscillatory signal may propagate through the force servo loop, resulting in sustained abnormal sidestick motion, distorted force feedback, and abnormal operation of the loading motor. In addition, the resulting abnormal sidestick motion and feedback force may change the pilot control action, allowing the fault effect to propagate further through the pilot, flight control system, and aircraft closed loop. Barnett conducted flight tests under isometric active sidestick failure conditions and evaluated their effects on rotorcraft handling qualities [10]. Jones and Barnett further investigated pilot induced oscillations triggered by active inceptor failures and showed that an inceptor failure may significantly alter pilot aircraft interaction [11]. Xu et al. adjusted active sidestick stiffness to suppress Category II pilot-induced oscillations caused by actuator rate saturation [12] and subsequently designed a smart sidestick controller that provides force cues under adverse pilot aircraft coupling conditions [13].
For the active sidestick system, oscillatory faults may originate from the torque sensor, angle sensor, control unit, or motor driver. Because these components occupy different positions in the force servo loop, their faults may propagate through different paths and produce different effects on the sidestick command output, force loading performance, and loading motor operating state. Moreover, the resulting aircraft response may be affected by the dynamic pilot reaction. Most available data on failure modes and effects are derived from industrial engineering experience and military reports, while systematic literature on the characteristics of failure mechanisms and fault effects is still limited [10,14,15,16,17,18,19,20]. Therefore, the relationships among the fault location, signal type, amplitude, frequency, equipment response, and pilot aircraft response need to be systematically investigated. In this paper, oscillatory signal faults in the active sidestick system are analyzed through fault injection simulations and experiments, with the aim of providing technical and theoretical support for the airworthiness certification of active sidestick system safety.
2. Active Sidestick and Pilot in Loop System Models
2.1. Active Sidestick System Model
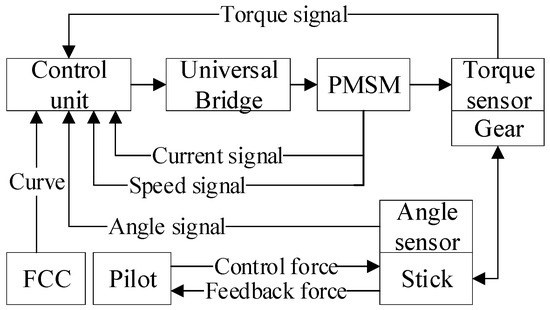
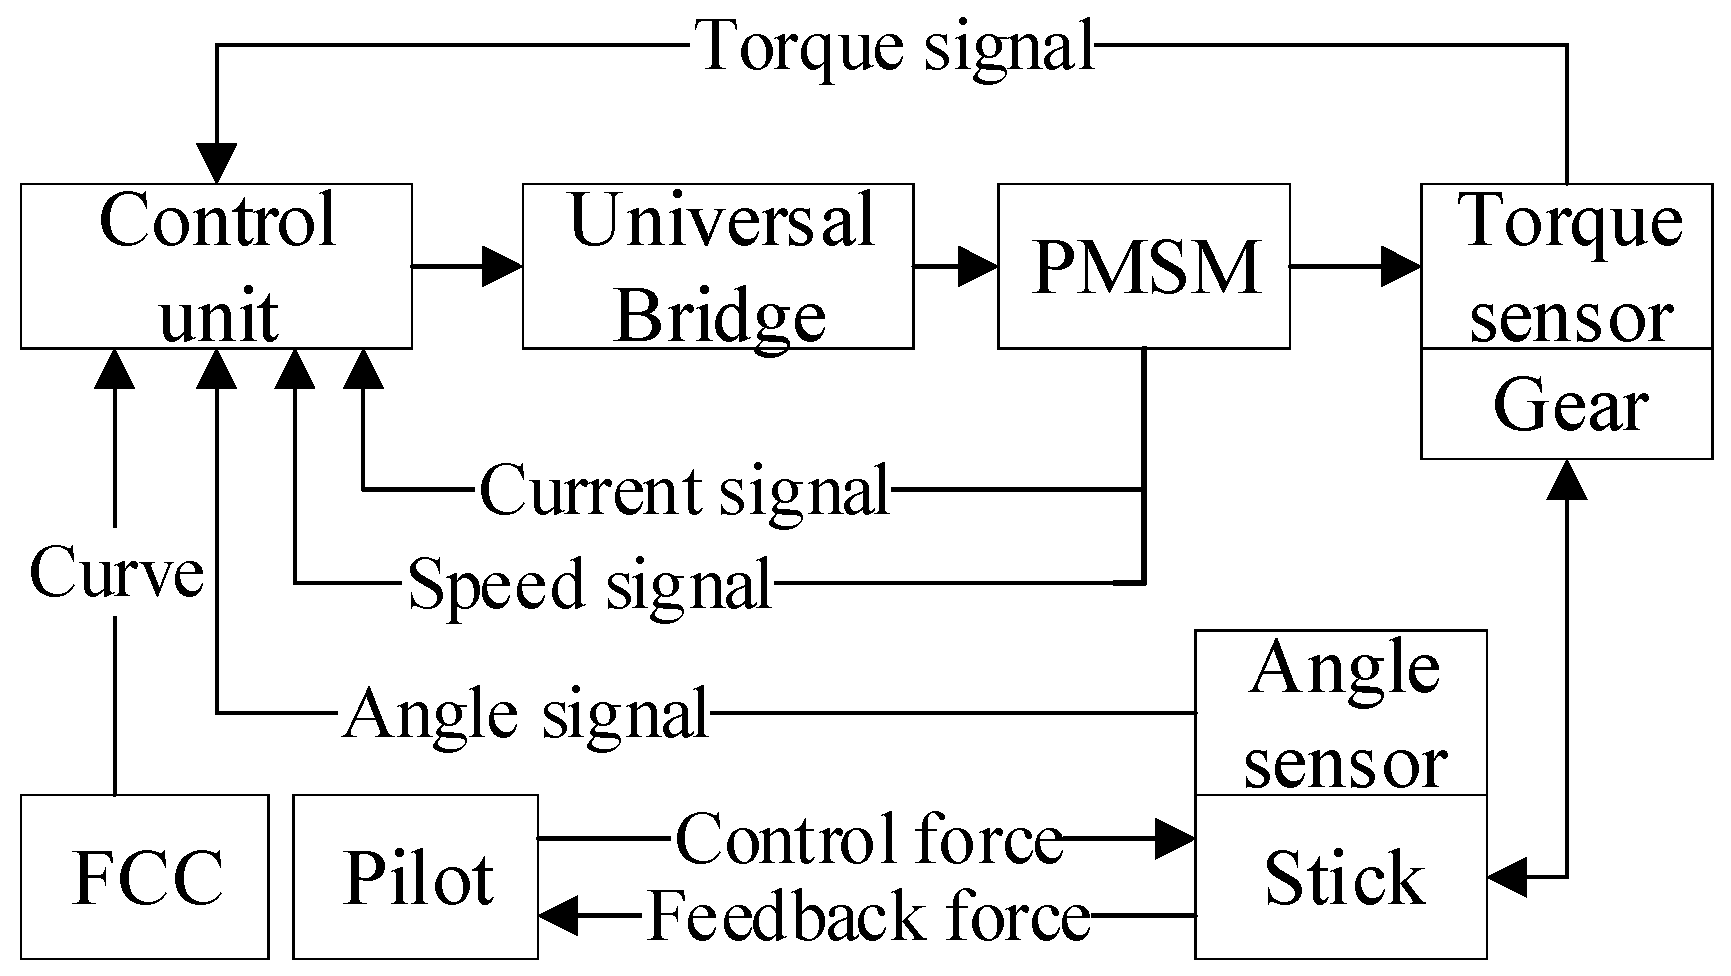
The active sidestick model employed in this study was developed in our previous work. Its detailed description, model validation, and related analyses are provided in References [21,22,23]. This feedback mechanism operates under a force servo mode during the pilot’s control inputs. The sidestick deflection angle measured by the angle sensor is transmitted to the flight control computer through the electronic control unit. Based on the aircraft state and the force displacement curve, the flight control computer generates the required force feel command. The electronic control unit converts this command into a motor control demand, and the motor driver regulates the operation of the permanent magnet synchronous motor. The motor output torque is transmitted to the sidestick through the reduction mechanism, while the torque sensor and angle sensor provide the feedback signals required for closed loop force loading control. The structural block diagram of these components is illustrated in Figure 1 [23].
Figure 1.
System structure block diagram.
To investigate the force servo function of the active sidestick, a dynamic model of the system is established. The active sidestick is driven by a permanent magnet synchronous servo motor. After coordinate transformation, the motor voltage equations in the d and q axes are expressed as follows:
Electromagnetic torque equation of the permanent magnet synchronous motor:
The equation of motion of the motor is:
where and are the stator voltages in the d and q axes, respectively; and are the stator currents in the d and q axes, respectively; and are the stator inductances in the d and q axes, respectively; is the stator phase resistance; is the permanent magnet flux linkage; is the number of pole pairs; is the mechanical angular speed of the motor; and are the electromagnetic torque and load torque, respectively; J is the rotor inertia; B is the motor viscous damping coefficient; and is the motor torque constant.
In the force servo mode of the active sidestick, the required feedback force is provided to the pilot in real time by the motor, enabling the pilot to experience a realistic force feeling when manipulating the sidestick and assess the state of the aircraft. Taking the pitch direction as an example, the relationship between the pilot’s torque acting on the sidestick and the motor’s feedback torque can be expressed as:
where T is the pilot control torque applied to the sidestick; is the sidestick deflection angle; is the equivalent rotational inertia of the pilot arm and sidestick system about the pivot; C is the equivalent damping coefficient; K is the equivalent stiffness coefficient of the active sidestick system; is the friction torque of the sidestick about its pivot; and is the feedback torque transmitted from the loading motor to the sidestick through the reduction gear.
When the pilot controls the sidestick handle to move, the equivalent elasticity coefficient can be ignored because the components of the active sidestick handle are rigidly connected to each other. The equation from the resultant moment to the angle of the handle under the joint action of the motor and the pilot can be deduced as:
The reaction torque transmitted from the loading torque of the motor to the pitch axis can be expressed as:
where i is the gear reduction ratio and is the motor load torque. According to the torsional relationship of the torque sensor, the motor load torque can be expressed as:
where is the motor angular position, is the active sidestick deflection angle, and is the torsional stiffness. The motor angular speed is given by .
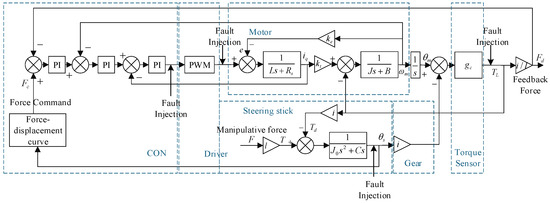
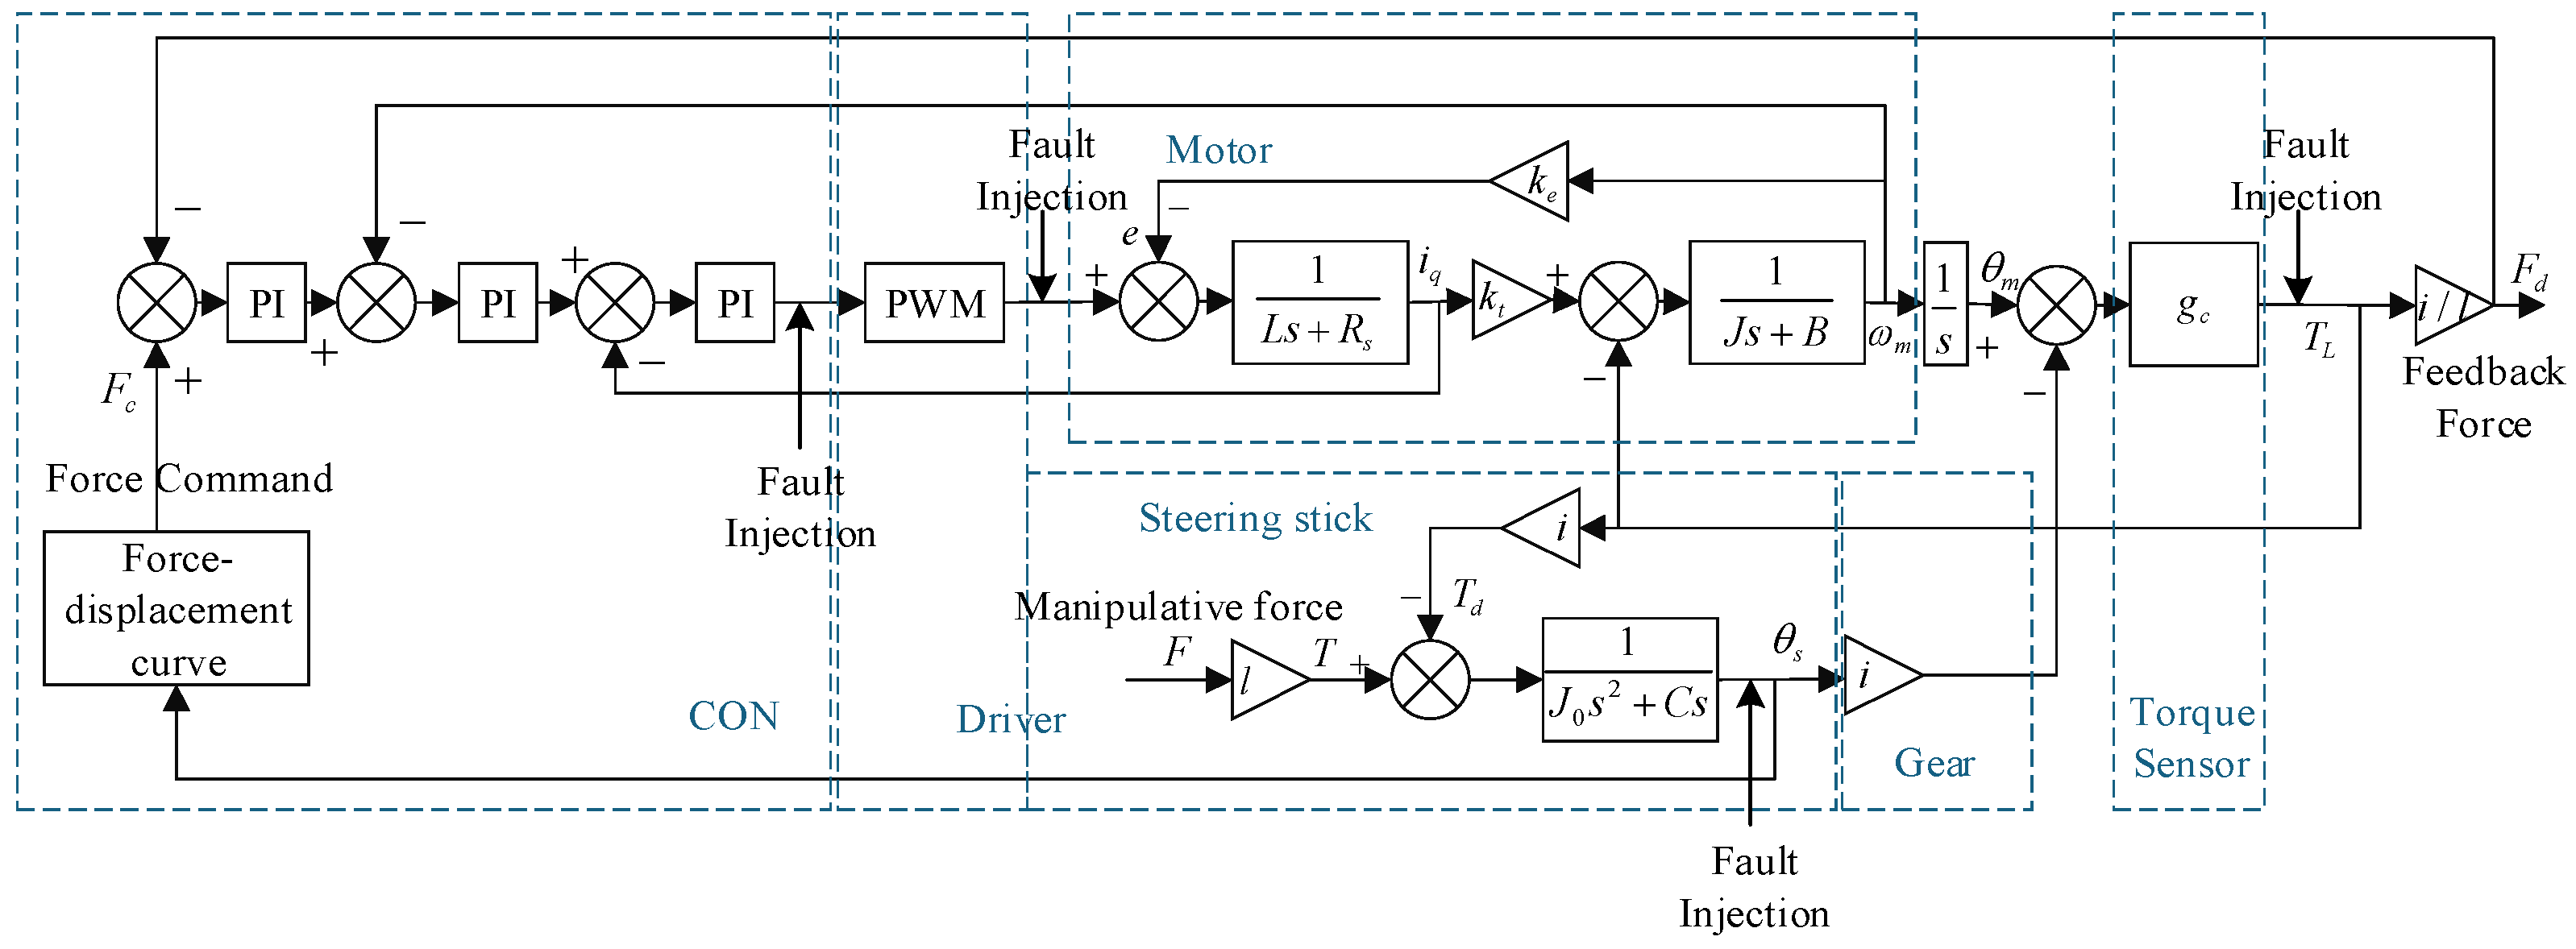
The dynamic model of the active sidestick system is established, as shown in Figure 2. To better describe the actual system, uncertainties such as friction and external load disturbance are added, and the calibration values of each parameter are as follows (Table 1) [24].
Figure 2.
System control block diagram.
Table 1.
Parameter calibration values.
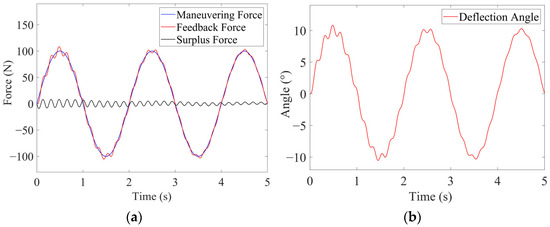
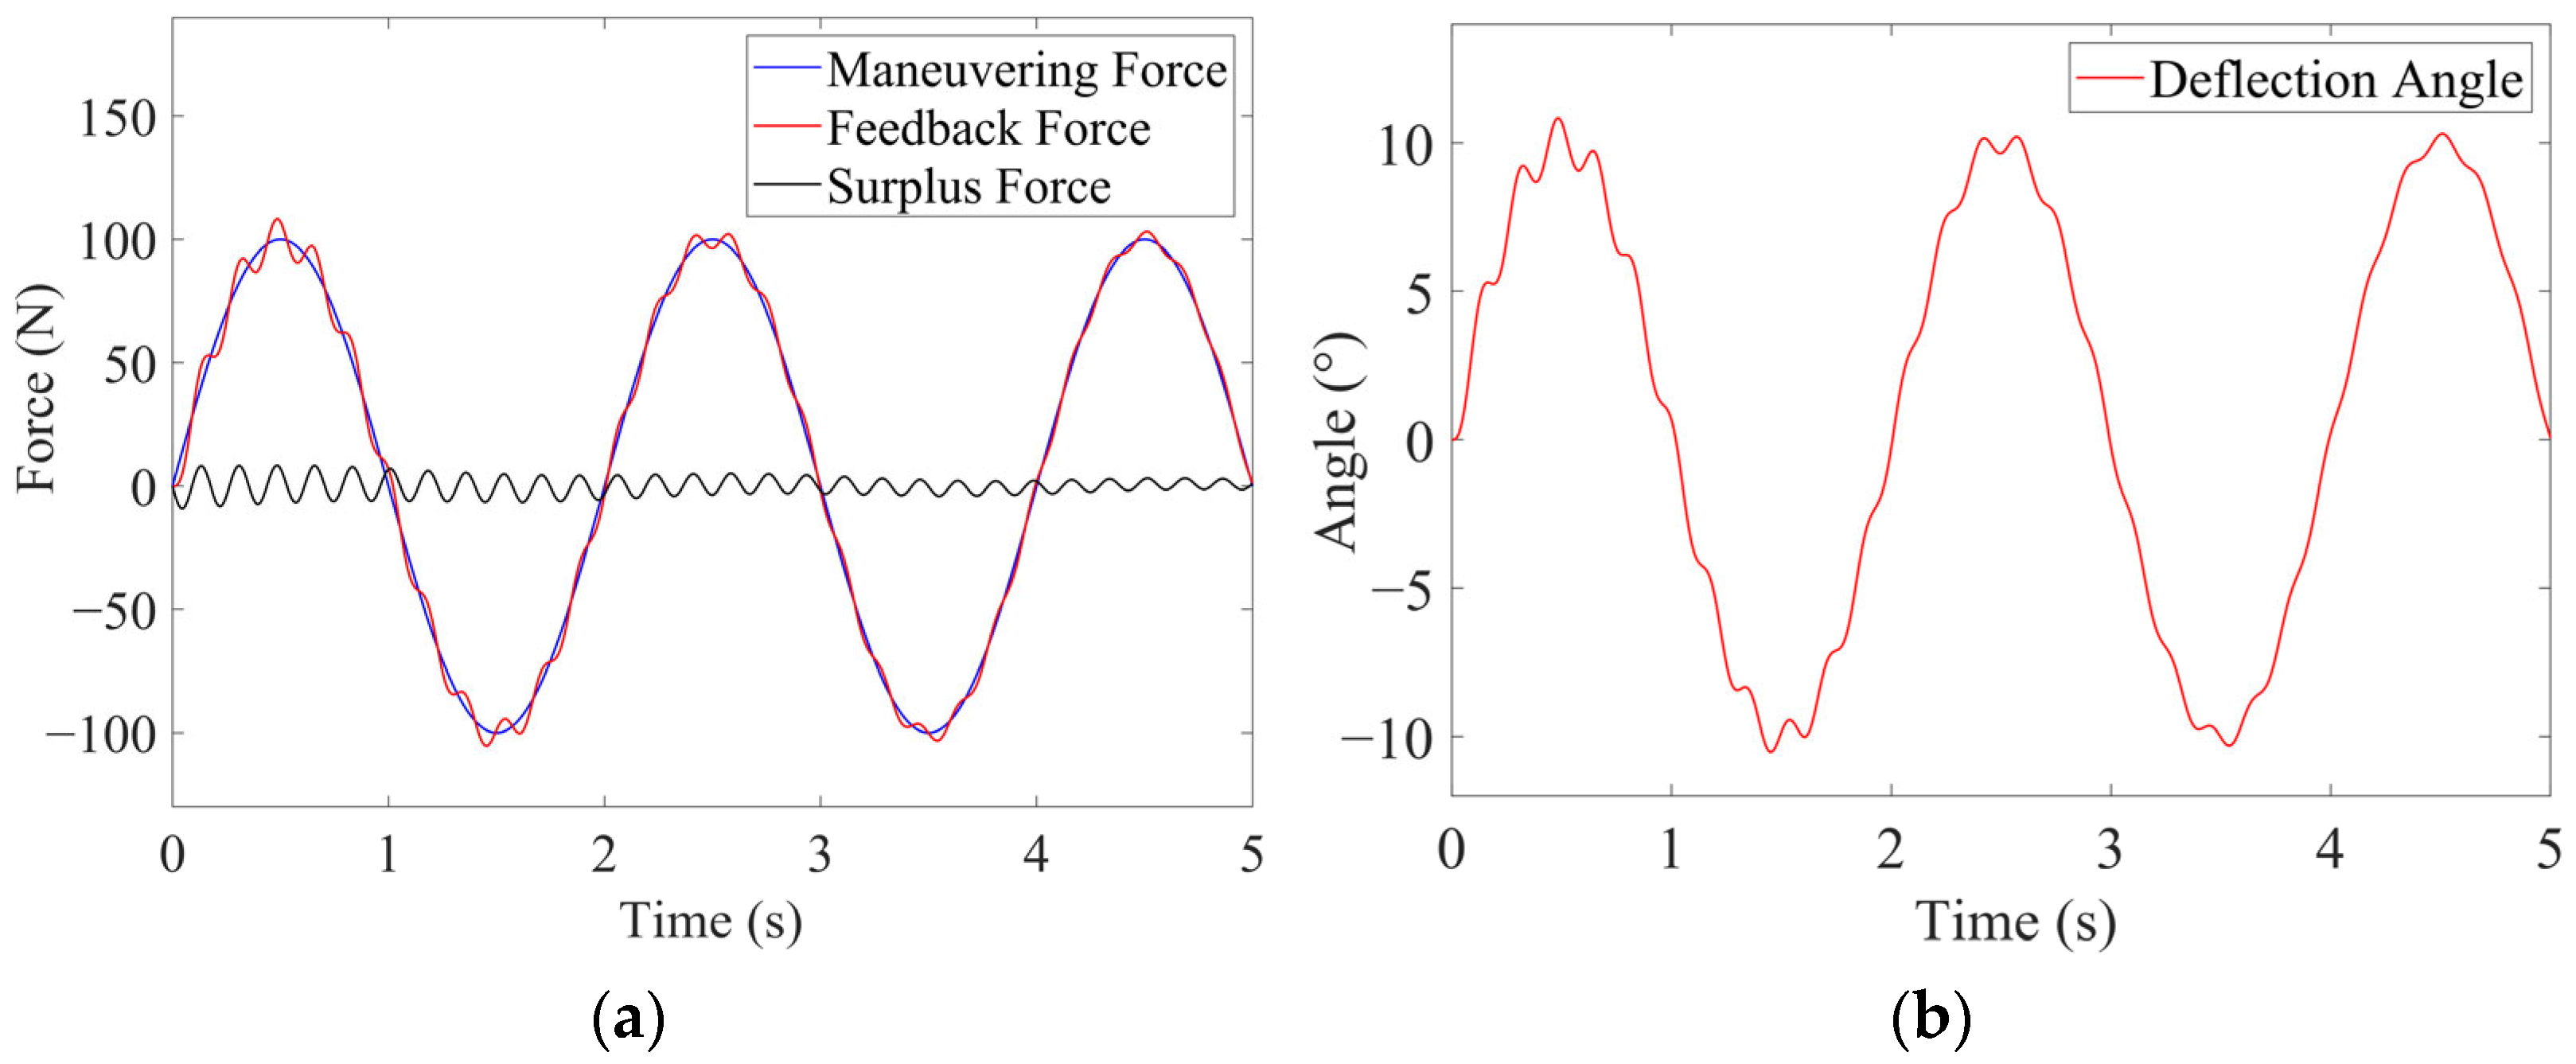
The system utilizes three closed-loop PI controls, which include current loops, speed loops, and force loops. The gradient of the force–displacement curve is fixed at 10. To validate the model, the simulation results are compared with the active sidestick data obtained from [25], as shown in Figure 3. When the same pilot maneuvering force is applied, the feedback force from the active sidestick aligns with the results found in the literature. The surplus force is defined as the difference between the feedback force generated by the system and the pilot input force. In cases where the input command is a sinusoidal manipulation force, the surplus force curve presented in this study matches the surplus force curve from the literature, demonstrating similar characteristics. Moreover, based on the force–displacement curve with a fixed gradient of 10, the output of the sidestick’s deflection angle is measured at 10°, which aligns with the operational principles of the active sidestick. Therefore, the model of the active sidestick system has been confirmed to be both correct and effective.
Figure 3.
Simulation results of three loop PI control: (a) load enhancement effect; (b) sidestick deflection angle.
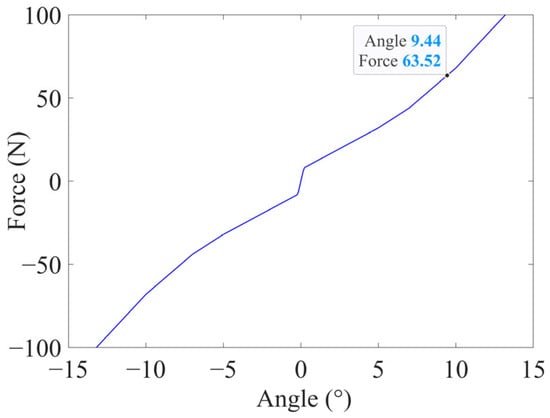
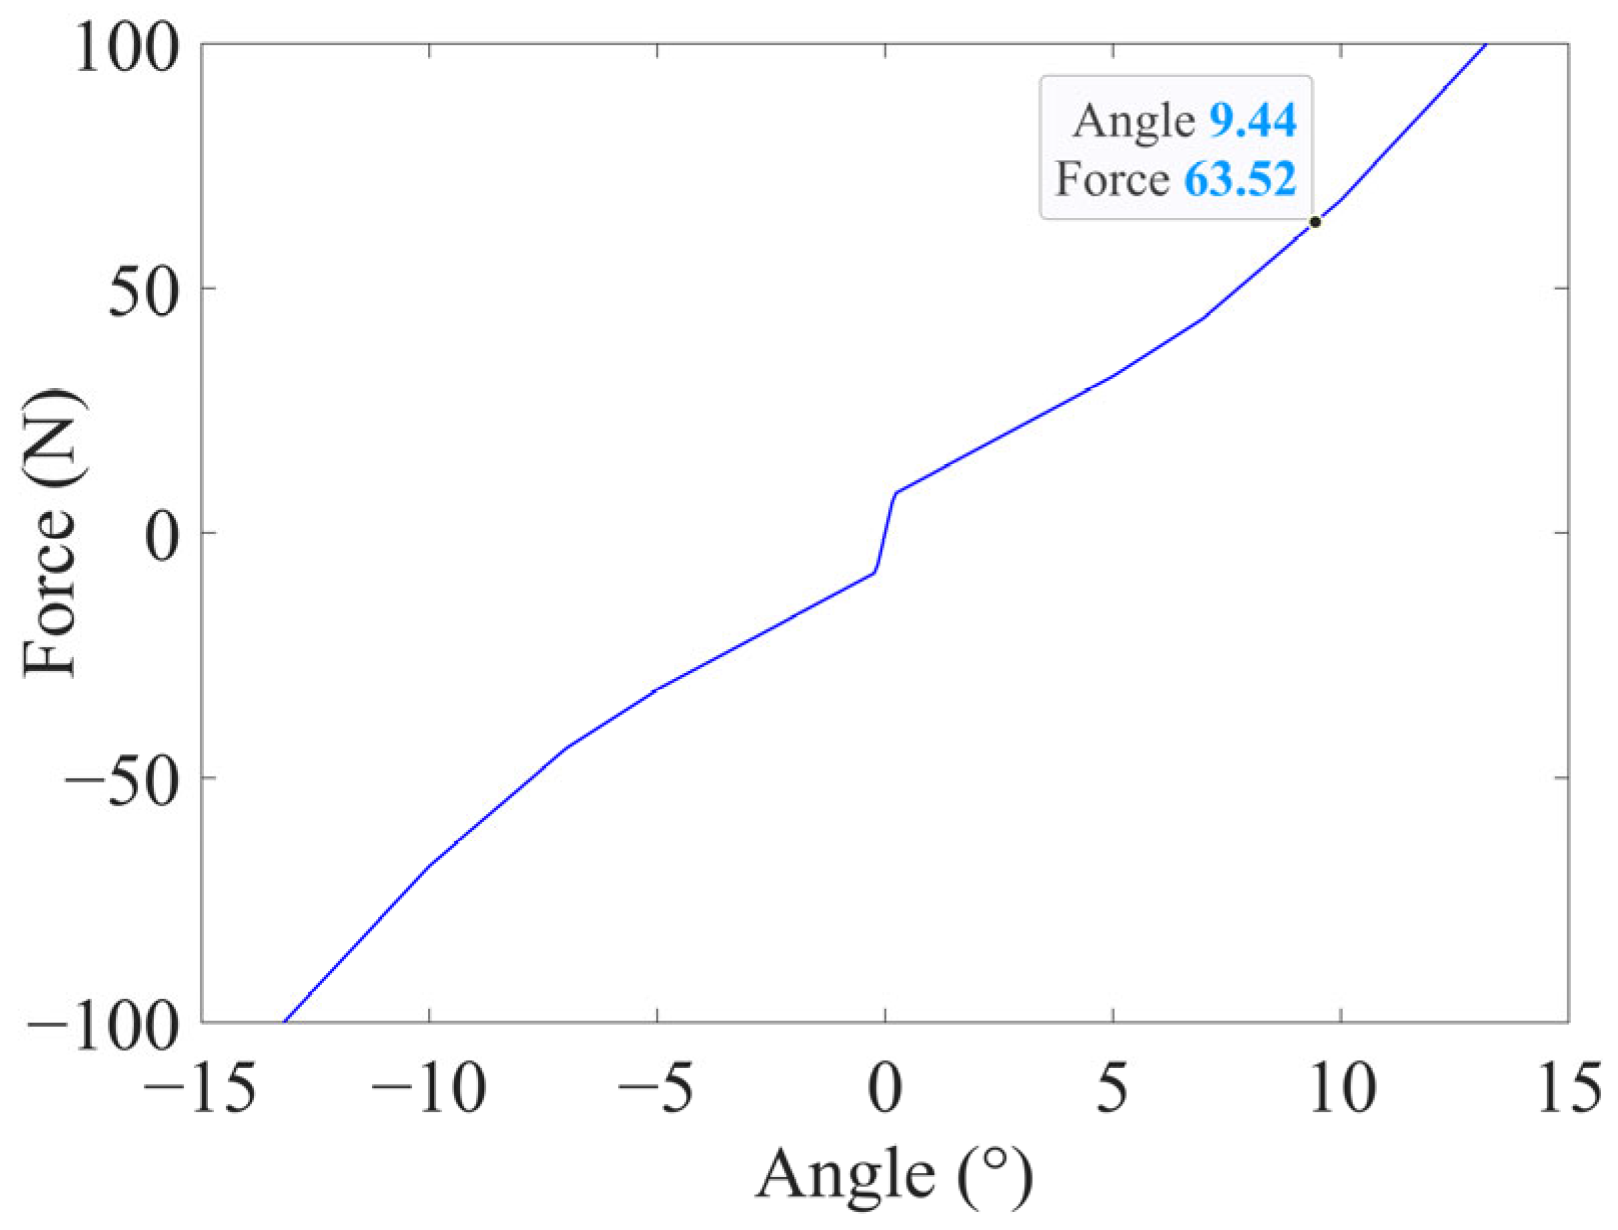
The active sidestick system is a typical complex control system with coupling, strong disturbance and multiple nonlinear factors. Therefore, the backstepping method was used to design a controller to control the active sidestick system to achieve the effect of surplus force suppression. To simplify the controller design process, current loop control was introduced into the permanent magnet synchronous motor controller to improve the anti-interference ability and robustness of the system. As shown in Figure 4, the sidestick deflection angle follows the force–displacement curve. When the control force reaches 63.52 N, the sidestick deflection angle is 9.44°, which is consistent with the force–displacement curve and conforms to the system operating logic.
Figure 4.
Pole force–displacement curve.
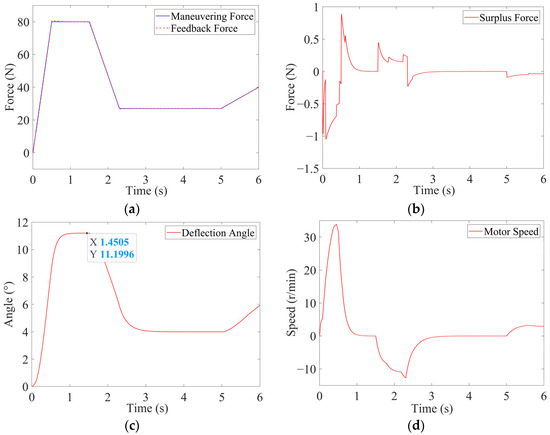
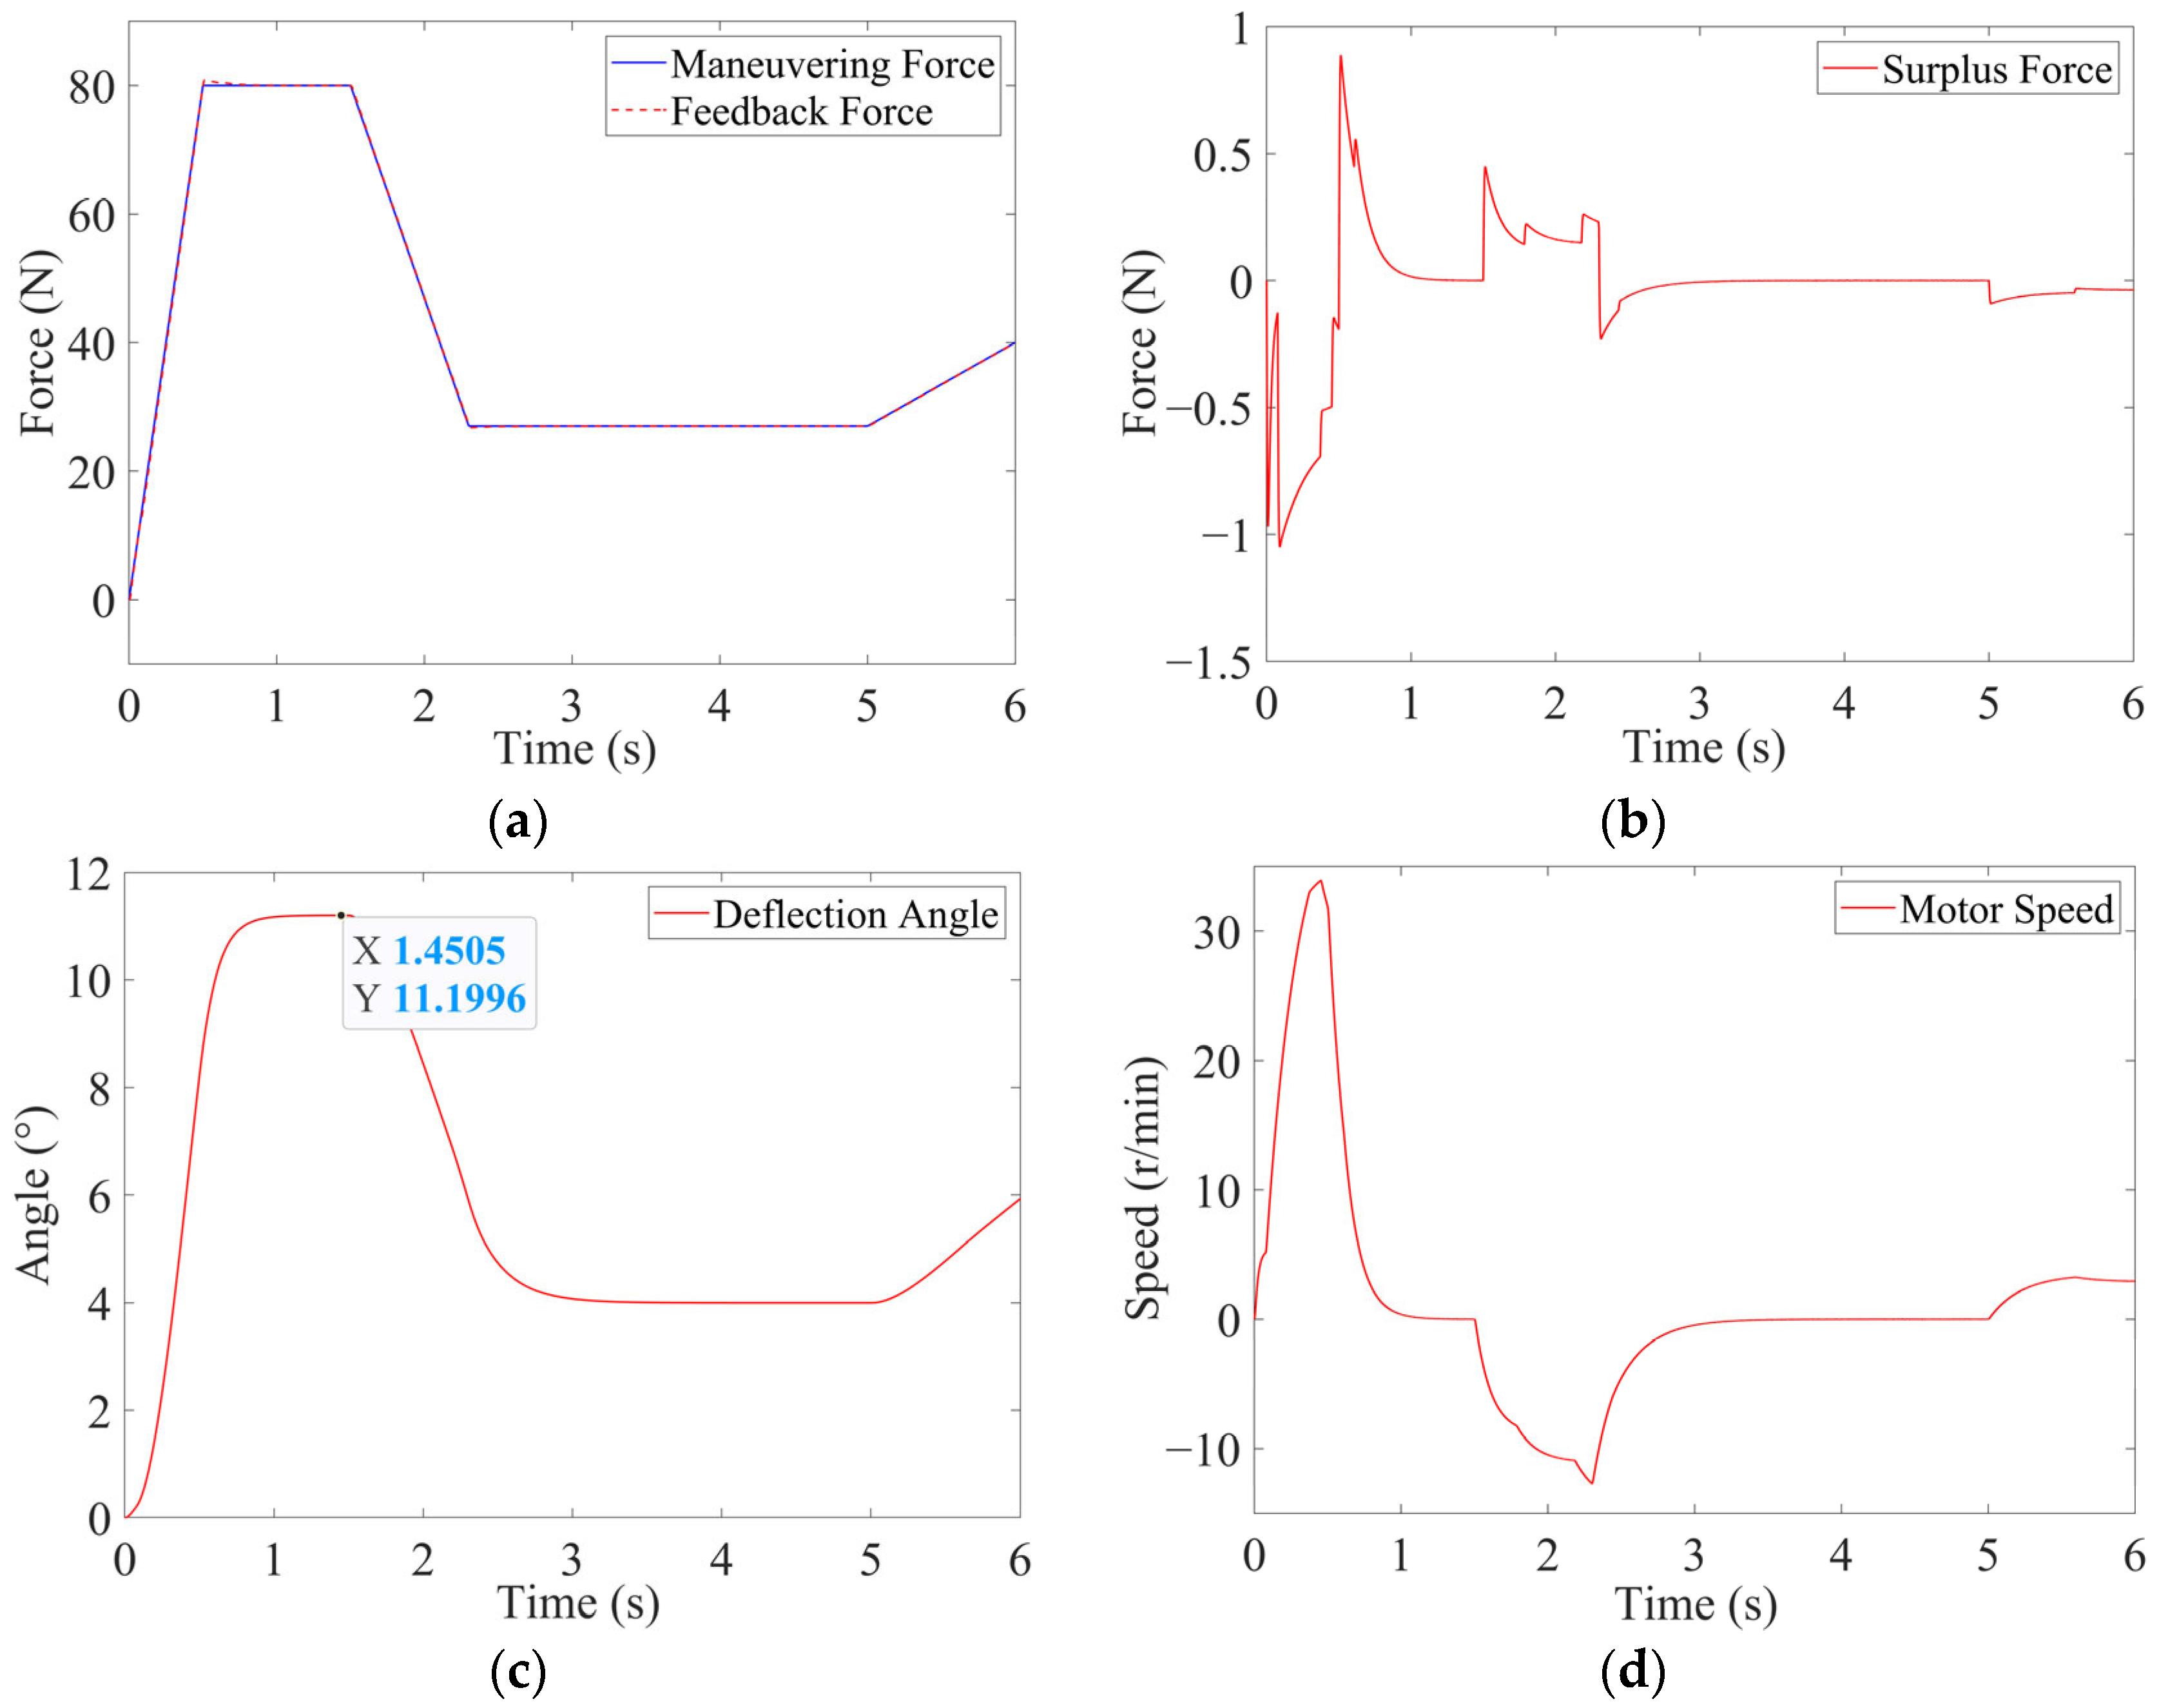
In previous work, the control performance and robustness of the adaptive backstepping controller were verified. The response of the system to the ramp pilot control command under variable stiffness conditions is shown in Figure 5 [21,22]. The input of the system is the pilot’s control force, and the output is the sidestick deflection angle. Under the ramp command, the difference between the pilot control force and the feedback force generated by the motor remains small.
Figure 5.
Simulation results of adaptive backstepping control: (a) load enhancement effect; (b) surplus force; (c) sidestick deflection angle; (d) motor speed.
2.2. PilotActive Sidestick–Aircraft Closed Loop Model
The active sidestick serves as an interface between the pilot and the flight control system. The pilot applies a control force to the sidestick according to the flight task and the perceived aircraft response, while the active loading system provides force feedback associated with the sidestick deflection and the operating state of the aircraft. The sidestick deflection is transmitted to the flight control system as a control command, and the resulting aircraft motion is subsequently perceived by the pilot. Based on this interaction relationship, a pilot–active sidestick–aircraft closed loop model is established by integrating the active sidestick model with a Hess structural pilot model and a simplified aircraft pitch axis model.
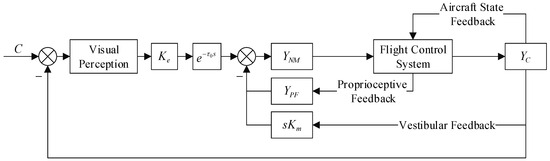
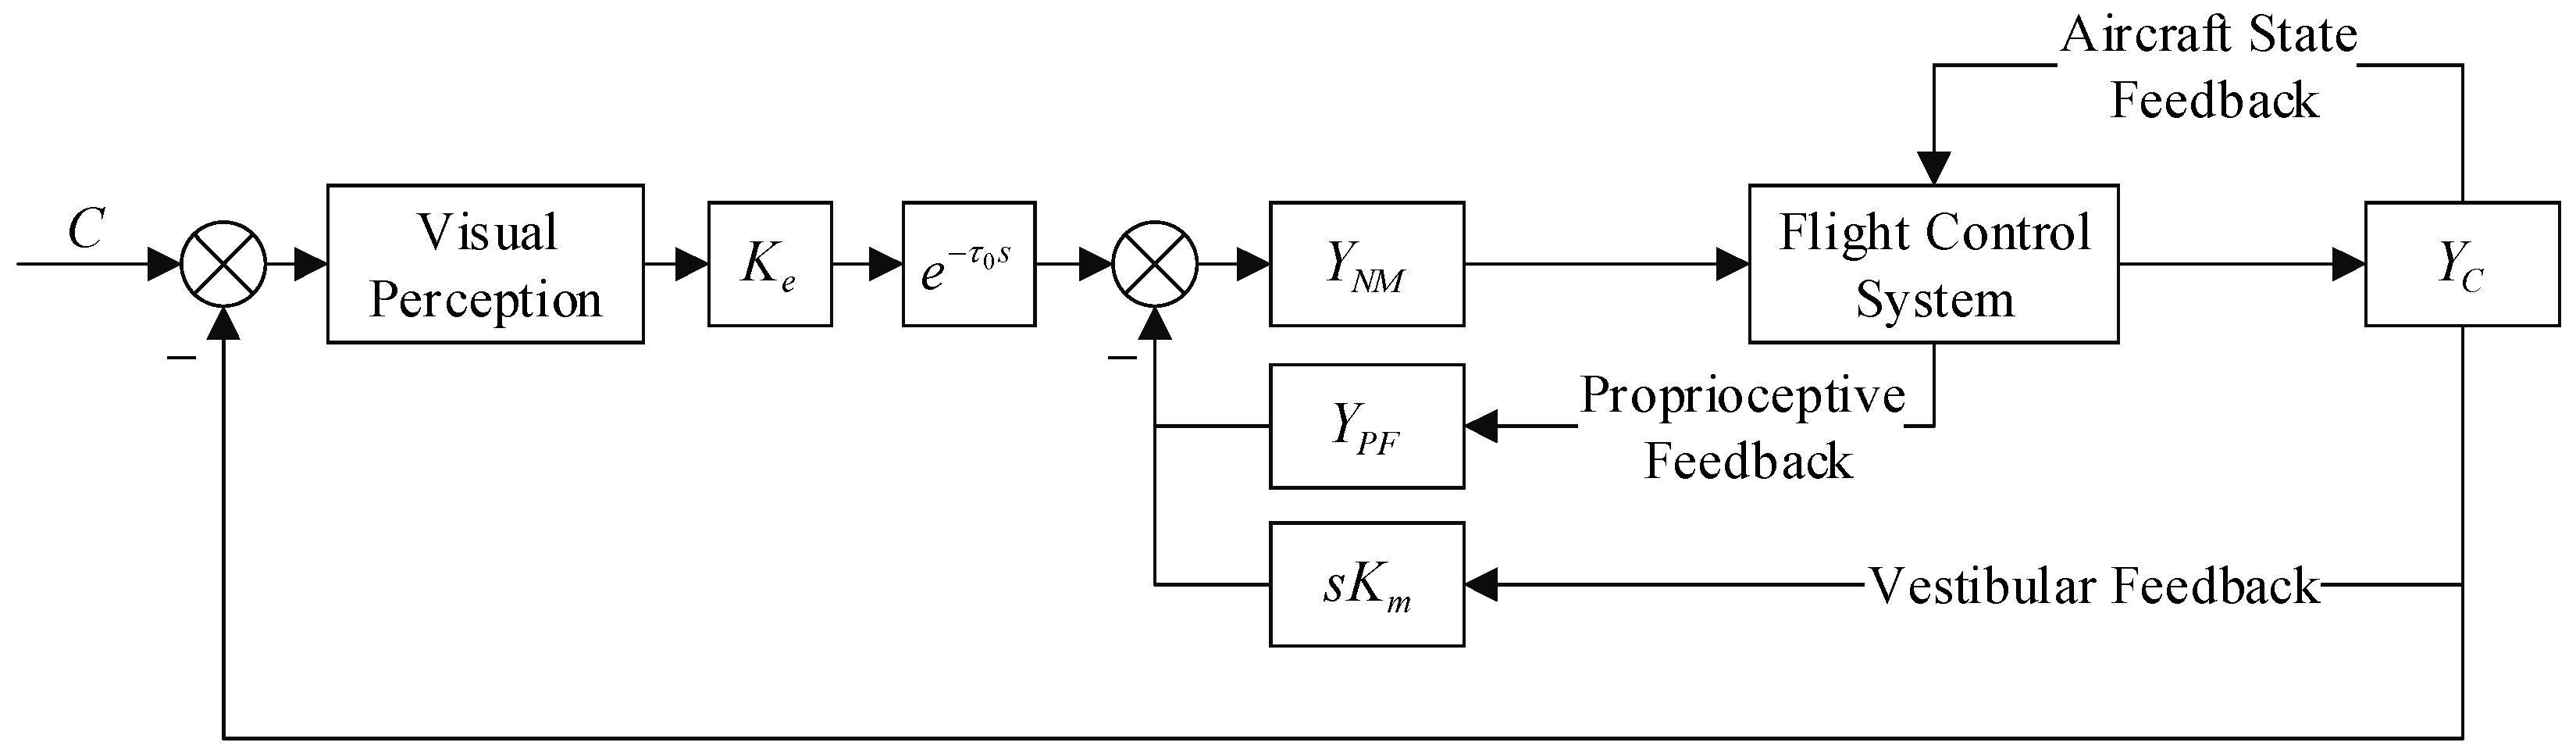
The Hess structural pilot model represents the pilot’s control behavior through visual perception, neuromuscular dynamics, proprioceptive feedback, and vestibular feedback [26]. The difference between the commanded pitch angle and the actual aircraft pitch angle forms the visual tracking error. After visual perception and the pilot reaction delay, the tracking error is combined with the proprioceptive and vestibular feedback signals to generate the pilot control action [27]; its structural block diagram is shown in Figure 6.
Figure 6.
Hess structural pilot model.
denotes the visual perception gain. Its value is selected such that the crossover frequency ωc of the pilot aircraft open loop system is approximately 2 rad/s, while the pilot reaction delay is generally set to 0.2 s. The visual perception gain reflects the urgency of the pilot’s control action during task execution. Increasing improves the pilot’s response speed to the command tracking error; however, an excessively large value may result in overcontrol.
represents the pilot neuromuscular dynamics, which are commonly described by a second-order transfer function. In practical simulations, a first-order model is sufficient to represent the dominant dynamic characteristics of the neuromuscular system. The neuromuscular time constant is generally selected within the range of 0.1–0.2 s, and is a coefficient associated with the variable stiffness characteristics of the active sidestick. Accordingly, the neuromuscular dynamics can be expressed as [28]:
represents the proprioceptive feedback element, which characterizes the pilot’s perception of arm displacement, with the sidestick deflection angle used as its input. Proprioceptive feedback is generally classified into three forms: lead, proportional, and lag. The proprioceptive element should be selected such that the slope of the magnitude frequency characteristic of the pilot vehicle open loop transfer function is approximately −20 dB/10 near the crossover frequency. Based on the operating characteristics of the system, a lag-type proprioceptive model, K/(s + a), is adopted. Proprioceptive feedback reflects the pilot’s control precision in performing the assigned task. A small value of K results in insufficient task tracking, whereas an excessively large value may lead to overtracking.
denotes the vestibular feedback gain. Vestibular feedback primarily represents the pilot’s perception of aircraft motion, and a semicircular canal model is employed to describe the perception of angular velocity, as shown in Figure 7. The aircraft motion signal is first processed by a washout filter and then introduced into the motion platform dynamics. The resulting platform motion signal is subsequently supplied to the semicircular canal model to generate the perceived motion cue. The outputs of the vestibular and proprioceptive models are used as feedback information in the neuromuscular control process. The value of determines the influence of motion perception on the pilot response. As increases, the pilot command may gradually change from a smooth response to an oscillatory response.
Figure 7.
Angular velocity perception model.
denotes the controlled plant, namely, the aircraft dynamics. In this study, the longitudinal pitch dynamics are considered after decoupling the longitudinal and lateral directional motions. Following appropriate simplification and linearization, the aircraft equations of motion are expressed as:
In these equations, α is the aircraft angle of attack, q is the pitch rate, θ is the pitch angle, and δ is the elevator deflection angle. , where is the air density, S is the wing reference area, is the mean aerodynamic chord, and m is the aircraft mass. In addition, , where U is the equilibrium flight speed. , and denote the thrust, drag, lift, weight, and pitching moment coefficients, respectively. is the flight path angle, , iyy is the pitch moment of inertia, and .
Substituting the aircraft parameters into the linearized equations yields the following state space model:
The pole locations of the open-loop aircraft model indicate that the system is unstable. Therefore, a PID controller is introduced and its parameters are tuned to obtain satisfactory closed-loop stability and dynamic response.
3. Analysis of Oscillation Mechanism
3.1. The Mechanism of Oscillation Signal Generation
For fly-by-wire flight control systems implemented by complex digital software and hardware, the transmission signals in the electronic circuits are easily interfered with by internal and external interference sources, forming uncommand signals. Internal and external interferences capable of modifying instructions and producing uncommand signals typically include, but are not limited to, loss of data bits, harmful transients, processing of signals by asynchronous microprocessors, transmission delays, signal distortion, sensor noise, unreliable sensor signals, lightning, and electromagnetic effects [29,30]. However, in highly integrated digital systems, these disturbances may occur independently or in combination, and their interaction can introduce spurious oscillatory components into the command or feedback paths. For example, abnormal asynchronous processing or transport lag may disrupt the intended timing relationship among redundant computing channels and thereby produce an oscillatory output. Variations in sensor or interface impedance, together with impedance mismatch in the transmission path, may also distort measurement noise and result in an oscillatory feedback component [20].
3.2. Oscillation Signal Form and Position
In general, the frequency range of the oscillation signal generated by the electric actuation system is 0.05–50 Hz. The impact of the oscillation signal with a frequency lower than 0.2 Hz on the system is negligible. There is a low-pass filter architecture in the active sidestick, and oscillating signals above 10 Hz are not transmitted to the sidestick handle. Therefore, the frequency range of the oscillation signal that causes the oscillation failure is usually 0.2–10 Hz [31]. The oscillation form of the oscillation signal is any shape from the triangular wave to the sinusoidal waveform, and the amplitude range of the common oscillation signal is 30%~250% of the normal signal amplitude based on engineering experience [32].
The oscillation signal is generated in all the commands and signals that enable the force-loading closed-loop system: computer components and interfaces, feedback components (e.g., sensors), drive components and structural mounting components.
4. Oscillation Failure Simulation Analysis
An oscillation failure is a typical superimposed fault, that is, the superposition of a normal signal with a fault signal. Oscillating signals usually come in the form of sine waves, triangular waves, etc. In order to clarify the influence of the type, frequency, amplitude and other factors of the oscillation signal on the system, the oscillation signal was set as a sine wave, with a triangular wave used for a comparison. The simulation results under the condition of change of frequency (constant amplitude) and change of amplitude (constant frequency) were compared, and the influence of the oscillation signal on the output of the system was studied. Three parameters were selected as the basis for analysis: the system sidestick deflection angle, surplus force and motor speed. The sidestick deflection angle represents the sidestick command output, which is the most important function of the sidestick; the system surplus force represents the control effect of the system and the pilot’s control feeling; and the motor speed represents the working state of the motor. All simulations were performed using MATLAB/Simulink R2023b.
4.1. Analysis of Faults with Fixed Frequency and Fixed Amplitude
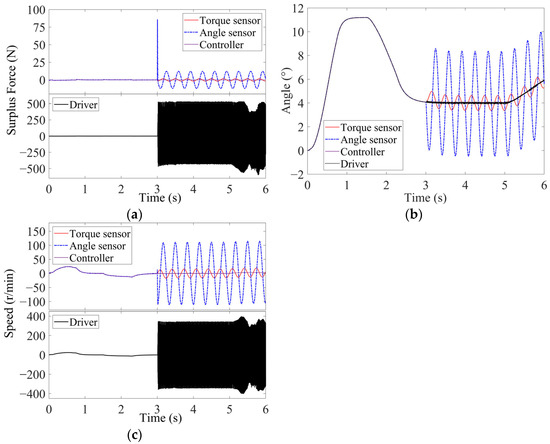
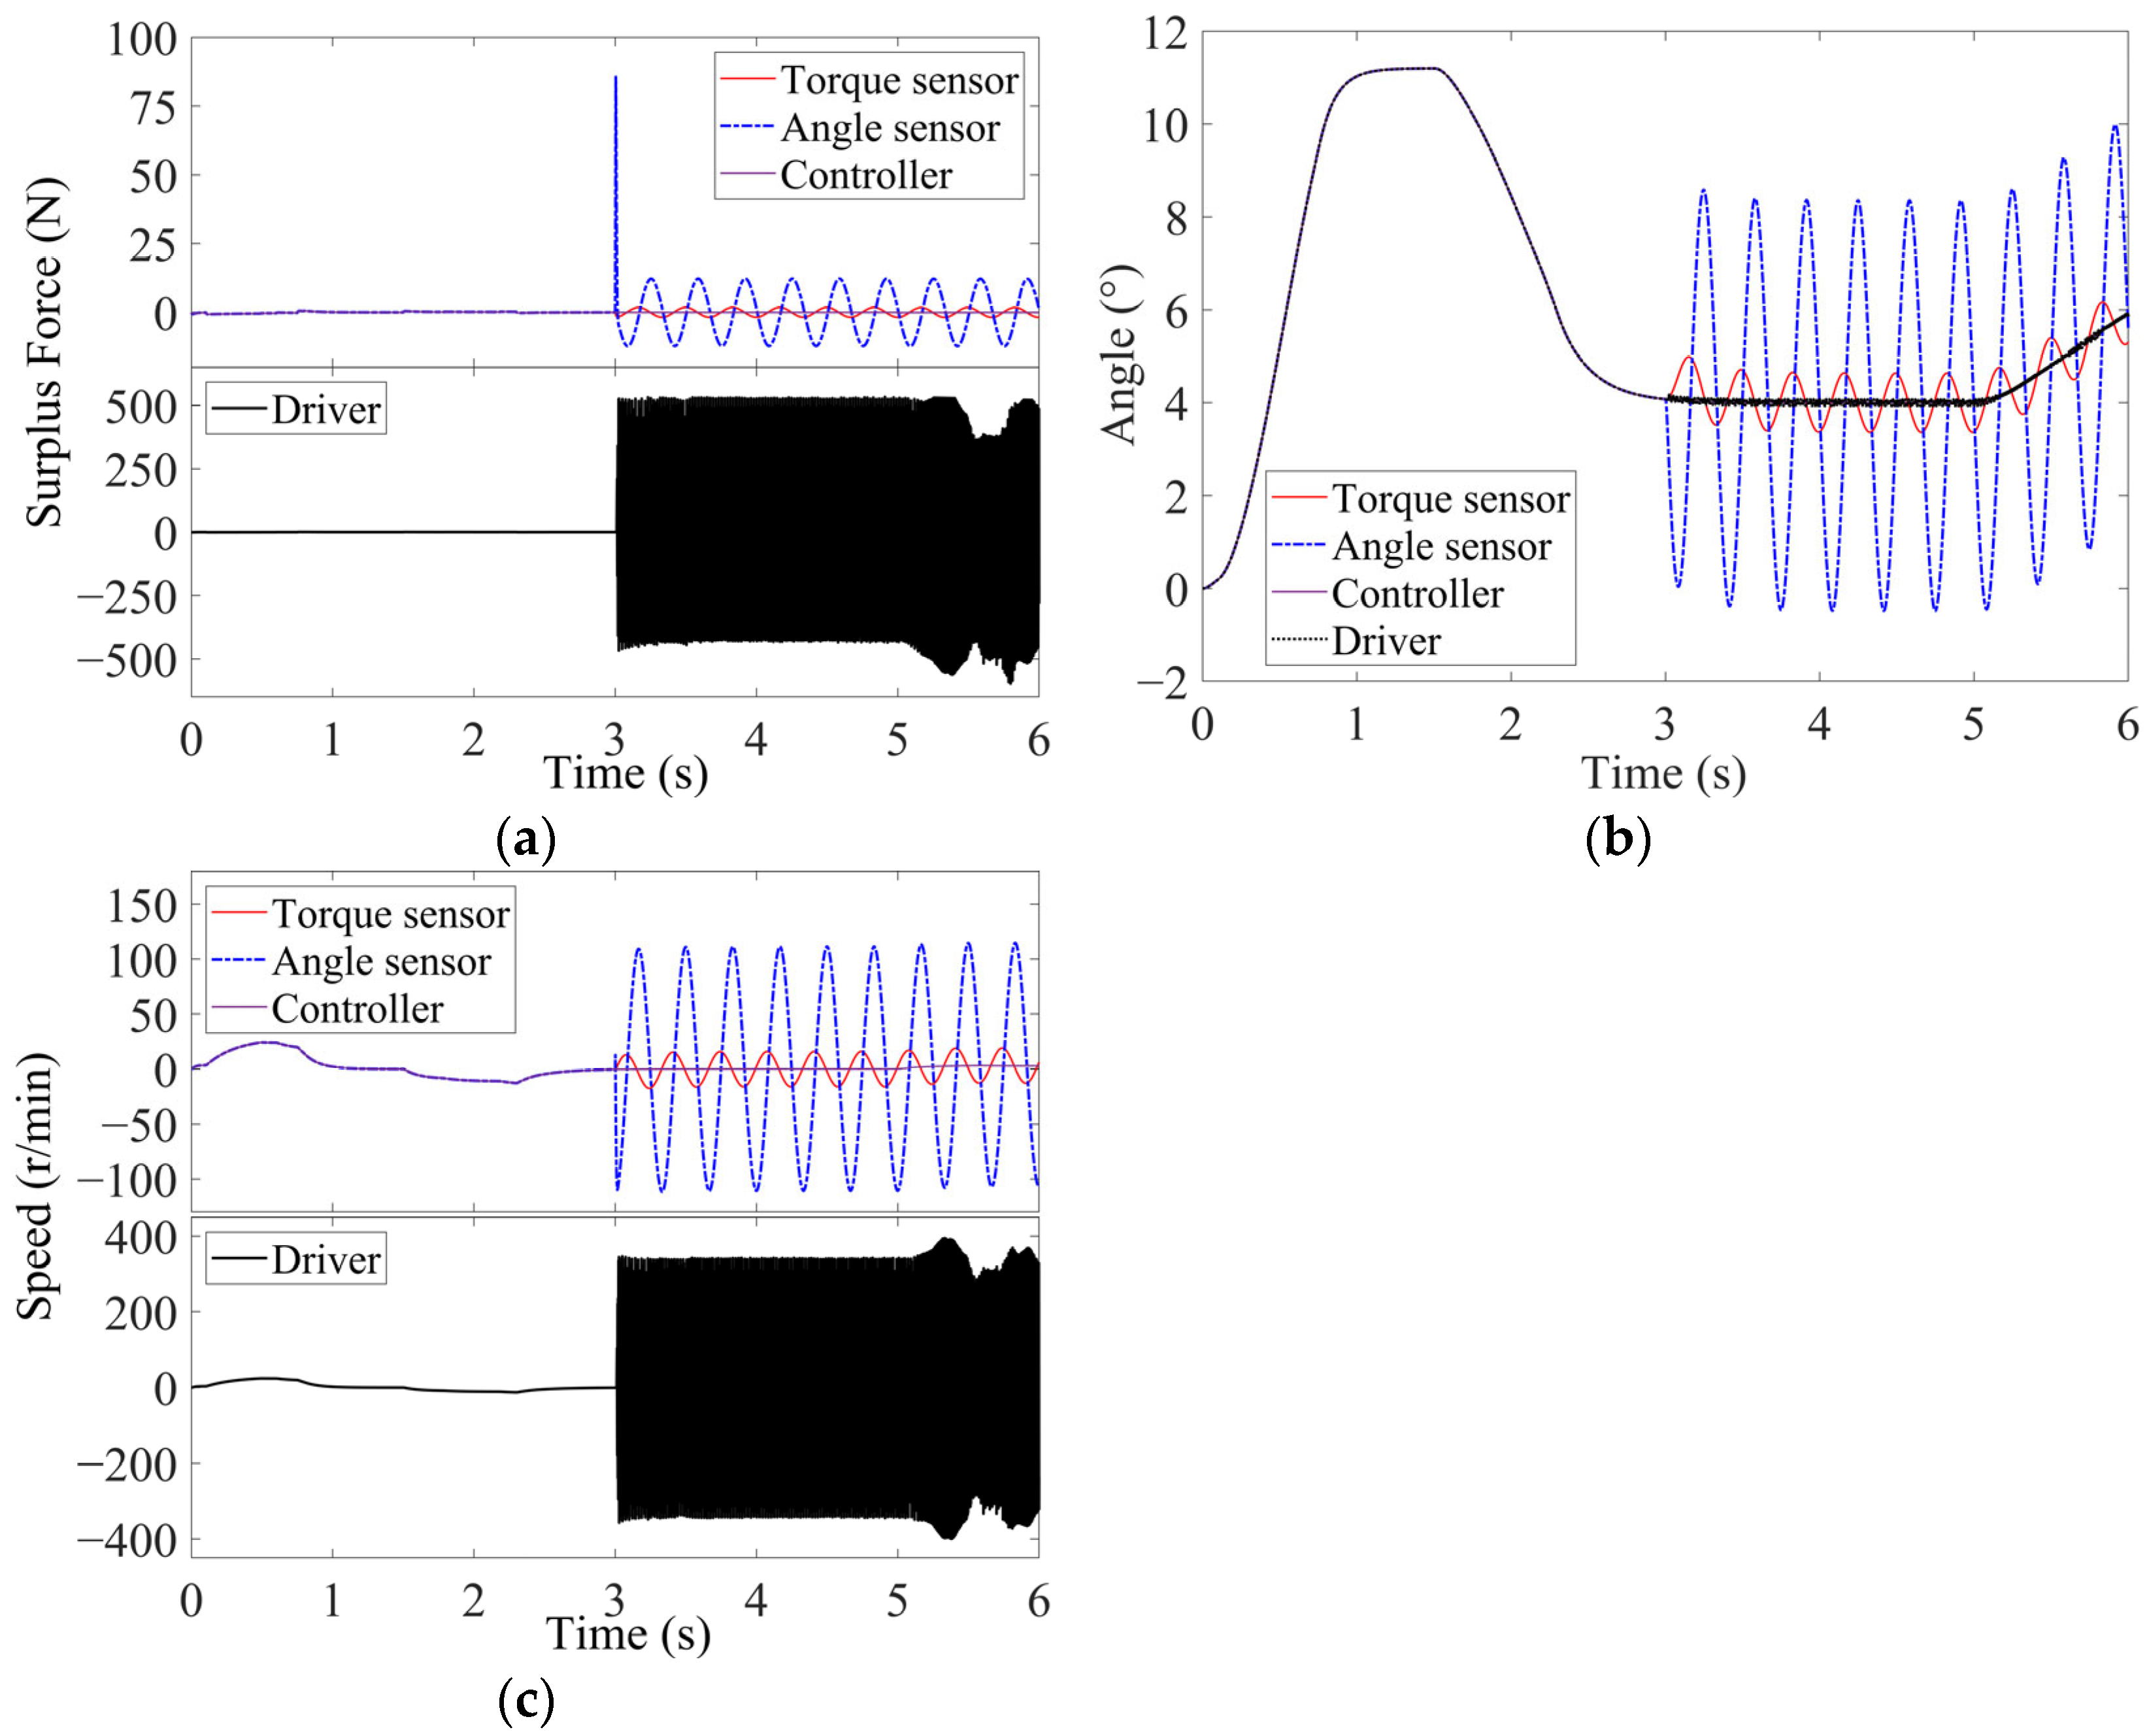
Oscillation signal faults were injected at the sensor output, controller output, and driver input. The signal frequency was 3 Hz and the amplitude was 50% of the normal signal. The sine wave oscillation signal was superimposed at 3 s, and the influence of different positions of the oscillation signal on the system was studied. The results of the fault simulation are shown in Figure 8.
Figure 8.
Simulation results of fault injection with fixed amplitude and fixed frequency: (a) surplus force; (b) sidestick deflection angle; (c) motor speed.
Oscillation faults can cause the sidestick output to oscillate, with varying degrees of oscillation at different positions. From the perspective of oscillation amplitude, the angle sensor is directly related to the closed-loop control of the sidestick output, and the oscillation degree of the sidestick deflection angle is the largest under the same degree of fault. The feedback signal of the torque sensor does not directly affect the deflection angle of the sidestick but reacts through the force–displacement relationship, and the degree of sidestick oscillation caused by its fault is small. The driver is directly related to the operation of the motor, so its oscillation will cause the sidestick to oscillate, which is characterized by high oscillation frequency but small amplitude. In contrast, the oscillation signal at the output of the controller has little effect on the sidestick deflection.
The surplus force represents the loading performance of the system and the pilot’s control feeling. The driver oscillation fault will lead to an increase in the surplus force of the system, and driver failure causes a large fluctuation in the surplus force of the system. These changes indicate that the working state of the system is abnormal. The failure of the angle sensor will lead to an increase in the surplus force of the system. However, the amplitude of the surplus force becomes significant only at the fault injection time. The failure of the torque sensor leads to a small increase in the surplus force of the system. Controller failures have little effect on the system’s surplus force.
The motor speed represents the working state and system performance of the system. It can be seen from the simulation results that the driver oscillation fault has the greatest impact on the system performance because it is directly related to the loading motor. Even a slight fault can cause the motor speed to oscillate at twice the rated speed, leading to increased motor power and frequent shaking. These can easily cause the motor to burn out or lead to damage in the mechanical structure. Sensor failure will cause motor speed oscillation. The degree of speed oscillation is related to the position, amplitude, and frequency of the oscillation signal. Controller failures have no effect on motor speed and are not considered in the following analysis.
4.2. Fault Analysis of Constant Frequency and Variable Amplitude
From the analysis results of Section 4.1, it can be seen that the fault of the controller output will not have a significant impact on the system performance. The oscillation fault of the driver output mainly affects the system performance. Therefore, this paper provides an in-depth analysis of the fault at the output of the sensor. In this section, the frequency of the oscillation signal is set to 1 Hz, and the signal amplitude is set to 50%, 100%, and 200% of the normal signal amplitude. The oscillation signal fault is simulated in the third second, and the influence of the oscillation signal type and amplitude on the system is studied.
4.2.1. Torque Sensor Failure
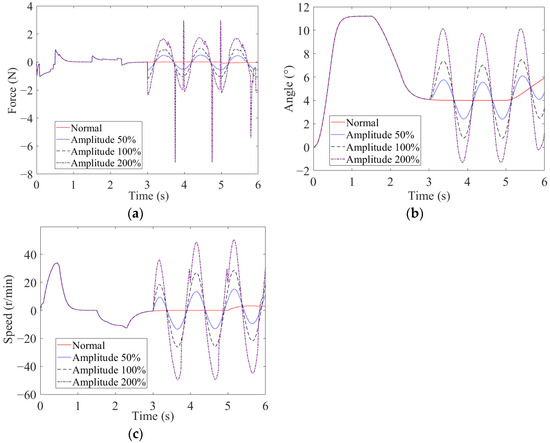
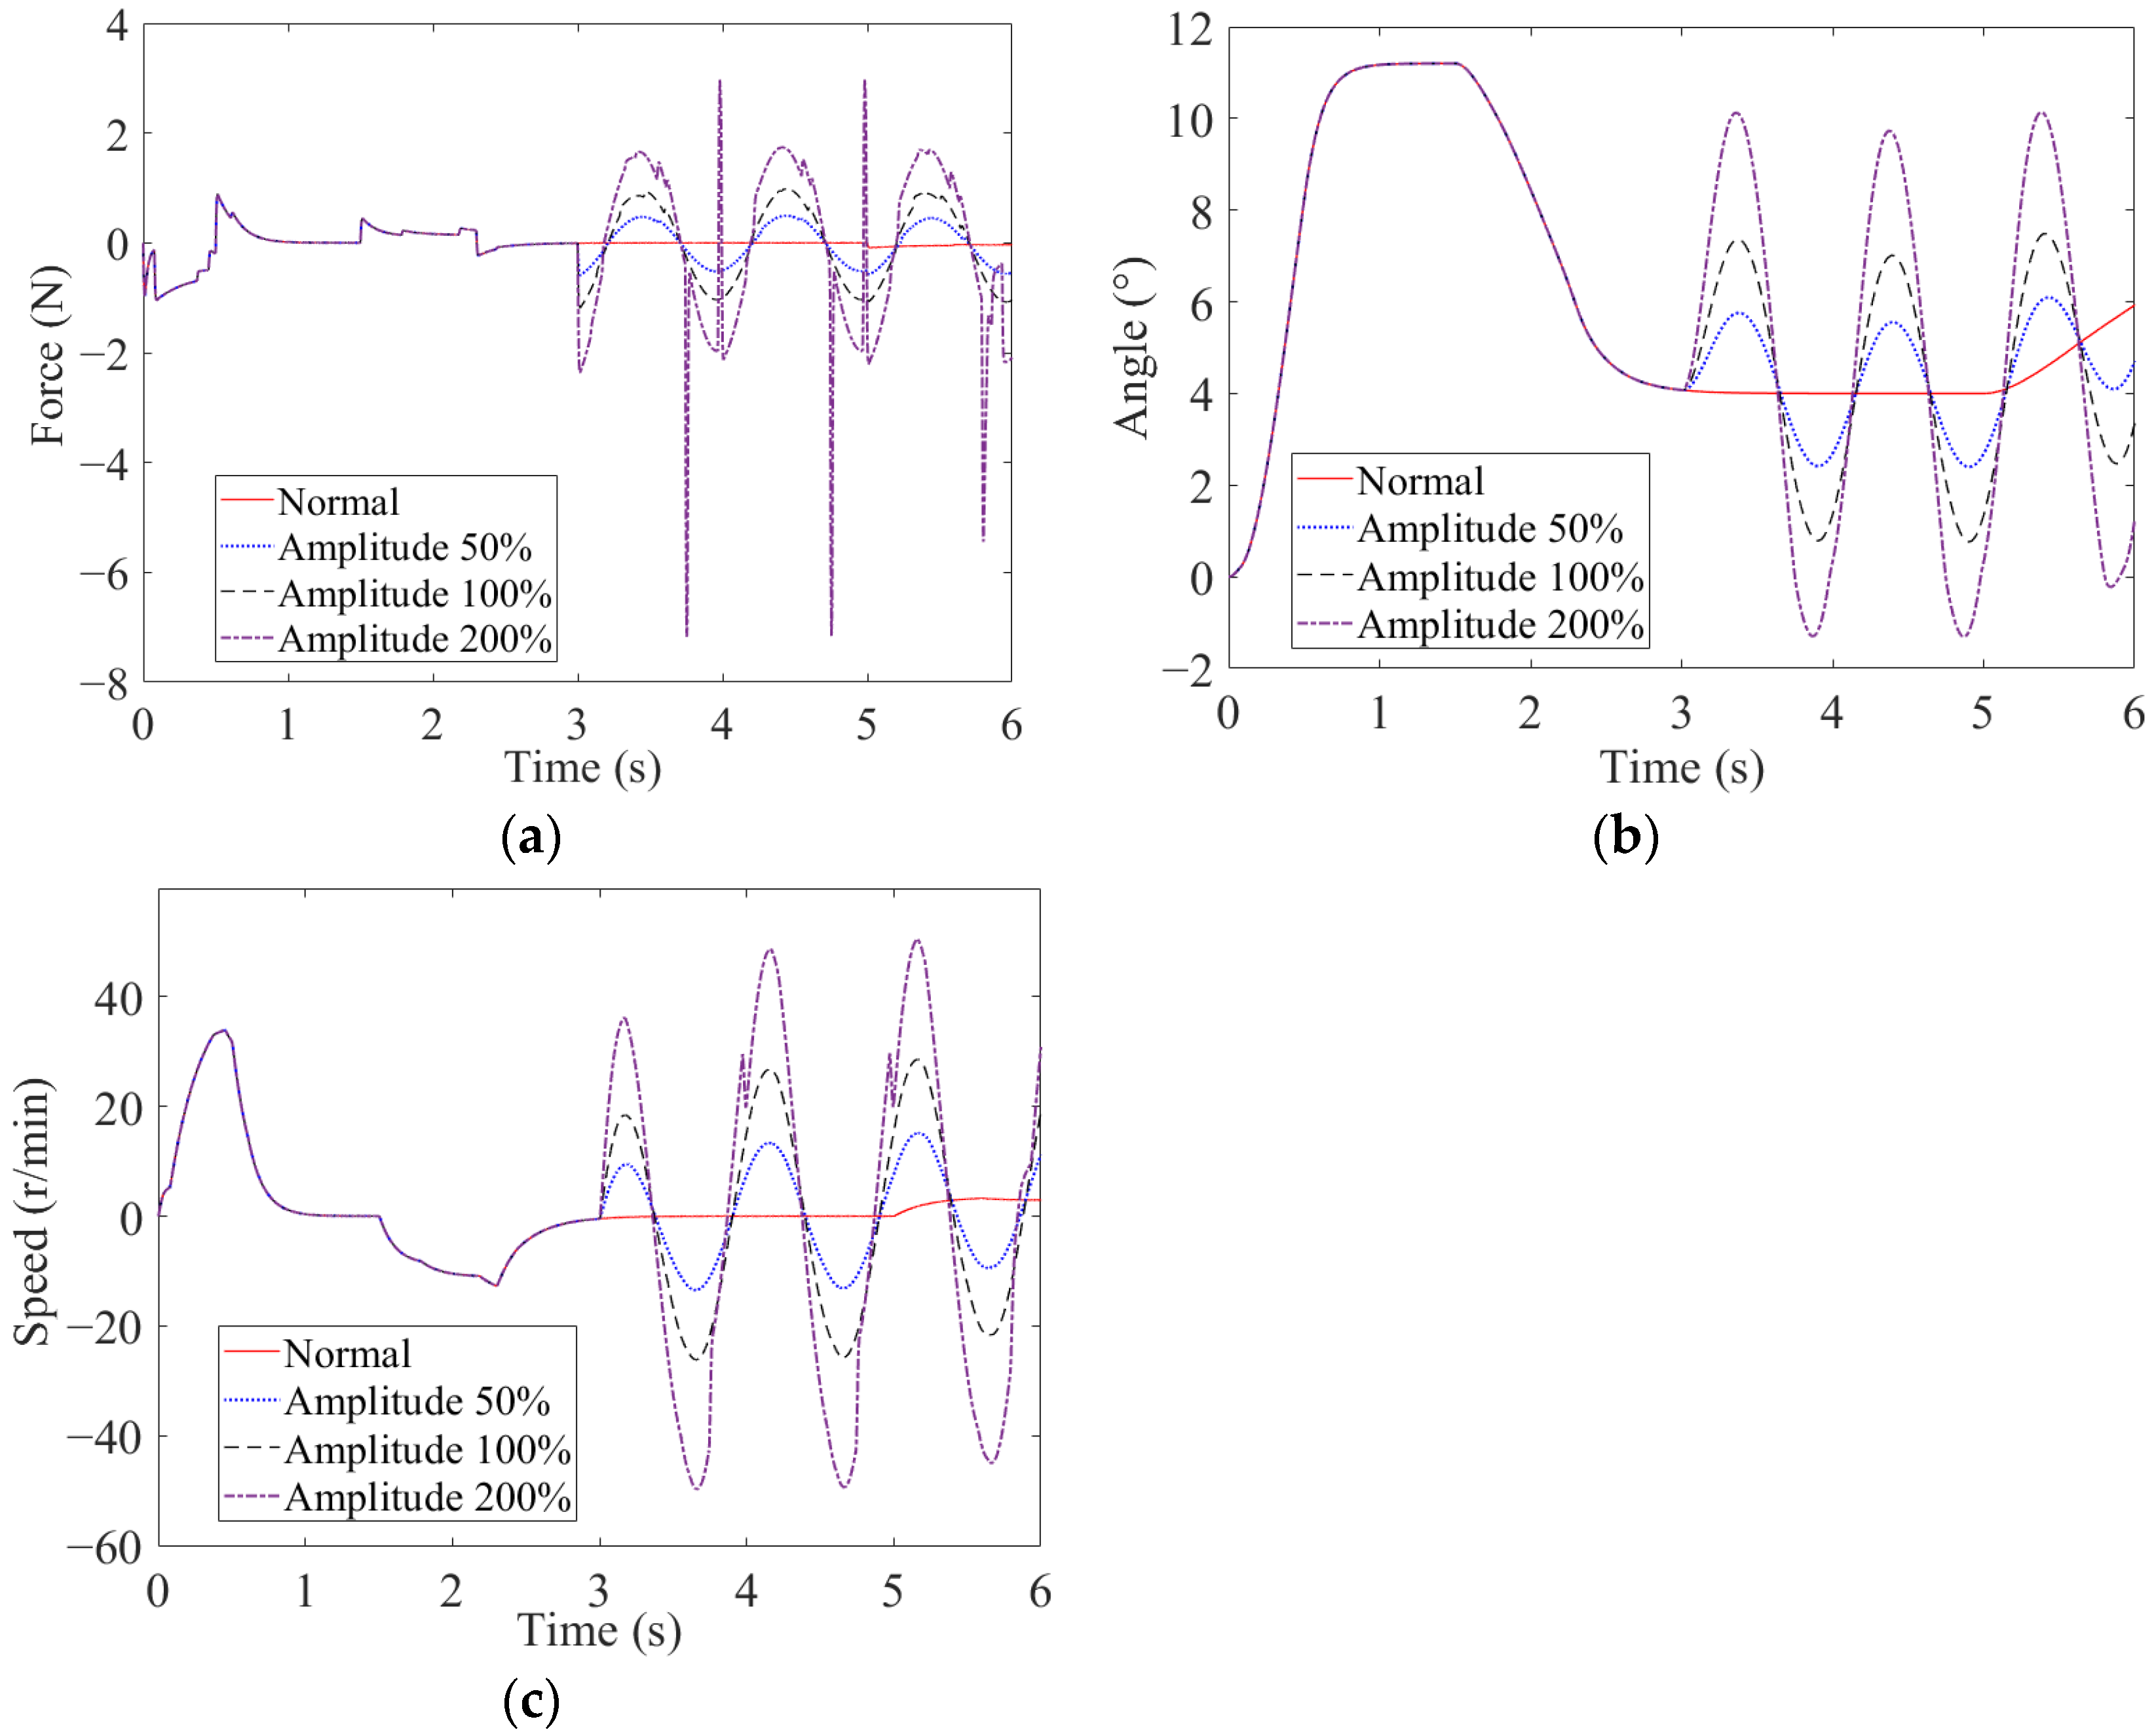
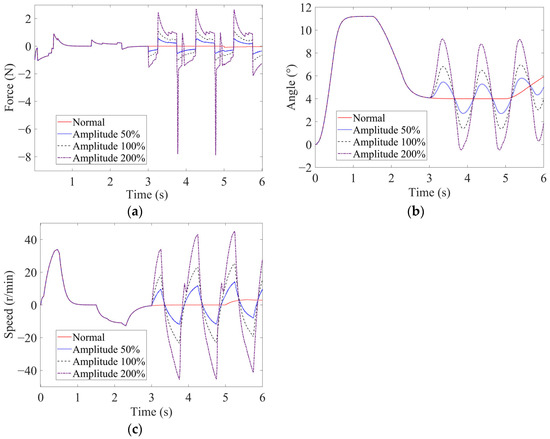
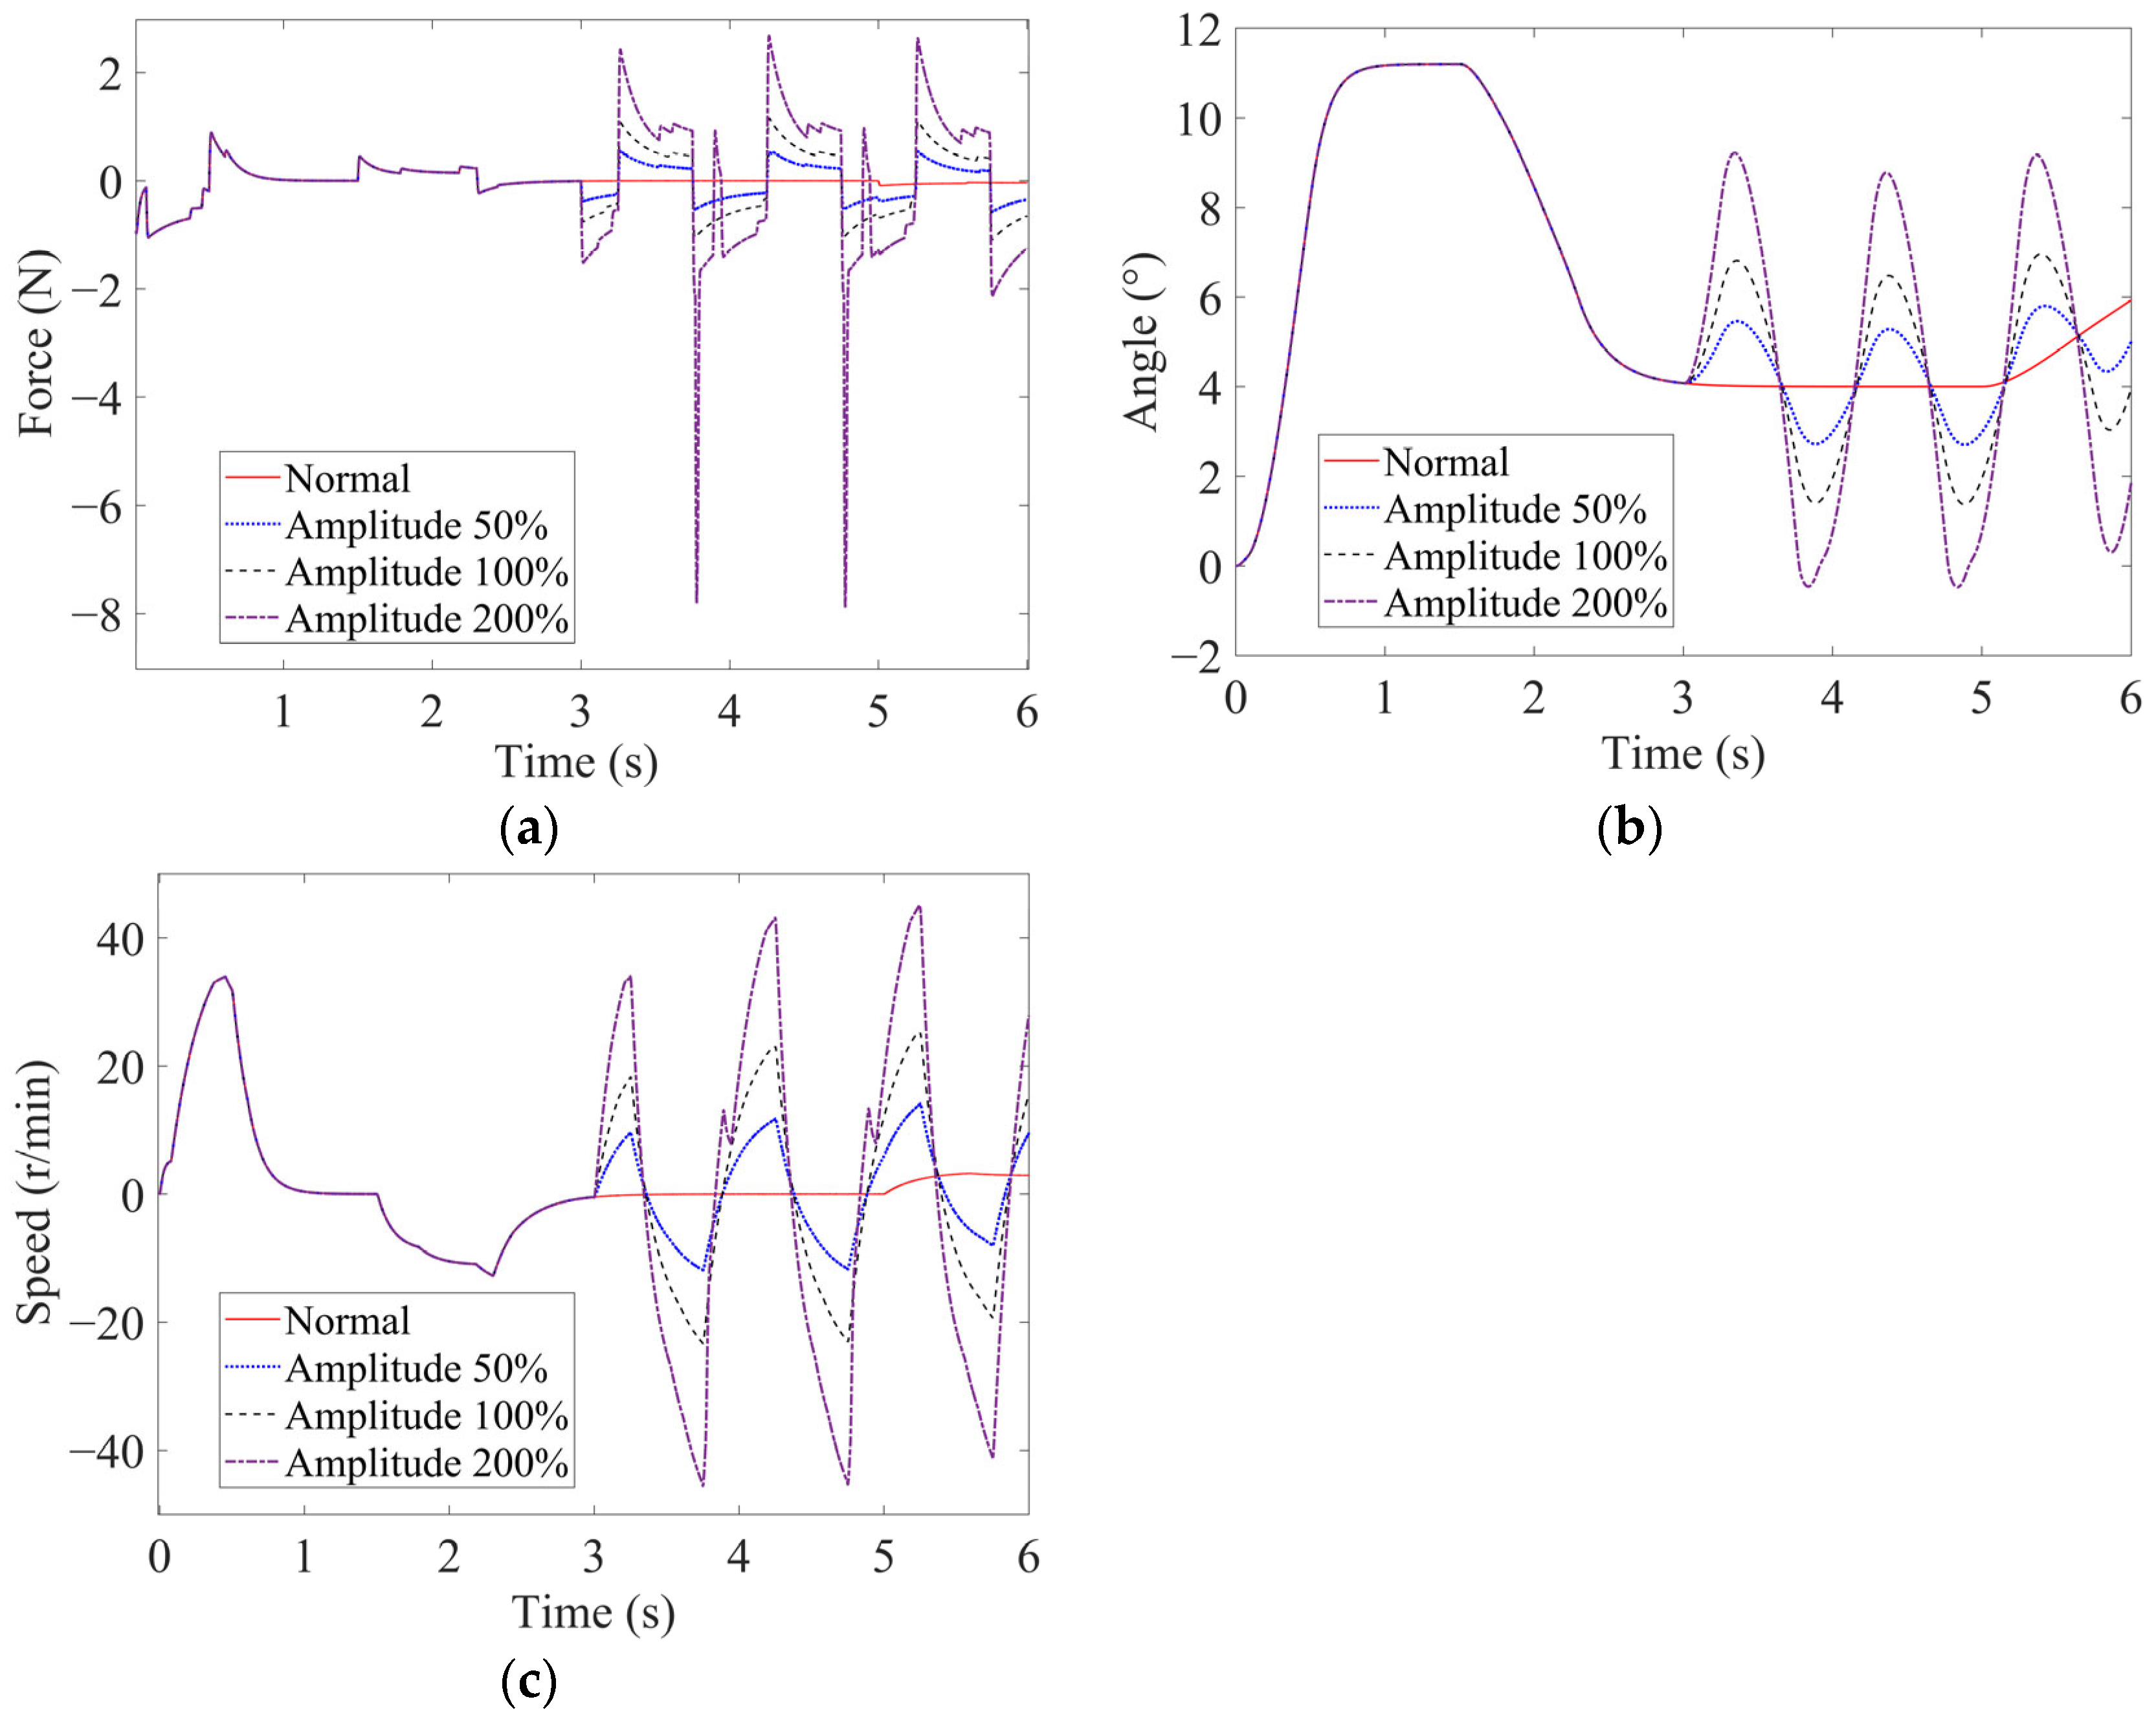
Within the force servo loop, the torque sensor provides the loading torque measurement used to calculate the force tracking error. A periodic error at the sensor output changes the motor control command during each fault cycle. The resulting motor torque fluctuations are transmitted to the sidestick through the reduction mechanism, thereby affecting the active sidestick deflection angle, surplus force, and loading motor speed. The simulation results for different oscillating fault signals (sine wave and triangular wave) are shown in Figure 9 and Figure 10, respectively.
Figure 9.
Simulation results of varying amplitude sinusoidal wave oscillation fault injection for the torque sensor: (a) surplus force; (b) sidestick deflection angle; (c) motor speed.
Figure 10.
Simulation results of varying amplitude triangular wave oscillation fault injection for the torque sensor: (a) surplus force; (b) sidestick deflection angle; (c) motor speed.
As can be seen from the simulation results, there was no change in the influence of different fault signal types on the deflection angle of the sidestick. Because the active sidestick presents a low-pass filtering characteristics, no matter what form of oscillation signal is applied, the output of the sidestick deflection angle shows a sinusoidal oscillation state. The degree of oscillation of the sidestick deflection angle is positively correlated with the amplitude of the oscillation signal, and the larger the amplitude of the oscillation signal, the greater the degree of oscillation of the sidestick deflection angle. Because the torque sensor is the feedback signal of the controller, the failure of its oscillation signal will cause the feedback value of the controller to periodically increase and decrease near the actual value. The loading force of the motor will vary after the instruction calculation, that is, the loading force will decrease when the feedback signal is large, and it will increase when the feedback signal is small. This trend can be seen from the surplus force curve (due to the existence of the starting position in the sidestick force displacement curve, the centering feeling force was induced when the sidestick was in the center; however, this had no effect on the analysis results). As a result, the sidestick oscillates in relation to the degree of failure under the combined force of the pilot and the motor. With the increase in the severity of the fault, that is, when the amplitude of the oscillation signal increases to 270% of the normal signal, the oscillation degree of the sidestick is too large and develops into a hardover state, and the pilot cannot control it.
4.2.2. Angle Sensor Failure
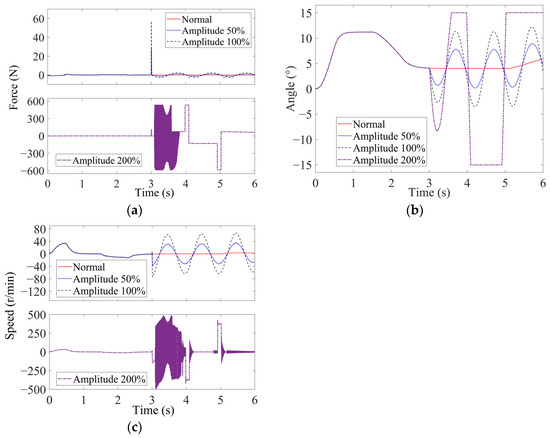
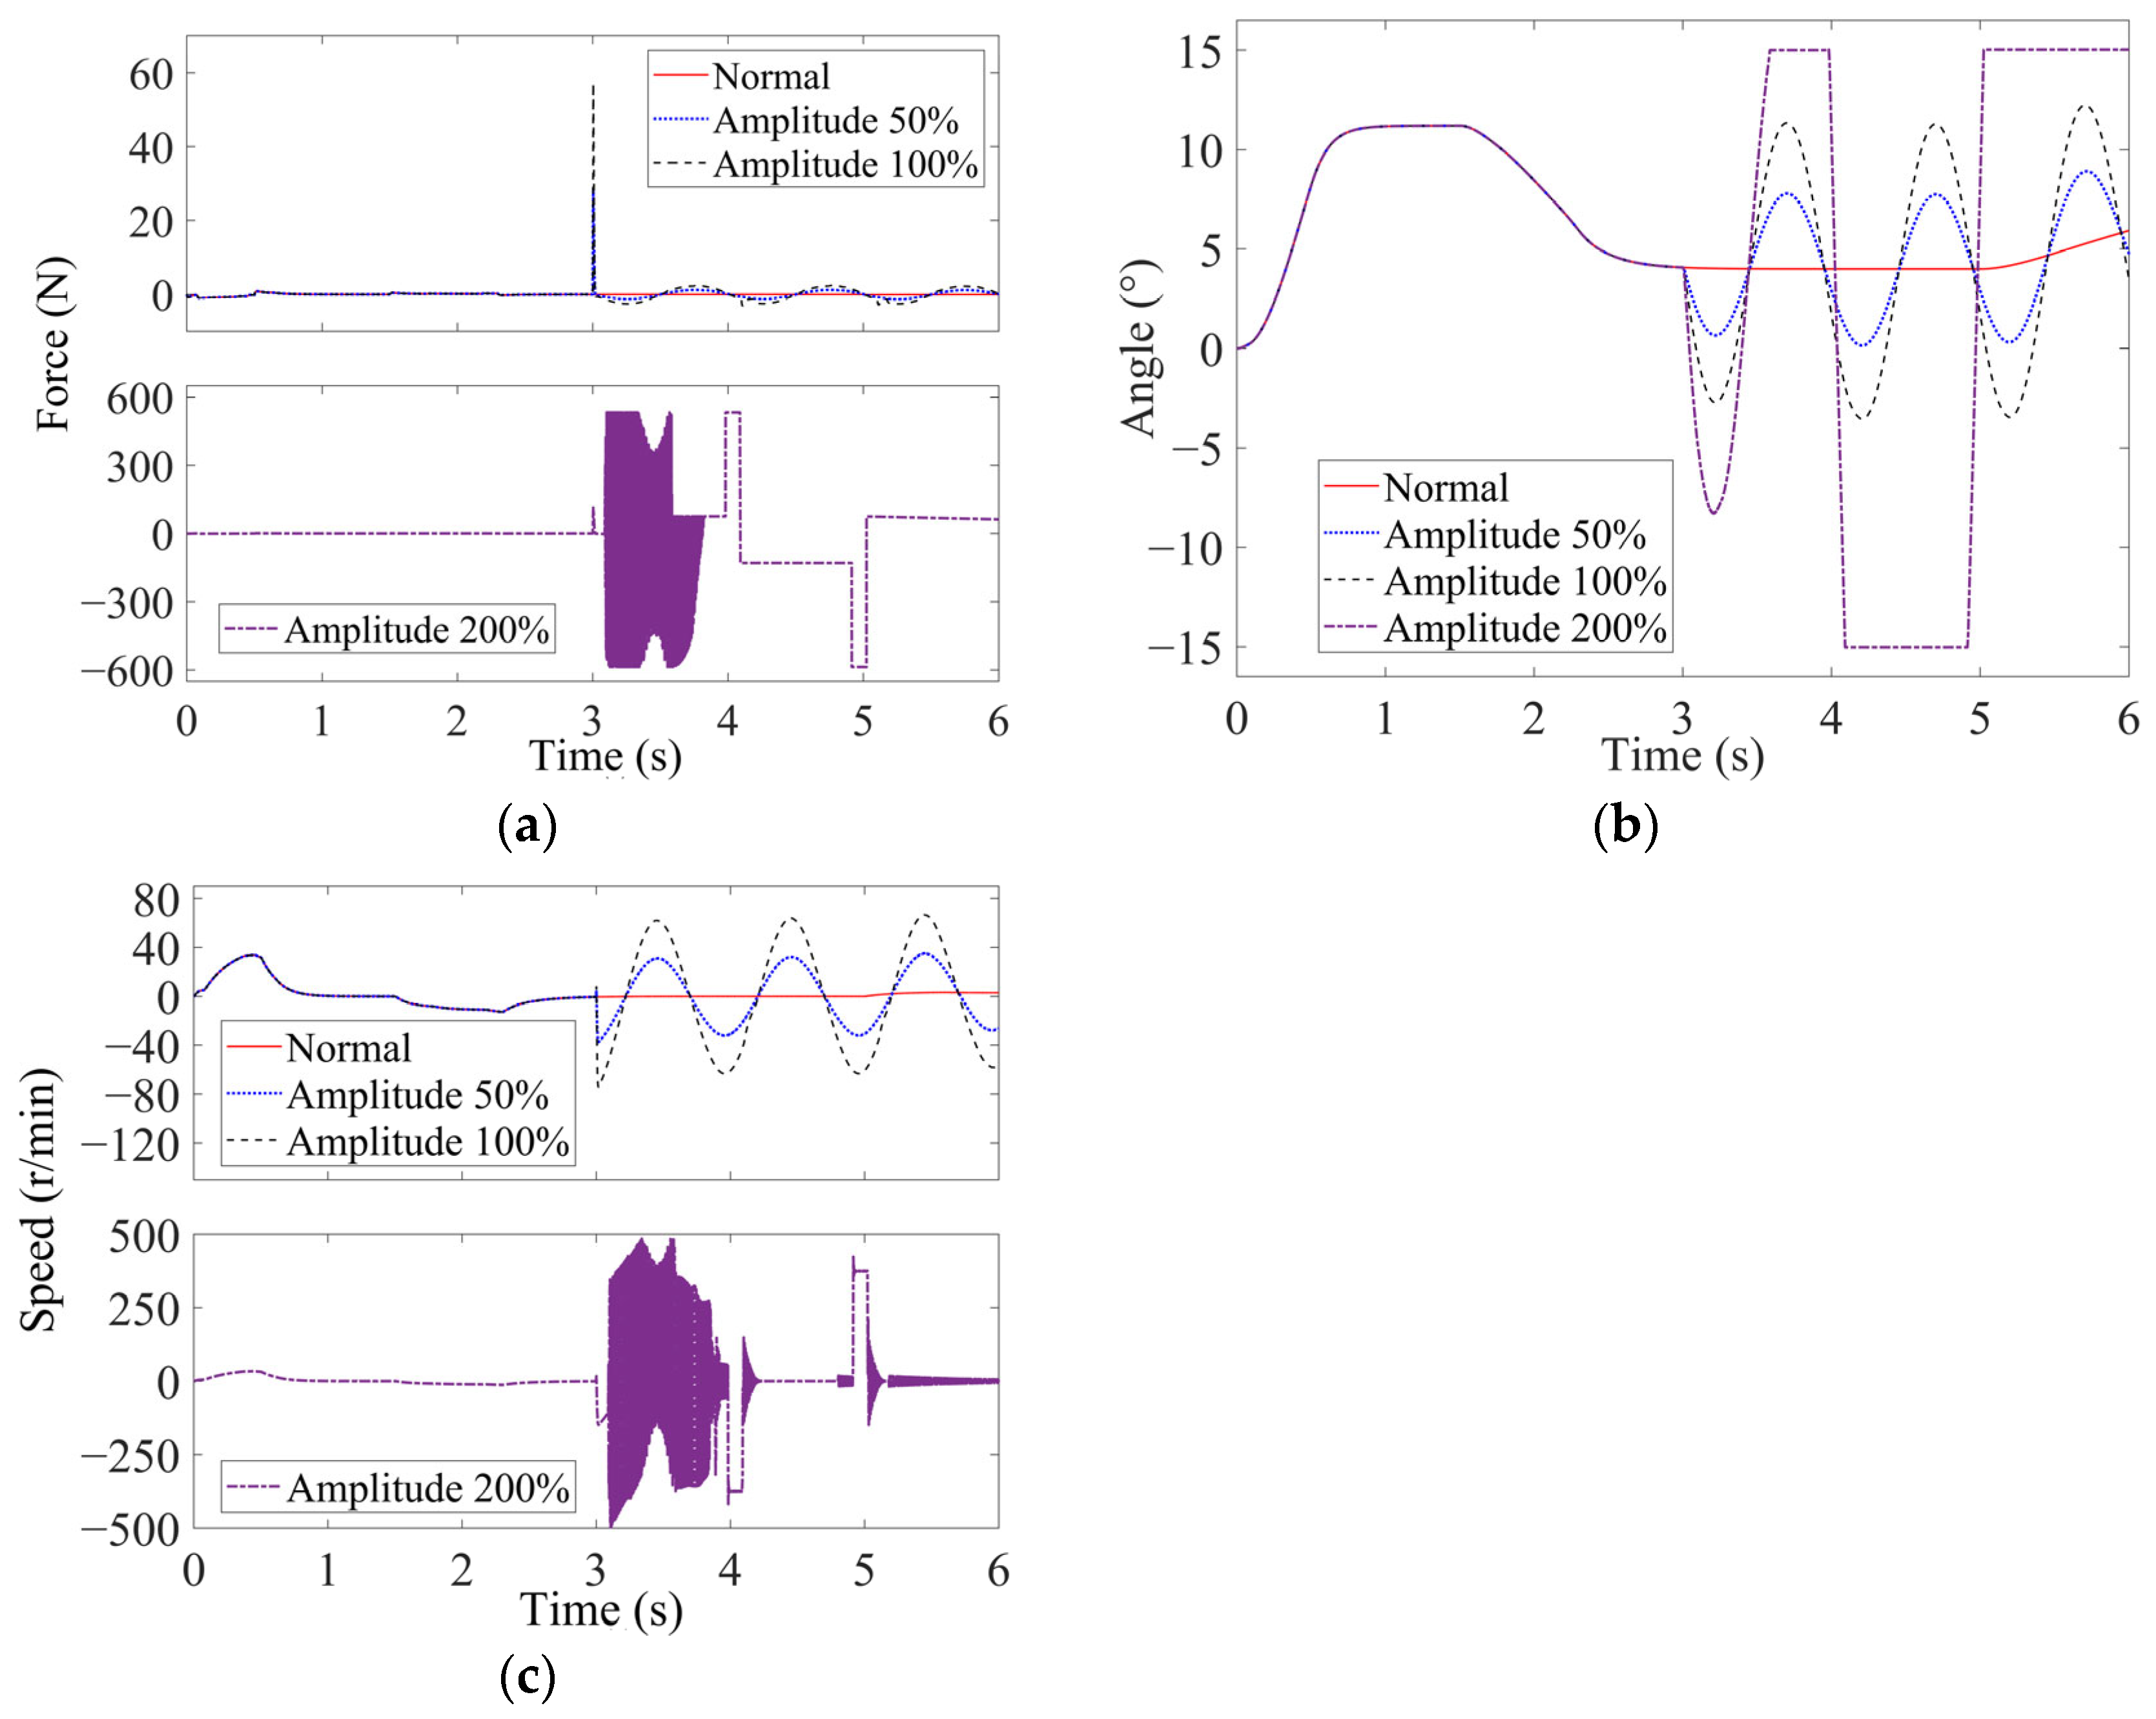
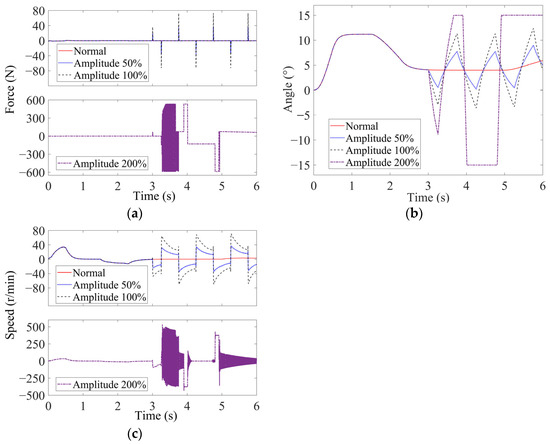
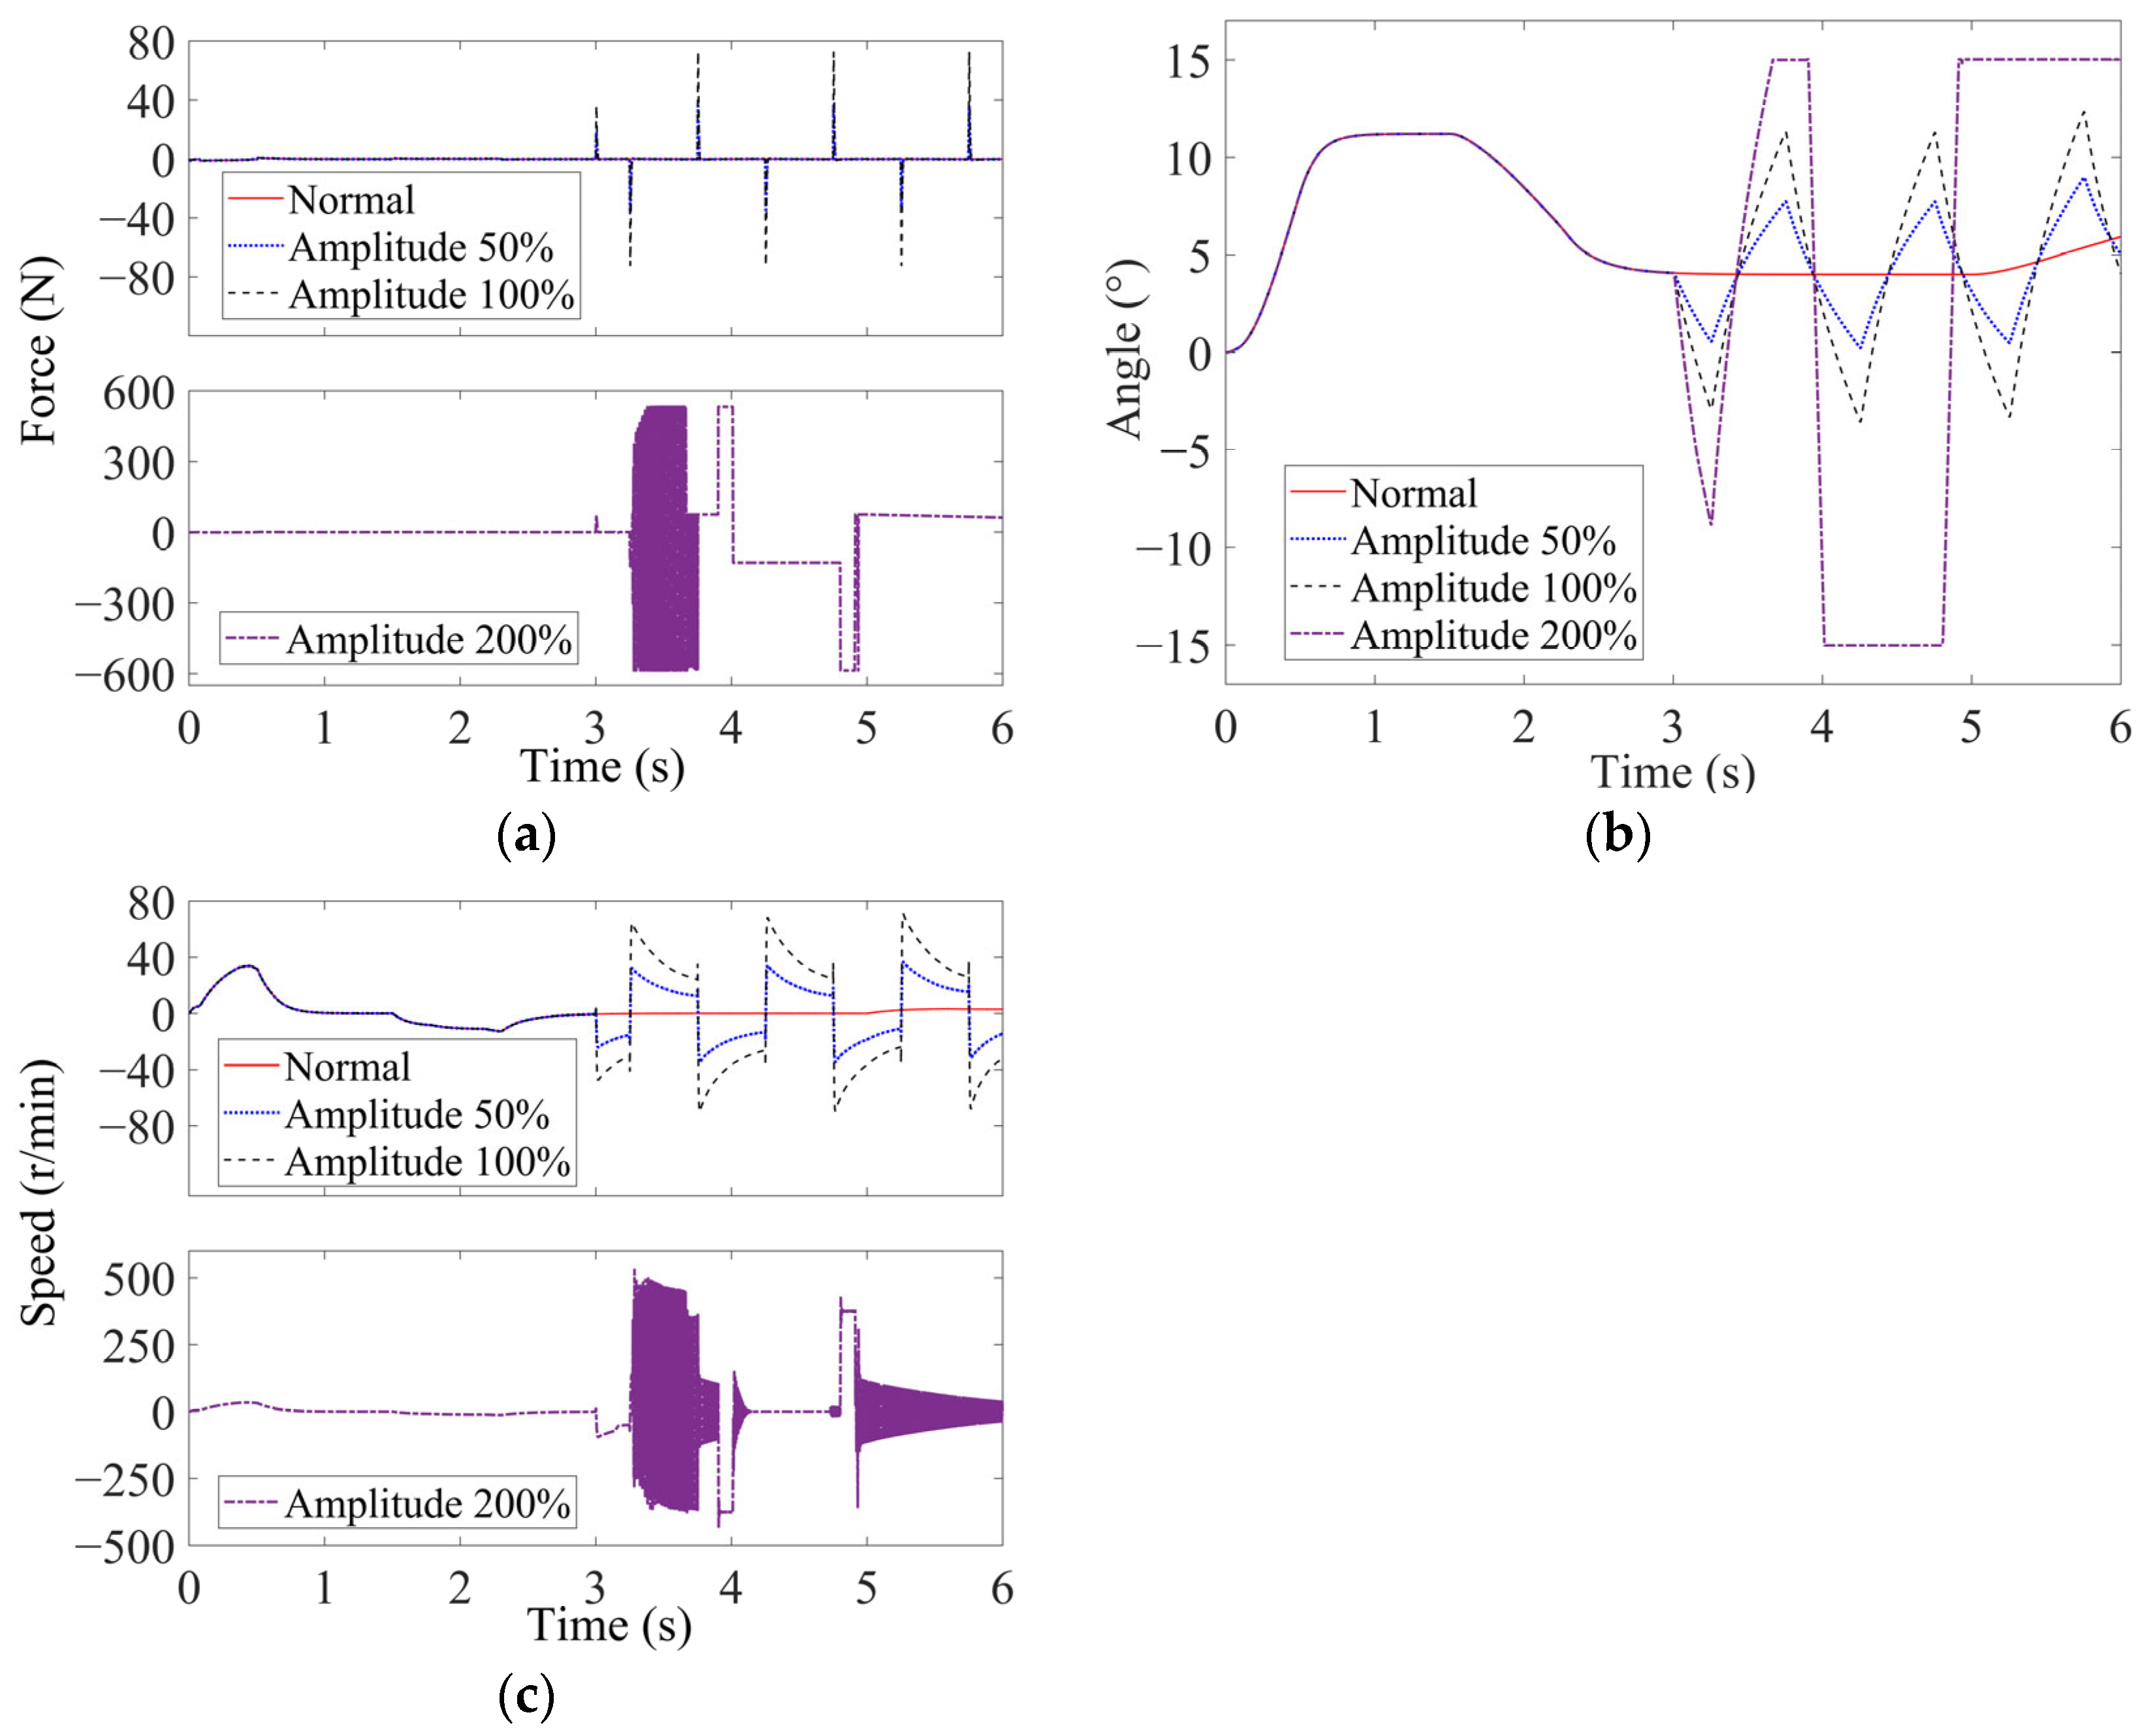
Under force servo operation, the angle sensor output is used to generate the feedback force command according to the prescribed force–displacement relationship. An error in the angle sensor signal therefore causes the controller to calculate an incorrect force command and transmit an erroneous control signal to the motor driver. The loading motor is consequently driven according to the incorrect reference, which may result in an abnormal motor operating state, interfere with the sidestick deflection output, and degrade the surplus-force suppression performance. In practical safety-critical flight control systems, angle sensing is generally implemented with redundancy and corresponding fault detection and isolation functions. Therefore, a large angle sensor discrepancy would normally be expected to be detected and isolated before it continuously propagated through the control loop. The present study does not consider sensor redundancy management, fault detection and isolation logic, or post-fault system reconfiguration. A simulation case with a fault amplitude of 200% was introduced as an extreme test condition to investigate the transition boundary of the active sidestick system from sustained oscillation to hardover. The simulation results for varying amplitude sinusoidal and triangular wave oscillation faults are shown in Figure 11 and Figure 12, respectively.
Figure 11.
Simulation results of varying amplitude sinusoidal wave oscillation fault injection for the angle sensor: (a) surplus force; (b) sidestick deflection angle; (c) motor speed.
Figure 12.
Simulation results of varying amplitude triangular wave oscillation fault injection for the angle sensor: (a) surplus force; (b) sidestick deflection angle; (c) motor speed.
According to the simulation results, the form of the oscillation signal determines the oscillation form of the sidestick deflection angle, and the waveforms of the two are consistent. The amplitude of the oscillation signal mainly affects the degree of oscillation of the deflection angle of the sidestick. The larger the amplitude of the oscillation signal, the greater the amplitude of the oscillation of the deflection angle of the sidestick. Because the angle sensor is the command channel signal of the controller, its oscillation failure signal will cause the feedback value of the controller to periodically fluctuate near the actual value, and the loading force of the motor will vary after the instruction calculation. That is, when the command signal increases, the loading force increases, and when the command signal decreases, it decreases. This trend can be seen from the surplus force curve (due to the existence of the starting position in the force–displacement curve, the centering feeling force was induced when the sidestick was in the center; however, this had no impact on the analysis results). The influence of the oscillation signal on the surplus force mainly depends on the signal type. The level of surplus force generated under the triangular wave oscillation signal is larger than that generated under the sine wave signal. The surplus force of the system under the sine wave oscillation signal is only greater than 50 N when the fault is injected, and remains less than 20 N the rest of the time. The surplus force of the system under the triangle wave oscillation signal can reach 100 N at the peak of the triangle wave. An increase in the amplitude of the oscillation signal will cause the sidestick deflection angle to hardover. When the amplitude is greater than 150% of the normal signal amplitude, the sidestick deflection angle will remain in the hardover state. Then the sidestick becomes uncontrollable due to the excessive loading force of the motor, causing the motor to enter a stalled state after reaching the maximum stroke position. In the hardover state, the motor has a large loading force and is easy to stall, which may result in motor burnout or damage the mechanical structure. Therefore, this failure should be given attention.
4.3. Analysis of Fixed Amplitude and Variable Frequency Faults
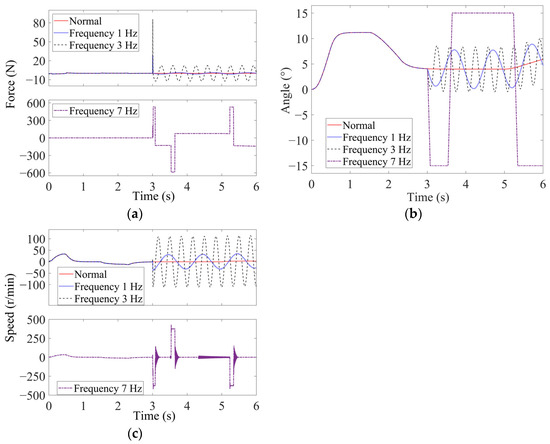
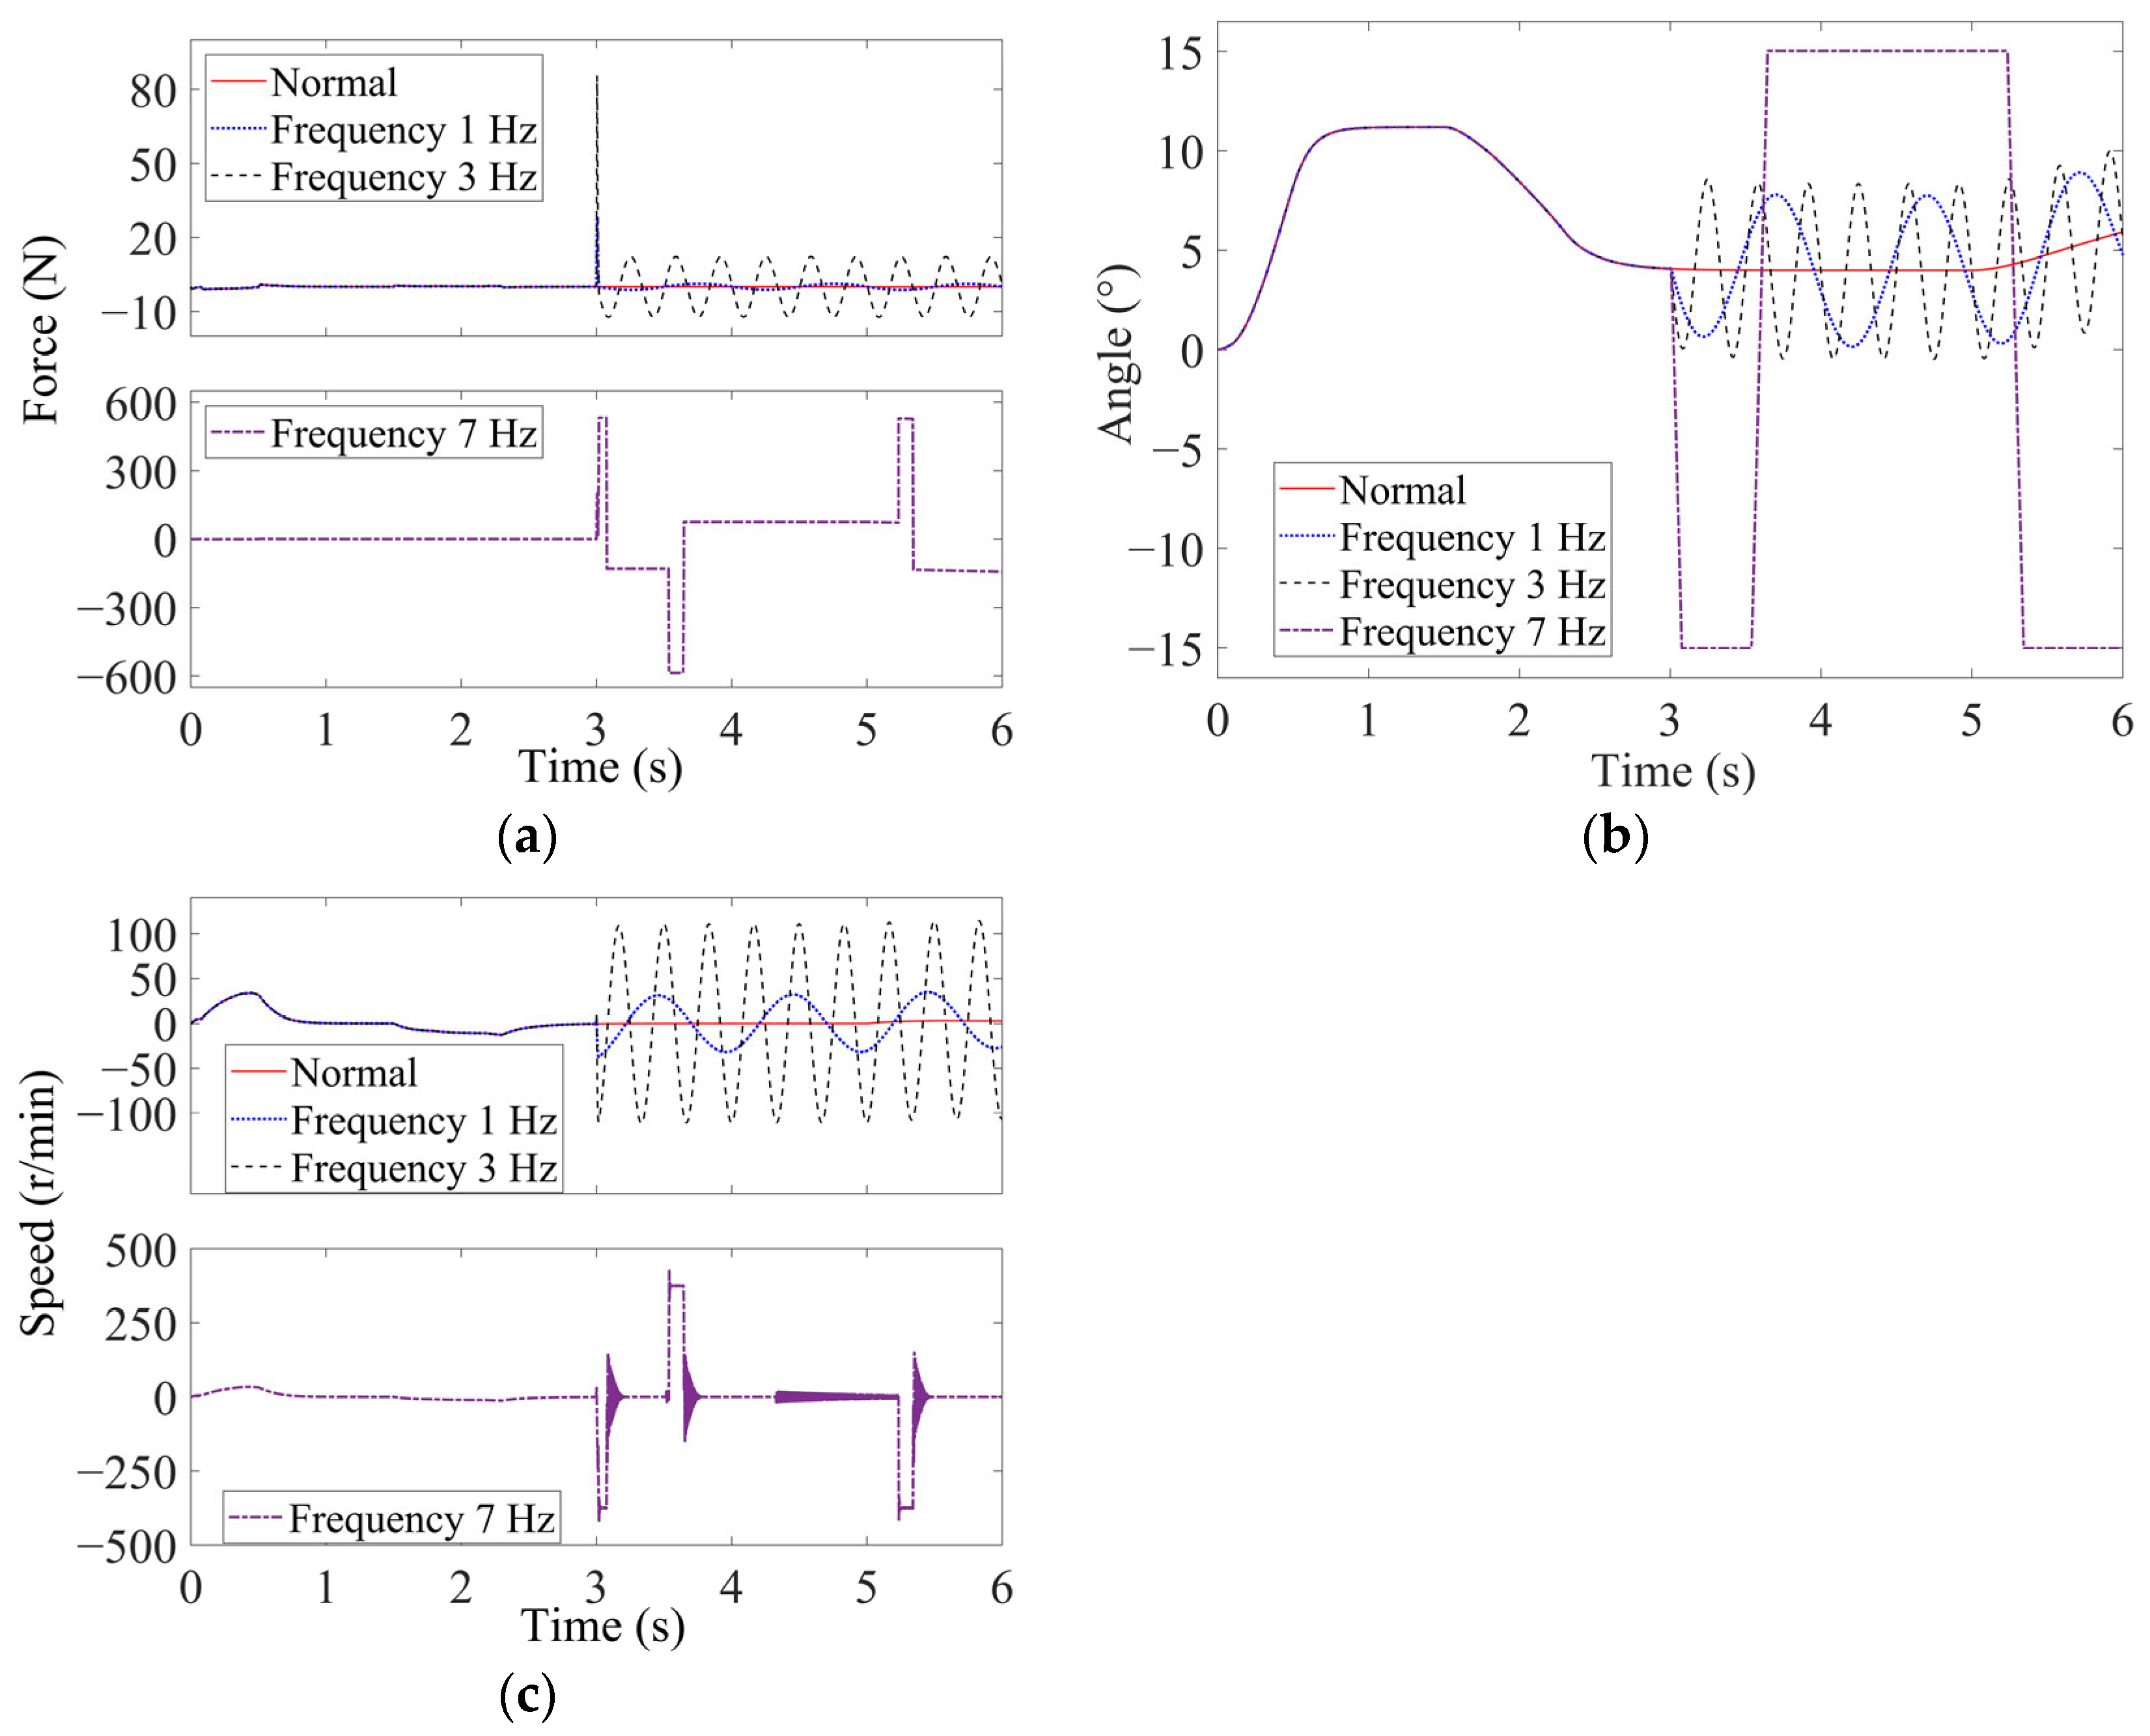
The fixed amplitude value was set to 50% of the normal signal, and the frequency were set to 1 Hz, 3 Hz, and 7 Hz. At 3 s, an oscillation signal was injected into the output of the sensor, and the influence of the frequency of the oscillation signal on the system was studied. The fixed-frequency variable-amplitude analysis in Section 4.2 has already demonstrated the similarities and differences between sinusoidal and triangular oscillation signals. Since the two waveforms produce the same qualitative failure responses, only sinusoidal oscillation signals are considered in this section to avoid repetitive presentation. The simulation results for oscillatory faults at the torque sensor and angle sensor outputs are analyzed separately below.
4.3.1. Torque Sensor Failure
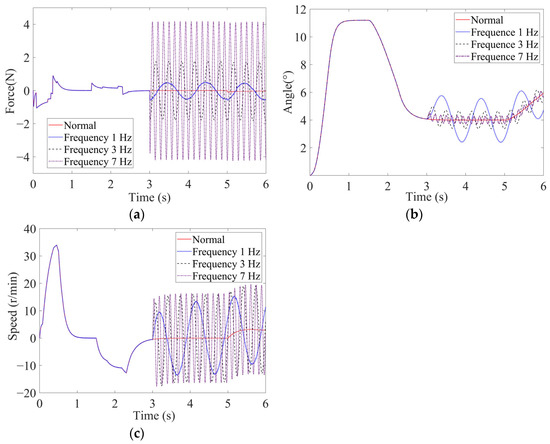
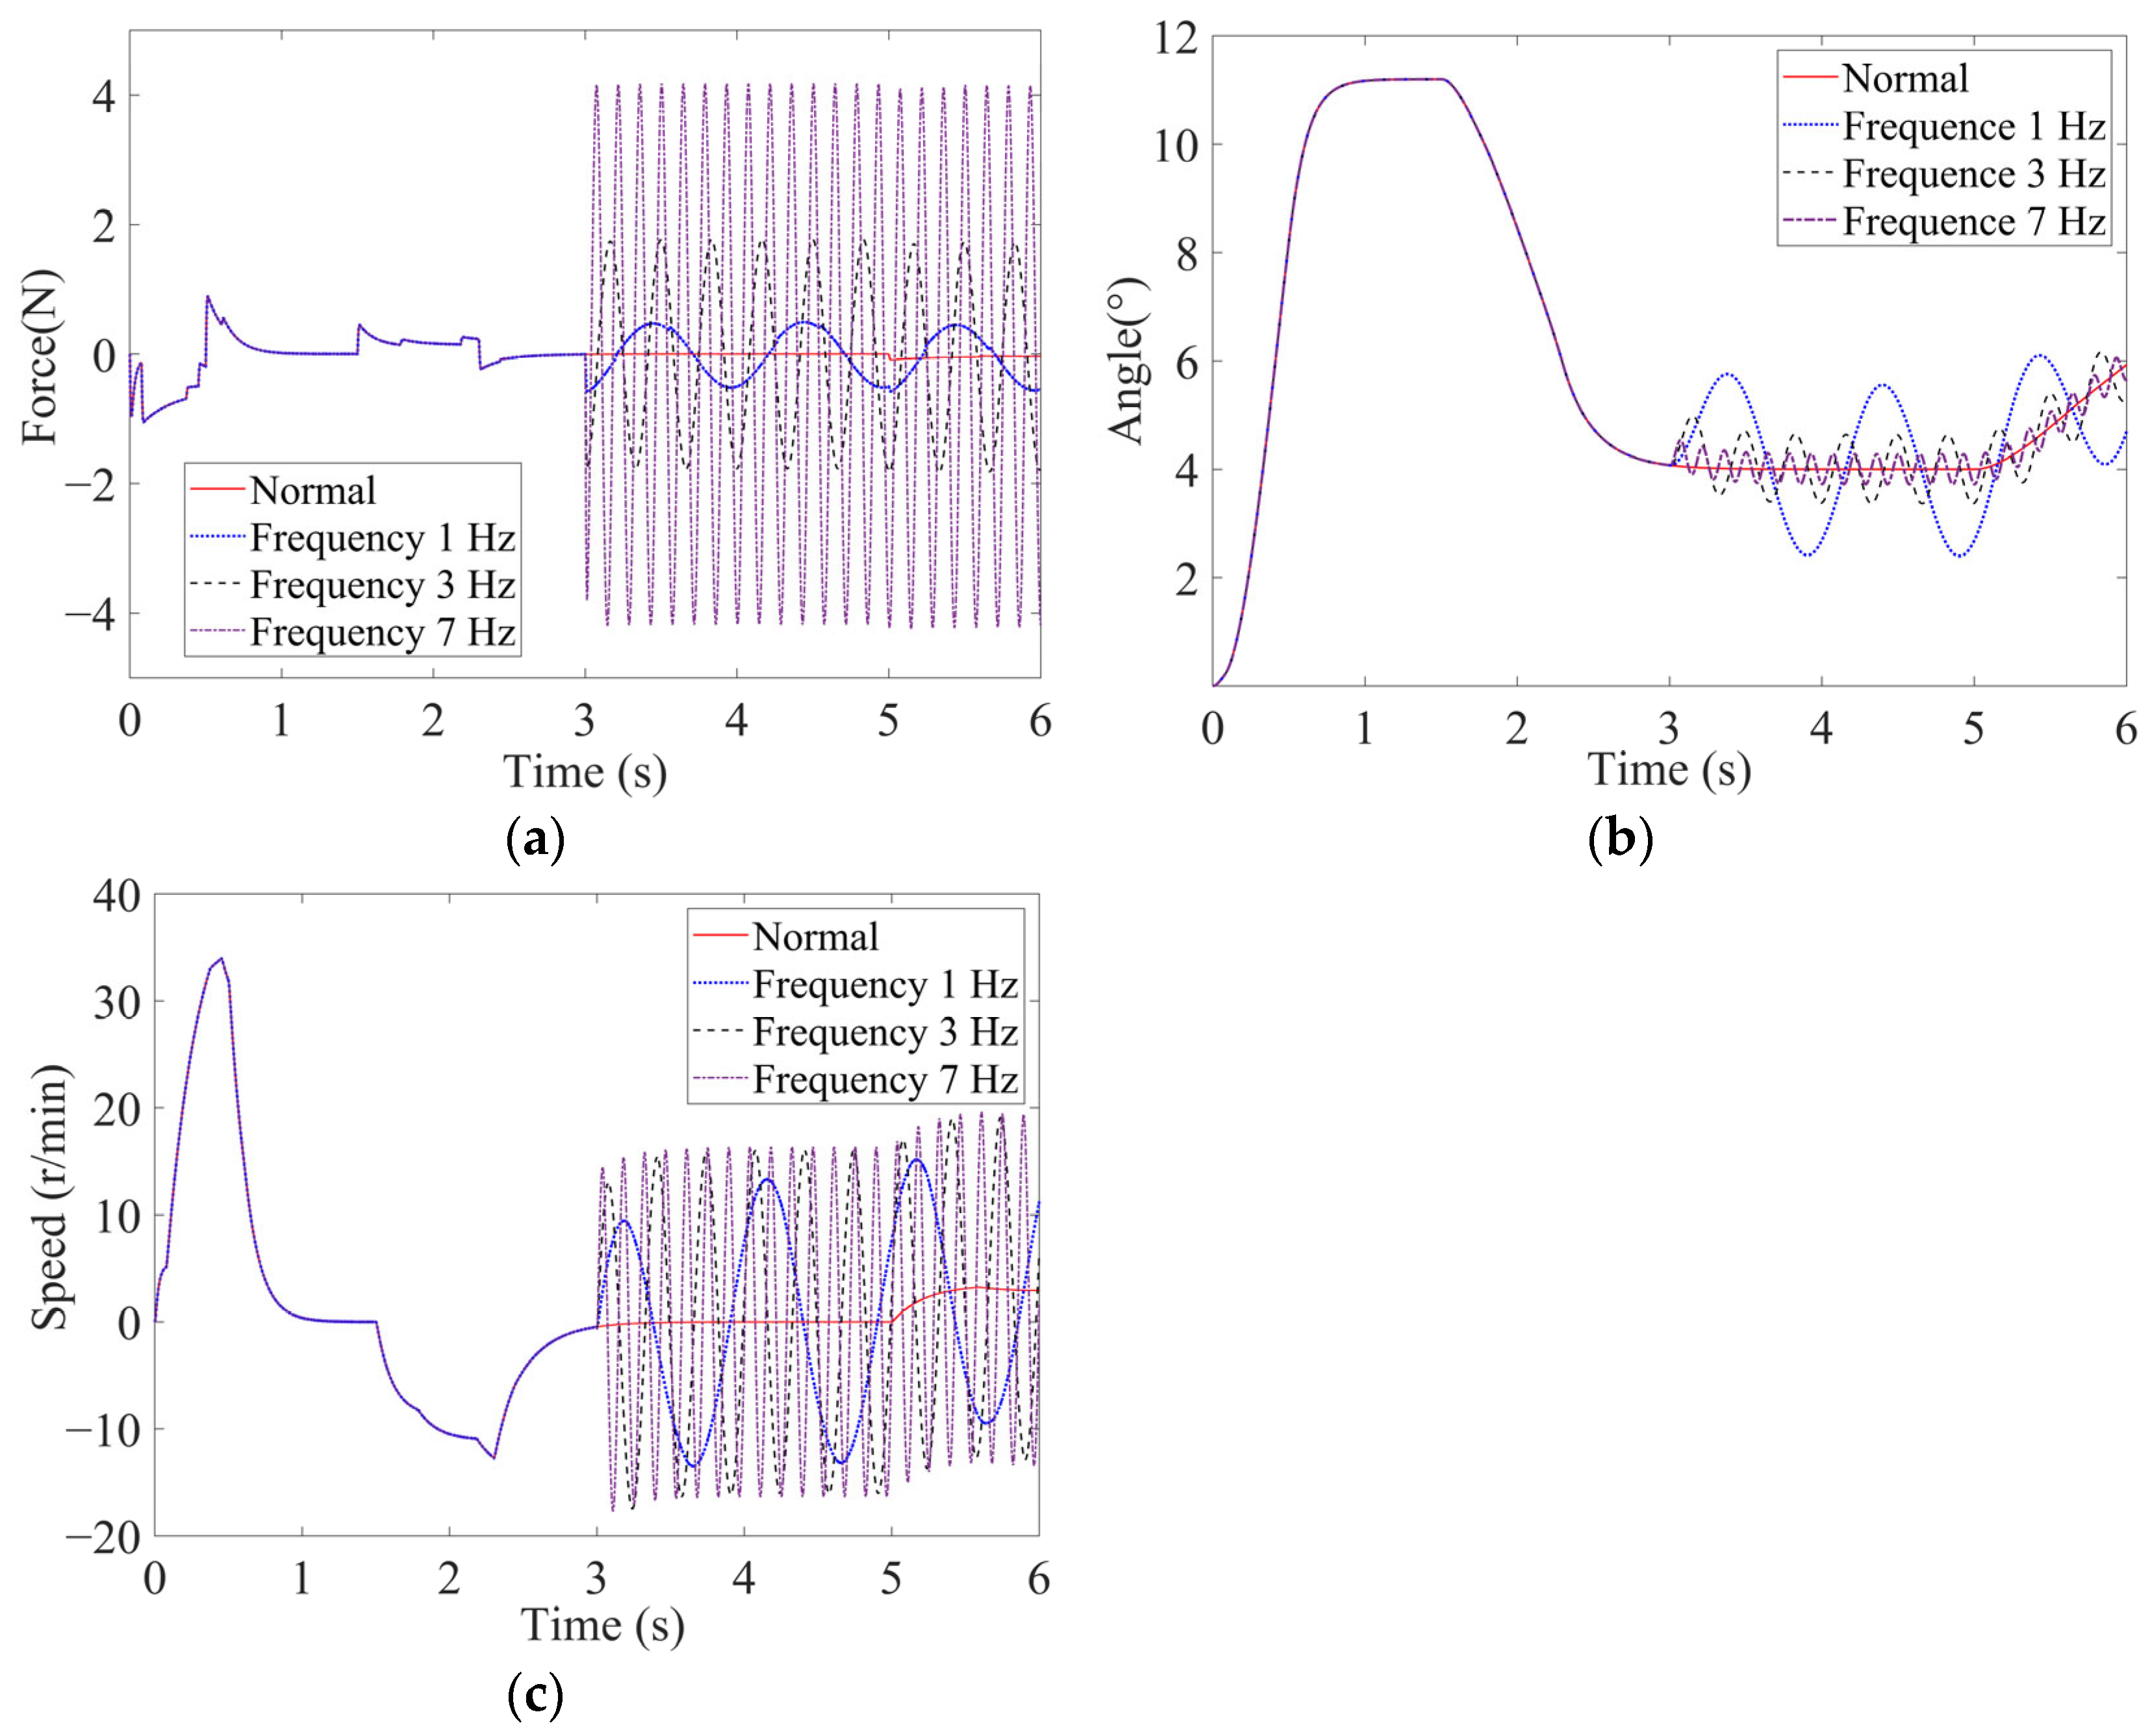
The system simulation results of the torque sensor under the action of oscillation fault signals are shown in Figure 13. The frequency of the oscillation signal mainly affects the oscillation amplitude and frequency of the sidestick deflection angle. The greater the oscillation signal frequency, the greater the oscillation frequency of the sidestick deflection angle, but the amplitude of the oscillation decreases with the increase in frequency. The influence of the oscillating signal on the surplus force mainly depends on the signal frequency; the larger the signal frequency, the higher the frequency and the greater the amplitude of the surplus force. The larger the amplitude of the oscillating signal, the greater the surplus force. However, the effect of the oscillation signal amplitude on the surplus force is smaller than that of the oscillation signal frequency.
Figure 13.
Simulation results of sinusoidal wave oscillation fault injection for the torque sensor: (a) surplus force; (b) sidestick deflection angle; (c) motor speed.
4.3.2. Angle Sensor Failure
The system simulation results of the angle sensor under the action of oscillation fault signals are shown in Figure 14. The oscillation signal frequency only affects the oscillation frequency of the sidestick deflection angle and does not affect its amplitude. The greater the oscillation signal frequency, the greater the oscillation frequency of the sidestick deflection angle, while the oscillation amplitude remains the same. This behavior differs from the influence of the oscillation signal from the torque sensor. Increases in the amplitude and frequency of the oscillation signal will cause the deflection angle of the sidestick to hardover. When the amplitude is greater than 150% of the normal signal amplitude, a frequency greater than 3.1 Hz will drive the sidestick deflection angle into the hardover state.
Figure 14.
Simulation results of sinusoidal wave oscillation fault injection for the angle sensor: (a) surplus force; (b) sidestick deflection angle; (c) motor speed.
4.4. Fixed-Amplitude Variable-Frequency Response Analysis of the Pilot in the Loop System Under Oscillation Faults
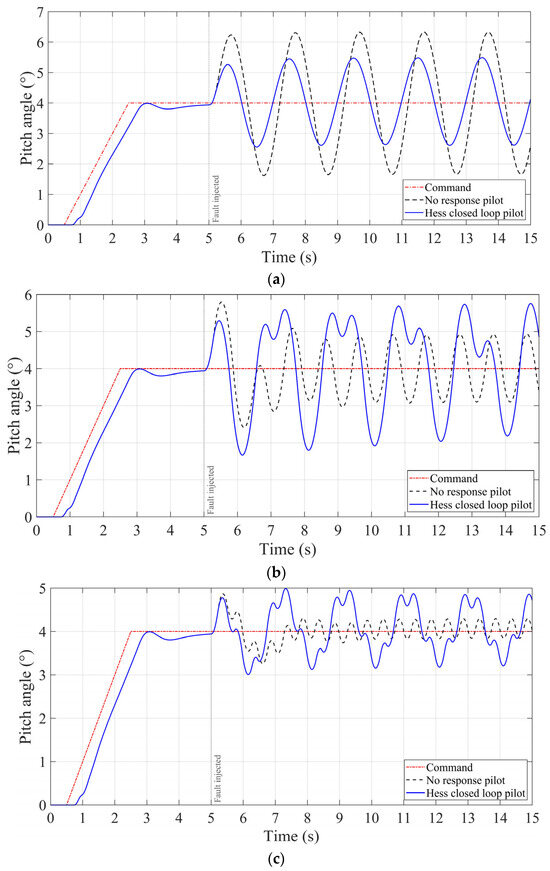
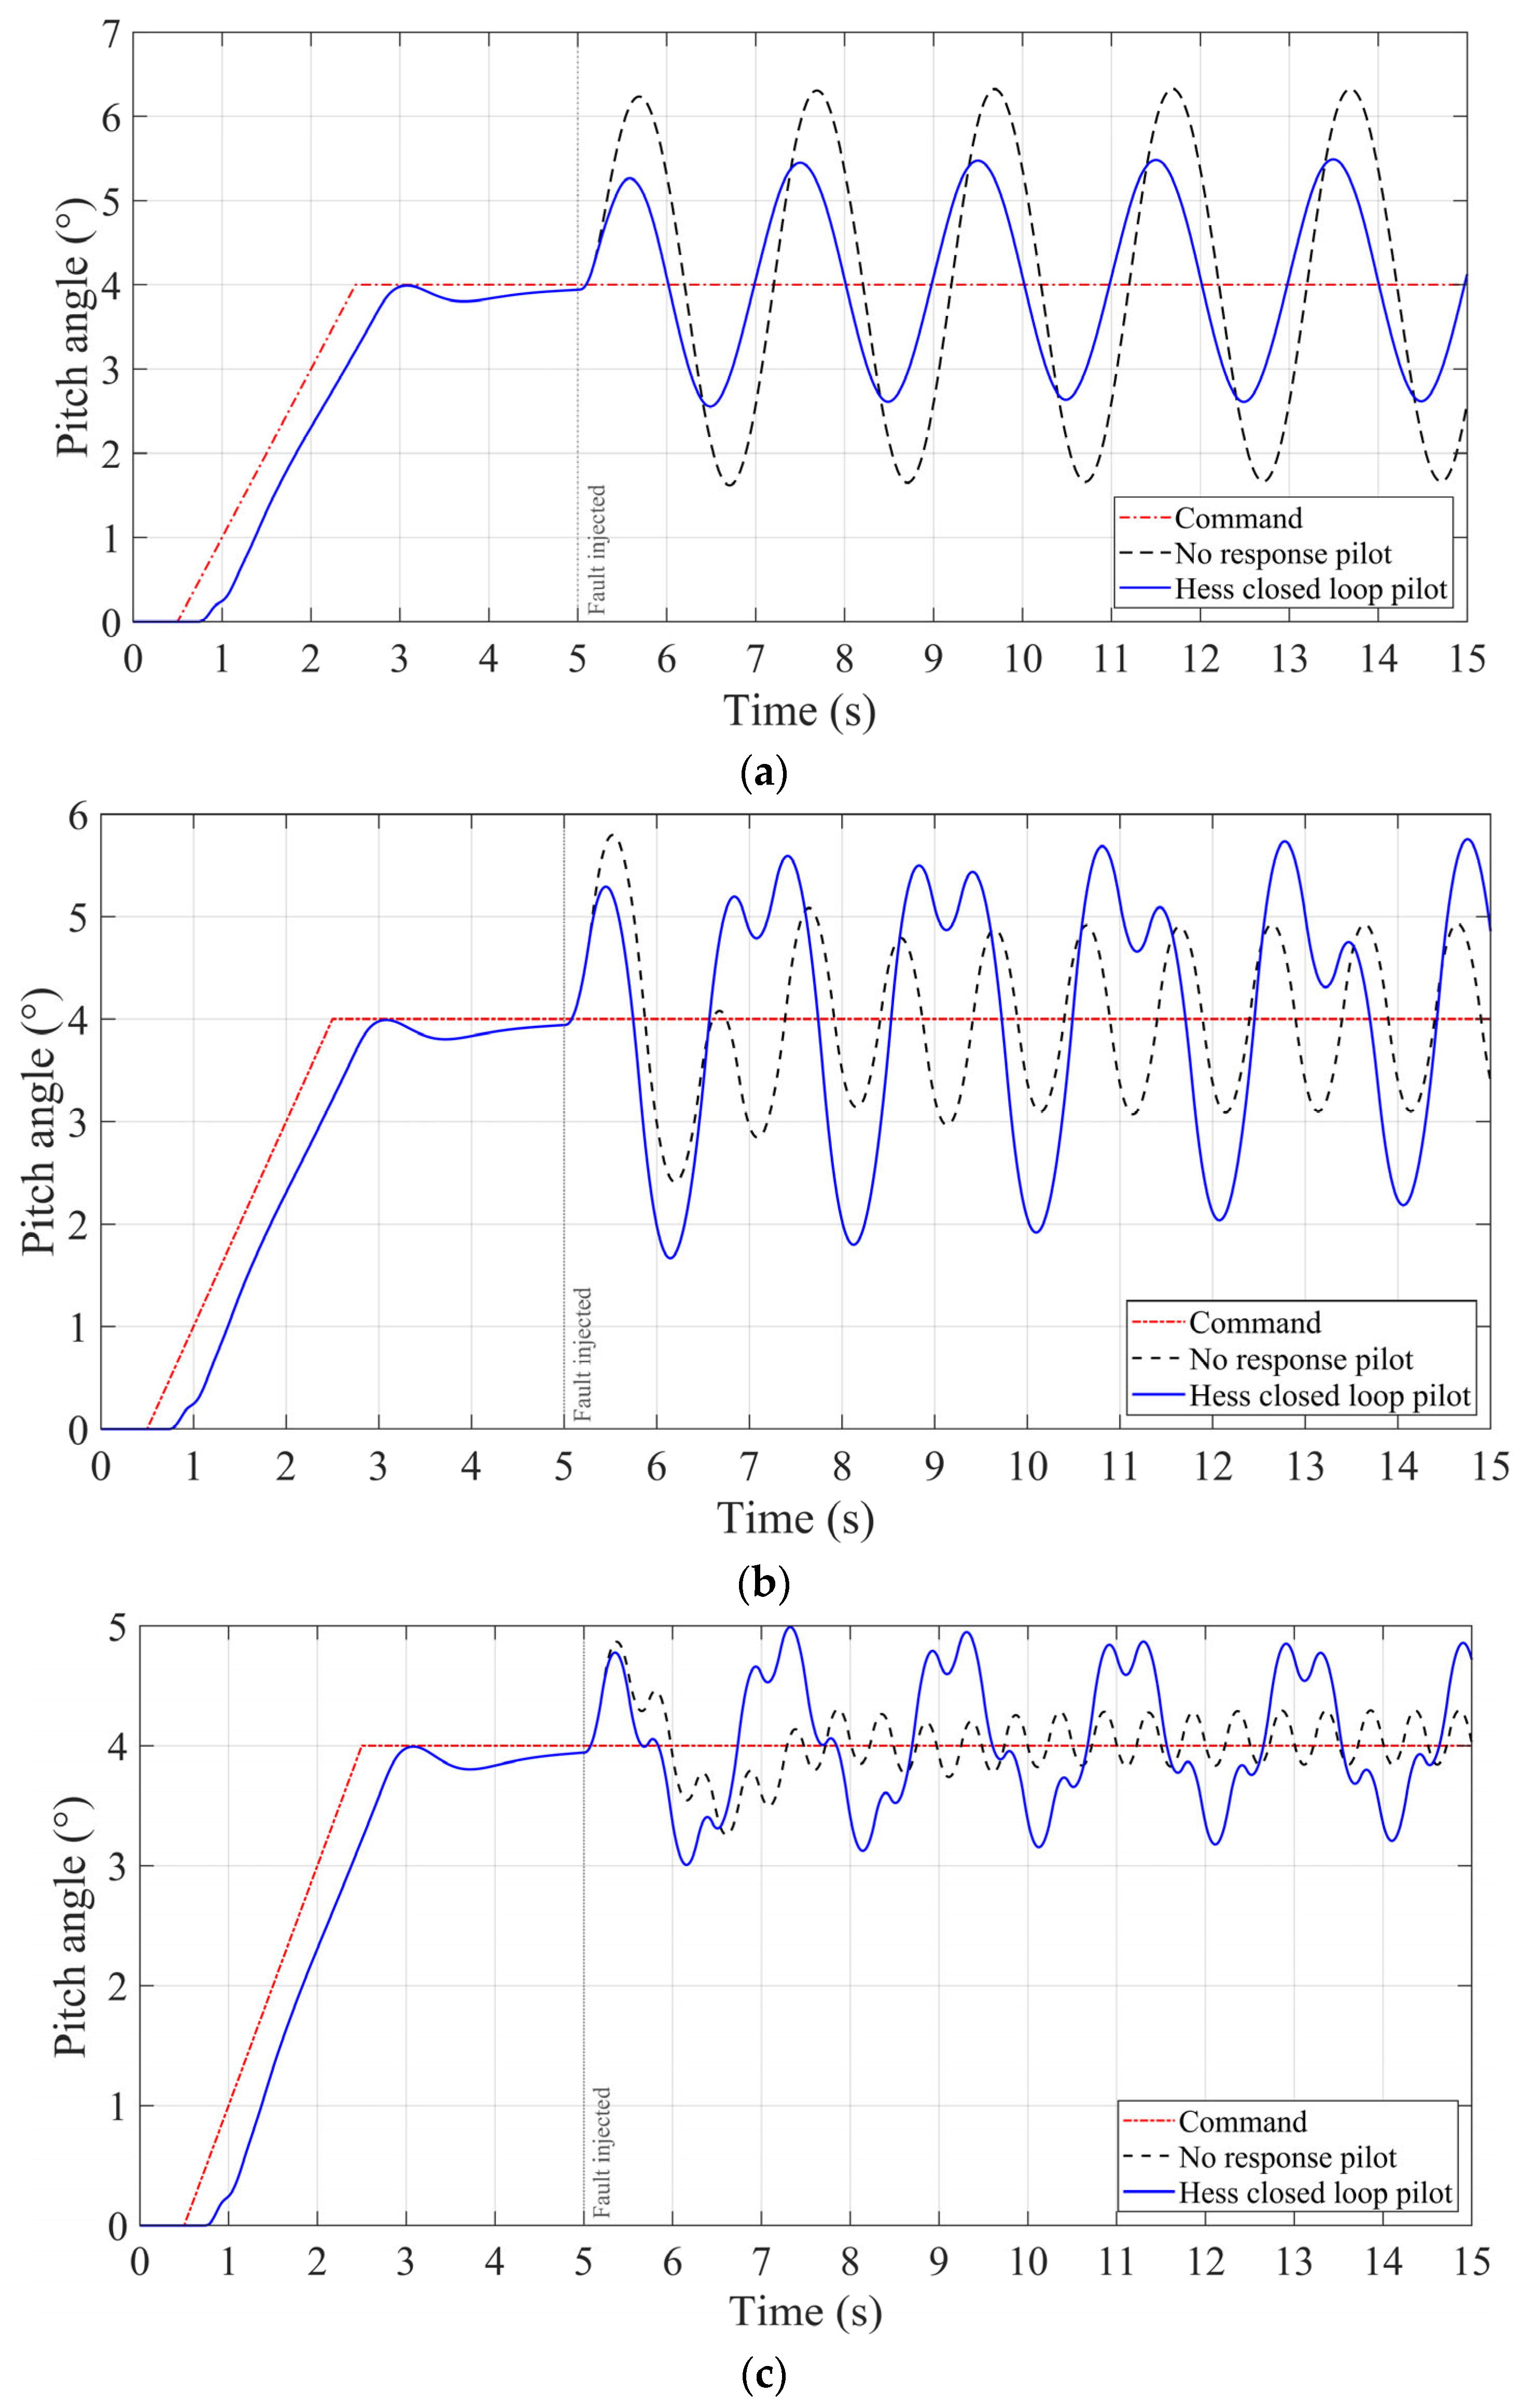
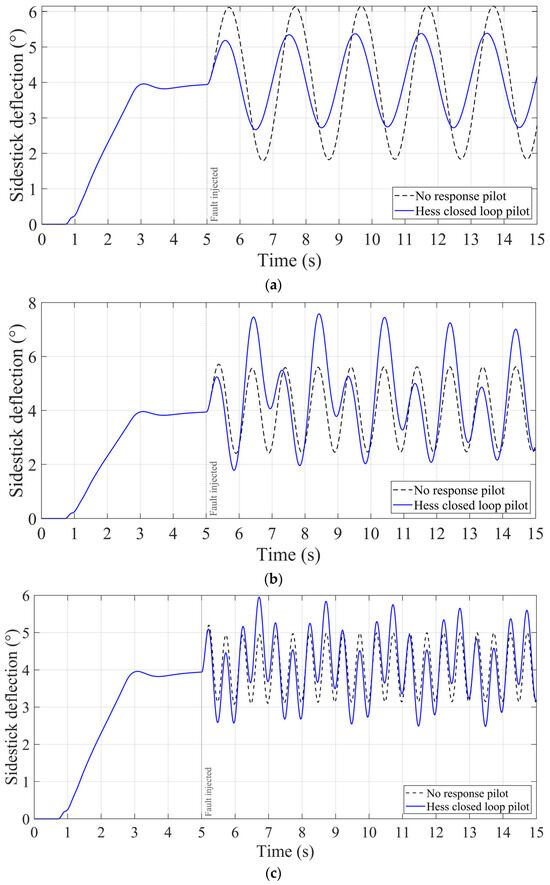
The pilot–active-sidestick–aircraft closed-loop model established in Section 2.2 was employed to investigate the coupled responses of the pilot, active sidestick, and aircraft under oscillation faults at different frequencies. A 4° aircraft pitch angle command was applied at 0.5 s. Considering the transient pitch response of the aircraft, a sinusoidal oscillation signal was injected into the torque sensor output at 5 s. The fault amplitude was set to 50% of the nominal signal amplitude, and the fault frequencies were set to 0.5 Hz, 1 Hz, and 2 Hz. Following fault injection, the aircraft pitch angle and active sidestick deflection angle responses under the pilot in the loop and nonreactive pilot conditions are shown in Figure 15 and Figure 16, respectively.
Figure 15.
Aircraft pitch angle responses under different oscillation fault frequencies: (a) 0.5 Hz; (b) 1 Hz; (c) 2 Hz.
Figure 16.
Active sidestick deflection angle responses under different oscillation fault frequencies: (a) 0.5 Hz; (b) 1 Hz; (c) 2 Hz.
Figure 15 and Figure 16 show that the effects of pilot response on the aircraft pitch angle and active sidestick deflection angle vary significantly with the oscillation fault frequency. At 0.5 Hz, both the aircraft pitch angle and the active sidestick deflection angle with pilot response are smaller than those under the nonreactive pilot condition. This indicates that the additional control force generated by the pilot counteracts the abnormal sidestick motion and suppresses the propagation of the oscillation fault through the closed-loop system. However, at 1 Hz and 2 Hz, both the aircraft pitch angle and the active sidestick deflection angle with pilot response are larger than those under the nonreactive pilot condition. Owing to the pilot reaction delay and dynamic characteristics, the phase relationship between the additional pilot control force and the motion required for effective fault suppression becomes unfavorable. Consequently, the pilot response changes from a counteracting action to an adverse feedback action and intensifies the coupled oscillation among the pilot, active sidestick, and aircraft.
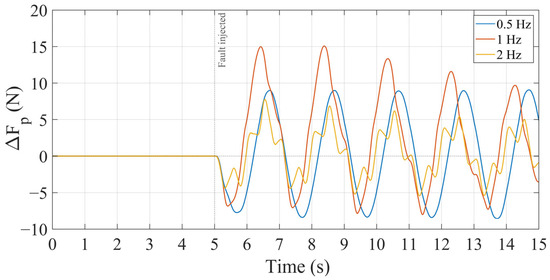
To further investigate the dynamic response of the pilot to oscillation faults, the pilot control force generated after fault injection was subtracted from that under the fault free condition to obtain the additional pilot control force. The additional pilot control forces at different oscillation fault frequencies are shown in Figure 17.
Figure 17.
Additional pilot control force under different oscillation fault frequencies.
The simulation results show that, before fault injection, the pilot responses under the two conditions are identical, and the additional pilot control force is therefore zero. After the oscillation fault was injected at 5 s, the pilot generated a periodic additional control force in response to the abnormal active sidestick motion and aircraft pitch response. The amplitude and transient characteristics of the additional pilot control force varied significantly with the fault frequency. Under the 0.5 Hz oscillation fault, the additional pilot control force rapidly approached a nearly constant amplitude periodic response, with its positive and negative peaks remaining at approximately 9 N and −8 N, respectively. This indicates that the pilot can continuously respond to the relatively low-frequency oscillatory motion and establish a stable periodic control action. Under the 1 Hz oscillation fault, the pilot generated the largest additional control force, with the initial positive peak reaching approximately 15 N, after which the response amplitude gradually decreased. This indicates that a strong coupled response occurs among the pilot, active sidestick, and aircraft near 1 Hz. The large control force during the initial stage contains an evident transient component, which gradually decays as the closed-loop system approaches a periodic state. Under the 2 Hz oscillation fault, the amplitude of the additional pilot control force was lower than those under the 0.5 Hz and 1 Hz conditions, and the waveform contains more evident high-frequency fluctuations. This is mainly associated with the limited pilot response bandwidth, neuromuscular dynamics, pilot reaction delay, and the attenuation characteristics of the active sidestick and aircraft dynamics. Consequently, the pilot cannot fully follow the relatively rapid oscillatory motion at 2 Hz.
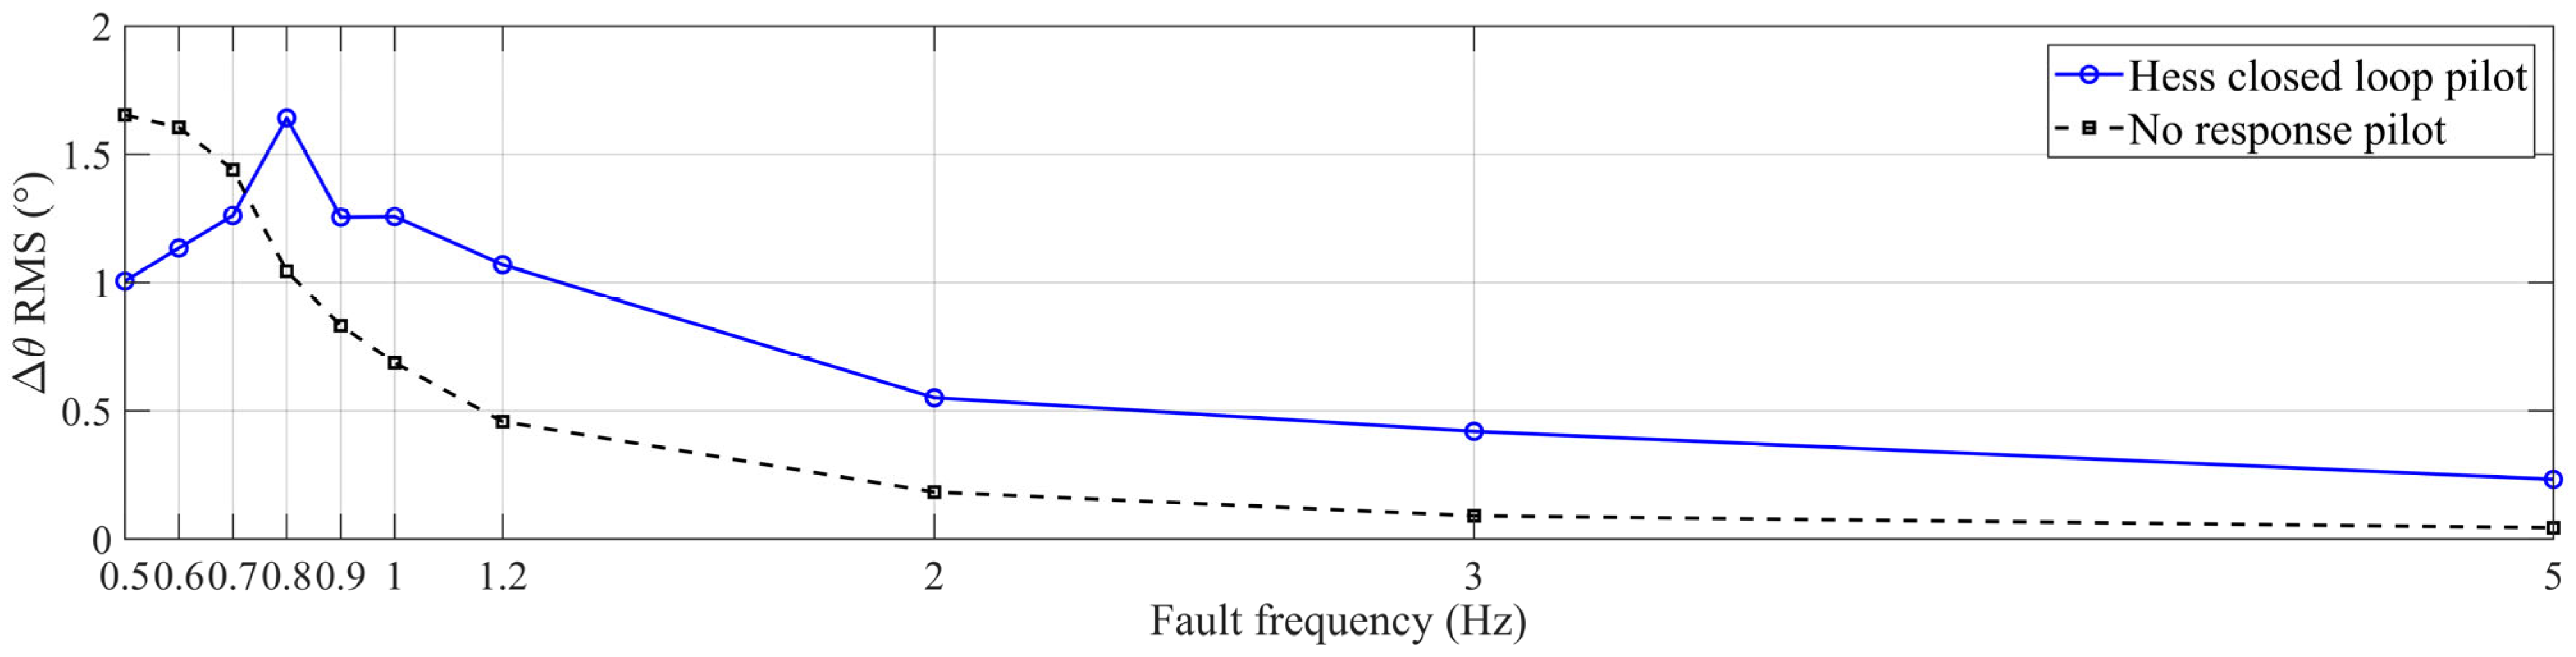
To further determine the frequency boundary between pilot suppression and pilot amplification, additional simulations were conducted over the fault frequency range from 0.5 Hz to 5 Hz. Figure 18 compares the RMS values of the aircraft pitch angle tracking error relative to the commanded pitch angle under the pilot response and nonreactive pilot conditions.
Figure 18.
Comparison of aircraft pitch angle tracking error RMS under different oscillation fault frequencies.
As shown in Figure 18, when the oscillation fault frequency was lower than 0.72 Hz, the RMS value of the aircraft pitch angle tracking error under the pilot response condition was lower than that under the nonreactive pilot condition. This indicates that the additional pilot control force counteracts the abnormal motion induced by the fault and improves the aircraft pitch angle tracking performance. Therefore, the pilot response suppresses the propagation of the oscillation fault through the closed-loop system. When the fault frequency is higher than 0.72 Hz, the RMS value of the aircraft pitch angle tracking error under the pilot response condition becomes larger than that under the nonreactive pilot condition. In this frequency range, the additional pilot control force no longer suppresses the oscillation fault but instead increases the deviation between the actual aircraft pitch angle and the commanded pitch angle. Within the frequency range from 0.72 Hz to 1.3 Hz, the aircraft pitch angle tracking error under the pilot response condition remains at a relatively high level and reaches its maximum near 0.8 Hz, indicating that the adverse coupling among the pilot, active sidestick, and aircraft is most significant within this frequency range. When the fault frequency is higher than 1.3 Hz, the aircraft pitch angle tracking error under the pilot response condition remains larger than that under the nonreactive pilot condition, indicating that the pilot response still aggravates the fault effect. However, owing to the low pass attenuation characteristics of the pilot, active sidestick, flight control system, and aircraft dynamics, the aircraft pitch angle tracking error gradually decreases as the fault frequency increases.
4.5. Result Analysis
Based on the equipment level simulations and the pilot in the loop analysis, the main effects of active sidestick system faults on the sidestick deflection angle, surplus force suppression performance, loading motor state, and aircraft response are summarized as follows.
- (1)
- The failure of the active sidestick system will lead to an abnormal sidestick deflection angle, which is generally presented as oscillation and hardover. They are classified according to their severity, as follows: oscillation < hardover. The oscillation state is mainly manifested as a small oscillation of the sidestick near the normal deflection angle. The hardover is manifested as the sidestick being driven by the motor to the maximum travel position, which may severely reduce the available pilot control authority.
- (2)
- The failure of the active sidestick system will lead to the abnormality or loss of the surplus force suppression function of the system, which is manifested in the increase of surplus force beyond the value required by the technical standard. The surplus force of the system is generally related to the deflection angle of the sidestick. When the sidestick is in the oscillation state, the surplus force suppression function of the system becomes abnormal, causing the surplus force of the system to exhibit large oscillations. When the sidestick is in a state of hardover, the surplus force suppression function is lost.
- (3)
- A fault in the active sidestick system can lead to abnormal operating conditions for the loading motor, with the motor’s state linked to the angle of the sidestick. When the sidestick is in an oscillating state, the speed of the loading motor also oscillates, which can easily damage the motor. When the sidestick is in a state of hardover, the loading motor generally enters a stalled state and can easily be burned out.
- (4)
- After the pilot and aircraft dynamics are incorporated into the closed-loop system, the effect of the oscillation fault exhibits an evident frequency-dependent characteristic. When the fault frequency is lower than 0.72 Hz, the additional pilot control force counteracts the abnormal motion caused by the fault, reduces the aircraft pitch angle tracking error, and suppresses the propagation of the oscillation fault through the closed-loop system. When the fault frequency is higher than 0.72 Hz, the additional pilot control force increases the aircraft pitch angle tracking error, and the pilot response changes from a counteracting action to an amplifying action. Within the frequency range from 0.72 Hz to 1.3 Hz, the adverse coupling among the pilot, active sidestick, and aircraft is most significant, and the aircraft pitch angle tracking error reaches its maximum near 0.8 Hz. When the fault frequency is higher than 1.3 Hz, the pilot response still increases the tracking error relative to the nonreactive pilot condition. However, owing to the low-pass attenuation characteristics of the pilot, active sidestick, flight control system, and aircraft dynamics, the absolute tracking error gradually decreases as the fault frequency increases.
The equipment level failure effects at different fault locations are summarized in Table 2.
Table 2.
Summary of failure impacts of different fault positions. “√” indicates the presence of a fault impact, whereas “-“ indicates no fault impact.
Sensor oscillation faults directly distort the feedback signals of the active sidestick system and may simultaneously cause abnormal sidestick motion, degradation of the surplus force suppression performance, and oscillatory operation of the loading motor. In comparison, motor driver faults mainly affect the operating state of the loading motor, whereas oscillation faults at the control unit output have relatively limited effects on the active sidestick deflection angle, surplus force, and motor speed under the simulation conditions considered in this study. The pilot in the loop analysis further demonstrated that the severity of a sensor oscillation fault cannot be evaluated solely on the basis of the equipment level response of the active sidestick system. After the fault propagates through the flight control loop, the pilot response may suppress or amplify the aircraft pitch response depending on the fault frequency. In particular, oscillation faults within the frequency range from 0.72 Hz to 1.3 Hz produce the most significant adverse coupling effects among the pilot, active sidestick, and aircraft, resulting in relatively large aircraft pitch angle tracking errors.
5. Experimental Analysis of Oscillation Fault
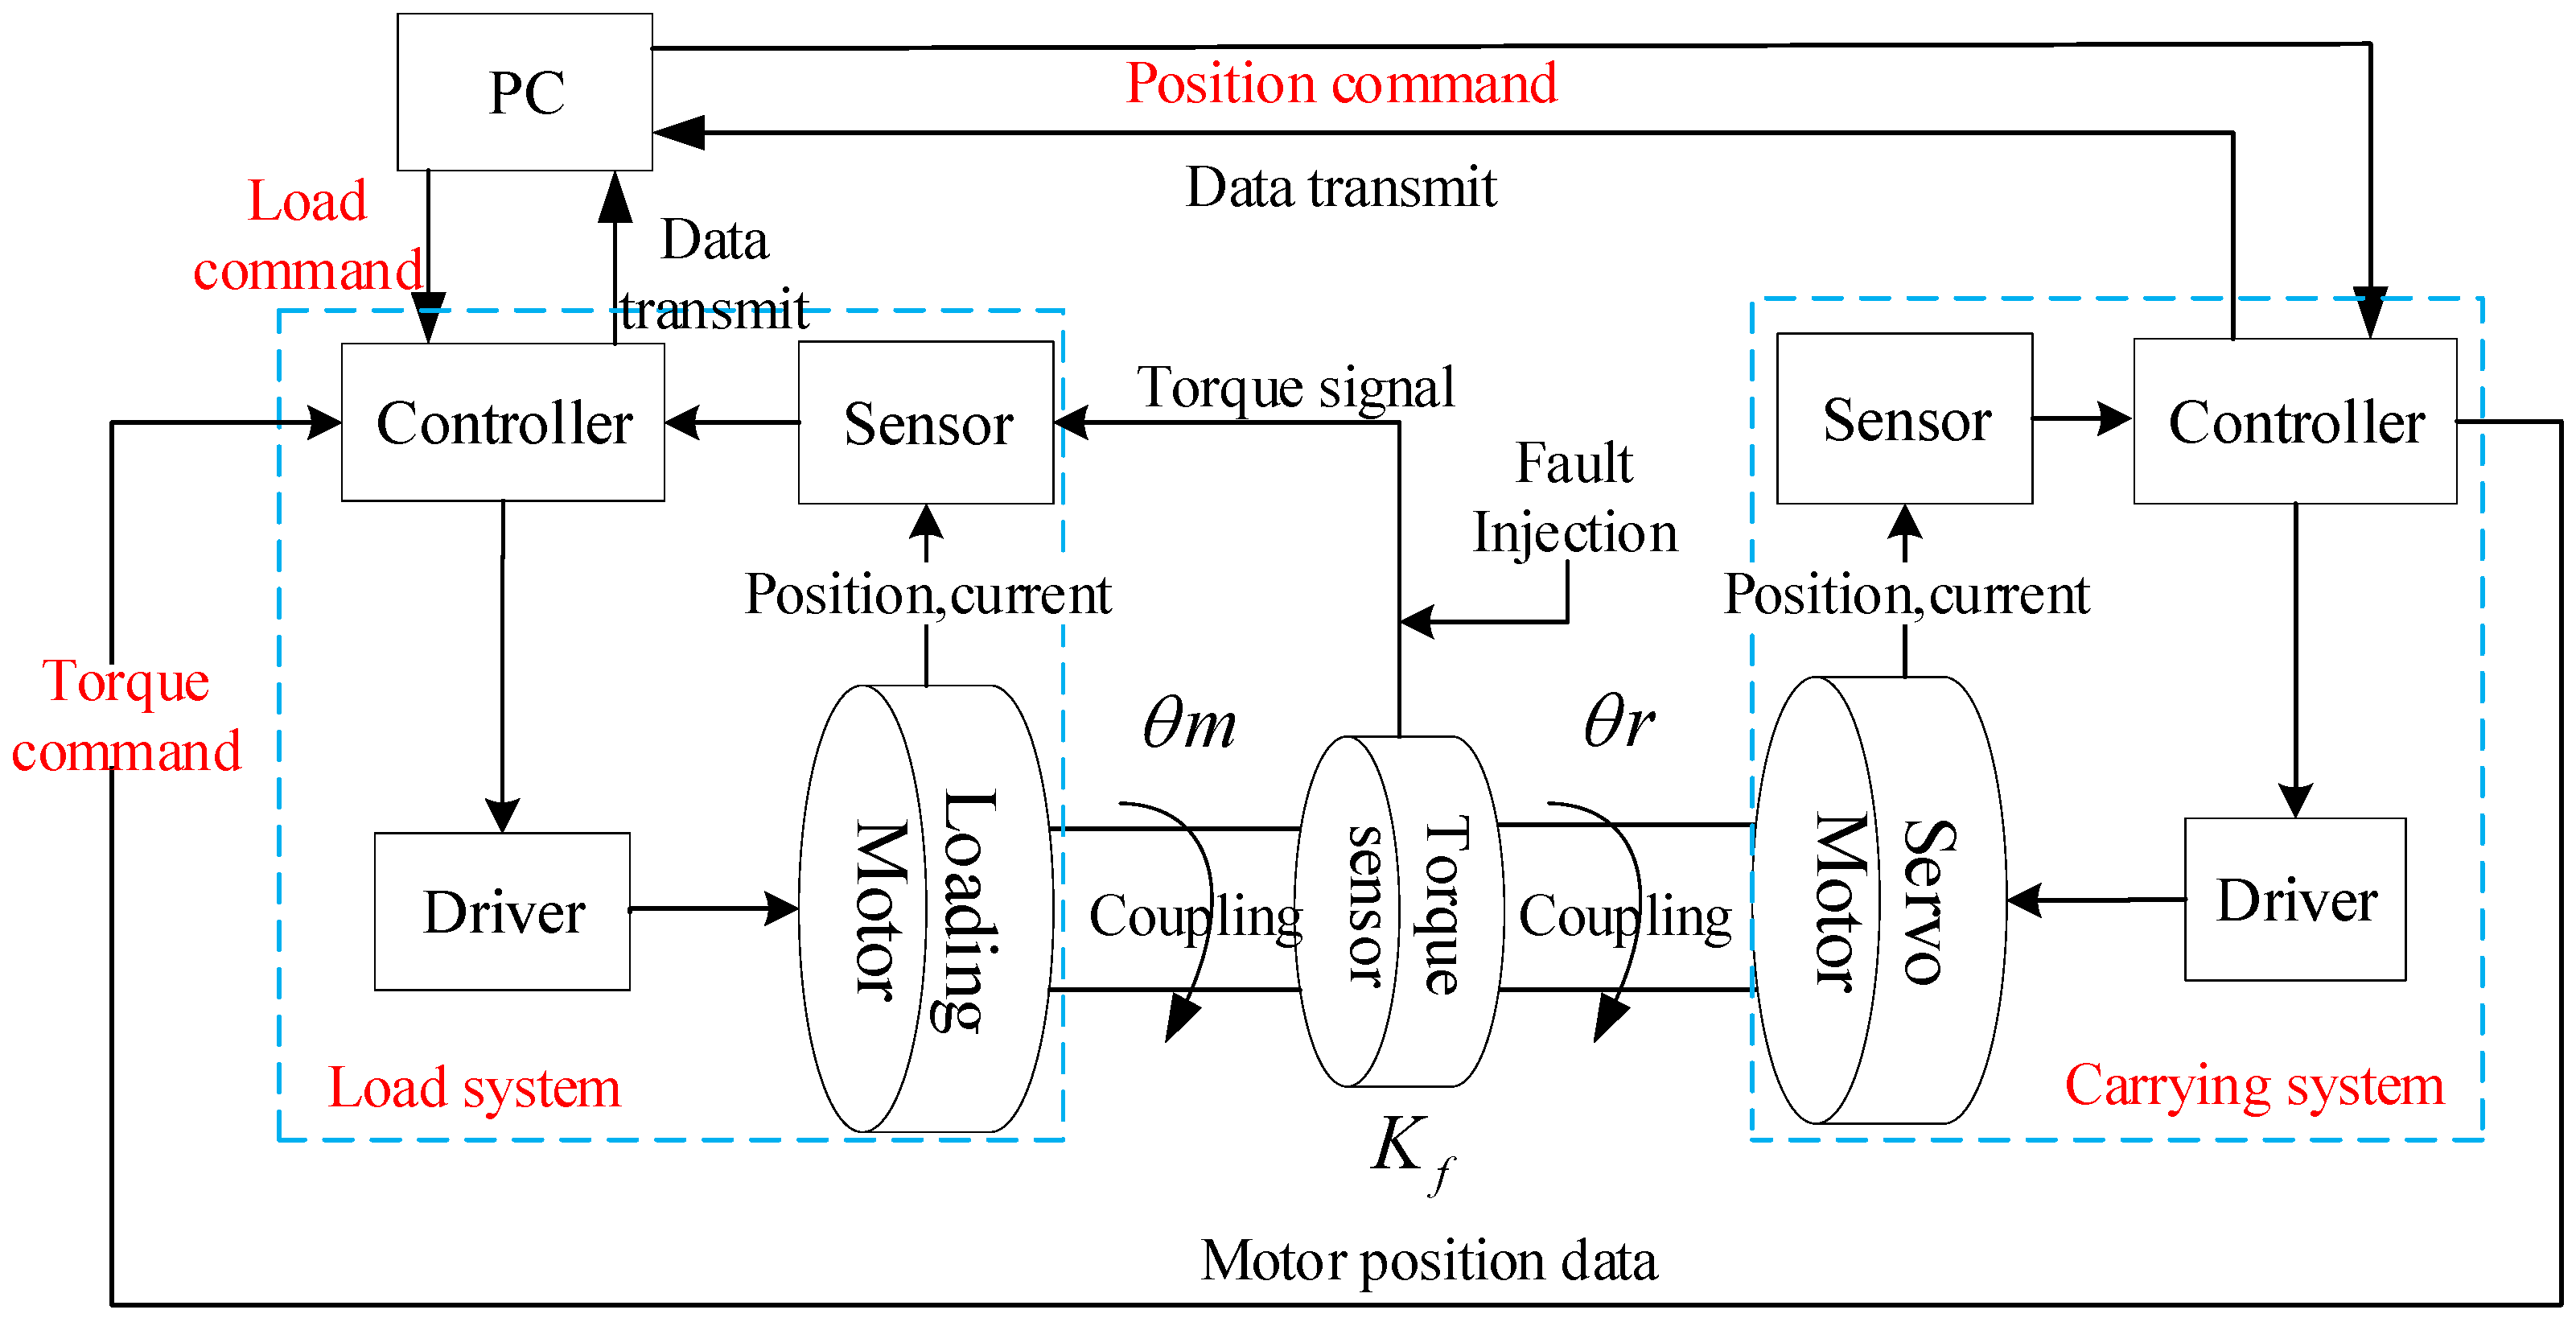
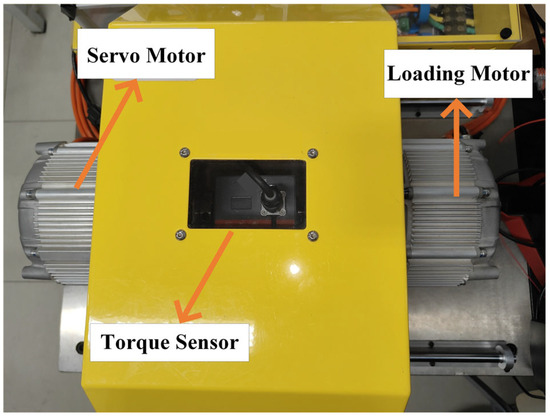
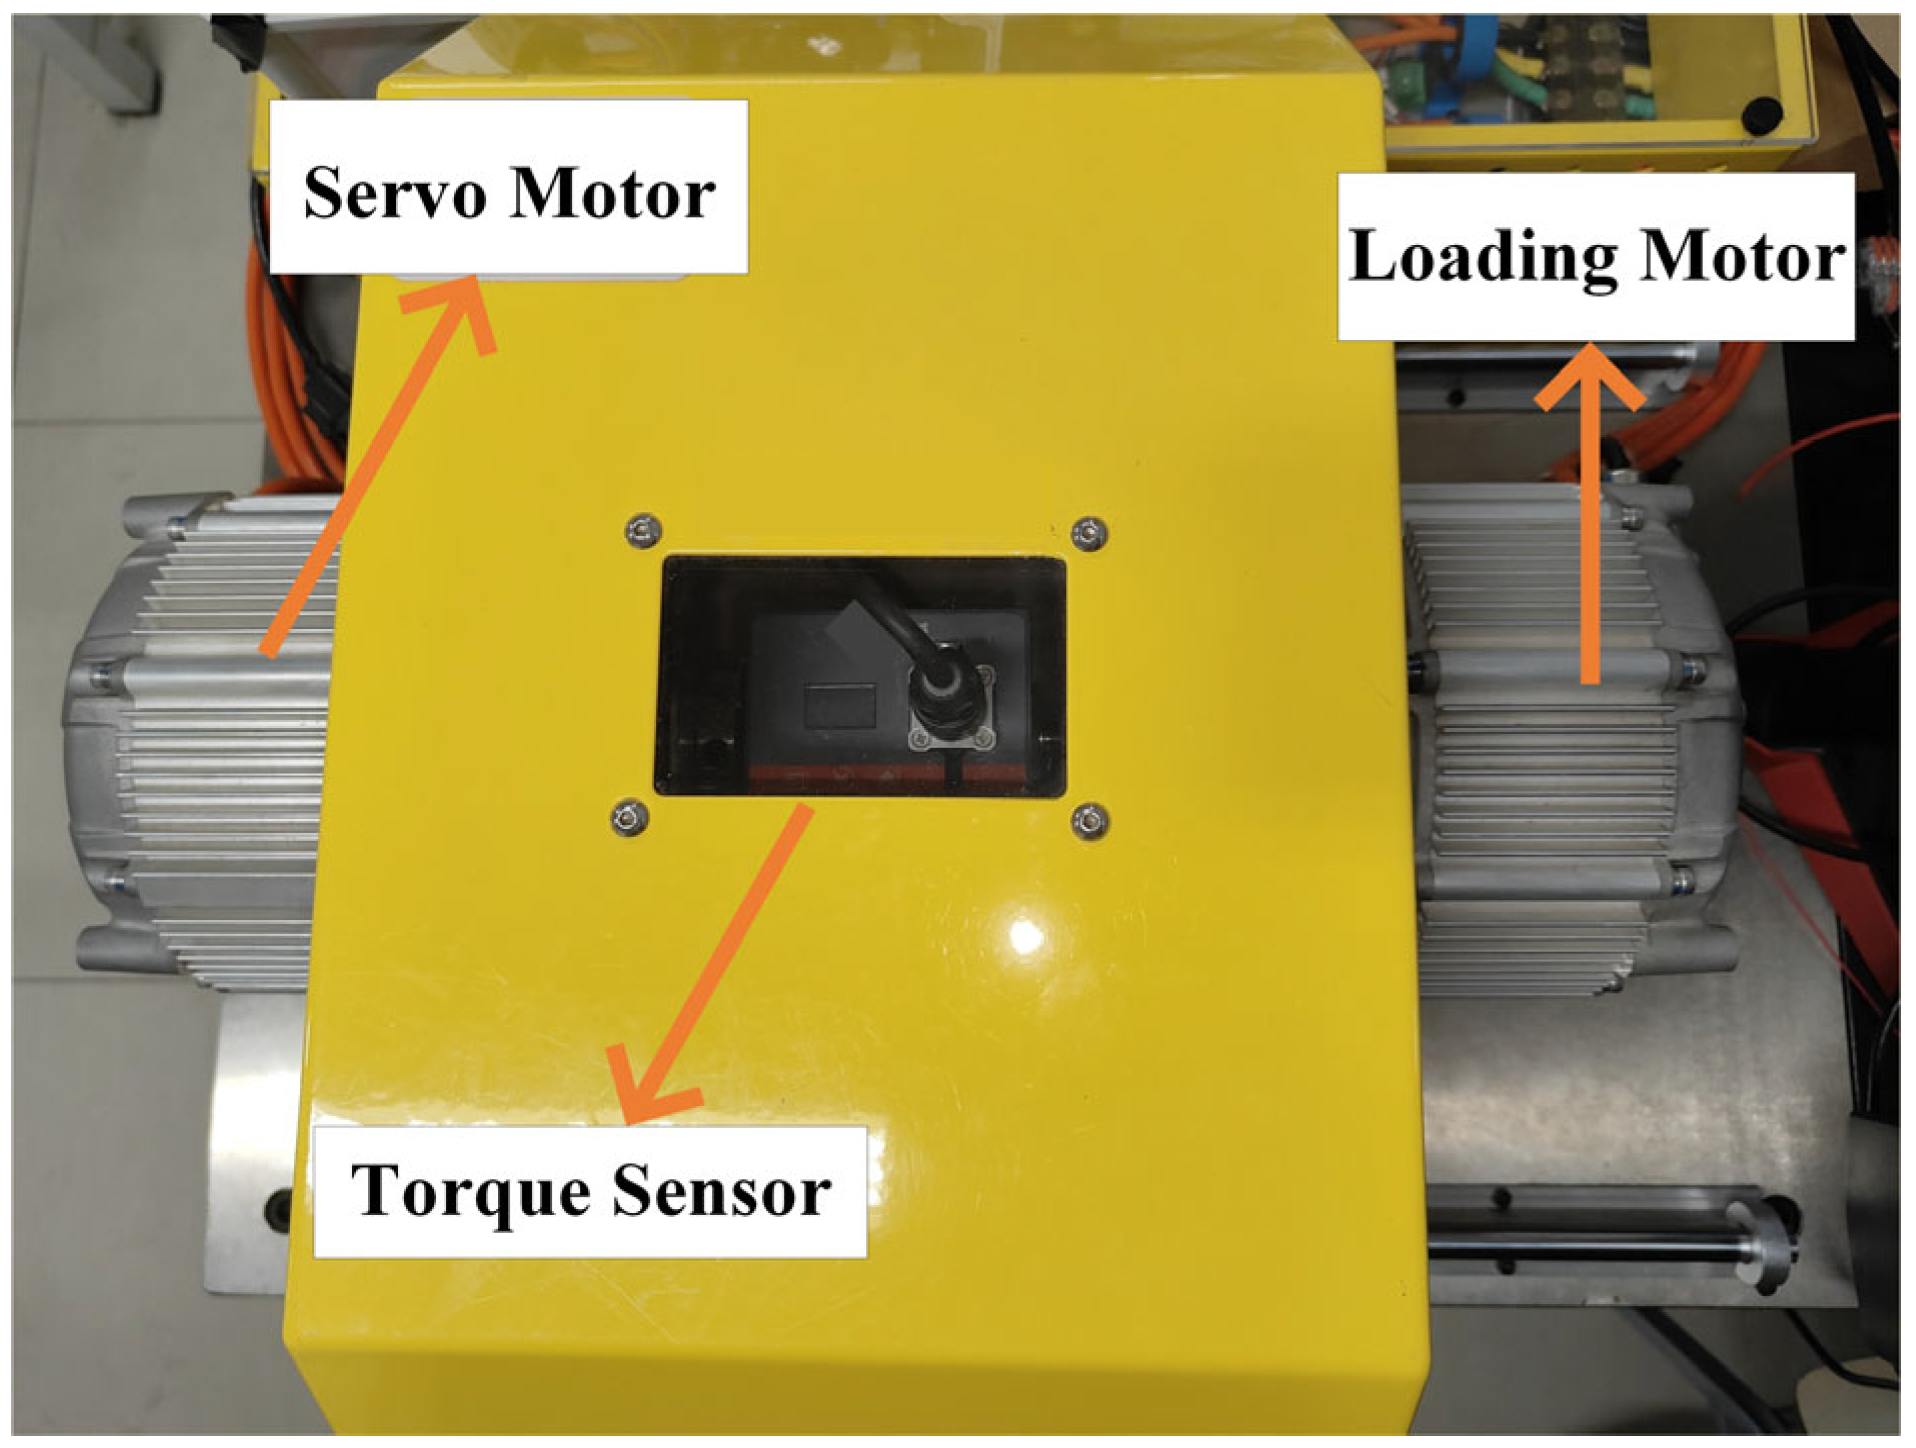
In this section, the working mechanism of the active sidestick is simulated by the dual-motor drag actuation experimental platform(Tianjin Santroll Electric Technology Co., Ltd., Tianjin, China), and the correctness of the fault injection simulation results is verified. The control block diagram of the experimental platform is shown in Figure 19. By setting the same conditions as the simulation, the characteristics of the force loading effects in the simulation and the experiment under the same fault conditions are compared, so as to prove the correctness of the fault injection simulation results. The experimental platform adopts the form of dual-motor torsion, where the dual motors are rigidly connected with the torque sensor through a coupling, as shown in Figure 20. The torque sensor is responsible for collecting real-time torque and feeding back to the controller for closed-loop control, and the motor rotor position and speed information are collected and fed back to the controller through the photoelectric encoder of the motor itself. The two motors are divided into a servo and a loading motor. The servo motor carries out a three-closed-loop control according to the feedback signal of the photoelectric encoder, and simulates the pilot’s push-pull sidestick action. The loading motor carries out force servo actuation according to the feedback signal of the photoelectric encoder and torque sensor, and loads the torque according to the servo motor output angle (the deflection angle of the driver’s push–pull sidestick). The experiment was carried out according to the dynamic loading condition of the motor.
Figure 19.
Experimental platform control block diagram.
Figure 20.
Experimental platform structure diagram.
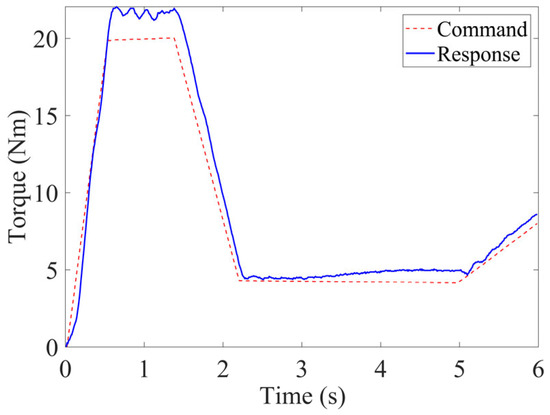
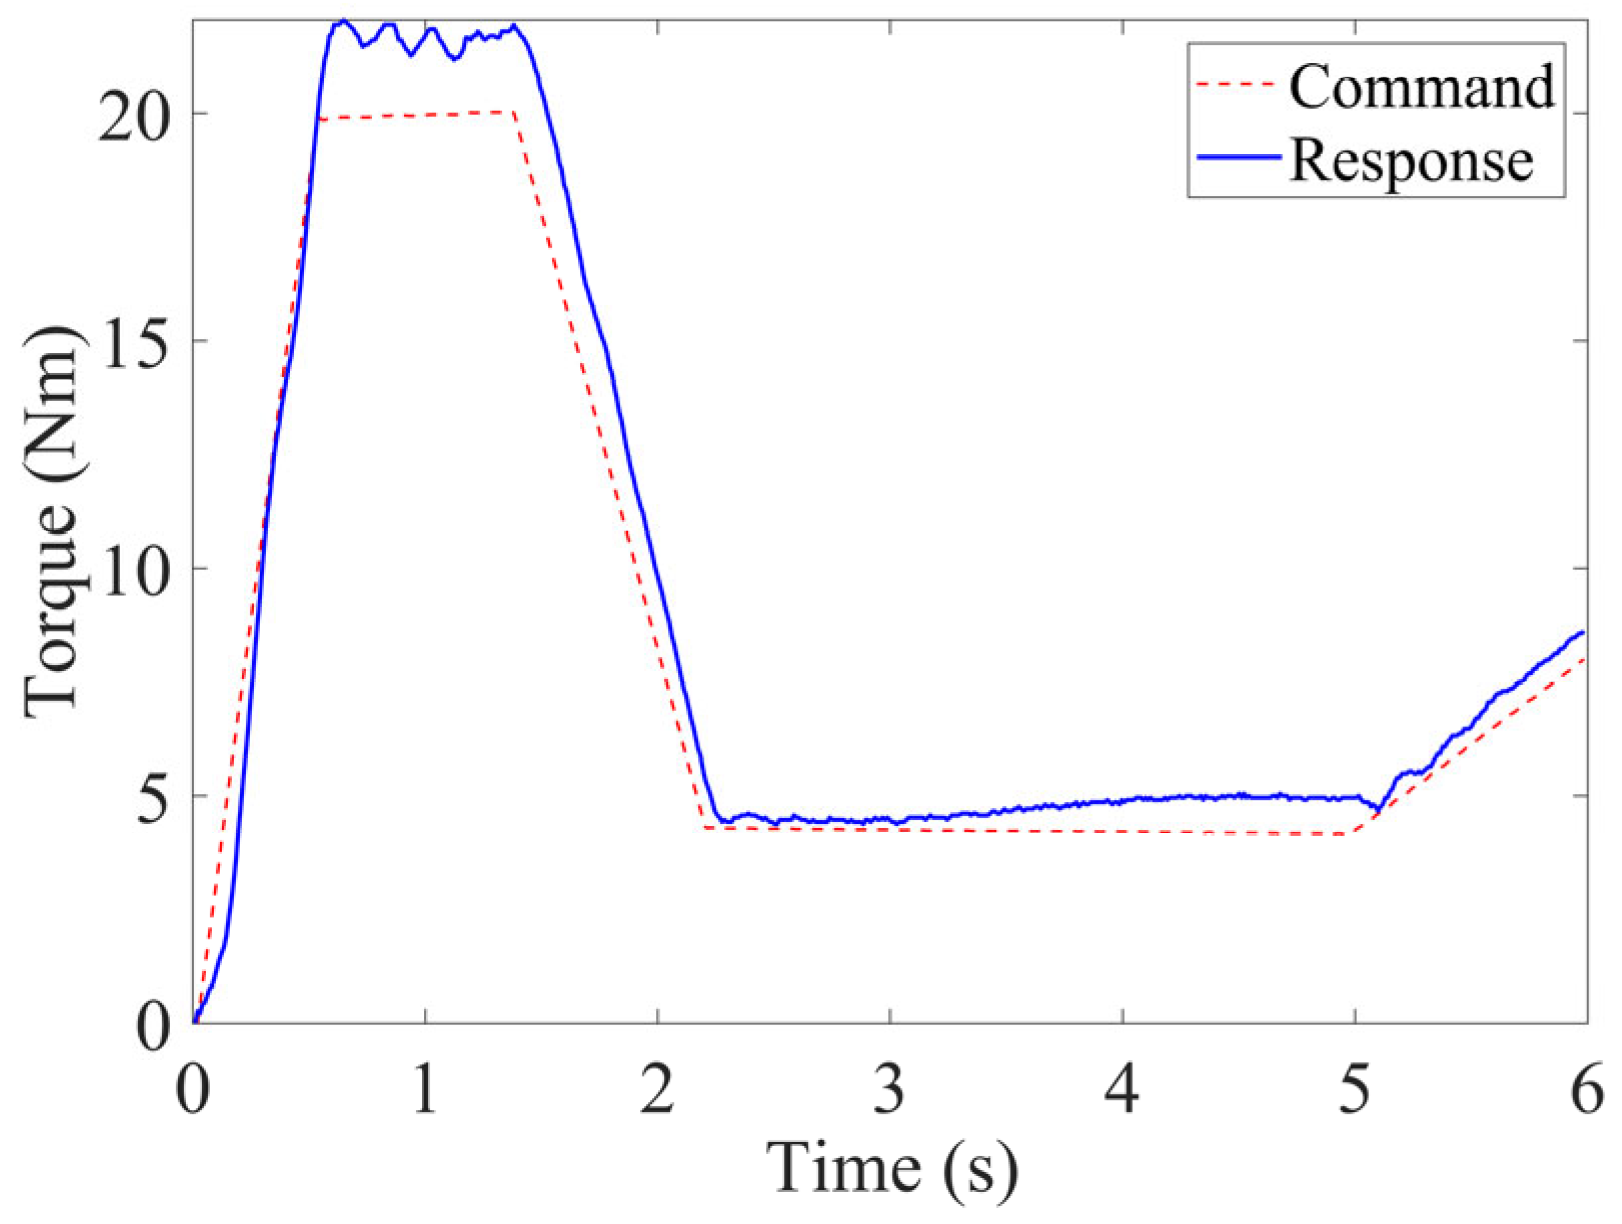
In the experiment, the servo motor was used as the position servo function, which was operated according to the given position command, and the loading motor was the force servo function, with a maximum torque of 20 N·m loaded in proportion to the servo angle. The experimental results were analyzed for the oscillation fault of the torque sensor injected with different frequencies and different amplitudes. Considering that the torque sensor was an important feedback sensor for controlling the outer loop, and the fault mechanism is complex, the fault injection experiment was carried out for the torque sensor.
Figure 21 shows the loading performance of the experimental platform without fault injection. The system surplus torque remained small and increased significantly only when the loading torque was large. These results can be used as a reference for subsequent fault injection experiments.
Figure 21.
The loading results under normal operating conditions of the experimental platform.
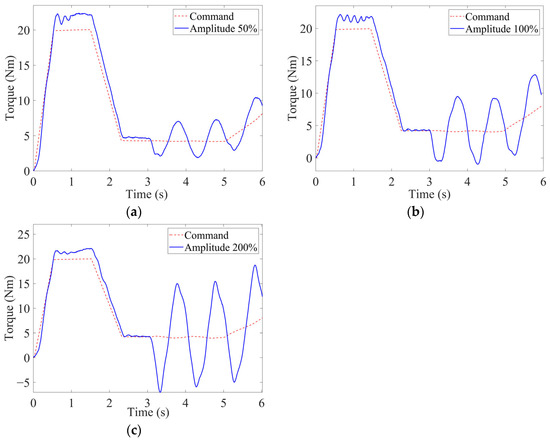
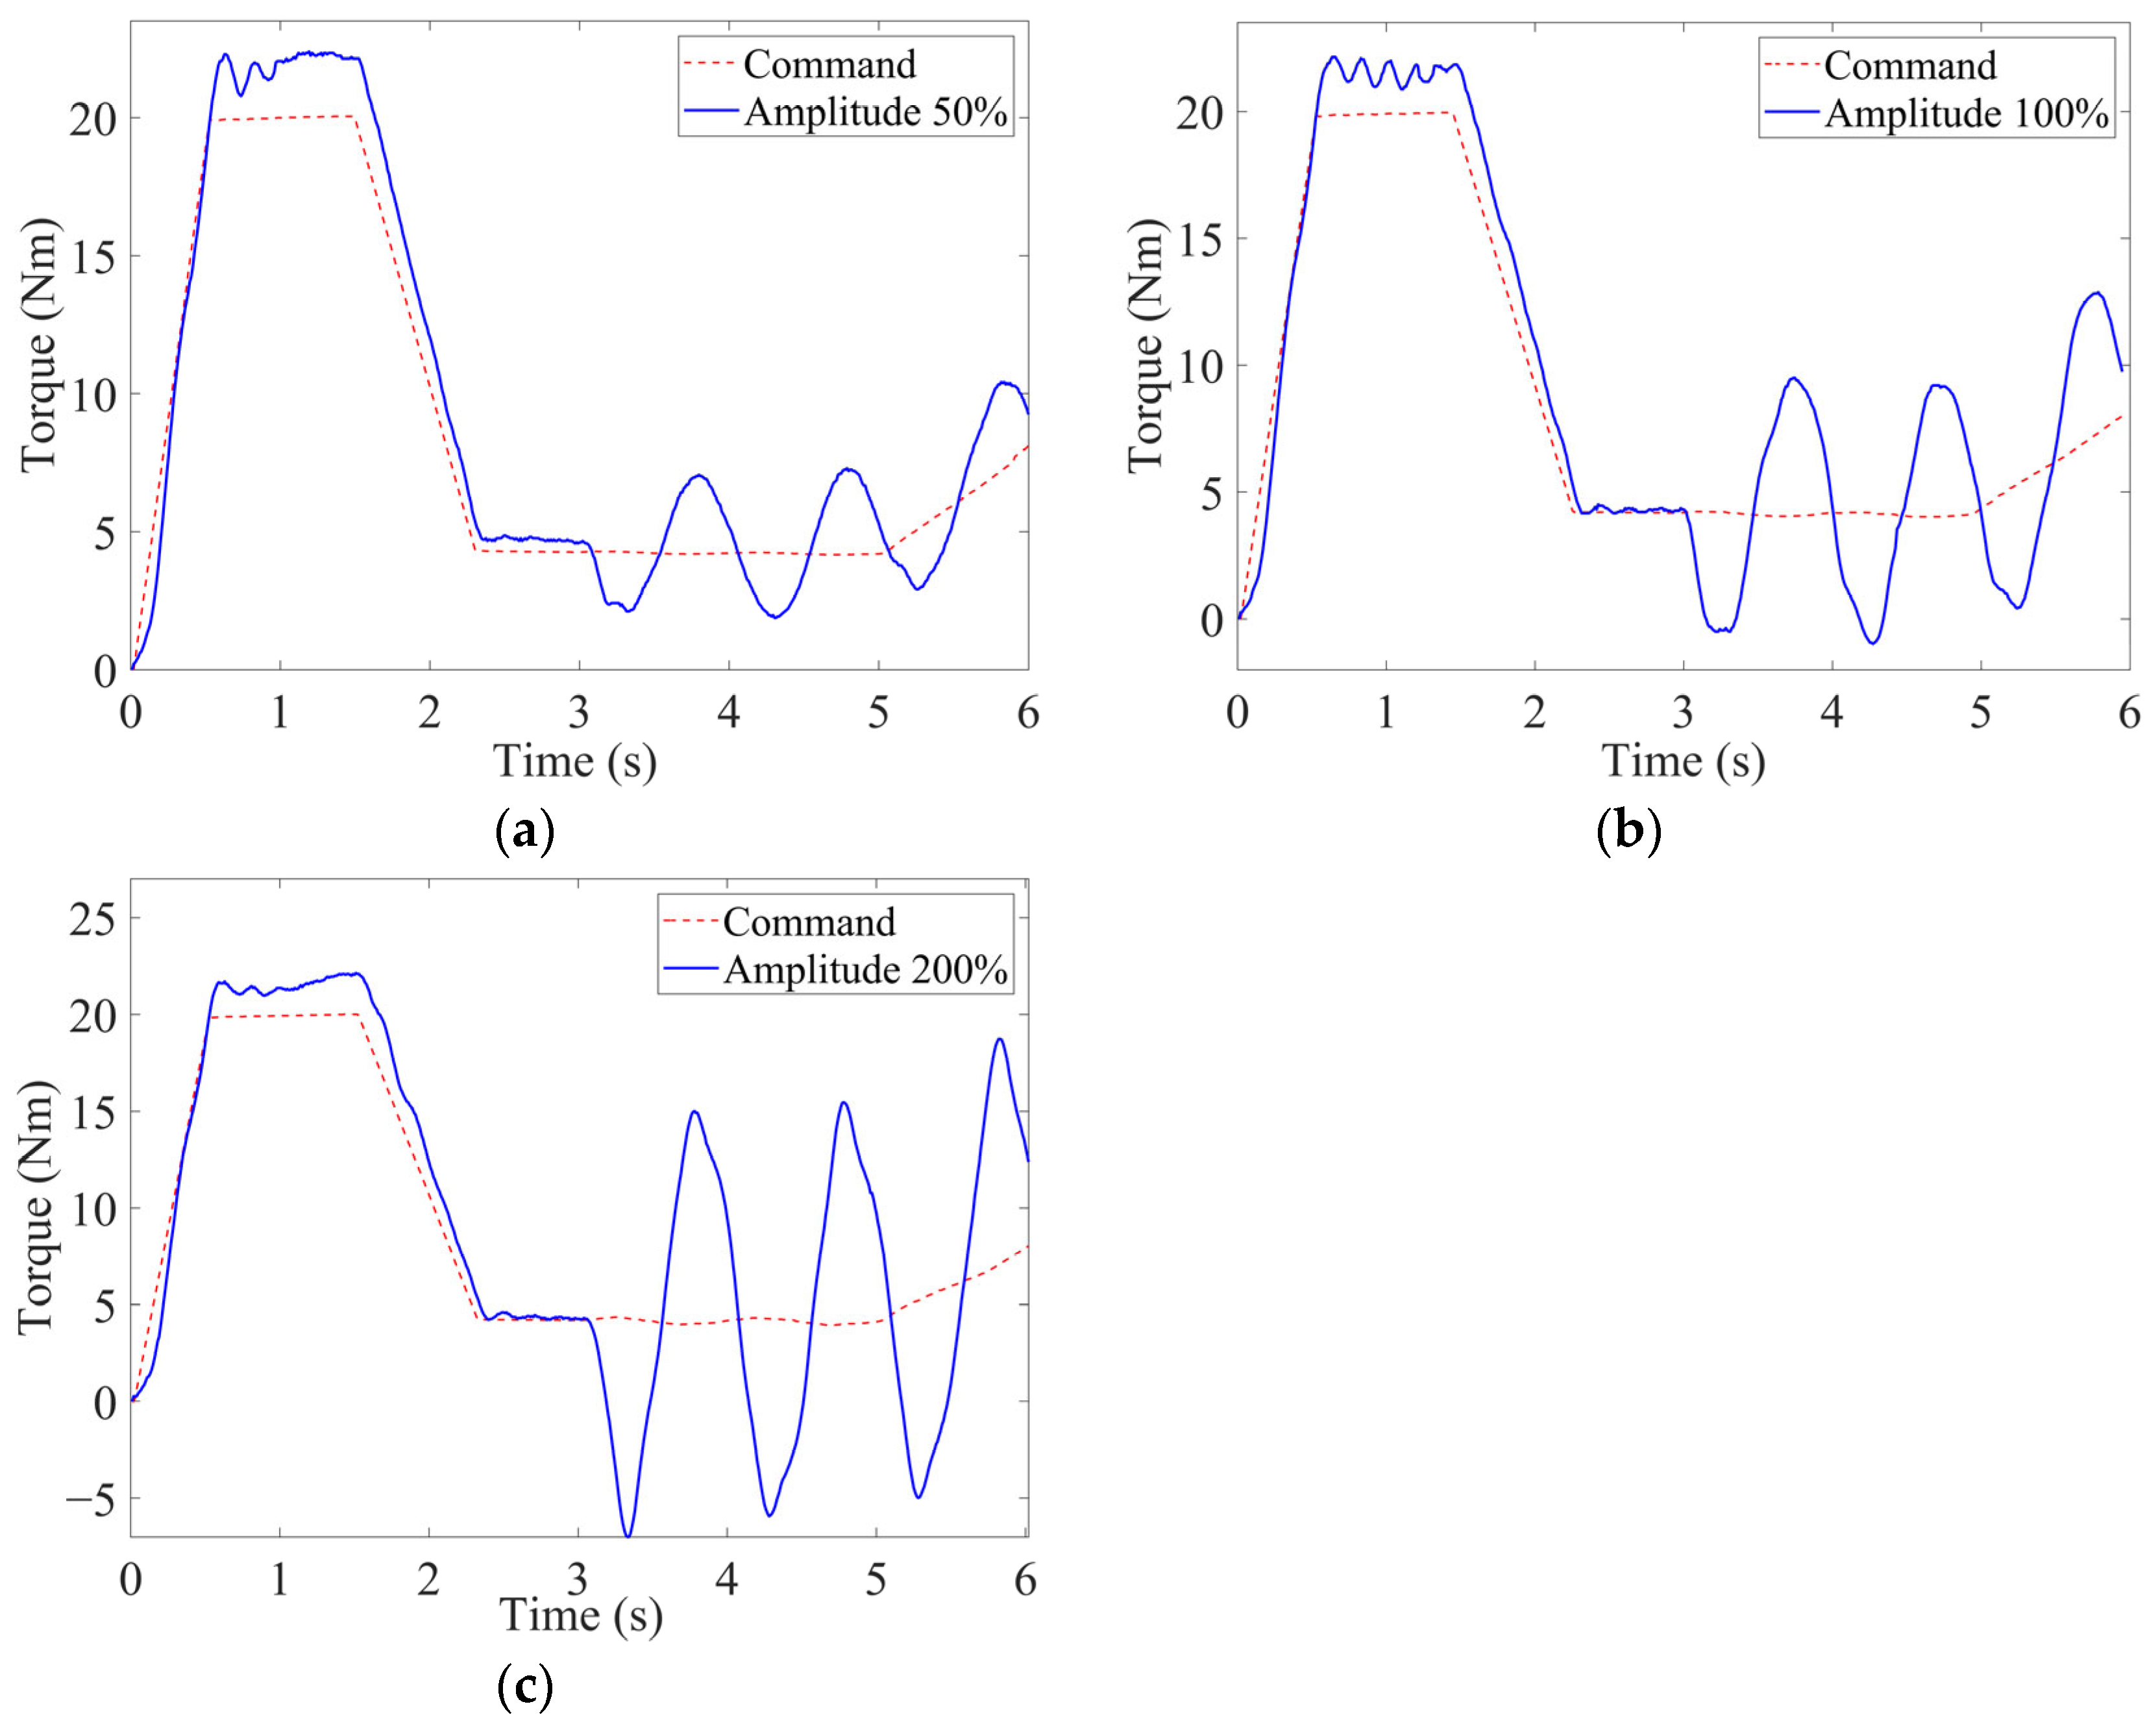
The frequency of the fault signal was set to 1 Hz, and the signal amplitude was set to 50%, 100%, and 200% of the normal signal. At 3 s, the oscillation signal was injected at the output of the sensor, and the influence of the amplitude of the oscillation signal on the system was obtained experimentally, as shown in Figure 22.
Figure 22.
Experimental results under constant frequency and variable amplitude oscillation faults: (a) fault signal amplitude 50%; (b) fault signal amplitude 100%; (c) fault signal amplitude 200%.
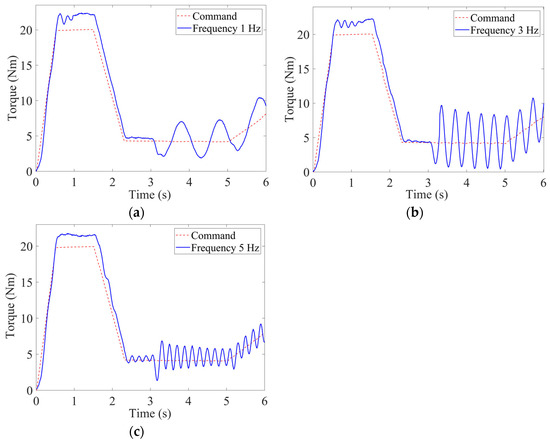
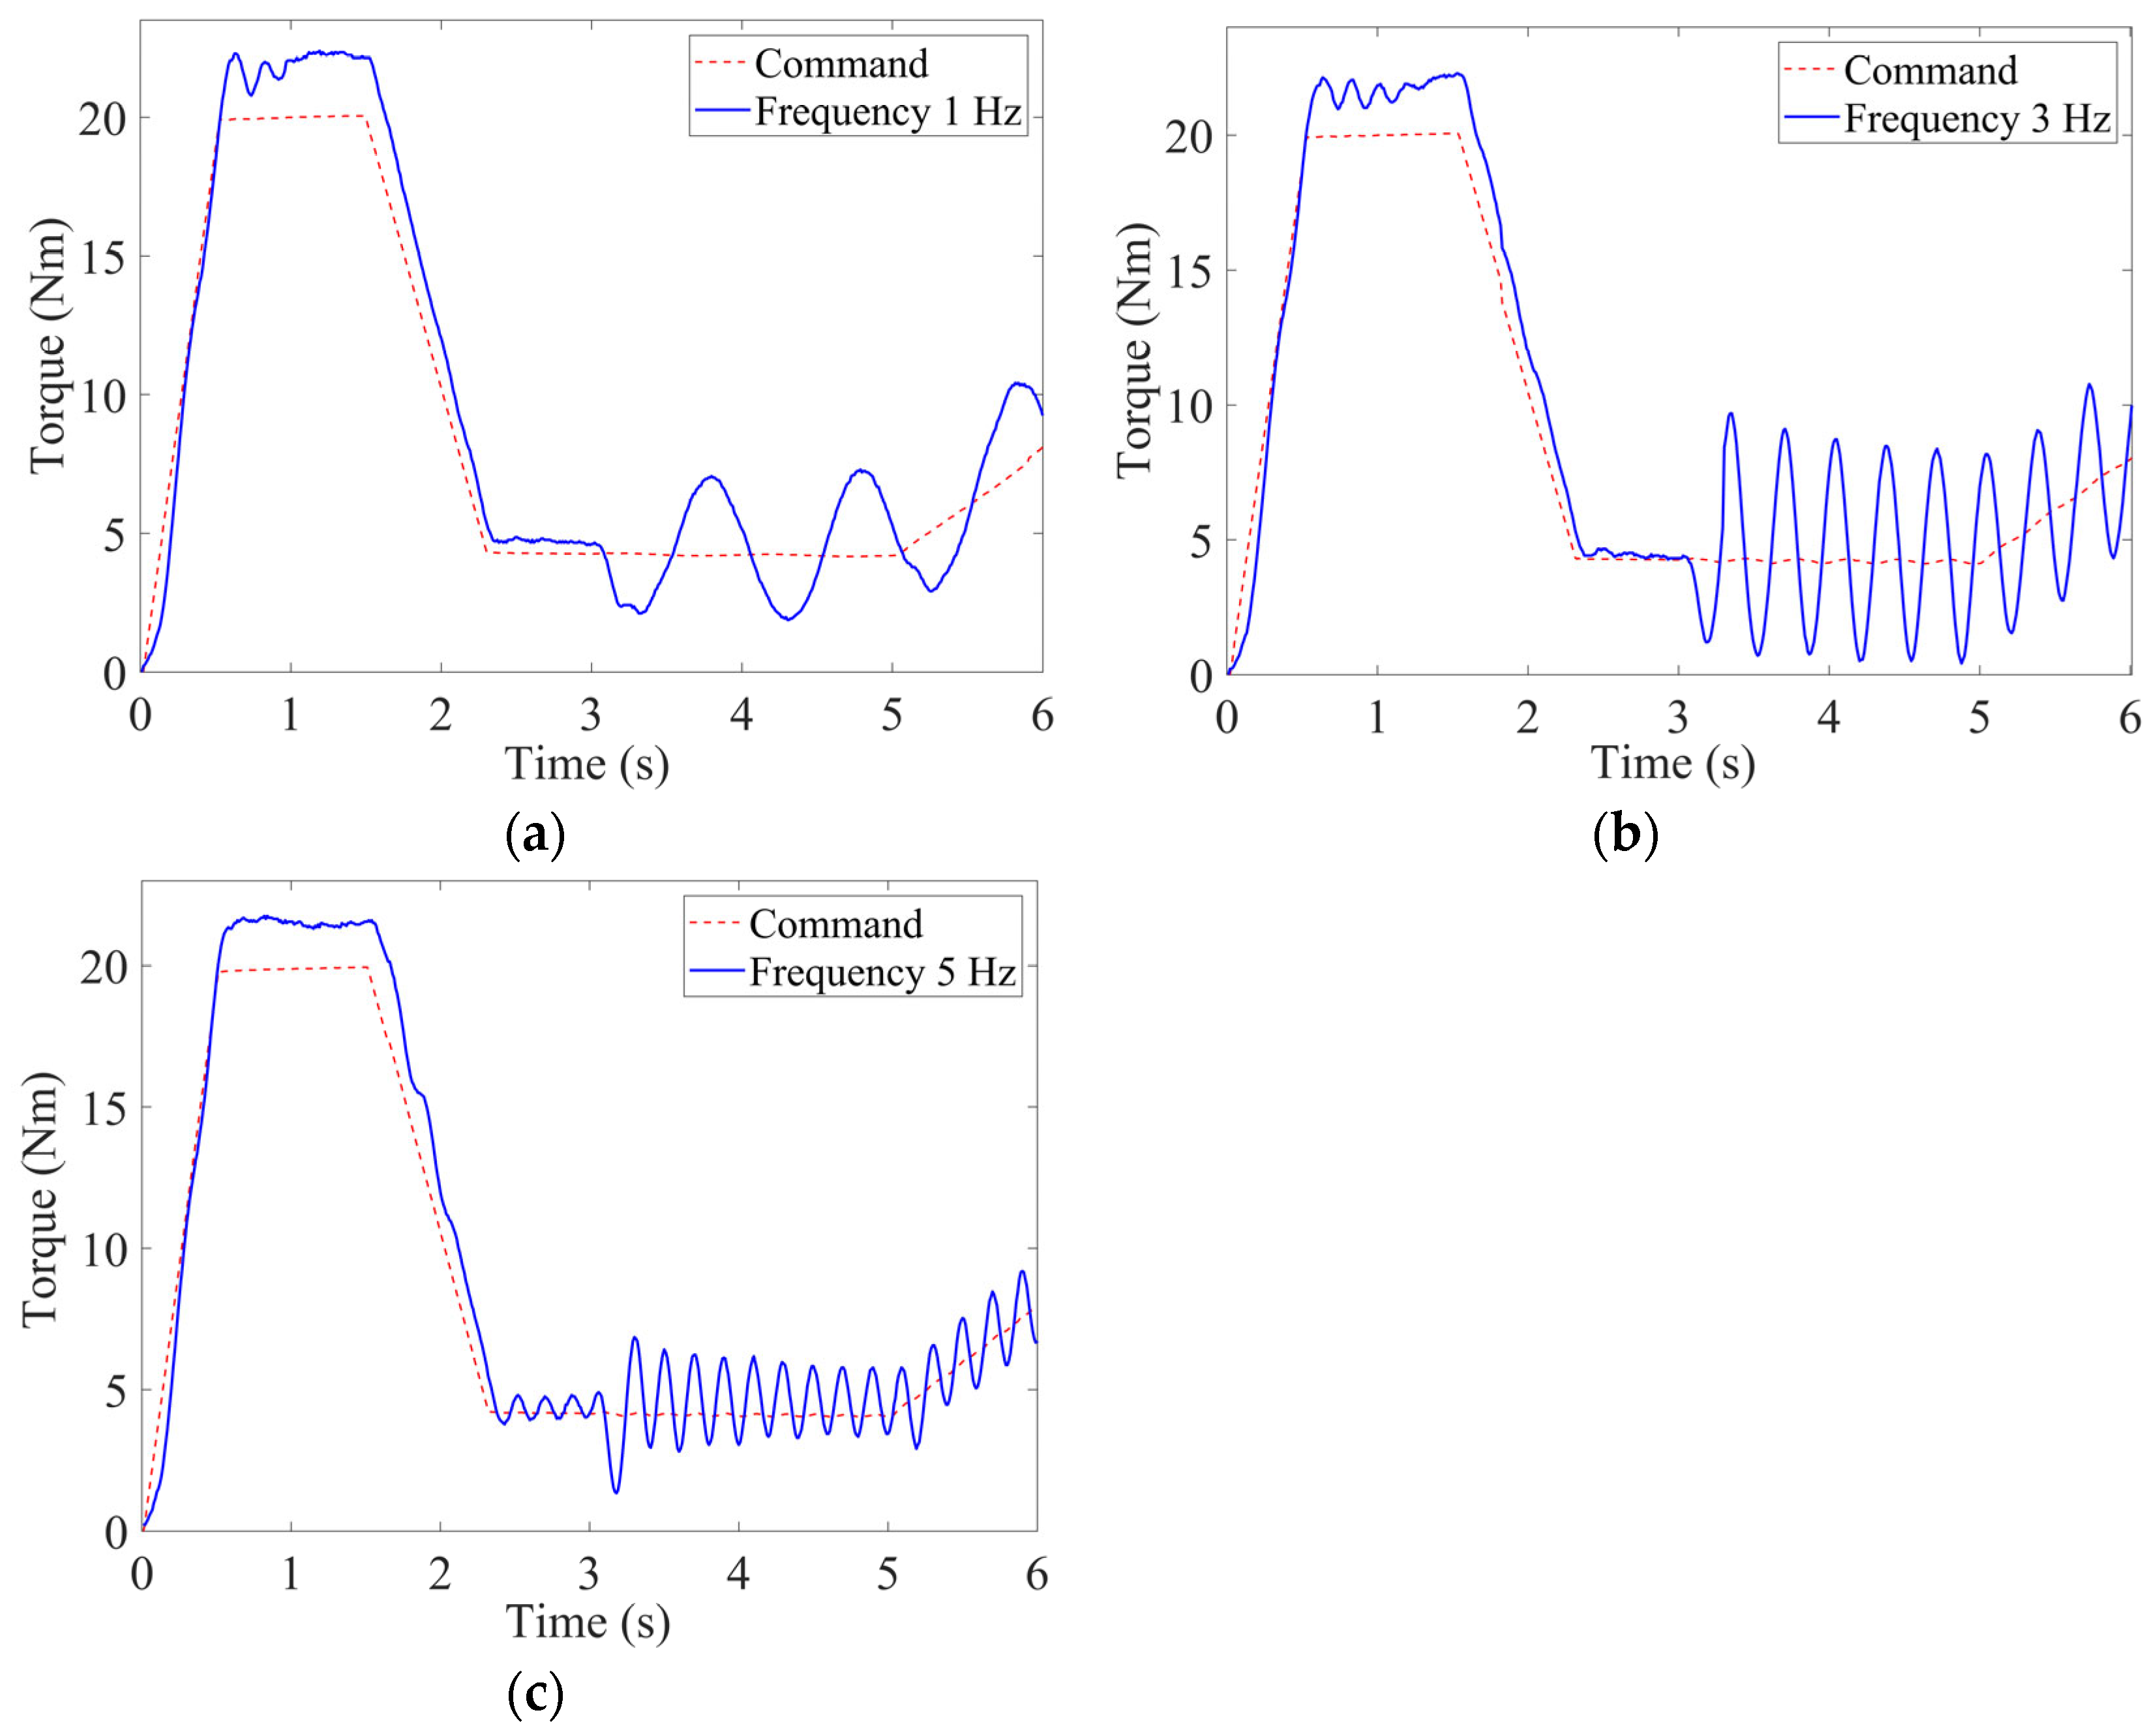
The amplitude of the fault signal was set to 50% of the normal signal, and the frequency was set to 1 Hz, 3 Hz, and 5 Hz. At 3 s, the oscillation signal was injected at the output of the sensor, and the influence of the frequency of the oscillation signal on the system was obtained, as shown in Figure 23.
Figure 23.
Experimental results under constant amplitude and variable frequency oscillation faults: (a) fault signal frequency 1 Hz; (b) fault signal frequency 3 Hz; (c) fault signal frequency 5 Hz.
From the experimental results, it can be seen that the sine wave oscillation fault signal of the torque sensor affected the torque loading effect of the system, and the degree of influence varied with the amplitude and frequency of the oscillation signal. With the increase in the amplitude of the fault signal, the increase in the system torque loading leads to higher surplus torque. The frequency of the surplus torque remains the same as the frequency of the fault signal. The frequency change in the oscillation signal mainly influences the frequency of the surplus torque and also affects the level of surplus torque. As the frequency of the fault signal increases, the frequency of surplus torque increases and remains consistent with the frequency of the fault signal. With the increase in fault signal frequency, the surplus torque frequency increases and the amplitude decreases. This is mainly because the inertia of loading system is large, the dynamic performance is slower, and the closed-loop control of the servo cannot fully simulate the change of the sidestick deflection angle caused by the change in the surplus force in the fault case. The experimental results show that the influence of the frequency and amplitude changes in the fault signal on the surplus torque is basically consistent with the simulation results of the fault injection, which validates the simulation results.
6. Conclusions and Future Work
6.1. Conclusions
This study investigated the failure effects of oscillation signals in an active sidestick system through fault mechanism analysis, fault injection simulation, and experimental verification. The results show the following:
- (1)
- At the equipment level of the active sidestick system, oscillation fault signals with different types, amplitudes, and frequencies were injected at different system locations. Oscillation faults in the motor driver directly affect the operating state of the loading motor and may cause motor speed oscillation or operation near the stalled condition. Oscillation faults at the control unit output have relatively limited effects on the active sidestick deflection angle, surplus force, and motor speed. Sensor oscillation faults directly distort the system feedback signals and may simultaneously cause abnormal sidestick motion, degradation of surplus force suppression performance, and oscillatory operation of the loading motor. The experimental results obtained by injecting sinusoidal signals into the torque sensor are consistent with the corresponding simulation trends, thereby validating the rationality of the failure effect analysis method.
- (2)
- After the pilot model and the aircraft longitudinal dynamics model were incorporated, the failure effects of oscillation signals exhibited evident frequency-dependent characteristics. A critical frequency exists in the relationship between the additional pilot control force and the oscillation fault frequency. When the fault frequency is lower than this critical frequency, the additional pilot control force suppresses the abnormal motion caused by the fault and reduces the aircraft pitch angle tracking error. When the fault frequency is higher than this critical frequency, the additional pilot control force increases the aircraft pitch angle tracking error, and the pilot response changes from a suppressing effect to an amplifying effect. In addition, an evident adverse coupling frequency range exists among the pilot, active sidestick system, and aircraft. Within this frequency range, the additional pilot control force markedly increases the aircraft pitch angle tracking error.
- (3)
- The simulation and experimental results can provide theoretical reference and technical support for the safety assessment, compliance verification, and airworthiness certification of civil aircraft active sidestick systems. During system safety assessment and airworthiness compliance verification, particular attention should be paid to the oscillation fault frequency ranges in which the pilot response changes from a suppressing effect to an amplifying effect or causes a marked increase in the aircraft response. Meanwhile, the detection of oscillation signal faults, particularly sensor signal oscillation faults, should be strengthened. Considering that the frequency of an oscillation fault signal may be close to that of the sidestick shaker feedback signal, fault detection should be able to clearly distinguish abnormal oscillation faults from normal shaker feedback signals.
6.2. Future Work
This study mainly analyzed the equipment level failure effects of the active sidestick system and the failure effects of torque sensor oscillation faults when additional pilot control force was considered. Future research will be extended to other critical components to analyze the failure effects under the pilot response after a fault occurs. In addition, the failure effect analysis conducted in this study can provide a basis for the design of fault detection methods. Subsequent research will further investigate fault detection methods and fault tolerant control strategies on this basis and analyze the failure effects after fault detection, isolation, and control reconfiguration.
Author Contributions
Conceptualization, X.S. and B.S.; methodology, X.S. and B.S.; software, B.S.; validation, B.S.; formal analysis, B.S.; investigation, B.S.; resources, X.S.; data curation, B.S.; writing—original draft preparation, B.S.; writing—review and editing, X.S. and B.S.; supervision, X.S. All authors have read and agreed to the published version of the manuscript.
Funding
This research received no external funding.
Data Availability Statement
The original contributions presented in this study are included in the article. Further inquiries can be directed to the corresponding author.
Conflicts of Interest
The authors declare no conflicts of interest.
Abbreviations
The following abbreviations are used in this manuscript:
| ECU | Electronic control unit |
| PCU | Power control unit |
| PMSM | Permanent magnet synchronous motor |
| FCC | Flight control computer |
| OFC | Oscillatory failure case |
| PC | Personal computer |
References
- Jin, X. Design and application of flight control system oscillation fault monitor. J. Cap. Norm. Univ. (Nat. Sci. Ed.) 2023, 44, 29–34. [Google Scholar] [CrossRef]
- Ma, L.; Yang, S.; Shi, L. Analysis on airworthiness special conditions of civil helicopter fly-by-wire flight control system. Adv. Aeronaut. Sci. Eng. 2021, 12, 20–28. [Google Scholar] [CrossRef]
- Wang, L. Research on operational test airworthiness requirements and compliance verification methods. Aviat. Stand. Qual. 2014, 3, 44–45+49. [Google Scholar] [CrossRef]
- Hanke, D.; Herbst, C. Active sidestick technology—A means for improving situational awareness. Aerosp. Sci. Technol. 1999, 3, 525–532. [Google Scholar] [CrossRef] [Scilit]
- Hosman, R.J.A.W.; Benard, B.; Fourquet, H. Active and passive side stick controllers in manual aircraft control. In Proceedings of the 1990 IEEE International Conference on Systems, Man, and Cybernetics, Los Angeles, CA, USA, 4–7 November 1990; IEEE: New York, NY, USA, 1990; pp. 527–529. [Google Scholar]
- De Stigter, S.; Mulder, M.; van Paassen, M.M. Design and evaluation of a haptic flight director. J. Guid. Control Dyn. 2007, 30, 35–46. [Google Scholar] [CrossRef] [Scilit]
- Van Baelen, D.; Ellerbroek, J.; van Paassen, R.; Mulder, M. Design of a haptic feedback system for flight envelope protection. J. Guid. Control Dyn. 2020, 43, 700–714. [Google Scholar] [CrossRef] [Scilit]
- Rauer, E. Methodology to analyse handling qualities under force gradient transitions of an active sidestick. Aerotec. Missili Spaz. 2019, 98, 231–242. [Google Scholar] [CrossRef] [Scilit]
- Fergani, S.; Allias, J.F.; Briere, Y.; Defay, F. A novel design and control solution for an aircraft sidestick actuator based on Halbach permanent magnet machine. IFAC-PapersOnLine 2016, 49, 80–87. [Google Scholar] [CrossRef] [Scilit]
- Barnett, M. Flight Test Techniques and the Influence on Rotorcraft Handling Qualities during Isometric Failures of Active Sidesticks; DLR Report No. DLR-FB-2022-14; Deutsches Zentrum für Luft-und Raumfahrt: Cologne, Germany, 2022. [Google Scholar] [CrossRef]
- Jones, M.; Barnett, M. Analysis of rotorcraft pilot induced oscillations triggered by active inceptor failures. In Proceedings of the AIAA Scitech Guidance, Navigation, and Control Conference, San Diego, CA, USA, 6–11 January 2019; American Institute of Aeronautics and Astronautics, Inc.: Reston, VA, USA, 2019; AIAA Paper 2019-0104. [Google Scholar] [CrossRef] [Scilit]
- Xu, S.; Tan, W.; Sun, L.; Qu, X. Using active side stick to prevent Category II pilot induced oscillations. Acta Aeronaut. Astronaut. Sin. 2018, 39, 121861. [Google Scholar] [CrossRef]
- Xu, S.; Tan, W.; Qu, X. Design method of aircraft smart side stick controller with force cue. Acta Aeronaut. Astronaut. Sin. 2021, 42, 525775. [Google Scholar] [CrossRef]
- Wang, L. An implementation and compliance verification of a fault detection method for a fly-by-wire flight control system rudder oscillation. Sci. Technol. Inf. 2014, 11, 40+31. [Google Scholar]
- Wang, Y. Research on Airfoil Oscillation Monitor Technology for Large Passenger Aircraft Flight Control System. Master’s Thesis, Harbin Engineering University, Harbin, China, 2023. [Google Scholar] [CrossRef]
- Byington, C.; Watson, M.; Edwards, D.; Stoelting, P. A model-based approach to prognostics and health management for flight control actuators. In Proceedings of the IEEE Aerospace Conference, Big Sky, MT, USA, 6–13 March 2004; IEEE: Piscataway, NJ, USA, 2004; Volume 6, pp. 3551–3562. [Google Scholar] [CrossRef] [Scilit]
- Gao, Z.; Cecati, C.; Ding, S.X. A survey of fault diagnosis and fault-tolerant techniques—Part I: Fault diagnosis with model-based and signal-based approaches. IEEE Trans. Ind. Electron. 2015, 62, 3757–3767. [Google Scholar] [CrossRef] [Scilit]
- Forouzanfar, M.; Safaeipour, H.; Casavola, A. Oscillatory failure case detection in flight control systems via wavelets decomposition. ISA Trans. 2022, 128, 47–53. [Google Scholar] [CrossRef] [Scilit] [PubMed]
- Peng, S.; Jiang, H.; Zuo, P.; Dong, X.; Li, Q.; Zhang, R. Oscillatory failure case detection in the missile actuators electrical flight control system by adaptive unknown input observer. In Proceedings of the 2018 Chinese Control and Decision Conference (CCDC), Shenyang, China, 9–11 June 2018; IEEE: Piscataway, NJ, USA, 2018; pp. 2557–2562. [Google Scholar] [CrossRef] [Scilit]
- Sun, X.; Yang, Z.; Yang, J.; Wang, L. Failure effect analysis of uncommand oscillation signals in electromechanical actuation system. J. Beijing Univ. Aeronaut. Astronaut. 2018, 44, 1419–1429. [Google Scholar] [CrossRef]
- Yang, J.; Zuo, J.; Sun, X. Mechanism and sensitivity analysis of surplus force in the active sidestick system. J. Beijing Univ. Aeronaut. Astronaut. 2026, 52, 1378–1390. [Google Scholar] [CrossRef]
- Dai, R.; Yang, J.; Zuo, J.; Sun, X. Adaptive backstepping suppression strategy of surplus force in active sidestick. Mech. Sci. Technol. Aerosp. Eng. 2024, 1–9. [Google Scholar] [CrossRef]
- Yang, J.; Zuo, J.; Sun, X. Failure effect analysis of uncommand signal in the active side-stick system. IET Conf. Proc. 2024, 2024, 2345–2351. [Google Scholar] [CrossRef] [Scilit]
- Chen, Z.; Zhang, C.; Zhu, S.; Liu, C. Torque control for spring-damping system of aircraft active side-stick. Flight Control Detect. 2023, 6, 32–40. [Google Scholar] [CrossRef]
- Wu, H.; Sun, Y.; Sun, X.; Liu, C. Research on stick force control of active side stick based on MPC algorithm. Mach. Electron. 2023, 41, 33–38. [Google Scholar]
- Hess, R.A. Modeling pilot control behavior with sudden changes in vehicle dynamics. J. Aircr. 2009, 46, 1584–1592. [Google Scholar] [CrossRef] [Scilit]
- Mao, Z. Research on Pilot Control Modeling During the Approach Phase; Nanjing University of Aeronautics and Astronautics: Nanjing, China, 2019. [Google Scholar]
- Yang, C. Research on Pilot Modeling for Quantitative Aviation Safety Studies; Shanghai Jiao Tong University: Shanghai, China, 2015. [Google Scholar]
- Federal Aviation Administration. Special Conditions: Airbus Model A380-800 Airplane; Special Conditions No. 25-316-SC. Fed. Reg. 2006, 71, 18169–18183. [Google Scholar]
- Federal Aviation Administration. Special Conditions: Boeing Model 777 Series Airplanes; Special Conditions No. 25-ANM-78. Fed. Reg. 1993, 58, 59646. [Google Scholar]
- Lavigne, L.; Zolghadri, A.; Goupil, P.; Simon, P. Robust and early detection of oscillatory failure case for new generation Airbus aircraft. In Proceedings of the AIAA Guidance, Navigation, and Control Conference and Exhibit, Honolulu, HI, USA, 18–21 August 2008; American Institute of Aeronautics and Astronautics, Inc.: Reston, VA, USA, 2008; AIAA Paper 2008-7139. [Google Scholar] [CrossRef] [Scilit]
- Urbano, S. Early and robust detection of oscillatory failure cases (OFC) in the flight control system: A data-driven technique. In Proceedings of the 55th AIAA Aerospace Sciences Meeting, Grapevine, TX, USA, 9–13 January 2017; American Institute of Aeronautics and Astronautics, Inc.: Reston, VA, USA, 2017; AIAA Paper 2017-2017. [Google Scholar] [CrossRef] [Scilit]



Disclaimer/Publisher’s Note: The statements, opinions and data contained in all publications are solely those of the individual author(s) and contributor(s) and not of MDPI and/or the editor(s). MDPI and/or the editor(s) disclaim responsibility for any injury to people or property resulting from any ideas, methods, instructions or products referred to in the content. |
© 2026 by the authors. Licensee MDPI, Basel, Switzerland. This article is an open access article distributed under the terms and conditions of the Creative Commons Attribution (CC BY) license.