


Abstract
Quick Access Recorder (QAR) data provide high-dimensional onboard flight records that are increasingly used for data-driven aviation safety analysis. As flight operations become more complex, conventional manual monitoring and threshold-based exceedance detection are often insufficient for identifying evolving risks in a timely and interpretable manner. This paper reviews QAR data-driven methods for flight anomaly detection and risk warning from the perspective of statistical learning and aviation data science. First, the main characteristics of QAR data are summarized, including multi-source heterogeneity, temporal dependence, missing values, noise, and severe class imbalance. Common preprocessing techniques, such as missing-value imputation, trajectory correction, feature engineering, downsampling, and imbalanced-data handling, are then reviewed. Second, existing methods are organized into four groups: statistical monitoring and rule-based methods, clustering and unsupervised anomaly detection, Bayesian and probabilistic risk reasoning, and hybrid machine learning with explainable AI. Representative approaches include statistical process control, association rules, Gaussian mixture models, CurveCluster, Fast-DTW, Bayesian networks, dynamic Bayesian networks, VAE-LSTM, MAD-XFP, and XGBoost with SHAP interpretation. The review further discusses typical applications in landing risk warning, takeoff risk assessment, flight operation pattern recognition, and aviation noise prediction. Finally, key challenges are summarized, including model interpretability, real-time deployment, cross-aircraft and cross-airport generalization, data quality, causal reasoning, and privacy-preserving collaboration. This review provides a structured reference for using QAR data to support aviation safety assessment, risk warning, and operational decision-making.
1. Introduction
With the rapid growth of global air transportation and the increasing complexity of flight operations, aviation safety has become a critical challenge for operators, regulators, and researchers. Higher flight density, limited airspace resources, complex weather conditions, and increasingly data-rich aircraft systems all require more proactive safety management approaches. Traditional safety management methods that rely mainly on post-event investigation, manual monitoring, and fixed exceedance thresholds are often insufficient for detecting evolving risks in real time. As a result, data-driven methods based on flight operational data have become increasingly important for aviation safety assessment and decision support.
In this context, Quick Access Recorder (QAR) data, as a critical airborne recording device on modern civil aircraft, is playing an increasingly important role. The QAR system can record hundreds or even thousands of parameters at high frequency during flight, including flight attitude, engine performance, crew operations, and environmental conditions, forming typical high-dimensional time-series big data. These data exhibit distinct statistical characteristics: multi-source heterogeneity (significant differences in physical meaning, dimensions, and sampling frequencies across subsystems), strong temporal dependence (parameters evolve dynamically with flight phases and show significant non-stationarity), missing values and noise (caused by sensor failures or transmission interference), severe class imbalance (normal flight data overwhelmingly dominate, while abnormal events are extremely sparse), and high-dimensional sparse anomalies (complex abnormal patterns that are difficult to label in advance). For example, in the approach and landing phase, the proportion of abnormal samples is often about 22%, with a highly uneven distribution across anomaly types Dang et al. [1]. Note that overall flight-wide anomaly rates are much lower (<1–2%), highlighting the severe class imbalance. These characteristics provide rich information for data-driven safety assessment but also pose severe challenges to traditional statistical methods and machine learning models.
The application of QAR data has gradually expanded from early simple exceedance monitoring to flight operations quality assurance (FOQA), fault diagnosis, risk warning, operational optimization, and even airport noise management. Zhang et al. [2] systematically reviewed domestic and international research progress on QAR data, pointing out that QAR data has become an important foundation for global airlines’ flight quality monitoring, engine condition detection, aircraft system fault diagnosis, and 3D route design. China is currently the only country in the world that implements full QAR monitoring on all commercial transport fleets, with relevant systems processing over 16,000 flights and 150 GB of data daily, significantly improving safety supervision efficiency. Turgut et al. [3], in their 25-year thematic review, further examined the development of QAR data analysis from the three dimensions of safety, efficiency, and health management, emphasizing that data-driven methods are shifting from passive response to active prevention and from single-parameter monitoring to multi-source fusion intelligent assessment. Additionally, Yang et al. [4] provided a comprehensive review of flight safety state assessment methods based on time-series big data, further highlighting the role of QAR in dynamic risk evaluation. He [5] further summarized the application and research progress of QAR data in civil aviation.
Although existing studies have made significant progress, several deficiencies remain: first, traditional threshold monitoring methods struggle to capture complex nonlinear temporal patterns and multi-parameter interactions; second, most machine learning methods have weak interpretability and cannot meet the strict requirements of aviation safety regulators for model transparency and causal analysis; third, research on dynamic risk quantification for high-risk phases such as landing and takeoff is relatively fragmented and lacks a systematic statistical learning framework; fourth, model generalization capability across different aircraft types and airports is insufficient, posing challenges for practical engineering deployment. These issues limit the broader use of QAR data for data-driven aviation safety assessment and operational decision support.
This review treats QAR data as a representative type of onboard aviation operational data. By organizing existing studies on QAR-based anomaly detection, risk warning, probabilistic reasoning, and interpretable machine learning, the paper connects flight safety research with the broader theme of applying data science to aviation. The goal is not only to summarize individual algorithms, but also to clarify how QAR data can be transformed into safety indicators, warning signals, and decision-support information for operational aviation environments.
This review addresses key gaps by providing (1) a transparent systematic methodology, (2) critical comparisons of methods with performance metrics, (3) clear distinctions between QAR, FOQA, FDM, and FDR, and (4) a concrete QAR-specific research roadmap, thereby offering both synthesis and original scholarly contribution.
2. Review Methodology
This systematic review follows the PRISMA guidelines to ensure transparency and reproducibility. We searched Web of Science, Scopus, IEEE Xplore, CNKI, and Google Scholar from 2014 to 2026 using the keywords: (“QAR data” OR “Quick Access Recorder”) AND (“anomaly detection” OR “risk warning” OR “flight safety” OR “statistical learning” OR “machine learning”).
Inclusion criteria: Peer-reviewed articles focusing on QAR data for flight anomaly detection or risk warning with statistical or machine learning methods and empirical results. Exclusion criteria: Studies using only non-QAR data, purely descriptive papers without methodological contribution, or pre-2014 works.
The initial search yielded 187 records. After removing duplicates and title/abstract screening, approximately 112 records remained for further evaluation, of which 68 full texts were assessed for eligibility. This resulted in 42 included studies. Snowballing and inclusion of recent publications led to the synthesis of approximately 35 key studies, of which 26 are directly cited in the reference list. A discrepancy between the number of studies assessed (35) and those directly cited (26) arises because some retrieved articles only marginally referenced QAR data or lacked sufficient methodological depth for detailed synthesis, and were therefore used for background support rather than core citation. Data extraction focused on methodologies, datasets, performance metrics, limitations, and applications. This structured approach significantly improves transparency and comprehensiveness compared to previous non-systematic reviews.
To clarify the relationships among key flight data concepts frequently mentioned in the literature, a comparative summary is provided in Table 1 and the overall screening process of the systematic review is illustrated in Figure 1.
Table 1.
Comparison of Key Flight Data Concepts.
Figure 1.
PRISMA flow diagram of the systematic review process.
3. Characteristics of QAR Data and Statistical Preprocessing
QAR (Quick Access Recorder) data serves as the core data source for flight safety assessment in modern civil aviation aircraft. QAR data typically records 200–1000+ parameters at sampling frequencies of 1–8 Hz, including flight dynamics (pitch, roll, airspeed, vertical acceleration), engine parameters (N1, EGT, fuel flow), control inputs, and environmental conditions. A typical flight generates 50–500 MB of raw data. Compared with traditional black box data, QAR features higher sampling frequencies and larger data volumes, enabling real-time recording of hundreds or even thousands of flight parameters and providing a solid foundation for data-driven risk assessment. However, QAR data also exhibits significant statistical complexity, posing high requirements for preprocessing techniques. This section reviews the main statistical characteristics of QAR data and commonly used preprocessing methods.
3.1. Statistical Characteristics of QAR Data
QAR data is essentially typical high-dimensional, multi-source time-series big data with the following main statistical characteristics:
First, it has multi-source heterogeneity. QAR data originates from multiple aircraft subsystems, including flight control systems, engine monitoring systems, environmental control systems, and crew operation records. Parameters differ significantly in physical meaning, dimensions, and sampling frequencies. For example, attitude parameters (such as pitch angle PITCH and roll angle ROLL) have relatively high sampling frequencies, while some engine parameters (such as fuel flow FF) have lower frequencies. This heterogeneity makes data fusion difficult and requires complex alignment and standardization processes Dang et al. [1]; Zhang Heng [2].
Second, it has strong temporal dependence. Flight is a continuous dynamic evolution process, and QAR data exhibits strong temporal correlation and non-stationarity. Parameters at adjacent time points are highly correlated, and statistical distributions differ significantly across flight phases (takeoff, cruise, approach, and landing). This strong temporal characteristic limits the applicability of traditional statistical methods based on the independent and identically distributed (i.i.d.) assumption, making functional data analysis (FDA) and recurrent neural networks more advantageous for temporal modeling Rong et al. [6]; Li et al. [7].
Third, it has missing values and noise issues. Due to sensor failures, transmission interference, or decoding errors, missing values and noise are common in QAR data. Some parameters may be completely missing during specific flight phases, and noise can significantly affect trajectory calculation and risk quantification accuracy. For example, during the landing phase, trajectory data often exhibits local deviations due to GPS signal interference or sensor drift, requiring specialized correction methods Li et al. [7]; Tang et al. [8].
Fourth, it has severe class imbalance. In massive QAR datasets, normal flight data overwhelmingly dominate, while abnormal or high-risk events (such as hard landing and runway overrun) are extremely sparse. Dang et al. [1] showed that the proportion of abnormal samples in the approach phase is only about 22%, with a highly uneven distribution across anomaly types (e.g., ILS glideslope deviation accounting for up to 42%). This imbalance easily causes models to bias toward the majority class, severely affecting anomaly detection performance Dang et al. [1]; Wang Lei et al. [9].
These statistical characteristics determine that QAR data preprocessing is a fundamental step for subsequent modeling and analysis, directly affecting model accuracy and reliability.
3.2. Statistical Preprocessing Methods
To address the characteristics of QAR data in Section 3.1, researchers have developed various statistical preprocessing techniques, primarily including missing value imputation, downsampling, trajectory correction, feature engineering, and imbalanced data handling.
3.2.1. Missing Value Imputation
Missing value imputation is the first step in QAR data cleaning. Common methods include mean/median imputation, K-nearest neighbors (KNN) interpolation, multiple imputation, and expectation-maximization (EM) algorithms based on time series. Dang et al. [1] adopted a nearest-neighbor approach in the MAD-XFP framework to supplement missing values while effectively maintaining temporal continuity. For long-period missing segments, phased imputation strategies combining flight phase information can be used.
3.2.2. Downsampling and Smoothing
The original sampling rate of QAR data is high (some parameters reach 8 Hz or higher), and direct processing would incur enormous computational costs. Common methods include uniform downsampling, sliding window averaging, and exponentially weighted moving average (EWMA). Rong et al. [6] applied 1 Hz downsampling in their VAE-LSTM model, which preserved key temporal information while significantly reducing computational complexity. Smoothing can effectively suppress noise and improve the stability of subsequent clustering and modeling.
3.2.3. Trajectory Correction
Trajectory data is a critical input for landing and runway risk assessment, but QAR trajectories often contain noise and deviations. Li et al. [7] proposed a projection combined with ground speed correction method: first projecting the trajectory onto the runway centerline and then calibrating adjacent trajectory points using post-touchdown ground speed information. This effectively eliminates lateral offsets and distance fluctuations. The method significantly improved positioning accuracy relative to the runway in real A320 QAR datasets, laying a foundation for dynamic risk curve construction (Li et al. [7]; Tang et al. [8].
3.2.4. Feature Engineering
Feature engineering is key to improving model performance. Common operations include parameter derivation (e.g., calculating crosswind/headwind components), statistical feature extraction (mean, variance, kurtosis, trend slope), temporal window features, and domain-knowledge-driven composite indicators (e.g., 50 ft kinetic energy, remaining runway length). Dang et al. [1] significantly improved XGBoost performance in multi-type anomaly detection through systematic feature engineering. For functional data characteristics, functional principal component analysis (FPCA) can also be used for dimensionality reduction Li X et al. [10].
3.2.5. Imbalanced Data Handling
To address the sparsity of abnormal samples, oversampling techniques such as SMOTE and its variants are commonly used. Dang et al. [1] adopted Borderline SMOTE, synthesizing only borderline minority class samples and effectively alleviating class imbalance while avoiding excessive generalization. Other methods include undersampling, class weight adjustment in ensemble learning, and generating synthetic abnormal samples using generative adversarial networks (GAN).
Through the preprocessing pipeline in Section 3.1, the quality and usability of QAR data are significantly improved, providing reliable inputs for subsequent statistical modeling and risk assessment. It should be noted that the selection of preprocessing methods should be optimized according to specific application scenarios and data characteristics, and combinations of different methods often yield better results.
To better illustrate these key characteristics and corresponding preprocessing techniques, we summarize them in Table 2.
Table 2.
Summary of QAR Data Characteristics and Preprocessing.
4. Core Methods for Flight Anomaly Detection
To provide an overview of the analytical pipeline before delving into specific methods, Figure 2 illustrates the conceptual framework of the QAR-based risk warning system. This framework outlines the end-to-end process from raw data to actionable insights, highlighting the central role of various statistical and machine learning approaches discussed in this section.
Figure 2.
Conceptual framework of the QAR-based risk warning system.
The diagram shows the sequential data flow from raw QAR records through preprocessing and core analytical methods to risk quantification and decision support outputs.
4.1. Statistical Monitoring and Rule-Based Methods
Traditional statistical methods play a fundamental and irreplaceable role in QAR data-driven flight safety assessment. These methods are centered on probability theory, statistical inference, and causal modeling. They offer strong interpretability, uncertainty quantification capabilities, and regulatory compliance, making them particularly suitable for the strict requirements of aviation safety regarding model transparency and decision reliability.
In the early stages of QAR data application, researchers widely adopted Statistical Process Control (SPC) techniques to monitor key flight parameters in real time. By constructing Shewhart control charts, Cumulative Sum (CUSUM) control charts, or Exponentially Weighted Moving Average (EWMA) control charts, researchers can effectively identify abnormal situations where parameters deviate from normal ranges. For example, when monitoring landing vertical load or descent rate, the Shewhart control chart sets upper and lower control limits based on the mean and standard deviation; parameters exceeding these limits immediately trigger alerts. This method is computationally simple and intuitive, and was widely used in early Flight Operations Quality Assurance (FOQA) systems, providing a reliable tool for quickly detecting obvious exceedance events. However, traditional SPC assumes that the data are independent and identically distributed (i.i.d.), which conflicts with the strong temporal dependence and multi-parameter interactions inherent in QAR data, resulting in limited sensitivity to slow drifts or complex pattern changes.
To overcome this limitation, change-point detection methods were introduced into QAR data analysis. These methods can identify moments when statistical characteristics change during flight, thereby more accurately capturing the starting points of abnormal events. Gao Yang and Wang Xiangzhang [11] proposed the SPA–Markov method, which combines Set Pair Analysis with Markov chains to construct a framework for flight safety situation assessment and prediction. This method first converts key QAR parameters into identity–discrepancy–contrariety (IDC) measures and then uses a Markov transition probability matrix to achieve dynamic prediction of safety situations. In practical applications, this method can handle uncertainty and dynamic evolution in QAR data and has been applied to real-time flight safety situation assessment.
Among statistical and probabilistic methods, Bayesian networks are widely used for causal modeling and risk probability reasoning. They represent conditional dependencies between variables through directed acyclic graphs (DAGs) and use Bayes’ theorem to combine prior knowledge with data likelihood for posterior probability updating, making them particularly suitable for complex scenarios involving multi-factor interactions in aviation safety. Barry [12] constructed a runway veer-off risk assessment model based on QAR flight data using Bayesian networks. The model systematically incorporates factors such as runway length, wind speed and direction, crew operations, aircraft performance, and airport environment, quantifying their interactive effects through conditional probability tables. It not only provides the probability distribution of risk occurrence but also offers clear causal paths, providing interpretable support for regulatory decision-making and procedure optimization. Similarly, Chen Fang et al. [13] used dynamic Bayesian networks (DBN) to assess safety risks of civil aviation airborne shutdown events. By introducing temporal dependency arcs, they achieved dynamic updating of risk probabilities as flight phases and operations change, and validated the model’s effectiveness on real QAR datasets. The prominent advantages of Bayesian methods lie in their ability to effectively incorporate domain experts’ prior knowledge, quantify uncertainty, and support causal reasoning. However, network structure construction often heavily relies on expert experience, and exact inference faces computational bottlenecks in large-scale high-dimensional QAR data, prompting researchers to continuously explore improvements in approximate inference and structure learning algorithms.
Association rule mining is another important tool in traditional statistical methods for discovering hidden multi-parameter relationships in QAR data. Wang Lei et al. [14] applied association rules to analyze QAR landing exceedance events, successfully mining strong association patterns such as “excessive touchdown distance combined with high touchdown speed leading to insufficient autobrake deceleration.” They quantified rule strength using support, confidence, and lift metrics, providing a solid data-driven foundation for constructing risk warning rule bases. Compared with machine learning black-box models, the “If-Then” form of association rules offers extremely high interpretability, making it easy for pilots and safety managers to understand and apply, and playing an important role in actual FOQA rule optimization. However, this method is sensitive to parameter discretization and has difficulty directly handling the dynamic characteristics of continuous time-series data, usually requiring combination with other temporal analysis methods to achieve maximum effectiveness.
Overall, the main advantages of traditional statistical methods are their strong interpretability—model outputs such as probability values, control limits, and association rules are intuitive and convenient for regulatory compliance and human decision-making. They also possess strong uncertainty quantification capabilities, with Bayesian frameworks providing posterior distributions and confidence intervals to support scientific risk decisions; additionally, they have high computational efficiency and are suitable for real-time or near-real-time monitoring scenarios, playing a key role in early QAR data applications. However, these methods also have obvious limitations: their ability to capture complex nonlinear relationships and high-dimensional temporal features is relatively insufficient; they have high requirements for data quality and their performance easily degrades when noise, missing values, or complex parameter interactions are severe; and they have difficulty automatically handling multi-type composite abnormal events, often requiring considerable manual intervention and domain knowledge support Wang Lei et al. [14]; Barry, 2021 [12]; Chen Fang et al. [13]. These limitations have also provided important impetus for the emergence and development of subsequent clustering, unsupervised anomaly detection, and hybrid learning methods.
Despite the aforementioned limitations, traditional statistical methods still lay a solid statistical foundation for QAR data safety assessment and serve as important cornerstones for various advanced methods. In practical applications, researchers usually adopt a hybrid strategy of “statistical methods providing the framework and probability foundation + machine learning enhancing feature extraction and prediction accuracy” to fully leverage the advantages of each Dang et al. [1]; Li et al. [7]. This hybrid approach not only improves overall model performance but also provides methodological support for constructing interpretable and trustworthy flight safety state assessment systems. Through systematic review of traditional statistical methods, we can better understand the technological evolution of QAR data analysis and lay the foundation for discussions of clustering, unsupervised detection, Bayesian probabilistic reasoning, and hybrid emerging methods in subsequent chapters.
As shown in Table 3, traditional statistical methods demonstrate significant advantages in interpretability and causal analysis. Their outputs, such as probability distributions, control limits, and association rules, are intuitive and transparent, which aligns well with the stringent requirements of aviation regulatory authorities for model explainability and decision traceability. However, these methods have relatively limited capability in capturing complex high-dimensional nonlinear temporal features and multi-parameter interactions inherent in QAR data. This limitation provides important complementary space for subsequent unsupervised clustering and hybrid learning methods, which can effectively discover hidden patterns and enhance predictive power while building upon the solid probabilistic and causal foundation established by traditional statistical approaches. For example, traditional Statistical Process Control (SPC) methods, widely used in early FOQA systems, offer high interpretability and low computational complexity for single-parameter exceedance monitoring. However, they have limited capability in capturing complex temporal interactions and multi-parameter relationships. Association rule mining Wang Lei et al. [14] provides intuitive “If-Then” rules with strong support, confidence, and lift metrics for landing exceedance analysis, but requires discretization and struggles with continuous time-series data. Bayesian networks Barry, 2021 [12]; Chen Fang et al. [13] excel in causal reasoning and uncertainty quantification, yet structure learning in large-scale QAR data remains challenging and often relies heavily on expert knowledge.
Table 3.
Comparison of Traditional Statistical Methods in QAR Data Applications.
4.2. Clustering and Unsupervised Anomaly Detection
Clustering and unsupervised anomaly detection methods constitute the core technical pathway for addressing “abnormal sparsity” and “unknown pattern discovery” problems in QAR data analysis. Unlike supervised methods, these approaches do not require large numbers of labeled samples. Instead, they automatically mine low-probability clusters or outliers from massive normal flight data to achieve anomaly detection, operation mode identification, and early risk warning. In the field of aviation safety, where real abnormal events occur at extremely low frequencies, unsupervised methods have natural applicability. This section systematically reviews representative methods such as Gaussian Mixture Models (GMM), curve clustering, Dynamic Time Warping (DTW) and its variants, and VAE, and analyzes their application effects in QAR data.
In terms of Gaussian mixture models and classical clustering methods, the Gaussian mixture model is one of the classic benchmark methods in QAR anomaly detection. Li Lishuai et al. [15] proposed the ClusterAD framework, which models flight operation data as a mixture of multiple Gaussian distributions. Parameters are estimated through the Expectation-Maximization (EM) algorithm, and the posterior probability of each sample belonging to each cluster is calculated to identify abnormal points deviating from normal operation modes. This method achieved good results in flight safety monitoring and has become a comparison benchmark for many subsequent studies. The advantage of GMM lies in its ability to handle multi-modal distributions, provide soft clustering, and generate probabilistic outputs that facilitate subsequent risk quantification. However, it is sensitive to initial parameters; it easily encounters the curse of dimensionality in high-dimensional QAR data; and its assumption that data follow a Gaussian distribution may not fully match the actual non-Gaussian characteristics of flight parameters.
In terms of curve clustering and functional data analysis methods, many key parameters in QAR data (such as vertical acceleration, pitch angle, and roll angle) exhibit obvious curve shapes during the landing phase. Traditional point-based clustering methods struggle to capture their overall dynamic characteristics. Curve clustering methods based on functional data analysis (FDA) ideas have therefore developed rapidly. Li X et al. [10] proposed the CurveCluster+ algorithm, a representative work in this direction. The method treats multi-parameter curves during landing as functional data; it first applies functional principal component analysis (FPCA) for dimensionality reduction and then uses functional depth and hierarchical clustering to identify different hard landing modes. Unlike traditional threshold methods that only focus on vertical load at a single moment, CurveCluster+ can quantify morphological differences across the entire landing curve, automatically generate representative curve centers, and evaluate the risk level of each cluster. Experiments on real QAR datasets verified the method’s advantages in pattern recognition accuracy and interpretability, providing intuitive statistical tools for pilot training and risk warning Li X et al. [10]. This type of method reflects an important extension of statistical learning from “point data” to “functional data” and has unique value in handling the strong temporal and continuous dynamic characteristics of QAR data.
For DTW-based temporal trajectory clustering, flight trajectories are the most representative multivariate temporal features in QAR data. Traditional Euclidean distance has difficulty handling trajectories of varying lengths and local deformations, making Dynamic Time Warping and its accelerated versions the mainstream solution. In their noise prediction study using QAR data from Changsha Huanghua International Airport terminal area, Tang et al. [8] adopted Fast-DTW combined with hierarchical clustering for trajectory modeling: first performing coarse classification of corridor entrances based on heading angle, and then using normalized Fast-DTW to measure 3D trajectory similarity and generate multiple representative trajectories along with their occurrence probabilities. For missing operational parameters (such as thrust) in clustered trajectories, machine learning models were further constructed for completion, ultimately achieving high-fidelity noise prediction. This study fully demonstrated the statistical value of probabilistic distribution modeling and temporal similarity measures in QAR data processing Tang et al. [8]. Zheng Lei et al. [16] also performed clustering on multivariate QAR time-series data based on DTW distance, identifying flight operation modes at different risk levels and revealing their associations with safety events through statistical analysis. Fast-DTW significantly reduces computational complexity while maintaining high accuracy, making it suitable for large-scale QAR trajectory datasets.
With the development of deep learning, reconstruction-based unsupervised anomaly detection methods have been widely applied in the QAR field. Rong Chuitian et al. [6] proposed a VAE-LSTM model combined with the multi-head self-attention mechanism. The model first uses a variational autoencoder (VAE) to learn low-dimensional probabilistic representations of normal flight data, then employs LSTM to capture long-term temporal dependencies, and finally uses reconstruction error as the anomaly score. This method performs well on real QAR datasets for various abnormal events and is particularly suitable for capturing local mutations and global trend deviations. Dang et al. [1] combined unsupervised ideas with supervised learning in the MAD-XFP framework, further improving joint detection capability for multi-type anomalies through clustering-assisted feature selection and abnormal sample generation.
The main advantages of clustering and unsupervised anomaly detection methods include their unsupervised nature: they do not require large amounts of labeling and are suitable for the reality of sparse anomalies in QAR data; strong pattern discovery capability: they can automatically identify unknown abnormal patterns and typical operation clusters, providing insightful discoveries for domain experts; and strong flexibility: they are easily combined with trajectory correction Li et al. [7], feature engineering, and probabilistic modeling Tang et al. [8] to form a complete analysis pipeline. However, these methods also have obvious limitations: their interpretability is relatively weak and usually requires subsequent statistical analysis or tools such as SHAP for supplementation; they are sensitive to noise and outliers, easily producing false clusters or being affected by initial conditions; and cluster number determination and threshold setting have certain subjectivity, with generalization capability across different aircraft types and airports needing improvement Li Lishuai et al. [15]; Zheng Lei et al. [16]. Current improvement directions for these problems include combining functional data analysis to enhance curve clustering accuracy Li X et al. [10], introducing probabilistic trajectory modeling to enhance robustness Tang et al. [8], and integrating interpretable AI techniques (such as attention mechanisms) to improve model transparency Rong et al. [6].
Overall, clustering and unsupervised methods serve as important bridges connecting traditional statistical methods with deep hybrid learning. In actual FOQA systems, a layered strategy of “unsupervised clustering for pattern discovery, statistical quantification of risk, supervised fine classification” is usually adopted to achieve efficient, accurate, and interpretable safety assessment Dang et al., 2025 [1]; Tang et al. [8].
As shown in Table 4, unsupervised methods offer distinctive advantages in pattern discovery. By automatically identifying unknown operational patterns and low-probability outliers from massive unlabeled QAR data, they are particularly well-suited to the reality of extremely sparse abnormal events in aviation safety. Nevertheless, these methods generally have relatively weak interpretability and lack direct risk quantification capabilities. Therefore, they must be effectively integrated with subsequent statistical quantification techniques, such as Bayesian probabilistic reasoning or dynamic risk curves, to transform discovered patterns into actionable risk warnings, thereby more effectively supporting practical flight safety applications. Gaussian Mixture Models (GMM) Li Lishuai et al. [15] provide probabilistic outputs and soft clustering suitable for flight operation anomaly detection, but are sensitive to initial parameters and suffer from the curse of dimensionality in high-dimensional QAR data. CurveCluster+ Li X et al. [10] demonstrates strong performance in capturing landing curve morphology and offers superior interpretability for hard landing pattern recognition compared to point-based threshold methods. DTW-based trajectory clustering Tang et al. [8] effectively handles variable-length time-series data with moderate computational complexity, while VAE-LSTM reconstruction approaches Rong et al. [6] show excellent capability in modeling long-term temporal dependencies, although they generally have higher computational demands and weaker interpretability.
Table 4.
Comparison of Clustering and Unsupervised Anomaly Detection Methods.
4.3. Bayesian Methods and Probabilistic Reasoning
Bayesian methods take probability theory and Bayes’ theorem as their core, performing posterior inference by combining prior knowledge with data likelihood. They possess natural advantages in handling uncertainty, causal relationships, and risk quantification. In QAR data analysis, methods such as Bayesian networks (BN), dynamic Bayesian networks (DBN), and Bayesian hierarchical models are widely used for risk probability reasoning, causal analysis, and situation assessment. They represent an important extension of traditional statistical methods toward complex system modeling.
Bayesian networks update the probability of each risk-related variable according to its conditional dependence on parent variables. This structure allows prior knowledge, observed QAR parameters, and expert-defined causal relationships to be combined in a transparent probabilistic framework. For example, Barry [12] used conditional probability tables to quantify multi-factor risks in runway veer-off risk assessment.
In terms of the application of static Bayesian networks in risk assessment, Bayesian networks represent conditional dependencies between variables through directed acyclic graphs (DAGs) and perform inference using joint probability distributions. Barry [12] constructed a runway veer-off risk assessment model based on QAR data. The model incorporates factors such as runway length, wind speed and direction, crew operations, aircraft performance, and airport environment into the network structure, quantifying the interactive effects of various factors through conditional probability tables. It ultimately outputs the occurrence probability of runway veer-off and key risk paths. This study not only provided quantitative risk probabilities but also identified major contributing factors through sensitivity analysis, offering interpretable decision support for airport safety management and procedure optimization Barry [12]. Similarly, Chen Fang et al. [13] constructed a Bayesian network-based safety risk assessment model for civil aviation airborne shutdown events. By integrating engine parameters, flight attitude, and environmental data from QAR, they achieved multi-factor joint probability reasoning and validated the model’s prediction accuracy on real datasets. This method performs well in estimating probabilities of sparse events, compensating for the sample insufficiency limitation of traditional frequency statistics.
Static Bayesian networks have difficulty capturing the strong temporal characteristics of QAR data. Dynamic Bayesian networks address this limitation by extending the BN structure across time slices, thereby achieving dynamic evolution modeling of risk. Chen Fang et al. [13] further applied DBN to the dynamic risk assessment of airborne shutdown events. By introducing temporal dependency arcs, they realized real-time updating of risk probabilities as flight phases and operations change. This model demonstrates significant advantages in handling the uncertainty and dynamic interactions of QAR time-series data, providing a probabilistic foundation for early warning. Gao Yang and Wang Xiangzhang [11] proposed the SPA–Markov method, which combines Set Pair Analysis with Markov chains to construct a dynamic assessment and prediction framework for flight safety situations. The method converts QAR parameters into identity–discrepancy–contrariety measures and achieves situation evolution prediction through Markov transition probabilities, achieving good results in practical applications Gao et al. [11].
To further improve model performance, researchers often integrate Bayesian methods with other statistical techniques. Li et al. [7] incorporated Bayesian ideas to construct risk curves in their runway overrun dynamic risk model, quantifying risk levels under different autobrake settings through posterior probabilities. Wang Lei et al. [14] used the results of association rule mining as structural priors for Bayesian networks, achieving data-driven network learning and enhancing the model’s causal explanatory power. In addition, Bayesian hierarchical models show potential in handling hierarchical heterogeneity across multiple airports and aircraft types. They can simultaneously estimate global parameters and local effects, providing a unified framework for cross-scenario risk assessment.
The main advantages of Bayesian methods are reflected in their strong interpretability and causal analysis capabilities. They can clearly display relationships between variables through network structures and conditional probability tables, supporting “What-if” scenario simulations Barry [12]. They also provide uncertainty quantification through posterior distributions, confidence intervals, and risk probabilities, supporting decision risk analysis. Their dynamic modeling capability makes DBN and other extensions suitable for the strong temporal characteristics of QAR data Chen Fang et al. [13]. Bayesian methods can also incorporate prior knowledge, effectively utilizing domain expert experience to alleviate the sparse sample problem in QAR data.
However, this type of method also has limitations. The main ones are that Bayesian network structure learning is difficult; in large-scale high-dimensional QAR data, network structure search incurs huge computational costs and often requires expert intervention. Computational complexity is relatively high, and exact inference faces bottlenecks in complex networks, requiring approximate inference methods (such as variational inference and MCMC). The methods are sensitive to data quality, and noise and missing values can significantly affect the accuracy of probability estimation Gao et al. [11]; Dang et al. [1]. To address these issues, current research trends include combining Bayesian networks with machine learning (such as Bayesian hyperparameter optimization and Bayesian deep learning) and introducing interpretable AI techniques (such as SHAP) to enhance causal inference capabilities Dang et al. [1].
In summary, Bayesian and probabilistic reasoning methods provide a solid statistical foundation for QAR data-driven risk assessment and serve as a key bridge connecting traditional statistical methods with modern hybrid learning models. In actual FOQA applications, Bayesian methods are often combined with other techniques to form a comprehensive framework of “probabilistic reasoning + pattern recognition + interpretable prediction,” providing scientific decision support for aviation safety management.
4.4. Hybrid and Emerging Statistical Learning Methods
With the rapid development of artificial intelligence technology, hybrid and emerging statistical learning methods have become the mainstream trend in QAR data safety assessment. These methods combine the interpretability of traditional statistics with the powerful feature extraction capabilities of machine learning, forming a comprehensive framework of “statistical modeling + deep learning + interpretable AI.” They can effectively handle the high dimensionality, temporality, and class imbalance of QAR data. Representative works such as VAE-LSTM, XGBoost-enhanced frameworks, CurveCluster+ extensions, and SHAP interpretability techniques demonstrate particularly prominent advantages.
Rong Chuitian et al. [6] proposed a QAR anomaly detection model based on VAE-LSTM combined with a multi-head self-attention mechanism. The method first uses a variational autoencoder (VAE) to learn low-dimensional probabilistic distribution representations of normal flight data, then captures long-term temporal dependencies through LSTM, and finally introduces a multi-head self-attention mechanism to enhance focus on critical time steps and parameters. Anomalies are jointly judged through reconstruction error and attention weights. This model performs well on real QAR datasets for various abnormal events (such as attitude anomalies and speed deviations). The statistical highlight of this method lies in the organic integration of probabilistic generative models (VAE) and temporal modeling (LSTM), which not only preserves uncertainty quantification capability but also improves the capture of long-distance dependencies. Compared with pure statistical methods, it can automatically learn complex nonlinear features; compared with pure deep learning models, it provides more intuitive anomaly scoring mechanisms through reconstruction error Rong et al. [6].
The MAD-XFP framework proposed by Dang et al. [1] is a typical representative of hybrid methods. With XGBoost as the core, the framework systematically integrates feature engineering, Borderline SMOTE for imbalanced data handling, and Optuna for automatic hyperparameter optimization to achieve joint detection of multiple types of abnormal events during the approach phase. At the same time, SHAP (Shapley Additive exPlanations) values are introduced to calculate the contribution of each feature to abnormal events, automatically generating preliminary causal analysis reports distinguishing human factors from environmental factors. This framework achieved high-precision results on real QAR datasets and significantly outperformed single threshold methods and traditional machine learning models. Its statistical contributions include transforming domain knowledge into quantifiable indicators through feature engineering, effectively alleviating class imbalance using Borderline SMOTE, and providing strict statistical interpretability through SHAP to support regulatory compliance Dang et al. [1].
Li X et al. [10]’s CurveCluster+ algorithm further integrates statistical risk assessment on the basis of curve clustering. It extracts principal components and depth indicators of landing curves through functional data analysis and then combines Bayesian posterior probabilities to quantify the risk levels of each cluster. This hybrid method preserves the interpretability of curve morphology while achieving probabilistic output of risk, providing a complete solution for hard landing mode recognition. Tang et al. [8] combined Fast-DTW trajectory clustering with machine learning parameter completion, generating probabilistic representative trajectories and inputting them into a noise prediction engine, demonstrating the successful extension of clustering methods to environmental risk management.
In addition, the introduction of interpretable AI techniques in statistical learning is an important development trend of current hybrid methods. SHAP, LIME, and other methods are widely used to explain deep model outputs, compensating for the “black-box” deficiency. Dang et al. [1] achieved automatic causal analysis of abnormal events through SHAP, significantly improving the usability of models in aviation safety regulation. In the future, Bayesian networks can be incorporated as prior structures into deep learning frameworks to form “Bayesian deep learning” hybrid models, further enhancing uncertainty quantification and causal reasoning capabilities.
The main advantages of hybrid and emerging statistical learning methods lie in their strong feature extraction capability, which means deep learning components can automatically learn complex patterns in high-dimensional QAR time-series data; improved interpretability, which means tools such as SHAP provide statistical-level feature contribution explanations; good robustness, which means through imbalanced data handling and hyperparameter optimization, they adapt to the complex characteristics of real QAR data; and multi-task synergy, which means they can simultaneously achieve anomaly detection, risk quantification, and causal analysis Dang et al. [1]; Rong et al. [6]. Their limitations are mainly reflected in high computational resource requirements; increased model complexity may reduce generalization capability; and interpretability still requires validation by domain experts.
Overall, hybrid methods represent the development direction of QAR data safety assessment. In practical applications, it is recommended to adopt a complete technical chain of “unsupervised clustering for pattern discovery—Bayesian probabilistic quantification—hybrid model fine prediction—SHAP interpretable analysis” to achieve efficient, accurate, and trustworthy flight safety state assessment Tang et al. [8]; Li X et al. [10]; Dang et al. [1].
As shown in Table 5, these hybrid methods have significantly enhanced the overall performance of QAR data analysis by effectively integrating the interpretability of traditional statistical approaches with the powerful feature extraction and modeling capabilities of machine learning. This synergy not only improves prediction accuracy and robustness but also strengthens the models’ practical applicability and regulatory compliance, thereby providing a solid and powerful toolkit for subsequent real-world application scenarios in flight anomaly detection and risk warning. For instance, the MAD-XFP framework Dang et al. [1] demonstrates strong performance in multi-type anomaly detection on real QAR datasets, achieving high precision through XGBoost and providing interpretability via SHAP values. Similarly, VAE-LSTM Rong et al. [6] shows excellent capability in capturing long-term temporal dependencies, although it requires higher computational resources. CurveCluster+ Li X et al. [10] offers superior morphological pattern recognition for hard landing events compared to traditional threshold methods.
Table 5.
Comparison of Hybrid and Emerging Statistical Learning Methods.
5. Typical Application Scenarios
QAR data-driven safety assessment methods have been practically applied in multiple high-risk flight scenarios. This chapter focuses on the landing phase (the most critical high-risk area), takeoff phase, and other typical scenarios. It analyzes the synergistic effects, performance, and engineering value of representative methods, highlighting the practical deployment capabilities of statistical learning in real operations.
5.1. Risk Warning in the Landing Phase
The landing phase accounts for only about 1% of total flight time, yet it has an accident rate as high as 24%, making it the top priority in civil aviation safety management. The application of QAR data in landing risk warning is the most mature, primarily focusing on typical events such as hard landing, runway overrun, long landing, and high-plateau approach.
In terms of runway overrun risk assessment, Li et al. [7] proposed a dynamic runway overrun risk assessment model based on real QAR data from a certain airline’s A320 fleet. The model first corrects the landing trajectory using a projection combined with a ground speed correction method to address noise and offset issues in QAR data. It then designs an algorithm to automatically identify autobrake levels and constructs a dynamic risk curve with remaining runway length as the horizontal axis and touchdown speed as the vertical axis. The area under the curve is defined as the high-risk zone, and the distance from sample points to the curve is quantified as the risk indicator. Experimental results show that automatic deceleration rate, touchdown distance, and kinetic energy at 50 ft are the key statistical factors for runway overrun risk. The model effectively identifies high-risk flights on real datasets and significantly outperforms traditional static threshold methods Li et al. [7]. Wang Lei et al. [14] further applied association rule mining to QAR landing exceedance events, revealing hidden multi-parameter relationships and providing a data-driven foundation for constructing risk warning rule bases.
For hard landing pattern recognition and risk quantification, the CurveCluster+ algorithm proposed by Li X et al. [10] is a representative work. The method treats parameters such as vertical acceleration and pitch angle during landing as functional data. It uses functional principal component analysis and curve clustering to identify landing patterns at different risk levels and quantifies the risk of each pattern. Compared with single-parameter threshold methods, this approach can capture morphological differences across the entire landing curve and provides interpretable cluster center curves, offering intuitive statistical tools for pilot training and risk warning Li X et al. [10]. Zhang Chaohui [17] combined risk coupling theory to construct a hard landing risk analysis model based on QAR data, achieving comprehensive risk quantification through coupling metrics of multi-factor interactions. These studies collectively demonstrate that functional data analysis and statistical clustering have significant advantages in landing curve pattern recognition.
High-plateau airports face higher landing risks due to high altitude, low air density, and complex meteorological conditions. Chen Nongtian et al. [18] proposed a risk assessment method for civil aircraft high-plateau approaches and landings based on QAR data. They used statistical modeling to quantify the effects of approach speed, descent rate, wind shear, and other factors, constructing a comprehensive risk indicator system suitable for high-plateau environments. This study provides important data support for safe operations at plateau airports. Wang Lei et al. [14] conducted an earlier systematic analysis of QAR data applications in preventing landing incidents, emphasizing the value of real-time data monitoring for early intervention. These works have formed a complete chain from single-event monitoring to multi-factor dynamic risk assessment.
Table 6 clearly illustrates the focus and complementarity of different methods in landing risk assessment. Traditional statistical methods and association rules excel in interpretability and rule extraction: curve clustering methods demonstrate unique advantages in capturing morphological features of landing curves, while hybrid approaches such as XGBoost + SHAP provide powerful capabilities in multi-type anomaly detection and automatic causal analysis. This complementarity allows researchers and practitioners to select or combine appropriate methods according to specific application requirements, ranging from regulatory-compliant rule generation to high-precision dynamic risk quantification, and thereby providing valuable and practical references for engineering applications in real-world flight safety management and risk warning systems.
Table 6.
Comparison of Typical Risk Assessment Methods in the Landing Phase.
5.2. Full-Flight Phase Anomaly Pattern Recognition
Although takeoff phase risk is lower than landing, events such as runway overrun can still cause serious consequences. Li C F et al. [19] focused on takeoff runway overrun risk, mining pilot behavioral characteristics from real flight data and constructing a human-factor-based risk assessment model. The model analyzes behavior patterns such as thrust setting, speed management, and decision timing, and quantifies the contribution of different behaviors to runway overrun risk through statistical modeling. It provides a scientific basis for pilot training and procedure optimization Li C F et al. [19]. This study forms a complementary relationship with the landing phase dynamic risk model, jointly demonstrating the consistency framework of QAR data in full-flight phase risk quantification.
5.3. Other Typical Application Scenarios
In multi-type anomaly detection and causal analysis, the MAD-XFP framework proposed by Dang et al. [1] targets multiple abnormal events during the approach phase (e.g., high descent rate, large roll angle, high/low approach speed) and achieves joint detection and automatic causal analysis. The framework combines feature engineering, Borderline SMOTE, and SHAP explanation techniques, achieving high-precision results on real QAR datasets and outputting preliminary causal reports distinguishing human factors from environmental factors Dang et al. [1]. Rong Chuitian et al. [6] demonstrated excellent performance in anomaly detection using their VAE-LSTM multi-head self-attention model, particularly suitable for capturing local mutations and global trend deviations.
In flight operation pattern recognition, Zheng Lei et al. [16] used DTW clustering on QAR data to identify operation modes at different risk levels and analyzed their associations with safety events, providing a pattern library for risk warning. Tang et al. [8] extended QAR trajectory clustering to airport noise prediction, generating probabilistic representative trajectories through Fast-DTW and completing operational parameters to achieve high-fidelity noise distribution prediction. This demonstrates the cross-domain application potential of QAR data in safety and environmental protection. Chen Fang et al. [13] used dynamic Bayesian networks to assess safety risks of civil aviation airborne shutdown events, achieving temporal dynamic probability reasoning. Similar pattern recognition approaches have also been explored in recent studies on abnormal flight pattern identification using QAR data (Wang [20]), and turbulence anomaly detection based on symbolic classifiers (Zhuang et al. [21]).
Beyond the core risk-warning scenarios, QAR data have also been applied to more specialized tasks, such as monitoring severe damage defects of brake heat packs (Jiao and Zhou [22]), analyzing signal quality of the instrument landing system (Dong [23]), diagnosing intermittent faults in the attitude and heading reference system (Li [24]), evaluating airline flight safety resilience (He [25]), and analyzing navigation station positioning errors (Gou [26]).
5.4. Method Synergistic Mechanisms and Comprehensive Evaluation
In actual FOQA systems, various methods usually form layered synergistic mechanisms: traditional statistical methods provide probabilistic foundations, clustering methods discover patterns, Bayesian methods perform causal reasoning, and hybrid learning methods achieve fine prediction and interpretable output. For example, in landing risk assessment, CurveCluster+ can first be used to identify patterns, followed by dynamic risk curves Li et al. [7] for risk quantification, and finally SHAP Dang et al. [1] for causal explanation.
Comprehensive evaluation shows that statistical learning methods have significant advantages in interpretability and practical engineering applicability, but still need to address issues such as real-time performance, cross-aircraft-type generalization, and small-sample problems. Future studies may further combine statistical modeling with AI-based feature learning to improve QAR-based safety assessment across different flight phases and operational scenarios.
6. Challenges and Future Directions
Although significant progress has been made in QAR data-driven flight safety state assessment methods, numerous challenges remain in practical deployment and large-scale application. This section summarizes the main challenges in current research and outlines future directions from the perspective of statistical learning.
6.1. Current Major Challenges
The first challenge is interpretability and regulatory compliance. Aviation safety regulators impose extremely high requirements on model transparency. Although hybrid methods dominated by deep learning achieve high accuracy, their “black-box” nature makes the decision-making process difficult to explain. While Dang et al. [1] introduced SHAP to improve interpretability, SHAP value computation incurs large overhead in high-dimensional QAR data and remains sensitive to noise. Traditional Bayesian networks Barry [12]; Chen Fang et al. [13] offer strong interpretability, but structure learning in large-scale networks is difficult and heavily relies on expert priors. Achieving “interpretable AI” while maintaining high accuracy remains a core challenge for statistical learning in aviation safety.
The second challenge concerns real-time performance and computational efficiency. QAR data requires high real-time capability, yet processing the high-dimensional time series involves enormous computational costs. Although Tang et al. [8]’s Fast-DTW clustering reduces complexity through acceleration algorithms, latency issues persist in high-traffic terminal areas. Deep models such as VAE-LSTM Rong et al. [6] consume excessive resources when deployed on edge devices. Balancing real-time risk warning with high-precision modeling is a major bottleneck for actual FOQA system deployment.
Third, insufficient cross-aircraft-type and cross-airport generalization capability and data quality and imbalance issues remain prominent. Most studies are based on single aircraft types (e.g., A320) or single airports, resulting in poor model generalization. Li et al. [7]’s dynamic risk curves require parameter recalibration under different runway conditions and meteorological environments. Although Chen Nongtian et al. [18]’s high-plateau model is optimized for specific scenarios, its performance declines when transferred to plain airports. Constructing robust domain-adaptive models is an important issue for statistical learning. Additionally, QAR data generally suffers from missing values, noise, and sparse labels. Even though Dang et al. [1] used Borderline SMOTE to alleviate imbalance, synthetic samples may introduce new noise. While trajectory correction Li et al. [7] is effective, its accuracy still needs improvement under complex meteorological conditions. The inconsistency in multi-source data fusion (QAR + ADS-B + meteorological data) further increases preprocessing difficulty.
Finally, causal inference and dynamic risk quantification are insufficient. Existing studies mostly remain at the correlation level, with limited true causal inference capability. Although Barry [12]’s Bayesian network provides causal paths, it struggles with time-varying interventions. Dynamic risk curves Li et al. [7] consider temporality but have limited modeling capability for complex intervention scenarios (e.g., temporary pilot decisions). How to integrate causal discovery with predictive modeling to support intervention-oriented risk analysis remains a major challenge.
6.2. Future Development Directions
Although QAR-based safety assessment has made substantial progress, several issues remain before these methods can be widely used in operational environments. Future research may focus on six directions: representation learning for QAR curve data, integration of causal inference with predictive modeling, multi-source data fusion and cross-domain adaptation, interpretable AI and human–machine decision support, extension to eVTOL and urban air mobility operations, and privacy-preserving collaborative learning. These directions are important for developing QAR-based safety assessment methods that are reliable, interpretable, and suitable for practical aviation applications.
First, functional data analysis can be combined with modern sequence-learning architectures to improve the representation of QAR curve data. For example, the CurveCluster+ approach proposed by Li X et al. [10] can be further developed into a pre-training and fine-tuning framework, in which large-scale normal QAR data are first used to learn general representations of flight-parameter curves, and task-specific risk data are then used to adapt the model to particular safety assessment problems. Such a framework may help capture the shape, phase-dependent evolution, and temporal variation in QAR curves, including landing-related patterns, while improving the transferability of models across different aircraft types, airports, and operational scenarios.
Second, the unified framework of causal inference and predictive modeling is another key direction. Deeply integrating Bayesian causal networks with deep predictive models to construct a “causal + predictive” hybrid architecture can simultaneously achieve risk prediction and intervention effect estimation. The SHAP method from Dang et al. [1] can serve as an important bridge for quantifying intervention effects through feature contribution analysis. Further introduction of structural causal models (SCM) and counterfactual reasoning techniques will better support “What-if” safety decision scenarios, such as simulating risk changes under different operational strategies, thereby providing a scientific basis for active prevention.
Third, multi-source heterogeneous data fusion and cross-domain adaptation capabilities urgently need enhancement. Future efforts should integrate diverse information such as QAR, ADS-B, meteorological data, air–ground voice communication, and maintenance records to build multi-modal fusion frameworks. Techniques such as domain adversarial training, transfer learning, and probabilistic trajectory modeling Tang et al. [8] can be utilized to improve model generalization across different aircraft types, airports, and high-plateau versus plain scenarios, thereby addressing the current limitation of most models being adapted only to “single aircraft type, single airport.”
In addition, the construction of interpretable AI and human–machine collaborative decision-making systems will become an important trend. A hybrid explanation system of “statistical interpretability + visualization” should be developed, organically combining SHAP values, attention mechanisms, and Bayesian posterior distribution visualization to provide pilots, air traffic controllers, and safety managers with intuitive risk profiles and decision recommendations. In this process, exploring human–machine collaborative frameworks is particularly critical: model outputs serve as auxiliary decision references, with final confirmation by human experts, forming an “AI assistance + human oversight” closed loop that preserves intelligent efficiency while ensuring safety and reliability.
With the growth of low-altitude and urban air mobility operations, safety assessment for new aircraft types such as eVTOL is becoming an emerging research direction. It is necessary to develop lightweight, real-time QAR-like data analysis methods tailored to the high maneuverability, dense urban airspace, and complex low-altitude environments of eVTOL. Existing mature landing risk models Li et al. [7]; Chen Nongtian et al. [18] can serve as foundations and be extended to risk assessment and warning systems for vertical takeoff and landing as well as urban air mobility (UAM) scenarios, providing technical support for safe low-altitude economic operations.
However, privacy protection and data sharing issues must not be overlooked. Future efforts should vigorously develop federated learning frameworks to achieve joint model training across airlines and institutions without sharing raw sensitive QAR data. At the same time, combining differential privacy and secure multi-party computation technologies can ensure the security and compliance of data flows, laying the foundation for large-scale collaborative research and industry-level safety platforms.
Finally, standardization and engineering implementation are key to transforming research results into practice. The formulation of industry standards for QAR data processing, model evaluation, and risk warning should be accelerated, along with the establishment of open-source benchmark datasets and unified evaluation frameworks. End-to-end FOQA intelligent platforms should be developed to encapsulate statistical learning methods as configurable modules, supporting rapid deployment, continuous optimization, and personalized customization, thereby truly achieving a closed loop from theoretical research to engineering practice.
Through in-depth exploration of the aforementioned directions, the deep integration of statistical learning and artificial intelligence is expected to build an intelligent safety assessment system that is “interpretable, real-time, and causally driven,” providing strong technical support for the construction of intelligent civil aviation and aviation safety governance.
6.3. Proposed Research Roadmap
To bridge current research gaps and accelerate the transition from theory to practice, we propose a phased research roadmap for QAR data-driven aviation safety systems.
In the short term (1–2 years), priority should be given to foundational infrastructure, including the establishment of standardized, publicly available QAR benchmark datasets with unified preprocessing pipelines. Researchers should also focus on integrating explainable AI techniques, particularly universal SHAP-based interpretation modules, into existing models to enhance regulatory acceptance and facilitate rapid validation.
In the medium term (2–4 years), efforts should shift toward developing hybrid architectures that combine Bayesian networks with deep learning models. These “Bayesian-Deep” frameworks would enable dynamic causal reasoning and support “what-if” scenario simulations for intervention evaluation. Concurrently, domain-adaptive transfer learning techniques should be explored to improve model generalization across different aircraft types, airports, and operational conditions.
In the long term (4 years and beyond), the focus will expand to emerging aviation paradigms. Existing landing risk and anomaly detection frameworks should be extended to electric vertical takeoff and landing (eVTOL) vehicles and urban air mobility (UAM) operations. To ensure robustness and practical applicability, future studies should conduct rigorous validation across diverse scenarios, including different aircraft types (e.g., narrow-body vs. wide-body), airports (high-plateau vs. plain), airlines with varying operational procedures, and multiple time periods (different seasons and years). Key performance metrics should include false alarm rate, anomaly detection success rate (e.g., precision, recall, F1-score), real-time processing time (latency), computational efficiency, and expert validation by pilots, safety officers, and regulators to assess the system’s clinical and operational value. To enable large-scale collaboration, privacy-preserving technologies such as federated learning and differential privacy should be adopted, allowing multiple airlines and institutions to jointly train models without sharing sensitive raw QAR data.
This phased roadmap provides a structured pathway toward building interpretable, real-time, and causally aware QAR-based safety assessment systems that meet both scientific and regulatory demands.
7. Conclusions
QAR data, as an important data foundation for civil aviation flight safety, has become a key enabler for the transformation from passive response to active prevention. This paper systematically reviews flight safety state assessment and risk warning methods based on QAR data from an applied statistics perspective. The study first analyzes the statistical characteristics of QAR data, including its high-dimensional temporality, multi-source heterogeneity, class imbalance, and sparse anomalies, and reviews corresponding preprocessing techniques. Second, following the methodological evolution logic, it categorically summarizes core assessment methods: traditional statistical methods (Bayesian networks, association rules, SPA–Markov) provide probabilistic foundations and causal inference; clustering and unsupervised anomaly detection (GMM, CurveCluster, Fast-DTW) enable pattern discovery; Bayesian and probabilistic reasoning methods strengthen dynamic risk quantification; and hybrid and emerging statistical learning methods (VAE-LSTM, MAD-XFP, XGBoost + SHAP) integrate multiple advantages to improve accuracy and interpretability. Then, focusing on high-risk scenarios such as landing and takeoff, it analyzes typical application cases and method synergistic mechanisms. Finally, it summarizes current challenges and proposes future development directions.
Statistical learning methods demonstrate unique advantages in QAR data analysis. Traditional statistical methods provide solid probabilistic foundations and interpretability; clustering methods achieve unknown pattern discovery; Bayesian methods strengthen causal reasoning; and hybrid learning methods organically integrate multiple techniques to form the current mainstream technical framework. The landing phase is the most mature high-risk scenario for QAR applications. Methods such as dynamic risk curves, curve clustering, and association rules exhibit strong effectiveness in runway overrun, hard landing, and high-plateau approach risk assessment, significantly outperforming traditional threshold monitoring. Interpretability, uncertainty quantification, and dynamic modeling are the core contributions of statistical learning. Techniques such as SHAP, Bayesian posterior probabilities, and functional data analysis effectively enhance the regulatory usability and decision support capability of models. Method synergy is the key to achieving engineering deployment. In actual FOQA systems, a layered framework of “unsupervised pattern discovery, statistical probability quantification, hybrid model fine prediction, and interpretable causal analysis” should be adopted.
Although existing research has achieved important progress, it still faces multiple challenges including interpretability, real-time performance, cross-domain generalization, data quality, and privacy protection. In the future, research should focus on directions such as deep integration of functional data analysis with large models, unified frameworks of causal inference and predictive modeling, multi-source heterogeneous data fusion, privacy computing technologies, and adaptation to low-altitude economy and eVTOL scenarios. Continuous innovation in statistical learning and artificial intelligence is expected to build a more intelligent, trustworthy, and efficient flight safety state assessment system, supporting more reliable, interpretable, and data-driven aviation safety management.
Author Contributions
Conceptualization, F.W. and Y.Z.; resources, F.W., Y.Z., Y.W., T.L., Z.W. and H.H.; writing—original draft preparation, F.W. and Y.Z.; writing—review and editing, F.W., Y.Z., Y.W., T.L., Z.W. and H.H.; supervision, F.W. All authors have read and agreed to the published version of the manuscript.
Funding
This work was partially supported by the Research on the Construction of Think Tank for Civil Aviation Major Emergency Transportation and National Defense Transport Safety Operation Assurance under grant No. YS2025001, Sichuan Provincial Engineering Research Center of Smart Operation and Maintenance of Civil Aviation Airports under grant No. JCZX2024ZZ16, and the Fundamental Research Funds for the Central Universities under grant Nos. 26CAFUC01008, 26CAFUC01010, 26CAFUC03048, 26CAFUC03077, 25CAFUC03036, 25CAFUC03037, and 25CAFUC09010.
Data Availability Statement
No new data were created or analyzed in this study. Data sharing is not applicable to this article.
Conflicts of Interest
The authors declare no conflicts of interest.
References
- Dang, X.; Hua, C.; Rong, C. Automated Anomaly Detection and Causal Analysis for Civil Aviation Using QAR Data. Appl. Sci. 2025, 15, 2250. [Google Scholar] [CrossRef] [Scilit]
- Zhang, H. A Review of the Research of Quick Access Recorder Data. AJST 2023, 5, 95–101. [Google Scholar] [CrossRef] [Scilit]
- Turgut, E.T.; Usanmaz, O.; Cavcar, A. A 25-Year Journey in Quick Access Recorder (QAR) Data: A Thematic Review. Prog. Aerosp. Sci. 2026, 162, 101204. [Google Scholar] [CrossRef] [Scilit]
- Yang, J.; Tang, D.Y.; Ma, Z.S.; Liu, B.; Gong, X.; Wen, Z.; Yu, J.; Lu, J.; Kang, R.; Han, D.; et al. A Review of Flight Safety State Assessment Methods Based on Time-Series Big Data. Acta Autom. Sin. 2026, in press. [Google Scholar] [CrossRef]
- He, G. Application and Research Progress of QAR Data. J. Civ. Aviat. Flight Univ. China 2024, 34, 164–166. [Google Scholar] [CrossRef]
- Rong, C.; OuYang, S.; Sun, H. Anomaly Detection in QAR Data Using VAE-LSTM with Multihead Self-Attention Mechanism. Mob. Inf. Syst. 2022, 2022, 8378187. [Google Scholar] [CrossRef] [Scilit]
- Li, X.; Zhang, L.; Shang, J.; Li, X.; Qian, Y.; Zheng, L. A Runway Overrun Risk Assessment Model for Civil Aircraft Based on Quick Access Recorder Data. Appl. Sci. 2023, 13, 9828. [Google Scholar] [CrossRef] [Scilit]
- Tang, Z.; Fan, Y.; Chen, X.; Shi, X.; Niu, Z.; Zhong, Y.; Jia, M.; Tang, X. Air Traffic Noise Prediction Method Based on Machine Learning Driven by Quick Access Recorder. Aerospace 2026, 13, 208. [Google Scholar] [CrossRef] [Scilit]
- Wang, L.; Zhang, N.; Gao, S. Landing Exceedance Risk Assessment Based on QAR Data and Association Rules. J. Beijing Univ. Aeronaut. Astronaut. 2025, 51, 1907–1915. [Google Scholar] [CrossRef]
- Li, X.; Shang, J.; Zheng, L.; Wang, Q.; Sun, H.; Qi, L. CurveCluster+: Curve Clustering for Hard Landing Pattern Recognition and Risk Evaluation Based on Flight Data. IEEE Trans. Intell. Transp. Syst. 2022, 23, 12811–12821. [Google Scholar] [CrossRef] [Scilit]
- Gao, Y.; Wang, X.Z. Research on Assessment and Prediction of Flight Safety Situation Based on SPA-Markov. J. Saf. Sci. Technol. 2016, 12, 87–91. [Google Scholar]
- Barry, D.J. Estimating Runway Veer-Off Risk Using a Bayesian Network with Flight Data. Transp. Res. Part C Emerg. Technol. 2021, 128, 103180. [Google Scholar] [CrossRef] [Scilit]
- Chen, F.; Cui, Q.M.; Xiang, Q.Q. Safety Risk Assessment of Civil Aviation Airborne Shutdown Events Based on Dynamic Bayesian Network. China Saf. Sci. J. 2023, 33, 16–23. [Google Scholar] [CrossRef]
- Wang, L.; Wu, C.; Sun, R. An Analysis of Flight Quick Access Recorder (QAR) Data and Its Applications in Preventing Landing Incidents. Reliab. Eng. Syst. Saf. 2014, 127, 86–96. [Google Scholar] [CrossRef] [Scilit]
- Li, L.; Hansman, R.J.; Palacios, R.; Welsch, R. Anomaly Detection via a Gaussian Mixture Model for Flight Operation and Safety Monitoring. Transp. Res. Part C Emerg. Technol. 2016, 64, 45–57. [Google Scholar] [CrossRef] [Scilit]
- Zheng, L.; Chi, H.; Shao, X.Y. Pattern Recognition and Risk Analysis for Flight Operations. Chin. J. Manag. Sci. 2017, 25, 109–118. [Google Scholar] [CrossRef]
- Zhang, C.H. Research on Hard Landing Risk Analysis Method Based on QAR Data and Risk Coupling Theory. Master’s Thesis, Civil Aviation University of China, Tianjin, China, 2024. [Google Scholar] [CrossRef]
- Chen, N.T.; Man, Y.Z.; Li, J.H. Risk Assessment Method for Civil Aircraft Approach and Landing at High Plateau Based on QAR Data. J. Beijing Univ. Aeronaut. Astronaut. 2024, 50, 77–85. [Google Scholar] [CrossRef]
- Li, C.F.; Sun, R.S.; Pan, X. Takeoff Runway Overrun Risk Assessment in Aviation Safety Based on Human Pilot Behavioral Characteristics from Real Flight Data. Saf. Sci. 2023, 158, 105992. [Google Scholar] [CrossRef] [Scilit]
- Wang, F.Y. Research on Abnormal Flight Pattern Recognition and Risk Evaluation Model of Civil Aircraft Based on QAR Data. Master’s Thesis, Civil Aviation University of China, Tianjin, China, 2023. [Google Scholar] [CrossRef]
- Zhuang, Z.; Lin, K.; Zhang, H.; Chan, P.-W. Detection of Turbulence Anomalies Using a Symbolic Classifier Algorithm in Airborne Quick Access Record (QAR) Data Analysis. Adv. Atmos. Sci. 2024, 41, 1438–1449. [Google Scholar] [CrossRef] [Scilit]
- Jiao, L.; Zhou, J.Z. Research on Method of Monitoring Severe Damage Defects of Brake Heat Pack Using A320S Aircraft QAR Wheel Speed Parameter Data. J. Civ. Aviat. Flight Univ. China 2024, 35, 43–47. [Google Scholar]
- Dong, L.Y. Signal Quality Analysis of Instrument Landing System Based on QAR Data. J. Civ. Aviat. 2025, 9, 76–81. [Google Scholar]
- Li, N. Analysis and Elimination of Intermittent Faults in Attitude and Heading Reference System Based on QAR Data. Electromech. Eng. Technol. 2024, 53, 297–300. [Google Scholar]
- He, P. Evaluation Method of Airline Flight Safety Resilience Based on QAR Data. J. Nanjing Univ. Aeronaut. Astronaut. (Nat. Sci. Ed.) 2025, 57, 1189–1199. [Google Scholar] [CrossRef]
- Gou, L.P. Analysis of Navigation Station Positioning Error Based on QAR Data. Aeronaut. Comput. Tech. 2024, 54, 94–99. [Google Scholar]
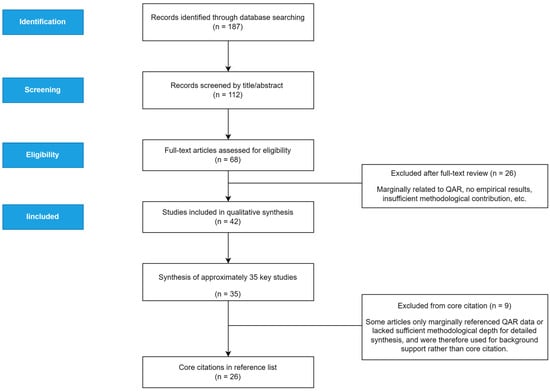
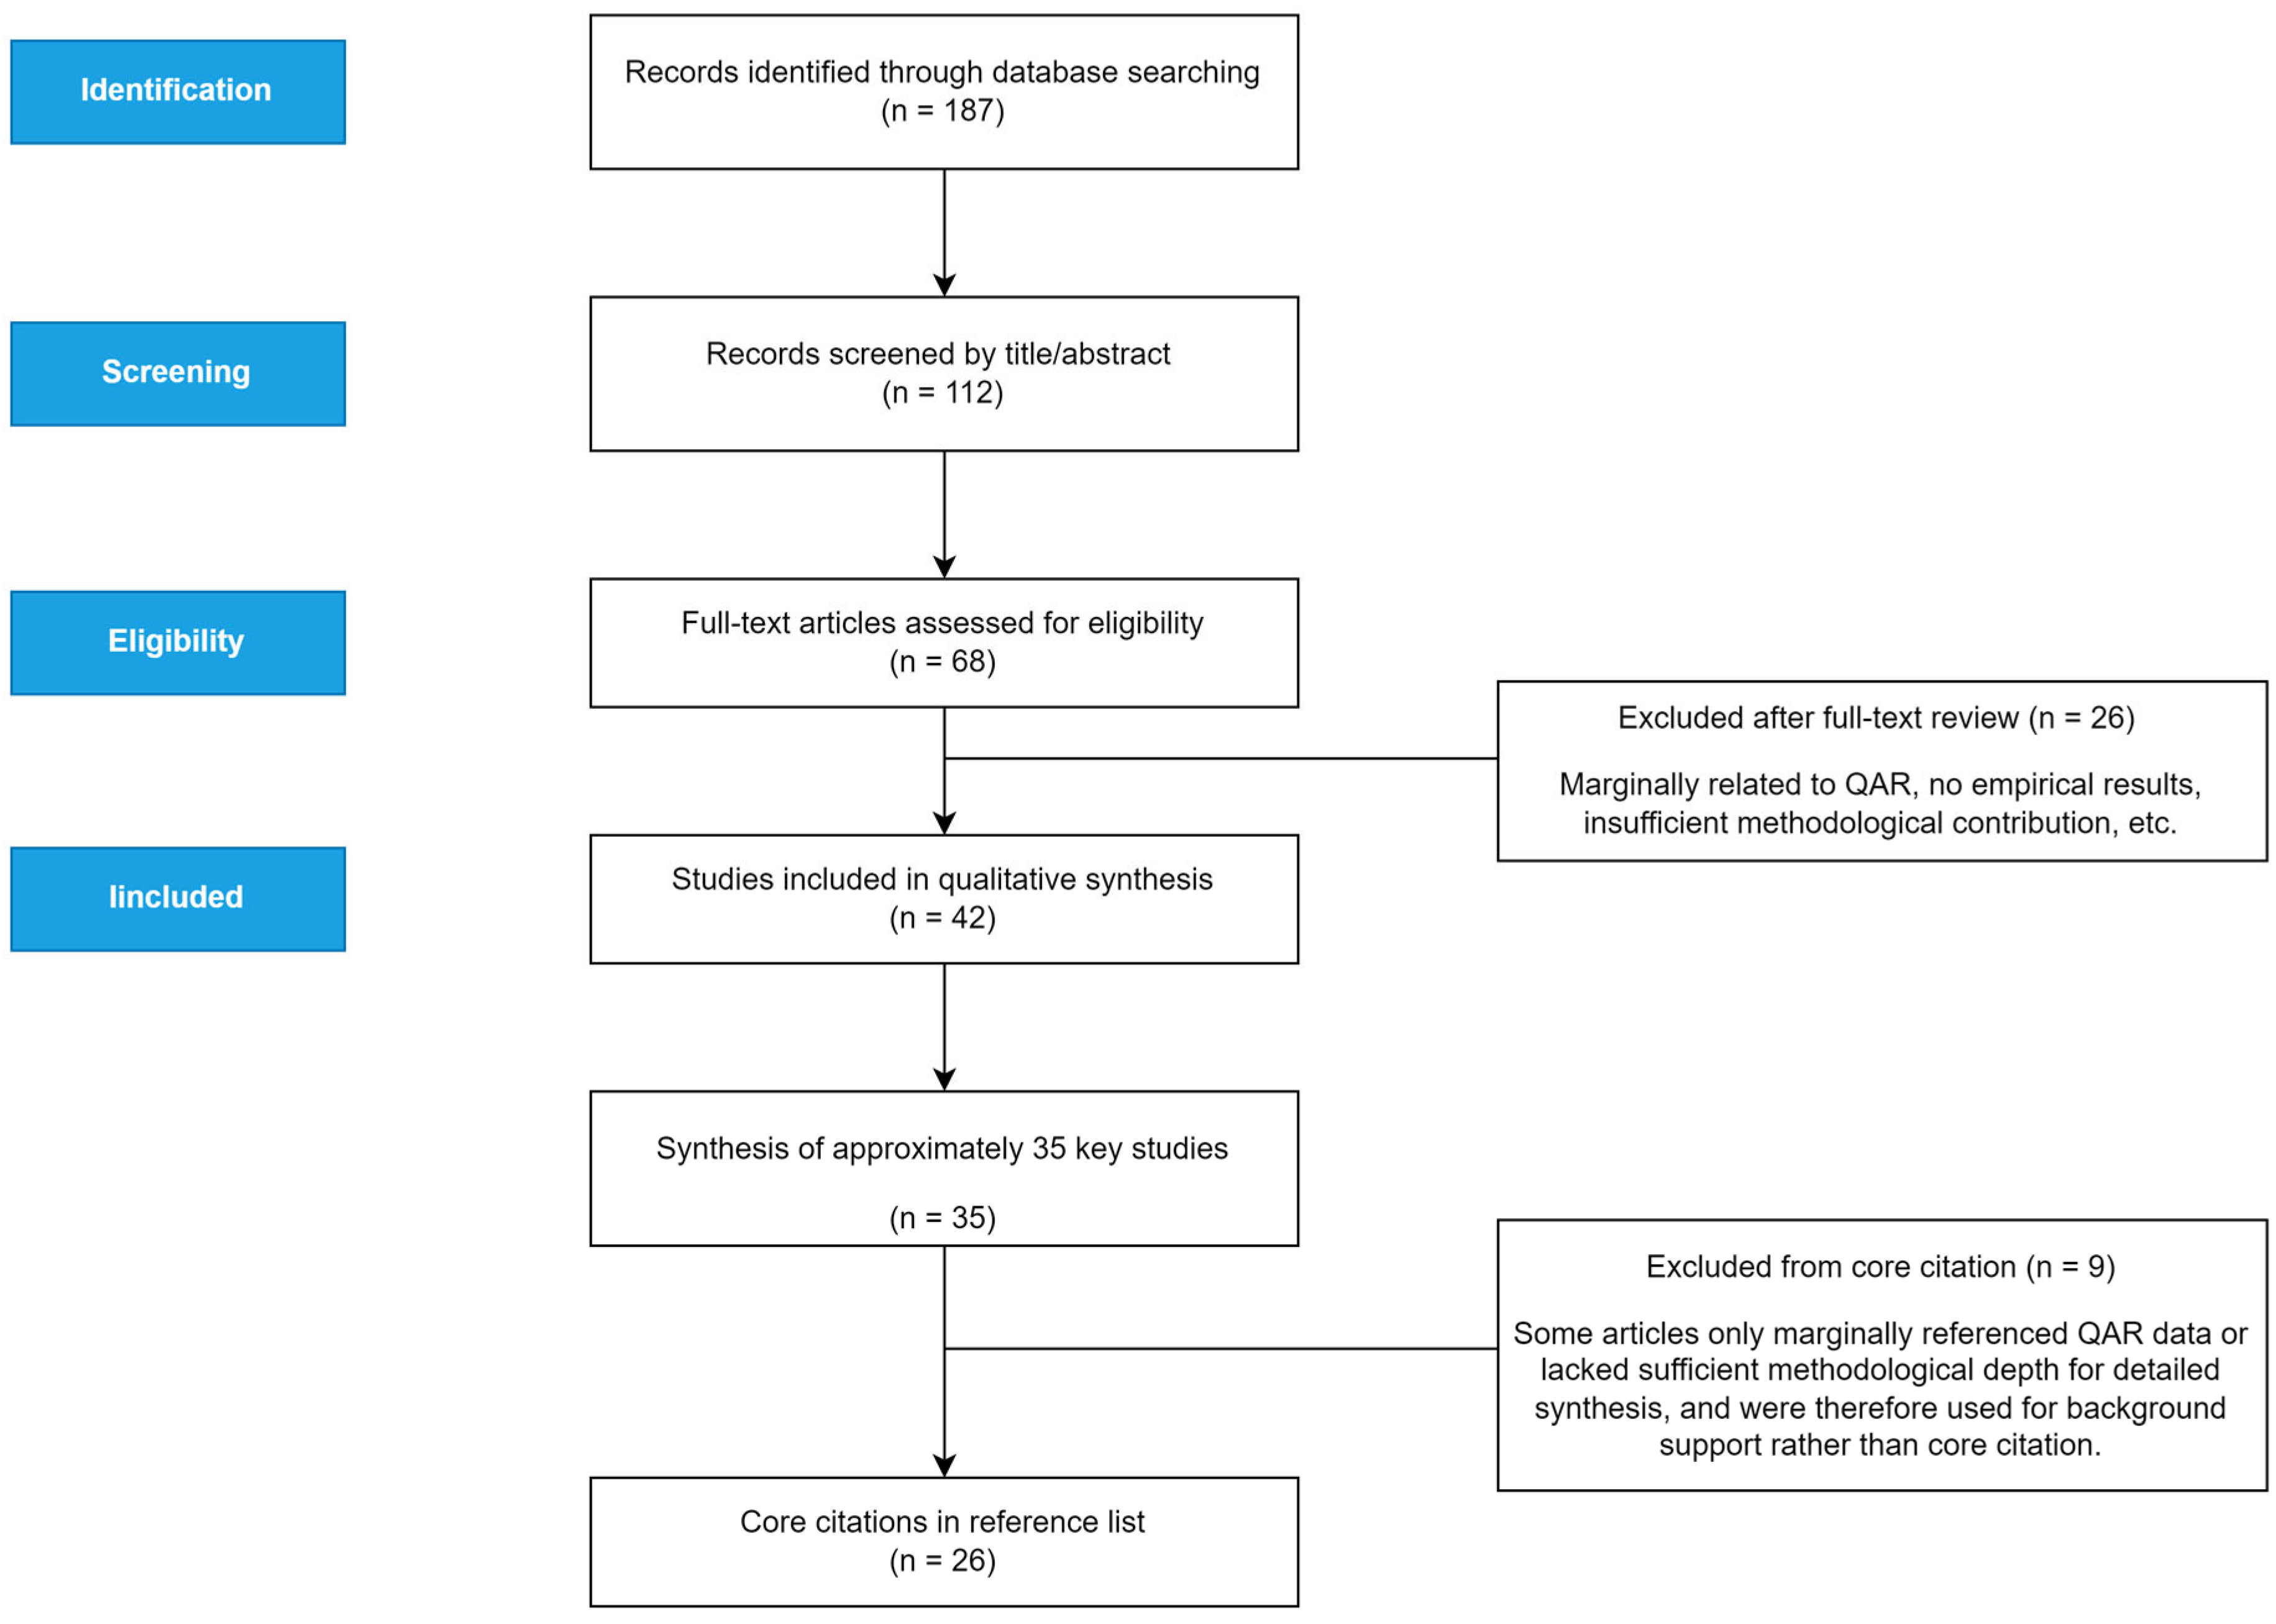
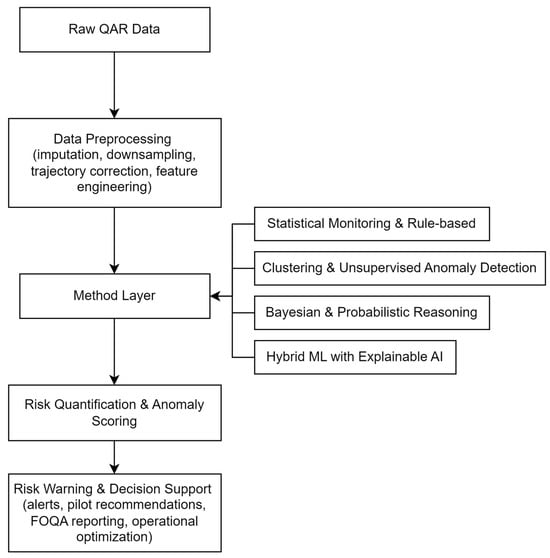
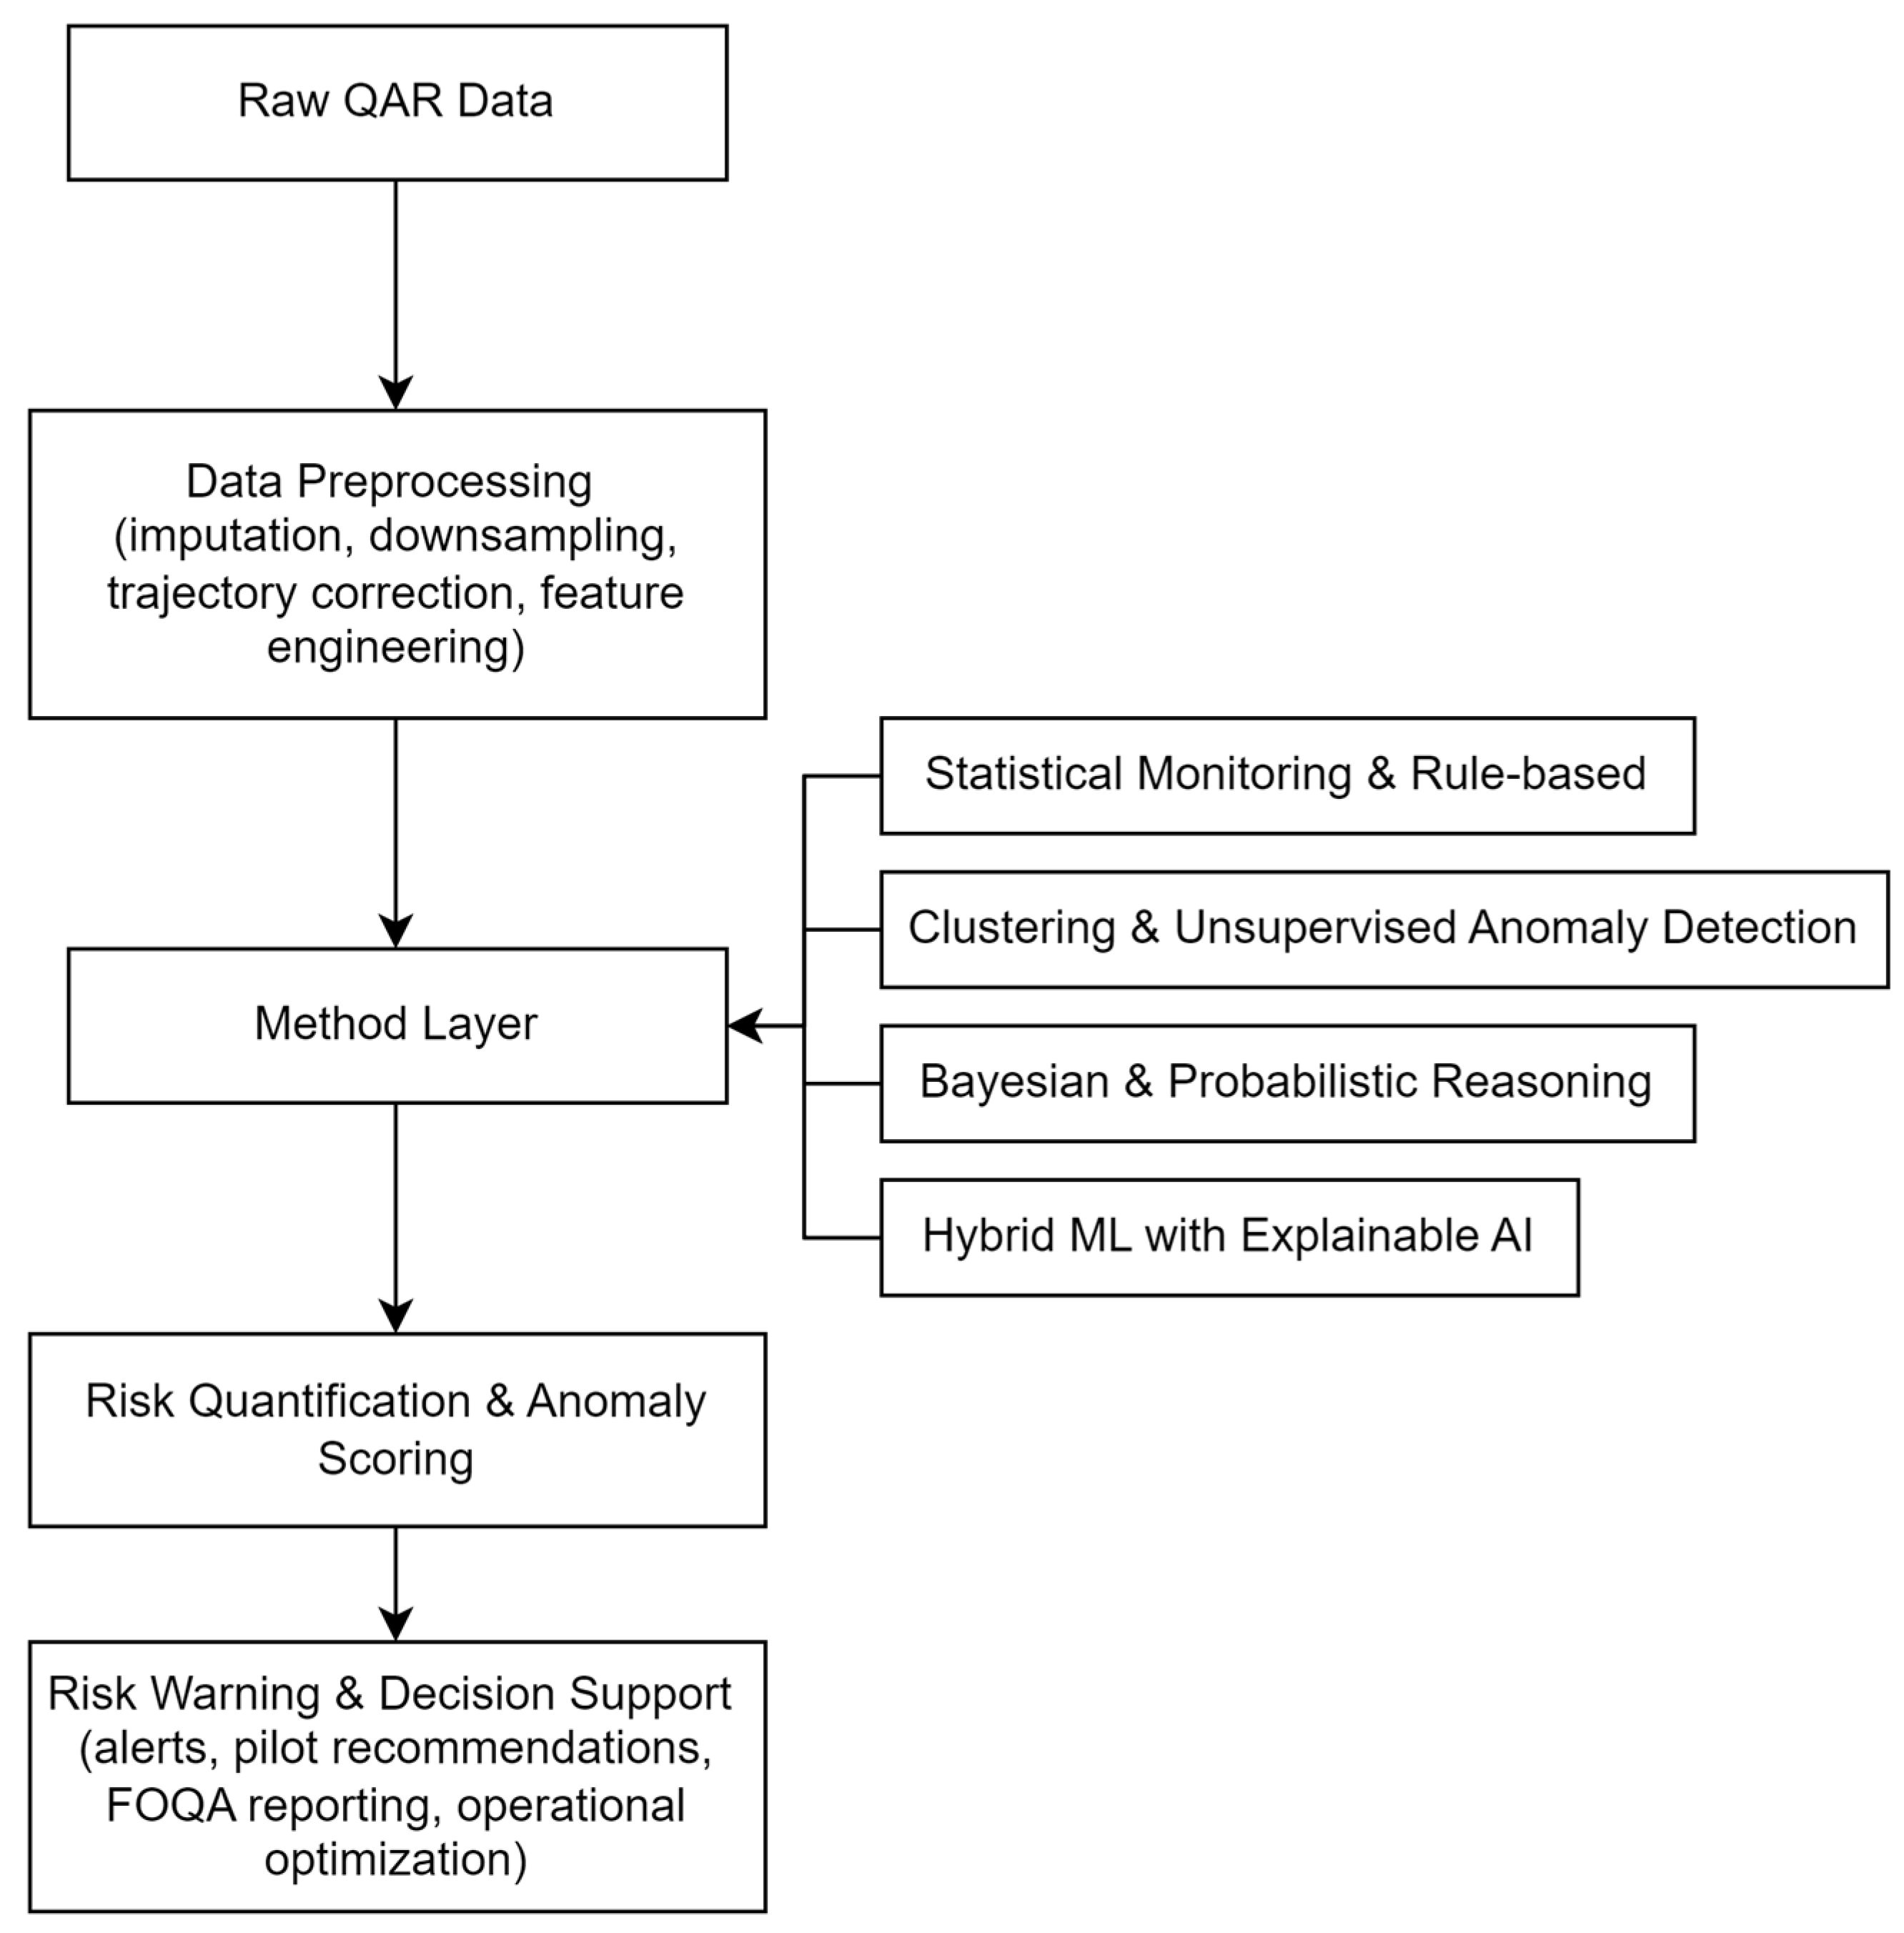

Disclaimer/Publisher’s Note: The statements, opinions and data contained in all publications are solely those of the individual author(s) and contributor(s) and not of MDPI and/or the editor(s). MDPI and/or the editor(s) disclaim responsibility for any injury to people or property resulting from any ideas, methods, instructions or products referred to in the content. |
© 2026 by the authors. Licensee MDPI, Basel, Switzerland. This article is an open access article distributed under the terms and conditions of the Creative Commons Attribution (CC BY) license.