


Abstract
Engine high-altitude simulation tests require establishing a stable low test-chamber pressure across a wide range of operating conditions. Existing studies focus predominantly on the local starting mechanisms—namely, shock-wave swallowing, aerodynamic choking, and boundary-layer separation—of individual ejector or diffuser components, with limited investigation of the coupling among shock evolution, chamber pressure response, starting hysteresis, and diffuser starting thresholds during continuous ejection pressure regulation. To address this gap, a two-dimensional axisymmetric Reynolds-averaged Navier–Stokes model with the standard k-ε turbulence model is employed, encompassing the test chamber, engine nozzle, supersonic diffuser, and annular ejector of a large-scale active-ejection test stand (where an annular ejector actively evacuates the test chamber to simulate high-altitude backpressure). The formation, migration, and stabilization of the shock system are revealed under increasing ejection pressure. Hysteresis characteristics are elucidated by comparing pressure-increasing and pressure-decreasing paths. The non-monotonic relationship between chamber pressure and ejector total pressure ratio under zero-secondary-flow conditions is established. The mechanism governing diffuser starting threshold variation under coupled engine gas and ejection flows is identified. Quantitatively, the ejector starting pressure ratio is found to be approximately 16.78 with a hysteresis width of ~13.6% between the starting and unstarting thresholds, and the diffuser starting threshold scales linearly with the ejector total pressure ratio (R2 = 0.976). The results reveal the coupling among shock evolution, hysteresis, chamber pressure response, and diffuser starting thresholds and clarify the dual influence of ejection pressure on both chamber pressure regulation and diffuser starting thresholds. These findings provide a theoretical basis for parameter matching and operational control of high-altitude simulation facilities.
1. Introduction
High-altitude simulation test stands are core facilities for reproducing the low-back-pressure environment required for engine ground testing. Active ejection systems, which pre-evacuate the test chamber and regulate back pressure during testing, are widely used in large-scale facilities but involve complex aerodynamics, including shock-wave/boundary-layer interactions, shear mixing, and multi-component coupling. Variations in ejection pressure affect both the starting and chamber pressure regulation capability of the annular ejector and alter the diffuser exit boundary, thereby influencing the diffuser starting threshold. Elucidating these coupling mechanisms is thus of clear engineering significance. The test stand considered in this study serves as a ground-based platform for evaluating the altitude-starting and continuous-operation performance of upper-stage rocket engines under simulated high-altitude back-pressure conditions. The facility has been designed and constructed; experimental campaigns are planned but have not yet been conducted. The present numerical study therefore aims to provide predictive guidance for the forthcoming test program and to establish a quantitative framework for interpreting future experimental data.
Considerable research has been conducted on supersonic ejectors and ejector–diffuser systems. German et al. [1] were among the first to propose evaluating ejector–diffuser system performance through integrated metrics of starting pressure, pressure recovery capability, and operating envelope. Kim and Kwon experimentally investigated an annular injection supersonic ejector and found that its performance was sensitive to the primary nozzle exit shape and downstream flow passage configuration [2], and further demonstrated that the starting pressure, unstarting pressure, and secondary flow pressure are not governed by the same geometric parameter [3]. Xu et al. numerically and experimentally studied zero-secondary-flow ejector performance and the variation of blind-cavity pressure with total pressure [4,5]; Fan et al. [6] improved the system vacuum level through mixing chamber optimization. These studies provided a foundation for the geometric design of ejectors and diffusers. Recent experimental investigations of coupled ejector–diffuser systems have further demonstrated that the primary nozzle arrangement, secondary-flow throat geometry, and jet organization significantly affect the system pumping capacity, starting boundary, and pressure recovery performance. Xu et al. [7] showed that the supersonic nozzle array configuration alters the primary-flow expansion and mixing processes. Gu et al. [8] demonstrated that a throat in the secondary flow passage can modify the aerodynamic choking process and pressure recovery capability. Gupta et al. [9] indicated that shear layer development, shock structure, and secondary-flow entrainment near the critical condition affect the mass entrainment capacity and pressure recovery level.
Starting hysteresis is a typical phenomenon in supersonic ejectors. Kim and Kwon found that the primary-flow total pressure required to transition an annular injection supersonic ejector from the unstarted to the started state is markedly higher than that required to sustain stable operation after starting [10]. Based on this, Park et al. proposed a start-up procedure employing a high-pressure pulse for starting followed by low-pressure maintenance [11]. Similar hysteresis exists in mixing-enhancement ejectors, where Ye et al. observed distinct self-starting and hysteresis regions [12]. Additionally, Zou et al. identified the duct Mach number as an important parameter influencing starting pressure [13]; Chen et al. proposed experimental criteria for distinguishing different causes of unstarting [14]; Sun et al. described multiple flow-regime transitions during the ejector starting process [15]. These findings indicate that ejector starting should not be characterized solely by a single pressure threshold; the shock position, initial flow-field state, and pressure regulation path must also be considered. Furthermore, vacuum ejectors often exhibit pronounced unsteady path-dependent behavior during the starting and unstarting processes. Arun Kumar and Rajesh [16] analyzed the transient flow in unstarted and started modes of vacuum ejector operation. Raju et al. [17] experimentally investigated transient characteristics, and Jo et al. [18] showed that shock structure near the nozzle exit and pressure fluctuations within the diffuser affect operating state stability.
In recent years, unsteady effects during the starting process have received increased attention. Mittal et al. reported that the secondary-chamber pressure may exhibit damped oscillations during starting transients in vacuum ejector–diffuser systems, and that recirculation zone movement and mass flux direction changes are important causes of the unsteady pressure response [19]. Related numerical studies indicate that under finite-volume secondary-chamber conditions, recirculation zone formation and dynamic equilibrium play an important role in the evacuation process [20]. Arun Kumar and Rajesh found that diffuser length, height, and reverse mass flow path alter the secondary-chamber evacuation rate [21]. Bharate et al. divided the vacuum generation process in second-throat vacuum ejectors into multiple stages, indicating that nozzle shock-cell motion, jet expansion state, and second-throat geometry jointly govern secondary-chamber pressure evolution [22]. Kong et al. [23] investigated starting transient flows in a chevron ejector–diffuser system. These studies demonstrate that ejector starting is a complex process governed by the interplay of shock migration, recirculation structure, evacuation process, and back-pressure disturbance propagation, and that a single steady-state pressure indicator cannot fully capture the system starting boundary.
Diffuser starting characteristics are likewise a key focus of high-altitude simulation system research. Kumaran et al. evaluated second-throat diffuser performance for high-altitude test facilities, emphasizing comprehensive assessment via minimum starting pressure, pressure recovery capability, vacuum chamber pressure maintenance, and wall pressure distribution [24]. Fouladi et al. studied a thrust-optimized parabolic (TOP) nozzle coupled with a second-throat exhaust diffuser, finding that free shock separation, restricted shock separation, and separation–recirculation modes inside the nozzle can significantly alter diffuser starting and unstarting processes [25], with restricted shock separation raising the minimum starting pressure by approximately 30% [26]. A stage-by-stage analysis of starting transients indicated that nozzle separation mode transition, inlet recirculation bubble evolution, and plume impingement jointly determine the vacuum chamber pressure response [27]. Afkhami et al. showed that nozzle pressure rise rate and pre-evacuated region length significantly affect diffuser starting time and starting process stability [28]. Raju et al. [29] numerically demonstrated that operating pressure and diffuser geometry jointly influence shock position, pressure recovery, and heat load distribution. Yeom et al. [30] emphasized that the minimum starting pressure is a critical parameter in facility design and operational control. Yao et al. proposed an ejection-enhanced second-throat configuration improving pressure-recovery capability under high-Mach-number conditions [31]. Liu et al. revealed that when the diffuser is unstarted, gas backflow leads to elevated chamber pressure, whereas after diffuser starting, the chamber pressure drops abruptly [32]. These studies demonstrate that the diffuser starting threshold is governed not only by diffuser geometry but also by the upstream nozzle plume, the downstream ejection boundary, and the overall system operating state.
In summary, existing research has achieved important progress in ejector configuration optimization, starting pressure characterization, hysteresis identification, starting transient analysis, and diffuser performance evaluation. However, three deficiencies remain for refined operational control of large-scale active-ejection high-altitude simulation test stands. First, most studies treat the ejector or diffuser as isolated analysis units, without fully accounting for system-level coupling effects among the test chamber, engine nozzle, diffuser, and annular ejector. Second, existing criteria are predominantly based on critical values of the starting or unstarting pressure, with insufficient attention to quantitative relationships between shock-train evolution during continuous ejection-pressure regulation and chamber pressure response. Third, after engine ignition, the ejection flow not only provides the pumping boundary but also influences diffuser starting conditions through shear mixing, total pressure loss, and shock-system matching. Although previous work has separately addressed the diffuser minimum starting pressure, transient starting process, and pressure oscillation characteristics, the quantitative correlations among annular ejector starting state, chamber pressure response, and diffuser starting threshold under continuous ejection-pressure regulation have yet to be systematically elucidated.
To address these deficiencies, this study employs a two-dimensional axisymmetric Reynolds-averaged Navier–Stokes (RANS) model encompassing the test chamber, engine nozzle, supersonic diffuser, and annular ejector of a large-scale active-ejection test stand. The standard k-ε turbulence model with enhanced wall treatment and a species transport model are employed, and the coupled compressible flow equations are solved using a density-based solver (ANSYS Fluent 2021 R1). Under zero-secondary-flow conditions, the formation, migration, and stabilization of the shock train within the annular ejector were analyzed as the ejector total pressure ratio was increased, and the critical ejector starting criterion was determined. Through a comparison of pressure-increasing and pressure-decreasing paths, the chamber pressure response and starting hysteresis characteristics were examined. Under the coupled engine–ejection flow condition, the dependence of the diffuser starting threshold on the ejector total pressure ratio was quantified. The three primary scientific contributions are summarized immediately below.
The scientific contributions of this study are threefold. First, it establishes the physical coupling between shock-train evolution and the non-monotonic chamber pressure response under continuous ejection pressure regulation, identifying three distinct control regimes (jet-entrainment-dominated, aerodynamic-choking-dominated, and jet-boundary-pressure-equilibrium-dominated) that govern the pre-evacuation process. Second, it quantifies the starting hysteresis interval of the annular ejector and reveals the progressive flow-field degradation mechanism—initiated at the exit boundary and propagating upstream—that underlies the path-dependent unstarting behavior. Third, it uncovers the dual role of the ejection flow in diffuser starting: while providing the necessary pumping boundary, increased ejection pressure simultaneously elevates the engine total pressure required for diffuser starting through enhanced downstream shear mixing and altered pressure matching, a trade-off not previously quantified.
2. Physical Model and Numerical Methodology
2.1. Physical Model and Computational Domain
Figure 1 presents a structural schematic of the active-ejection high-altitude simulation test stand. The system consists primarily of a test chamber, an engine nozzle, a supersonic diffuser, and an annular ejector. The test chamber accommodates the engine under test and provides a low-pressure environment; the engine nozzle accelerates the high-temperature gas to supersonic conditions and discharges it into the diffuser; the diffuser accomplishes deceleration, pressurization, and pressure recovery of the supersonic gas flow; and the annular ejector evacuates the test chamber by means of a high-pressure ejection flow, thereby establishing and maintaining the low-chamber-pressure environment required for engine high-altitude simulation tests. The test facility was provided by the 401st Research Institute of the Fourth Academy of China Aerospace Science and Technology Corporation.
Figure 1.
Schematic diagram of the active-ejection high-altitude simulation test stand with key geometric notation. The dimensional symbols are defined in Table 1.
Table 1.
Key geometric parameters of the full-system model, normalized by the second-throat diameter ().
In this study, a full-system computational model encompassing the test chamber, engine nozzle, diffuser, annular ejector, and their downstream exhaust region is established. In contrast to modeling approaches that treat only the local flow field of individual components—for instance, ejector-only studies [2,3,4,5,6] and diffuser-only studies [24]— the full-system computational domain simultaneously incorporates the coupling effects among the engine gas flow, the ejection flow, the test chamber pressure, and the diffuser starting process. It is therefore better suited for analyzing the chamber pressure response under inlet total pressure regulation, the ejector starting characteristics, and the variation of the diffuser starting threshold.
Given that the engine nozzle, diffuser, and annular ejector possess pronounced axisymmetric geometric features, and that the present study focuses on system-level starting characteristics and chamber pressure response—quantities governed primarily by the streamwise pressure distribution rather than azimuthal flow details—the three-dimensional geometry is simplified to a two-dimensional axisymmetric model. This simplification is further justified by the circular cross-section of all primary components. In rectangular ducts, three-dimensional shock-train effects are dominated by corner flow separation, which persists across inflow Mach numbers of 2–4 and aspect ratios of 2.5–10 [33], and sidewall confinement has been shown to approximately double the shock-train length compared with span-periodic configurations [34]. By contrast, circular ducts inherently eliminate corner flows, and the axisymmetric configuration minimizes the three-dimensional effects from shock-wave/boundary-layer interactions encountered in rectangular channels [33]; consequently, the pseudo-shock length in a circular duct is substantially shorter than in a rectangular duct of equivalent cross-sectional area [33]. Two-dimensional axisymmetric Reynolds-averaged Navier–Stokes simulations have been extensively validated for supersonic ejector flows—Bartosiewicz et al. [35] demonstrated that 2D axisymmetric models with k–ω SST turbulence closure reproduce axial pressure profiles and shock locations to within 6% of capillary-probe measurements, and Croquer et al. [36] reported no evidence of three-dimensional effects in supersonic ejectors, noting that prior 3D simulations on an axisymmetric geometry found results similar to those from 2D calculations. Besagni et al. [37] directly compared 2D axisymmetric and full 3D RANS models of a supersonic air ejector and concluded that “there are no significant improvement when using a 3D approach compared with a 2D axial-symmetric approach” for both the global entrainment ratio and the wall pressure profiles. The 2D axisymmetric framework therefore provides system-level accuracy consistent with available experimental data while preserving computational tractability for the parametric pressure-variation studies required herein. The potential influence of three-dimensional effects—including asymmetric separation patterns, azimuthal shock-structure non-uniformity, and corner-flow-induced instabilities—on the quantitative prediction of local shock-train details is acknowledged; these effects are addressed in the Conclusions and identified as directions for future work. This simplification substantially reduces the computational cost while preserving the main flow features, facilitating comparative analyses of shock-system migration, shock-train formation, and the diffuser starting process under multiple inlet total pressure conditions.
The computational domain, proceeding in the axial direction, sequentially includes the test chamber, the engine nozzle, the diffuser, the annular ejector, and the downstream exhaust region, as shown in Figure 2. To mitigate the influence of the outlet boundary on the ejector downstream flow field and the diffuser pressure recovery process, an exhaust region of sufficient length is provided downstream of the ejector exit.
Figure 2.
Computational domain and mesh distribution of the full-system model. The mesh is shown at 600 dpi with enlarged insets for the engine nozzle throat, ejector nozzle exit, second-throat inlet, and diffuser near-wall region. Local grid densities in these regions are reported in the text.
In the computations, the engine gas and the ejection flow are treated as two different high-temperature gas media. Both the engine nozzle inlet and the ejector nozzle inlet are set as pressure-inlet boundaries, with the inlet total pressure, total temperature, and species mass fractions specified respectively. The downstream far field employs a pressure-outlet boundary condition, with the outlet static pressure set to the ambient pressure. All solid walls within the computational domain are assigned no-slip adiabatic wall conditions, and an axisymmetric boundary condition is applied at the symmetry axis. The above boundary conditions reasonably represent the principal aerodynamic coupling relationships among the engine gas injection, the ejection flow pumping, and the downstream exhaust in the high-altitude simulation test stand.
Three sets of computational conditions are employed, covering (i) zero-secondary-flow ejector starting (, steady), (ii) pressure-path hysteresis (, unsteady), and (iii) coupled engine–ejector operation (, , steady). For the engine nozzle, with the nozzle geometry, inlet total temperature, and gas medium held constant, a change in the inlet total pressure alters the nozzle pressure ratio and the gas mass flow rate, thereby modifying the gas momentum entering the diffuser. Similarly, for the ejector nozzle, with the geometric configuration, inlet total temperature, and ejection gas medium held fixed, a change in the ejector inlet total pressure regulates the expansion intensity, momentum flux, and pumping capacity of the annular jet.
A hybrid meshing strategy combining structured and unstructured grids is adopted for the axisymmetric computational domain. Based on an assessment of the flow features, strong expansion wave systems, high-speed jets, and significant near-wall velocity gradients exist inside the engine nozzle and the ejector nozzle, requiring high resolution for near-wall flow and boundary layer development; accordingly, structured grids are employed in both nozzle regions, with boundary-layer grids generated at the walls to ensure adequate resolution of the viscous sublayer. The remaining regions, including the test chamber, diffuser, ejector mixing section, and downstream exhaust section, feature relatively complex geometric boundaries and variable flow structures; these are discretized using unstructured grids to accommodate geometric flexibility while maintaining meshing adaptability. Local grid refinement is implemented in key regions where flow parameter gradients are steep or shock structures are concentrated. The refined regions specifically include the sections within the diffuser where shock reflections and shock-train formation are anticipated; the high-speed shear layer at the ejector nozzle exit and its development zone; and the streamwise extent traversed by the shock train during its residence and migration within the ejection passage. By preemptively increasing the grid density in these regions, the capability to capture complex flow structures is improved without unduly increasing the overall grid count. The total number of computational cells is approximately 300,000. The specific near-wall grid resolutions for each wall region, including the first-layer wall-normal grid height and the streamwise grid spacing, are summarized in Table 2. The hybrid strategy rather than a fully structured mesh is necessitated by the annular ejector geometry: the nozzle throat gap of , combined with the convergent–divergent ejector contour (streamwise extent ≈ 1.5 m), would demand extreme cell aspect ratios exceeding 103 in a fully structured quadrilateral mesh. In the unstructured regions, local grid refinement is applied wherever flow-parameter gradients are steep or shock structures are concentrated—specifically, within the diffuser shock-reflection zone, along the high-speed shear layer at the ejector-nozzle exit, and over the streamwise range traversed by the shock train during its residence and migration in the ejection passage. These targeted refinements ensure that the unstructured topology does not degrade the resolution of the complex flow features, while preserving geometric flexibility in regions—such as the ejector contour and the diffuser inlet curvature—where a body-fitted structured mesh would introduce severe mesh skewness. The critical flow regions (engine nozzle, ejector nozzle, and diffuser throat) employ structured quadrilateral grids with near-wall y+ and streamwise spacing as reported in Table 2 and Table 3.
Table 2.
First-layer wall-normal grid height (), minimum and maximum streamwise grid spacing (, ) across the computational domain. A cell growth rate of 1.2 is applied in the wall-normal direction for all regions.
Table 3.
Wall distribution across the computational domain.
The dimensionless wall distance y+ of the first near-wall grid layer varies across the computational domain owing to the wide range of local flow velocities and geometric length scales among the different components. The enhanced wall treatment (EWT) is adopted, which employs a two-layer approach: in regions where the near-wall grid is sufficiently fine ( ≈ 1), the viscous sublayer is resolved directly through a one-equation model; in regions with coarser near-wall resolution ( ≳ 30), the formulation reverts to standard wall functions; and in the intermediate buffer region, a blended law-of-the-wall is applied. This approach accommodates the varying near-wall resolution inherent to a full-system model spanning multiple components—engine nozzle, diffuser, annular ejector, and second-throat duct—each with substantially different wall shear stress levels and axial length scales. The y+ statistics for each wall-bounded region, computed from the numerical solution, are summarized in Table 3. Standard wall functions, which require y+ ≳ 30 in all wall-adjacent cells to place the first grid point within the fully turbulent log-law region, are incompatible with the present multi-component domain: this constraint cannot be satisfied uniformly across the domain with a single computational mesh—in the high-shear engine nozzle the same first-layer height yields y+ ≈ 1, while in the low-velocity test chamber y+ falls far below 30. Scalable wall functions relax the y+ restriction by shifting the first grid point to the log-law region regardless of the actual near-wall mesh resolution, thereby discarding viscous-sublayer accuracy in deliberately refined zones. EWT, by contrast, resolves the viscous sublayer directly where y+ ≈ 1 and transitions smoothly to wall functions in coarser regions—retaining physical fidelity where the mesh permits it without imposing an unattainable uniformity requirement across the domain.
To characterize the overall pressure level of the test chamber, five pressure monitoring points are arranged within the chamber, as shown in Figure 3. Owing to the low flow velocity inside the test chamber, the spatial distribution of pressure within the chamber is relatively uniform except in localized recirculation or weakly disturbed regions; hence, the arithmetic mean of the static pressures at the five monitoring points is taken as the test chamber pressure in this study. This averaging procedure effectively reduces the interference of single-point pressure fluctuations on chamber pressure assessment and is better suited for determining ejector starting, diffuser starting, and chamber pressure response behavior under different flow rate conditions.
Figure 3.
Distribution of pressure monitoring points in the test chamber. Five monitoring points (P1–P5) are arranged at equal intervals along the test chamber wall, covering the axial extent of the chamber. The arithmetic mean of the static pressures at these five points is taken as the representative test chamber pressure.
2.2. Governing Equations
The compressible viscous flow within the high-altitude simulation test stand is governed by the two-dimensional axisymmetric Reynolds-averaged Navier–Stokes (RANS) equations, comprising the conservation of mass, momentum, energy, and species transport. The governing equations in unified conservation form are as follows: where Q = (ρ, ρu, ρv, ρE, ρYk)T is the vector of conservative variables; F and G are the inviscid flux vectors in the axial (x) and radial (r) directions, respectively; S is the axisymmetric source term containing the viscous flux gradients and radial-area contributions; and the superscript T denotes the transpose.
The ideal gas equation of state is employed to close the system. Both working fluids are treated as ideal gases with constant specific heat capacity, and the viscosity and thermal conductivity are modeled using kinetic theory. The gas constants and thermophysical properties of the working media are summarized in Table 4. Buoyancy forces are neglected throughout the computational domain because the ratio of gravitational to inertial forces is small: the test-chamber Richardson number Ri = Gr/Re2 ≪ 1, consistent with the forced-convection regime of the present high-speed ejector–diffuser system.
Table 4.
Gas properties and inlet conditions for the two working fluids.
2.3. Turbulence Model
The flow within the ejector and diffuser is characterized by high Reynolds numbers (Re ≈ 1.3 × 10⁷ based on the mixing chamber diameter at the ejector starting condition), strong shear, and shock-wave/boundary-layer interaction. To balance computational accuracy and engineering applicability, the standard k-ε model is adopted to close the RANS equations.
where is the turbulent kinetic energy production rate, with being the mean strain-rate magnitude; is the eddy viscosity; and the model constants are , , , , and .
The standard k-ε model has been extensively validated for supersonic ejector and diffuser flows [35,36] and provides robust engineering-level predictions of system-level quantities such as entrainment ratio, critical back pressure, and starting pressure. A comparative assessment against the realizable k-ε model [38] under representative operating conditions is provided in Appendix A.
The standard k-ε model has been employed in validated numerical studies of supersonic ejectors. Bartosiewicz et al. [35] compared six turbulence models (standard k-ε, RNG k-ε, realizable k-ε, standard k-ω, SST k-ω, and RSM) against capillary-probe centerline pressure measurements in a supersonic air ejector and found that all two-equation models reproduced the shock position and pressure recovery within approximately 6% of the experimental data. Croquer et al. [36] reviewed the ejector CFD literature and concluded that two-equation RANS models, including the standard k-ε model, are sufficient for predicting system-level quantities such as entrainment ratio, critical back pressure, and starting pressure. For the present configuration, the high-Reynolds-number, fully turbulent nature of the flow and the dominance of pressure-gradient-driven dynamics over transitional effects support the use of a high-Re two-equation model. To assess the sensitivity of the key findings to the choice of the k-ε variant, a comparative study between the standard k-ε model and the realizable k-ε model [38] was performed for the zero-secondary-flow ejector starting analysis (Section 3.1, four conditions) and the hysteresis analysis (Section 3.3, full pressure-increasing and pressure-decreasing path). The detailed comparison is provided in Appendix A. The principal outcome is that the critical ejector starting pressure ratio = 16.78 is unchanged, and the unstarting pressure ratio differs by less than 1% between the two models. The absolute chamber pressure differs by up to 24% in the deep-started regime, but this difference is confined to the absolute pressure level and does not affect the dimensionless pressure ratios and threshold values that constitute the focus of this study.
A limitation to be acknowledged is that neither the standard nor the realizable k-ε model resolves transitional boundary-layer effects or fine separation-bubble dynamics in strong adverse pressure gradients. In regions where the near-wall mesh is coarse, the enhanced wall treatment reverts to a wall-function-type formulation that assumes a fully turbulent log-law profile, which may underpredict the extent of separated flow regions near shock reflections. The realizable k-ε model improves upon this by enforcing physical realizability constraints on the Reynolds stresses, but it does not incorporate the near-wall blending treatment of the k-ω SST model [39]. The sensitivity analysis in Appendix A confirms that, for the system-level starting thresholds and chamber pressure response investigated here, the two k-ε variants yield consistent conclusions. Comparative evaluation with the k-ω SST model is a meaningful direction for future work.
2.4. Species Transport Model
A passive-species transport model without chemical reactions is employed to distinguish between the engine gas and the ejection flow. The two gas streams are treated as separate species with distinct thermophysical properties (Table 4); their mixing and transport are governed by convection–diffusion equations, with turbulent diffusion modeled via the gradient diffusion hypothesis using a constant turbulent Schmidt number. The mass diffusion flux of species k is governed by Fick’s law, ∇, where the effective diffusion coefficient is obtained from the turbulent Schmidt number Sct = 0.7 and the eddy viscosity provided by the turbulence model.
2.5. Numerical Method
The governing equations are discretized using a second-order upwind scheme and solved with the density-based coupled solver in ANSYS Fluent 2021 R1. Steady-state computations employ a density-based implicit solver with a Courant–Friedrichs–Lewy number of CFL = 2 for pseudo-transient time marching until convergence. Unsteady simulations for the hysteresis analysis (Section 3.3) adopt a dual-time-stepping formulation with a first-order implicit physical time discretization and the same implicit solver at CFL = 2 for inner iterations. Grid-independence verification, time-step selection, and near-wall resolution are addressed in the following subsections. Convergence is assessed by monitoring the residuals of all governing equations, with a target threshold of 10−6. Where residuals cannot reach this target due to local flow unsteadiness, computations are terminated at a fixed maximum of 20,000 iterations. All steady-state computations were performed on a workstation equipped with dual Intel Xeon Gold 5118 processors (2.30 GHz, 24 physical cores) and 320 GB of DDR4 RAM (2400 MHz); a typical steady-state case required approximately 1 h (≈24 core-hours).
2.6. Verification and Validation
2.6.1. Grid Independence Verification
To assess the influence of grid resolution on the computational results, three sets of grids with different densities are constructed, with cell counts of approximately 150,000, 300,000, and 500,000, respectively. The static pressure distribution along the ejector centerline and the average test chamber pressure under a typical post-ejector-starting condition are selected as the evaluation metrics for the grid-independence verification.
Figure 4 presents the ejector centerline static pressure distributions computed on the three grids. It can be observed that the pressure distributions in the front section of the ejector are essentially consistent across the three grids; in the rear half of the ejector, the coarse grid exhibits some deviation in predicting the shock-train position and the pressure recovery process, whereas the axial pressure distributions obtained on the medium and fine grids have already converged toward agreement. Balancing computational accuracy and computational efficiency, the grid with approximately 300,000 cells is ultimately selected for the subsequent multi-condition computations in this study.
Figure 4.
Grid-independence verification.
To quantify the numerical uncertainty associated with the spatial discretization, the Grid Convergence Index (GCI) proposed by Roache [40] was computed following the standardized procedure of Celik et al. [41]. The centerline static pressure was selected as the key variable, and the evaluation was performed at five representative axial stations spanning different flow regimes. The representative grid size is taken as for two-dimensional grids, yielding refinement factors r21 = h2/h1 ≈ 1.29 (medium-to-fine) and r32 = h3/h2 ≈ 1.41 (coarse-to-medium), where subscripts 1, 2, and 3 denote the fine (500k), medium (300k), and coarse (150k) grids, respectively. The results of the GCI analysis are summarized in Table 5.
Table 5.
Grid convergence analysis at five representative axial stations.
At the second throat upstream station (x = 33.4 m), the grids exhibit monotonic convergence with an apparent order p = 3.15 and GCI500k = 1.17%. Across the remaining four stations, the convergence pattern is oscillatory: the coarse grid deviates from the medium and fine grids, whereas the medium and fine grids differ by less than 1.2%. The nearly identical medium and fine grid profiles (maximum relative difference of 1.66% in smooth-flow regions, mean 0.54%) confirm that the 300k grid has entered the asymptotic convergence range. Based on the combined evidence—the qualitative agreement in Figure 4, the quantitative medium-to-fine comparison, and the GCI results at monotonic-convergent stations—the numerical uncertainty attributable to spatial discretization is conservatively estimated to be below 3% for the key flow quantities reported in this study. The grid with approximately 300,000 cells is therefore retained for the production computations. The small discrepancy between the medium and fine grid solutions (maximum 1.66%, mean 0.54%) is therefore interpreted as evidence of grid convergence rather than insufficient refinement: at asymptotically converged resolution, further cell addition produces diminishing returns in the pressure solution, consistent with the GCI below 3% and the oscillatory convergence pattern observed at four of the five evaluation stations.
2.6.2. Time-Step Selection
For the unsteady hysteresis simulations (Section 3.3), a dual-time-stepping formulation is employed with a physical time step of Δt = 1 × 10⁻⁴ s at a Courant–Friedrichs–Lewy number of CFL = 2 for the inner iterations. This time step was selected to resolve the shock-train migration dynamics between consecutive pressure levels along the pressure-increasing and pressure-decreasing paths while maintaining numerical stability in the presence of strong shock gradients. A formal time-step independence study, analogous to the grid independence analysis in Section 2.6.1, is identified as a direction for future work.
2.6.3. Near-Wall Resolution
The wall-normal grid resolution ensures adequate coverage of the near-wall flow physics across all wall-bounded surfaces. The first-layer centroid y+ values, reported in Table 3, achieve y+ < 1 over 98% of the engine nozzle wall area. The enhanced wall treatment (EWT) formulation provides a blended treatment across the buffer layer where y+ is approximately 1–30, and the quantitative y+ distribution across all components is documented in Table 3. In the mixing chamber and second throat, a first-layer height of 5 mm (Table 2) places the near-wall centroid in the fully turbulent log-law region (y+ up to 2047). The enhanced wall treatment provides continuous sublayer-to-log-law blending, so that wall shear stress and pressure distributions remain physically consistent across this y+ range. Because the ejector starting threshold and chamber pressure are governed by the inviscid shock structure and bulk pressure matching, the system-level conclusions are insensitive to the precise near-wall turbulence resolution. The shock train observed in Figure 4 and Figure 6 spans approximately 30–40 streamwise cells at a nominal of 10 mm in the second throat (Table 2). Individual shock fronts are smeared over 3–4 cells (≈30–40 mm) by the second-order upwind scheme; the succession of smeared fronts within the shock train accounts for the ~0.3–0.4 m apparent broadening in the figures, while the overall shock-train length is dictated by the downstream pressure rise at aerodynamic choking and is independent of this modest numerical diffusion.
2.6.4. Turbulence Model Sensitivity
A comparative study between the standard k-ε and realizable k-ε turbulence models was conducted for the zero-secondary-flow ejector starting analysis (four conditions) and the full unsteady hysteresis path. The detailed comparison is provided in Appendix A. The critical starting pressure ratio = 16.78 is unchanged, and the unstarting time differs by less than 1% between the two models, confirming that the system-level conclusions are insensitive to the choice of the k-ε variant. The absolute chamber pressure in the deep-started regime differs by up to 24%, and this sensitivity is acknowledged as a limitation. The contour fields in Appendix A (Figure A1) reveal two notable local differences between the models. At the near-starting condition ( = 15.30), the realizable model predicts a moderately more diffuse shock system. At the started condition ( = 16.78), the shock train predicted by the standard k-ε model extends into the anterior-middle portion of the second throat, whereas the realizable model confines the shock train to the throat entrance region. These local discrepancies do not affect the system-level indicators—the ejector starting threshold ( = 16.78) and hysteresis interval remain unchanged—but indicate that the predicted shock-train axial extent in the started regime is sensitive to the specific k-ε variant.
2.6.5. Benchmark Validation of the CFD Methodology
To validate the numerical methodology employed in this study, the CFD setup—density-based coupled solver, standard k-ε turbulence model with enhanced wall treatment (EWT), second-order upwind scheme, and 2D axisymmetric formulation—was applied to the well-established supersonic air ejector benchmark of Bartosiewicz et al. [35]. This benchmark provides centerline static pressure distributions measured under defined operating conditions with zero secondary flow. Two primary-flow total pressures were simulated: P1 = 5 atm (the reference case used by Bartosiewicz et al. for turbulence model comparison) and P1 = 4 atm (cross-condition validation). The benchmark geometry was meshed with 212,000 structured quadrilateral cells, with y+ ≤ 1 maintained on all critical wall surfaces, reaching up to 5.3 locally on the nozzle surface, remaining within the viscous-sublayer resolution range of the two-layer enhanced wall treatment.
Figure 5 presents the centerline static pressure distributions from the CFD simulations alongside the experimental measurements of Bartosiewicz et al. [35]. For both operating conditions, the CFD predictions capture the correct shock phasing and pressure-recovery trend. The mean absolute deviation in p/p0 is 0.029 for P1 = 5 atm and 0.047 for P1 = 4 atm over the near-field region (x = 0–0.14 m), corresponding to relative deviations of approximately 19% and 31% relative to the p/p0 span in this region. The primary source of discrepancy is the over-prediction of shock strength, a known limitation of the standard k-ε model documented by Bartosiewicz et al. for this benchmark.
Figure 5.
CFD methodology validation against the supersonic air ejector benchmark of Bartosiewicz et al. [35].
The correct shock location, consistent pressure-recovery behavior, and deviation magnitudes consistent with the documented performance of the standard k-ε model demonstrate acceptable agreement between the present CFD methodology and experimental benchmark data.
3. Results and Discussion
3.1. Ejector Starting Flow Field Analysis
The zero-secondary-flow condition refers to the operating state in which only the ejection system is activated without engine gas inflow. Under this condition, the minimum chamber pressure that the ejection system can establish reflects its baseline pumping capacity. In this study, the ejector total pressure ratio, defined as the ratio of the ejector nozzle inlet total pressure to the ambient back pressure (taken as 101,325 Pa), is used to characterize the ejection driving intensity.
Four representative operating conditions are selected, with ejector total pressures of 1.40, 1.55, 1.70, and 2.20 MPa, corresponding to ejector total pressure ratios of approximately 13.82, 15.30, 16.78, and 21.71, respectively. Based on the position of the shock train relative to the second throat and the chamber pressure response characteristics, the ejector operating state is classified into three stages. When is below the value required for starting, the shock train has not yet entered the second throat, downstream back-pressure disturbances can propagate upstream through the subsonic region, and the ejector is in the unstarted state. When the shock-train leading edge enters the vicinity of the second throat, the axial static pressure exhibits a stepwise recovery, and the chamber pressure drops abruptly, the ejector completes starting. When continues to increase, the shock train migrates further into the divergent section as a whole, a stable supersonic core flow forms upstream of the second throat, and the ejector enters the post-starting stable operating state. For clarity, two distinct throats exist in the present system (Figure 1; Table 1): the diffuser first throat at the convergent-section minimum area, and the second throat—the downstream constant-area section of the ejector ()—where aerodynamic choking, shock-train stationing, and the starting/unstarting transition occur; the “second throat” referenced throughout this study refers to the latter.
Figure 6 presents the Mach number contours for the four aforementioned conditions. At = 13.82 (Figure 6a), although the annular primary jet has already formed a high-speed jet in the near-wall region, a distinct low-speed core region still persists in the central zone, aerodynamic choking has not yet been established near the second throat, and the ejection system is in the unstarted state. When increases to 15.30 (Figure 6b), the jet expansion intensity and momentum flux increase, the high-speed zone within the mixing chamber expands while the central low-speed zone contracts, and signs of intensified compression waves and incipient local shock structures appear between the mixing chamber convergent section and the second-throat inlet; however, the shock train has not yet fully entered the second throat, and the system is in a near-starting state. When increases to 16.78 (Figure 6c), the shock-train leading edge enters the vicinity of the second throat, the upstream influence of downstream pressure disturbances is significantly weakened, a relatively continuous supersonic core flow forms between the mixing chamber and the second throat, the central low-speed zone is compressed and expelled downstream, and the ejector completes starting. It should be noted that the compression structure in the starting transition state is not a single normal shock but a shock train composed of multiple oblique shocks, reflected shocks, and local recompression structures, formed under the combined action of passage geometric constraints, near-wall boundary layers, and the downstream adverse pressure gradient. The physical essence of starting lies in the establishment of aerodynamic choking after the shock train enters the critical throat cross-section, thereby blocking the upstream propagation of downstream back-pressure disturbances. The average test chamber pressure under this condition drops abruptly to approximately 4400 Pa, and the magnitude of this drop corroborates the flow-field transition. When increases further to 21.71 (Figure 6d), the shock train migrates downstream into the divergent section, a stable supersonic core flow is established upstream of the second throat, the mixing chamber low-speed zone essentially disappears, and the system enters the post-starting stable operating state with a substantial starting margin. The Mach-number colorbar in Figure 6 spans 0–5; the high-speed near-wall jet and the supersonic core approach the upper end of this scale, whereas the central low-speed core resides near the lower end.
Figure 6.
Mach number contours at different ejector total pressure ratios under zero-secondary-flow conditions.
Figure 7 presents the axial static pressure distributions along the ejector at different values, further corroborating the above shock-train migration behavior. At = 13.82, the axial static pressure initially decreases slowly along the streamwise direction and then gradually recovers, without any distinct pressure jump, indicating that the system has not yet formed an effective aerodynamic choke. At = 15.30, a localized steep-rise segment appears on the static pressure curve between the mixing chamber convergent section and the second-throat inlet, corresponding to the formation of an incipient shock train. At = 16.78, the static pressure curve exhibits a pronounced stepwise jump in the vicinity of the second throat, corresponding to the shock-train leading edge position shown in Figure 6c, indicating that the downstream pressure disturbances have been effectively attenuated. At = 21.71, the static pressure jump segment migrates downstream into the divergent section, and the pressure recovery process becomes more continuous. The axial location of the second throat is indicated in Figure 1.
Figure 7.
Axial static pressure distributions in the ejector at different ejector total pressure ratios under zero-secondary-flow conditions.
Previous transient studies of vacuum ejectors have demonstrated that the determination of the ejector starting state should not rely solely on a single indicator such as the inlet total pressure or the chamber pressure; rather, it should involve a comprehensive assessment combining the internal flow-field structure, the pressure recovery position, and the secondary-chamber pressure response [16,17,18,19,20,21,22,23,24,25,26,27,28,29]. Based on the above analysis, this study adopts three concurrent criteria as the ejector starting criterion: the shock-train leading edge enters the second throat, the axial static pressure exhibits a stepwise recovery near the second throat, and the average test chamber pressure undergoes an abrupt drop. Under the computational conditions of this study, the critical ejector starting pressure ratio is approximately 16.78, corresponding to an ejector total pressure of 1.70 MPa. The flow states and starting determinations for each operating condition are summarized in Table 6.
Table 6.
Ejector starting states at different ejector total pressure ratios under zero-secondary-flow conditions.
The above analysis establishes the ejector starting behavior and shock-train evolution under zero-secondary-flow conditions. When engine gas inflow is introduced—corresponding to the coupled ejector–diffuser operating regime—the axial static pressure distribution upstream of the ejector is substantially modified by the under-expanded engine jet. Representative Mach number contours at the ejector-start condition are shown for three engine pressure ratios (, 39.5, and 88.8). Under zero-secondary-flow conditions, the test chamber exhibits a nearly uniform low-pressure field (). With engine gas inflow at , the under-expanded jet produces a pronounced expansion–compression wave system in the test chamber, and the pressure at the diffuser inlet decreases to approximately 0.019 before recovering through the diffuser contraction. At , the deeper expansion ( near the nozzle exit) and higher engine mass flow jointly alter the pressure-matching condition at the diffuser–ejector interface, shifting the shock-train leading edge and modifying the overall pressure recovery trajectory. These coupled-flow features are discussed quantitatively.
3.2. Zero-Secondary-Flow Chamber Pressure
Under the zero-secondary-flow condition with the engine unfired, the test chamber pressure is primarily governed by the entrainment capacity of the annular primary jet, the pressure matching state within the mixing chamber, and the degree of aerodynamic choking near the second throat. This condition excludes the influence of the engine gas flow on the diffuser and ejector, and can be used to evaluate the intrinsic pre-evacuation capability of the ejection system. The ejector total pressure ratio, , is employed to characterize the ejection driving intensity, where is the ejector nozzle inlet total pressure and is the ambient back pressure.
Figure 8 presents the variation of the average chamber pressure ratio, , with under zero-secondary-flow conditions. The test chamber pressure exhibits a distinctly non-monotonic variation with , passing sequentially through three stages: continuous decrease, critical abrupt drop, and gradual recovery.
Figure 8.
Variation of the average chamber pressure ratio with ejector total pressure ratio under zero-secondary-flow conditions.
In the unstarting stage, as increases from 11.84 to 15.79, the chamber pressure decreases gradually from 52,903.6 Pa to 28,731.2 Pa. During this stage, the shock train has not yet entered the second throat, back-pressure disturbances can still propagate upstream through the subsonic passage, and the chamber pressure reduction is primarily attributable to the enhanced entrainment capacity of the primary jet, consistent with the experimental criterion that “the blind-cavity pressure decreases with increasing ejector total pressure in the unstarted state” [42]. As illustrated in Figure 6a,b, although the annular jet has formed a near-wall high-speed zone at this stage, aerodynamic choking has not yet been established, and the test chamber cannot maintain a stable low-pressure isolation environment.
When increases to 16.28–16.78, the chamber pressure undergoes an abrupt drop: at = 16.28, the chamber pressure is 16,060.5 Pa, and at = 16.78, it drops abruptly to 4455.8 Pa, a reduction of approximately 72.3%. As shown in Figure 6c, this abrupt drop corresponds to the entry of the shock-train leading edge into the second throat and the establishment of aerodynamic choking, whereby the feedback of downstream back-pressure disturbances to the test chamber low-pressure zone is significantly weakened. Under the computational conditions of this study, the zero-secondary-flow starting pressure ratio is approximately 16.78, corresponding to = 1.70 MPa.
When is further increased after starting, the chamber pressure does not decrease further. As increases from 16.78 to 29.61, the chamber pressure rises from 4455.8 Pa to 7733.4 Pa ( increases from 0.0440 to 0.0763). This is because, after starting, the test chamber is effectively a blind cavity connected to the ejector mixing zone, and the chamber pressure is determined by the joint equilibrium of the jet boundary static pressure, the mixing zone pressure recovery, and the shock-train position. The jet boundary static pressure increases with the total pressure, leading to a chamber pressure recovery. Experiments by Chen et al. also demonstrate that the blind-cavity pressure can increase with the primary-flow total pressure after starting [42].
The above non-monotonic response reveals three control regimes for the zero-secondary-flow chamber pressure: in the unstarting stage, jet entrainment dominates, and the chamber pressure decreases with increasing ; in the critical starting stage, aerodynamic choking by the shock train dominates, and the chamber pressure undergoes an abrupt drop; in the post-starting stage, jet boundary pressure equilibrium dominates, and the chamber pressure recovers gradually with increasing . Arun Kumar and Rajesh investigated the physics of vacuum generation in zero-secondary-flow ejectors, noting that the primary jet expansion, shear layer separation, recirculation bubble formation, and pressure recovery within the diffuser section jointly determine the secondary-chamber pressure evolution; during the starting process, the compression and expulsion of the recirculation zone is an important cause of the rapid reduction in secondary-chamber pressure [43]. This understanding is consistent with the critical-starting-stage chamber pressure abrupt drop and the post-starting pressure equilibrium transition observed in this study, indicating that the zero-secondary-flow chamber pressure response is not solely determined by the primary-flow total pressure but is governed by the coupled effects of the jet structure, recirculation zone, and shock system. Similar pressure zoning characteristics can also be observed in vacuum ejector starting transient studies [16,17], the essence of which is related to the competition among jet expansion, recirculation zone compression, secondary-passage aerodynamic choking, and diffuser-section pressure recovery.
Therefore, for zero-secondary-flow pre-evacuation, it is inadvisable to adopt the highest possible ejector total pressure. A reasonable strategy is to control within a range slightly above the critical starting pressure ratio, while ensuring that the shock train enters the second throat and remains stably stationed. For the present computational case, this optimal range is located near = 16.78, i.e., = 1.70 MPa, at which the chamber pressure is minimized and the ejector has completed starting.
3.3. Starting Hysteresis Analysis
The steady-state chamber pressure results in Figure 8 indicate that the optimal ejector pressure ratio for zero-secondary-flow pre-evacuation is approximately = 16.78, corresponding to an ejection pressure of = 1.70 MPa, at which the test chamber pressure is minimized and the ejector has completed starting. However, this conclusion reflects only the steady-state chamber pressure level corresponding to each value, without considering the influence of the pressure regulation path on the flow-field state. The experimental study by Kim and Kwon demonstrated that the self-starting pressure and the unstarting pressure of an annular injection supersonic ejector do not coincide: the self-starting pressure ratio required to complete starting during the pressure-increasing process is markedly higher than the minimum pressure ratio required to sustain starting during the pressure-decreasing process. This path-dependent phenomenon is termed starting hysteresis [10].
Subsequent studies on vacuum ejector transient flows [16,17,18,19,20,21,22,23,24,25,26,27,28,29] and the minimum starting condition of high-altitude simulation diffusers [30] have also shown that the starting and unstarting processes generally involve different initial flow-field structures and pressure propagation paths; the secondary-chamber pressure, recirculation zone position, and shock structure within the diffuser jointly influence the extent of the hysteresis interval. Accordingly, Park et al. proposed a “high-pressure starting, low-pressure sustaining” operational strategy [11]. For an active-ejection high-altitude simulation test stand, the existence of hysteresis implies that the optimal , identified in Figure 8, can only be reliably reached through a higher-pressure “overshoot,” and that after being reached, may be reduced to a value below this optimum for sustained operation. This constitutes the key constraint for implementing the steady-state chamber pressure minimum under dynamic conditions.
To quantitatively investigate this hysteresis characteristic, an unsteady computation with first increasing and then decreasing was performed under zero-secondary-flow conditions: was linearly increased from 0 to 2.183 MPa ( = 21.55) over 0–1.0 s, then linearly decreased to 1.19 MPa ( = 11.74) over 1.0–2.0 s, and held constant after 2.0 s. Figure 9 presents the time histories of and , and Figure 10 presents the Mach number contours at six representative instants (1.30–1.70 s) during the pressure-decreasing phase.
Figure 9.
Time histories of ejector inlet total pressure and average chamber pressure during the pressure-increasing and pressure-decreasing process.
Figure 10.
Mach number contours at representative instants during the pressure-decreasing maintenance process.
The chamber pressure response during the pressure-increasing phase is consistent with Figure 6, Figure 7 and Figure 8: at the early stage of establishment, the annular jet has not yet formed a stable exhaust structure, and increases slightly to approximately 94.6 kPa; thereafter, as increases, undergoes an abrupt drop at = 16.78, and the ejector completes starting; by t = 1.0 s ( = 2.183 MPa, = 21.55), has decreased to approximately 17.5 kPa.
The pressure-decreasing phase exhibits typical hysteresis characteristics. During t = 1.0–1.71 s, decreases from 2.18 MPa to 1.48 MPa ( decreases from 21.55 to 14.60). Rather than rebounding, continues to decrease from 17.5 kPa to 7.04 kPa (the global minimum during the entire process). If the flow-field state depended solely on the instantaneous , the pressure decrease should cause a weakening of the pumping capacity and an increase in ; however, the computational results demonstrate that the already-started flow field can sustain effective pumping at pressure ratios far below the self-starting pressure ratio. The Mach number contours in Figure 10 reveal the flow-field evolution during this hysteresis process. At t = 1.30 s ( = 1.885 MPa), a continuous high-speed core region is maintained within the mixing section, no distinct low-Mach-number intrusion is observed near the exit, and the system is in a stable started state. At t = 1.40 s ( = 1.786 MPa), a low-Mach-number zone first appears at the downstream exit wall and contracts inward; however, the high-speed core still penetrates the mixing section, indicating that instability originates from the exit boundary rather than occurring globally and simultaneously. At t = 1.50 s ( = 1.686 MPa), the exit low-Mach-number zone clearly expands upstream, the high-speed core length shortens, and the system enters a transitional stage from “stable starting” to “critical degradation.” At t = 1.60 s ( = 1.587 MPa), a large portion of the rear half of the mixing section is transformed into a low-Mach-number zone, the high-speed core retracts to the front-middle portion, and the through-type ejection structure can no longer be sustained to the downstream exit. At t = 1.65 s ( = 1.538 MPa) and t = 1.70 s ( = 1.488 MPa), the high-speed zone retracts further to the near field of the jet exit, the vast majority of the mixing section is occupied by a low-Mach-number zone, the continuous high-speed passage disappears, and the system is at the critical verge of unstarting. The Mach-number colorbar in Figure 10 spans 0–5; the high-speed core region lies toward the upper end of this scale, whereas the low-Mach-number intrusion zone lies near the lower end.
When decreases to approximately 1.47 MPa ( = 14.5), begins to reverse and increase rapidly, the aerodynamic choking at the second throat is disrupted, and the ejector unstarts. This unstarting pressure ratio of 14.5 is significantly lower than the critical starting pressure ratio of 16.78, determined from Figure 6c and Table 6; the interval between them, Δ = − , constitutes the hysteresis region. After unstarting, rebounds rapidly, reaching 38.8 kPa by t = 2.0 s; thereafter, with held constant at 1.191 MPa, continues to rise and ultimately stabilizes at approximately 51 kPa, which is essentially consistent with the chamber pressure on the unstarting branch of Figure 8, confirming that the system has fully returned to the unstarting branch.
The physical essence of the above hysteresis phenomenon stems from the fundamental difference in the initial flow-field structure between the pressure-increasing and pressure-decreasing paths. During the pressure-increasing process, the unstarted flow field contains extensive subsonic and recirculation zones, back-pressure disturbances can propagate upstream through the subsonic passage, and a high ejection momentum flux is required to push the shock train into the second throat and establish aerodynamic choking. During the pressure-decreasing process, a stable supersonic core flow has already been established upstream of the second throat, the central low-speed zone and recirculation structures have been eliminated, and the shock train has been stably stationed in the second throat or downstream thereof; consequently, even when drops below the self-starting pressure ratio, the already-formed supersonic exhaust structure can be maintained within a certain range. The flow-field degradation process revealed by the contours—formation of a local low-Mach-number zone at the exit, progressive upstream intrusion of the low-Mach-number zone, and continuous shortening of the high-speed core until eventual collapse—is a direct manifestation of this path-dependent characteristic. This degradation process is consistent with the transition from the started mode to the unstarted mode observed in existing vacuum ejector transient experiments, i.e., unstarting generally does not occur synchronously across the entire flow field but is progressively triggered by downstream pressure disturbances, local recirculation intensification, and supersonic core flow shortening [16,17,18,19,20,21,22,23,24,25,26,27,28,29].
In summary, the annular ejector in this study has a self-starting critical pressure ratio of = 16.78 ( = 1.70 MPa) and an unstarting critical pressure ratio of = 14.5 ( = 1.47 MPa). Accordingly, should be understood as a “pressure-increasing target value” rather than a “constant-pressure operating value”: in actual operation, it is advisable to first raise the steady-state optimum identified in Figure 8 above 16.78 to complete starting, and after has decreased and the flow field has stabilized, to reduce into the hysteresis interval of 14.5–16.78 for sustained operation. This “high-pressure starting, low-pressure sustaining” strategy can ensure reliable ejector starting and low-chamber-pressure maintenance while reducing the continuous pressure load on the high-pressure gas supply system.
3.4. Diffuser Starting Pressure Ratio Analysis
After engine ignition, the high-temperature gas is discharged from the engine nozzle into the diffuser, and the system transitions from the single-ejection-flow field under zero-secondary-flow conditions to a coupled flow field in which the engine gas flow and the annular ejection flow act jointly. Under these conditions, the test chamber pressure depends not only on the pumping capacity of the ejector but also on the engine jet momentum, the shock system structure within the diffuser, gas backflow, and the downstream ejection boundary. Therefore, whether the diffuser can start becomes the key factor determining whether a stable low-pressure environment can be established in the test chamber. The axial locations of the diffuser inlet and the ejector mixing section are indicated in Figure 1.
For convenience of analysis, the engine nozzle inlet total pressure ratio, , is used to characterize the engine gas flow driving intensity, and the ejector nozzle inlet total pressure ratio, , is used to characterize the ejection flow driving intensity. With the engine nozzle geometry and inlet total temperature held constant, the nozzle throat is in a critical flow state, and the engine mass flow rate is approximately proportional to the inlet total pressure. Hence, can equivalently represent the engine jet total pressure reserve and the gas momentum entering the diffuser. The ambient back pressure is taken as 101,325 Pa.
Diffuser starting exhibits pronounced system-coupling characteristics and cannot be judged solely on the basis of a single pressure indicator. Previous second-throat diffuser studies have shown that the minimum starting pressure, vacuum chamber pressure abrupt change, shock system restructuring within the diffuser, nozzle plume attachment state, and inlet recirculation zone evolution are all important bases for determining diffuser starting [24,25,26,27,30]. With reference to the treatment methods in second-throat diffuser performance evaluation and high-altitude simulation diffuser starting studies, this study jointly determines diffuser starting by combining the average test chamber pressure, the Mach number distribution within the diffuser, and the gas species distribution. The recent study by Afkhami et al. on the starting and terminating phases of a supersonic exhaust diffuser with a conical nozzle indicated that both the starting and terminating phases of the diffuser are accompanied by coordinated changes in the nozzle plume structure, inlet recirculation zone, shock reflection pattern, and test chamber pressure [44]. Therefore, the determination of the diffuser starting state should comprehensively consider flow-field features such as chamber pressure abrupt change, the establishment of a through-type supersonic core flow within the diffuser, and the disappearance of the recirculation zone, rather than relying solely on a single pressure threshold as the criterion. When the test chamber pressure exhibits a distinct abrupt drop with increasing , a through-type supersonic core flow and a stable shock train structure are formed within the diffuser, and simultaneously the gas backflow near the diffuser inlet is significantly weakened or disappears, the diffuser is considered to have completed starting. Under a given condition, the minimum engine total pressure ratio required to transition the diffuser from the unstarted state to the started state is defined as the critical starting total pressure ratio, denoted as . The location of the diffuser inlet is indicated in Figure 1. Figure 11 presents the Mach number contours of the coupled flow field at a fixed ejector total pressure ratio for three representative engine pressure ratios.
Figure 11.
Mach number contours of the engine–ejection coupled flow field at a fixed ejector total pressure ratio of for different engine total pressure ratios: (a) , pure ejection without engine flow; (b) , diffuser unstarted with inlet backflow; (c) , diffuser started with a through-flow supersonic core established.
Figure 12 presents the variation of the average chamber pressure ratio with the engine total pressure ratio under different ejection pressure conditions. It can be observed that, under a fixed ejection pressure, as the engine inlet total pressure increases, the test chamber pressure as a whole passes through a high-chamber-pressure unstarting branch, a critical descent zone, and a post-starting low-chamber-pressure branch. In the unstarting stage, the engine jet momentum is insufficient to establish a stable pressure recovery structure within the diffuser, gas spillage and backflow exist near the diffuser inlet, and the test chamber pressure is maintained at a relatively high level. As continues to increase, the engine jet axial momentum is enhanced, the shock system within the diffuser undergoes restructuring, the inlet backflow is gradually suppressed, and the chamber pressure exhibits a pronounced decrease and enters a low-chamber-pressure plateau. Based on the chamber pressure abrupt drop position combined with flow-field structure determination, the critical diffuser starting intervals under the various ejection pressures in this study are presented in Table 7. As increases from 19.74 to 29.61, the critical engine total pressure ratio required for diffuser starting increases from approximately 51.81–54.28 to 81.42. This result indicates that, within the geometric configuration and operating condition range of this study, the engine total pressure reserve required for diffuser starting increases overall with increasing ejection pressure.
Figure 12.
Variation of the average chamber pressure ratio with engine total pressure ratio at different ejector total pressure ratios. Stars denote the last unstarted and first started data points used to determine the critical starting interval for each ejector pressure ratio.
Table 7.
Critical diffuser starting conditions at different ejector total pressure ratios. Linear regression uses the upper bound of each interval.
A linear regression of the critical starting conditions listed in Table 7 yields , with a coefficient of determination R2 = 0.976 (p < 0.001), confirming a strong linear dependence within the investigated range (19.74 ≤ ≤ 29.61). The non-zero intercept (−5.74) indicates that the ratio is not strictly constant but varies from approximately 2.6 to 2.8 across this range; consequently, the limiting case of zero ejection flow lies outside the valid extrapolation domain of this empirical correlation. The standard error of the slope is 0.24 (95% confidence interval: [2.34, 3.66]).
Figure 13 presents the variation of the critical diffuser starting pressure ratio with the ejector pressure ratio . Within the operating condition range of this study, exhibits an approximately linear positive correlation with , with the linear fitting result being . This linear relationship indicates that for each unit increase in the ejector pressure ratio, the engine total pressure ratio required for critical diffuser starting increases by approximately 3.0. This result provides a quantitative basis for the matching of diffuser and ejector parameters in active-ejection high-altitude simulation test stands: after selecting the ejection pressure, the minimum engine total pressure reserve required can be estimated from this relationship, thereby enabling a comprehensive trade-off between the ejection pumping capacity and the diffuser starting threshold.
Figure 13.
Variation of the critical diffuser starting pressure ratio with ejector pressure ratio.
Taking = 25.66 as an example, when = 69.08, the test chamber pressure is still at a relatively high level ( = 3915 Pa) and the diffuser has not yet fully started. When increases to 71.55, the chamber pressure drops to approximately 3243 Pa and enters the low-chamber-pressure branch that varies slowly with , indicating that the diffuser has completed starting. Hence, the critical diffuser starting pressure under this condition lies within = 69.08–71.55. Similarly, when = 29.61, the chamber pressure drops from 5444 Pa to 3680 Pa within the interval of 78.96–81.42, indicating that a higher engine total pressure ratio is required to complete starting under higher ejection pressure conditions.
The above regularity can be explained in terms of the dual role of the ejection flow with respect to diffuser starting. On the one hand, the annular ejection flow reduces the downstream pressure of the diffuser, providing the necessary pumping boundary for the discharge of the engine gas flow and the maintenance of a low-pressure environment in the test chamber. On the other hand, as the ejector total pressure ratio increases, the annular high-speed jet forms a stronger shear layer at the diffuser exit and in the ejector mixing section; the momentum exchange, turbulent mixing, and total pressure loss between the gas mainstream and the ejection flow are enhanced; and the static pressure matching relationship at the diffuser exit section is altered. Existing studies have shown that diffuser geometric parameters, operating pressure, and nozzle separation modes all alter the shock stationing position, pressure recovery, and starting margin within the diffuser [25,26,27,30]; therefore, changes in the ejection boundary may further increase the total pressure reserve required for the engine jet. Jo et al. numerically analyzed the flow and heat transfer characteristics of a second-throat exhaust diffuser under different operating pressures and geometric parameters, noting that the diffuser inlet section length, second-throat length, and divergent section dimensions alter the shock position, pressure recovery process, and heat load distribution [18]. This indicates that the diffuser starting threshold is influenced not only by the engine jet total pressure but is also closely related to the pressure recovery structure and geometric constraints within the diffuser. Hence, under the present geometric configuration, the critical engine total pressure ratio increases with increasing ejector total pressure ratio. The locations of the diffuser exit and the ejector mixing section are indicated in Figure 1.
From an engineering application perspective, the above results indicate that the ejection pressure of an active-ejection test stand should not be set solely with the objective of achieving the minimum chamber pressure under zero-secondary-flow conditions. The minimum starting pressure of the high-altitude simulation diffuser and its transient characteristics directly affect the facility operating envelope [27,30]. During the coupled operating phase after engine ignition, a higher ejection pressure, although beneficial for enhancing the pumping capacity, may simultaneously increase the engine total pressure margin required for diffuser starting. For engines with low pressure ratios or conditions with insufficient jet momentum during the initial ignition phase, a comprehensive trade-off should be made among reliable ejector starting, test chamber low-pressure maintenance, and the diffuser starting threshold. The experimental study by Fouladi et al. demonstrated that the diffuser inlet to nozzle exit cross-sectional area ratio significantly affects the pressure oscillations, starting pressure, and unstarting pressure in high-altitude test facilities; as the area ratio increases, the test chamber pressure oscillation modes multiply, and both the minimum starting pressure and the unstarting pressure of the second-throat diffuser may increase [45]. This further indicates that the operational control of an active-ejection high-altitude simulation system cannot be determined solely on the basis of the steady-state minimum chamber pressure; geometric matching, pressure oscillations, and the unstarting margin must also be considered simultaneously.
4. Conclusions
This study numerically investigated the coupled aerodynamics of an active-ejection high-altitude simulation test stand using a full-system two-dimensional axisymmetric RANS model with the standard k-ε turbulence model. The principal findings are as follows.
- (1)
- Under zero-secondary-flow conditions, the annular ejector completes starting at a critical pressure ratio , characterized by shock-train entry into the second throat and establishment of aerodynamic choking. The test-chamber pressure exhibits a non-monotonic response comprising three distinct regimes: jet-entrainment-dominated decrease, aerodynamic-choking-dominated abrupt drop (from ~16.1 kPa to ~4.46 kPa), and jet-boundary-pressure-equilibrium-dominated recovery.
- (2)
- Significant starting hysteresis exists, with the unstarting pressure ratio ≈ 14.5 being approximately 13.6% lower than the self-starting value. The associated flow-field degradation propagates upstream from the exit boundary, validating the “high-pressure starting, low-pressure sustaining” operational strategy for engineering application.
- (3)
- Under coupled engine–ejection flow conditions, the critical diffuser starting pressure ratio increases linearly with the ejector pressure ratio, satisfying . This reveals a previously unquantified trade-off: while the ejection flow provides the necessary pumping boundary for diffuser starting, higher ejection pressure simultaneously elevates the engine total pressure required to achieve starting through enhanced downstream shear mixing and altered pressure matching. These findings establish quantitative physical relationships among ejection pressure regulation, test-chamber pressure response, and diffuser starting—the three objectives of this study—and thus the stated research goals have been achieved. The full-system axisymmetric approach, despite its geometric simplifications, captures the essential coupling mechanisms that single-component analyses would miss and provides a computationally tractable framework for parametric optimization of active-ejection test stand operating strategies. The reported quantitative thresholds and linear correlation offer direct guidance for pressure setting and start-up procedure design. It should be noted that the present two-dimensional formulation cannot resolve three-dimensional effects such as azimuthal non-uniformities in the annular jet and asymmetric corner-flow separation; future work will extend these findings through three-dimensional simulations and experimental validation.
In engineering applications, the setting of the ejector total pressure should be determined through a comprehensive trade-off among reliable ejector starting, test chamber vacuum maintenance, and the diffuser starting threshold. Several limitations of the present study should be noted. First, the conclusions are derived from a two-dimensional axisymmetric RANS model. While the circular cross-section of all primary components suppresses corner-flow-induced three-dimensional effects—which constitute the dominant three-dimensional mechanism in rectangular-duct shock trains [33]—the 2D axisymmetric framework cannot resolve asymmetric separation patterns, azimuthal instabilities, or circumferentially non-uniform shock structures, all of which have been documented in high-fidelity simulations of confined shock trains [34]. Gillespie and Sandham [34] demonstrated that sidewall confinement in a square duct doubles the shock-train length compared with a span-periodic configuration, introduces secondary-flow corner vortices that extend into the core flow, and suppresses the leading-shock separation bubble—indicating that three-dimensional effects are driven primarily by geometric confinement rather than by inherent flow instability. Smits and Dussauge [46] identified the low-frequency unsteadiness of shock-wave/boundary-layer interactions (characterized by a Strouhal number ) as an inherent feature of separated supersonic internal flows, driven by a combination of upstream boundary-layer forcing and downstream separation-bubble dynamics. These three-dimensional phenomena cannot be resolved by the present 2D axisymmetric framework. Second, the geometric configuration considered herein is specific to a single test-stand design, and the empirical correlation obtained () is therefore limited in its scope of applicability. Future work should extend these findings through three-dimensional scale-resolving simulations (e.g., Delayed Detached Eddy Simulation), higher-fidelity turbulence models, and—where feasible—ground test data to quantify the influence of three-dimensional effects on the quantitative prediction of starting thresholds and to assess the generality of the coupled-ejection correlations across different geometric configurations. Additionally, the numerical scheme employed herein (second-order upwind) is adequate for system-level engineering predictions but is known to introduce numerical dissipation in regions of sharp gradients; high-resolution reconstruction schemes such as the ROUND family [47,48] may improve the resolution of local shock-train structures and shear-layer mixing in future scale-resolving simulations.
Author Contributions
Conceptualization, L.W. and L.Z.; methodology, L.W. and L.Z.; software, L.W.; validation, L.W.; formal analysis, L.W.; investigation, L.W.; data curation, L.W.; writing—original draft preparation, L.W.; writing—review and editing, L.Z.; visualization, L.W.; supervision, L.Z.; project administration, L.Z.; funding acquisition, L.Z. All authors have read and agreed to the published version of the manuscript.
Funding
This research received no external funding.
Data Availability Statement
The original contributions presented in this study are included in the article.
Acknowledgments
The authors acknowledge the high-performance computing facility of Southeast University for providing computational resources. During the preparation of this manuscript, the authors did not use any AI or AI-assisted technologies.
Conflicts of Interest
The authors declare no conflicts of interest.
Appendix A. Turbulence Model Sensitivity Study
Appendix A.1. Motivation and Scope
To verify that the key findings of this study are not an artifact of the turbulence modeling approach, a sensitivity study comparing the standard k-ε model and the realizable k-ε model [38] was conducted. The comparison covers two representative flow regimes: the zero-secondary-flow ejector starting analysis (Section 3.1, four conditions: 13.82, 15.30, 16.78, 21.71, steady-state) and the pressure-path hysteresis analysis (Section 3.3, full pressure-increasing path 0 → 21.55 and pressure-decreasing path 21.55 → 11.74, unsteady dual-time-stepping). These two regimes encompass the key physical phenomena examined in this study: shock-train migration through the second throat, establishment of aerodynamic choking, the non-monotonic chamber pressure response, and the path-dependent unstarting behavior.
Appendix A.2. Steady-State Ejector Starting (Section 3.1)
Figure A1 presents the Mach number contours computed with the standard k-ε and realizable k-ε models at the four ejector total pressure ratios.
Figure A1.
Mach number contours computed with the standard k-ε and realizable k-ε turbulence models at four ejector total pressure ratios.
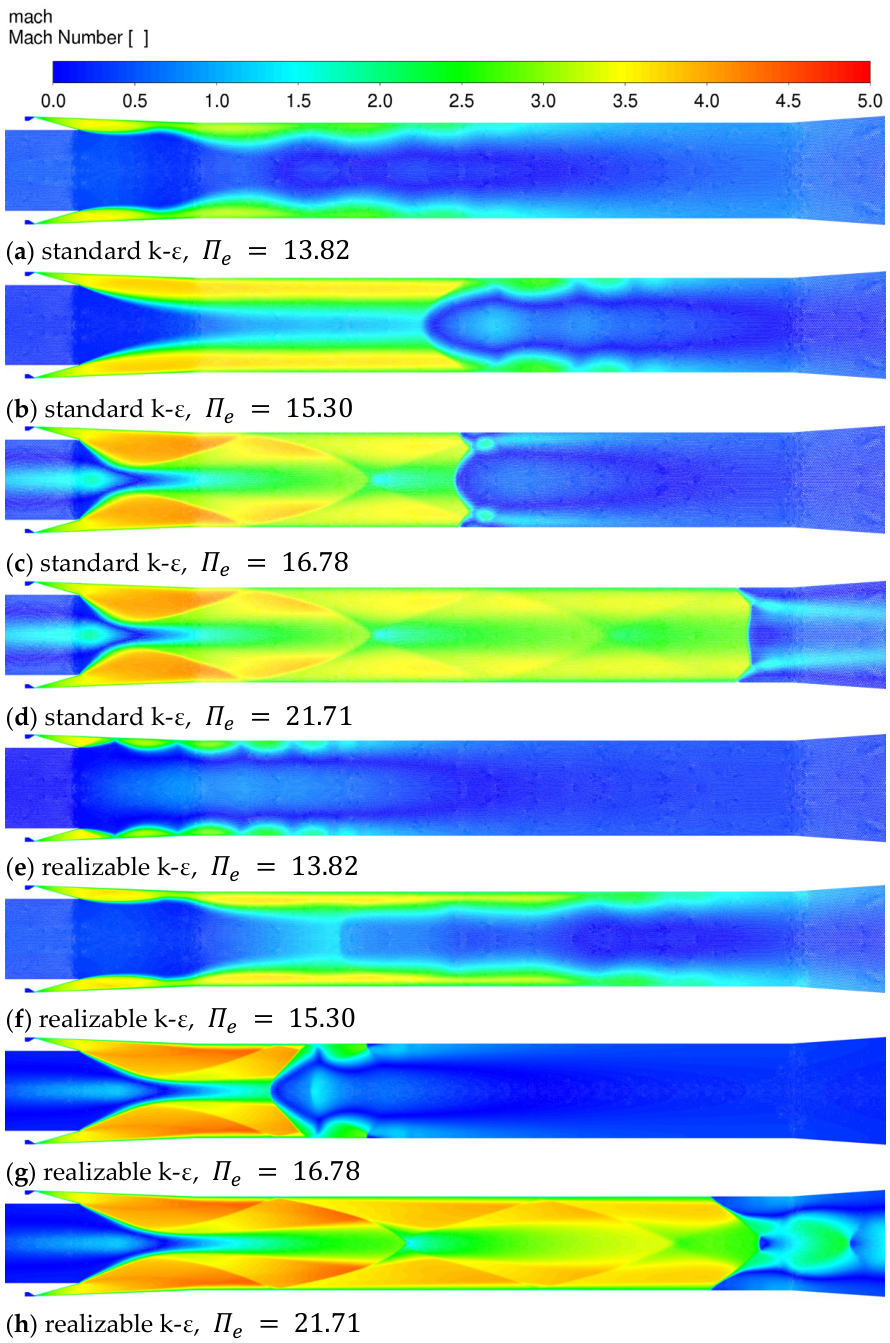
The shock-train position, the extent of the central low-speed zone, and the progression from the unstarted state ( = 13.82) through the near-starting state ( = 15.30) to the started state ( = 16.78, 21.71) are visually consistent between the two models. The critical starting pressure ratio = 16.78 is unchanged, indicating that the prediction of the ejector starting threshold is insensitive to the choice of the k-ε variant under the present geometric and boundary conditions.
Appendix A.3. Unsteady Hysteresis (Section 3.3)
The quantitative comparison in Appendix A.3 compares the key quantitative indicators extracted from the unsteady hysteresis simulation with the two turbulence models. The quantities reported are those that directly inform the system-level conclusions of Section 3.3: the minimum chamber pressure during the pressure-decreasing phase, the pressure at the end of the pressure-increasing ramp (t = 1.0 s), the unstarting time and pressure, and the stabilized post-unstart chamber pressure.
Comparison of key hysteresis indicators between the standard k-ε and realizable k-ε turbulence models. The unstarting detection time differs by approximately 1%, the post-unstart stabilized chamber pressure differs by less than 1%, and the minimum chamber pressure in the deep-started regime differs by 24.2%, which does not propagate into the dimensionless pressure ratio thresholds that constitute the focus of this study.
The critical observations from this comparison are as follows. (i) The unstarting time—the primary indicator of the hysteresis interval width—differs by approximately 1%, which is negligible relative to the ~13.6% hysteresis interval ( = 16.78 vs. ≈ 14.5). (ii) The post-unstart stabilized chamber pressure is essentially identical between the two models (<1% difference), confirming that the steady-state chamber pressure on the unstarting branch is insensitive to the turbulence model. (iii) The minimum chamber pressure in the deep-started regime differs by 24%, but this value is a local minimum that does not directly enter the threshold definitions; the relevant quantities— and —are preserved.
Appendix A.4. Summary
The sensitivity study confirms that the system-level starting and unstarting thresholds, the hysteresis interval width, and the post-unstart steady-state chamber pressure—the quantities that form the basis of the conclusions in Section 4—are insensitive to the choice between the standard and realizable k-ε variants. The absolute chamber pressure level in the deep-started regime is model-dependent, and this sensitivity is acknowledged as a limitation. Comparative evaluation with the k-ω SST model, which incorporates a more elaborate near-wall treatment, is identified as a direction for future work.
References
- German, R.C.; Bauer, R.C.; Panesci, J.H. Methods for Determining the Performance of Ejector-Diffuser Systems. J. Spacecr. Rocket. 1966, 3, 193–200. [Google Scholar] [CrossRef] [Scilit]
- Kim, S.; Kwon, S. Experimental Investigation of an Annular Injection Supersonic Ejector. AIAA J. 2006, 44, 1905–1908. [Google Scholar] [CrossRef] [Scilit]
- Kim, S.; Kwon, S. Experimental Determination of Geometric Parameters for an Annular Injection Type Supersonic Ejector. J. Fluids Eng. 2006, 128, 1164–1171. [Google Scholar] [CrossRef] [Scilit]
- Xu, W.W.; Wang, Z.G. Numerical Study of the Zero-Secondary-Flow Field in an Annular Supersonic Air Ejector. J. Propuls. Technol. 2003, 24, 36–39. [Google Scholar] [CrossRef]
- Xu, W.W.; Zou, J.J.; Wang, Z.G.; Zhou, J. Experimental Investigation on the Starting Characteristics of a Supersonic Annular Ejector. J. Rocket Propuls. 2005, 22, 7–11. [Google Scholar]
- Fan, W.; Luan, X.T.; Han, X.W.; Deng, Y.F. Effect of Mixing Chamber on the Performance of a Zero-Secondary-Flow Annular Supersonic Ejector. J. Rocket Propuls. 2011, 37, 22–25. [Google Scholar]
- Xu, D.; Gu, Y.; Li, W.; Chen, J. Experimental Investigation of the Performance of a Novel Ejector-Diffuser System with Different Supersonic Nozzle Arrays. Fluids 2024, 9, 155. [Google Scholar] [CrossRef] [Scilit]
- Gu, R.; Sun, M.; Cai, Z.; Chen, J.; Li, P.; Dong, Z.; Wang, T.; Yao, Y.; Huang, Y. Experimental Study on the Rocket-Ejector System with a Throat in the Secondary Stream. Aerosp. Sci. Technol. 2021, 113, 106697. [Google Scholar] [CrossRef] [Scilit]
- Gupta, P.; Rao, S.M.V.; Kumar, P. Experimental Investigations on Mixing Characteristics in the Critical Regime of a Low-Area Ratio Supersonic Ejector. Phys. Fluids 2019, 31, 026101. [Google Scholar] [CrossRef] [Scilit]
- Kim, S.; Kwon, S. Starting Pressure and Hysteresis Behavior of an Annular Injection Supersonic Ejector. AIAA J. 2008, 46, 1039–1044. [Google Scholar] [CrossRef] [Scilit]
- Park, G.; Kim, S.; Kwon, S. A Starting Procedure of Supersonic Ejector to Minimize Primary Pressure Load. J. Propuls. Power 2008, 24, 631–635. [Google Scholar] [CrossRef] [Scilit]
- Ye, W.; Xu, W.; Li, P.; Zhang, F.; Zhang, J. Experimental Investigation on the Performance of a Multi-Strut Mixing-Enhancement Ejector. Appl. Therm. Eng. 2019, 154, 650–656. [Google Scholar] [CrossRef] [Scilit]
- Zou, J.J.; Zhou, J.; Xu, W.W.; Wang, Z.G. Experiment on the Air Ejection Starting Characteristics of a Supersonic Annular Ejector. J. Natl. Univ. Def. Technol. 2008, 30, 1–4. [Google Scholar]
- Chen, J.; Wang, Z.G.; Wu, J.P.; Xu, W.W. Flow Field Structure and Ejection Performance of a Constant-Area Supersonic-Supersonic Ejector. High Power Laser Part. Beams 2012, 24, 1301–1305. [Google Scholar] [CrossRef] [Scilit]
- Sun, S.L.; Li, G. Experimental and Numerical Study on the Starting Characteristics of a High-Altitude Simulation Ejector. J. Proj. Rocket. Missile Guid. 2017, 37, 63–67. [Google Scholar] [CrossRef]
- Arun Kumar, R.; Rajesh, G. Flow Transients in Un-Started and Started Modes of Vacuum Ejector Operation. Phys. Fluids 2016, 28, 056105. [Google Scholar] [CrossRef] [Scilit]
- Raju, M.; Desikan, S.L.N.; Vaidyanathan, A. Transient Characteristics of a Typical Vacuum Ejector-An Experimental Study. Phys. Fluids 2022, 34, 096108. [Google Scholar] [CrossRef] [Scilit]
- Jo, S.; Han, S.; Kim, H.J.; Yim, K.J. Numerical Study on the Flow and Heat Transfer Characteristics of a Second Throat Exhaust Diffuser According to Variations in Operating Pressure and Geometric Shape. Energies 2021, 14, 532. [Google Scholar] [CrossRef] [Scilit]
- Mittal, A.; Rajesh, G.; Lijo, V.; Kim, H.D. Starting Transients in Vacuum Ejector-Diffuser System. J. Propuls. Power 2014, 30, 1213–1223. [Google Scholar] [CrossRef] [Scilit]
- Lijo, V.; Kim, H.D.; Rajesh, G.; Setoguchi, T. Numerical Simulation of Transient Flows in a Vacuum Ejector-Diffuser System. Proc. Inst. Mech. Eng. Part G. J. Aerosp. Eng. 2010, 224, 777–786. [Google Scholar] [CrossRef] [Scilit]
- Arun Kumar, R.; Rajesh, G. Effect of Geometric Configurations on the Starting Transients in Vacuum Ejector. AIAA J. 2019, 57, 2905–2922. [Google Scholar] [CrossRef] [Scilit]
- Bharate, G.; Kumar, R.A. Starting Transients in Second Throat Vacuum Ejectors for High Altitude Testing Facilities. Aerosp. Sci. Technol. 2021, 113, 106687. [Google Scholar] [CrossRef] [Scilit]
- Kong, F.; Kim, H.D.; Setoguchi, T.; Kim, J.S. Starting Transient Flows in a Chevron Ejector-Diffuser System. J. Mech. Sci. Technol. 2015, 29, 887–892. [Google Scholar] [CrossRef] [Scilit]
- Kumaran, R.M.; Sundararajan, T.; Manohar, D.R. Performance Evaluation of Second-Throat Diffuser for High-Altitude-Test Facility. J. Propuls. Power 2010, 26, 248–258. [Google Scholar] [CrossRef] [Scilit]
- Fouladi, N.; Farahani, M.; Mirbabaei, A.R. Performance Evaluation of a Second Throat Exhaust Diffuser with a Thrust Optimized Parabolic Nozzle. Aerosp. Sci. Technol. 2019, 94, 105406. [Google Scholar] [CrossRef] [Scilit]
- Fouladi, N.; Farahani, M. Numerical Investigation of Second Throat Exhaust Diffuser Performance with Thrust Optimized Parabolic Nozzles. Aerosp. Sci. Technol. 2020, 105, 106020. [Google Scholar] [CrossRef] [Scilit]
- Fouladi, N.; Afkhami, S.; Pasandideh Fard, M. Starting Transient Analysis of Second Throat Exhaust Diffuser in High-Altitude Test of a Thrust Optimized Parabolic Nozzle. Phys. Fluids 2023, 35, 066132. [Google Scholar] [CrossRef] [Scilit]
- Afkhami, S.; Fouladi, N.; Pasandideh Fard, M. Experimental and Numerical Investigation of Transient Starting of Pre-Evacuated Exhaust Diffuser in High Altitude Ground Test. Aerosp. Sci. Technol. 2023, 133, 108111. [Google Scholar] [CrossRef] [Scilit]
- Raju, M.; Desikan, S.L.N.; Vaidyanathan, A. Unsteady Flow Characteristics in Vacuum Ejectors with Convergent-Divergent Primary Nozzle. Phys. Fluids 2025, 37, 086150. [Google Scholar] [CrossRef] [Scilit]
- Yeom, H.-W.; Yoon, S.; Sung, H.-G. Flow Dynamics at the Minimum Starting Condition of a Supersonic Diffuser to Simulate a Rocket’s High Altitude Performance on the Ground. J. Mech. Sci. Technol. 2009, 23, 254–261. [Google Scholar] [CrossRef] [Scilit]
- Yao, X.Y.; Huang, S.H. Numerical Simulation of a Novel Ejection-Enhanced Second-Throat Configuration. J. Propuls. Technol. 2019, 40, 2454–2463. [Google Scholar] [CrossRef]
- Liu, T.; Lan, B.G.; Li, G.W.; Li, C. Numerical Study on the Test Chamber Pressure of an Active-Ejection High-Altitude Simulation Test Stand. J. Solid Rocket Technol. 2021, 44, 409–413. [Google Scholar]
- Wang, C.-P.; Tian, X.-A.; Cheng, K.-M.; Wu, Y.-Z. Numerical analysis of pseudo-shock flow diffusion phenomenon in variable cross-section ducts. Proc. IMechE Part G. J. Aerosp. Eng. 2008, 222, 1109–1121. [Google Scholar] [CrossRef] [Scilit]
- Gillespie, A.; Sandham, N.D. Numerical study of the effect of sidewalls on shock train behaviour. Flow 2023, 3, E12. [Google Scholar] [CrossRef] [Scilit]
- Bartosiewicz, Y.; Aidoun, Z.; Desevaux, P.; Mercadier, Y. Numerical and experimental investigations on supersonic ejectors. Int. J. Heat Fluid Flow 2005, 26, 56–70. [Google Scholar] [CrossRef] [Scilit]
- Croquer, S.; Poncet, S.; Aidoun, Z. Turbulence modeling of a single-phase R134a supersonic ejector. Part 1: Numerical benchmark. Int. J. Refrig. 2016, 61, 140–152. [Google Scholar] [CrossRef] [Scilit]
- Besagni, G.; Croci, L.; Cristiani, N.; Inzoli, F.; Guédon, G.R. Computational fluid dynamic modelling of supersonic ejectors: Comparison between 2D and 3D modelling. J. Phys. Conf. Ser. 2021, 2116, 012091. [Google Scholar] [CrossRef] [Scilit]
- Shih, T.-H.; Liou, W.W.; Shabbir, A.; Yang, Z.; Zhu, J. A New k-ε Eddy Viscosity Model for High Reynolds Number Turbulent Flows. Comput. Fluids 1995, 24, 227–238. [Google Scholar] [CrossRef] [Scilit]
- Menter, F.R. Two-Equation Eddy-Viscosity Turbulence Models for Engineering Applications. AIAA J. 1994, 32, 1598–1605. [Google Scholar] [CrossRef] [Scilit] [PubMed]
- Roache, P.J. Perspective: A Method for Uniform Reporting of Grid Refinement Studies. ASME J. Fluids Eng. 1994, 116, 405–413. [Google Scholar] [CrossRef] [Scilit]
- Celik, I.B.; Ghia, U.; Roache, P.J.; Freitas, C.J.; Coleman, H.; Raad, P.E. Procedure for Estimation and Reporting of Uncertainty Due to Discretization in CFD Applications. ASME J. Fluids Eng. 2008, 130, 078001. [Google Scholar] [CrossRef] [Scilit]
- Chen, J.; Wu, J.P.; Lu, H.Q.; Wang, Z.G. Experimental Study on the Starting Characteristics of a Two-Dimensional Supersonic Air Ejector. J. Natl. Univ. Def. Technol. 2010, 32, 7–11. [Google Scholar]
- Arun Kumar, R.; Rajesh, G. Physics of Vacuum Generation in Zero-Secondary Flow Ejectors. Phys. Fluids 2018, 30, 066102. [Google Scholar] [CrossRef] [Scilit]
- Afkhami, S.; Fouladi, N.; Pasandideh Fard, M. Gas Dynamics at Starting and Terminating Phase of a Supersonic Exhaust Diffuser with a Conical Nozzle. Phys. Fluids 2024, 36, 036123. [Google Scholar] [CrossRef] [Scilit]
- Fouladi, N.; Farahani, M.; Parsa Delivand, A.R.; Nojoumi, A.A. Experimental Evaluation of the Influence of the Diffuser Inlet to Nozzle Exit Cross Sectional Area Ratio on Pressure Oscillation in a High-Altitude Test Facility. Phys. Fluids 2024, 36, 086118. [Google Scholar] [CrossRef] [Scilit]
- Smits, A.J.; Dussauge, J.-P. Turbulent Shear Layers in Supersonic Flow, 2nd ed.; Springer: New York, NY, USA, 2006. [Google Scholar]
- Deng, X. A Unified Framework for Non-linear Reconstruction Schemes in a Compact Stencil. Part 1: Beyond Second Order. J. Comput. Phys. 2023, 481, 112052. [Google Scholar] [CrossRef] [Scilit]
- Deng, X. A New Open-Source Library Based on Novel High-Resolution Structure-Preserving Convection Schemes. J. Comput. Sci. 2023, 74, 102150. [Google Scholar] [CrossRef] [Scilit]
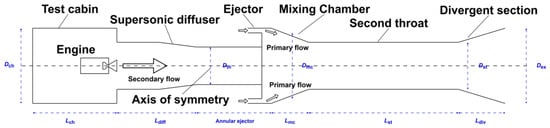
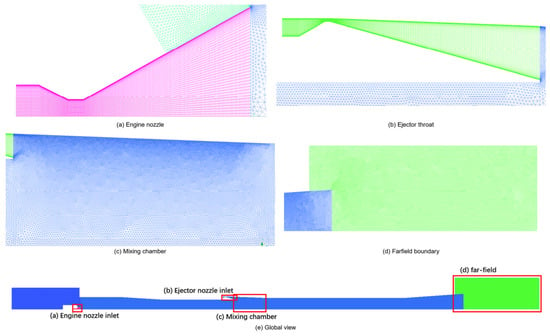
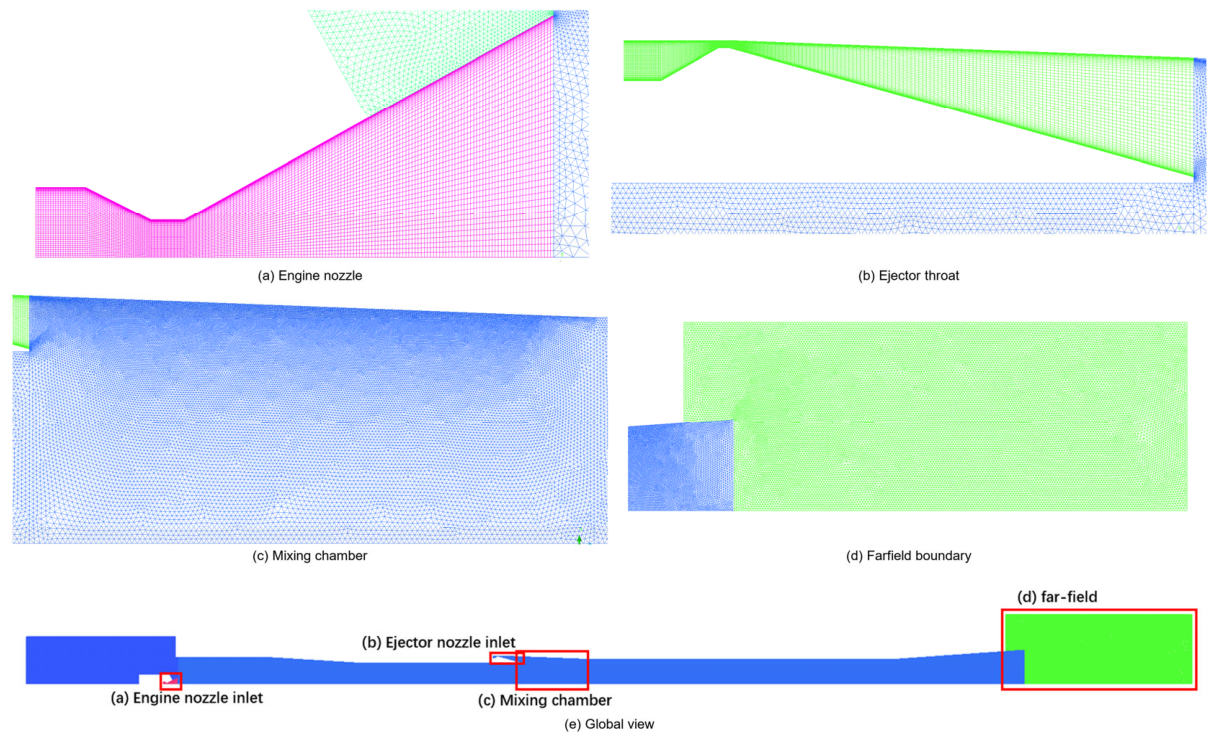
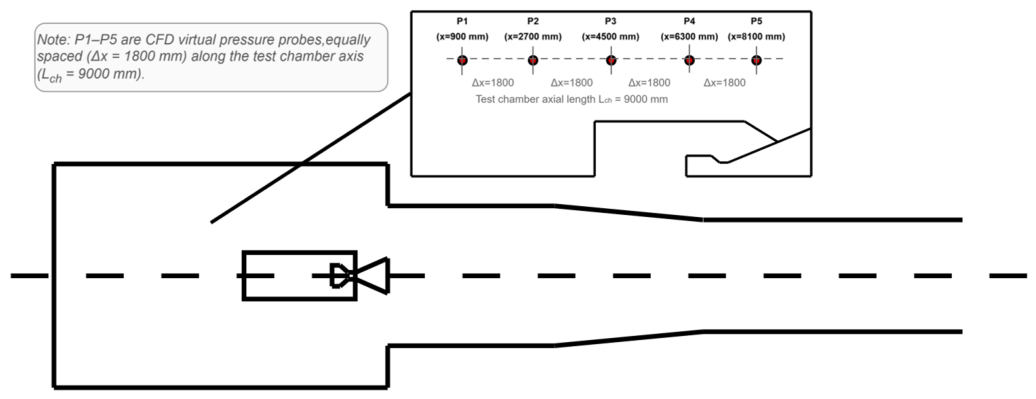
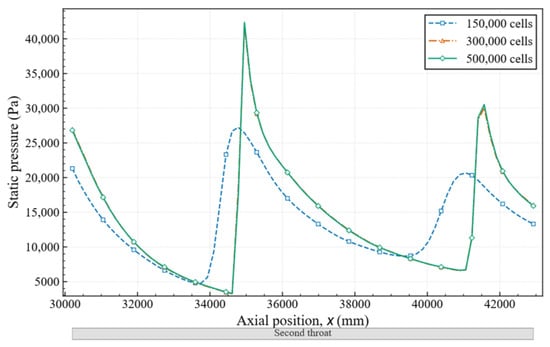
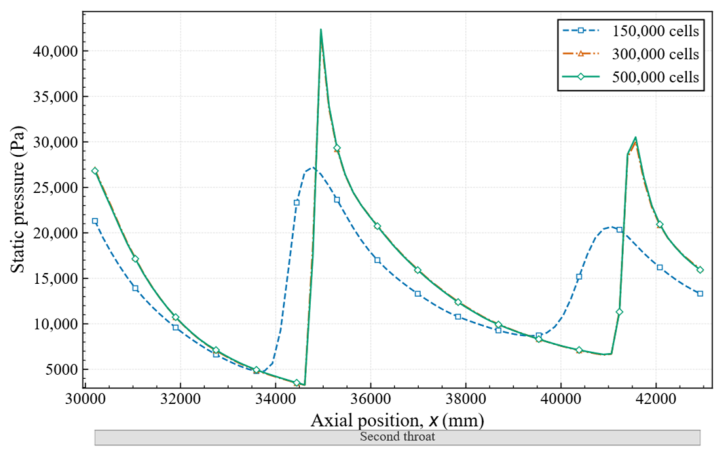
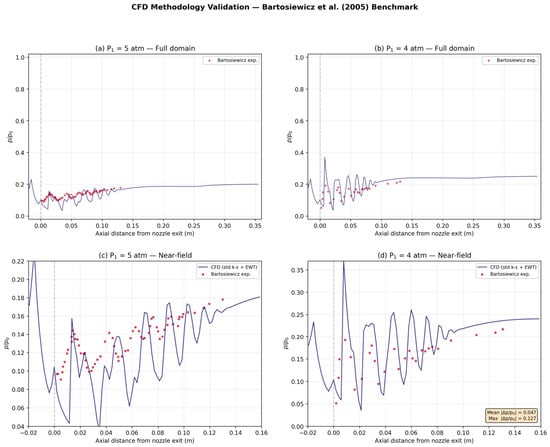
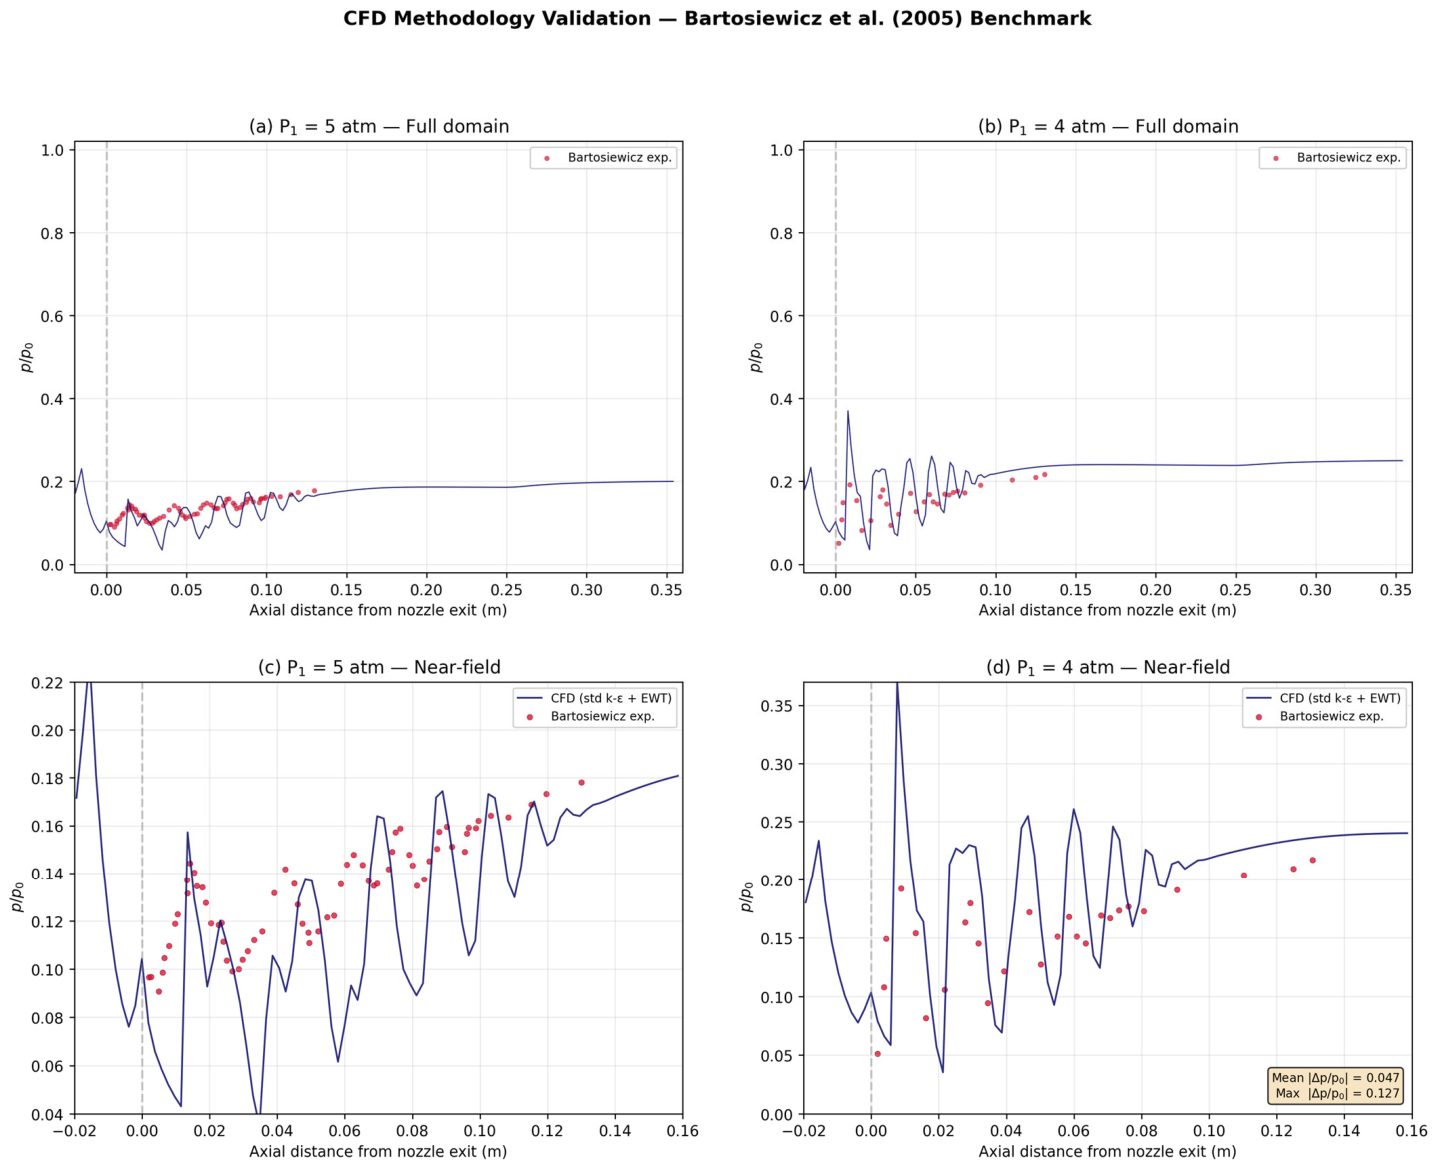
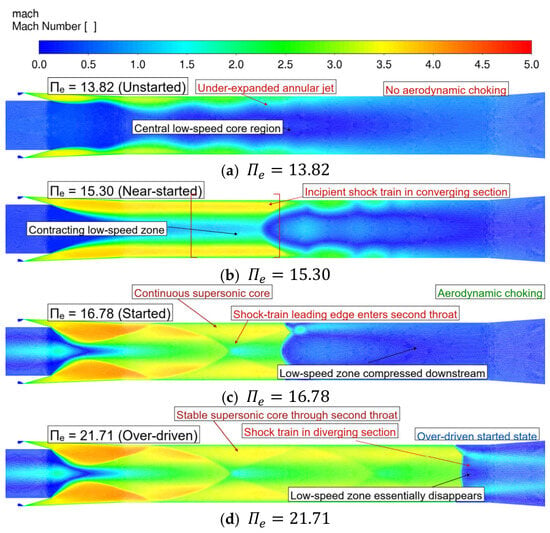
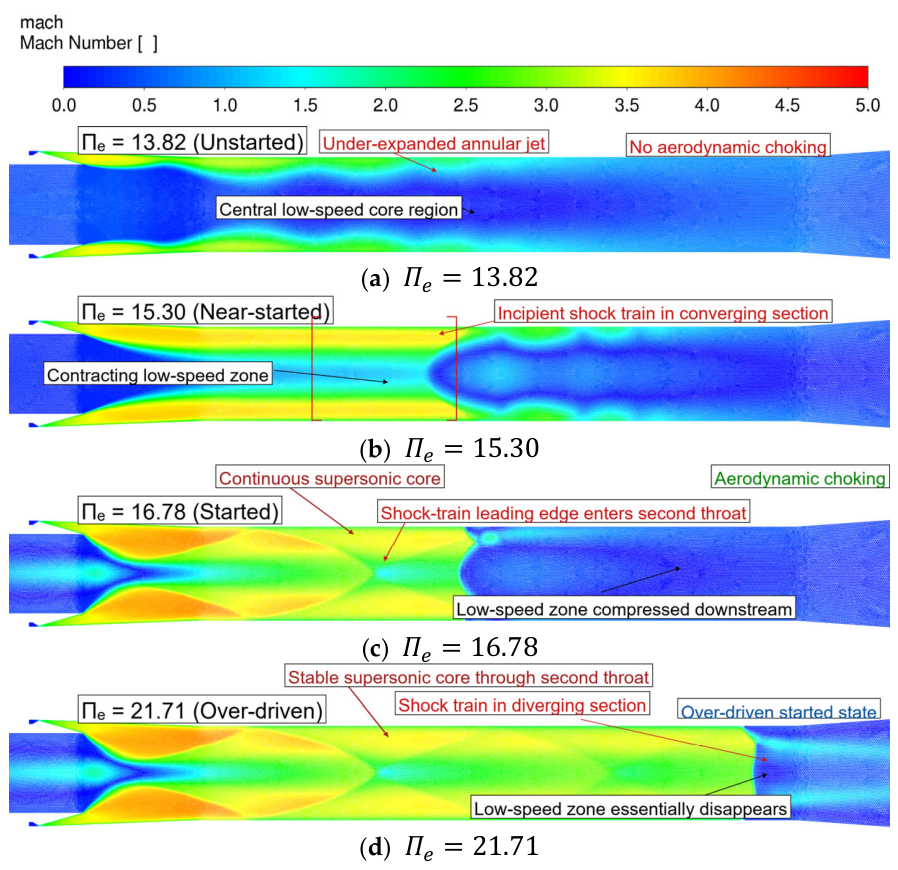
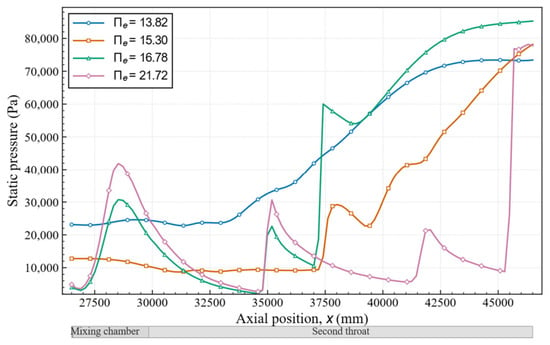
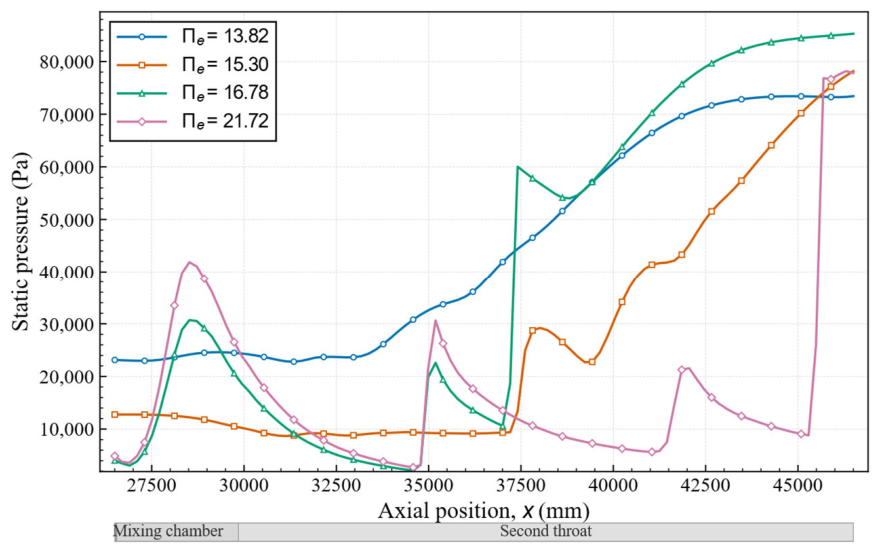
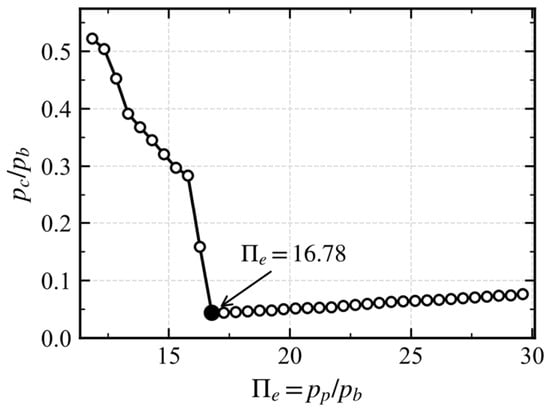
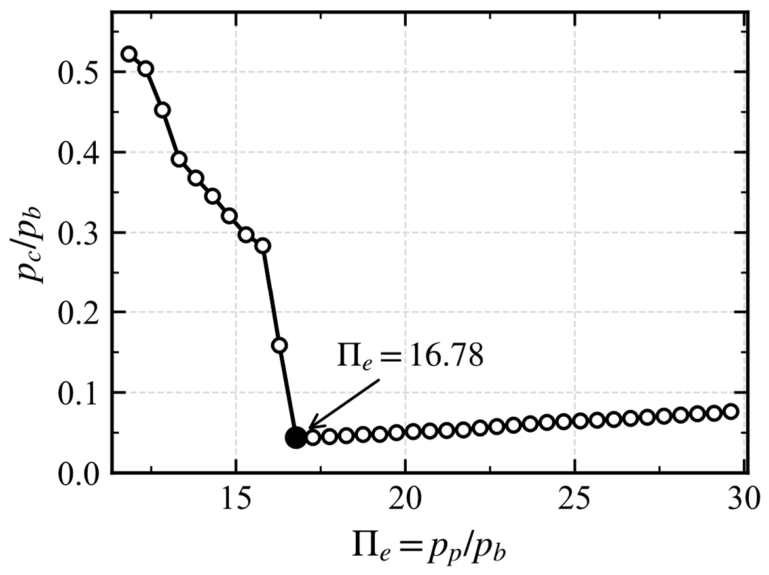
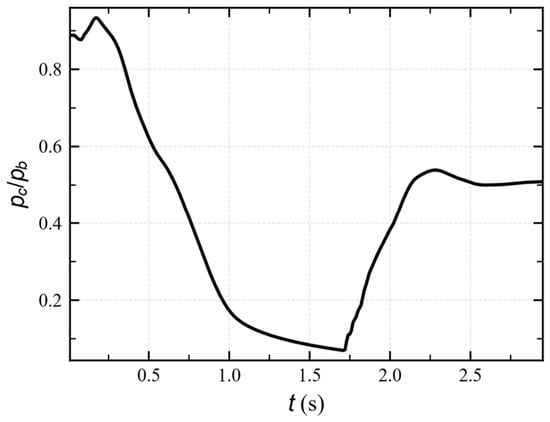
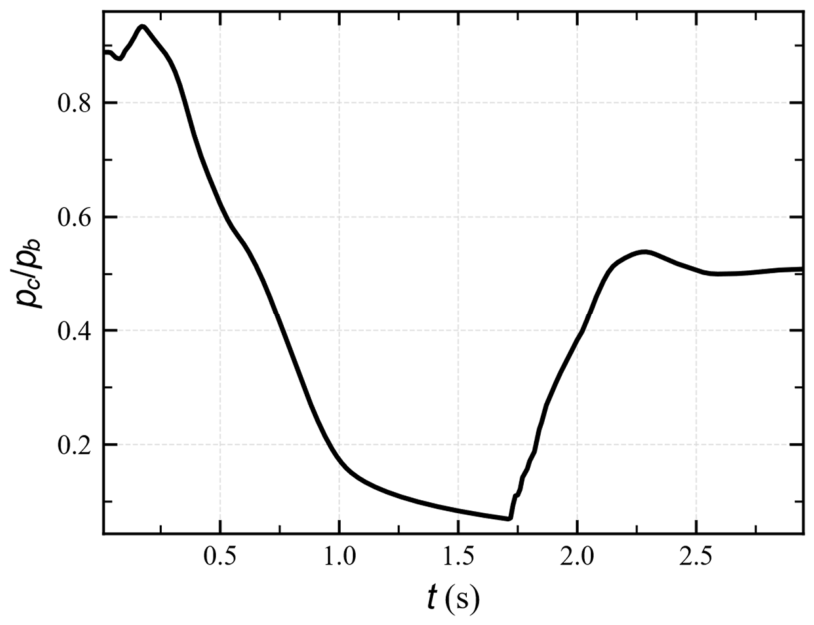
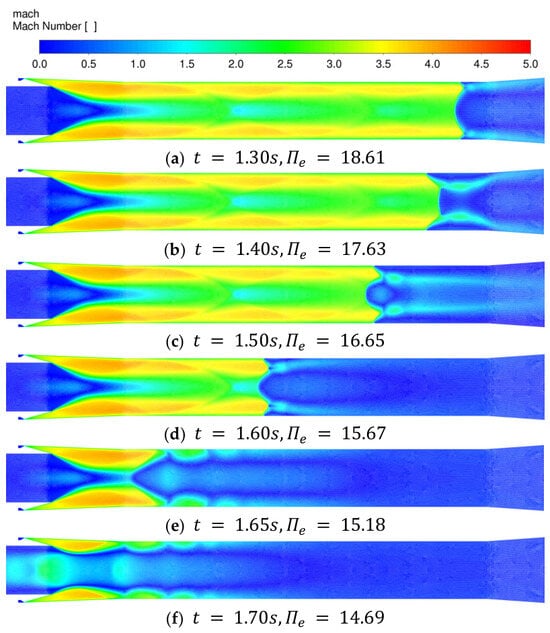
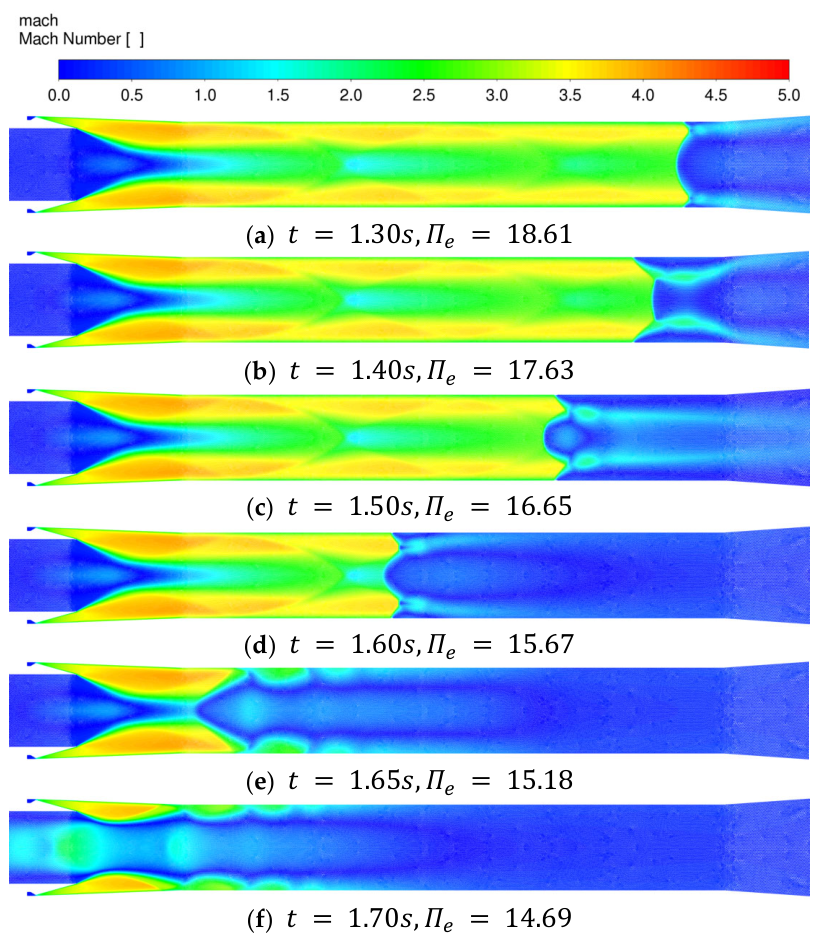
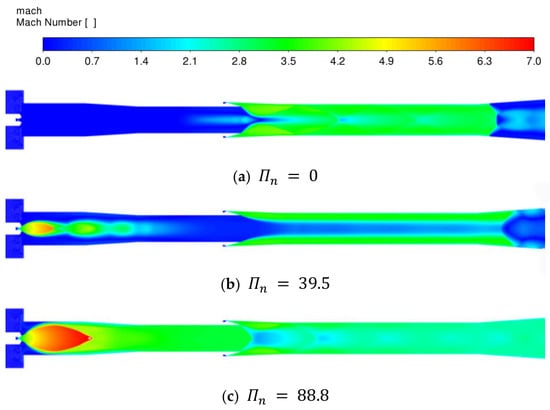
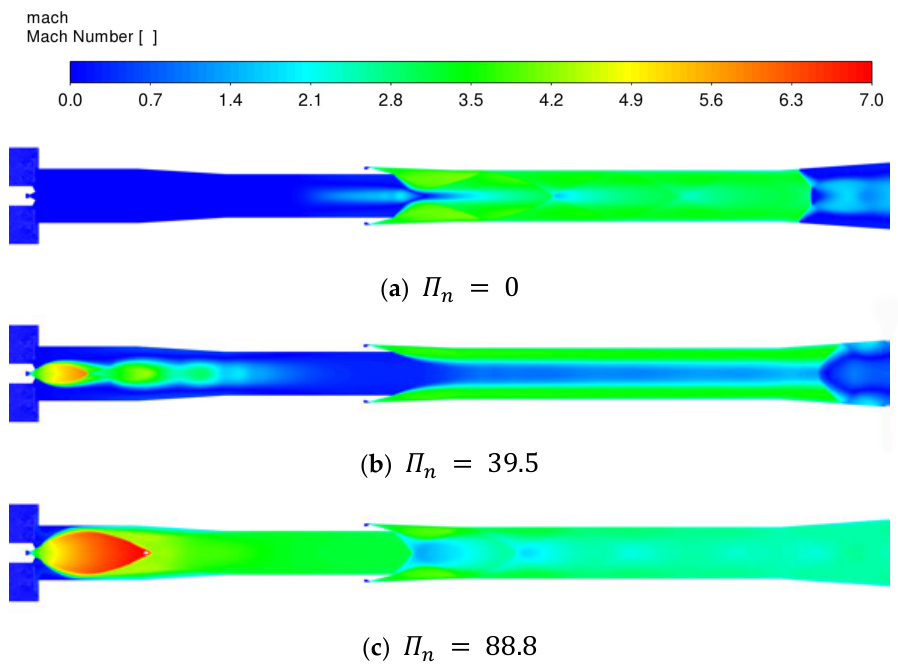
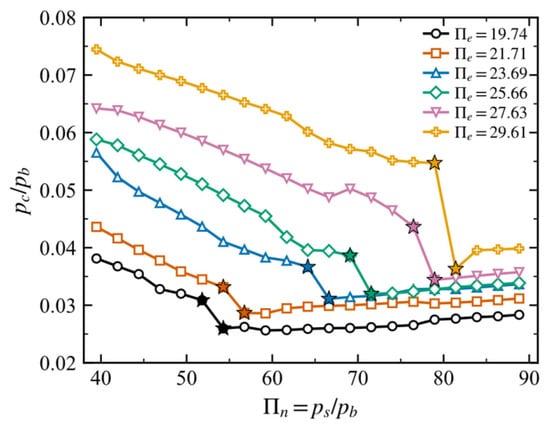
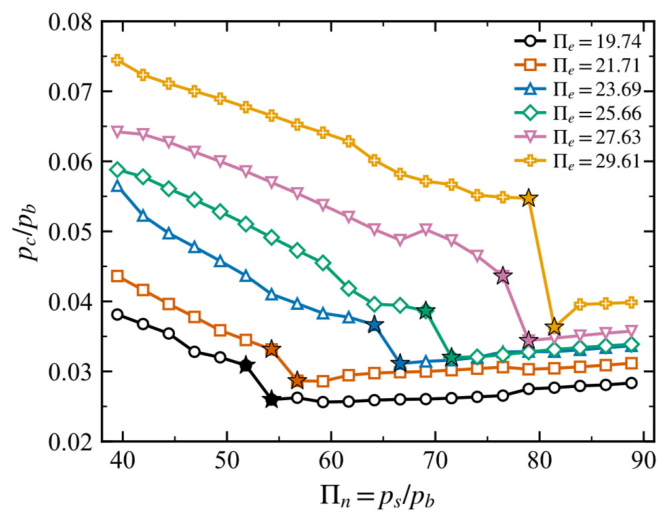
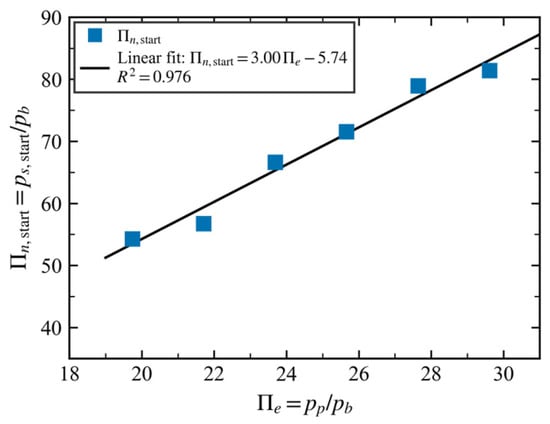
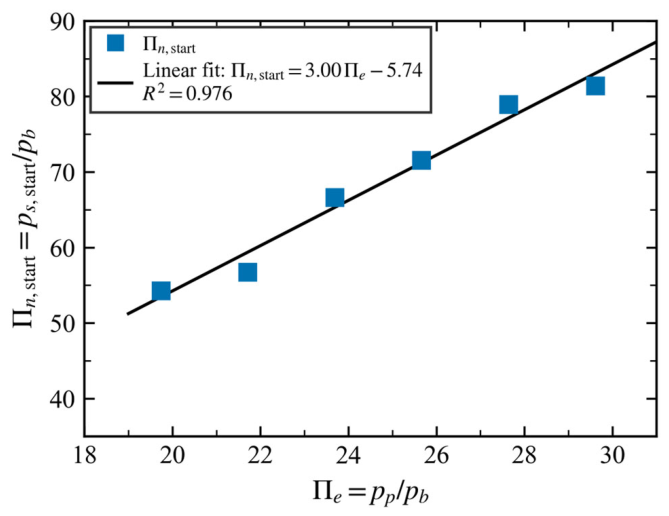

Disclaimer/Publisher’s Note: The statements, opinions and data contained in all publications are solely those of the individual author(s) and contributor(s) and not of MDPI and/or the editor(s). MDPI and/or the editor(s) disclaim responsibility for any injury to people or property resulting from any ideas, methods, instructions or products referred to in the content. |
© 2026 by the authors. Licensee MDPI, Basel, Switzerland. This article is an open access article distributed under the terms and conditions of the Creative Commons Attribution (CC BY) license.