


Abstract
Helicopter operations are often underrepresented in environmental assessments due to their relatively low number of movements and the use of aggregated indicators that do not capture their localised impacts. At the same time, rotorcraft activity typically occurs at low altitude within urban environments, where noise and emissions are directly perceptible and spatially concentrated. This creates a need for assessment approaches based on observed operations and capable of providing spatially resolved results. Automatic Dependent Surveillance-Broadcast (ADS-B) data provide high-resolution observations of aircraft trajectories and are increasingly used to analyse real-world aviation activity. However, existing approaches to ADS-B data processing have largely been developed for fixed-wing operations and do not address the specific challenges of rotorcraft activity, including low-altitude signal loss, positional artefacts, and incomplete trajectories. As a result, ADS-B data for helicopters are generally not suitable for direct use in applications requiring physically consistent and operationally defined inputs. This study proposes a methodology to condition ADS-B helicopter trajectories into a physically consistent and operationally characterised dataset suitable for downstream analysis. The approach integrates trajectory correction, reconstruction of incomplete operations, and the derivation of flight modes and associated parameters. The resulting dataset provides a complete, operation-level description of helicopter activity derived from observed data. The methodology is demonstrated through its application to helicopter operations in the Zurich area and its integration with established environmental modelling approaches, including a rotorcraft-specific noise model (NORAH2) and a flight-mode-based emissions estimation method (Rindlisbacher and Chabbey). The results produce spatially resolved maps and tabulated outputs describing environmental impacts over a defined period, enabling the identification of localised hotspots. The contribution of this work lies in providing a reproducible and integrated framework that bridges the gap between raw ADS-B rotorcraft observations and application-ready datasets for spatially explicit environmental assessment.
1. Introduction
Helicopter operations constitute a distinct class of aviation activity characterised by low-altitude flight, spatial dispersion, and frequent operation within urban environments. Unlike fixed-wing aviation, which is largely structured around airport infrastructure, rotorcraft movements occur across distributed networks of helipads, hospitals, and ad hoc landing sites. As a result, their environmental impacts, particularly noise and emissions, are highly localised and directly experienced by nearby populations.
Recent advances in surveillance technologies, and in particular Automatic Dependent Surveillance-Broadcast (ADS-B), have enabled the observation of aircraft trajectories at high spatial and temporal resolution. ADS-B data have been widely used in aviation research for traffic analysis, trajectory reconstruction, and performance assessment [1,2,3,4,5,6,7,8]. However, most existing studies focus on fixed-wing aircraft operating at medium to high altitude, where signal coverage is stable and trajectories are relatively continuous. In contrast, rotorcraft operations present specific challenges for ADS-B-based analysis, including signal loss at low altitude, multipath effects in urban environments, positional artefacts, and incomplete trajectory segments. These issues significantly limit the direct usability of ADS-B data for applications requiring physically consistent and complete trajectory information.
A substantial body of research has addressed individual aspects of ADS-B data processing, including trajectory filtering, interpolation, and reconstruction, as well as the extraction of flight phases and operational characteristics from surveillance data [2,3,4,5,6,7,8]. Parallel work has explored the analysis of helicopter operations using ADS-B, focusing on aspects such as manoeuvre characterisation, mission segmentation, and operational patterns. In addition, ADS-B trajectories have been used to support downstream applications, including environmental analysis. However, these strands of research remain largely disconnected and are predominantly focused on fixed-wing aviation or specific analytical tasks, rather than providing a unified framework applicable to rotorcraft operations.
This disconnect is particularly evident in applications requiring detailed operational characterisation, such as environmental assessment. Such applications require not only complete trajectories, but also the identification of operational units (individual flights), the reconstruction of missing segments, and the derivation of key parameters such as flight modes and time-in-mode. These elements are not directly available from ADS-B data and are not jointly addressed in existing methodologies, especially in the context of rotorcraft operations in complex environments.
The present study addresses the above-mentioned gap by proposing a practical and reproducible methodology for conditioning ADS-B data of helicopter operations into a physically consistent and operationally characterised dataset. The approach integrates several processing steps that are typically treated separately in the literature, including the detection and correction of trajectory artefacts, the reconstruction of incomplete operations, and the identification of operational segments and flight modes. Particular attention is given to the specific constraints of rotorcraft activity, such as low-altitude signal degradation, interactions with multiple helipads, and the need to preserve physically plausible kinematics.
The resulting dataset provides a complete, operation-level representation of helicopter activity, including trajectories and derived parameters required for downstream applications. While the methodology is applicable to a range of use cases, its practical relevance is demonstrated in this study through its integration with established environmental modelling approaches. In particular, the conditioned trajectories are used as input to a rotorcraft-specific noise model (NORAH2) and to a flight-mode-based emissions estimation methodology (Rindlisbacher and Chabbey), both of which require physically consistent trajectories and explicit operational parameters. These applications serve to illustrate that the proposed data conditioning framework produces outputs that are directly compatible with existing modelling tools. However, the primary contribution of this work lies in the methodology itself, which enables the transformation of raw ADS-B observations into structured and reusable datasets suitable for a wide range of analytical contexts beyond the specific models used in this study.
2. Literature Review
2.1. ADS-B Data Characteristics and Limitations
Automatic Dependent Surveillance-Broadcast (ADS-B) has become a widely used source of trajectory data for aviation research due to its high spatial and temporal resolution and global availability through distributed receiver networks such as the OpenSky Network [1]. ADS-B provides aircraft state vectors at frequencies typically around 1 Hz, including position, velocity, and altitude, enabling detailed observation of real-world flight behaviour beyond conventional radar systems.
Despite these advantages, ADS-B data present well-documented limitations when used for analytical purposes. Crowdsourced datasets are affected by signal loss, particularly at low altitude, multi-receiver inconsistencies, duplicated messages, and occasional positional outliers. These issues can result in discontinuities, implausible kinematics, and inconsistencies between reported parameters such as position, speed, and vertical rate [2,3,4]. As highlighted in previous work, untreated artefacts may propagate into derived quantities, producing unrealistic trajectories and compromising downstream analyses.
A substantial body of research has addressed ADS-B preprocessing and trajectory reconstruction. Filtering techniques have been proposed to remove outliers and reduce noise in ADS-B trajectories [5], while interpolation and smoothing methods have been used to reconstruct missing segments and restore physically plausible motion [6,7]. Additional work has focused on identifying flight phases or manoeuvres from ADS-B data using statistical and machine learning approaches [8].
However, most published ADS-B preprocessing methods were developed and validated using fixed-wing datasets [5,6,7] and therefore do not explicitly address the surveillance challenges associated with low-altitude rotorcraft operations, where terrain masking, urban infrastructure, and frequent take-off and landing events can result in signal degradation, positional artefacts, and incomplete trajectories.
2.2. Use of ADS-B Data for Rotorcraft Operations
Compared to fixed-wing aviation, the use of ADS-B data for rotorcraft analysis remains relatively limited. Helicopter operations are characterised by low-altitude flight, frequent take-offs and landings at distributed sites, hovering, and complex manoeuvres in urban environments. These characteristics exacerbate ADS-B data limitations, particularly signal loss and positional artefacts near the ground.
Existing studies using ADS-B data for rotorcraft have generally focused on specific analytical objectives. For example, Hoole et al. used ADS-B data from the OpenSky Network to derive helicopter manoeuvre statistics and usage spectra, demonstrating that trajectory data can provide insight into rotorcraft operational behaviour [9]. Similarly, Hünemohr et al. combined ADS-B data with performance models to estimate helicopter gearbox usage parameters, showing that ADS-B-derived trajectories can be used to infer operational loads [10].
Other studies have examined rotorcraft operations in urban environments, using ADS-B data to identify mission segments or classify flight behaviour [11]. Earlier work has also explored the extraction of patterns from helicopter ADS-B datasets, such as identifying recurring routes or operational clusters [12].
While these studies demonstrate the potential of ADS-B data for rotorcraft analysis, they typically address isolated aspects of the problem. Most approaches focus on classification, pattern recognition, or specific performance indicators, without addressing the broader challenges of trajectory conditioning, reconstruction, and consistency. In particular, they do not provide methodologies for producing physically coherent, complete trajectories suitable for downstream modelling applications.
2.3. ADS-B Data for Downstream Environmental Applications
ADS-B data have increasingly been used as input for downstream applications, particularly in the context of environmental assessment. Several studies have demonstrated the feasibility of deriving emissions and noise estimates from ADS-B trajectories by combining them with aircraft performance models and external databases.
Filippone et al. showed that ADS-B data can be used to estimate aircraft fuel consumption and emissions by reconstructing flight profiles and applying performance-based models [13]. Similarly, Pretto et al. developed a methodology to reconstruct aircraft operations from high-resolution tracking data and used these to predict airport noise, demonstrating the potential of ADS-B data for trajectory-based environmental modelling [14].
At a broader scale, ADS-B data have also been used to develop global emissions inventories, such as the GAIA dataset [15], highlighting the increasing role of surveillance data in environmental analysis. Recent work has further explored the automation of noise and emissions estimation from ADS-B data in airport environments [16].
Despite these advances, existing approaches are largely focused on fixed-wing aviation and airport-based operations. They typically rely on relatively complete trajectories, predefined procedures, or standardised flight profiles. These assumptions are not directly applicable to rotorcraft operations, which are more variable, distributed, and affected by data gaps and artefacts. As a result, current methodologies do not provide a general solution for transforming ADS-B data into usable inputs for rotorcraft environmental assessment.
2.4. Requirements of Environmental Modelling Frameworks
Environmental modelling tools for aviation noise and emissions impose specific requirements on input data. Trajectory-based noise models require complete, time-resolved flight paths with physically consistent kinematics, as well as operational parameters such as speed, altitude, and flight mode. Emissions estimation methods similarly rely on the identification of flight phases and the calculation of time spent in each mode.
Previous work by the authors demonstrated that ADS-B-derived trajectories can be used as input to rotorcraft noise models such as NORAH2, provided that they are appropriately conditioned [17]. In that study, ADS-B data were processed to ensure kinematic plausibility and used to generate noise maps in an urban setting, illustrating the feasibility of linking open surveillance data to environmental modelling outputs.
However, that work focused on demonstrating the application of a specific modelling tool rather than on developing a generalised methodology for ADS-B data conditioning. The analysis was carried out under relatively favourable conditions, including stable meteorological conditions, a limited number of ground-level helipads, good signal reception, and a geographically constrained study area. As a result, ADS-B trajectories required only limited conditioning to achieve kinematic plausibility. In contrast, the present study addresses more challenging and representative conditions, including low-altitude signal degradation, interactions with multiple helipads (including elevated infrastructure), and incomplete or inconsistent trajectories.
More generally, existing modelling frameworks such as NORAH2 [18], AEDT [19], and emissions methodologies like Rindlisbacher and Chabbey [20] assume that suitable input data are already available. They do not provide mechanisms for transforming raw ADS-B observations into the structured, physically consistent datasets required for their application.
2.5. Identified Gap in the Literature
The reviewed literature demonstrates that significant progress has been made in three related domains: ADS-B data preprocessing, rotorcraft trajectory analysis, and environmental modelling. However, these research areas remain largely disconnected.
Existing approaches either address generic ADS-B data conditioning without considering rotorcraft-specific constraints [2,3,4,5], analyse rotorcraft operations without producing physically consistent, model-ready trajectories [9,10,11], or apply environmental models assuming the availability of structured input data [13,14].
To the best of the authors’ knowledge, no published methodology provides a comprehensive and reproducible framework that integrates these elements into a single workflow capable of transforming raw ADS-B observations of low-altitude rotorcraft operations into complete, physically consistent, and operationally characterised datasets suitable for direct downstream use.
This gap is particularly relevant for applications requiring detailed operational representation, such as spatially resolved environmental assessment, where both data quality and operational characterisation are critical. The present study addresses this gap by proposing an integrated methodology that combines ADS-B data conditioning, operation reconstruction, and flight-mode derivation into a unified framework applicable to rotorcraft operations.
3. Methodology
3.1. Methodology Framework and Workflow
Figure 1 illustrates the processing workflow applied in this study.
Figure 1.
Overview of the methodological framework for the reconstruction of ADS-B trajectories of helicopter operations.
The methodology is organised as a sequential pipeline in which ADS-B state-vector data are processed to generate inputs for environmental modelling. The workflow integrates data preparation, trajectory processing, operation characterisation, and model application within a single framework.
Trajectory conditioning aims to reconstruct the most physically plausible representation of helicopter operations from ADS-B observations known to contain measurement artefacts, signal interruptions, altitude inconsistencies, frozen positions and incomplete terminal trajectories. The methodology therefore treats the raw ADS-B record as an imperfect observation of the underlying operation rather than as a definitive representation of the flight path. Each processing stage addresses a specific class of recognised surveillance-data limitation using constraints derived from helicopter kinematics, trajectory continuity, terrain elevation, helipad location, meteorological correction and operational consistency. Where sufficient information exists, affected trajectory segments are reconstructed to restore physically plausible behaviour; where this is not possible, segments are classified as non-repairable and excluded from further analysis. The objective is therefore not to alter valid trajectory information but to resolve known ADS-B deficiencies and generate trajectories suitable for subsequent environmental assessment.
Input datasets, including ADS-B observations, terrain elevation, meteorological data, and helipad information, are first combined to provide the necessary context for trajectory processing.
Operations are then identified from the ADS-B time series and treated as independent units. For each operation, trajectory processing is applied to address data artefacts and ensure kinematic coherence. This includes the identification and removal of physically inconsistent data segments (intrusions) and the treatment of repeated-position intervals associated with temporary signal loss (freezes), together with correction and smoothing of horizontal and vertical profiles.
The processed trajectories are subsequently characterised through flight mode assignment and the derivation of parameters required for modelling, including time-in-mode, true airspeed and vertical angle.
The resulting characterised trajectories are used as inputs to environmental models (noise and emissions).
3.2. Data Sources
The methodology relies on the integration of multiple datasets required to reconstruct and contextualise helicopter operations.
ADS-B trajectory data were obtained from the OpenSky Network historical database, providing time-resolved state vectors including aircraft position (latitude, longitude), velocity, heading, altitude (barometric and geometric), and identification parameters. These data constitute the primary input to the methodology.
A helicopter fleet database is required to associate ADS-B identifiers (ICAO hex codes) with aircraft types and to assign representative performance parameters, including cruise speed, maximum speed, and rate of climb. Table 1 shows the helicopter types used in this study with speed and rate of climb characteristics.
Table 1.
Helicopter types present in this study with speed and rate of climb characteristics.
A helipad dataset was used, containing helipad name, geographic coordinates (projected coordinates) and elevation above sea level (see Appendix A).
Terrain elevation data are required to derive ground elevation and altitude above ground level. In this study, terrain data were obtained from the SwissALTI3D digital elevation model provided by the Federal Office of Topography (swisstopo), with a spatial resolution of 2 m.
Meteorological data were obtained from the Open-Meteo service (https://open-meteo.com/). Hourly time series were retrieved for the study area, including surface pressure, air temperature, humidity, wind speed, and wind direction.
Emission modelling requires the use of representative emission indices and fuel-flow values associated with helicopter engine classes and operating regimes. In this study, these data were provided by the Federal Office of Civil Aviation (FOCA)—see Appendix B.
3.3. ADS-B Trajectory Conditioning
3.3.1. Input Variables and Coordinate System
ADS-B state vectors include position (latitude, longitude), altitude (barometric and geometric), velocity, heading, and vertical rate. Positions are transformed from WGS84 coordinates into a projected coordinate system-in this study, Swiss projected coordinate system LV95 (CH1903+/LV95) was used- to enable metre-scale spatial analysis. Time stamps are converted to local time to ensure consistency with meteorological data and operation segmentation.
Barometric altitude is used as the primary vertical reference, with geometric altitude and vertical rate used as consistency indicators rather than absolute references.
3.3.2. Operation Segmentation
ADS-B data are first sorted by aircraft identifier (hexcode) and timestamp. For each aircraft, trajectories are segmented into operations based on temporal discontinuities. An operation is defined as a continuous sequence of state vectors in which the time gap between consecutive records does not exceed 300 s. A gap greater than 300 s marks the start of a new operation.
3.3.3. Helipad Association
ADS-B trajectory points are spatially associated with helipad locations using the helipad database described in Section 3.2. Positions falling within predefined helipad geometries are classified as helipad-associated points. This classification is used to identify helipad interactions and to define fixed reference points for subsequent trajectory reconstruction and altitude correction.
3.3.4. Spatial Reconstruction
ADS-B trajectories contain artefacts that must be addressed prior to further processing. Two classes of anomalies are considered: intrusions and freezes.
Intrusions are trajectory segments that are inconsistent with plausible helicopter motion. They are identified by violations of kinematic continuity, including large spatial jumps, speeds exceeding helicopter-specific performance limits, and heading changes inconsistent with the surrounding trajectory. In the Zurich implementation, helicopter-specific maximum speeds listed in Table 1 were used where available, with a default value of 90 m s−1 otherwise. Discontinuities larger than 200 m were screened, with stronger corruption flags applied at 1000 m, 2000 m and 5000 m. Heading inconsistency was evaluated using a 120° threshold, applied only where displacement and speed were sufficient for heading to be meaningful. These artefacts are typically associated with receiver-related errors such as signal misassociation or corrupted message decoding and are very often observed in ADS-B mapping systems where the location of an aircraft “jumps” momentarily to a distant location; only to come back a few seconds later. Segments classified as intrusions are removed, as they cannot be reconciled with physically plausible trajectories (Figure 2).
Figure 2.
Example of intrusion artefacts and their removal. (a) Raw ADS-B trajectory containing intrusion artefacts, visible as spatial deviations inconsistent with helicopter motion. (b) Conditioned trajectory after removal of intrusive segments.
Freezes correspond to sequences of repeated position reports with no displacement over multiple consecutive time steps. In the Zurich implementation, freeze intervals ranged from a few consecutive observations to approximately twelve consecutive rows (representing 1 s each), beyond which reliable reconstruction became increasingly uncertain, and the affected interval was generally treated as non-repairable. These segments are interpreted as short-duration signal loss during which the aircraft continues to move but position updates are not received. For each freeze segment, the displacement required to connect the last valid point before the freeze with the first valid point after the freeze is evaluated. Repairability is assessed by calculating the implied bridge speed across the frozen interval and comparing it with the applicable helicopter maximum speed. In the Zurich implementation, a freeze was considered bridgeable when the implied bridge speed did not exceed 1.25 times the helicopter-specific maximum speed. When this condition was satisfied, the frozen rows were reconstructed by interpolation between the bounding valid points, restoring continuity while preserving the overall trajectory geometry (Figure 3). Where a frozen or corrupt interval could not be bridged within these constraints, the affected rows were removed rather than interpolated. The remaining trajectory was retained only if the surrounding observations formed a coherent continuation after removal; otherwise, the affected block was extended, or the operation was discarded during the cleaning stage.
Figure 3.
Example of freeze artefact and reconstruction.
A conservative repair strategy is applied: trajectory points within helipad geometry are assumed to represent true stationary behaviour and are therefore preserved unchanged, with no positional or altitude correction applied.
3.3.5. Kinematic Reconstruction and Trajectory Smoothing
The kinematic information derived directly from ADS-B position data exhibits short-timescale fluctuations arising from measurement noise, irregular sampling, and residual artefacts. Consequently, horizontal speeds, computed from successive position reports, exhibit unrealistic point-to-point variability that reflects measurement noise rather than genuine changes in aircraft speed.
Horizontal speed is first computed from the displacement between consecutive positions in the projected coordinate system and the corresponding time interval. For freeze segments, this geometric speed is zero and is subsequently reconstructed as described in Section 3.3.4.
Although instantaneous geometric speed is highly variable, short-window averages are consistent with the velocity reported in the ADS-B dataset. This observation is used to constrain the smoothing process. A locally constrained regression is applied in which geometric speed is regularised towards the reported ADS-B velocity, reducing high-frequency variability while preserving the overall speed profile.
Once a consistent speed profile is obtained, the trajectory is reparameterised in time. Spatial coordinates are redistributed along the original trajectory polyline according to the smoothed speed and time intervals, preserving both the geometric path and the endpoints of each operation. In this way, the reconstructed trajectory follows the original spatial path while evolving with physically consistent kinematics.
Because horizontal positions are modified during this process, the original altitude values are no longer aligned with the updated trajectory. Altitude is therefore reassociated using a chainage-based interpolation, in which vertical values are mapped onto the reconstructed trajectory according to cumulative distance along the path. This ensures consistency between horizontal and vertical components of the trajectory. Figure 4 illustrates speed smoothing and trajectory reparameterization. The fidelity of the resulting reparameterised trajectories and the associated altitude reassociation procedure was independently evaluated using both the original OpenSky trajectories and an external ADS-B dataset (ADS-B Exchange). Validation results are presented in Section 6.
Figure 4.
Conceptual illustration of speed smoothing and trajectory reparameterisation.
3.3.6. Barometric Altitude Correction (ISA Adjustment)
Following trajectory reparameterisation, barometric altitude is corrected for deviations from International Standard Atmosphere (ISA) conditions. The correction accounts for differences in surface pressure relative to the standard reference of 1013.25 hPa.
The corrected altitude is computed as:
where is the corrected altitude (m), hbaro is the barometric altitude as supplied in the source data and P is the surface pressure in hPa. A temperature correction is subsequently applied to account for deviations from ISA temperature, using a linear adjustment of 0.4% per °C relative to standard conditions.
3.3.7. Operation-Level Altitude Correction and Local Consistency Enforcement
After ISA correction, residual inconsistencies may remain in the altitude profile of an operation. These arise from two sources: systematic bias and measurement artefacts. Systematic bias reflects differences between the recorded barometric altitude and true altitude, while measurement artefacts are primarily due to ADS-B altitude quantisation, typically on the order of 8 m.
To correct systematic bias, a constant vertical offset is estimated for each operation (as illustrated in Figure 5). The offset is derived from trajectory segments associated with known helipad elevations. These segments are identified as periods of approximately constant altitude over consecutive samples. The vertical offset is defined as the minimum adjustment required to align these segments with the corresponding helipad elevation, while preserving overall trajectory consistency.
Figure 5.
Conceptual illustration of operation-level altitude correction due to systematic vertical bias.
For operations without direct helipad interaction, the offset is inferred from low-altitude segments consistent with helipad proximity, ensuring that the corrected trajectory remains physically plausible.
After application of the operation-level offset, local consistency is enforced. In the vicinity of helipads, defined by the helipad geometries described in Section 3.2, small deviations from pad elevation are attributed to altitude quantisation and are corrected by aligning stationary segments with the corresponding pad elevation. Stationary segments are defined as consecutive samples with negligible horizontal displacement.
For moving segments, altitude values are constrained to remain above terrain or pad elevation as appropriate. Short violations, defined as isolated samples or short sequences inconsistent with surrounding trajectory behaviour, are corrected by interpolation between neighbouring valid points. Interpolation is performed along the temporal sequence, ensuring continuity while preserving the overall trajectory structure.
This approach separates systematic vertical bias from local measurement artefacts, resulting in altitude profiles that are consistent with both terrain and infrastructure constraints.
3.3.8. Pad-Event Reconstruction
Pad-event reconstruction ensures that take-off and landing phases are consistent with known helipad locations. Pad events are identified as trajectory segments associated with helipad geometries and characterised by low horizontal displacement and approximately constant altitude.
For each pad event, trajectory points within the stationary segment are reassigned to the helipad reference position and elevation. This ensures that the trajectory correctly represents ground contact at the helipad. However, this alignment may introduce discontinuities in the preceding trajectory segment, particularly in altitude, leading to unrealistic vertical transitions.
To address this, adjacent trajectory segments are adjusted by interpolation along the trajectory sequence to restore a continuous and physically plausible approach to the helipad.
This process results in a coherent representation of lift-off and landing operations, preserving both spatial alignment with infrastructure and kinematic consistency. The effect of this reconstruction is illustrated for a landing event in Figure 6.
Figure 6.
Pad-event reconstruction. The reconstructed trajectory (dashed) aligns the landing segment with the helipad location, correcting the truncated observed trajectory (solid).
3.3.9. Altitude Refinement and Smoothing
Altitude smoothing was required to produce trajectories suitable for flight mode assignment, where each segment must be consistently classified as climb, descent or approach. This imposes two simultaneous constraints on the smoothed profile. First, the altitude must evolve monotonically within each phase, i.e., short counter-trend segments (local descent within a climb or local climb within a descent) must be removed. Second, the smoothed trajectory must remain close to the input data, with deviations not exceeding ±16 m. This tolerance was selected from the maximum altitude variability attributable to residual ADS-B quantisation and measurement jitter observed in the processed dataset. The value corresponds approximately to the largest commonly observed quantisation interval (50 ft, 15.2 m), with a small additional margin to accommodate rounding effects. Deviations beyond this limit were considered likely to represent genuine flight manoeuvres rather than measurement artefacts and were therefore not eligible for correction.
Initial tests focused on classical smoothing filters commonly used in trajectory and signal processing. A centred running average, and a Savitzky–Golay filter, based on local polynomial regression within a moving window. Both methods were able to reduce high-frequency variability while preserving the overall trajectory. However, because these methods reproduce the local shape of the signal, they retain short counter-trend variations present in the input data. As a result, small altitude reversals remained embedded within climb and descent phases, which is incompatible with robust flight mode classification. For this reason, these approaches were not pursued further.
To explicitly address this limitation, a locally weighted regression (LOWESS—locally weighted scatterplot smoothing) approach was evaluated. LOWESS constructs a smooth profile by fitting local regressions with distance-based weights, thereby suppressing small-scale oscillations. In practice, this method effectively removed the short counter-trend segments observed with the previous filters, as shown in Figure 7a. However, it introduced a different issue: the smoothed trajectory diverged from the original profile in specific regions. These deviations reflect the locally adaptive nature of LOWESS, which does not enforce global fidelity constraints and can distort the trajectory geometry, particularly at boundaries and during slope transitions. In the present application, such deviations exceeded the acceptable tolerance and were therefore not suitable.
Figure 7.
Comparison of smoothing approaches for altitude profiles: (a) LOWESS versus (b) constrained three-pass Whittaker method.
To satisfy both requirements simultaneously, a constrained multi-pass smoothing approach based on Whittaker regularisation was adopted (seen in Figure 7b). The Whittaker formulation balances closeness to the original observations against penalties on rapid changes in gradient, producing a continuous altitude profile that follows the overall trajectory trend rather than individual point-to-point fluctuations. In contrast to the previous methods, this baseline is augmented with explicit constraints and iterative refinement. The solution is restricted to remain within a ±16 m corridor around the input trajectory, and known reference points (e.g., helipad altitudes) are enforced as fixed values.
The first refinement pass identifies and repairs short trajectory features that are inconsistent with the surrounding vertical trend, such as a brief descent embedded within an otherwise continuous climb, a brief climb embedded within a descent, or a very short level segment interrupting a sustained vertical movement. A second refinement pass re-evaluates the trajectory using a larger trend-assessment window (16 rows compared with 10 rows in the previous stage) and identifies climb, descent and near-level trajectory regimes. Altitude is then constrained to evolve continuously upward within climb regimes, continuously downward within descent regimes, and approximately constant within near-level regimes, while remaining inside the permitted correction corridor. Validated helipad-altitude points are preserved throughout all stages and are never modified.
This combined approach achieves the required balance: it eliminates local altitude reversals that interfere with flight mode assignment, while preserving the overall trajectory shape within the defined tolerance. In contrast to the classical filters and LOWESS, which satisfy only one of these criteria, the adopted method meets both simultaneously and was therefore selected for the final processing.
3.3.10. Flight Mode Assignment
Following reconstruction of physically consistent trajectories, each operation is segmented into discrete flight modes. This step constitutes the final stage of trajectory interpretation and provides the operational description required by both noise and emissions models.
Flight mode classification is based on a combination of vertical behaviour, horizontal displacement, and altitude relative to ground level. Sustained positive or negative vertical trends over a local window are used to identify climb (DEP) and descent (APP) phases. Forward flight (FOV) is characterised by significant horizontal displacement with limited vertical variation. Near-ground modes are distinguished using altitude above ground level and local displacement, with low-altitude and low-displacement conditions corresponding to hover or ground-related states (IGH, OGH, TAX, RIDL). These criteria are applied within a contextual framework that considers neighbouring trajectory segments to ensure temporal consistency and avoid spurious mode transitions.
The classification is implemented using a multi-indicator scoring framework designed to identify operationally meaningful flight phases rather than every local fluctuation present in the trajectory. For each trajectory row, local behaviour is evaluated over both short- and long-duration moving windows using indicators including cumulative horizontal displacement, net altitude change, trajectory angle, climb/descent consistency, altitude above ground level, and proximity to helipad operations. Separate scores are calculated for approach (APP), departure (DEP), forward flight (FOV), and hover conditions. A mode is assigned only when multiple indicators provide consistent evidence of the corresponding flight phase. This approach reduces sensitivity to residual ADS-B variability and prevents isolated fluctuations from generating unrealistic mode transitions. For example, short-duration altitude reversals embedded within an otherwise sustained climb or descent may be physically possible but are not necessarily representative of a distinct operational phase or flight mode relevant to noise or emissions modelling. The objective is therefore to identify the sustained flight-state sequence most representative of the intended trajectory and required by the downstream environmental assessment models.
The numerical implementation parameters used in the Zurich case study are reported in Appendix C to facilitate reproducibility. These parameters define the temporal windows used to identify sustained trajectory behaviour, the minimum displacement and altitude-change criteria used to distinguish forward flight from climb or descent phases, the altitude-above-ground thresholds used to separate hover states, and the contextual criteria applied near helipads and terminal approach zones. The selected values were developed through iterative evaluation of conditioned trajectories and quality-assurance review, with the objective of producing stable and operationally coherent flight-mode segmentation suitable for environmental modelling. While the classification framework is transferable, individual parameter values may require adjustment when applied to datasets with different sampling frequencies, trajectory quality characteristics, operational environments, or modelling objectives.
3.3.11. Model Input Parameterisation
Following flight mode assignment, additional parameters are derived to complete the set of inputs required for environmental modelling.
For each trajectory, a time sequence (t) is constructed from the original time stamps, starting at zero for each operation and increasing monotonically along the trajectory. From consecutive time stamps, a row-wise duration is computed, representing the elapsed time between successive trajectory points. In the vast majority of cases, this duration is equal to 1 s, reflecting the nominal resolution of ADS-B data, with only a small number of rows exhibiting slightly longer intervals, which are inherent to the original ADS-B observations and not introduced by the processing methodology.
This row-wise duration is directly interpreted as the time associated with each trajectory state. As such, each row is treated as an independent computational unit characterised by a flight mode, a duration, and an aircraft type. Emissions are therefore calculated on a per-row basis by applying mode-dependent fuel consumption rates and emission indices associated with the corresponding helicopter class. Total emissions for an operation are obtained by summing contributions across all rows.
Additional kinematic parameters are derived to support noise modelling. True airspeed (TAS) is computed by combining reconstructed ground motion with wind data, ensuring consistency with aircraft-relative motion. A representative vertical angle is also derived from local trajectory gradients, providing the climb or descent angle required by the noise model.
4. Demonstration Case Study: Zurich Helicopter Operations
4.1. Study Area and Operational Context
The methodology described in Section 3 is demonstrated to helicopter operations within the Zurich region, Switzerland, for the period 24 December 2025 to 4 January 2026. The study area was defined as a rectangular domain encompassing the main urbanised areas of the Canton of Zurich, including Zurich Airport and the metropolitan environment. The spatial extent of the domain is bounded by the coordinates presented in Table 2 as seen in Figure 8, corresponding to an area of approximately 1300 km2.
Table 2.
Boundaries of area of study.
Figure 8.
Zurich’s study area boundary including relevant helipads.
This domain captures a diverse and operationally relevant mix of helicopter activities, including airport-associated movements, emergency medical service (EMS) operations, and infrastructure-linked flights associated with hospital helipads and dedicated helicopter bases. The area includes several key operational nodes, notably the heliport facilities at Zurich Airport, the Swiss Air Rescue (REGA) base in Dübendorf, and multiple rooftop and ground-level hospital helipads distributed across the urban area.
Zurich provides a particularly suitable case study for the evaluation of the proposed methodology due to the combination of high population density, complex terrain, and the presence of diverse rotorcraft operations within an urban environment. Although the absolute number of helicopter movements is relatively limited compared to other transport modes, the operational context is characterised by low-altitude flight, frequent interaction with built infrastructure, and mission-specific routing constraints, particularly for emergency medical services. These characteristics result in operations that are spatially concentrated at specific infrastructure nodes and temporally irregular, but locally perceptible. As such, the study area constitutes a representative and demanding test case for assessing the applicability of ADS-B-based environmental modelling of rotorcraft operations in urban contexts.
4.2. Environmental Model Inputs
The reconstructed trajectories were used as a unified input dataset for both noise and pollutant emissions modelling. The use of a single, consistent trajectory dataset for both modelling domains ensures that noise and emissions estimates are derived from an identical representation of helicopter operations, enabling direct comparison and integrated interpretation of environmental impacts. The environmental models applied in this demonstration are:
Emissions Model
For emissions estimation, mode-dependent fuel flow and emission indices were provided by the Swiss Federal Office of Civil Aviation (FOCA) (Appendix B as given by Mr Theo Rindlisbacher by email correspondence), based on representative helicopter engine classes. These data provide pollutant-specific emission factors for nitrogen oxides (NOx), volatile organic compounds (VOC), carbon monoxide (CO), and particulate matter, which are applied according to helicopter class and assigned flight mode. Emission indices were provided for three engine operating points: Ground Idle (Taxi), Approach, and Take-off/Climb. To map these indices to the kinematic flight modes derived from ADS-B trajectories, each trajectory segment was assigned an EI corresponding to the closest FOCA operating power regime (Table 3).
Table 3.
Emissions indices assigned to each flight mode and helicopter class.
RIDL and TAX were assigned Taxi indices, APP was assigned Approach indices, and DEP, IGH, and OGH were assigned Climb indices because FOCA’s methodology groups hover and take-off/hover conditions with the climb power regime (In the FOCA helicopter emissions methodology [20], the take-off mode is defined as “hover and climb,” and a single representative power setting and emission index are assigned to that combined regime). For FOV (cruise), which is not explicitly defined in the FOCA tables, emission indices were computed by linear interpolation between the Approach and Climb (DEP) operating points. The interpolation was performed using the mean operating power values specified in the FOCA helicopter emissions methodology [20] for representative one-hour operations, namely 80% for single-engine helicopters, 65% for twin-engine helicopters, and 62% for heavy helicopters. Helicopters were assigned to these representative classes according to the classification presented in Table 1 and the corresponding emission indices provided in Appendix B. These power settings are used by FOCA to represent average cruise conditions when estimating emissions over a complete flight cycle and therefore provide a practical basis for estimating emissions during FOV operations.
The corresponding FOV emission indices were calculated as:
where EIFOV, EIAPP and EIDEP are the emission indices for FOV, Approach and Departure respectively, and PFOV, PAPP and PDEP are the corresponding operating powers.
Noise Model
For noise assessment, the trajectory dataset was formatted to meet the input requirements of NORAH2, a standalone helicopter noise model published by EASA in 2024 [21]. The required parameters include aircraft identification (used to select the appropriate noise model configuration), time sequencing, three-dimensional position (X, Y, Z), ground speed, vertical flight path angle, and flight mode classification. Additional parameters required by NORAH2, are slip and roll angles. Slip angle was therefore assumed to be 0°, consistent with the NORAH2 documentation, which indicates that this condition is representative of most rotorcraft operations. Roll angle was also set to 0° throughout the trajectories. This simplification was adopted because the study focuses on reconstructing the principal trajectory descriptors governing environmental modelling, namely aircraft position, altitude, speed, flight-path angle and operational mode. While localised bank angles occur during turning manoeuvres, their influence is considered secondary relative to these primary trajectory parameters and was therefore neglected for the purposes of this methodological demonstration.
Where an exact helicopter type was unavailable within the NORAH2 database, the closest available NORAH helicopter was selected as an acoustic proxy. Aircraft-specific adjustment factors were derived from differences in available noise certification levels between the observed helicopter and the selected proxy aircraft. For OGH, RIDL and TAX operations, the same aircraft-substitution adjustment as the corresponding FOV condition was applied, as certification-equivalent reference metrics are not available for these operational states. The resulting proxy assignments and adjustment factors are provided in Appendix D. While this study focuses, for its noise assessment, on NORAH2, the conditioned trajectories provide a detailed representation of aircraft position and kinematics over time, which constitutes the type of input generally required by trajectory-based noise modelling approaches.
4.3. Study Period and Representativeness
The analysis covers a 12-day period from 24 December 2025 to 4 January 2026 (inclusive). This timeframe was selected to provide a manageable dataset for methodological demonstration while capturing a complete sequence of helicopter operations within the defined study area.
The selected period includes the Christmas and New Year holiday season, which may influence the volume and composition of helicopter activity observed during the study period. Consequently, the results should not be interpreted as representative of typical annual operational conditions.
The objective of this study is not to derive statistically representative annual estimates, but to demonstrate the applicability of the proposed methodology under real operational conditions. As such, the selected timeframe is considered sufficient to capture a range of typical rotorcraft activities, and the issues associated with ADS-B recording.
It is important to note that the results presented in subsequent sections reflect the operations observed within this specific period and should not be interpreted as representative of long-term averages. The methodology itself, however, is not constrained by the duration of the input dataset and can be applied to extended time periods or continuous data streams as required for regulatory or planning purposes.
By explicitly separating methodological demonstration from long-term representativeness, the case study provides a controlled and transparent basis for evaluating the performance of the ADS-B conditioning and environmental modelling framework, while maintaining scalability to larger datasets and broader temporal scopes.
4.4. Application of the ADS-B Conditioning Methodology
The methodology described in Section 3 was applied to the ADS-B dataset for the Zurich study area without modification. The processing workflow was implemented as a continuous pipeline, transforming raw state-vector data into physically consistent, operation-resolved trajectories suitable for environmental modelling.
The application of the methodology involved sequential execution of the main processing stages, including data cleaning, trajectory reconstruction, operation segmentation, altitude correction, helipad anchoring, kinematic smoothing, and flight mode assignment.
Particular attention was given to the handling of low-altitude flight behaviour and infrastructure interactions, which are critical for rotorcraft operations in urban environments. The integration of helipad geometry and terrain elevation data enabled the reconstruction of physically plausible altitude profiles and ensured that take-off, landing, and near-ground phases were represented consistently with known infrastructure constraints.
No manual intervention was applied during the processing of individual trajectories. All reconstruction and correction steps were performed using rule-based procedures defined in Section 3, ensuring reproducibility and transparency of the results.
The output of this process is a set of reconstructed helicopter operations, each represented as a time-ordered sequence of trajectory points with consistent spatial coordinates, altitude, and kinematic properties, and with an assigned flight mode at each time step. These trajectories constitute the basis for the subsequent noise and emissions assessments presented in Section 5.
4.5. Reconstructed Operations and Dataset Characteristics
The initial ADS-B dataset comprised 73,213 state-vector records. Following application of the cleaning and reconstruction procedures, 3894 rows (5.3%) were removed due to irreconcilable inconsistencies, including intrusion artefacts and non-repairable trajectory segments.
At the operation level, summarised in Table 4, 153 candidate operations were initially identified. Of these, 6 operations (3.9%) were discarded. Two operations were excluded due to insufficient length (fewer than five trajectory points), which prevents meaningful reconstruction of kinematic behaviour. The remaining four discarded operations exhibited severe artefacts, characterised by extended freeze periods combined with large spatial discontinuities and implausible heading changes, rendering physically consistent reconstruction infeasible.
Table 4.
Data cleaning statistics.
A further 12 operations (7.8%) were retained but partially trimmed, with segments removed where identified as intrusion artefacts within otherwise coherent trajectories. The remaining operations were either directly usable or contained freeze segments that were deemed repairable and successfully reconstructed through interpolation constrained by helicopter performance limits.
Figure 9 presents the reconstructed helicopter trajectories over the study area, illustrating the spatial distribution of operations and their relationship with key infrastructure elements. The results show that helicopter activity is structured around a limited number of operational nodes, notably Zurich Airport heliport facilities, the REGA base in Dübendorf, and several hospital helipads.
Figure 9.
Helicopter operations in canton of Zurich during the period of study.
The altitude correction process was quantitatively characterised to assess the reliance on different reference mechanisms. A total of 73.5% of operations contained at least one helipad event and were corrected using direct pad-based anchoring. Of the remaining operations, 10.9% were corrected using continuity-based proxies derived from other operations of the same aircraft, while 15.6% relied on independent inference from terminal or terrain-consistent trajectory segments. The magnitude of applied vertical shifts remained limited, with 93.2% of operations requiring corrections within ±8 m and all operations within ±16 m, consistent with ADS-B altitude quantisation effects. No large corrections (>16 m) were required. Post-correction validation showed no persistent negative altitude above ground level outside pad environments, confirming consistency with terrain constraints.
5. Results
The following results are presented as a demonstration of the application of the conditioned ADS-B trajectories to selected environmental modelling approaches, illustrating the type of outputs that can be generated from the proposed methodology.
Consequently, the results presented in this section are intended to illustrate the type of outputs that can be generated by the proposed methodology rather than to provide validated environmental assessments.
5.1. Operational Characteristics
The distribution of operations by helicopter type is highly skewed, with EC45 accounting for 75.5% of all operations. Secondary contributions arise from B429 (6.1%), AS350 (5.4%), and R44 (4.1%), while all remaining aircraft types individually represent less than 2% of operations. This strong concentration of activity within a single helicopter class is relevant for the interpretation of both noise and emissions results, as the overall environmental impact is largely driven by the operational and performance characteristics of the EC45 fleet.
5.2. Noise Results
For noise assessment, the analysis domain was restricted to the urban areas of Zurich and Dübendorf in order to focus on populated zones where exposure is most relevant.
Helicopter noise exposure was assessed using event-based indicators derived from the reconstructed trajectories and processed through the NORAH2 modelling framework. Given the relatively low number of operations (approximately 12 per day), averaged noise metrics such as LAeq16h or Lden were not considered representative, as they dilute the contribution of discrete events and do not reflect perceptible disturbance. Instead, the analysis focuses on maximum sound levels (LAmax) and the spatial distribution of event counts exceeding 60 dB (NA60).
The LAmax contours (Figure 10) indicate the spatial extent over which helicopter operations produce peak noise levels above 60 dB and 65 dB during the study period. These contours are primarily concentrated around key operational nodes, including Zurich Airport heliport facilities, the REGA base in Dübendorf, and hospital helipads within the urban area. Additional elongated patterns reflect approach and departure paths connecting these nodes, highlighting the corridor-like nature of helicopter operations.
Figure 10.
Spatial distribution of maximum sound levels (LAmax) generated by helicopter operations in the Zurich study area over the analysis period (24 December 2025–4 January 2026).
The NA60 contours (Figure 11) provide a complementary perspective by quantifying the frequency of noise events exceeding 60 dB (N60). The highest event densities are observed in the vicinity of the main operational bases, where repeated arrivals and departures result in cumulative exposure. Outside these areas, event counts decrease rapidly, indicating that noise exposure is spatially concentrated and closely linked to infrastructure.
Figure 11.
Spatial distribution of helicopter noise event counts exceeding 60 dB (NA60) in the Zurich study area over the analysis period (24 December 2025–4 January 2026). Numbers in circles indicate the average number of daily noise events above 60 dB (LAmax > 60 dB).
Taken together, the LAmax and NA60 results illustrate that helicopter noise in the study area is characterised by episodic, high-level events rather than sustained background noise. While the contribution to averaged noise indicators is limited, the spatial distribution and recurrence of these events demonstrate a measurable and localised exposure that is not captured by conventional metrics. This supports the use of event-based indicators as a more appropriate basis for assessing the environmental impact of rotorcraft operations.
5.3. Emissions Results
Helicopter emissions were estimated using a trajectory-based approach in which fuel consumption and pollutant outputs were computed at the level of individual trajectory segments and aggregated over the study period. The calculation follows the FOCA helicopter emissions framework, with emissions derived as a function of flight mode, time in mode, and helicopter class. The pollutants considered include fuel consumption, nitrogen oxides (NOx), volatile organic compounds (VOC), carbon monoxide (CO), and particulate matter (non volatile -nvPME-, and total -PMF- as well as number of non-volatile particulate matter -nvPNF-).
Over the 12-day study period (as shown in Table 5), total fuel consumption was estimated at 2435 kg, with 12,023 g of NOx, 9238 g of VOC, and 63,827 g of CO. Average daily emissions amount to approximately 203 kg of fuel, 1002 g of NOx, 770 g of VOC, 5319 g of CO, 730 g of nvPMF and 1113 g of PMF. The number of non-volatile particulates amounts to 9.57 × 10¹⁸ which is equivalent to 3.93 × 10¹⁵ nvPNF/kg fuel. While these totals are modest in comparison with other urban emission sources, they provide a quantified basis for assessing the contribution of helicopter operations to local air pollutant inventories.
Table 5.
Operational statistics, fuel consumption, and estimated pollutant emissions by helicopter type for the study period (24 December 2025–4 January 2026), including total values and corresponding daily averages.
Figure 12 presents the spatial distribution of non-volatile particulate number emitted (nvPNF) over the study period, aggregated on a 250 m grid. nvPNF is used as an example for emissions and serves as an illustration of the level of spatial resolution that can be achieved using conditioned ADS-B trajectory data. This resolution enables identification of the most affected areas within the study domain, which in this case are concentrated around key operational nodes, notably the REGA base in Dübendorf and the main hospital helipads within the Zurich urban area, reflecting repeated arrivals and departures associated with emergency medical service operations.
Figure 12.
Spatial distribution of non-volatile particulate number emitted in the Zurich study area, expressed as number per 250 m grid cell over the study period (24 December 2025–4 January 2026).
More generally, the results demonstrate that the methodology allows flexible generation of spatially resolved outputs, where grid size, temporal aggregation, and pollutant selection can be adapted depending on the application. This provides a practical basis for deriving detailed, operation-driven environmental indicators beyond those available from conventional cycle-based inventory methods.
While the results are presented as aggregated values over the study period, the methodology allows alternative temporal normalisations (e.g., per day) and alignment with other transport sectors, enabling comparison of the magnitude and spatial extent of helicopter-related impacts. Regardless of their relative contribution, the derived outputs provide a transparent and reproducible record of activity-based emissions, supporting both longitudinal analysis and evidence-based reporting.
6. Validation of Source Data and Kinematic Reconstruction
Two complementary validation exercises were undertaken. The first assessed the agreement between the OpenSky Network trajectories used as source data and an independent ADS-B provider (ADSB Exchange). The second assessed the effect of the kinematic reparameterisation and altitude reassociation procedure described in Section 3.3.5.
It should be noted that ADS-B data providers such as OpenSky Network, Flightradar24, FlightAware and ADSB Exchange operate independent receiver networks, often comprising different combinations of volunteer-operated and commercial ground stations. Consequently, receiver density, geographical coverage and message reception rates vary between providers. As a result, trajectory gaps observed in one dataset may not necessarily be present in another, as an alternative provider may benefit from more favourable receiver coverage or reception conditions within a particular area.
6.1. Independent Validation of Source Trajectory Data
The study’s source data (OpenSky Network) was independently validated for completeness and level of agreement using trajectory data obtained from the ADS-B Exchange platform. A sample comprising the activity of nine distinct rotorcraft (43% of the fleet represented in the study) for a full day (1 January 2026), corresponding to approximately 20% of all trajectory records and 18% of reconstructed operations, was extracted and compared against the OpenSky dataset.
To enable direct comparison between datasets exhibiting different sampling characteristics and horizontal trajectory geometries, altitude profiles were compared at common spatial locations. Using one trajectory as reference, comparison locations were generated at 100 m intervals along the flight path. All trajectory points from the comparison dataset were first projected onto the reference trajectory. Where a comparison location did not coincide exactly with a projected trajectory point, the corresponding altitude was estimated by linear interpolation between the adjacent projected points. This approach ensured that altitude values were compared at equivalent spatial positions rather than at the nearest recorded ADS-B message, thereby reducing the influence of differences in sampling frequency, message timing and trajectory point density between datasets.
The comparison therefore evaluated agreement at common spatial locations along the flight path rather than at matching timestamps or recorded message positions. This approach is particularly important when comparing independent ADS-B providers, as each source may contain different numbers of observations, different message intervals and slightly different horizontal trajectories due to positional jitter. By referencing all observations to a common spatial framework, the comparison isolates genuine differences in altitude profiles while minimising artefacts arising from sampling characteristics.
The agreement between the two independent ADS-B providers was assessed using several complementary statistical indicators (Appendix E, Table A1). The Mean Difference, which quantifies systematic bias between datasets, ranged between −0.35 m and +0.21 m. These values indicate the absence of any meaningful systematic offset between the OpenSky and ADS-B Exchange altitude profiles.
The Median Difference was equal to 0 m for all aircraft, indicating that the central tendency of the altitude measurements was identical between both datasets and that positive and negative residuals were evenly distributed.
The Standard Deviation of Differences, which describes the spread of residual errors, ranged from 1.49 m to 6.48 m. These values are small when compared with the altitude range of the analysed flight profiles, indicating very limited random disagreement between data sources.
The Mean Absolute Difference, representing the average magnitude of the discrepancies irrespective of sign, ranged between 0.57 m and 2.22 m. This demonstrates that the altitude reported by the two independent platforms typically differed by only a few metres throughout the trajectory.
The Median Absolute Difference ranged between 0.00 m and 1.21 m. For several aircraft, the median absolute difference was equal to zero, indicating that more than half of the comparison points exhibited identical altitude values after spatial alignment.
The Root Mean Square Error (RMSE), which places greater emphasis on larger discrepancies, ranged from 1.49 m to 6.48 m. These values confirm that even the largest deviations remained small and that substantial mismatches between the two datasets were rare.
The Pearson Correlation Coefficient (r) ranged from 0.9992 to 1.0000, while the Coefficient of Determination (R2) ranged from 0.9984 to 0.9999. These values indicate near-perfect agreement in the shape and variability of the altitude profiles, demonstrating that the OpenSky trajectories reproduce virtually all of the altitude variation independently observed in the ADS-B Exchange dataset.
Overall, the comparison demonstrates that the OpenSky trajectory dataset used throughout this study is both complete and highly consistent when compared against an independent ADS-B source, providing confidence in its suitability for subsequent trajectory reconstruction and environmental modelling.
6.2. Validation of Kinematic Reconstruction and Altitude Reassociation
The second part of the validation assessed the effect of the kinematic reconstruction procedure described in Section 3.3.5, whereby XY coordinates were reparameterised to obtain a physically coherent speed profile and altitude values subsequently reassociated through spatial interpolation.
The objective of this validation was to determine whether the reconstruction process altered the original spatial-altitude characteristics of the source trajectory data. The reconstructed trajectories were therefore compared against the original OpenSky trajectories using the same spatially aligned comparison framework described previously.
The results (Appendix E, Table A2) demonstrate that the reconstruction process preserved the original trajectory profiles with a very high degree of fidelity. Mean Differences ranged from −1.16 m to −0.04 m, while the Median Difference was equal to 0.00 m for all aircraft, indicating the absence of systematic bias introduced by the reassociation process. Mean Absolute Differences ranged from 0.23 m to 4.62 m, confirming that local deviations remained small despite the deliberate modification of the horizontal trajectory coordinates.
Pearson correlation coefficients ranged from 0.9986 to 1.0000 and coefficients of determination (R2) ranged from 0.9971 to 1.0000. These results indicate that the reparameterisation procedure preserved between 99.71% and 100% of the original altitude-profile variability whilst producing a kinematically coherent spatial distribution of trajectory points.
7. Discussion
7.1. Positioning of the Methodology Within the State of the Art
Raw ADS-B observations of rotorcraft operations are affected by low-altitude signal loss, positional artefacts, trajectory discontinuities, and inconsistencies with fixed infrastructure such as helipads. In their original form, these data do not provide a sufficiently reliable basis for environmental modelling.
Although ADS-B processing research has substantially advanced the use of surveillance data in aviation studies, most previous work has addressed individual data-quality issues in isolation rather than simultaneously as required for environmental modelling applications. The results of this study demonstrate that such observations can be transformed into physically consistent flight trajectories suitable for noise and emissions assessment.
Consequently, the proposed methodology reconstructs missing segments, enforces physical consistency, and derives operational parameters such as flight modes and time-in-mode required by downstream environmental models. It therefore provides an intermediate layer between raw surveillance data and application-specific environmental modelling.
7.2. Methodological Implications of the Reconstruction Approach
The conditioning process combines artefact removal, trajectory reconstruction, altitude correction, and infrastructure alignment within a single workflow to produce consistent trajectories suitable for environmental modelling.
This has several methodological implications. The reconstruction process does not rely on predefined flight profiles or assumptions about standard operations. It is also applicable in environments characterised by low-altitude flight and complex infrastructure interactions, where conventional approaches are less effective. Finally, the integration of flight-mode assignment ensures that the resulting dataset directly satisfies the input requirements of downstream modelling frameworks and can be reused across multiple analytical applications.
7.3. Demonstration Through Noise and Emissions Applications
The reconstructed trajectories were applied to both noise and emissions modelling, demonstrating the practical usability of the methodology. Using a common trajectory dataset ensures that both analyses are based on a consistent representation of operations.
These applications should be interpreted as demonstrations of methodological capability rather than validated impact assessments. The uncertainties associated with the noise and emissions models are independent of the trajectory reconstruction process and would require dedicated validation, including targeted measurements, to quantify absolute accuracy.
The results demonstrate that a single reconstructed ADS-B dataset can support multiple environmental modelling applications without additional conditioning.
7.4. Implications for Environmental Assessment and Applicability
By providing an activity-based representation of operations, the methodology enables rotorcraft movements to be incorporated within the same analytical framework as other transport modes, rather than being excluded or approximated through simplified assumptions.
The reconstructed trajectories allow environmental indicators to be derived from actual operations, capturing spatial concentration, temporal variability, and infrastructure interactions that are not represented in aggregated methods. This is particularly relevant for helicopter operations, where impacts are localised and strongly dependent on operational context.
The methodology is transferable to other study areas and scalable to larger datasets, provided that suitable trajectory data and supporting inputs (e.g., terrain, infrastructure, fleet characteristics) are available. While ADS-B data are used in this study, the approach is not intrinsically dependent on this source and can be extended to other surveillance or tracking datasets with comparable resolution. This makes the framework applicable to a wide range of contexts, including regional assessments and emerging low-altitude aviation systems.
8. Limitations
The objective of the methodology is to derive environmental-model-ready trajectories from ADS-B data supplemented by widely available ancillary datasets, rather than to rely on additional surveillance or operational sources. Consequently, periods of signal loss associated with terrain masking or low-altitude operations near heliports remain inherently uncertain. Although the proposed workflow applies physical, operational, terrain, and infrastructure constraints to reconstruct missing trajectory segments in a plausible manner, the exact flight path followed during these intervals cannot be known with certainty. This residual uncertainty therefore constitutes the principal limitation of the trajectory-conditioning methodology.
The environmental outputs derived from the reconstructed trajectories are presented as a demonstration of applicability rather than validated impact assessments. Emissions estimates, in particular, rely on representative indices assigned by helicopter class, introducing uncertainty due to the use of generic emission factors rather than aircraft-specific performance data.
Finally, the case study was intentionally restricted to a 12-day observation period in order to provide a manageable demonstration dataset. Such a short period does not correspond to the averaging periods typically used in environmental noise metrics and as such the resulting environmental outputs should not be interpreted as representative of annual helicopter activity.
9. Conclusions and Further Research
This study formalises the problem of converting incomplete and artefact-prone ADS-B observations of rotorcraft activity into physically coherent and operationally meaningful datasets, a challenge that is not explicitly addressed in existing literature. It does so by combining trajectory conditioning, reconstruction, and operational characterisation within a single workflow, bridging previously disconnected research areas. In addition, it demonstrates that the resulting datasets can serve as a unified input layer for multiple environmental modelling domains, enabling consistent, spatially resolved analysis based on observed operations rather than predefined flight profiles.
The methodology is demonstrated using a limited sample of ADS-B trajectories of helicopter operations in the Zurich area and, as such, the modelling outputs are intended as proof of capability rather than validated assessments.
By providing a reproducible link between surveillance data and model-ready inputs, the methodology enables helicopter operations to be represented within broader environmental analyses in a manner comparable to other transport sectors. This contributes to improving the transparency, completeness, and consistency of environmental reporting and supports evidence-based evaluation of localised impacts.
Further research should focus on the development of a generalised implementation of the methodology in the form of an integrated processing tool. Such a tool would encapsulate the different stages of the workflow and allow application to new study areas. Extending the methodology to longer time periods and multiple regions would further support its application to regulatory, planning, and emerging low-altitude aviation contexts.
Author Contributions
Conceptualization, M.G.C.G.; Methodology, M.G.C.G.; Validation, M.G.C.G. and K.B.; Formal analysis, M.G.C.G.; Investigation, M.G.C.G. and K.B.; Data curation, M.G.C.G. and K.B.; Writing—original draft, M.G.C.G.; Writing—review & editing, K.B.; Visualization, M.G.C.G.; Supervision, M.G.C.G. and K.B.; Funding acquisition, K.B. All authors have read and agreed to the published version of the manuscript.
Funding
This research received no external funding.
Data Availability Statement
Data available on request.
Acknowledgments
The authors would like to thank Theo Rindlisbacher (FOCA) for providing the helicopter emission indices used in this study. The authors gratefully acknowledge The OpenSky Network for providing access to ADS-B data used in this study.
Conflicts of Interest
The authors declare no conflict of interest.
Appendix A. List of Helipads
| Name | East LV95 | West LV95 | Elevation [m] |
| LSZH Heliport West | 2,683,668 | 1,256,134 | 421.6 |
| REGA Base | 2,690,508 | 1,250,167 | 438.1 |
| REGA Centre | 2,685,451 | 1,256,991 | 432 |
| Helipad 1 PaulClairmont (rooftop) | 2,679,980 | 1,246,730 | 512 |
| Helipad 2 PaulClairmont (ground level) | 2,680,111 | 1,246,669 | 464 |
| Helipad 1 Schmelzberg | 2,684,015 | 1,247,941 | 478 |
| Children’s Hospital | 2,685,588 | 1,245,161 | 485 |
| Kantonsspital 1 | 2,697,167 | 1,262,641 | 474 |
| Kantonsspital 2 | 2,697,121 | 1,262,659 | 464 |
| Clinic Hirslanden | 2,685,934 | 1,245,131 | 504 |
| Note: East LV95 and West LV95 correspond to national projected coordinate system of the Swiss Federation. | |||
Appendix B. Fuel Consumption and Emission Index per Helicopter Class
| Code | Source | Manufacturer ID | Type_ID | Engine | Synonyms | Power | Test Year | Mutations Datum | Remarks |
| H222 | FOCA | Rolls Royce | H | 250-C20 | 250-C20B/F, Allison T63 | 420 | 2024 | 07/08/2025 | Single Engine, Cl 87%, App 46%, Taxi 13%, Rohkamp |
| H202 | FOCA | Rolls Royce | H | 250-C20 | 250-C20B/F, Allison T63 | 420 | 2024 | 07/08/2025 | Twin Engine, Cl 78%, App 38%, Taxi 7%, Rohkamp |
| HF30 | FOCA | Turbomeca | H | Makila 1A1 | Makila (Puma/Cougar) | 1800 | 2008 | 07/08/2025 | Large Twin Cl 66% Ap 32%, GI 7%, FOCA/DLR |
| Code | FF_Cl (kg/s) | FF_App (kg/s) | FF_Taxi (kg/s) | NOx_Cl (g/kg) | NOx_App (g/kg) | NOx_Taxi (g/kg) | VOC_Cl (g/kg) | VOC_App (g/kg) | VOC_Taxi (g/kg) | CO_Cl (g/kg) | CO_App (g/kg) | CO_Taxi (g/kg) |
| H222 | 0.0253 | 0.0163 | 0.0091 | 5 | 5 | 5 | 1 | 2 | 13 | 9 | 29 | 78 |
| H202 | 0.0233 | 0.0146 | 0.0078 | 5 | 5 | 5 | 1 | 3 | 33 | 16 | 35 | 97 |
| HF30 | 0.0776 | 0.0529 | 0.0261 | 4 | 3.2 | 2.1 | 0.4 | 0.5 | 0.6 | 4.6 | 7.1 | 18.5 |
| Estimated Exit Plane nvPM EImass | Estimated Total EImass (FOA4 Based) | Estimated Engine Exit Plane nvPM EI Number | |||||||
| Code | nvPMF_Cl (g/kg) | nvPMF_App (g/kg) | nvPMF_Taxi (g/kg) | PMF_Cl (g/kg) | PMF_App (g/kg) | PMF_Taxi (g/kg) | nvPNF_Cl (#/kg) | nvPNF_App (#/kg) | nvPNF_Taxi (#/kg) |
| H222 | 0.32 | 0.3 | 0.21 | 0.44496 | 0.46146 | 0.33917 | 2.70 × 10¹⁵ | 4.70 × 10¹⁵ | 6.20 × 10¹⁵ |
| H202 | 0.32 | 0.29 | 0.19 | 0.44496 | 0.50771 | 0.44257 | 3.10 × 10¹⁵ | 5.00 × 10¹⁵ | 6.50 × 10¹⁵ |
| HF30 | 0.316 | 0.15 | 0.026 | 0.39536 | 0.227085 | 0.078662 | 4.37 × 10¹⁵ | 4.37 × 10¹⁵ | 2.44 × 10¹⁵ |
| Note: Emission indices as provided by Mr Theo Rindlisbacher (Federal Office of Civil Aviation of Switzerland). | |||||||||
Appendix C. Principal Flight-Mode Classification Parameters Used in the Zurich Case Study
Below is a summary of the principal implementation parameters used in the Zurich case study. These values act collectively within the scoring framework and should not be interpreted as independent flight-mode definitions.
| Parameter | Value | Purpose |
| Short evaluation window | 5 rows | Identification of local trajectory behaviour |
| Long evaluation window | 11 rows | Identification of sustained trajectory behaviour |
| Altitude-change deadband | 1.5 m | Suppression of residual altitude jitter in trend calculations |
| Ground-contact threshold | 2 m AGL | Identification of surface-contact conditions |
| Hover threshold | 20 m AGL | Separation of IGH and OGH |
| Taxi displacement threshold | 4 m | Separation of TAX and RIDL states |
| Terminal approach zone | 220 m | Contextual identification of approach phase near touchdown |
| Minimum touchdown drop | 3 m | Retention of touchdown row within APP phase |
| Long-window displacement criterion (FOV) | 90 m (long window) | Contributes to discrimination between hover-like and translational flight behaviour |
| Short-window displacement criterion (FOV) | 25 m (short window) | Confirms local translational movement |
| Maximum cumulative altitude change (FOV) | ±12 m | Exclusion of sustained climb/descent phases from FOV |
| Long-window descent criterion (APP) | −12 m | Contributes to identification of sustained descent behaviour |
| Long-window climb criterion (DEP) | +12 m | Contributes to identification of sustained climb behaviour |
| Minimum climb/descent consistency | 65% | Requirement for a dominant vertical trend within the evaluation window |
| Maximum counter-trend reversal length | 12 | Identification of short reversals embedded within a sustained climb or descent |
Appendix D. Helicopter-to-NORAH Proxy Mapping and Mode-Specific Acoustic Adjustment Factors
| Rotorcraft ICAO Code | NORAH Proxy | Flight Mode | |||||
| APP | DEP | FOV | OGH | RIDL | TAX | ||
| A109 | A109 | 0 | 0 | 0 | 0 | 0 | 0 |
| A119 | EC120 | 0.5 | 5.3 | 4 | 4 | 4 | 4 |
| A139 | A109 | 2.9 | −1.4 | 1.9 | 1.9 | 1.9 | 1.9 |
| A169 | S92 | −1.1 | −4.7 | −8.9 | −8.9 | −8.9 | −8.9 |
| A189 | S92 | 1.6 | −3.3 | −2 | −2 | −2 | −2 |
| ALO3 | AS350 | −2 | −2.5 | −1 | −2 | −2 | −2 |
| AS50 | AS350 | 0 | 0 | 0 | 0 | 0 | 0 |
| AS55 | A109 | 1.9 | −3 | −0.9 | −0.9 | −0.9 | −0.9 |
| AS65 | S92 | −1.4 | −1.6 | −6.7 | −6.7 | −6.7 | −6.7 |
| B06 | R66 | 0 | 0 | 0 | 0 | 0 | 0 |
| B407 | EC120 | 0 | 0 | 0 | 0 | 0 | 0 |
| B412 | B412 | 0 | 0 | 0 | 0 | 0 | 0 |
| B427 | B412 | −4.2 | −5.2 | −3.8 | −3.8 | −3.8 | −3.8 |
| B429 | EC135 | −1.2 | 0.4 | 4.7 | 4.7 | 4.7 | 4.7 |
| B430 | B412 | −1.6 | −1.3 | −1.2 | −1.2 | −1.2 | −1.2 |
| B505 | EC120 | −0.8 | 1.4 | 0.1 | 0.1 | 0.1 | 0.1 |
| BK17 | EC135 | −0.8 | 1.4 | 6.2 | 6.2 | 6.2 | 6.2 |
| CH47 | S92 | 2 | 0 | 0 | 0 | 0 | 0 |
| EC20 | EC120 | 0 | 0 | 0 | 0 | 0 | 0 |
| EC25 | A109 | 7.7 | 3.9 | 4.7 | 4.7 | 4.7 | 4.7 |
| EC30 | EC120 | −0.8 | −4.4 | −3.2 | −3.2 | −3.2 | −3.2 |
| EC35 | EC135 | 0 | 0 | 0 | 0 | 0 | 0 |
| EC45 | EC135 | −1.3 | −0.5 | 2.3 | 2.3 | 2.3 | 2.3 |
| EC55 | A109 | 4.5 | 0.5 | 0.1 | 0.1 | 0.1 | 0.1 |
| EC75 | A109 | 3.9 | −1.7 | 2.2 | 2.2 | 2.2 | 2.2 |
| G2CA | Cabri | 0 | 0 | 0 | 0 | 0 | 0 |
| H160 | A109 | −0.2 | −1.8 | −0.2 | −0.2 | −0.2 | −0.2 |
| H269 | H269 | 0 | 0 | 0 | 0 | 0 | 0 |
| MI8 | S92 | −1 | 0.2 | −3.5 | −3.5 | −3.5 | −3.5 |
| R22 | R22 | 0 | 0 | 0 | 0 | 0 | 0 |
| R44 | R44 | 0 | 0 | 0 | 0 | 0 | 0 |
| R66 | EC120 | −2.3 | 1.9 | 0.4 | 0.4 | 0.4 | 0.4 |
| S92 | S92 | 0 | 0 | 0 | 0 | 0 | 0 |
Appendix E. Aircraft-Level Validation Statistics for Independent ADS-B and Reconstruction Comparisons
This appendix presents the detailed validation statistics obtained for each rotorcraft included in the validation sample. Two independent comparisons were performed:
- Raw OpenSky trajectories versus ADSB Exchange trajectories.
- Raw OpenSky trajectories versus reparameterised OpenSky trajectories.
Statistics are reported after spatial alignment of the trajectories and are intended to quantify both the agreement between independent ADS-B providers and the effect of the reconstruction methodology as explained in Section 3.3.5.
Table A1.
Validation statistics for Raw OpenSky versus ADSB Exchange altitude profiles.
Table A2.
Validation statistics for Raw OpenSky versus Reparameterised OpenSky altitude profiles.
References
- Schaefer, M.; Strohmeier, M.; Lenders, V.; Martinovic, I.; Wilhelm, M. Bringing up OpenSky: A large-scale ADS-B sensor network for research. In Proceedings of the 13th International Symposium on Information Processing in Sensor Networks (IPSN), Berlin, Germany, 15–17 April 2014; pp. 83–94. Available online: https://opensky-network.org (accessed on 23 April 2026).
- Olive, X. Trajectory preprocessing for aviation data analytics: Filtering and quality control of ADS-B data. J. Open Aviat. Sci. 2024, 4, 1–15. [Google Scholar] [CrossRef] [Scilit]
- Sun, J.; Ellerbroek, J.; Hoekstra, J. Aircraft trajectory reconstruction and analysis using ADS-B data. In Proceedings of the SESAR Innovation Days, Athens, Greece, 2–5 December 2019; Available online: https://www.sesarju.eu (accessed on 23 April 2026).
- Tabassum, A.; Lanzi, P.; Ghasemi, A.; Humphreys, T.E. UAT ADS-B Data Anomalies and the Effect of Flight Parameters on Anomaly Detection. Data 2018, 3, 19. [Google Scholar] [CrossRef] [Scilit]
- Olive, X.; Krummer, J.; Figuet, B.; Richard Alligier, R. Filtering Techniques for ADS-B Trajectory Preprocessing. J. Open Aviat. Sci. 2025, 2, 05543928. [Google Scholar] [CrossRef] [Scilit]
- Pretto, M.; Dorbolò, L.; Giannattasio, P. Exploiting High-Resolution ADS-B Data for Flight Operation Reconstruction towards Environmental Impact Assessment. J. Open Aviat. Sci. 2023, 1. [Google Scholar] [CrossRef] [Scilit]
- Sun, J.; Ellerbroek, J.; Hoekstra, J. Reconstructing Aircraft Turn Manoeuvres for Trajectory Analyses Using ADS-B Data. In Proceedings of the 9th SESAR Innovation Days, Athens, Greece, 2–5 December 2019. [Google Scholar]
- Perrichon, R.; Gendre, X.; Klein, T. Hidden Markov Models and Flight Phase Identification. J. Open Aviat. Sci. 2024, 2, 7269. [Google Scholar] [CrossRef] [Scilit]
- Hoole, M.; Booker, J.; Cooper, J. Helicopter flight manoeuvre statistics via ADS-B: An initial investigation using the OpenSky Network. Eng. Proc. 2021, 13, 10. [Google Scholar] [CrossRef] [Scilit]
- Hünemohr, N.; Litzba, J.; Rahimi, F. Usage monitoring of helicopter gearboxes with ADS-B flight data. Aerospace 2022, 9, 647. [Google Scholar] [CrossRef] [Scilit]
- Hünemohr, N.; Bauer, M.; Kleikemper, J.; Peukert, M. Analysis of helicopter flights in urban environments for UAV traffic management. Eng. Proc. 2022, 28, 10. [Google Scholar] [CrossRef] [Scilit]
- Chin, H.-J.; Payan, A.P.; Johnson, C.; Mavris, D.N. Knowledge discovery within ADS-B data from routine helicopter operations. In Proceedings of the AIAA AVIATION Forum, Online, 15–19 June 2020; pp. 2020–2872. Available online: https://arc.aiaa.org (accessed on 23 April 2026).
- Filippone, A.; Parkes, B.; Bojdo, N.; Kelly, T. Prediction of aircraft engine emissions using ADS-B flight data. Aeronaut. J. 2021, 125, 123–145. [Google Scholar] [CrossRef] [Scilit]
- Pretto, A.; Dorbolò, L.; Giannattasio, P.; Zanon, A. Aircraft operation reconstruction and airport noise prediction from high-resolution flight tracking data. Transp. Res. Part D 2024, 125, 104397. [Google Scholar] [CrossRef] [Scilit]
- Teoh, R.; Engberg, Z.; Shapiro, M.; Dray, L.; Stettler, M.E.J. The high-resolution global aviation emissions inventory based on ADS-B (GAIA). Atmos. Chem. Phys. 2024, 24, 725–750. [Google Scholar] [CrossRef] [Scilit]
- Soares Roque, G.; Reichmuth, J. Automating the estimation of noise and emissions near airports with ADS-B data. J. Open Aviat. Sci. 2025, 2, 1–19. [Google Scholar] [CrossRef] [Scilit]
- Cebrián Gómez, M.G.; Banitsas, K. Helicopter noise modelling in an urban setting: A NORAH2 demonstration for Cannes, France. Aerospace 2026, 13, 37. [Google Scholar] [CrossRef] [Scilit]
- European Union Aviation Safety Agency (EASA). NORAH2 Rotorcraft Noise Model Documentation. 2024. Available online: https://www.easa.europa.eu (accessed on 23 April 2026).
- Federal Aviation Administration (FAA). Aviation Environmental Design Tool (AEDT) Technical Manual, Version 3g; FAA: Washington, DC, USA, 2024. Available online: https://aedt.faa.gov (accessed on 23 April 2026).
- Rindlisbacher, T.; Chabbey, A. Guidance on the Determination of Helicopter Emissions; FOCA: Bern, Switzerland, 2015; Available online: https://www.bazl.admin.ch (accessed on 23 April 2026).
- Diez, A.; Olsen, H.; Meliveo, L. Deliverable D1.2: NORAH2 User Manual; Report No. SC03-D1.2; European Union Aviation Safety Agency (EASA): Cologne, Germany, 2023; Available online: https://www.easa.europa.eu/en/research-projects/environmental-research-rotorcraft-noise (accessed on 23 April 2026).
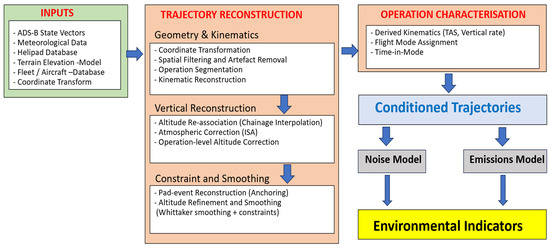
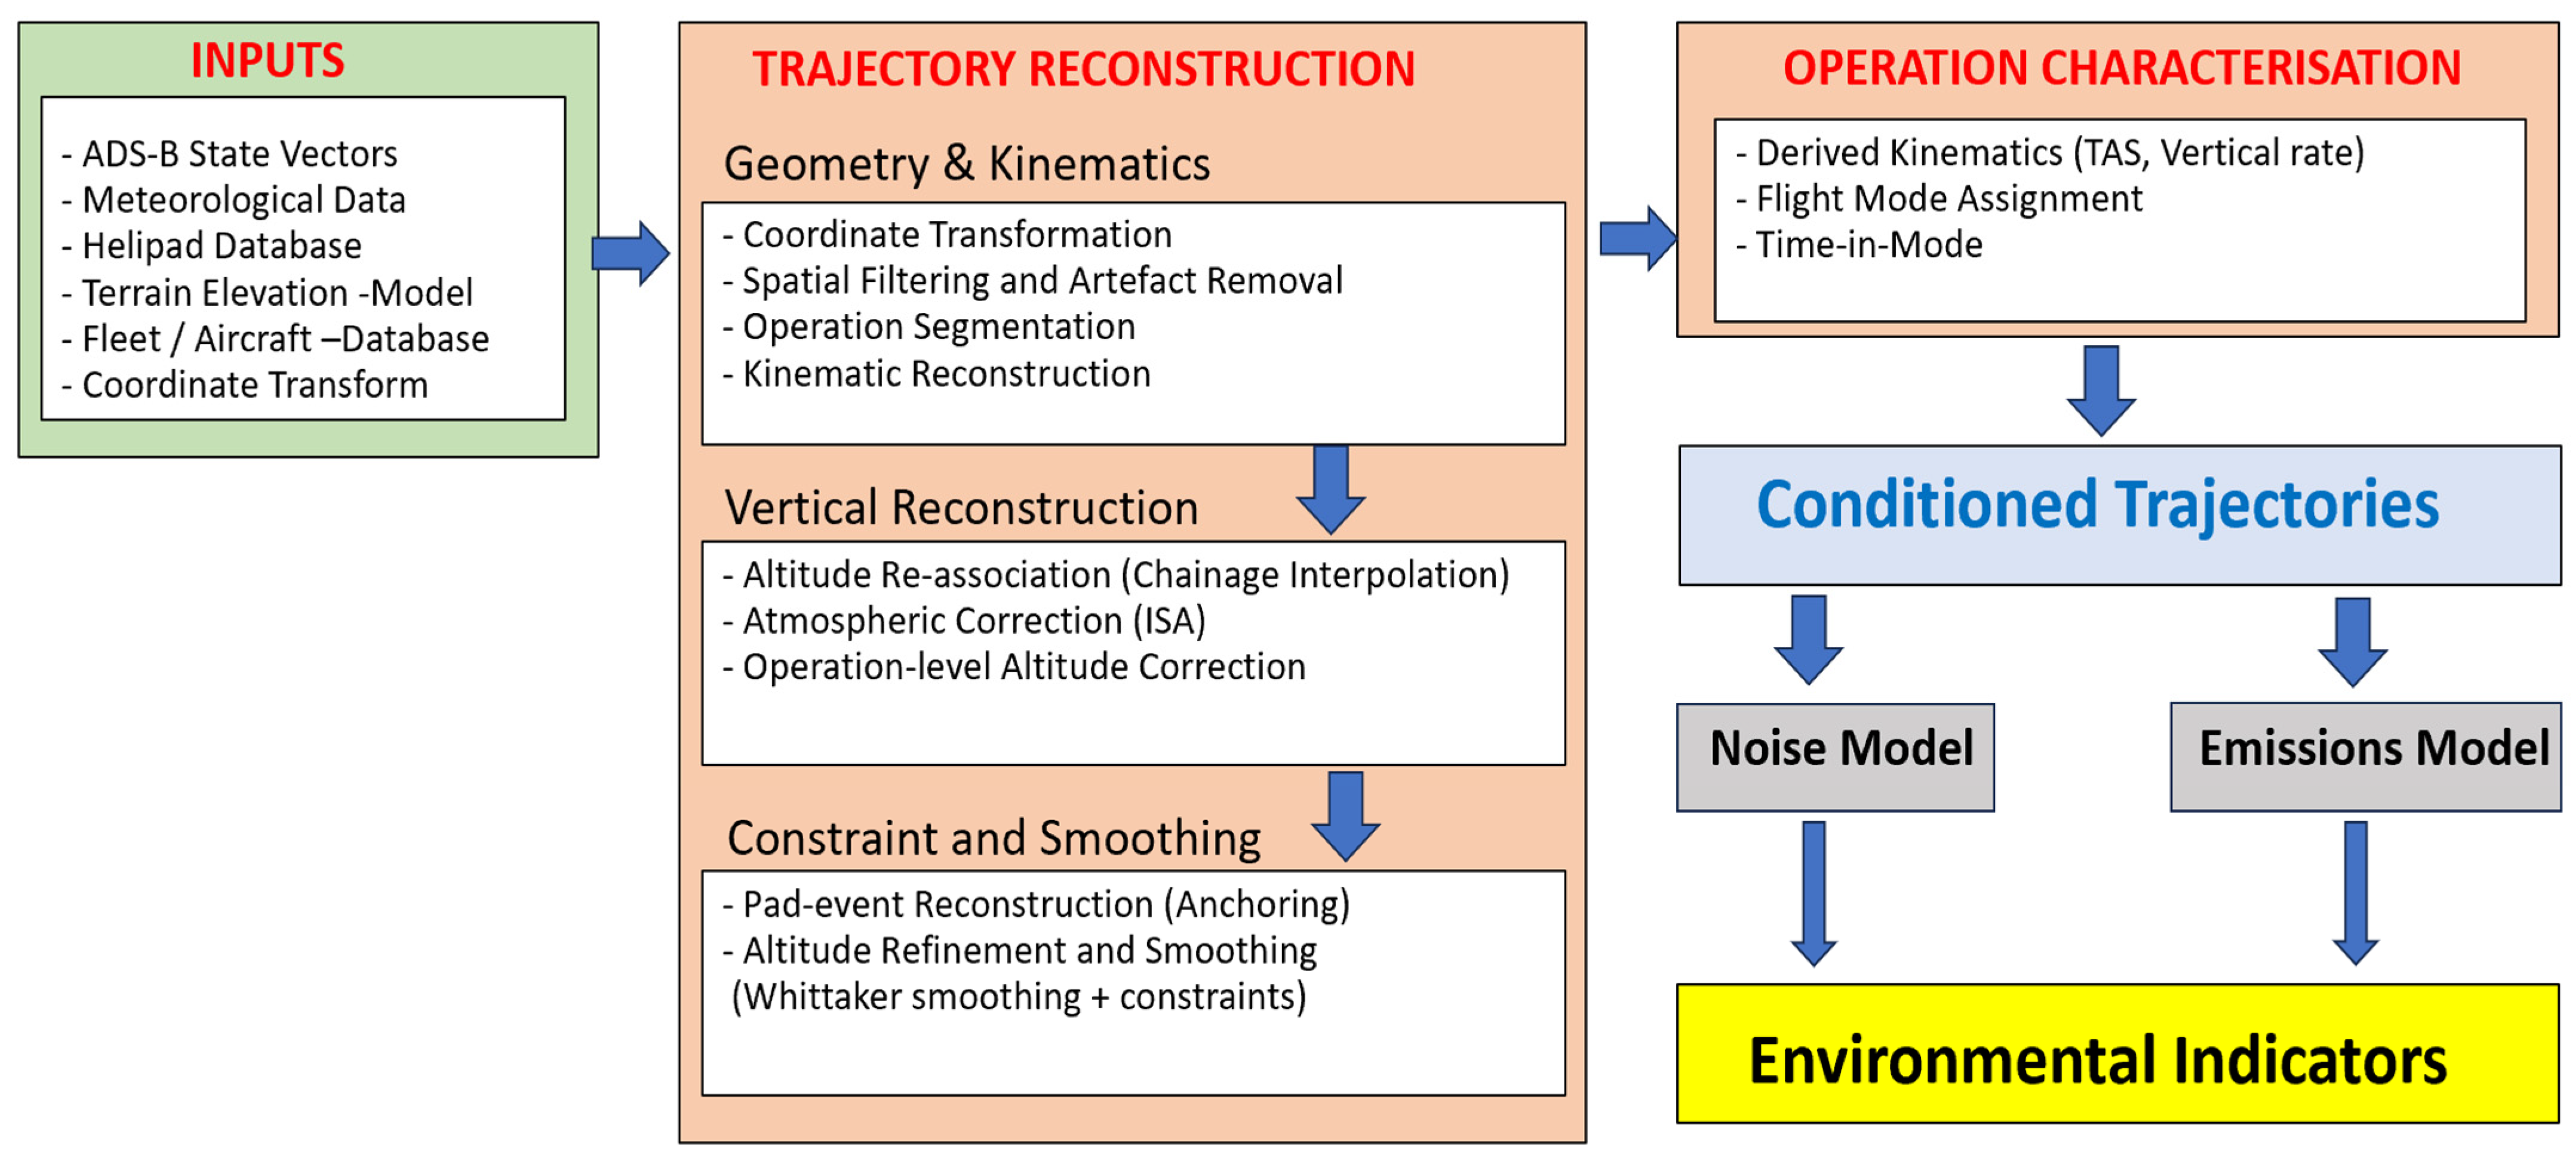
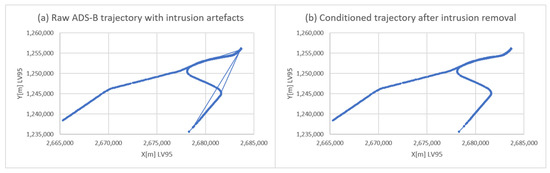
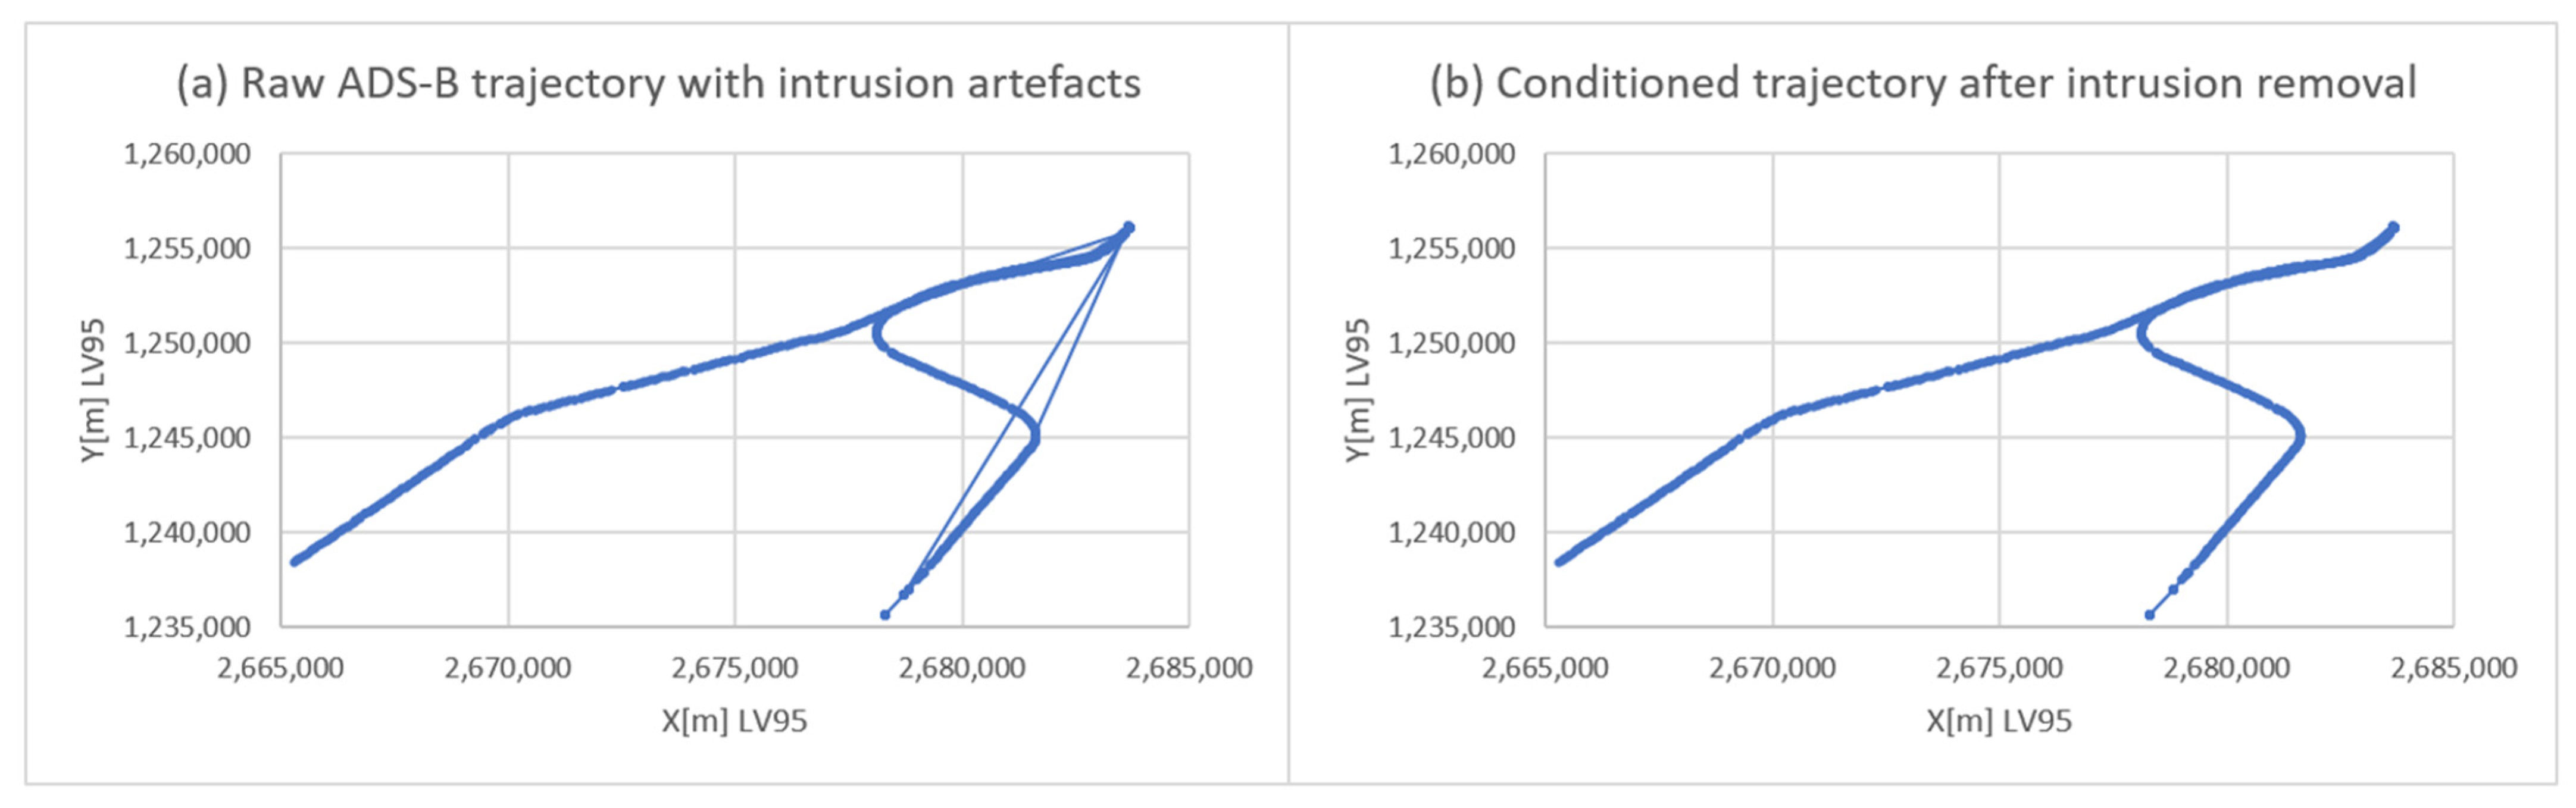
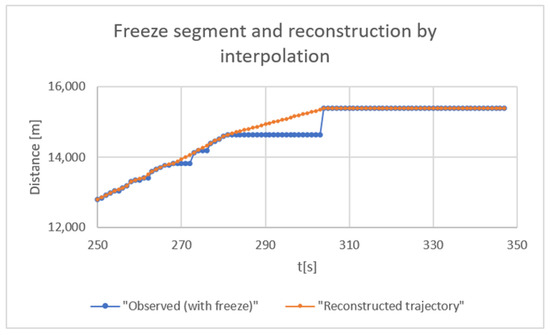
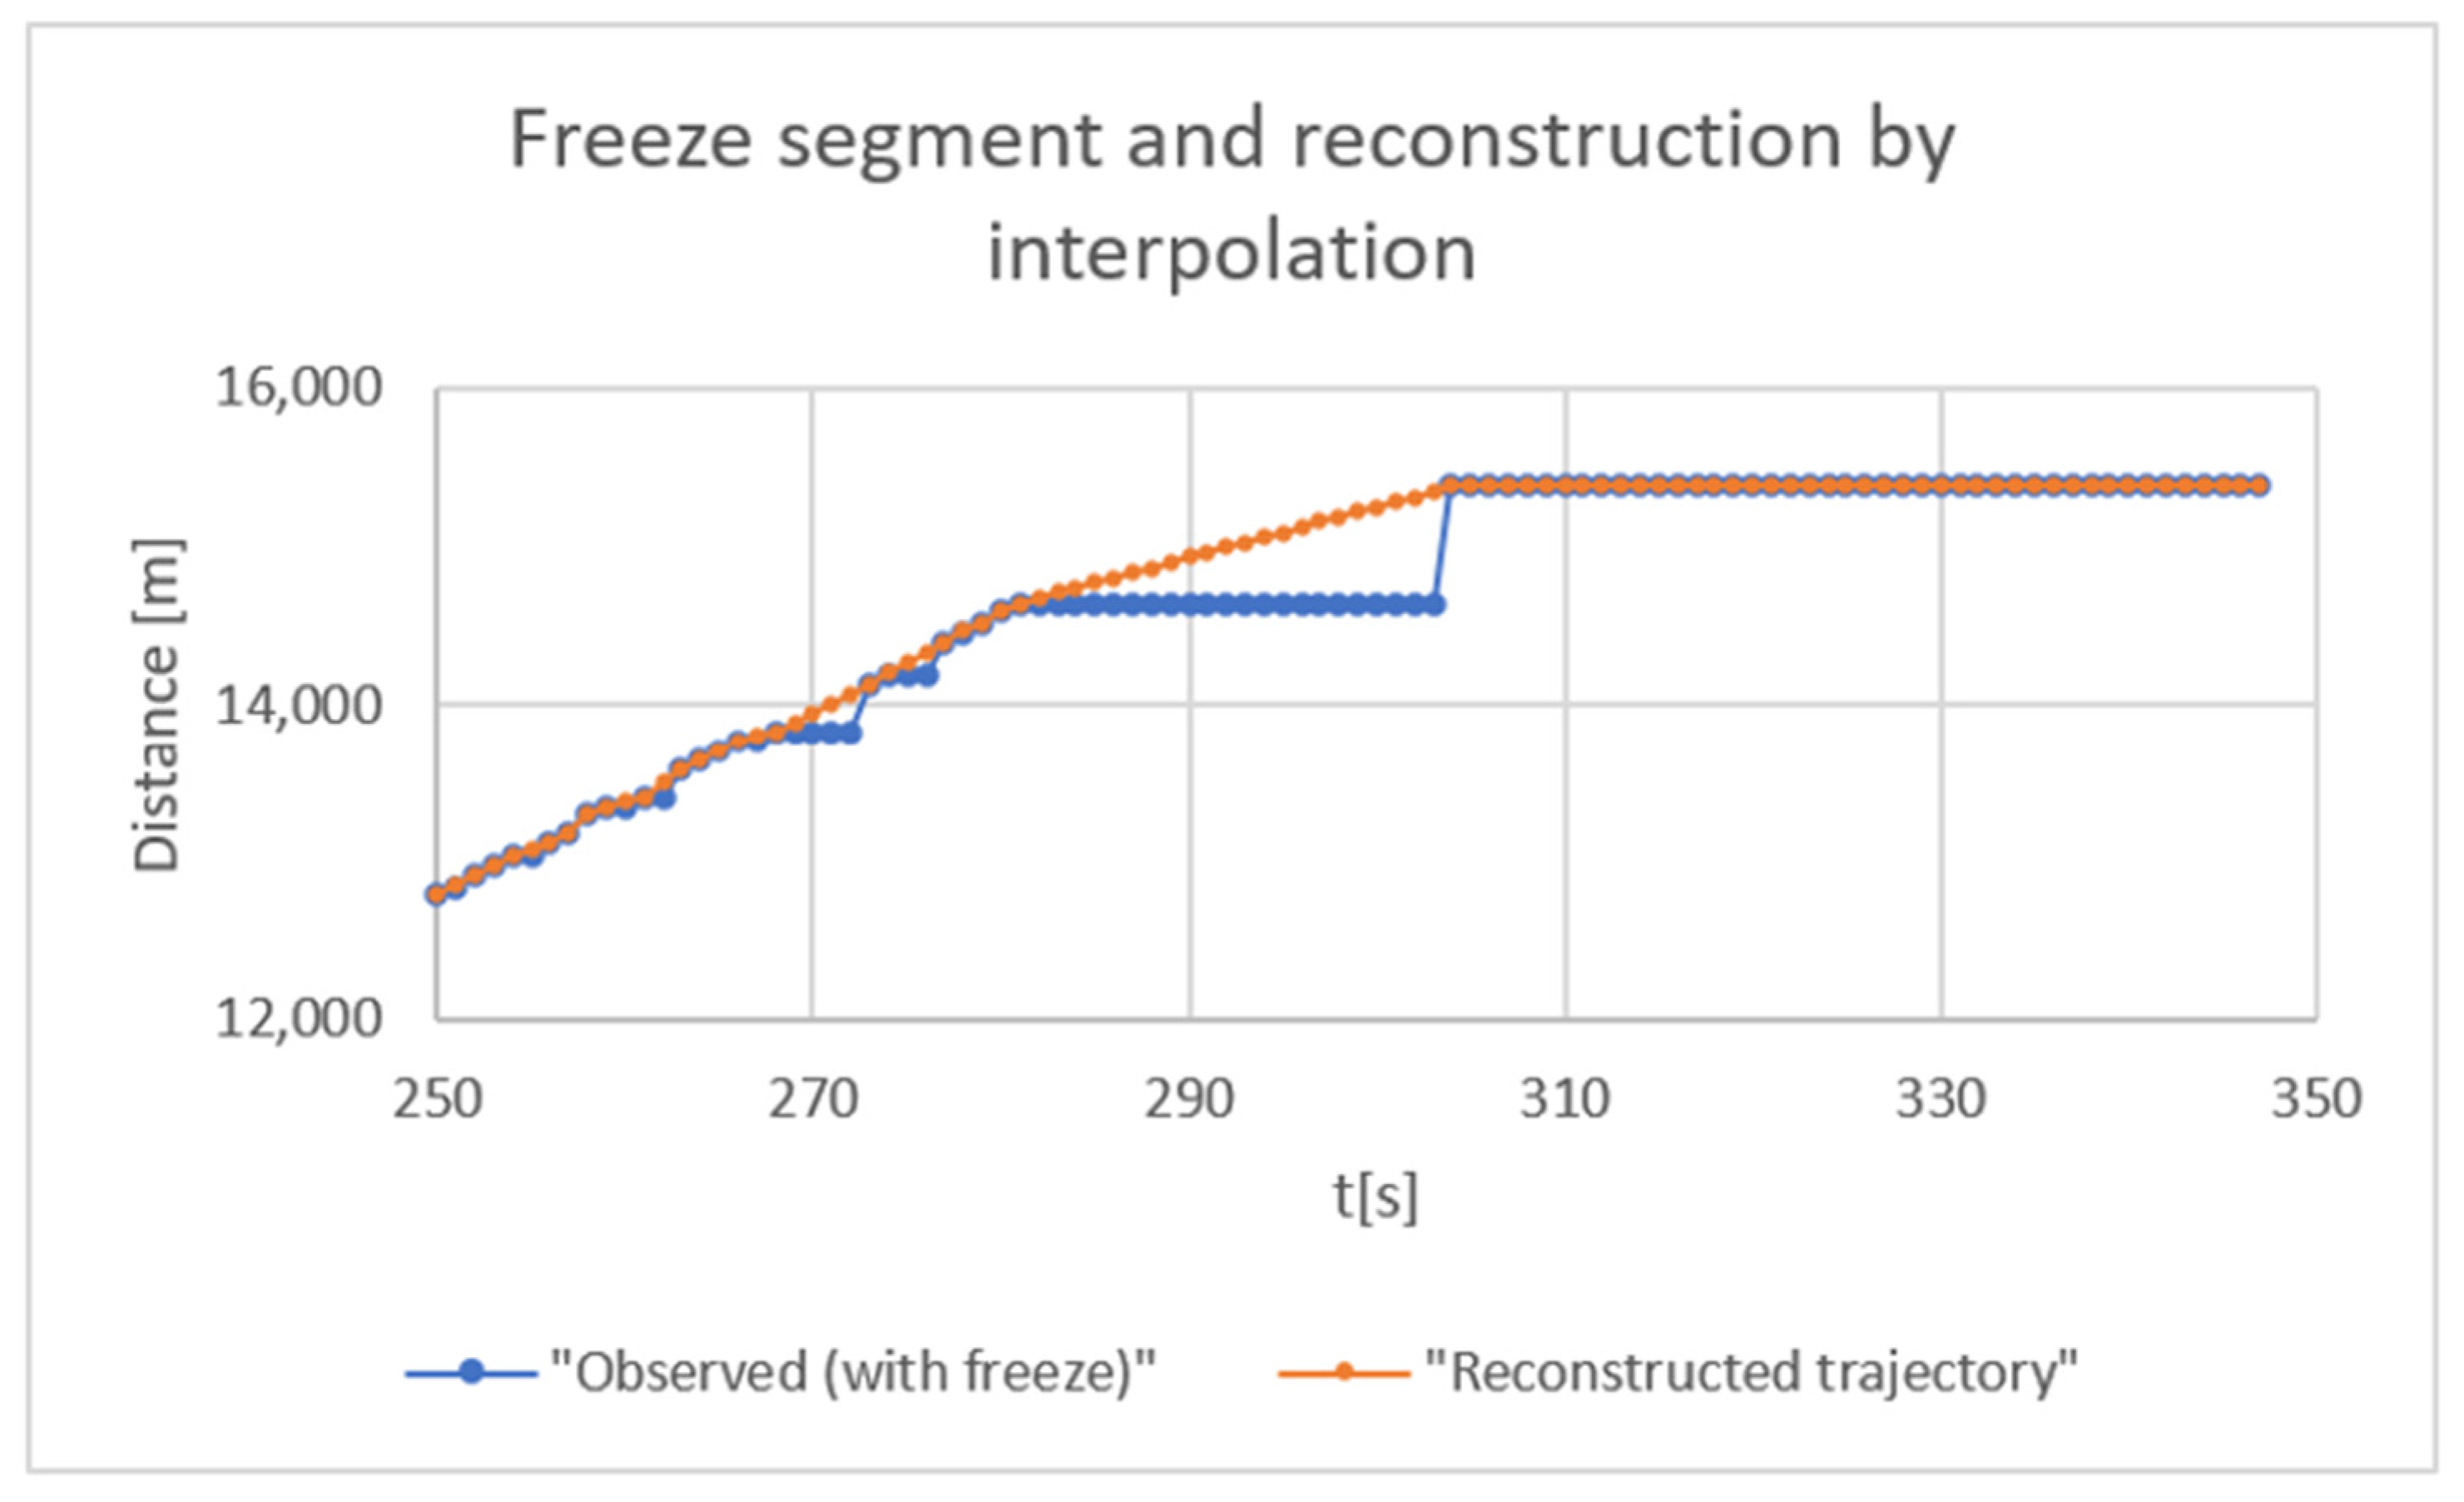
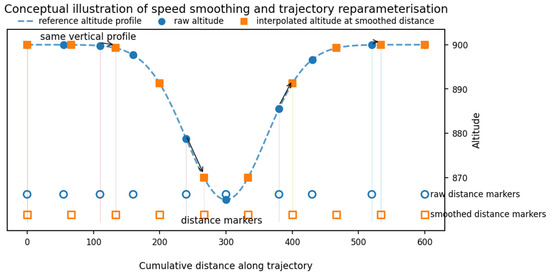
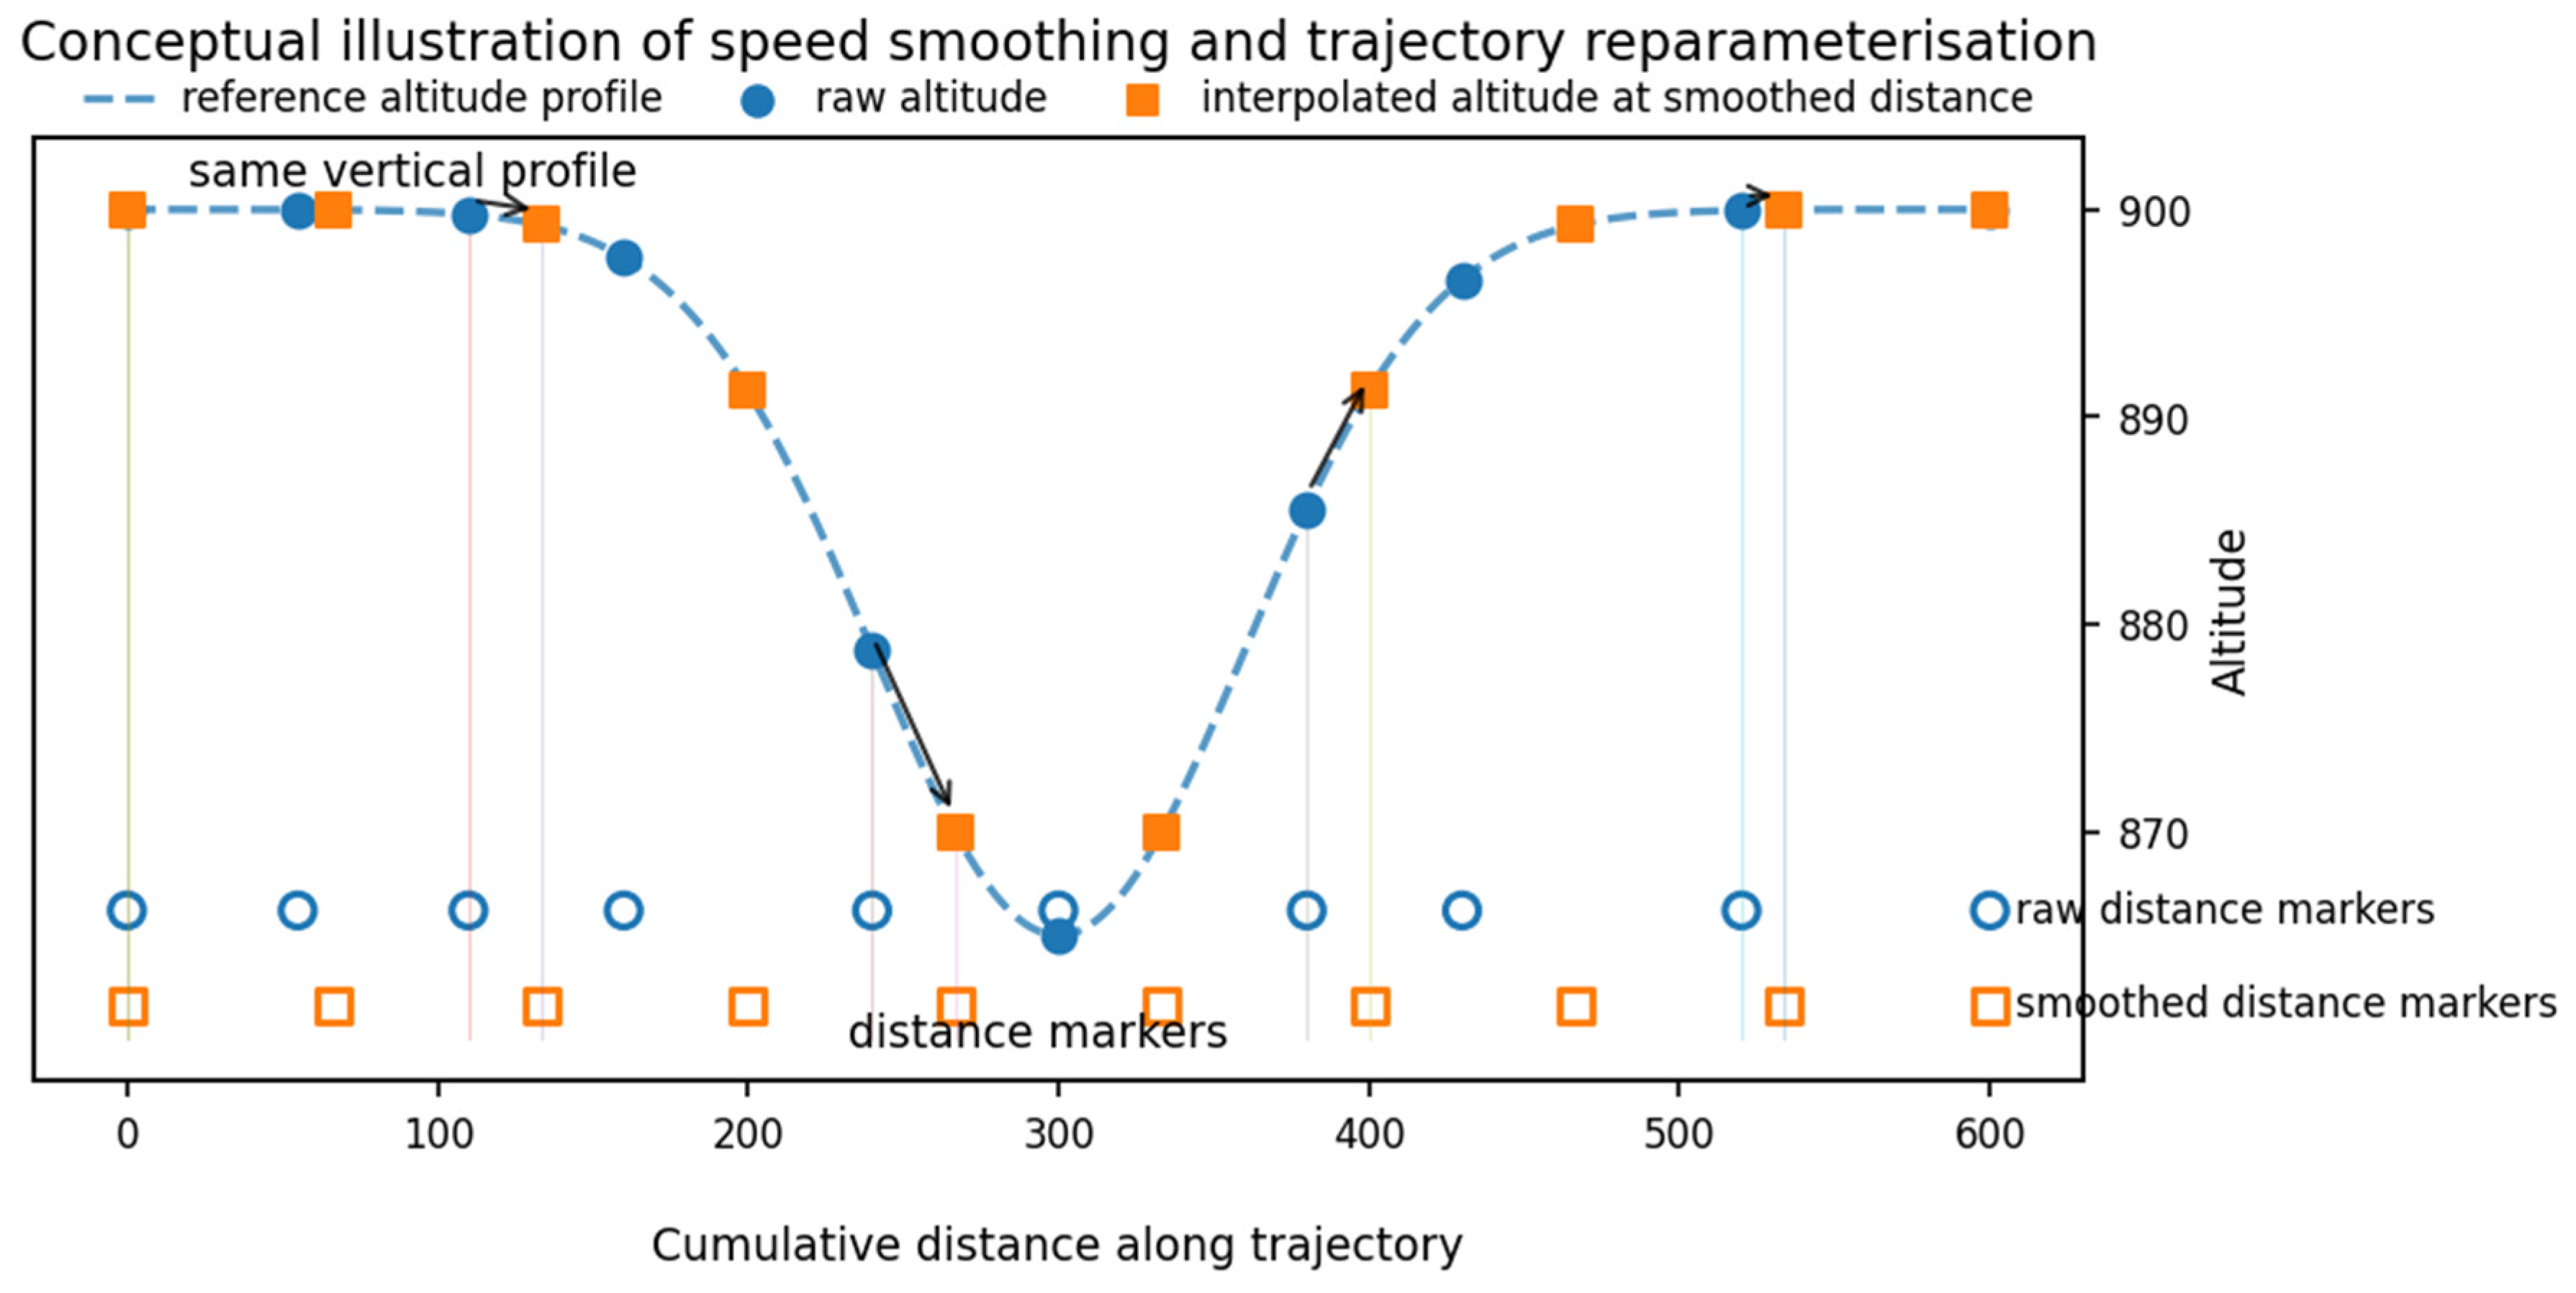
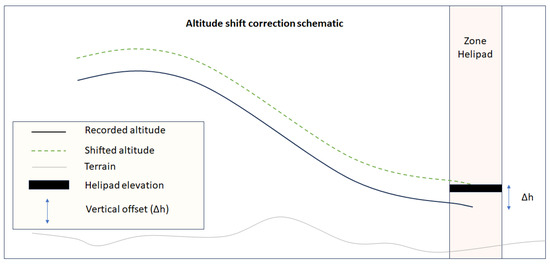
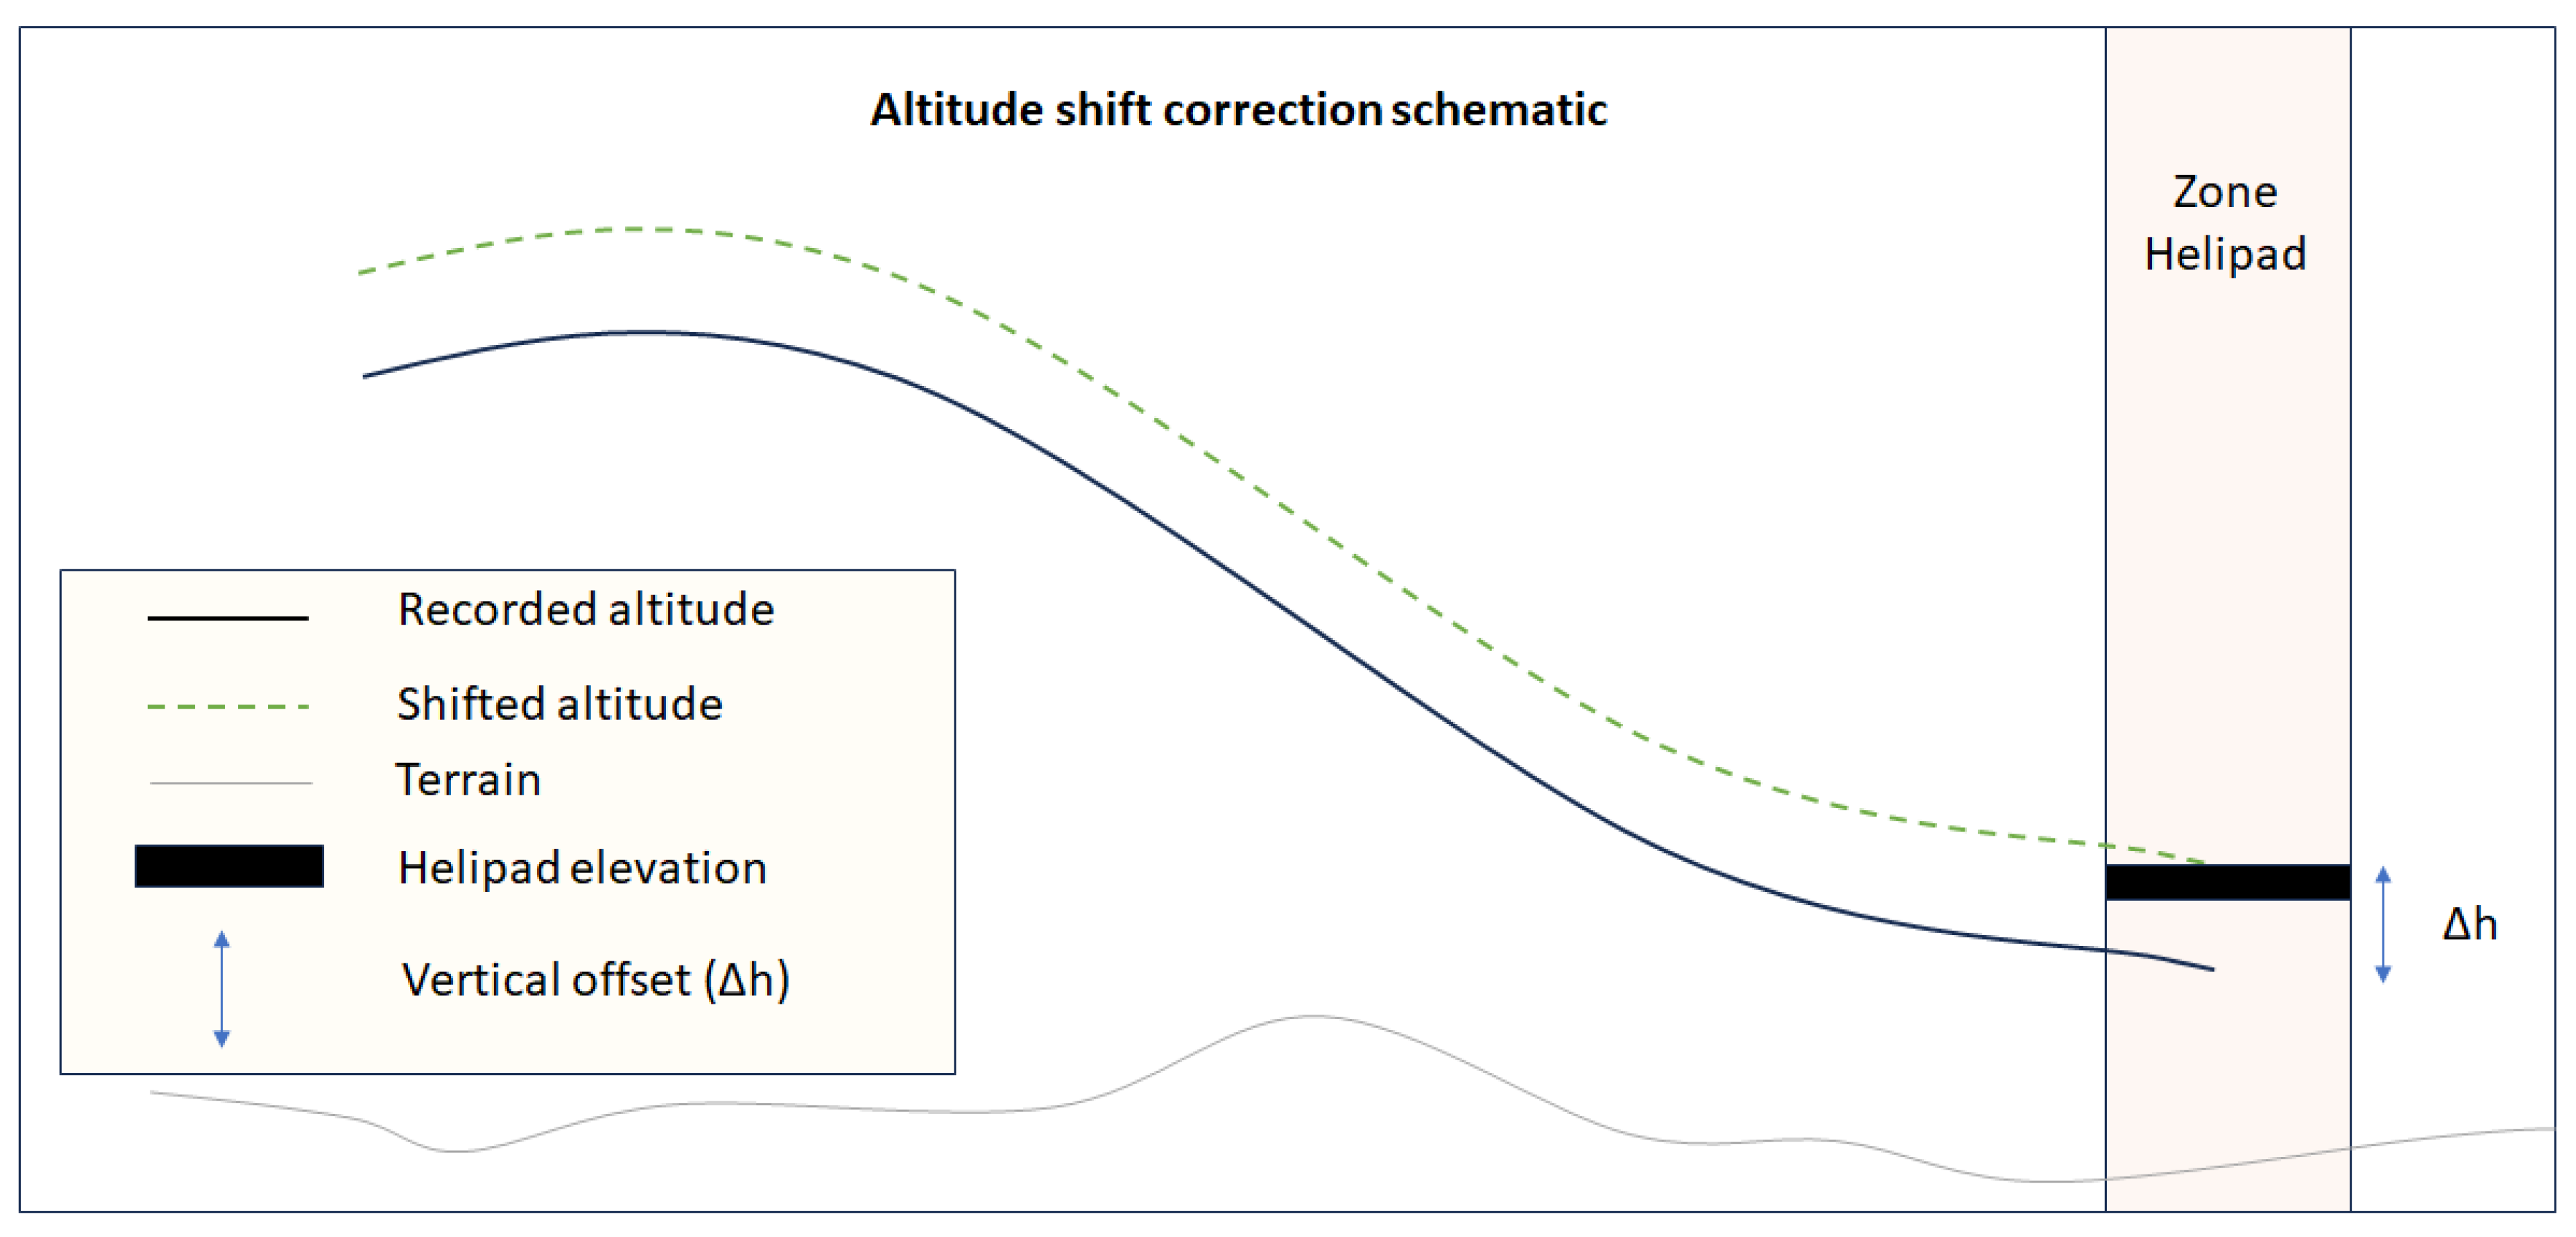
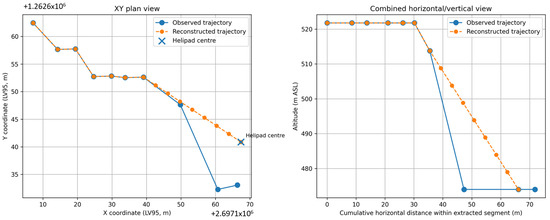
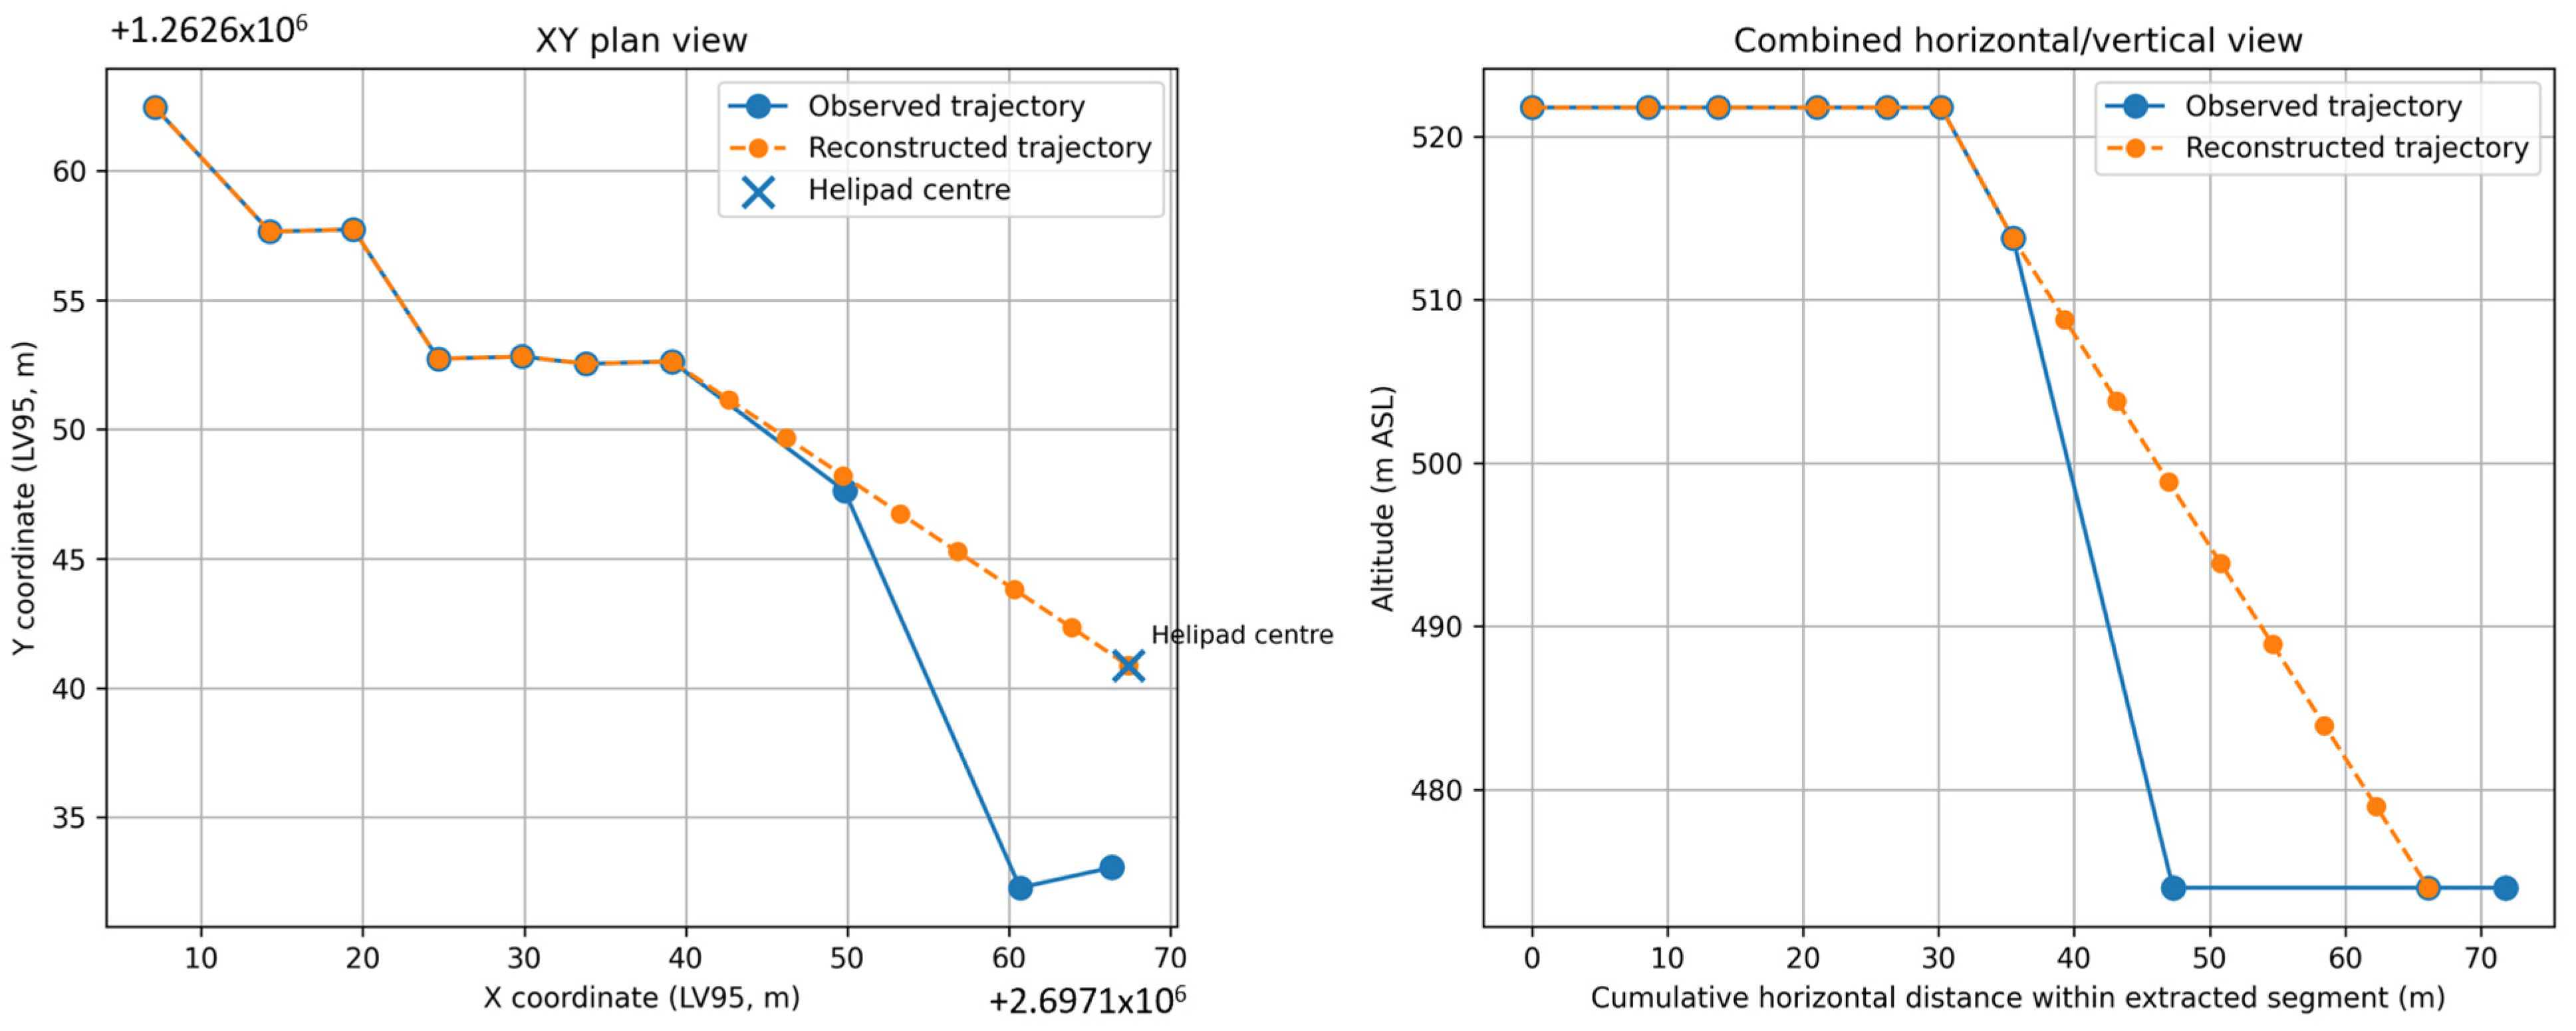
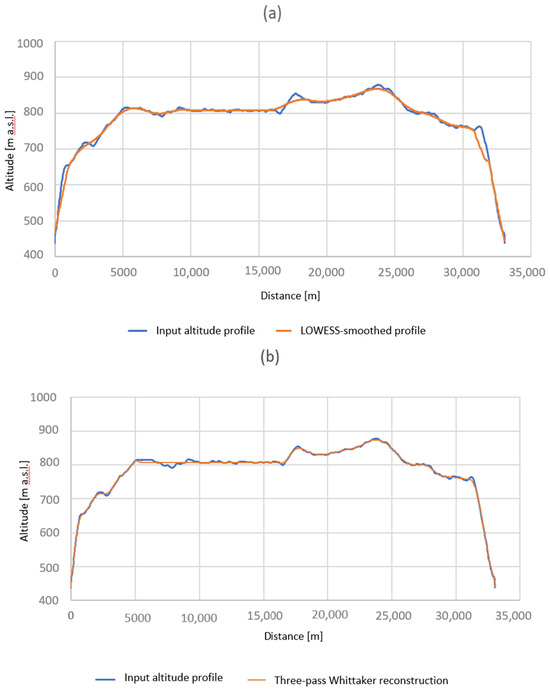
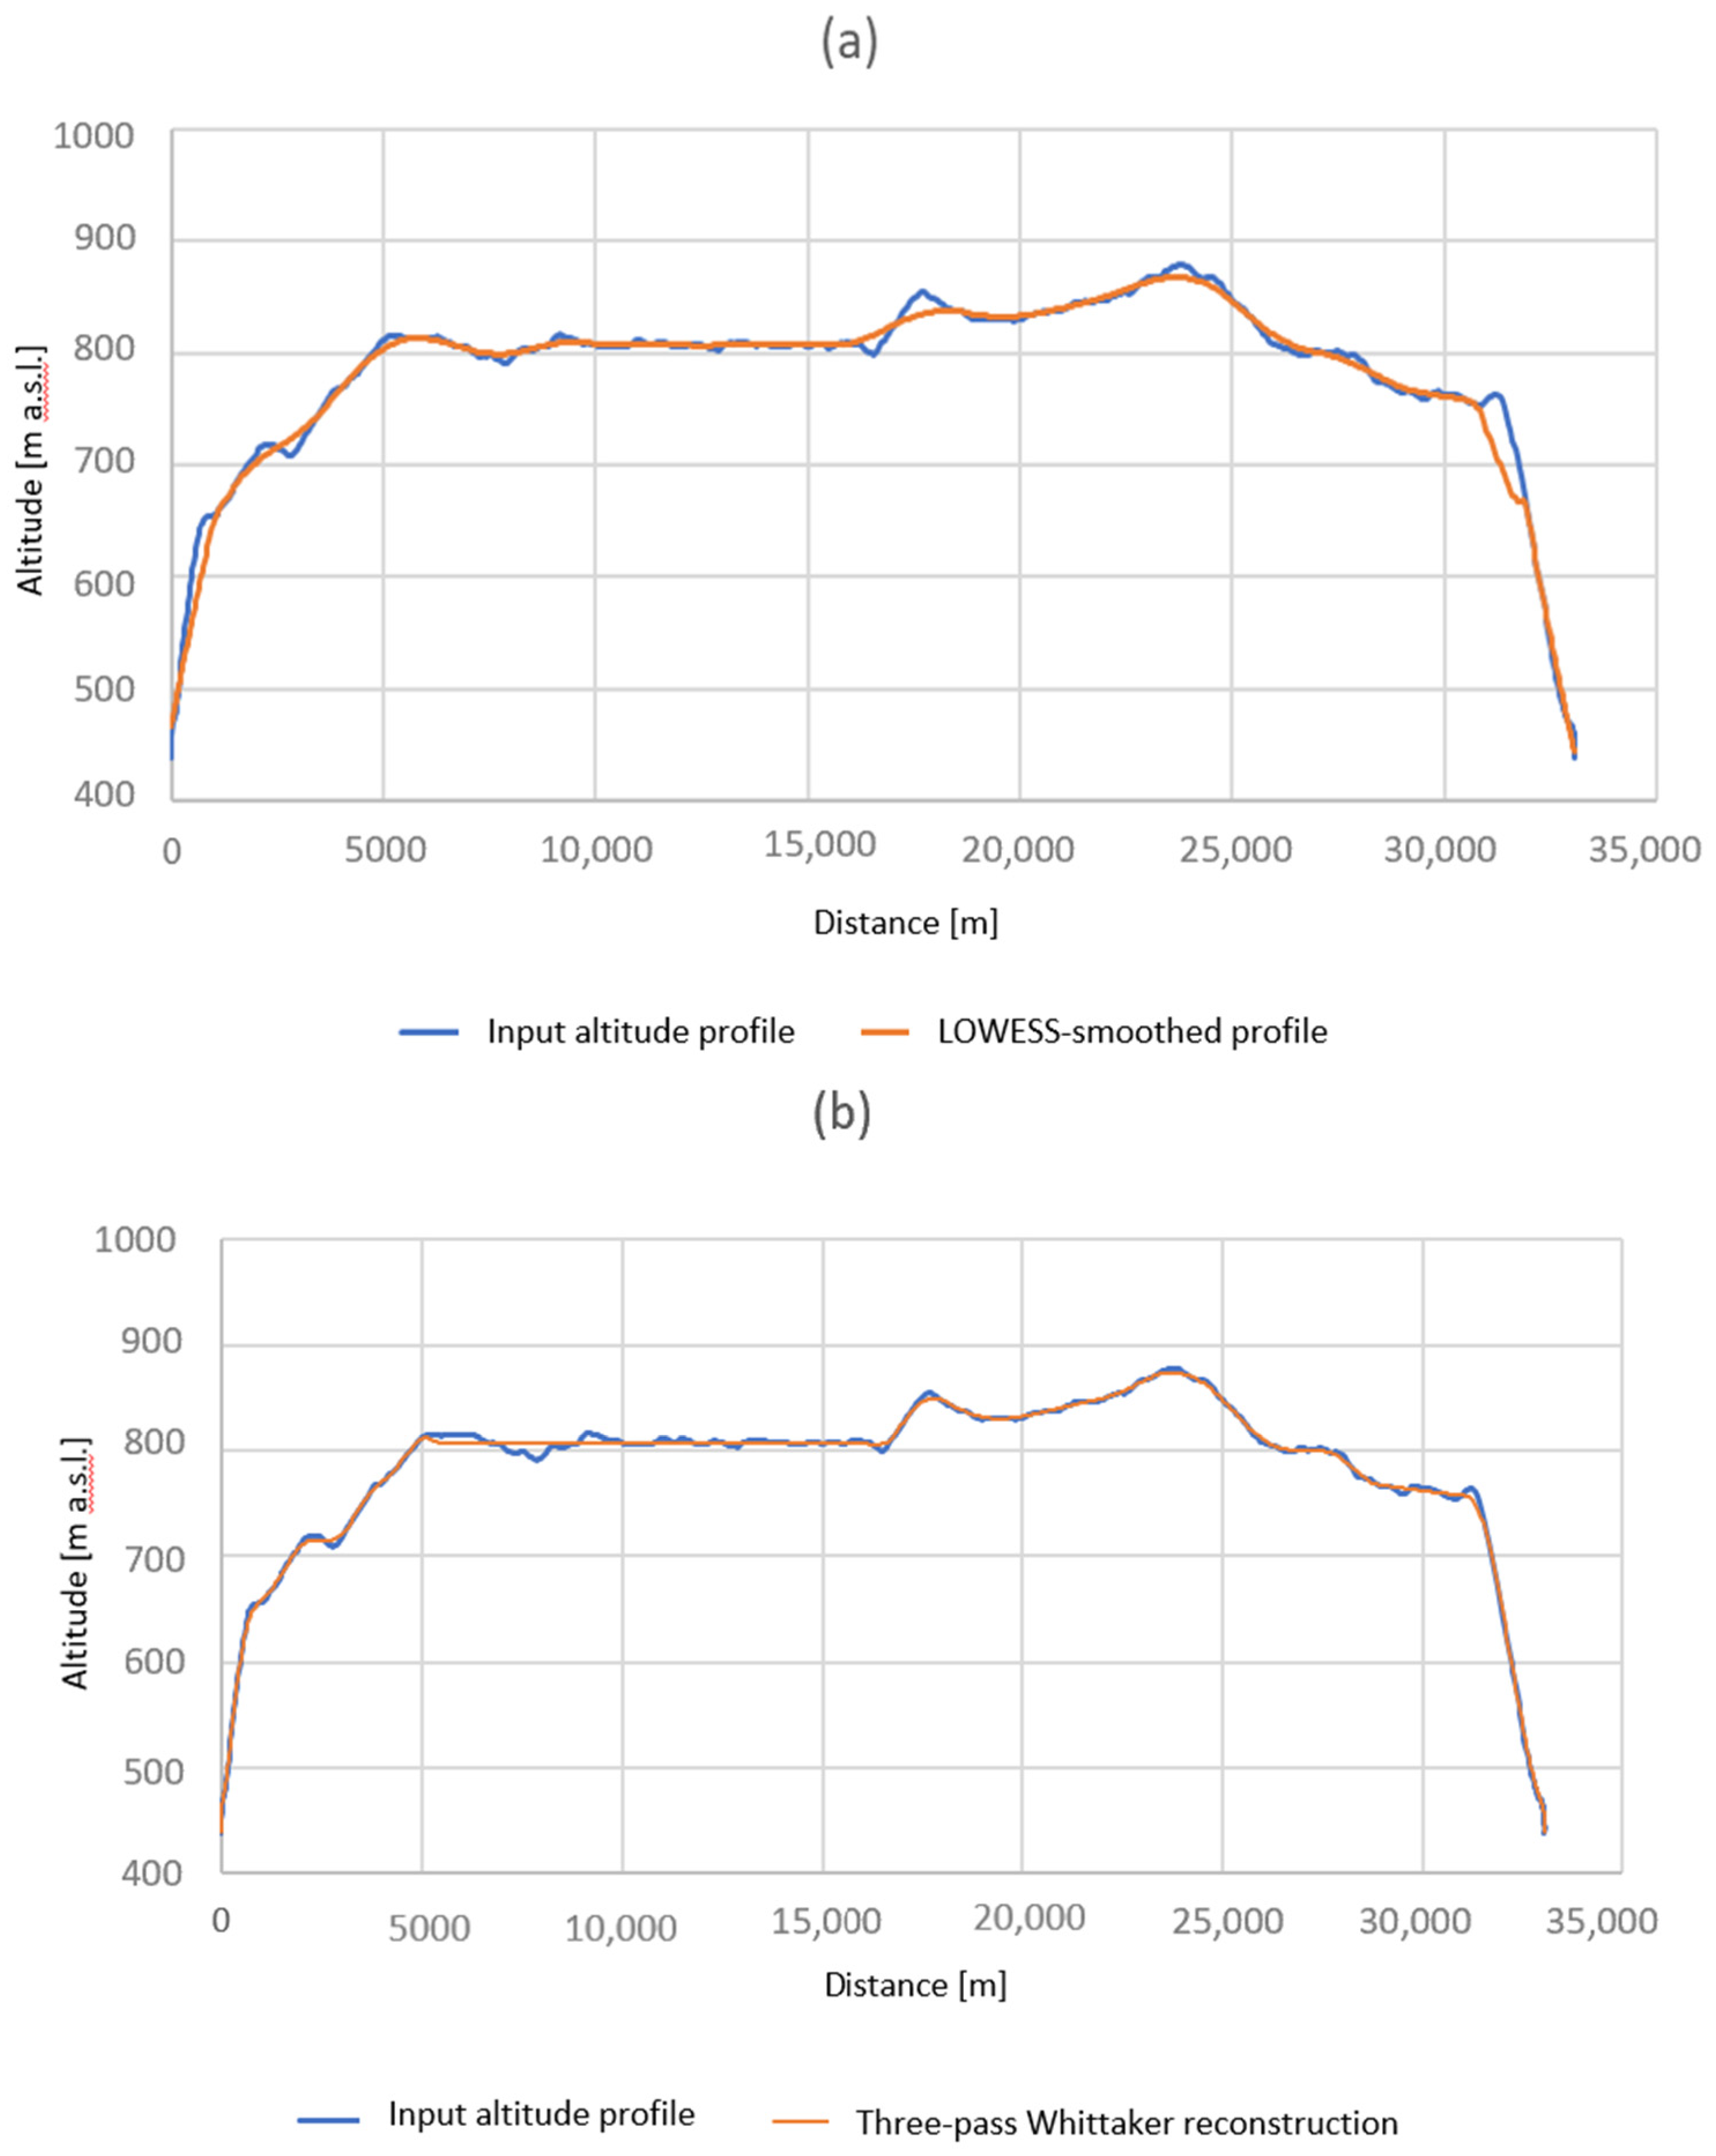
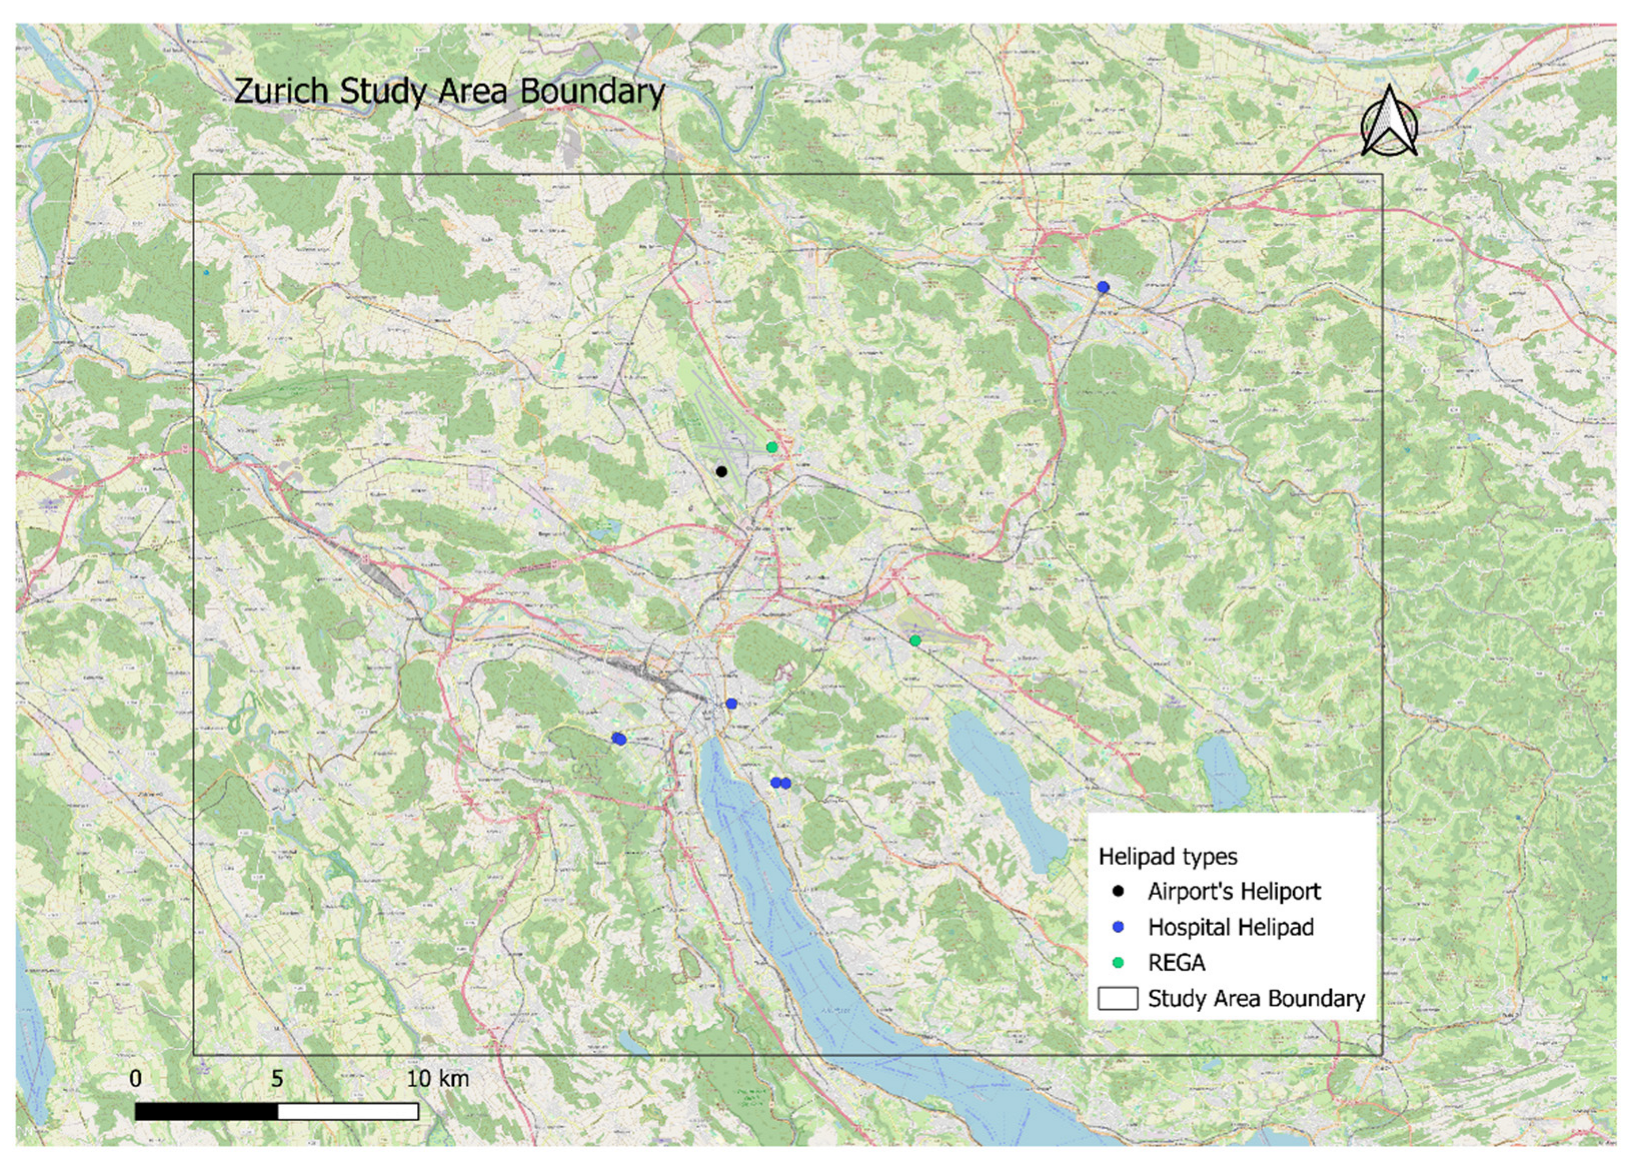
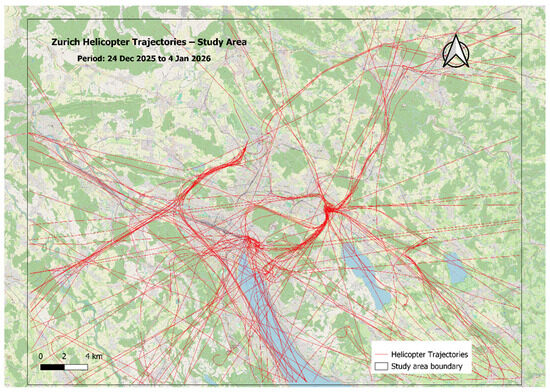
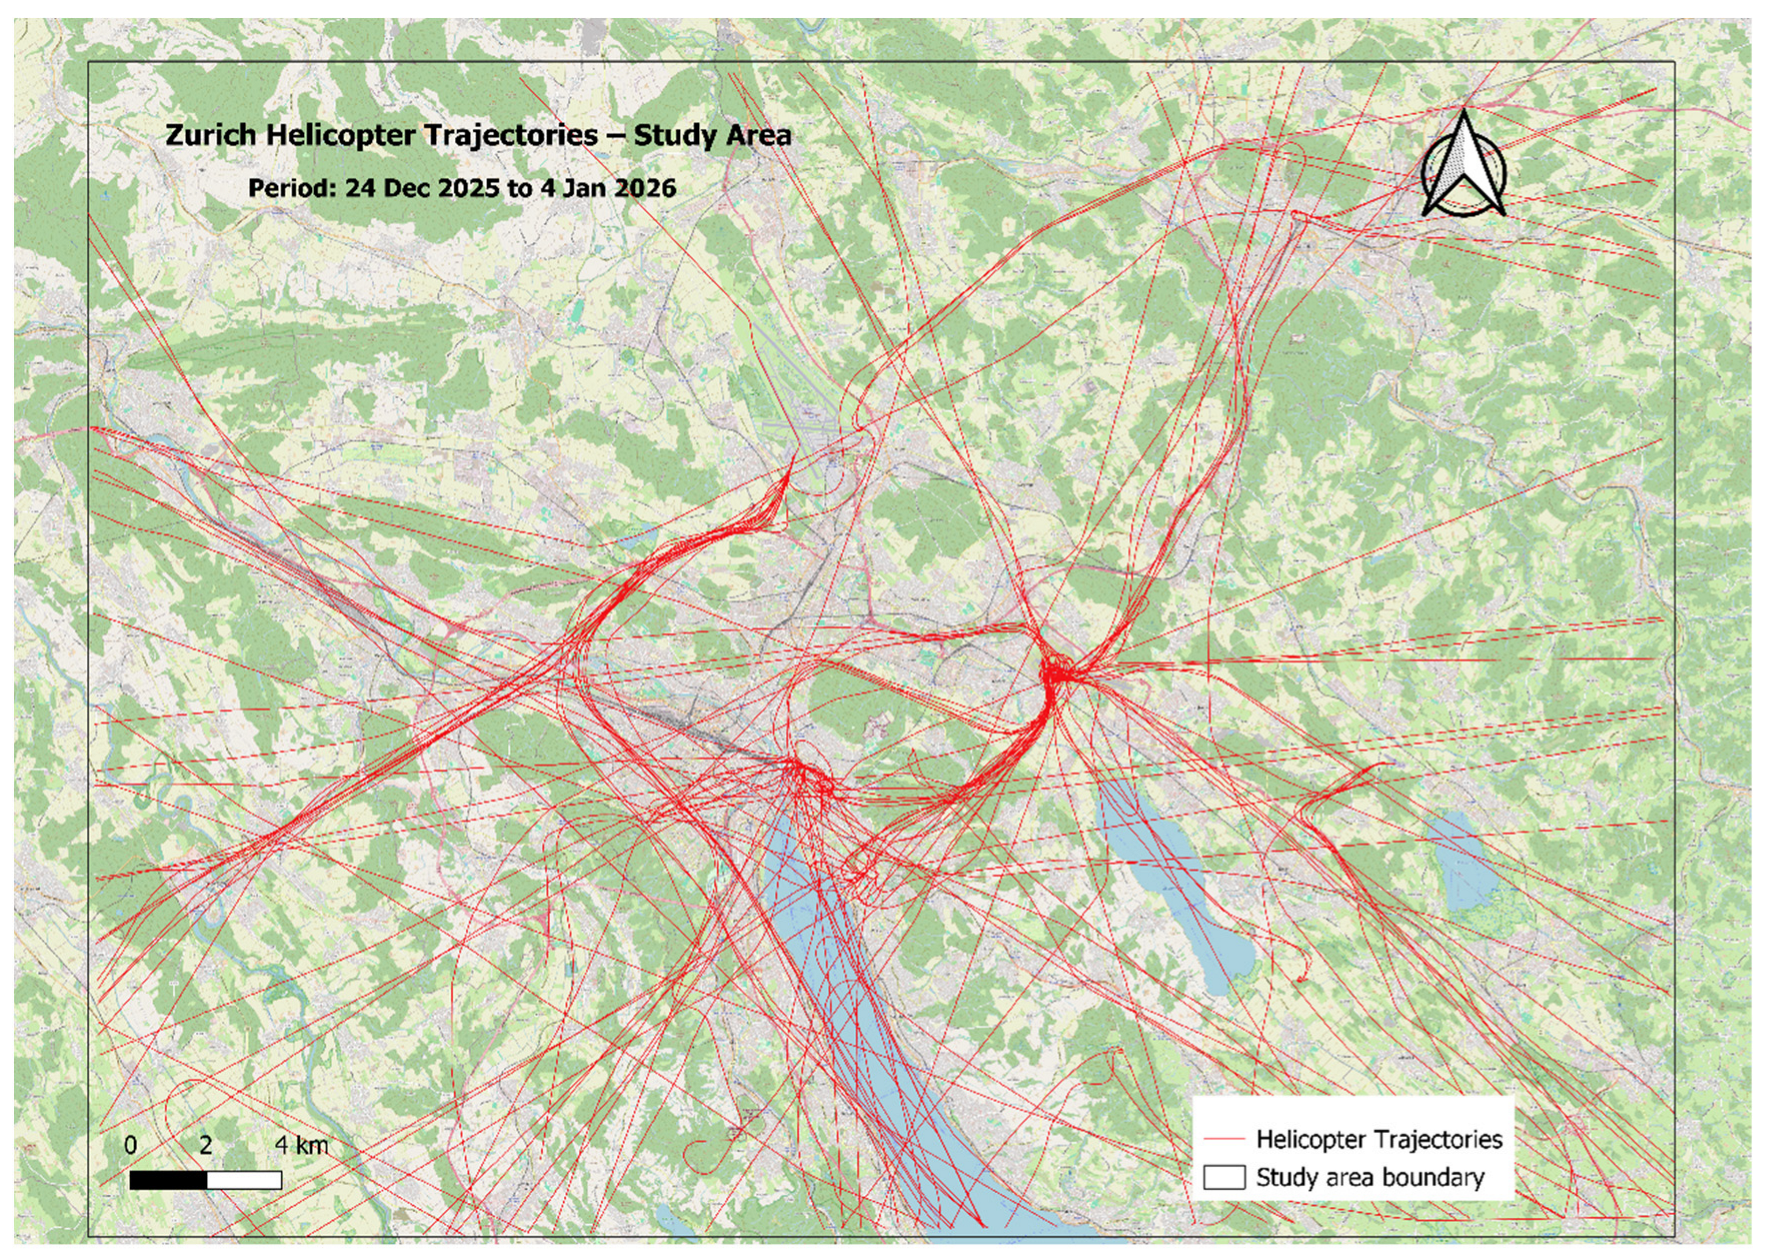
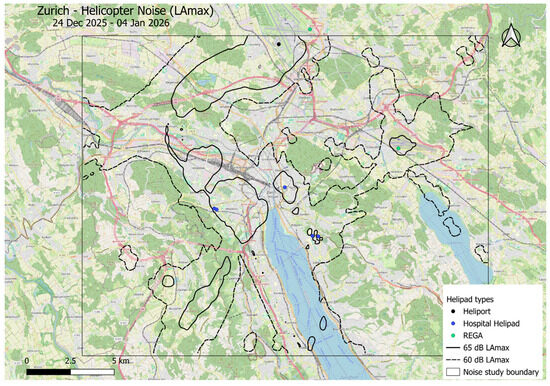
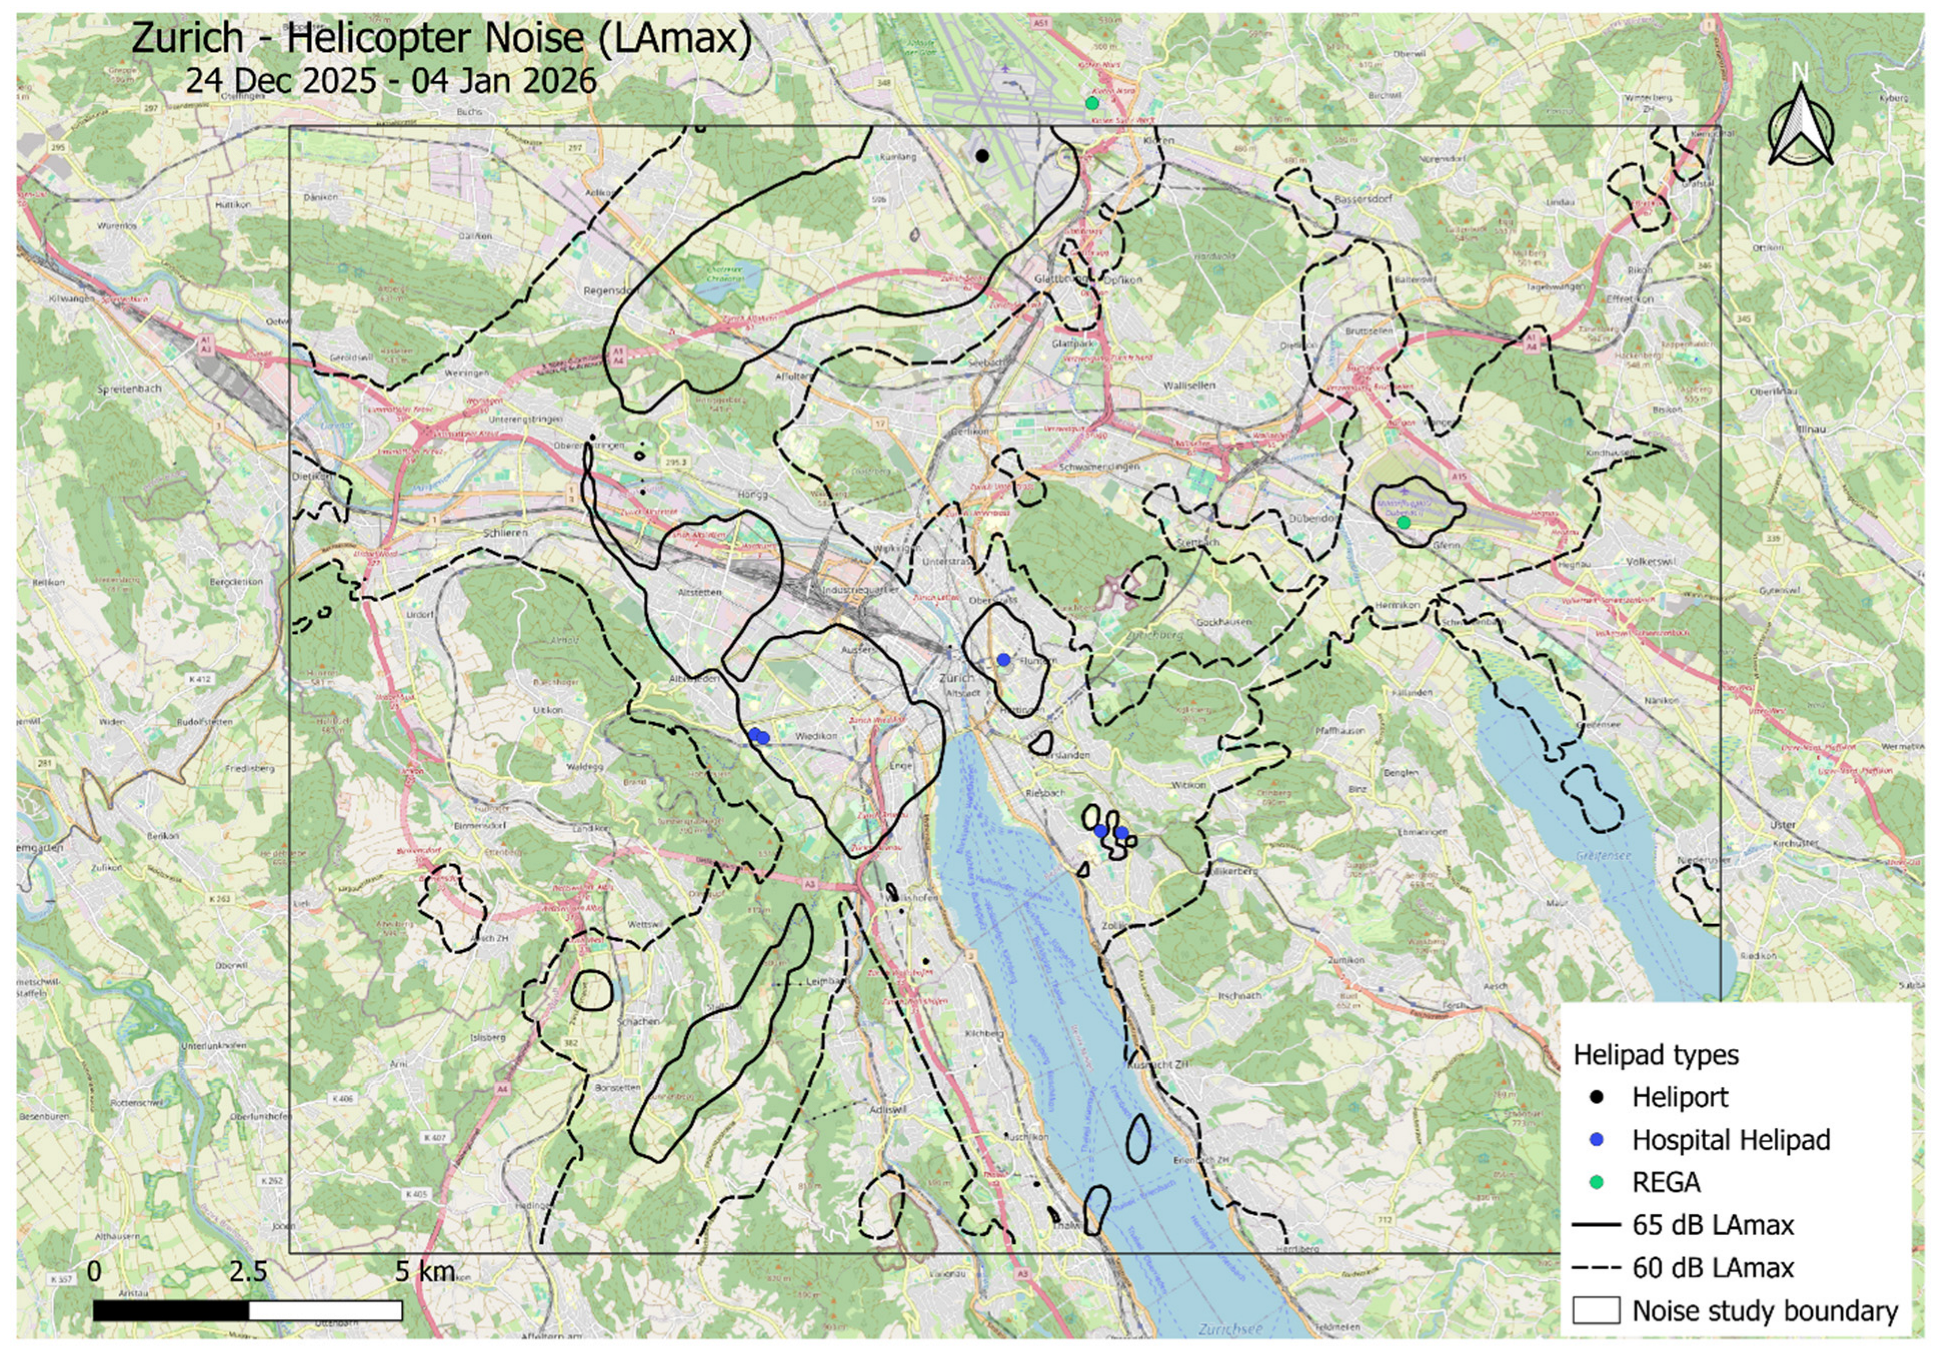
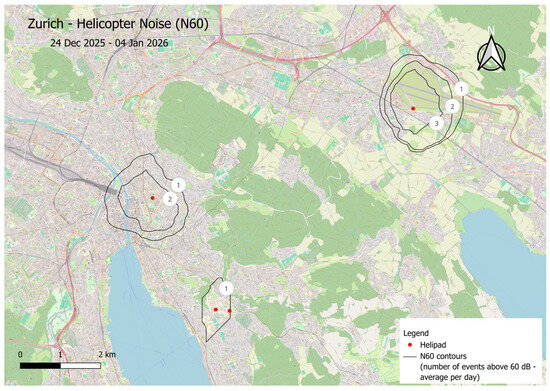
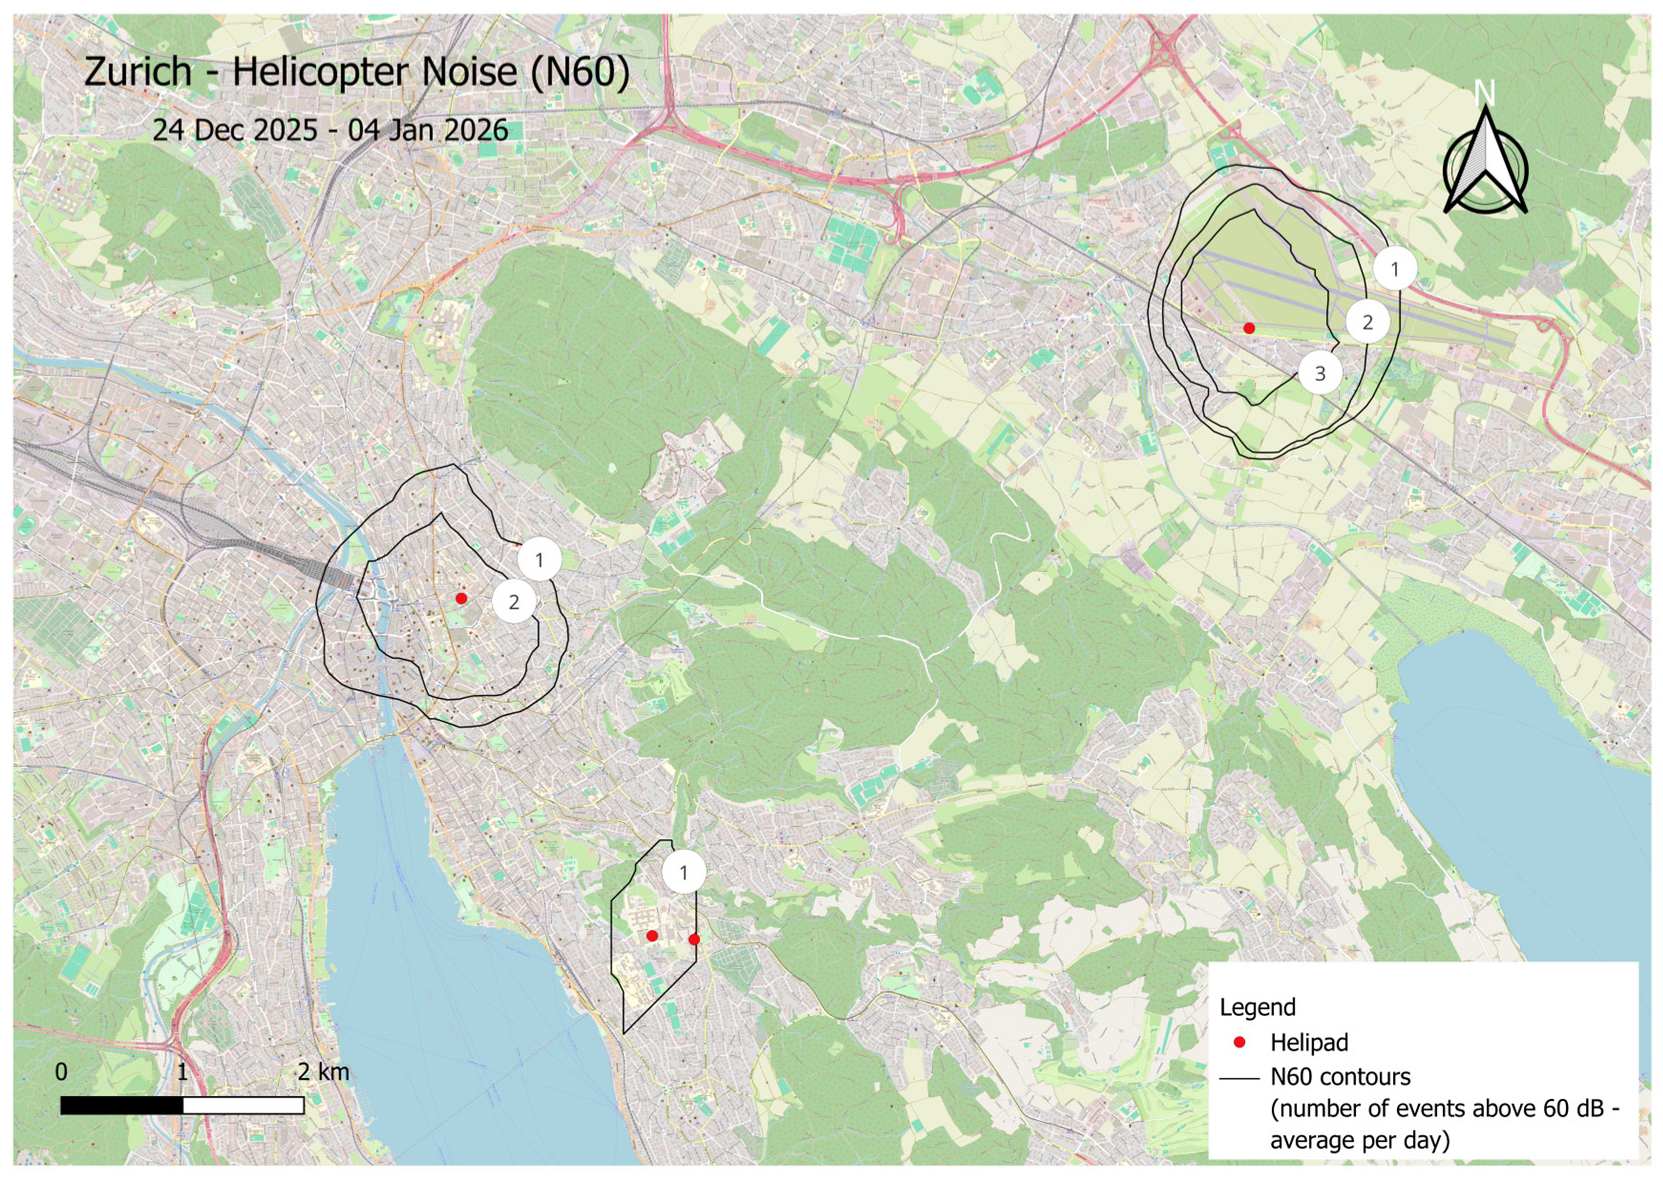
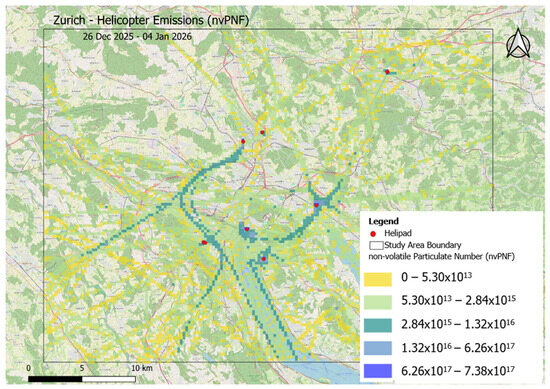
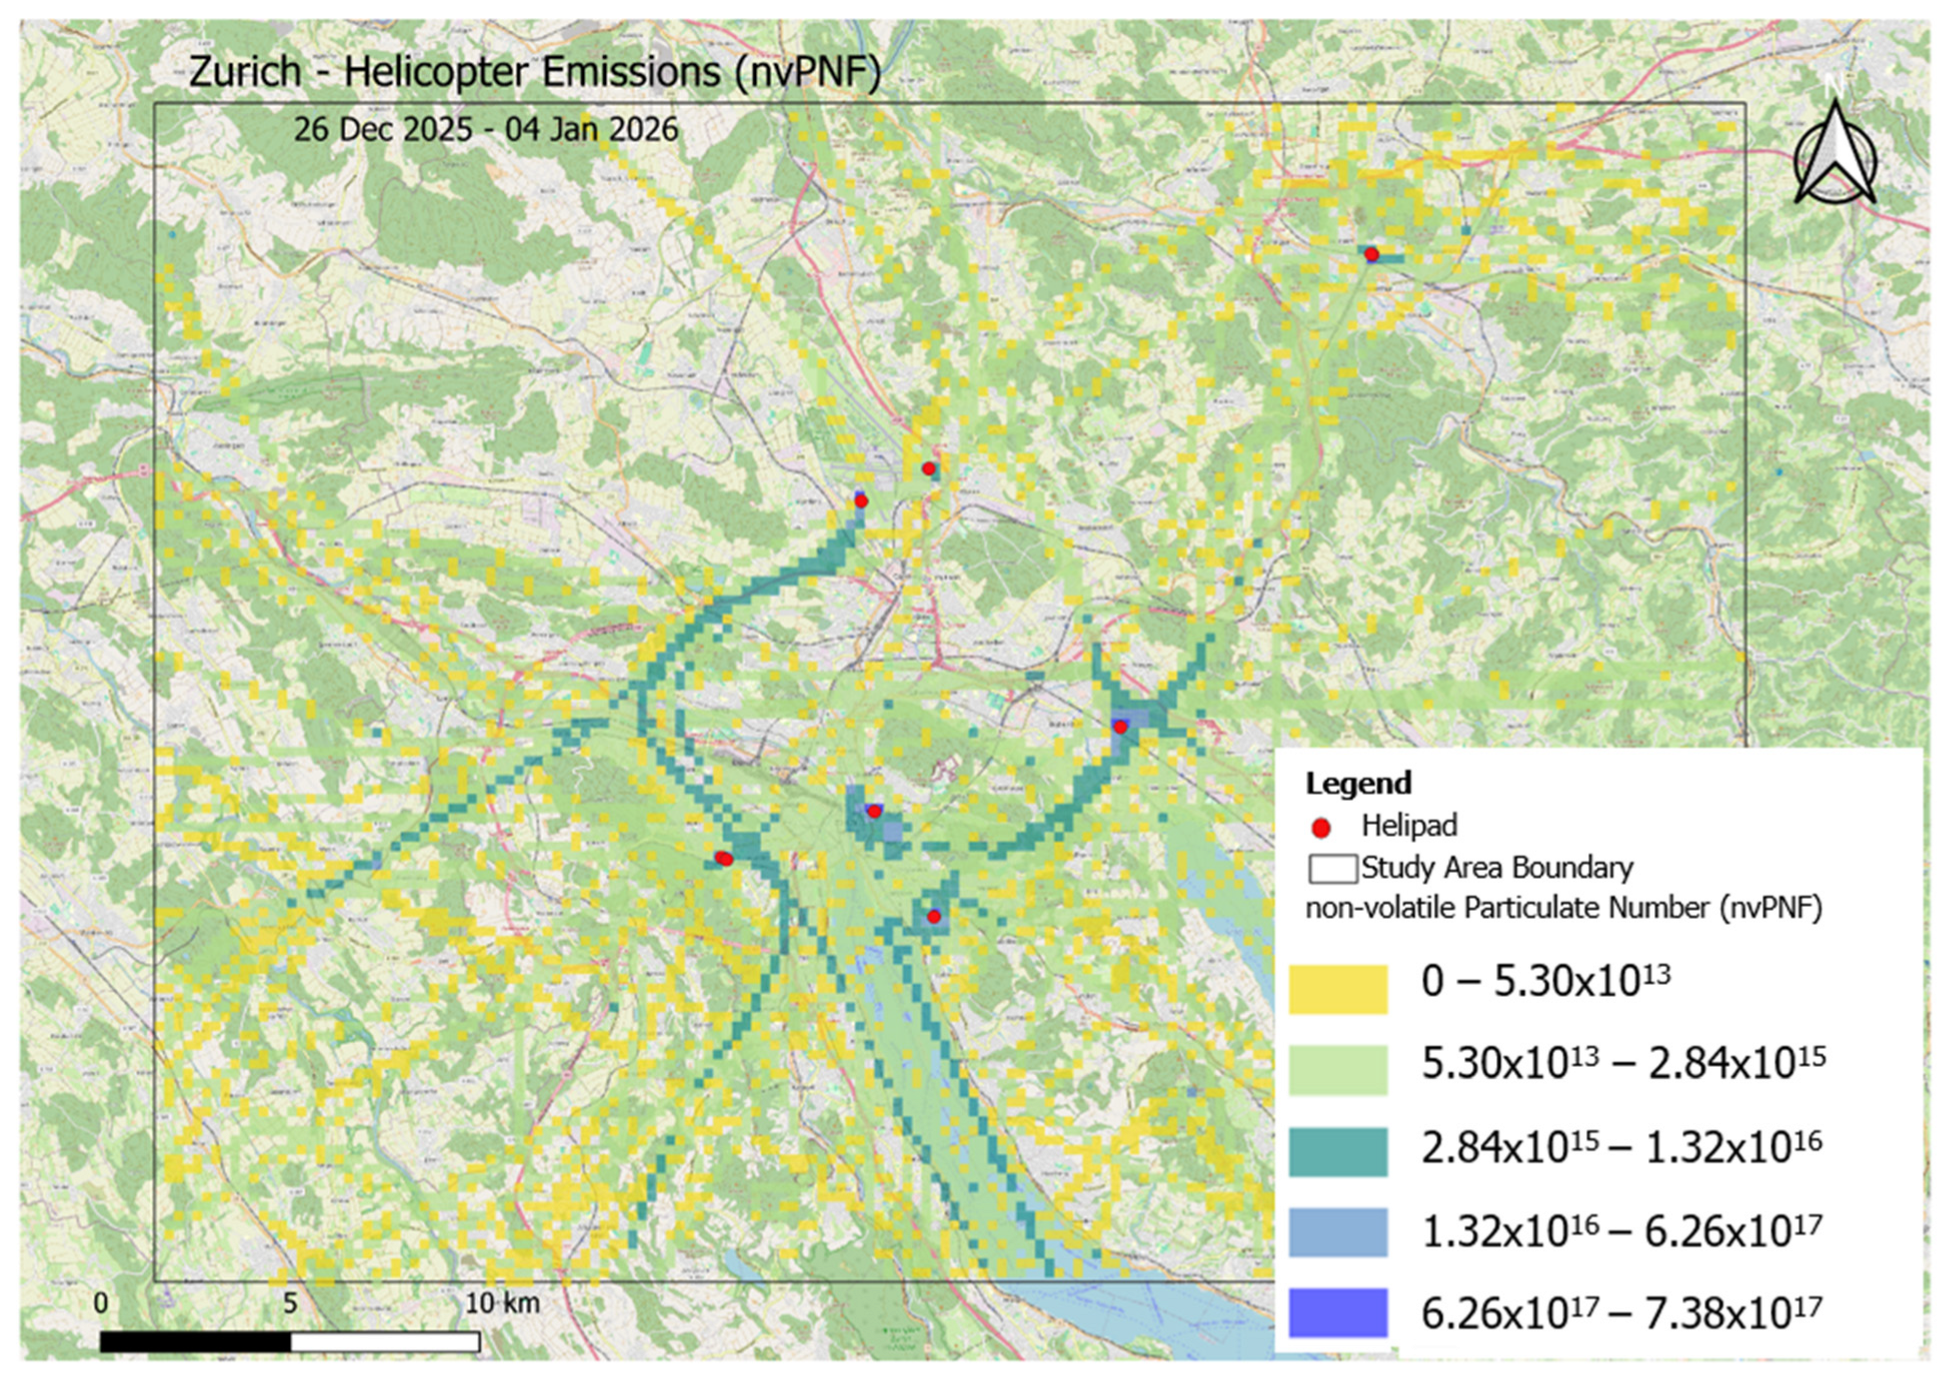

Disclaimer/Publisher’s Note: The statements, opinions and data contained in all publications are solely those of the individual author(s) and contributor(s) and not of MDPI and/or the editor(s). MDPI and/or the editor(s) disclaim responsibility for any injury to people or property resulting from any ideas, methods, instructions or products referred to in the content. |
© 2026 by the authors. Licensee MDPI, Basel, Switzerland. This article is an open access article distributed under the terms and conditions of the Creative Commons Attribution (CC BY) license.