


Abstract
To address the challenges of time-dependent error divergence in Strapdown Inertial Navigation Systems (SINS) and the insufficient accuracy of traditional terrain matching algorithms in feature-sparse flat terrain environments, this paper proposes an intelligent terrain-aided navigation method integrating an Improved Osprey Optimization Algorithm (IOOA), Distribution Estimation, and Q-learning. Utilizing terrain information entropy as a robust matching metric, the algorithm establishes a two-phase evolutionary framework comprising Lévy flight-based random search (exploration phase) and elite-guided Gaussian Estimation of Distribution (exploitation phase). By introducing a Q-learning mechanism to adaptively regulate exploration parameters, an intelligent balance between population diversity and convergence speed is achieved. Under a unified computational benchmark, systematic multi-scenario simulations were conducted using datasets from simulated moderately undulating foothill terrain, the Libyan Sahara, and the real Digital Elevation Model (DEM) of the Junggar Basin in Xinjiang, China. Experimental results demonstrate that, compared to traditional TERCOM and mainstream swarm intelligence algorithms, the proposed algorithm drastically reduces positioning errors in the aforementioned complex terrains and significantly enhances matching accuracy. Robustness and real-time performance tests indicate that the algorithm achieves an average single-match processing time of only 0.08 s and maintains error variability as low as ±0.83 m under random perturbations. Furthermore, an ablation study confirms the necessity of the multi-strategy fusion mechanism in suppressing local optima entrapment and non-convergent oscillations. This study validates the engineering feasibility of the algorithm under conditions of low computational dependency, providing an effective technical approach for high-precision autonomous navigation in GPS-denied environments.
1. Introduction
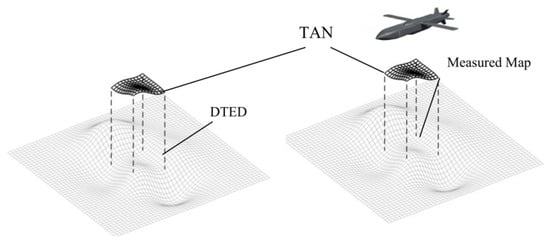
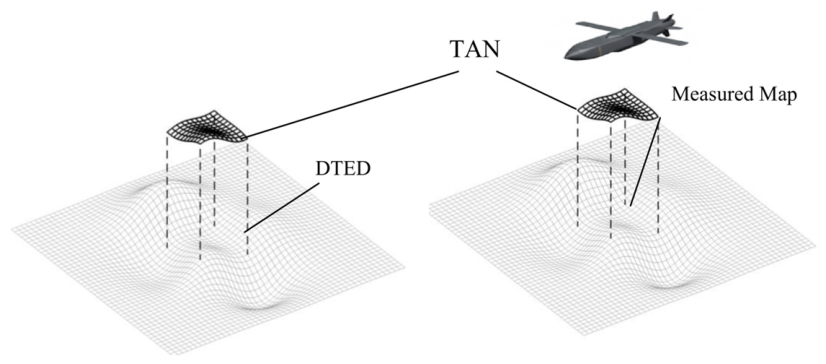
The Inertial Navigation System (INS) serves as the cornerstone of modern high-precision aviation due to its autonomy and accuracy. However, it inherently suffers from time-dependent error divergence, where positioning errors accumulate over the duration of the flight. To mitigate this issue, Terrain-Aided Navigation (TAN) is employed as a robust augmentation method. As shown in Figure 1, the fundamental principle of TAN involves utilizing onboard sensors to acquire real-time terrain elevation observations. These observed profiles are then correlated with a pre-stored Digital Terrain Elevation Database (DTED) to estimate the aircraft’s true position. This estimated position provides a discrete correction reference, effectively resetting the accumulated INS errors and ensuring long-term navigation precision [1].
Figure 1.
Schematic diagram of terrain matching navigation.
Among established terrain-aided navigation algorithms, Terrain Contour Matching (TERCOM) and the Sandia Inertial Terrain-Aided Navigation (SITAN) are two of the most representative techniques [2,3]. TERCOM is a map-matching technique based on a Digital Elevation Model (DEM), designed to correct the accumulating errors of an Inertial Navigation System (INS) over time. The traditional implementation relies on terrain elevation profiles (typically in the form of continuous strips or grids) collected along the flight trajectory. It estimates position by correlating these measured profiles with the DEM using similarity metrics such as least squares estimation. This approach makes it particularly suitable for vehicles with relatively stable and predictable flightpaths. The standard matching formulation is presented as follows:
Here, N represents the total number of sequential sampling points along the one-dimensional flight path. h_{r,i,j} represents the real-time measured elevation at the (i,j)-th sampling point acquired by the onboard radar altimeter. h_{m,i,j} represents the corresponding reference elevation extracted from the pre-stored Digital Terrain Elevation Database (DTED) along the projected trajectory.
SITAN, on the other hand, employs extended Kalman filtering to correct the course in real time, making it more adaptable to highly maneuverable platforms like fighter jets and unmanned aerial vehicles.
However, in environments characterized by flat, feature-sparse, and monotonously repetitive terrain, the matching problem often exhibits a highly multimodal fitness landscape. Consequently, traditional nonlinear estimation methods frequently suffer from vanishing gradients and entrapment in local optima [4,5,6].
With the advancement of computational intelligence, terrain matching is increasingly formulated as a complex spatial optimization problem to overcome the limitations of traditional contour matching. Among various metaheuristic strategies, Particle Swarm Optimization (PSO) has been widely adopted to search for optimal trajectory projections within the Digital Elevation Model (DEM). Numerous studies have improved PSO by adjusting inertial weights to adapt to varying terrain roughness, utilizing sequential similarity detection, or fusing multi-modal features to prevent premature convergence and meet real-time constraints [7,8,9,10]. Beyond PSO, other intelligent algorithms, such as Genetic Algorithms (GA) combined with the Sine Cosine Algorithm (SCA) [11] and the Salp Swarm Algorithm (SSA) mapped with adaptive weighting [12], have been introduced to enhance population information exchange and escape the “flat valleys” of the terrain fitness landscape.
However, despite possessing global search capabilities, representative algorithms like PSO and GA exhibit significant engineering limitations in high-dynamic navigation scenarios. The core issue with PSO lies in its tendency toward premature convergence over feature-sparse landscapes. Specifically, in areas with flat or repetitively featured terrains (such as sand dunes or periodic ridges), the terrain fitness function becomes highly multimodal. Consequently, the particle swarm can quickly become trapped in a pseudo-matching position (a local optimum) caused by similar topographical textures. Furthermore, its performance lacks stability across diverse mission environments due to heavy parameter dependence. Conversely, GA faces a substantial computational burden. Its mechanisms for population evaluation and stochastic crossover/mutation lead to unacceptably long processing times, fundamentally failing to meet the strict high-frequency guidance update requirements of modern flight control systems.
Alternatively, to handle the physical state uncertainties introduced by radar altimeter noise and DEM quantization errors, probabilistic matching and filtering estimation have been explored, shifting the paradigm from exact “hard matching” to probabilistic “soft matching”. Approaches utilizing probability density characteristics of elevation differences [13,14] and Particle Filtering (PF) [15,16,17,18] have proven effective. To synergize global convergence with local precision, hybrid frameworks such as coarse-to-fine matching combining TAN with PF have also been proposed [16]. Recent diverse advancements further include set-based state estimation using hybrid zonotopes [19], stereovision-based mapping frameworks [20], and fuzzy-logic systems utilizing aircraft attitude sensors to compensate for high-maneuver roll angles [21]. Furthermore, data-driven methodologies employing Neural Networks [22,23] have emerged as powerful tools for modeling complex nonlinear terrain mappings. In parallel, statistical rejection strategies using terrain-based indicators, such as the “minima ratio”, have been developed to effectively eliminate false-fix errors [24]. However, despite their effectiveness, their heavy reliance on extensive offline DEM training data severely restricts their tactical flexibility. In unknown or dynamically changing environments, these pre-trained models struggle to adapt online, highlighting the necessity for robust online optimization algorithms.
To address the aforementioned challenges of premature convergence in flat terrains and real-time computational bottlenecks, this paper proposes the IOOA, a hybrid framework integrating Lévy flight and Gaussian-based EDA to ensure robust matching in feature-sparse landscapes. We further introduce a lightweight Q-learning mechanism to adaptively balance global exploration and local exploitation. Validated by real-world datasets under high-dynamic flight conditions, the proposed method achieves superior accuracy with an online real-time performance of 0.08 s. The remainder of this paper details the mathematical models, the standard OOA limitations and the proposed IOOA strategy, experimental results, and conclusions.
2. Terrain Matching Model Based on Information Entropy
Traditional terrain contour matching typically relies on one-dimensional continuous strip elevation profiles along the flight path. However, this approach is highly susceptible to data distortion induced by navigation errors and demands extended data segments to ensure reliability. To overcome these limitations, this study utilizes airborne multi-beam radar altimeters to acquire two-dimensional terrain matrix data directly beneath the current position. By leveraging this enriched two-dimensional spatial information, matching accuracy and robustness are significantly enhanced.
Here, the matching region is formulated as a discrete two-dimensional elevation matrix. Furthermore, let hr(i,j) denote the real-time measured elevation at the (i,j)-th point within the matching region, and hm(i,j) represent the corresponding elevation extracted from the onboard digital map. While traditional correlation algorithms such as RMSD, RMAD, and RCOR determine the optimal match by searching for their respective minimum or maximum values, they exhibit inherent limitations. Specifically, the accuracy of standard TERCOM algorithms is severely constrained by a dual noise coupling effect.
First, multipath interference caused by electromagnetic wave penetration or reflection in complex geological structures (e.g., dry sand layers, subsurface rocks, or sparse vegetation) results in non-Gaussian distributed ranging errors. Second, discrete sampling in Digital Elevation Models (DEM) naturally smoothens micro-terrain features, causing a critical loss of resolution, particularly in flat areas with subtle topographic variations. Under these conditions, the measured elevation profile degenerates into a noise-dominated signal. Consequently, traditional cost function forms a high-frequency multimodal distribution within the search space, and the gradient near the true position vanishes. This causes the algorithm to become trapped in flat minimum regions, losing its discriminative capability and significantly degrading matching performance [22,25].
Moreover, although probabilistic matching approaches reframe the task as a probabilistic inference problem to handle uncertainties via likelihood estimation, they face severe limitations in engineering practice. These approaches typically necessitate exhaustive point-by-point comparisons and complex probability density calculations. This incurs substantial computational overhead, failing to meet the stringent real-time requirements of high-speed aerial platforms. Furthermore, such probabilistic frameworks are highly sensitive to measurement anomalies; when onboard sensors are corrupted by severe noise, reliance on these extensive computations frequently leads to degraded estimation accuracy.
Terrain entropy is based on the probability distribution of elevation values (rather than absolute numerical values). Its advantage lies in being more efficient and more resistant to interference. Traditional probability matching requires point-by-point detailed comparison of terrain elevations, which involves substantial computational effort and is susceptible to elevation measurement errors. In contrast, terrain entropy simplifies terrain features into a value representing the “degree of complexity.” During matching, only this value needs to be quickly compared, resulting in extremely fast computation and insensitivity to overall measurement biases in sensors. It is often used for rapid pre-screening, significantly narrowing the search range for precise matching. Noise disturbances only slightly alter the probability density function, making it significantly more stable than direct difference methods such as MAD/MSE [26,27]. Therefore, we adopt terrain entropy matching. The calculation formula is as follows:
Here, p(hi) represents the probability of the elevation value occurring within the matching window. However, calculating the logarithmic function point-by-point imposes a substantial computational burden on airborne embedded computers, severely restricting the real-time performance of the TAN system. To address this, in the engineering practice of cruise missile/UAV navigation [26], a linear approximation of the natural logarithm (which is closely related to its first-order Taylor expansion or the Tsallis quadratic entropy) is widely adopted. Substituting this into the Shannon entropy yields the simplified quadratic approximation:
where R(i) denotes the measured elevation value at the i-th grid point, and M represents the total number of sampling points within the matching window.
3. Osprey Optimization Algorithm
Proposed in 2023, the Osprey Optimization Algorithm (OOA) is a novel metaheuristic inspired by the hunting mechanisms of ospreys [28]. This algorithm addresses global optimization challenges by mathematically modeling the osprey’s behavior in detecting, tracking, and capturing prey. Mathematically, the algorithm considers a population of ospreys within a dimensional search space. The position of the osprey constitutes a candidate solution vector, denoted as Xi = (xi,1, xi,2, xi,d). The quality of each solution is determined by evaluating its objective function value at the current iteration. The OOA framework operates in two distinct phases: an exploration phase (identifying and attacking prey) and an exploitation phase (carrying prey to a secure location). In the exploration phase, the algorithm promotes global search capabilities by having each osprey randomly target another individual in the population as its prey. The corresponding position update is governed by:
Xnew represents the newly generated candidate position for the i-th osprey. Xi represents the current position vector of the i-th osprey. Fishpos denotes the position vector of the targeted prey, which corresponds to the position of another randomly selected individual from the current population and r is a random vector with its elements uniformly distributed in the interval [0, 1], denoted as rand ~ U(0,1). lbj and ubj represent the lower and upper bounds of the j-th dimension of the search space, respectively. r is a random integer selected from the set {1, 2}, which randomly determines the impact of the current position on the update step, where denotes the newly updated position of the i-th agent in the j-th dimension during the exploitation phase.t denotes the current iteration number of the optimization algorithm (distinguished from the physical simulation time t). SFj denotes the scaling factor (or sign factor) applied to the j-th dimension to further diversify the search direction.
The Osprey Optimization Algorithm (OOA) demonstrates unique applicability due to the high alignment between its biomimetic mechanism and the intrinsic logic of terrain matching. Its two-phase structure of “exploration exploitation” naturally corresponds to the terrain matching workflow. The population-based intelligent search effectively mitigates the search space uncertainty caused by Inertial Navigation System (INS) errors. Furthermore, the randomness in the exploration phase helps overcome issues common in flat terrain, such as multimodal cost functions and vanishing gradients, thereby avoiding entrapment in local optima.
However, despite providing a promising framework for terrain matching, the inherent limitations of OOA become apparent in extreme or special terrain environments, constraining further improvements in navigation accuracy. In feature-sparse, extremely flat terrains (such as vast deserts) or fragmented landscapes with high repetitiveness, the fitness landscape often exhibits extensive flatness or high-frequency multimodality. This causes a sharp decline in the efficiency of the traditional OOA’s random exploration strategy. Specifically, during the exploration phase, the population degenerates into a blind random walk due to the lack of effective gradient guidance, significantly retarding the convergence process. Meanwhile, in the exploitation phase, the elite guidance mechanism tends to cause the population to rapidly cluster around a local extremum. Due to initial position errors or sensor noise, this extremum is likely a pseudo-optimal solution far from the true position, and the algorithm lacks robust mechanisms to escape such “deceptive” regions.
4. Design of an Improved OOA-TERCOM Algorithm
4.1. Dynamic Search Space and Population
Due to the time-dependent drift characteristic of INS (Inertial Navigation System) errors, the INS error accumulates as time increases [29]. The terrain matching navigation system typically uses the INS-indicated position as the matching center. Therefore, INS errors, to some extent, affect matching accuracy. Traditional methods often keep the size of the matching area fixed. As a result, when the INS error is small, an excessively large matching radius may lead to redundant computations and reduced matching precision. Conversely, when the INS error is large, the matching area may be too small, also compromising matching accuracy. To address this issue, we propose the concept of a dynamic matching radius, where the matching range increases over time but remains constant during the initial 10 s. The same principle applies to the population.
4.2. Parallel Population Initialization
Typically, other intelligent optimization algorithms, such as the Particle Swarm Optimization (PSO) algorithm, randomly generate particles centered on the INS-indicated position. While this aligns with the basic principles of TERCOM, it often suffers from slow convergence and a tendency to fall into local optima. Moreover, the overly random distribution of particles in such cases can further slow down convergence. Therefore, we propose a more rational osprey initialization mode, namely synchronous candidate point generation: 80% of the points are randomly distributed around the previous frame’s optimal solution (Pinit = Pbest + N(0,(0.2R)2)), inheriting historical information), while 20% are fixed at the current INS position (Pinit = Pins, maintaining population diversity).
4.3. Dual-Mode Optimization Search
While the above initialization mechanism can improve convergence efficiency in most cases, its robustness heavily depends on the accuracy of historical matching results. The core issue is that, in areas with insufficient terrain features, the initial matching can easily deviate from the true position due to sensor noise or initial INS errors, resulting in a “misleading” historical optimal solution. In subsequent iterations, due to the weak gradient variation in the fitness surface over broad regions, the algorithm struggles to distinguish between the true optimum and false optima based on local information. In such scenarios, the traditional OOA exploration mechanism, which relies on random interactions between individuals, not only fails to correct the initial deviation effectively but may also rapidly draw the entire population into an incorrect local optimum due to the “convergence effect” of swarm intelligence. This leads to the so-called “premature convergence” or “misleading consensus” trap. Population diversity sharply declines, and the algorithm lacks an effective mechanism to escape this local optimum, causing positioning errors to accumulate or even diverge.
To address this issue, this paper proposes an improved strategy formalized in Equation (11). Distinct from the classical OOA, this formulation eliminates the dependency on the position of random peers Xrandom, transitioning instead to an Autonomous Stochastic Exploration mode. Specifically, the interaction term is replaced by a Lévy flight step, denoted as in the equation. Lévy flight is a random walk pattern where the step length follows a heavy-tailed distribution, characterized by frequent short-distance movements interspersed with occasional ultra-long-distance jumps. This mathematical structure not only mimics the efficient foraging behaviors of natural predators (e.g., albatrosses and sharks) but also empowers each agent to perform global-scale leaps independently (represented by the term ). This decentralized search mechanism fundamentally prevents the premature convergence caused by herd behavior, ensuring the algorithm maintains high diversity and activity in multi-modal terrains.
The calculation formula is as follows:
where u and v are random variables drawn from a normal (Gaussian) distribution.
β the Lévy flight index that controls the shape of the heavy-tailed distribution. In this study, it is empirically set to a constant value of β = 1.5 to ensure an optimal balance between short-distance random walks and occasional long-distance jumps.
The value of σv is generally set to 1. The value of σu depends on β and is given by:
Here denotes the standard Gamma mathematical function.
A critical innovation of this study is the incorporation of non-directional Lévy flight, which drastically boosts the stochastic nature of individual movements. This enhancement ensures that the algorithm maintains robust convergence capabilities, facilitating rapid recovery even when significant deviations occur in previous steps.
lb and ub represent the lower and upper bounds of the search space, respectively. α in (0, 1) is the probability threshold parameter that controls the transition between the global exploration and local exploitation phases and r is not a simple scalar, but rather a random direction vector in the dimensional search space. This ensures the multi-dimensional isotropic search behavior is mathematically correctly represented.
The exploration factor is a critical parameter that determines the intensity of the exploration phase, which directly influences the final optimization performance. Since a simple monotonic increase or decrease fails to adapt effectively to complex search environments, we introduce a Q-learning mechanism for dynamic adjustment. The Q-learning formula is given by [30]:
where st and at denote the current state and selected action at iteration t, respectively; η represents the learning rate; rt is the immediate reward received after taking the action; γ represents the discount factor, which determines the importance of future rewards; and maxa′Q(st+1,a′) denotes the maximum estimated Q-value over all possible actions a′ in the subsequent state st+1.
In this context, population diversity serves as the governing variable. Specifically, this metric is quantified by the Euclidean distance from each search agent to the geometric center of the population.
xcentral represents the geometric centroid of the current population, which is computed as the arithmetic mean of the spatial positions of all search agents.
Upon quantifying the population diversity, a discretization process is performed.
The number of states N is set to 10, and Rcoarse denotes the current coarse matching radius. Here, the floor function is applied to determine the state index s. Based on s, the ε-greedy strategy is employed to query the Q-table and select the corresponding action.
Representing four candidate actions.
In the Q-learning framework, the action space A is defined as a set of discrete candidate values for the exploration threshold parameter (previously introduced in Equation (12)). Specifically, the action set is defined as . At each decision step, the Q-agent selects a specific action α∈A based on the -greedy policy. It must be explicitly noted that this selected value is directly substituted into Equation (12) to serve as the real-time probability threshold. By doing so, the Q-learning algorithm acts as a high-level controller, dynamically regulating the transition probability between the global exploration and local exploitation phases of the IOOA to adapt to varying terrain complexities.
The reward function is defined as:
where Rfitness represents the fitness improvement reward, Rdiversity denotes the diversity maintenance reward, and Rconvergence serves as the stagnation penalty.
Fitness Improvement Reward
Here, fprev denotes the optimal fitness obtained in the previous iteration, while fcurrent corresponds to the optimal fitness of the current iteration.
denotes the change in the global best fitness value between two consecutive iterations. It is mathematically defined as = |f{best}{iter} − f_{best}{iter−1}|.
Here, the convergence rate is defined as:
To prevent the population from prematurely converging to local optima in feature-sparse terrains, a diversity maintenance reward, Rdiversity, is introduced into the Q-learning framework. It provides a positive stimulus when the population’s spatial dispersion exceeds a predefined safe threshold, thereby encouraging global exploration. It is formulated as a piecewise step function dependent on the current coarse matching radius Rcoarse:
where rd is a positive reward constant (empirically set to 5 in this study to match the magnitude of the fitness improvement reward), and γ represents the diversity threshold coefficient (set to 0.7). The variable Div denotes the current population diversity, as quantified in Equation (14).This mechanism explicitly penalizes over-concentration and rewards spatial distribution, ensuring the robustness of the exploration phase.
Having completed these calculations, we apply the primary Q-learning formula to update the state-action values:
It is important to clarify the architectural boundaries of the proposed framework. The incorporated Q-learning mechanism operates as an online learning process, updating its policy dynamically during flight. However, as is typical in time-critical aerospace engineering, the algorithm functions as a heuristic-bounded online adaptive system rather than a fully autonomous one. Secondary hyper-parameters such as the Lévy flight index (β) and the reward shaping coefficients in Equations (12), (20), (22), and (28) are fixed empirically based on extensive offline testing. Extending the online action space to dynamically tune all these variables would trigger the curse of dimensionality, preventing the Q-table from converging on the fly within the strict 0.2s real-time limit. By maintaining these variables as heuristic constants, the computational resources are focused exclusively on stably adapting the core exploration threshold online, thereby striking an optimal balance between algorithmic intelligence and engineering reliability.
In the exploitation phase, the algorithm employs an elite-guided intensification strategy. Since the exploration phase has already achieved broad coverage of the search space, the focus shifts to the intensive exploitation of promising regions. To this end, a Gaussian-based Estimation of Distribution Algorithm (EDA) is adopted. Specifically, in each iteration, the top η% of individuals are selected based on fitness rankings to form an elite set. Subsequently, the algorithm calculates the probability distribution characteristics namely, the mean (μ) and standard deviation (σ) of this set within the solution space. Based on this distribution, non-elite individuals are resampled to generate new solutions, thereby guiding the population to converge towards the high-quality regions identified by the elite group.
Elite Selection: The top η% of individuals exhibiting optimal fitness are selected from the current population to constitute the elite set E. This set is defined as E = {X1,X2,…,XeliteSize}, where the size of the elite group is calculated as eliteSize =⌊η × N⌋.
Gaussian Modeling: The elite set is treated as a sample drawn from the distribution of the optimal solution. Accordingly, the parameters of the corresponding multivariate Gaussian distribution are calculated. The probability model is given by:
Specifically, the mean vector μ and the covariance matrix Σ are computed based on the statistical properties of the elite set:
Probabilistic sampling update: Based on the established Gaussian probability model, new candidate solutions are generated to replace the non-elite individuals in the population.
To intensively exploit the promising regions identified during the exploration phase, specifically, each agent enters the exploitation phase with a probability of (1 − α). The position update formula is given by
where pnew and pold denote the updated position and the current position of the agent, respectively. p best represents the current global optimal position discovered by the swarm and rand represents the random step size. This strategy incorporates two pivotal mechanisms. First, by introducing a dynamically adjustable exploitation factor κ, agents are guided to approach the current global optimal solution with an adaptive step size, thereby facilitating rapid convergence. Second, to prevent the loss of population diversity and subsequent entrapment in local optima, a Gaussian random perturbation term N(0, (0.1R)2) is superimposed onto the convergence operation. The amplitude of this perturbation is correlated with the search radius R, ensuring robust exploration capabilities in the early stages while enabling progressively refined exploitation in the later stages.
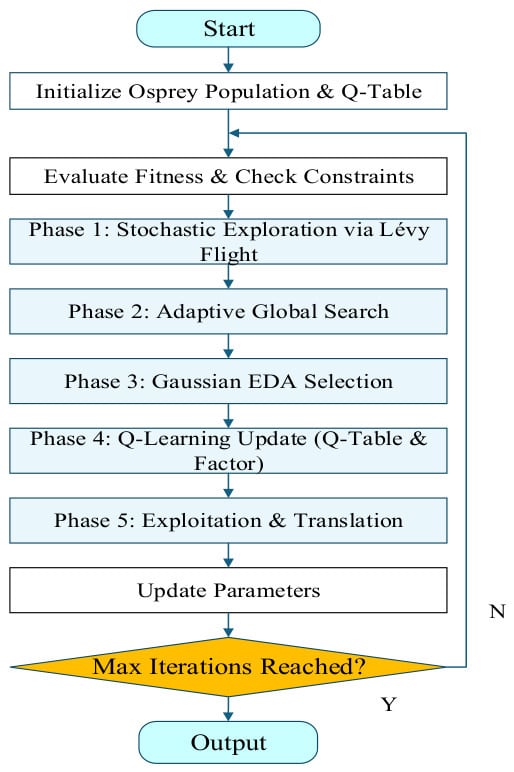
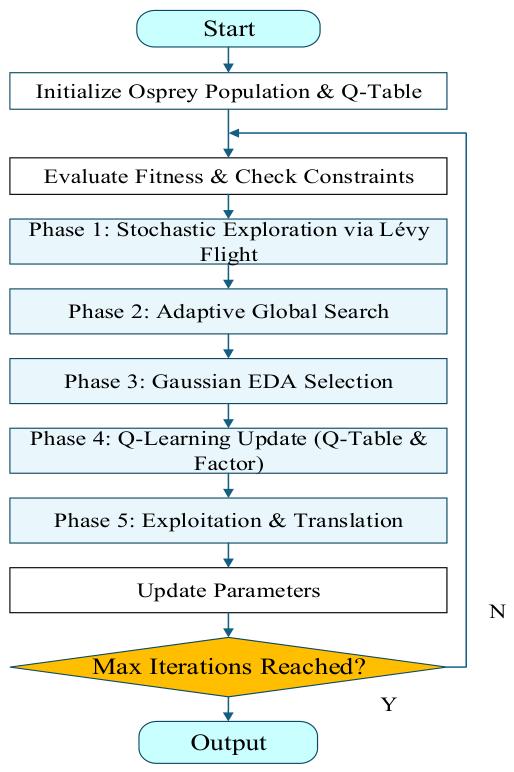
This “convergence-plus-perturbation” paradigm forms an effective complement to the probabilistic model constructed by the Estimation of Distribution Algorithm (EDA). While EDA guides population evolution through a Gaussian distribution model derived from elite samples, the proposed strategy executes directional exploitation at the individual level. Together, these mechanisms maintain an effective equilibrium between global exploration and local exploitation, ultimately significantly enhancing the precision and convergence speed of terrain matching through concentrated optimization. The fitness function is defined as fit = |H_{map}-H_{meas}|, where H denotes the terrain entropy. The holistic architecture and implementation details of the proposed IOOA framework are illustrated in the flowchart (Figure 2) and structured in the pseudo-code (Algorithm 1. IOOA).
Figure 2.
Flowchart of the algorithm.
| Algorithm 1. IOOA |
| input: N, T_max, D, F(·) output: X_best, F_best 1 Initialize: Random population X Generate 80% of X around X_prev: X_part1 = X_prev + N(0, (0.2R)2) Generate 20% of X around INS_pos: X_part2 = INS_pos, Q-table, t = 1, Evaluate F(X), set X_best, F_best. |
| 2 While t ≤ T_max do: |
| 3 Exploration: |
| 4 For each X_i: Move via Levy flight; |
| 5 end |
| 6 Rank population; |
| 7 Build Gaussian model from top K individuals; |
| 8 Move remaining individuals via Gaussian distribution; |
| 9 Update Q-table based on population dispersion; |
| 10 Exploitation: |
| 11 For each X_i: Move toward X_best with random variation; |
| 12 end |
| 13 Update: |
| 14 Update X_best, F_best if improved t = t + 1; |
| 15 end |
5. Experimental Verification and Result Analysis
To systematically validate the effectiveness and superiority of the Improved Osprey Optimization Algorithm (OOA) in terrain-aided navigation, we designed two sets of simulation experiments targeting different terrain complexity environments (flat low-hill terrain and extreme desert terrain). Comparative analyses were conducted with multiple algorithms, selected as representative benchmarks: traditional terrain entropy matching (TERCOM) serves as the baseline, highlighting the limitations of classical methods; Particle Swarm Optimization (PSO) and Genetic Algorithm (GA) are typical applications in intelligent optimization but are prone to premature convergence or high computational costs; the Dung Beetle Optimizer (DBO) represent emerging optimization strategies, while the Normalized Cross-Correlation (NCC) sliding sequence matching method emphasizes real-time performance. Through this multidimensional comparison, we aim to comprehensively evaluate the breakthroughs of the Improved OOA in terms of convergence accuracy, robustness, and adaptability, particularly in addressing challenges such as INS error accumulation and insufficient terrain features. The experimental setup is described below, with terrain feature visualizations shown in in the next sections, providing an intuitive basis for subsequent error analysis.
All simulation experiments in this study were conducted within a unified computing environment, utilizing MATLAB 2014b as the platform for algorithm implementation and data analysis. The hardware configuration consisted of a workstation equipped with an Intel Core i7-12700H processor and 32 GB of RAM, ensuring the efficiency of large-scale terrain data processing. This standardized environment provided a fair basis for subsequent performance comparisons. It is important to note that the experiments were performed on this standard consumer-grade personal computing platform without enabling any dedicated hardware acceleration devices typical of high-performance workstations (e.g., high-end GPUs or FPGAs). This choice of a general-purpose testing benchmark aimed to verify the algorithm’s operational stability and compatibility under non-specialized computing architectures. Experimental results demonstrate that the proposed algorithm imposes minimal computational demands on the underlying hardware resources. This hardware-agnostic characteristic ensures exceptional engineering portability, facilitating low-cost and seamless migration to airborne or missile-borne embedded flight control computers with similar architectures.
To ensure a strictly fair algorithmic comparison, all evaluated algorithms were executed under identical conditions: utilizing the same underlying DEM data, reference flight trajectories, and simulated noise models. Furthermore, to isolate the search capabilities of the optimization algorithms, all swarm intelligence methods (IOOA, PSO, GA, and DBO) strictly employed the identical Terrain Information Entropy map as their shared fitness function. Thus, the performance margins demonstrated in the following tests are entirely attributable to the intrinsic mechanisms of the respective algorithms.
Considering Radar Altimeter Noise, the altimeter measurement model in our simulation is fundamentally represented as:h_{meas} = h_{true} + v_{radar}.where h_{meas} is the measured ground clearance, h_{true} is the true relative altitude, and v_{radar} represents the composite measurement noise. In practical engineering, v_{radar} is highly complex, subject to thermal noise, beamwidth footprint averaging effects (especially over rugged mountain peaks), and vegetation canopy interference. These factors inevitably introduce non-Gaussian noise spikes.
To isolate and verify the core mechanism of the proposed matching algorithm, this study adopts a simplified engineering assumption by modeling as a zero-mean Gaussian white noise , with σradar = 15 m. While traditional point-to-point matching algorithms (such as TERCOM) are highly sensitive to such noise, the proposed IOOA method extracts terrain entropy (Equations (4) and (5)) to construct the fitness function. This macroscopic information-theoretic feature acts as an inherent low-pass filter, making the matching process significantly more resilient to both high-frequency measurement noise and isolated sensor anomalies.
5.1. Simulation Test 1
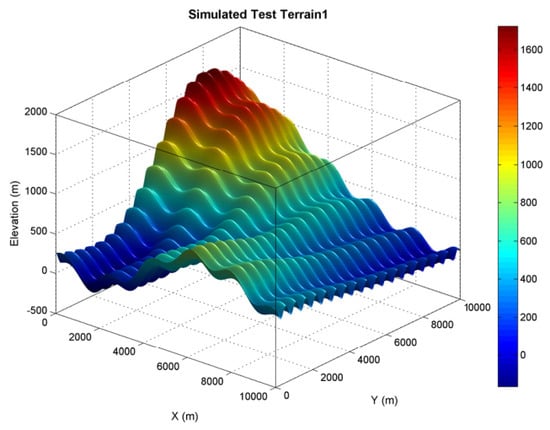
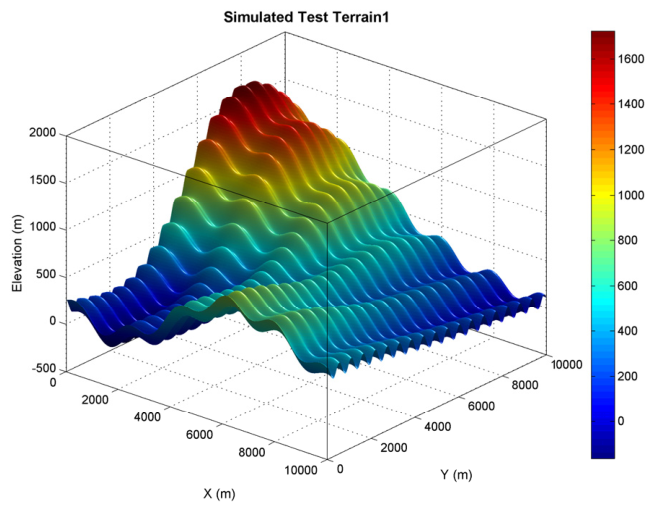
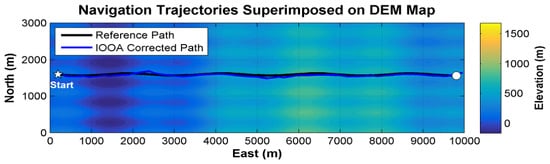
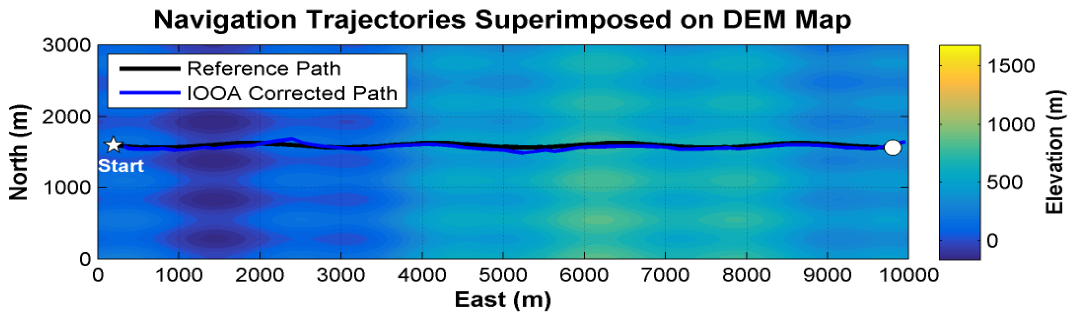
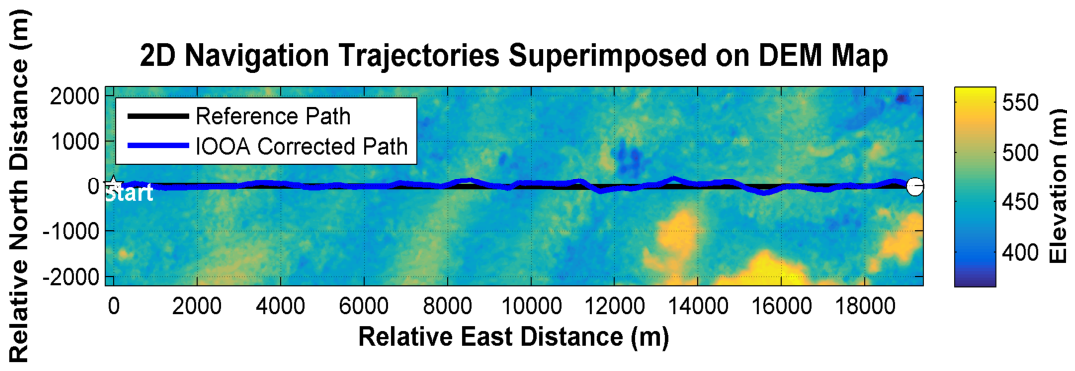
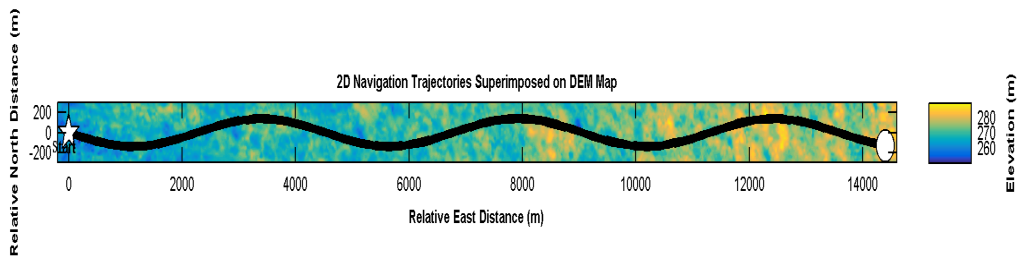
Simulation Test 1: Reference Terrain—A 10 km by 10 km Digital Elevation Model of Moderately Undulating Foothill Terrain. The experimental 3D flight environment and simulation settings are characterized by the Digital Elevation Model in Figure 3, the trajectory fitting results in Figure 4 and the detailed parameters listed in Table 1. The star and circle in Figure 4 denote the starting and ending points, respectively.
Figure 3.
Simulated Test Terrain1.
Figure 4.
Navigation trajectories superimposed on the Digital Elevation Model (DEM) map.
Table 1.
Parameter Settings for Simulation Test 1.
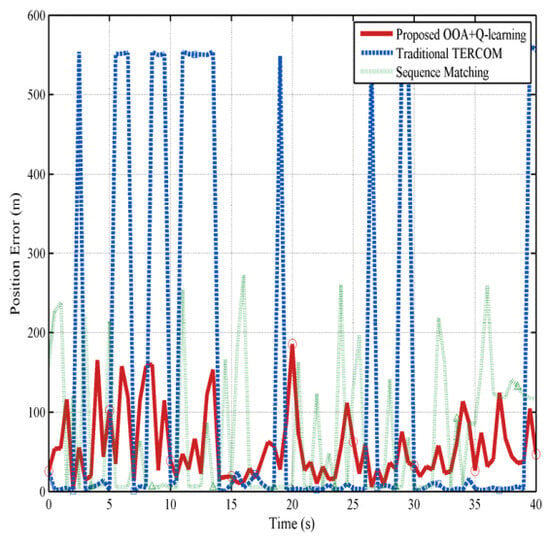
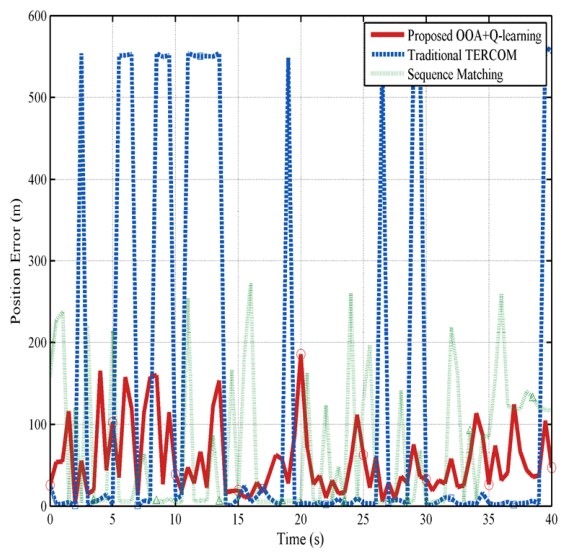
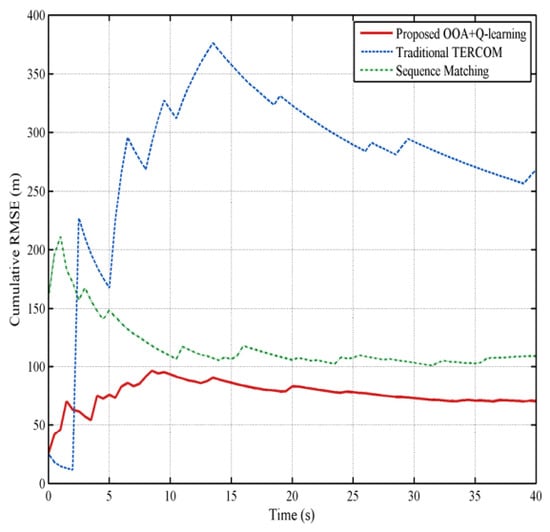
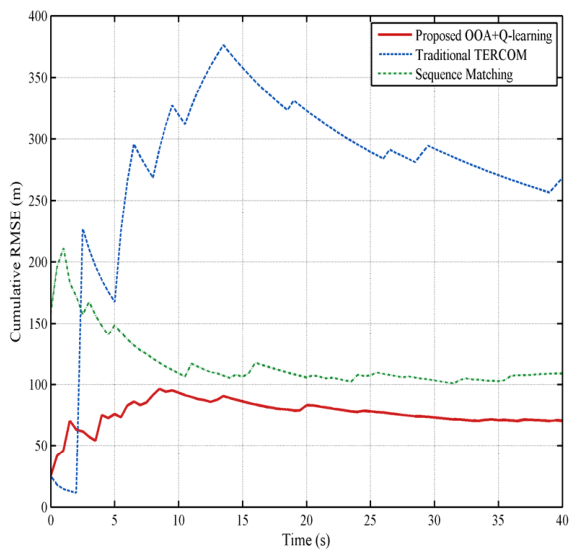
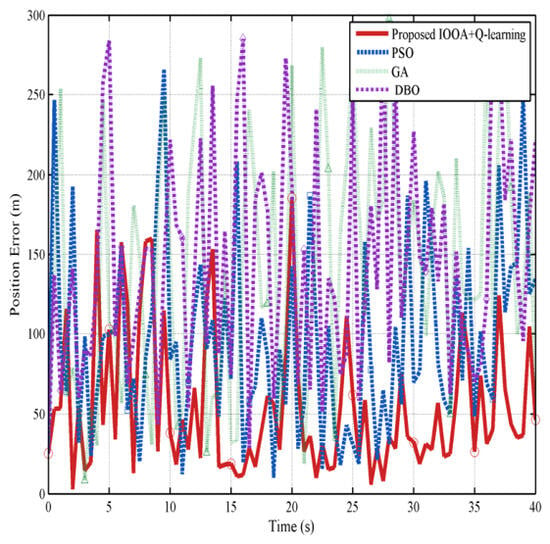
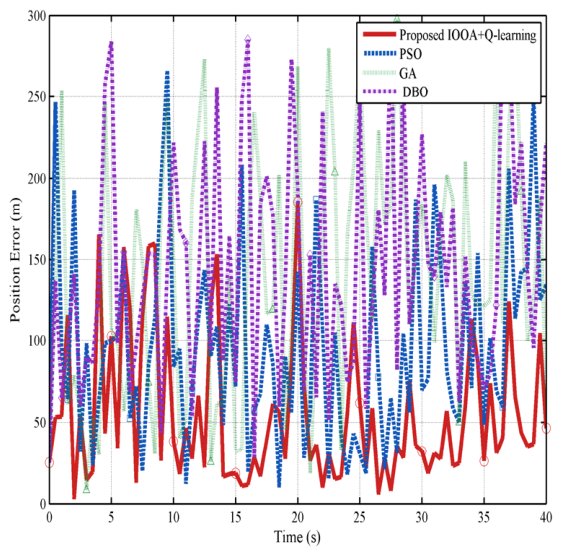
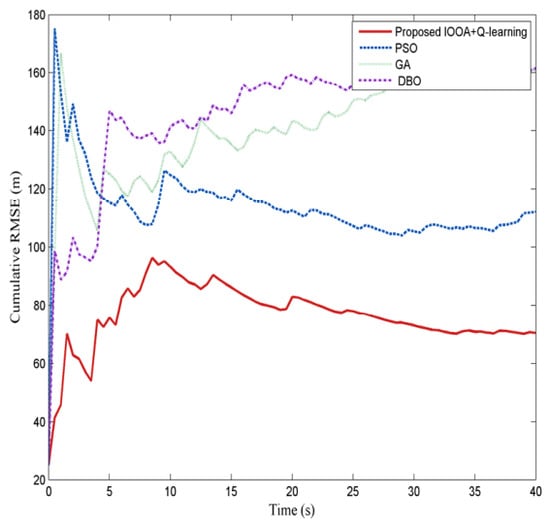
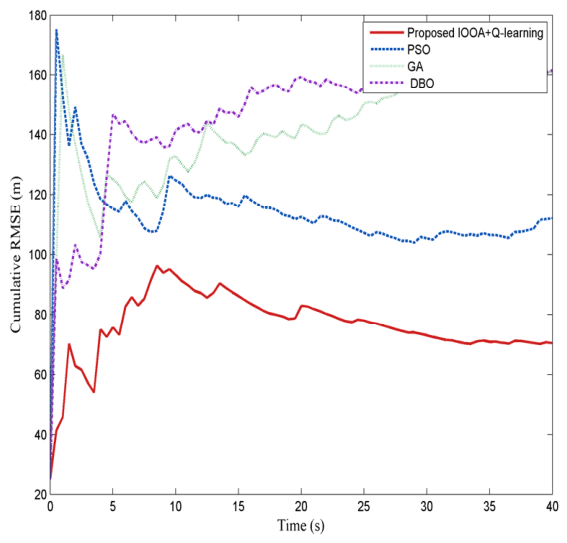
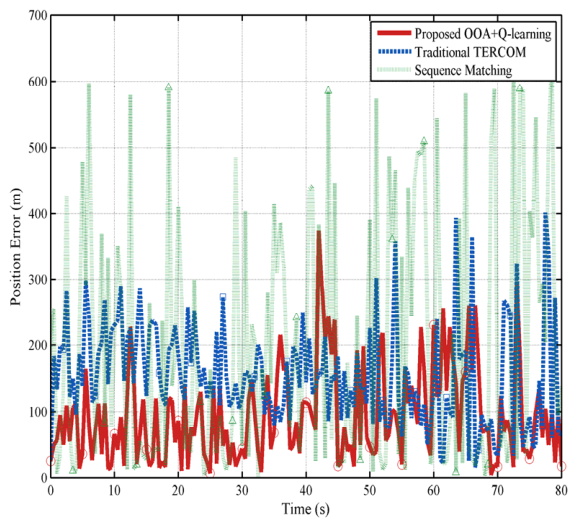
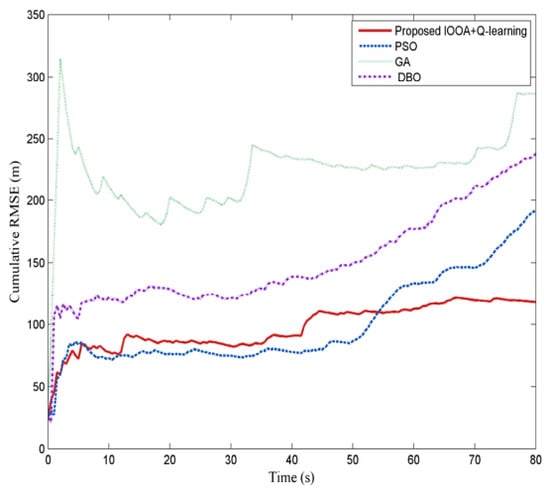
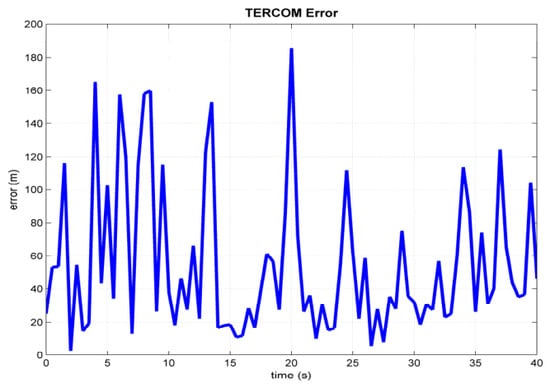
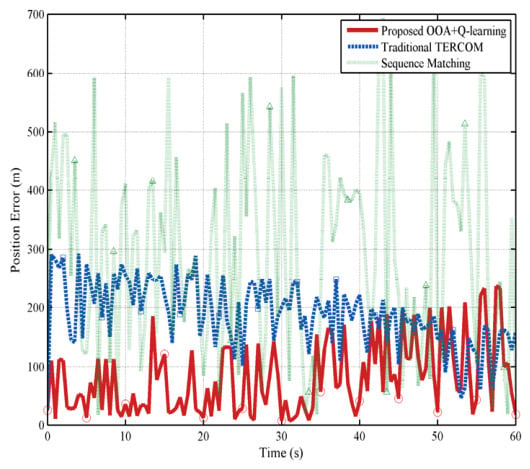
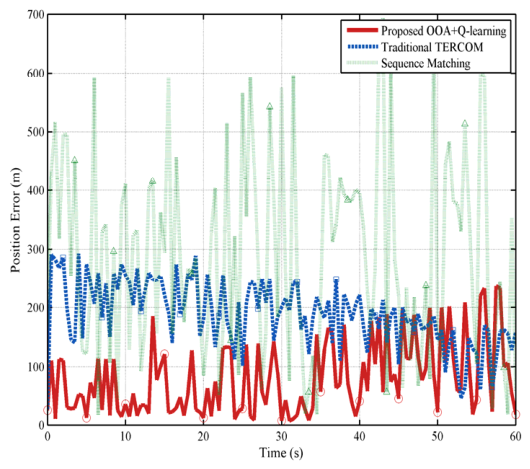
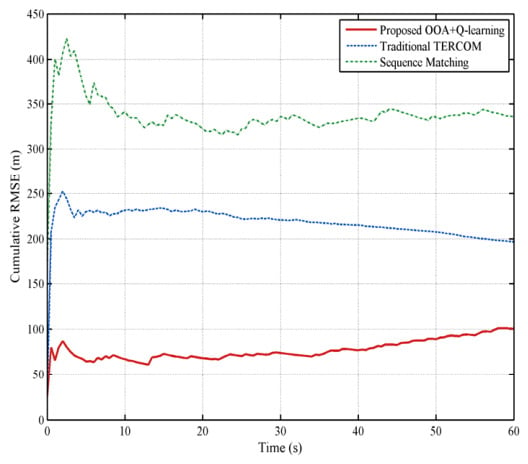
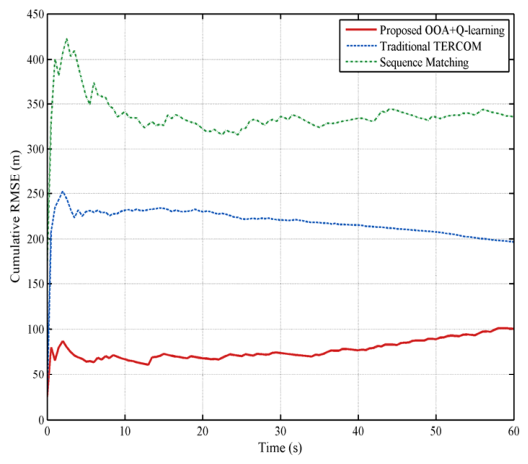
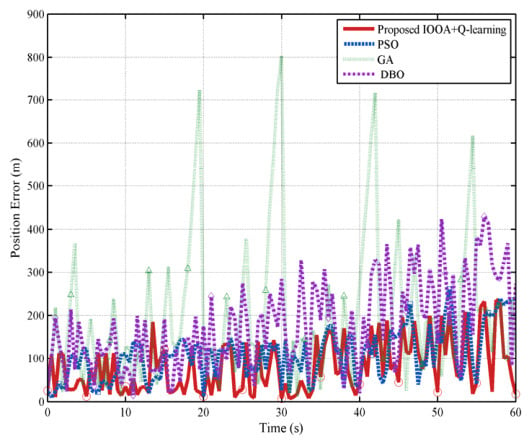
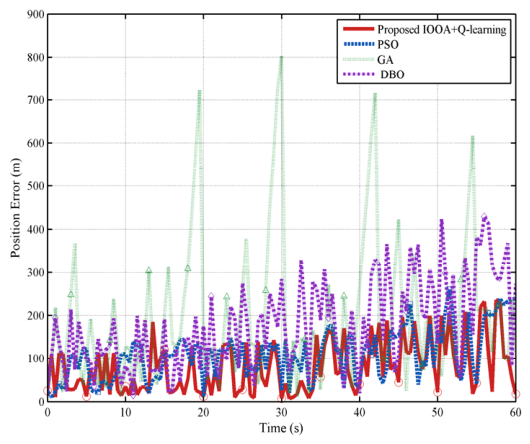
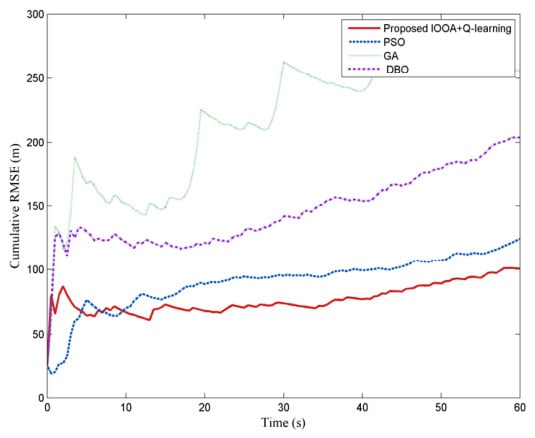
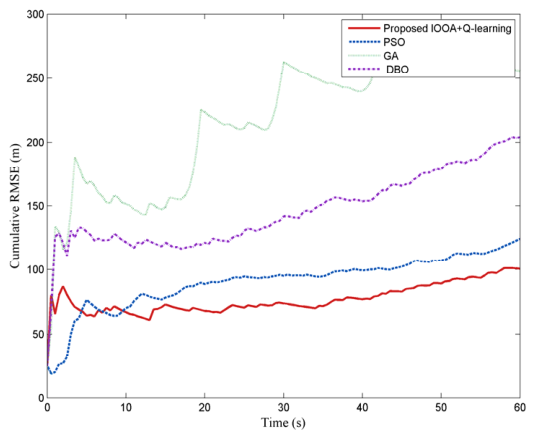
As illustrated in Figure 5 and Figure 6, although Terrain 1 features only moderate elevation variations, its topological structures are highly repetitive, creating prominent pseudo-matching traps (local optima). Consequently, the traditional TERCOM algorithm easily falls into these false matching regions under the dual noise coupling effect, exhibiting severe error divergence and frequent positioning jumps. In contrast, the proposed IOOA+Q-learning framework maintains a highly stable error curve. Furthermore, comparing the performance among swarm intelligence algorithms in Figure 7 and Figure 8, PSO and GA exhibit obvious premature convergence, trapped in the aforementioned pseudo-matching regions with cumulative RMSE exceeding 100 m. As quantitatively detailed in Table 2, the proposed IOOA successfully suppresses the total positioning error to 54 m, achieving a remarkable improvement of 56.8% over the traditional method. This explicitly validates the effectiveness of the non-directional Lévy flight mechanism in forcefully escaping repetitive terrain traps.
Figure 5.
Error comparison with traditional algorithms.
Figure 6.
Cumulative RMSE comparison with traditional algorithms.
Figure 7.
Error comparison with other swarm intelligence algorithms.
Figure 8.
Cumulative RMSE comparison with other swarm intelligence algorithms.
Table 2.
Error statistics for Simulation Test 1.
5.2. Simulation Test 2
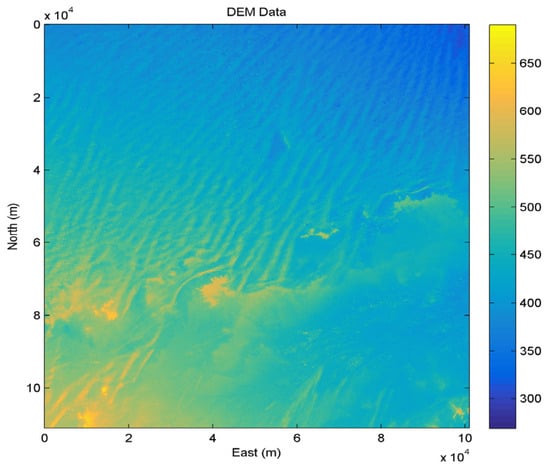
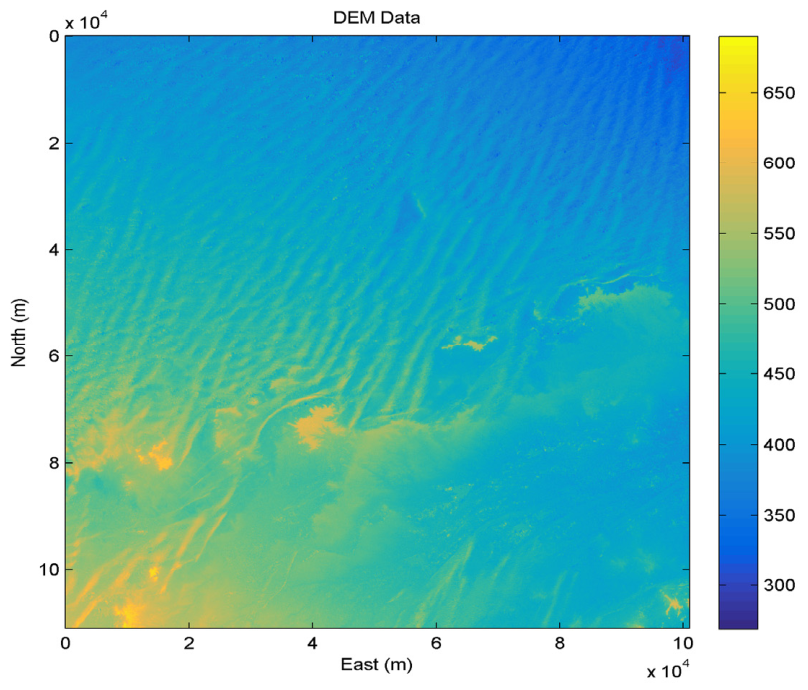
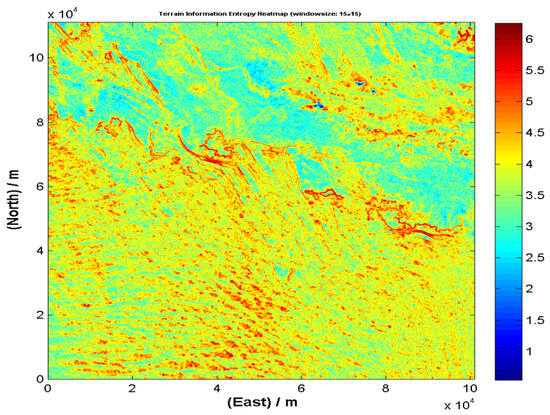
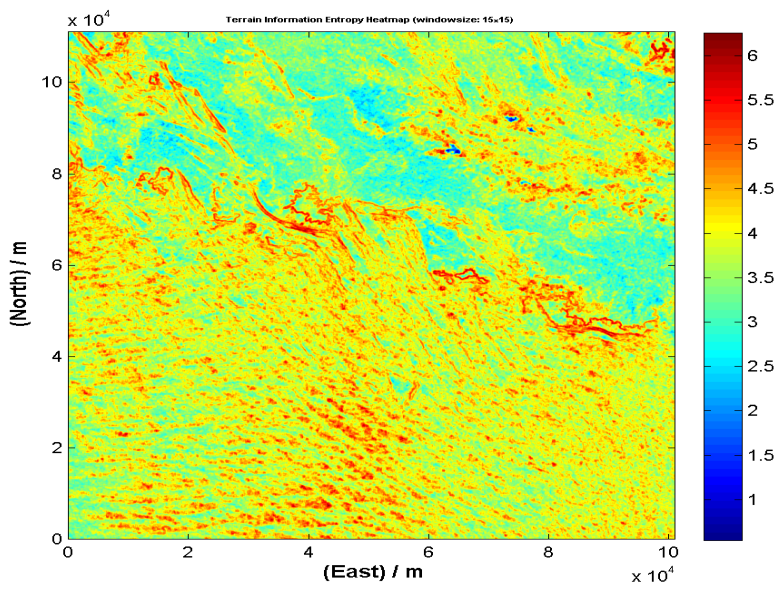
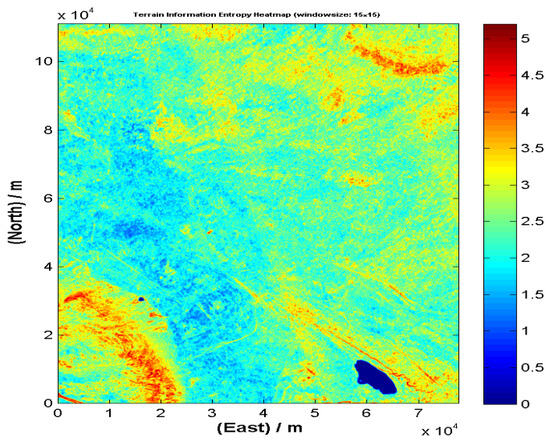
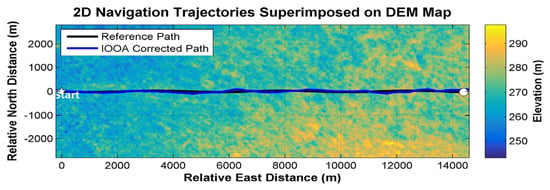
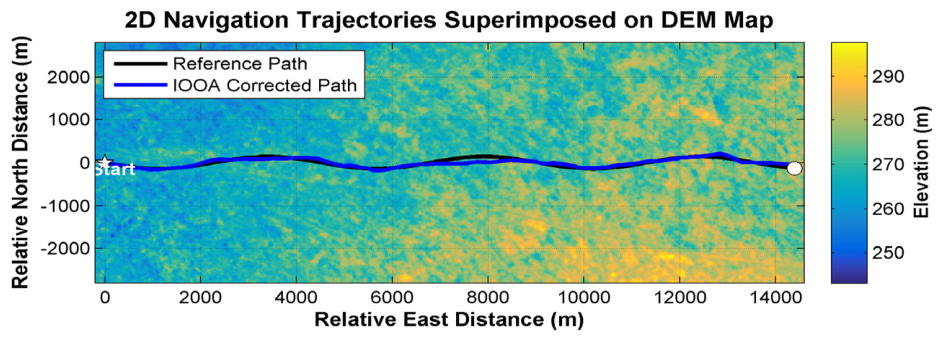
The study area is located in southeastern Libya, within the Sahara Desert (Al Kufrah Province), spanning latitudes 24° N to 25° N and longitudes 20° E to 21° E. The experimental 3D flight environment and simulation settings are characterized by the Digital Elevation Model in Figure 9, the corresponding terrain entropy map in Figure 10, the trajectory fitting results in Figure 11 and the detailed parameters listed in Table 3. The star and circle in Figure 11 denote the starting and ending points, respectively.
Figure 9.
Simulated Test Terrain 2.
Figure 10.
Terrain Entropy Heat Map2.
Figure 11.
Navigation trajectories superimposed on the Digital Elevation Model (DEM) map.
Table 3.
Parameter Settings for Simulation Test 2.
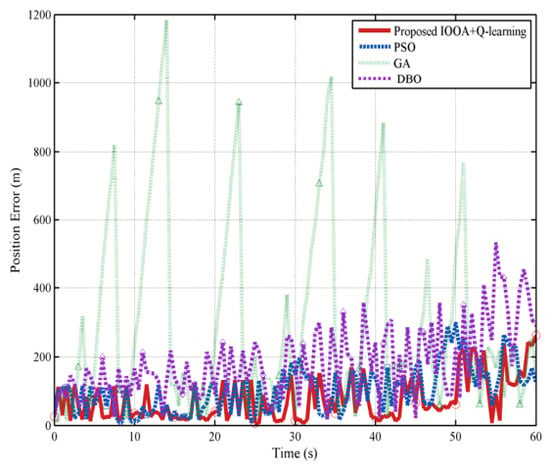
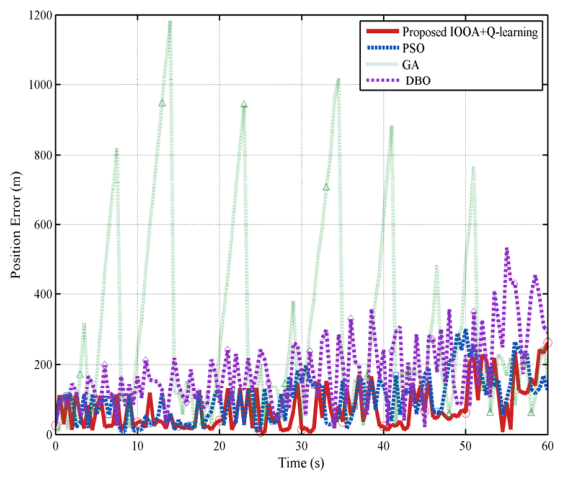
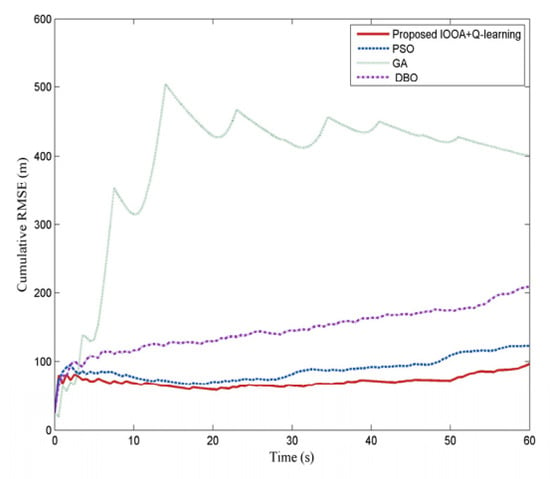
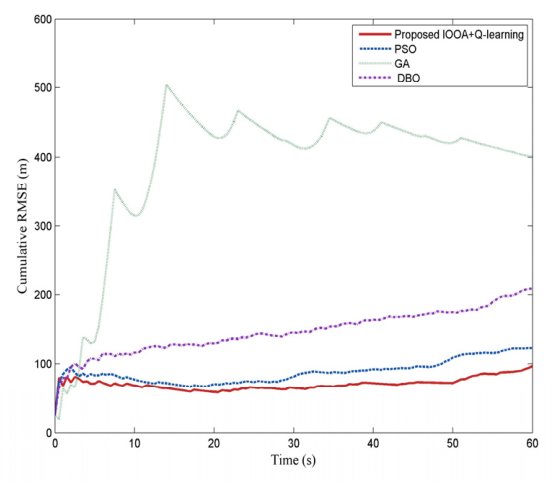
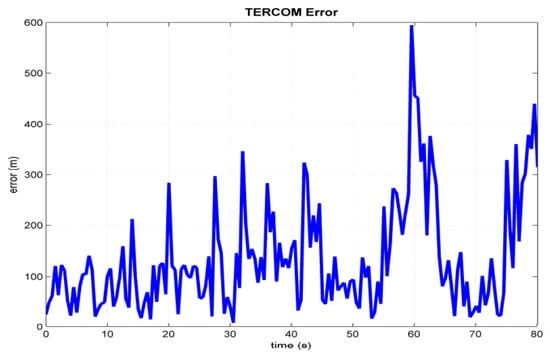
As depicted in Figure 12 and Figure 13, Terrain 2 (the Libyan Sahara) presents an extreme challenge for TAN systems due to its highly flat and feature-sparse nature. In such monotonous environments, the fitness landscape exhibits widespread flatness and extremely weak gradients. Consequently, traditional TERCOM algorithms struggle to locate distinct terrain contours, leading to severe mismatching and a high cumulative RMSE. Furthermore, Figure 14 and Figure 15 reveal that conventional swarm intelligence algorithms (PSO, GA, and DBO) also suffer significantly. Lacking distinct terrain features to guide the search agents, these algorithms degenerate into blind random walks and are easily trapped in flat local optima, resulting in total positioning errors well over 120 m. In stark contrast, the proposed IOOA maintains the most stable bounded error curve. As quantitatively detailed in Table 4, IOOA successfully suppresses the total positioning error to 94 m, achieving a 37.3% improvement over the traditional method. This explicitly demonstrates that the dual-mode search mechanism effectively prevents the population from experiencing ‘misleading consensus’ or premature convergence, ensuring robust global search capability even in the most feature-deficient landscapes.
Figure 12.
Error comparison with traditional algorithms.
Figure 13.
Cumulative RMSE comparison with traditional algorithms.
Figure 14.
Error comparison with other swarm intelligence algorithms.
Figure 15.
Cumulative RMSE comparison with other swarm intelligence algorithms.
Table 4.
Error statistics for Simulation Test 2.
5.3. Simulation Test 3
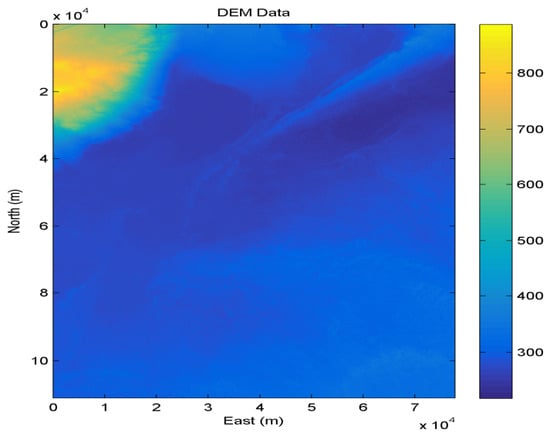
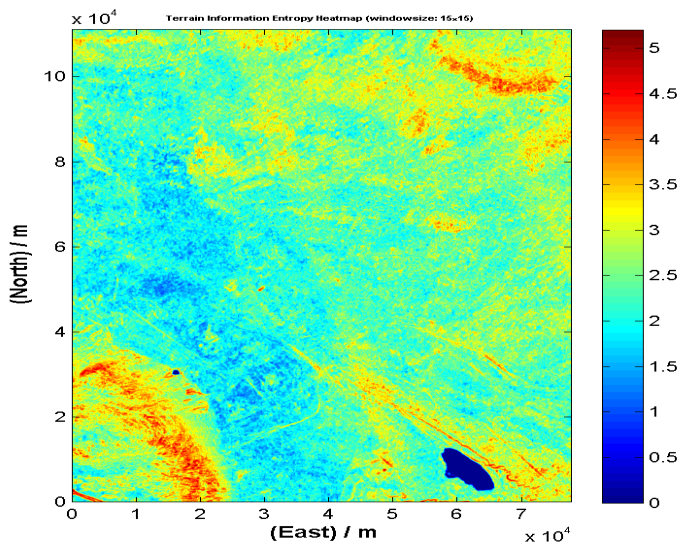
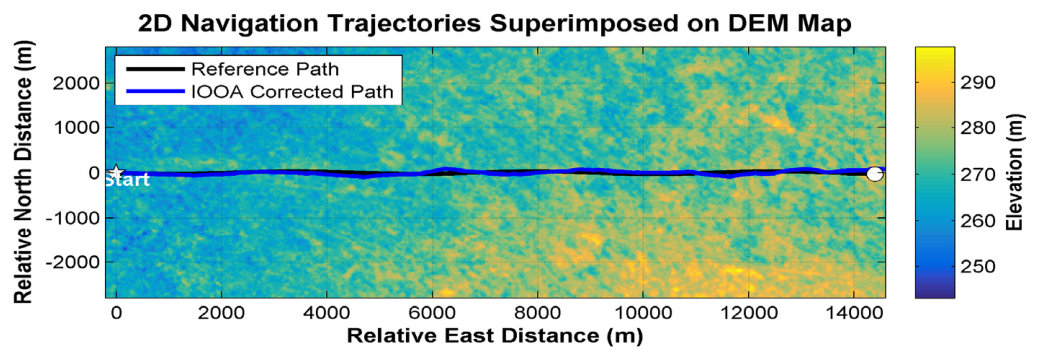
The study area is situated in the central part of the Junggar Basin, Xinjiang, China, within the geographical coordinates of 44° N–45° N and 85° E–86° E. The experimental 3D flight environment and simulation settings are characterized by the Digital Elevation Model in Figure 16, the corresponding terrain entropy map in Figure 17, the trajectory fitting results in Figure 18 and the detailed parameters listed in Table 5. The star and circle in Figure 18 denote the starting and ending points, respectively.
Figure 16.
Simulated Test Terrain 3.
Figure 17.
Terrain Entropy Heat Map3.
Figure 18.
Navigation trajectories superimposed on the Digital Elevation Model (DEM) map.
Table 5.
Parameter Settings for Simulation Test 3.
Here, 50 Monte Carlo runs were performed, and the statistical mean of the results is presented as follows.
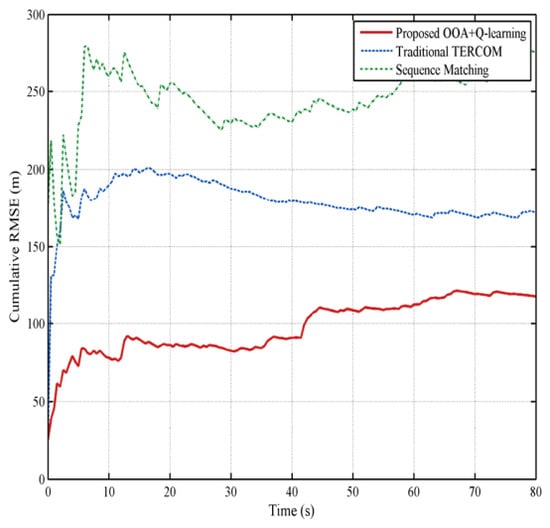
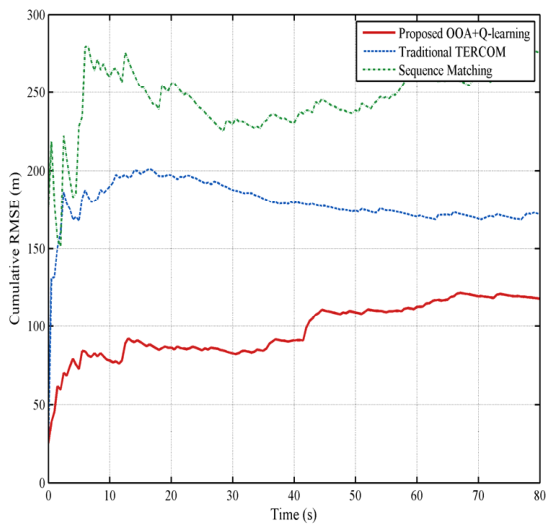
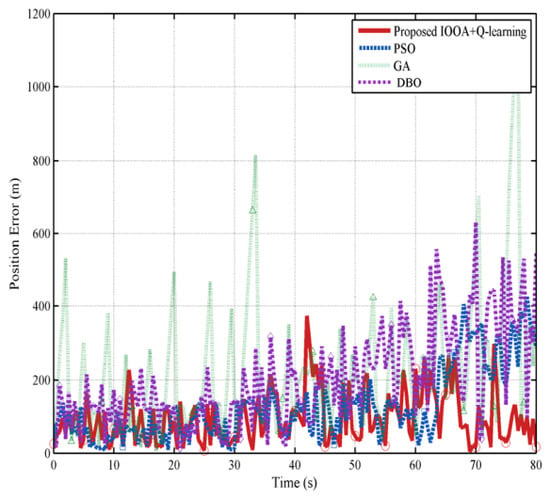
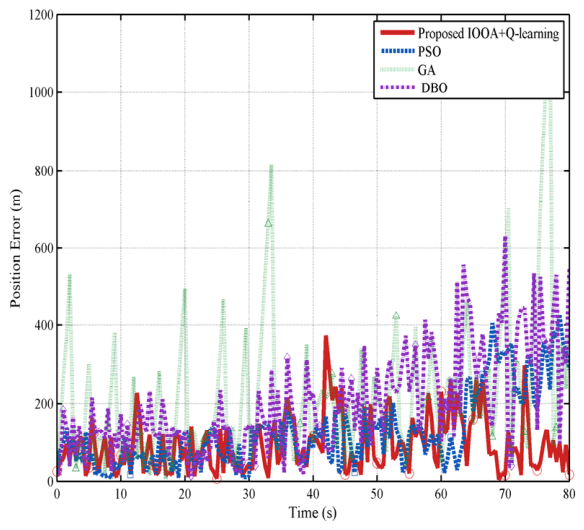
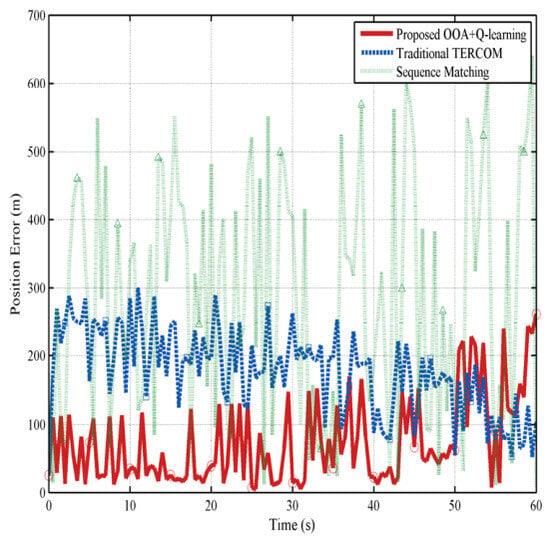
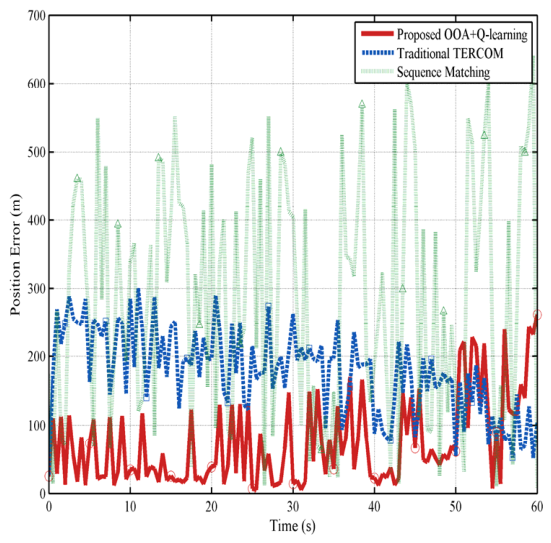
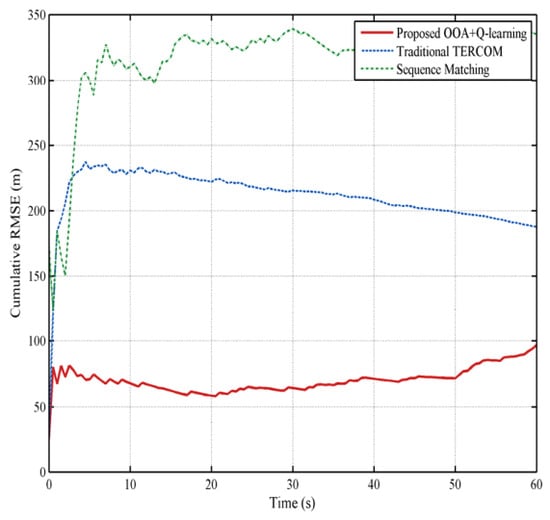
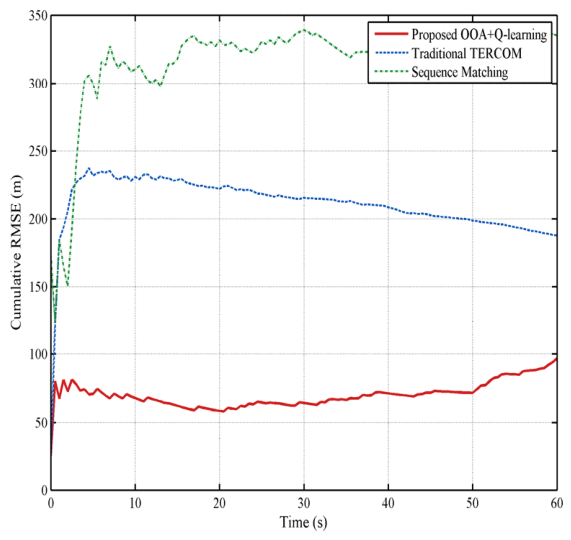
As illustrated in Figure 19 and Figure 20, Terrain 3 (the Junggar Basin) presents a highly heterogeneous geographical environment, characterized by alternating flat desert regions and sudden rugged ridges. This composite terrain rigorously tests the dynamic adaptability of navigation algorithms. Traditional TERCOM and sequence matching algorithms exhibit severe delayed responses and error accumulation when transitioning between feature-sparse and feature-rich areas, with TERCOM’s cumulative RMSE approaching 200 m. Furthermore, observing the swarm intelligence performance in Figure 21 and Figure 22, algorithms with static evolutionary parameters struggle to adapt to this spatial variability. Specifically, GA diverges completely due to its inability to converge quickly over suddenly rugged areas, while PSO experiences a gradual error drift. In contrast, the proposed IOOA exhibits exceptional robustness, consistently bounding the error below 100 m. As detailed in Table 6, IOOA limits the total positioning error to 85 m, outperforming the conventional algorithm by 50.9%. This outstanding performance definitively validates the necessity of the embedded Q-learning mechanism, which dynamically intelligently toggles the exploration exploitation threshold based on real-time population diversity, ensuring optimal adaptability across continuously changing terrain complexities.
Figure 19.
Error comparison with traditional algorithms.
Figure 20.
Cumulative RMSE comparison with traditional algorithms.
Figure 21.
Error comparison with other swarm intelligence algorithms.
Figure 22.
Cumulative RMSE comparison with other swarm intelligence algorithms.
Table 6.
Error statistics for Simulation Test 3.
5.4. Simulation Test 4 Effects of Fine Matching and Real-Time Performance Testing
To evaluate the algorithm’s sensitivity to fine matching, 20 tests with randomized fine-matching ranges (Terrain 1) were conducted. The average error curves are shown in Figure 23.
Figure 23.
Fine Matching Impact Test.
As the simulation results are presented in Figure 23, the improved algorithm demonstrated robust performance in the evaluation. It achieved an average positioning error of 55.03 m, with a low variability (±0.83 m) and a tight error range of 53.61 to 56.18 m across tests. This consistent and relatively high intrinsic accuracy indicates that the algorithm’s performance is not highly sensitive to or dependent on fine-tuning of the fine-matching parameters. Furthermore, the computational efficiency was notable, with an average processing time of only 0.08 s per matching operation. This speed readily satisfies the critical requirement for real-time application in the intended operational scenario. In summary, the algorithm successfully balances the dual objectives of precision and computational speed.
5.5. Ablation Study
The figure above presents the error curve (for Terrain 2) after removing the Q-learning parameter adaptation mechanism and the EDA elite guidance strategy. The simulation results are presented in Figure 24. It can be visually observed that although the introduction of the Lévy flight strategy provides the algorithm with a certain level of global search capability, as evidenced by the error occasionally dipping to around 20 m, the overall error curve exhibits a pronounced, jagged oscillatory pattern. Throughout the simulation period, the algorithm fails to achieve stable convergence and experiences multiple significant error rebounds exceeding 350 m.
Figure 24.
Ablation experiment.
5.6. Stress Testing
To comprehensively evaluate the practical applicability boundaries of the navigation framework, a stress-testing scenario closely resembling real-world tactical environments is designed. In actual flight, aircraft frequently execute high-dynamic evasive maneuvers (e.g., serpentine or S-turns) for dynamic obstacle avoidance.
Before presenting the algorithmic performance, it is imperative to establish the underlying physical coupling between maneuver intensity and sensor degradation in this simulation. As the aircraft executes highly dynamic evasive maneuvers characterized by large bank angles and rapid heading transitions, the compounded errors from the onboard sensors amplify non-linearly. Specifically, intense maneuvers accelerate the drift accumulation of the Inertial Navigation System (INS). More critically, as the roll angle increases, the radar altimeter’s downward-looking beam deviates significantly from the nadir, exacerbating slant-range geometric distortions. This severe misalignment directly triggers the heavy-tailed glint noise (contaminated Gaussian Mixture) modeled in our simulation, inducing multi-path fading, specular reflections off mountain slopes, and temporary signal loss of lock (the signal loss-of-lock rate is 0.15). Consequently, the magnitude of the baseline measurement error is inherently proportional to the severity of the tactical maneuver, presenting an extreme stress condition for any terrain-matching algorithm. The planned flight trajectory is illustrated in Figure 25, and the trajectory fitting results are shown in Figure 26. The simulation results are presented in Figure 27, Figure 28, Figure 29 and Figure 30, and the corresponding quantitative metrics are summarized in Table 7.
Figure 25.
Highly dynamic flight conditions.
Figure 26.
Navigation trajectories superimposed on the Digital Elevation Model (DEM) map.
Figure 27.
Error comparison with traditional algorithms.
Figure 28.
Cumulative RMSE comparison with traditional algorithms.
Figure 29.
Error comparison with traditional algorithms.
Figure 30.
Cumulative RMSE comparison with other swarm intelligence algorithms.
Table 7.
Error statistics for Stress testing.
Under these highly dynamic flight conditions (e.g., continuous S-turns and large bank angles), it is expected that navigational precision will face severe challenges due to non-Gaussian noise and multi-path effects. However, as demonstrated by the results, the proposed IOOA framework maintains exceptional robustness. Compared to the steady-state level flight condition in the Junggar Basin (Terrain 3) where the total average error was 85 m, the average positioning error under this extreme stress-testing scenario only marginally increased by 4 m, reaching 89 m. This slight variance is entirely acceptable for autonomous aerial platforms navigating in complex environments. By effectively preventing the catastrophic divergence that plagues traditional methods, the IOOA framework successfully bridges the gap between high platform maneuverability and the required navigational reliability, ensuring that the aircraft can robustly maintain its trajectory even under severe sensor disturbances.
5.7. Parameter Sensitivity Test
To ensure a fair and practically meaningful evaluation, the parameter sensitivity analysis was conducted under a strict computational time constraint typical for aerospace applications (i.e., a maximum allowable matching time of 0.2 s).
5.7.1. Impact of Lévy Flight Parameter (β) on Search Dynamics
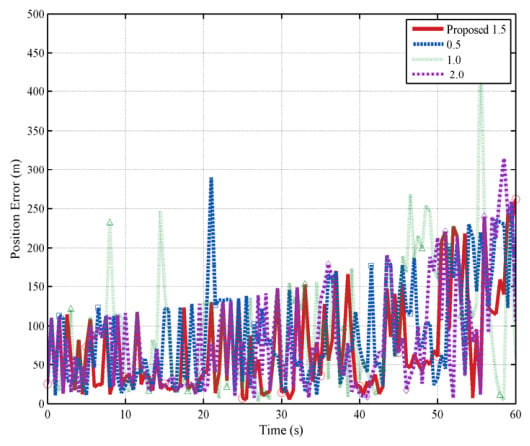
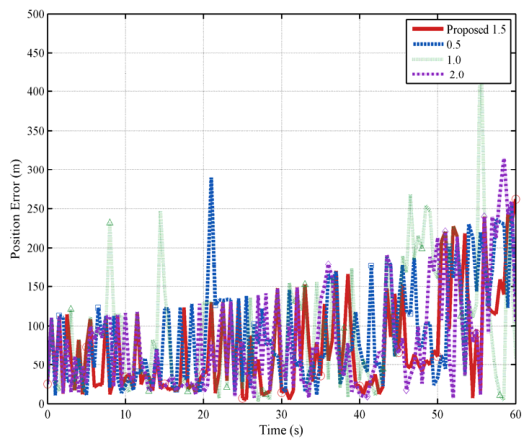
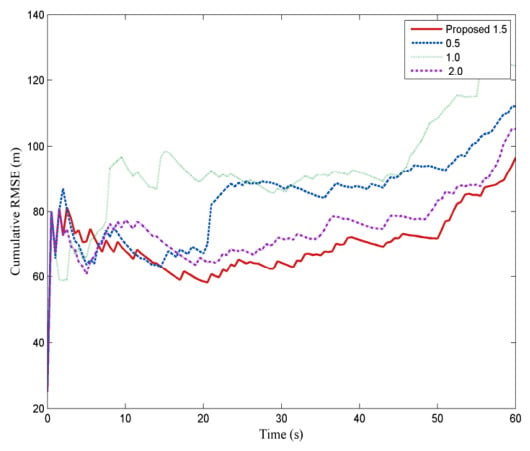
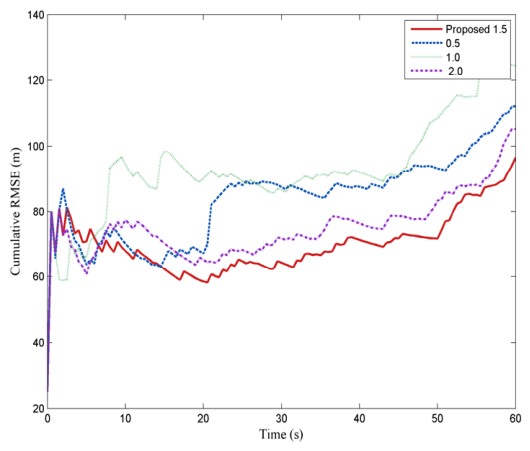
The Lévy flight index (β) fundamentally controls the step-size distribution, dictating the balance between global exploration and local exploitation. We evaluated β ∈ {0.5,1.0,1.5,2.0} using the feature-sparse Junggar Basin (Terrain 3). As illustrated in Figure 31 and Figure 32 (top subplots), when β = 2.0, the random walk degenerates into a Gaussian-like distribution; its short step lengths cause the algorithm to become easily trapped in local optima within the monotonous desert terrain. On the other hand, an overly heavy-tailed distribution (β = 0.5) induces excessive, chaotic global jumps, preventing the population from exploiting identified high-quality regions effectively. The empirical selection of β = 1.5 achieves the optimal search equilibrium, successfully preventing premature convergence while avoiding divergent oscillations, thereby yielding the lowest and most stable Cumulative RMSE.
Figure 31.
Error comparison.
Figure 32.
RMSE comparison.
5.7.2. Impact of Q-Learning State Discretization (N States)
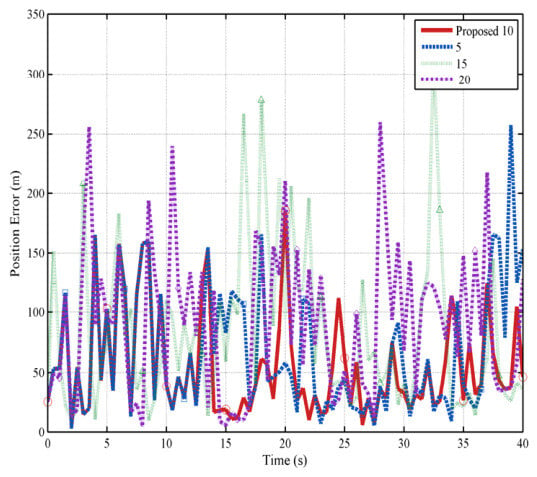
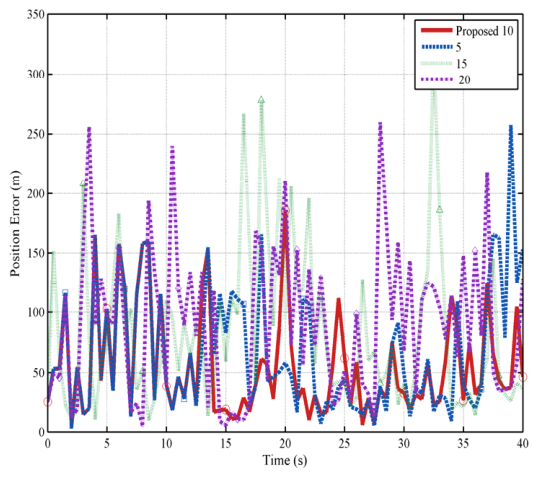
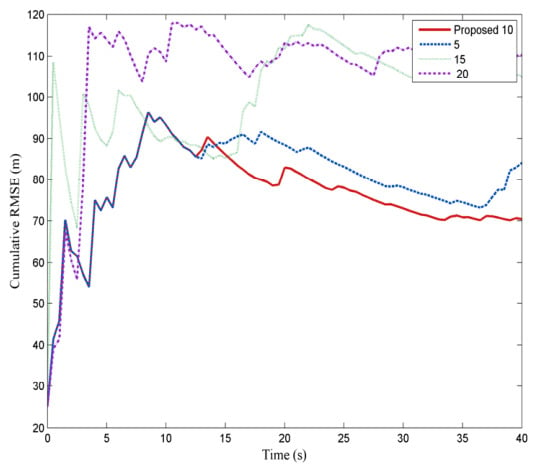
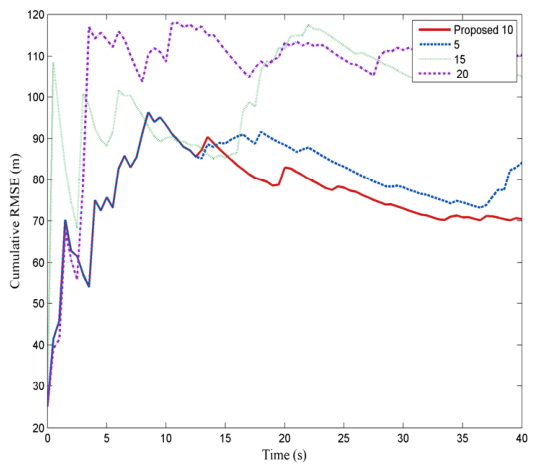
Unlike offline reinforcement learning environments, actual flight control systems demand rapid online policy convergence. To evaluate this, the parameter for the number of Q-learning states (5,10,15,20) was tested using the highly rugged Mountainous Terrain (Terrain 1). As shown in Figure 33 (bottom subplots), a massively discretized state space (Nstates = 20) leads to severe performance degradation. An excessively fine state space triggers the “curse of dimensionality,” preventing the Q-table from converging within the rapid timeframe of a 0.2 s navigation match. This leaves many state-action pairs underexplored and results in suboptimal threshold adaptation. Conversely, an overly small state space (Nstates = 5) lacks the necessary resolution to accurately capture the subtle changes in population diversity, causing blunt and ineffective transition behaviors during the search process.
Figure 33.
Error comparison.
The proposed setting of (Nstates = 10) acts as the Pareto optimal configuration, as shown in Figure 33 and Figure 34. It provides sufficient granularity to ensure smooth and accurate exploration threshold transitions while guaranteeing rapid online convergence of the Q-table within the strict 0.2 s real-time boundary.
Figure 34.
RMSE comparison.
5.8. Performance Evaluation
This paper proposes a novel Improved Osprey Optimization Algorithm (IOOA) for high-precision terrain-aided navigation. A multi-strategy optimization framework is proposed, which integrates a Q-learning mechanism for adaptive parameter tuning, a Lévy flight strategy for enhanced global search, and an elite-guided Estimation of Distribution strategy to maintain population diversity. This design effectively addresses the common limitations of traditional algorithms, such as premature convergence and local optima entrapment, while adapting to the dynamic error accumulation of Inertial Navigation Systems (INS). Systematic simulations demonstrate its superior performance: in simulated gentle hills, IOOA reduces the total positioning error to 55.03 m (±0.83), showing a significant accuracy advantage over mainstream methods including TERCOM (125 m), PSO (91 m), and GA (130 m). Its robustness is further validated in a challenging real-world Libyan desert scenario, where it confines the error within 94 m, outperforming all compared algorithms. An ablation study confirms the critical role of its integrated components, as their removal leads to severe, non-convergent error oscillations. Furthermore, with an average processing time of 0.08 s per match, the algorithm satisfies real-time operational requirements. In conclusion, IOOA achieves a marked improvement in accuracy, robustness, and efficiency, providing an effective solution for high-precision navigation in non-ideal environments.
6. Conclusions
Based on the conducted systematic simulation experiments, it can be definitively concluded that the Improved Osprey Optimization Algorithm (IOOA) achieves a qualitative leap in terrain-matching navigation performance compared to traditional methods. Specifically, in terrains with relatively gentle features such as dunes and moderately undulating foothill terrain, the algorithm improves positioning accuracy by nearly 40%, a result consistently validated across two distinct comparative experiments. In tests using real digital elevation data from the Libyan desert, the improved algorithm demonstrated a significant reduction in positioning error from 150 m (using the conventional method) to 94 m over an 80s navigation window, representing a 37.3% improvement in accuracy. Consistent performance gains were also validated in the Junggar Basin terrain, conclusively proving the algorithm’s robustness in both feature-deficient and complex environments. This performance gain is particularly pronounced in extremely flat and feature-deficient terrain, conclusively proving the algorithm’s enhanced adaptability to environments with weak or sparse navigational features.
Author Contributions
Conceptualization, T.S., D.S. and X.L.; methodology, D.S. and X.L.; software, D.S.; validation, D.S., Z.J. and J.L.; formal analysis, D.S.; investigation, D.S.; resources, T.S.; data curation, D.S. and Z.J.; writing—original draft preparation, D.S.; writing—review and editing, X.L. and T.S.; visualization, D.S. and J.L.; supervision, T.S. and X.L.; project administration, X.L.; funding acquisition, T.S. All authors have read and agreed to the published version of the manuscript.
Funding
This study was funded by the National Natural Science Foundation of China (62273214), Shandong Provincial Natural Science Foundation (ZR2025MS994), Key technology research and industrialization demonstration projects of Qingdao (26-1-1-gjgg-31-gx).
Data Availability Statement
The data presented in this study are available on request from the corresponding author.
Conflicts of Interest
The authors declare no conflict of interest.
References
- Jarraya, I.; Al-Batati, A.; Kadri, M.B.; Abdelkader, M.; Ammar, A.; Boulila, W.; Koubaa, A. Gnss-denied unmanned aerial vehicle navigation: Analyzing computational complexity, sensor fusion, and localization methodologies. Satell. Navig. 2025, 6, 9. [Google Scholar] [CrossRef] [Scilit]
- Baker, W.; Clem, R. Terrain Contour Matching (TERCOM) Primer Technical Report ASP-TR-77-61; Aeronautical Systems Division Wright Patterson AFB: Dayton, OH, USA, 1977. [Google Scholar]
- Zou, J.; Cai, T.; Zhao, S. Gravity-Aided Navigation Underwater Positioning Confidence Study Based on Bayesian Estimation of the Interquartile Range Method. Remote Sens. 2025, 17, 2137. [Google Scholar] [CrossRef] [Scilit]
- Golden, J.P. Terrain contour matching (TERCOM): A cruise missile guidance aid. In Image Processing for Missile Guidance; SPIE: Bellingham, WA, USA, 1980; Volume 238, pp. 10–18. [Google Scholar]
- Lv, W.; Wang, H.; Liu, C.; Ji, H. Design and simulation of terrain matching aided navigation system for UAVs. Electron. Opt. Control 2014, 21, 63–67. (In Chinese) [Google Scholar]
- Feng, Q.-T.; Shen, L.-C.; Chang, W.-S. Terrain-aided navigation algorithm based on Bayesian method. J. Chin. Inert. Technol. 2004, 1, 29–33. [Google Scholar]
- He, Y.-P.; Liu, X.-X.; Cai, Y.-P.; Zhu, Y. New terrain matching algorithm for aircraft based on particle swarm optimization. Infrared Laser Eng. 2016, 45, 122–127. [Google Scholar]
- Miao, S.-W.; He, Z.-J.; Li, R.-B. Terrain matching method based on adaptive particle swarm optimization. Navig. Control 2025, 24, 42–52. [Google Scholar]
- Liang, L.-Y.; Yu, D.-J.; Du, J.-P.; Chai, M.-J.; Li, T.; Zhou, J.-L. UAV terrain matching algorithm based on multi-modal feature fusion and particle swarm optimization. High Power Laser Part. Beams 2025, 37, 180–188. [Google Scholar]
- Cheng, X.-H.; Zhou, Y.-H. Underwater terrain-aided navigation method based on improved particle swarm optimization. J. Chin. Inert. Technol. 2017, 25, 770–775. [Google Scholar]
- Zhang, C. Research on Terrain Matching Navigation Algorithm Based on Multi-Beam Bathymetry. Ph.D. Thesis, Southeast University, Nanjing, China, 2023. [Google Scholar]
- Zhang, P. Research on Underwater Terrain-Aided Navigation Based on Improved Salp Swarm Algorithm. Ph.D. Thesis, Jiangsu Ocean University, Lianyungang, China, 2022. [Google Scholar]
- Feng, Q.-T.; Shen, L.-C.; Chang, W.-S. Terrain-aided navigation algorithm based on probabilistic data association. J. Astronaut. 2003, 5, 439–443+462. [Google Scholar]
- Zhao, L.-Q.; Li, R.-B.; He, Z.-J. Terrain Matching Algorithm Based on Probability Density Feature for Helicopter. Navig. Control 2023, 22, 26–33. [Google Scholar]
- Ding, P.; Cheng, X.-H.; Yang, S.-S.; Wang, L.; Shen, D. A TAN method based on improved RPF for flat terrain. J. Chin. Inert. Technol. 2024, 32, 787–794. [Google Scholar]
- Zhao, L.; Gao, N.; Huang, B.; Wang, Q.; Zhou, J. A Novel Terrain-Aided Navigation Algorithm Combined with the TERCOM Algorithm and Particle Filter. IEEE Sens. J. 2015, 15, 1124–1131. [Google Scholar] [CrossRef] [Scilit]
- Claus, B.; Bachmayer, R. Terrain-aided Navigation for an Underwater Glider. J. Field Robot. 2015, 32, 935–951. [Google Scholar] [CrossRef] [Scilit]
- Claus, B.; Bachmayer, R. Towards online terrain aided navigation of underwater gliders. In Proceedings of the 2014 IEEE/OES Autonomous Underwater Vehicles (AUV), Oxford, MS, USA, 6–9 October 2014. [Google Scholar]
- Thompson, A.F.; Robbins, J.A.; Boler, M.E.; Pangborn, H.C. Mixed-Integer Moving Horizon Estimation for Terrain-Aided Navigation Using Hybrid Zonotopes. In Proceedings of the 2025 IEEE/ION Position, Location and Navigation Symposium (PLANS), Salt Lake City, UT, USA, 28 April 2025; pp. 815–820. [Google Scholar]
- Kim, T.; Nam, S.; Lee, H.; Oh, J. Verification of Vision-Based Terrain-Referenced Navigation Using the Iterative Closest Point Algorithm Through Flight Testing. Sensors 2025, 25, 5813. [Google Scholar] [CrossRef] [Scilit] [PubMed]
- Kadri, M.B.; Yousuf, S. An advanced error state Kalman filter (ESKF)-based terrain contour matching (TERCOM) method for tracking an aerial vehicle using a low-cost digital elevation map. PeerJ Comput. Sci. 2025, 11, e3118. [Google Scholar] [CrossRef] [Scilit]
- Li, R.; Tang, X.; Du, Y.; Zhang, R.; Xu, B. Terrain contour aided navigation based on neural network. J. Beijing Univ. Aeronaut. Astronaut. 2026, 53, 524–532. [Google Scholar]
- Sun, C.; Zhao, S.; Deng, Z. Progressive Underwater Terrain Matching and Positioning Algorithm Based on Deep Learning. In Proceedings of the Seminar on the Development Trends and Directions of Inertial Technology—Innovation and Development of Inertial Technology in the Intelligent Era; China Inertial Technology Society: Beijing, China, 2025; pp. 368–376. (In Chinese) [Google Scholar]
- Uslu, I.E.; Tanyeri, B.; Bekar, U.C.; Akinci, M.N. A Statistical Framework for False-Fix Elimination in TERCOM Using Real Flight Test Data. Int. J. Aeronaut. Space Sci. 2026, 1–19. [Google Scholar] [CrossRef] [Scilit]
- Yao, J.; Ji, H.-X.; Wang, N.-J.; Wei, W.W.; Wang, X.H. A terrain matching aided navigation algorithm for UAV. Opt. Optoelectron. Technol. 2019, 17, 10–15. [Google Scholar]
- Chang, Q. Research on Key Technologies for Cruise Missile Guidance System. Ph.D. Thesis, Northwestern Polytechnical University, Xi’an, China, 2003. [Google Scholar]
- Yan, Z.-Y.; Shen, T.-Y.; Yu, J.-C. A seabed terrain matching navigation algorithm based on entropy difference. GNSS World China 2023, 48, 67–71. [Google Scholar]
- Chen, X.-M.; Zhang, J.-W.; Zhang, R.; Yang, B.; Wu, X.-L.; Liu, H.; Bi, Y.-B. An improved osprey optimization algorithm and its application. J. Chongqing Univ. Technol. (Nat. Sci.) 2024, 38, 122–133. [Google Scholar]
- Bradley, N.; Greaves, J.; Han, D.; Hollenberg, C.; Jones, D.; Koh, D.; Lubey, D.; McElrath, T.; Nicholas, A.; Snyder, J.S. Navigating Psyche: Launch, Initial Checkout, and Start of Cruise. J. Astronaut. Sci. 2026, 73, 4. [Google Scholar] [CrossRef] [Scilit]
- Clifton, J.; Laber, E. Q-learning: Theory and applications. Annu. Rev. Stat. Its Appl. 2020, 7, 279–301. [Google Scholar] [CrossRef] [Scilit]

Disclaimer/Publisher’s Note: The statements, opinions and data contained in all publications are solely those of the individual author(s) and contributor(s) and not of MDPI and/or the editor(s). MDPI and/or the editor(s) disclaim responsibility for any injury to people or property resulting from any ideas, methods, instructions or products referred to in the content. |
© 2026 by the authors. Licensee MDPI, Basel, Switzerland. This article is an open access article distributed under the terms and conditions of the Creative Commons Attribution (CC BY) license.